Exhibit 99
ALLSCRIPTS TM
Inform. Connect. Transform.
1

Allscripts Overview
2
Safe Harbor
This presentation may contain forward-looking statements about Allscripts Healthcare Solutions that involve risks and uncertainties. These statements are developed by combining currently available information with Allscripts’ beliefs and assumptions. Forward-looking statements do not guarantee future performance. Because Allscripts cannot predict all of the risks and uncertainties that may affect it, or control the ones it does predict, Allscripts’ actual results may be materially different from the results expressed in its forward-looking statements. For a more complete discussion of the risks, uncertainties and assumptions that may affect Allscripts, see the Company’s 2004 Annual Report on Form 10-K, available at www.sec.gov.
3
What We Do & Who We Are . . .
We Provide Clinical Software, Connectivity & Information Solutions to Physicians
360 Employees
Public (Nasdaq: MDRX)
Financial Strength $130+ Million in Cash Reserves $100+ Million in 2004 Revenue
Diversified/Multiple Revenue Streams
The Leader in High Growth Markets
Culture
Fast Moving, Client-Focused and Innovative
4

Our Vision
To Become an Indispensable Part of the Way Physicians Practice Medicine
5
Our Solutions
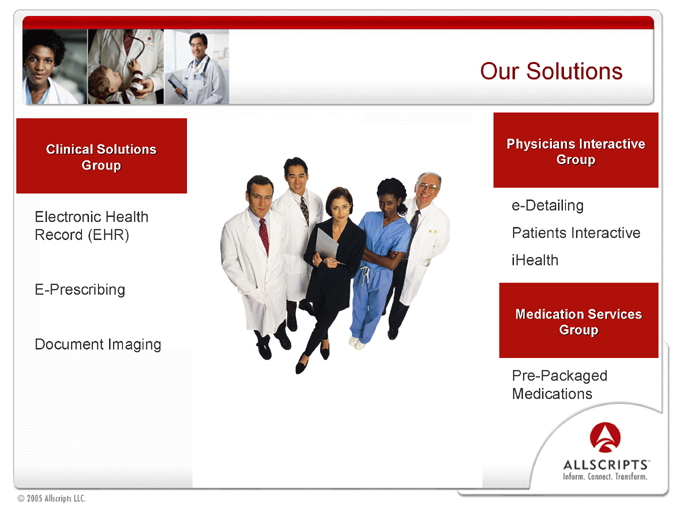
Clinical Solutions Group
Electronic Health Record (EHR)
E-Prescribing
Document Imaging
Physicians Interactive Group e-Detailing
Patients Interactive iHealth
Medication Services Group
Pre-Packaged Medications
6
7
Clinical Solutions:
EHR Market Opportunity $5-6 Billion Market
The Market Has “Tipped”
> 25% Penetration of Mid to Large Size Groups
50% of Groups Purchasing in Next 18 Months*
Average deal size was approximately $600,000 in Q1’05
Pipeline continues to grow. We also expect average deal size to grow and include individual deals in $3 to $5 million range over the next 12 to 18 mo.
What Changed?
Tools & Technology are Better, Less Expensive Physicians’ Willingness to Adopt Technology Political, Payors, PBM, Patient Trends Results (Proven, Measurable ROI)
•source: PricewatershouseCoopers Study
Clinical Solutions:
Allscripts EHR – Competitive Advantages
Physician-Centric Approach
IDX Alliance = Preferred Access to 70% of Large Groups Modular Approach Drives Rapid Adoption and ROI Independent, Documented Return-On-Investment Blue-Chip Client Base Partners Play a Key Role in Our Solutions and Connections Organizing & Leading the Ambulatory Market
8
Clinical Solutions:
Allscripts EHR—Results
Sales Growth In Excess of 60%
Ranked #1 in KLAS, the “Consumer Reports’ of Healthcare, Ambulatory EHR Perception Report
Ranked #1 at TEPR Competition
Ranked #1 MS-HUG Awards
Central Utah Clinic Saves $1,000,000 in First Year
9
10
Clinical Solutions:
Allscripts EHR—Results
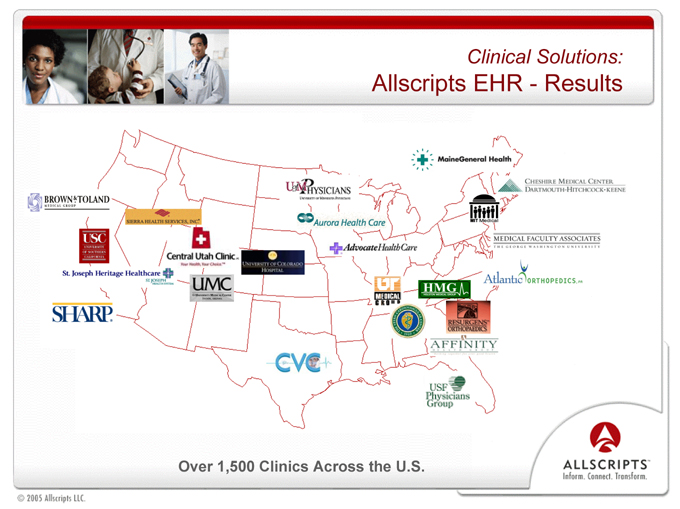
Over 1,500 Clinics Across the U.S.
11
Physicians Interactive:
Opportunity
The Opportunity
Pharma Industry Marketing Spend = $15 Billion/Year
Current Market for Online Product Education ~$250mm
The Pharma Challenge
Goal = Educate/Influence ~ 200,000 HVP’s Challenge = HVP’s Crunched For Time 43% of Pharma Detail Calls End at Receptionist 50% of Detail Calls Last < 2 Minutes
12
Physicians Interactive:
Results
Pioneer/Leading Provider of e-Detailing and Other Online Solutions
Blue Chip Client Base
39 Pharmaceutical, Biotech & Medical Device Companies
8 of Top 10 Pharmaceutical Companies
More Programs Delivered
400 Programs for 100 Brands
59 International Programs in 8 Countries
Significant Footprint with Physicians
60,000 Unique Physician Participants in U.S.
> 250,000 Educational Sessions Completed
13
Medication Services:
Results
Legacy Business
Continued Increases In Gross Margin Strength in Occupational Health Centers Strength in Employers On-Site Delivery
14
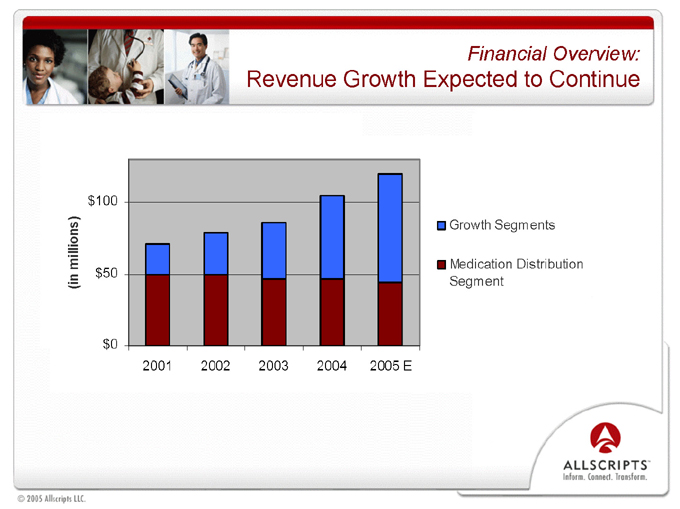
Financial Overview:
Revenue Growth Expected to Continue
(in millions) $100 $50 $0
Growth Segments
Medication Distribution Segment
2001 2002 2003 2004 2005 E
15
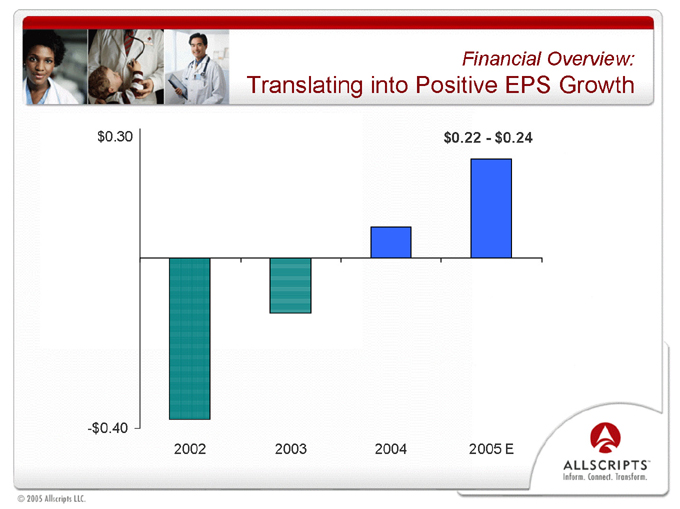
Financial Overview:
Translating into Positive EPS Growth $0.30 $0.22—$0.24
-$0.40
2002
2003
2004
2005 E
16
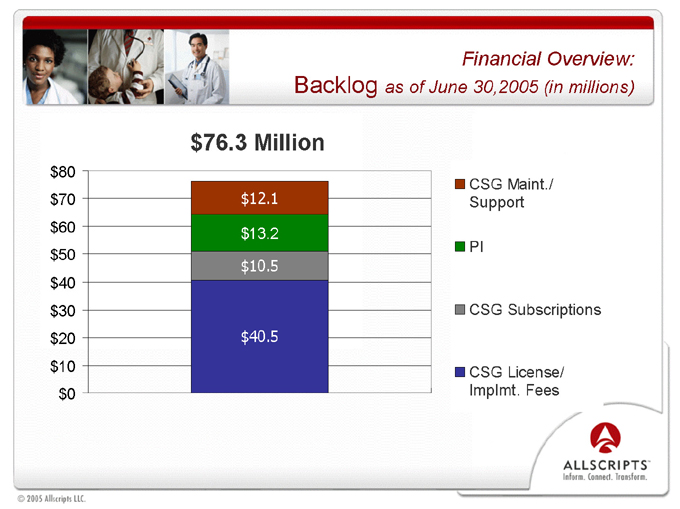
Financial Overview:
Backlog as of June 30,2005 (in millions) $76.3 Million $80 $70 $60 $50 $40 $30 $20 $10 $0
CSG Maint. / Support $12.1 $13.2 $10.5 $40.5
PI
CSG Subscriptions
CSG License/ Implmt. Fees
17
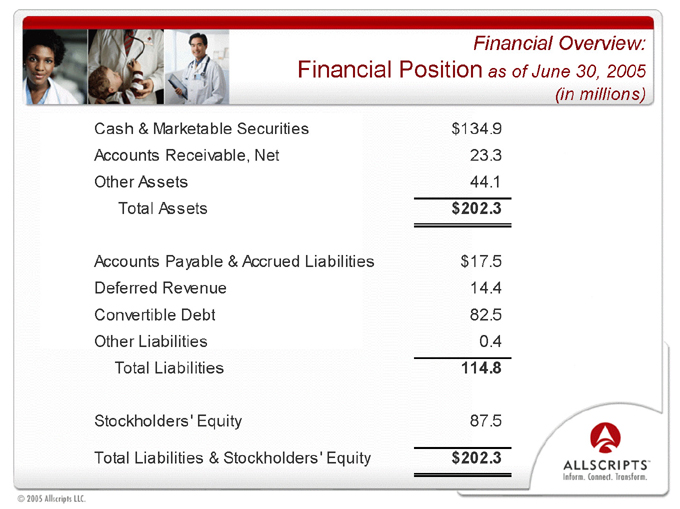
Financial Overview:
Financial Position as of June 30, 2005 (in millions)
Cash & Marketable Securities $134.9
Accounts Receivable, Net 23.3
Other Assets 44.1
Total Assets $202.3
Accounts Payable & Accrued Liabilities $17.5
Deferred Revenue 14.4
Convertible Debt 82.5
Other Liabilities 0.4
Total Liabilities 114.8
Stockholders’ Equity 87.5
Total Liabilities & Stockholders’ Equity $202.3
18
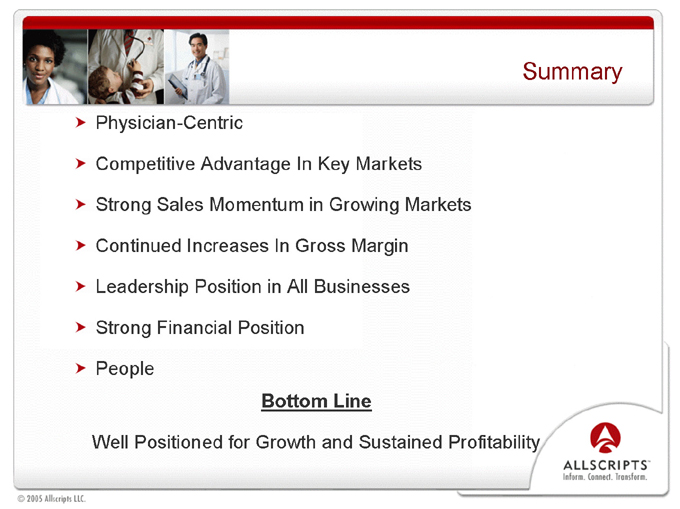
Summary
Physician-Centric
Competitive Advantage In Key Markets Strong Sales Momentum in Growing Markets Continued Increases In Gross Margin Leadership Position in All Businesses Strong Financial Position People
Bottom Line
Well Positioned for Growth and Sustained Profitability
19
ALLSCRIPTS TM
Inform . Connect . Transform .


