- MDRX Dashboard
- Financials
- Filings
-
Holdings
- Transcripts
- ETFs
- Insider
- Institutional
- Shorts
-
8-K Filing
Veradigm (MDRX) 8-KRegulation FD Disclosure
Filed: 3 Aug 06, 12:00am
 Exhibit 99.1 August 2006 1 |
 Safe Harbor This presentation may contain forward-looking statements about Allscripts Healthcare Solutions that involve risks and uncertainties. These statements are developed by combining currently available information with Allscripts’ beliefs and assumptions. Forward-looking statements do not guarantee future performance. Because Allscripts cannot predict all of the risks and uncertainties that may affect it, or control the ones it does predict, Allscripts’ actual results may be materially different from the results expressed in its forward-looking statements. For a more complete discussion of the risks, uncertainties and assumptions that may affect Allscripts, see the Company's Annual Report on Form 10-K for the year ended December 31, 2005, available at www.sec.gov. 2 |
 Company Overview Physicians rely on our products to improve the quality and efficiency of healthcare they provide Our integrated product lines provide clinical information and automate physicians’ most basic workflows such as documentation, prescription writing, charge capturing, scheduling and billing We deliver broad and diverse solutions – Clinical Solutions Group – Physicians Interactive Group – Medication Solutions Group Allscripts Provides Clinical Software, Connectivity and Information Solutions To Physicians 3 |
 Our Vision Physicians Control 80% of $2.2 Trillion To Become an Indispensable Part of the Way Physicians Practice Medicine Annual Healthcare Spend 4 |
 Our Vision To Become an Indispensable Part of the Way Physicians Practice Medicine We deliver solutions that Healthcare. 5 |
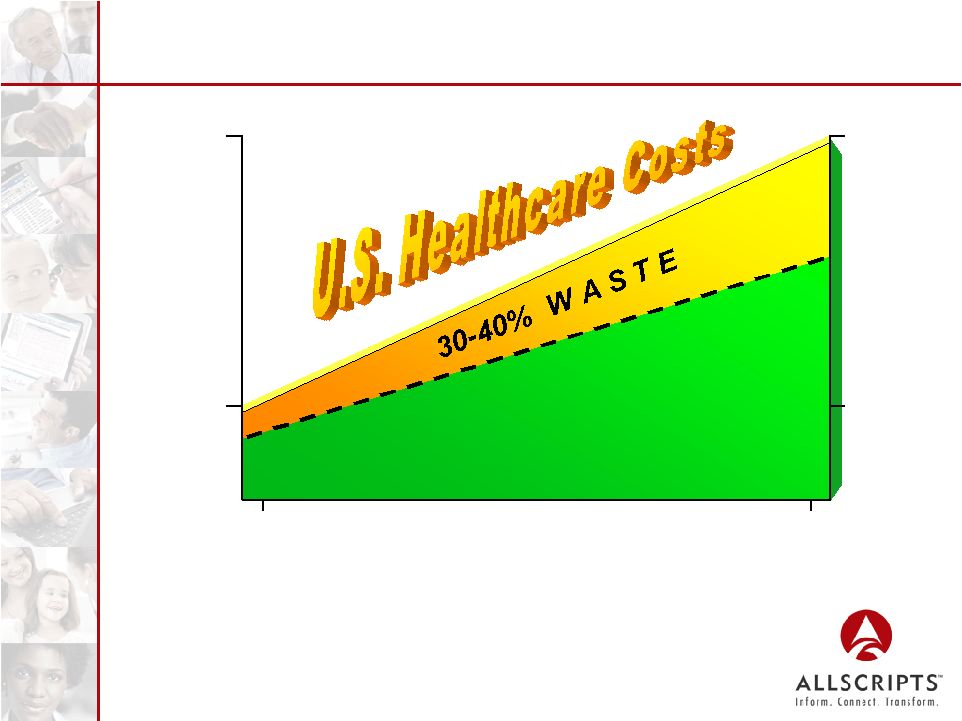 Fundamental Problem In Healthcare 2004 2014 16% 22% $1.8 $3.5 The U.S. is 1st in the world in healthcare expenditures, but no better than 16th in medical outcomes ($ in Trillions) (% of GDP) 6 |
 Fundamental Problem In Healthcare 7 |
 What Is The Solution? CONNECTING 8 |
 Large and Growing Market Opportunity Small to mid-sized practices represent largest number of physicians Practice management solutions provide complementary product offering with significant incremental market opportunity Ambulatory EHR Market is ~$5+ Billion Opportunity ~550,000 U.S. Physicians ~85% EHR Market Opportunity x ~$12,500 Initial Investment per Physician x ~$5+ Billion Opportunity = 9 |
 Allscripts Competitive Strengths Significant installed base Award-winning technologies that enable industry-leading solutions Rapid return on investment Strong partnerships and strategic alliances Experienced employee base 10 |
 Delivering Value Through Diversified Solutions e-Prescribing e-Prescribing Personal Health Record Personal Health Record Medication Dispensing Medication Dispensing e-Detailing e-Detailing Emergency Department Emergency Department Practice Management Practice Management Electronic Health Record Electronic Health Record Care Management Care Management 11 |
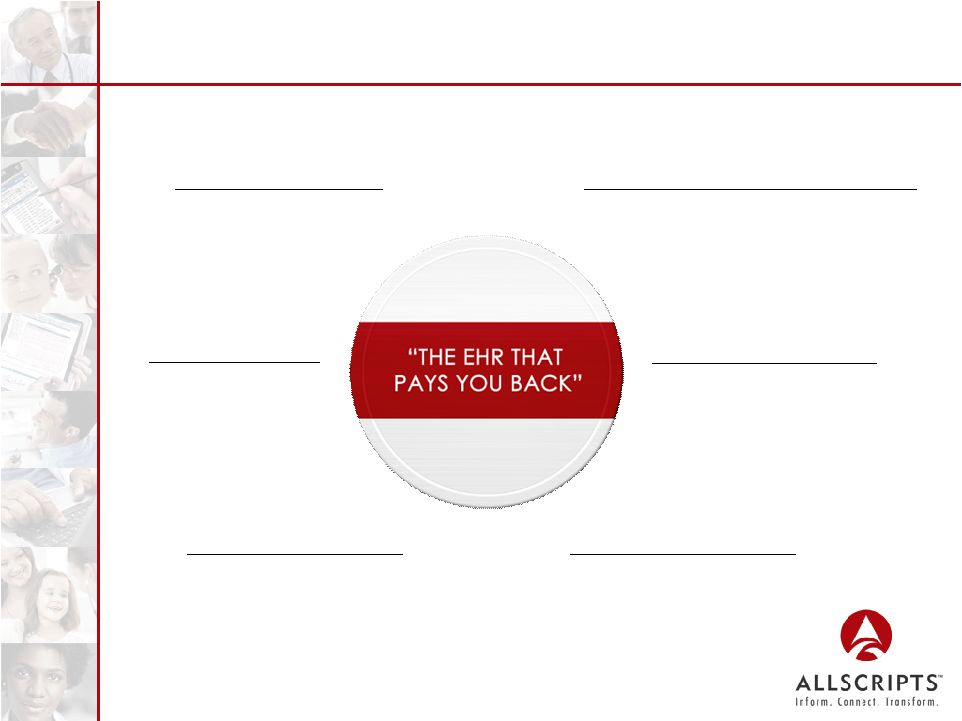 Delivering Results Generates Clinical Trial Revenue Holston Medical Group $3M/Yr. in Clinical Trial Revenue Delivers on Pay for Performance Facey Medical $1.2M P4P Payout from Blue Cross Produces e-Prescribing Savings Sierra Health $5M in Savings via eRx Reduces Resources in Medical Records George Washington Univ. Medical Faculty Associates Reduction of 20 FTEs in Medical Records Reduces/Eliminates Transcription Central Utah Clinic $1M in Savings in Year 1 ($20K/MD) Enhances Documentation University of Tennessee Medical Group Avg. Gross Charges Increases by > $30/Patient Visit 12 |
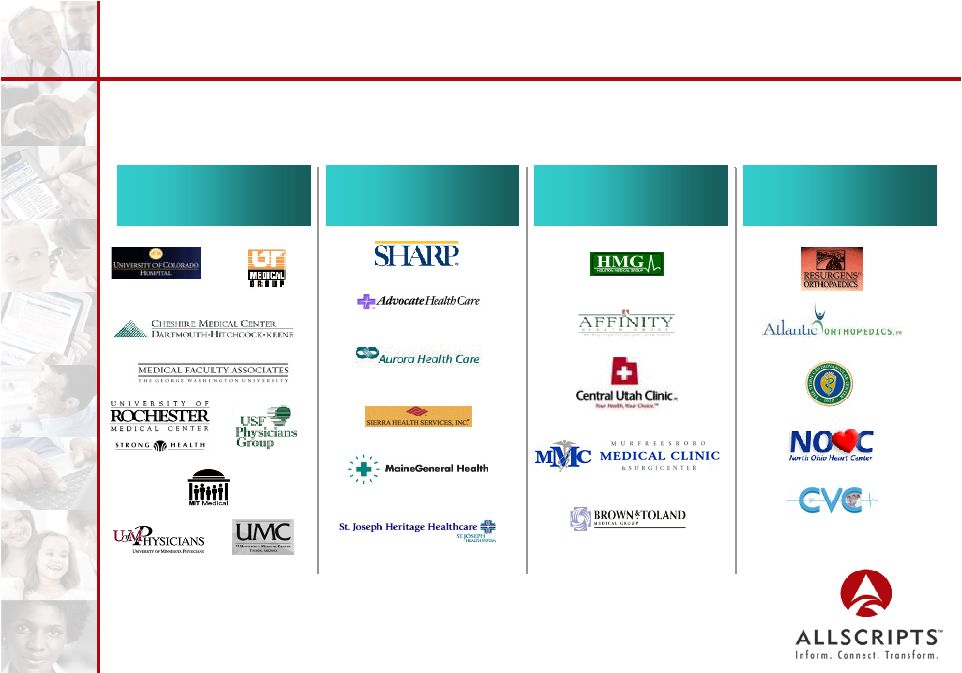 Allscripts: The EHR of Choice Academic Medical Groups Specialty Groups Multi-Specialty Groups Integrated Delivery Networks Over 3,000 Leading Clinics Nationwide 13 |
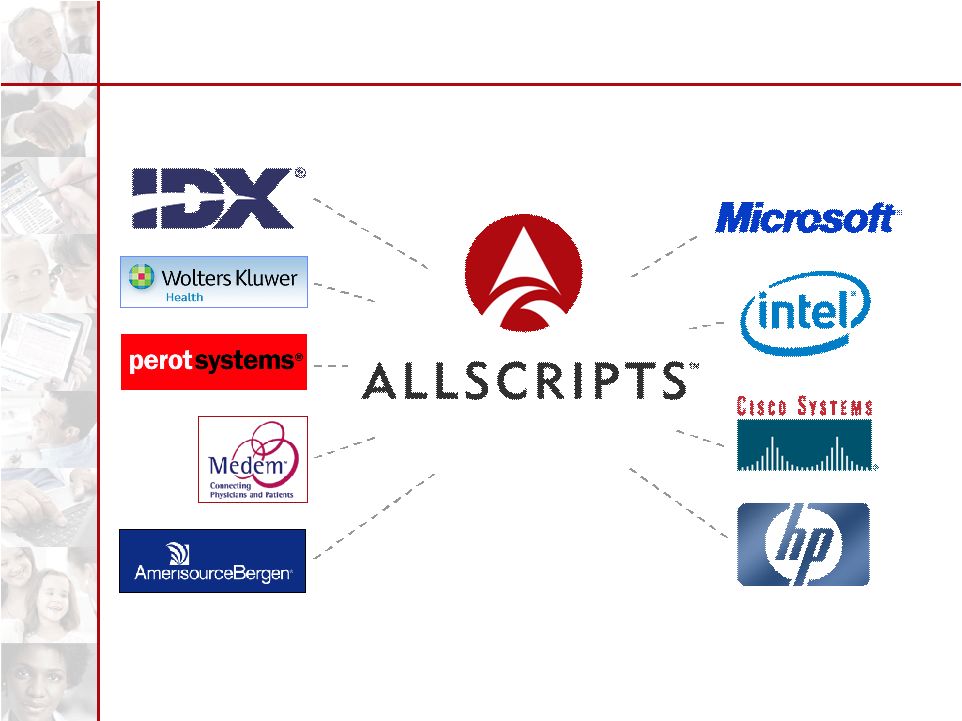 Strength of Our Partnerships 14 |
 Renegotiated IDX Agreement A win for OUR Customers, IDX/GE, and Allscripts Preserves the best attributes of the original agreement Allscripts remains preferred choice and “safe choice” for IDX customers with over 150 existing sites Allscripts can now offer its own integrated EHR and practice management solutions GE is interested in an orderly disposition of their ownership interest in Allscripts “Physician groups choose Allscripts because of the referencable customer base, leading product, and a successful implementation track record, not because of a piece of paper signed 5 years ago.” 15 |
 A4 Acquisition: Strategic Benefits Expand product and service offerings – Fully integrated EHR and practice management solutions for small and mid-sized physician groups – Complementary acute care solutions Increase market penetration – Double the size of our salesforce – Add over 1,500 physician clinics nationally Accelerate financial performance – Double our clinical software revenues – Natural gross margin expansion – Accretive on CASH basis in 2006 and on GAAP basis in 2007 16 |
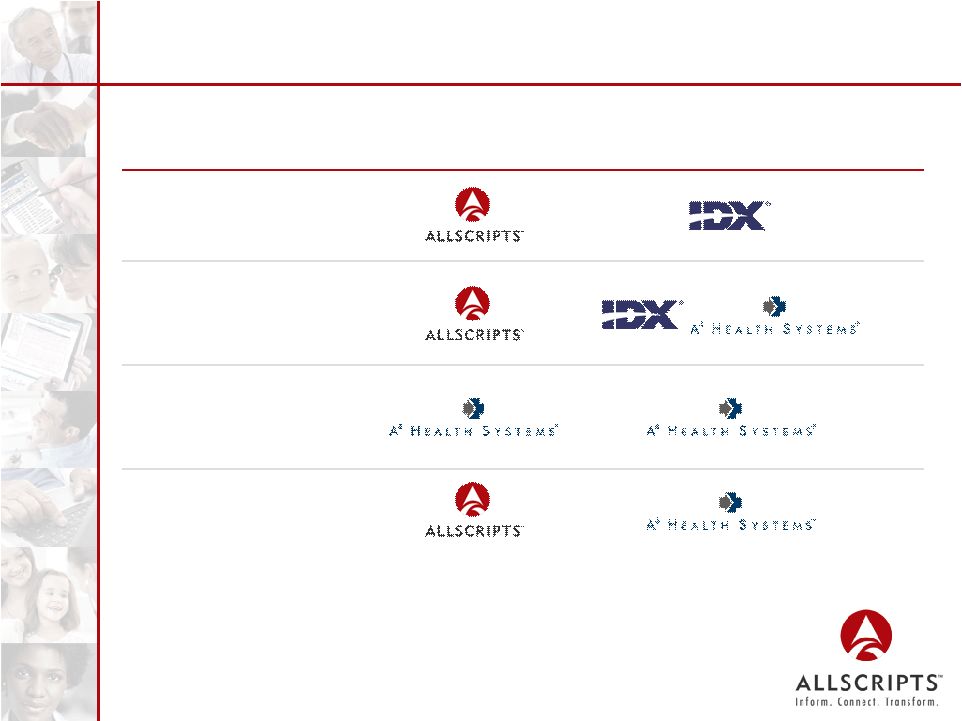 Ambulatory Market Share Segment EHR Practice Management Profitable Leadership In Each Segment Large Physician Practices (>25) Mid-Sized Physician Practices (10-24) Independent & Small Physician Practices (<10) Specialty Groups 17 |
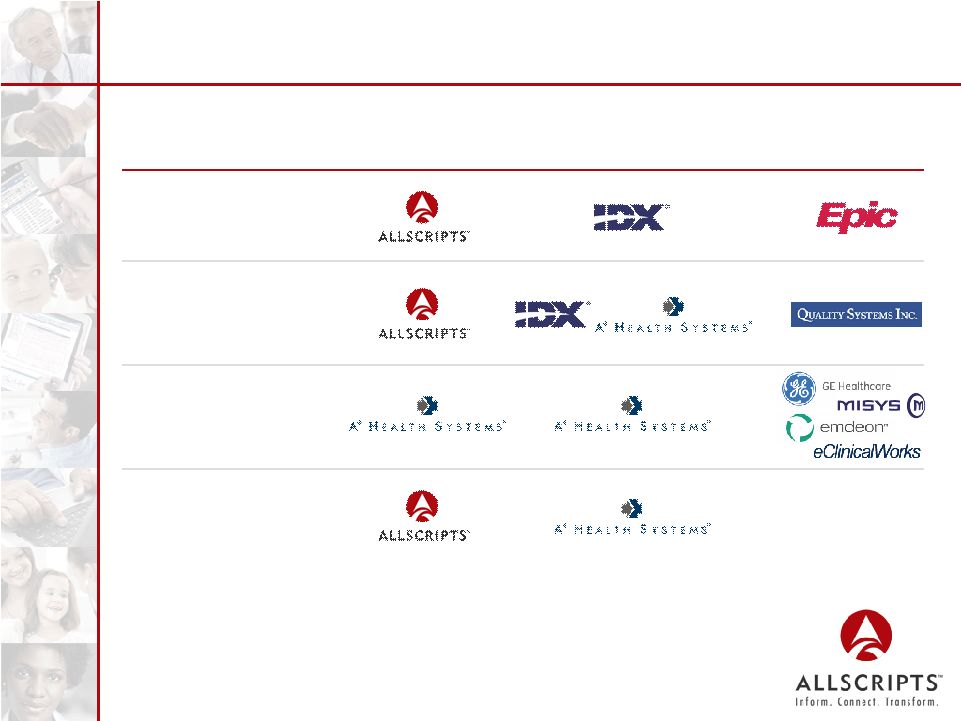 Ambulatory Market Share Large Physician Practices (>25) Segment EHR Practice Management Mid-Sized Physician Practices (10-24) Independent & Small Physician Practices (<10) Specialty Groups Profitable Leadership In Each Segment Primary Competitors Variety of Small Players 18 |
 E H R E H R Acute Care Focus Our Solutions Ensure Continuity of Care Hospital Hospital Emergency Department (ED) Emergency Department (ED) Care Management Care Management INFORMATION INFORMATION 19 |
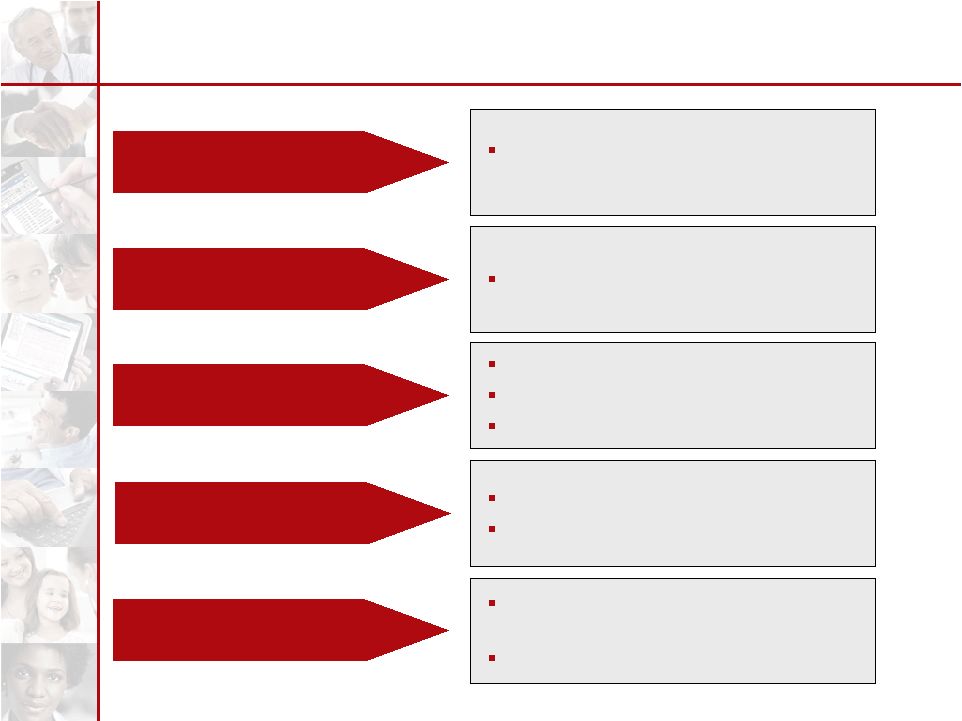 Strategies For Growth Broaden Physician Base Enhance Physician Utilization Continue Product Innovation Leverage Brand Recognition Pursue Strategic Opportunities Aggressively pursue physician practices in all markets In-depth training and customer support Scalable and modular Rapid implementation Broader functionality Publicity and media campaigns Government driving awareness Continue to pursue complementary businesses and assets Continue to build strategic relationships 20 |
 Key Takeaways 1. The time is now 2. Our physician focus is key to transforming healthcare 3. We are a leader in the core growth markets in which we compete 4. Competitive advantage: driving utilization and results We’re just getting started! 21 |
 Financial Overview 22 |
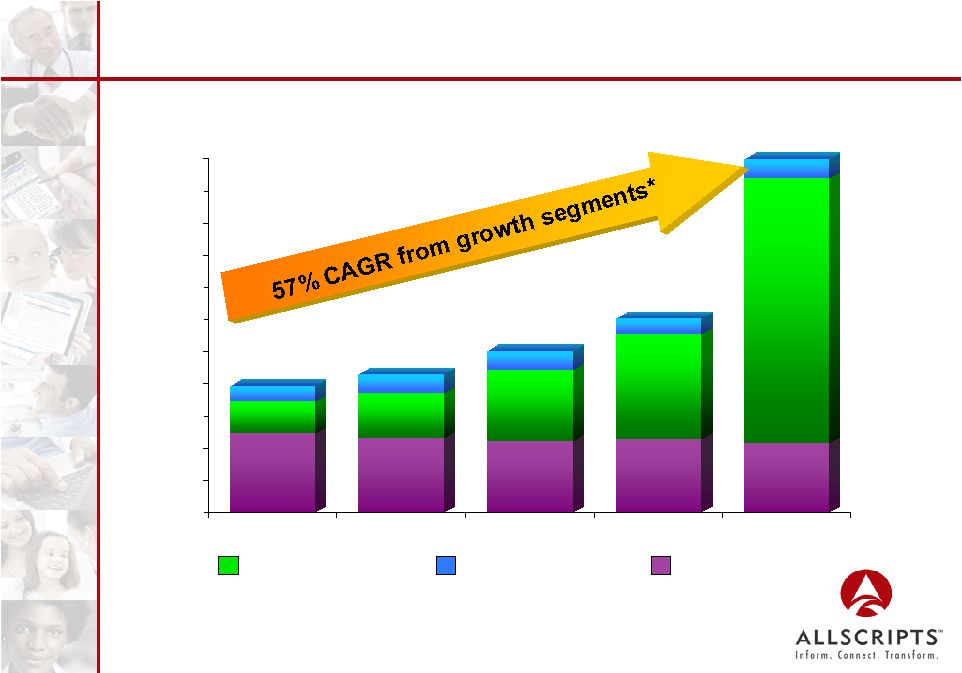 Consistent Revenue Growth ($ in Millions) $0 $20 $40 $60 $80 $100 $120 $140 $160 $180 $200 $220 2002 2003 2004 2005 2006(E) $78.8 $85.8 $100.8 $120.6 $220.0 23 Pre-packaged Medications Information Services Clinical Software and Related Services * Growth segments include Clinical Software and Related Services and Information Services |
 Operating Earnings Drives Strong Cash Earnings Growth* ($0.50) ($0.25) $0.00 $0.25 $0.50 $0.75 2002 2003 2004 2005 2006(E) ($0.24) $0.19 $0.39 $0.70 - $0.72 24 * Defined as EBITDA plus one-time acquisition-related costs, interest income and stock-based compensation $0.00 |
 $0 $20 $40 $60 $80 $100 $120 $140 $160 $180 2002 2003 2004 2005 2006(E) Solid Bookings Growth Information Services Clinical Software and Related Services $33.3 $43.1 $65.9 $89.5 $170.0 ($ in Millions) 25 |
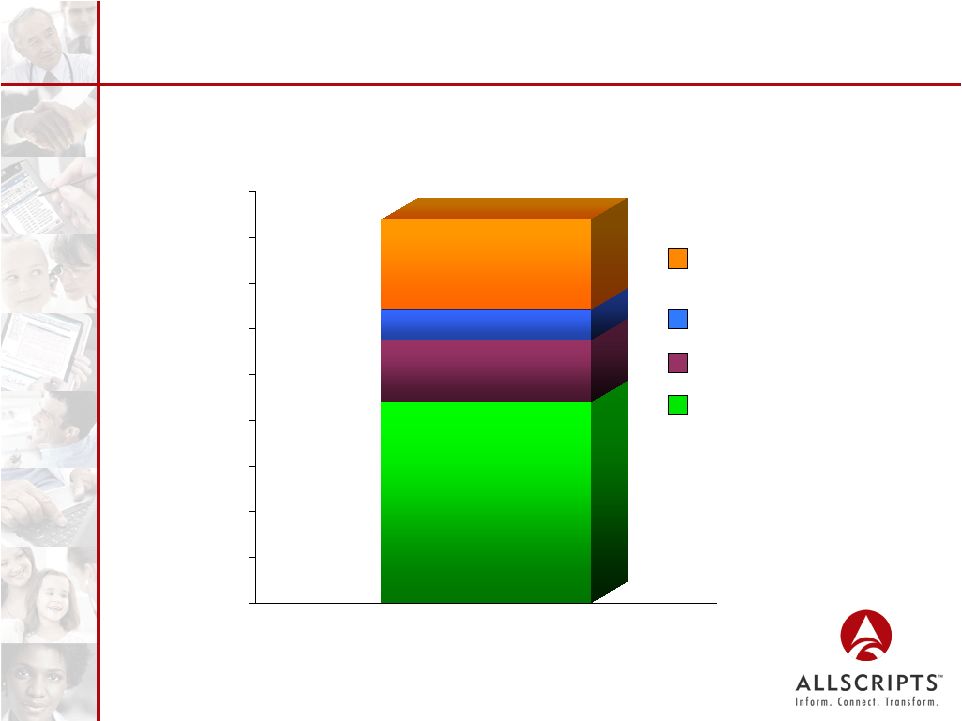 $0 $20 $40 $60 $80 $100 $120 $140 $160 $180 $167.9 Million Diversified Backlog Provides Stability $87.9 $87.9 $27.0 $27.0 $13.3 $13.3 $39.7 $39.7 ($ in Millions) As of 6/30/06 Clinical Software Maintenance Support Information Services Clinical Software Subscriptions Clinical Software License/ Implementation Fees 26 |
 A4 Acquisition: Financial Highlights Cost: ~ $300 million – $215 million cash and 3.5 million common shares A4 Health Systems delivers strong financial performance Enhances revenue mix with a greater emphasis on the clinical software segment Accelerate financial performance – Accretive to Allscripts on CASH basis in 2006 and on GAAP basis in 2007 27 |
 Accelerated Growth Through A4 Revenues: Software & Related Services Prepackaged Medications Information Services Total Revenues Gross Profit Gross Profit % Income from Operations Cash Earnings Net Income GAAP Earnings per Share (Diluted) Cash Earnings per Share (Diluted) ($ in Millions) 2004 $44.1 44.7 11.9 $100.8 42.6 42.3% 3.2 8.1 $3.1 $0.07 $0.19 2005 $65.2 45.6 9.8 $120.6 54.9 45.5% 9.2 16.8 $9.7 $0.23 $0.39 28 $165.0 43.0 12.0 $220.0 112.0 50 to 52% 19.0 38.0 $11.0 $0.20 to $0.22 $0.70 to $0.72 2006 (E) |
 Financial Strength Cash & Marketable Securities Accounts Receivable, Net Other Assets Total Assets Accounts Payable & Accrued Liabilities Deferred Revenue Debt Other Liabilities Total Liabilities Stockholders’ Equity Total Liabilities & Stockholders’ Equity ($ in Millions) $146.1 29.2 45.7 $221.0 $22.4 17.3 82.5 0.4 $122.6 98.4 $221.0 As of 12/31/05 29 As of 6/30/06 65.8 44.6 338.7 $449.1 $33.3 33.0 85.6 0.5 $152.4 296.7 $449.1 |
 Summary World-Class Technologies World-Class Technologies Return On Investment Return On Investment Our People Our People Proven Track Record Proven Track Record Strong Partnerships Strong Partnerships Leading Provider of Clinical Solutions Leading Provider of Clinical Solutions Physician-centric Physician-centric Well-positioned for Growth and Sustained Profitability 30 |
 31 |