1 © 2007 Allscripts, LLC Allscripts Investor Presentation February, 2007 Exhibit 99.1 |
2 © 2007 Allscripts, LLC Safe Harbor This presentation may contain forward-looking statements about Allscripts Healthcare Solutions that involve risks and uncertainties. These statements are developed by combining currently available information with Allscripts’ beliefs and assumptions. Forward-looking statements do not guarantee future performance. Because Allscripts cannot predict all of the risks and uncertainties that may affect it, or control the ones it does predict, Allscripts’ actual results may be materially different from the results expressed in its forward-looking statements. For a more complete discussion of the risks, uncertainties and assumptions that may affect Allscripts, see the Company's Annual Report on Form 10-K for the year ended December 31, 2006, available at www.sec.gov. |
3 © 2007 Allscripts, LLC Our Mission To be the Leading Provider of Clinical Software, Connectivity & Information Solutions to Physicians |
4 © 2007 Allscripts, LLC 4 About Allscripts 900+ Employees & Growing Solid Financials (Nasdaq: MDRX) Established Leader in Healthcare IT Market Electronic Health Records Practice Management e-Prescribing Document Imaging Personal Health Records Connectivity Solutions Emergency Department Information System Case Management |
5 © 2007 Allscripts, LLC Where We Are . . . Our Healthcare Scorecard $2.2 Trillion Spent in Healthcare $700 Billion in Waste 98,000 Deaths from Medical Errors 7,000 Deaths from Medication Errors |
6 © 2007 Allscripts, LLC Our View Healthcare Revolves Around the Physician Why Physicians? Traditional View Healthcare Revolves Around the Hospital |
7 © 2007 Allscripts, LLC The Status Quo: Cost & Risks |
8 © 2007 Allscripts, LLC What Will It Take to Get There? |
9 © 2007 Allscripts, LLC ~ 550,000 U.S. Physicians x 80% EHR Market Opportunity x ~$12,000 Initial Investment/Physician = ~$5 Billion Opportunity The Ambulatory Physician Market Electronic Health Record (EHR) Market = ~ $5 Billion Practice Management (PM) Market = ~ $1 Billion/Yr. ~10% to 20% of PM Systems Replaced/Yr. Software Maintenance Agreement (SMA) = ~ $1 Billion/Yr. Transactions = ~ $1 to 2 Billion/Yr. |
Large Physician Practices (25<200 MDs) Segment Mid-Sized Physician Practices (10-24 MDs) Small Physician Practices (3<10 MDs) Leadership Across the Market Enterprise (>200 MDs) Independent Physician Practices (1-2 MDs) Primary Competitors Variety of Small Players Variety of Small Players Misys, Sage, Eclinical, GE Quality Systems Epic TouchWorks™ TouchWorks™ HealthMatics™ eRx NOW™ HealthMatics™ Offering HealthMatics™ |
11 © 2007 Allscripts, LLC Our Footprint: Significant Installed Base / Strong Reference Sites Our People: Experienced Employees Who Care Our Solutions: World-Class Industry-Leading Technologies Our Leadership: Standards, National Initiatives, and Innovation Our Partners: Strong Partnerships and Strategic Alliances Our Ability To Deliver Results: Rapid Deployment and ROI Why We Win… |
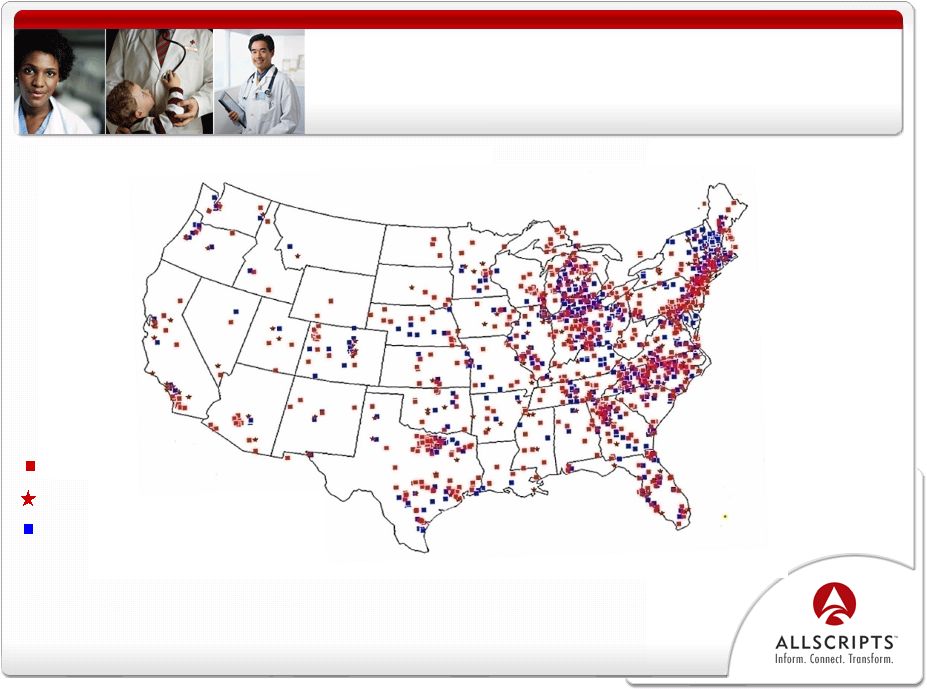
12 © 2007 Allscripts, LLC 12 Academic Medical Center Clients Electronic Health Record Clients Hospitals and Acute Care Clients Significant National Footprint Allscripts Across the U.S. 30,000+ Physicians and 400 Hospitals Across the U.S. |
13 © 2007 Allscripts, LLC The EHR of Choice Academic Medical Groups Specialty Groups Multi-Specialty Groups Integrated Delivery Networks |
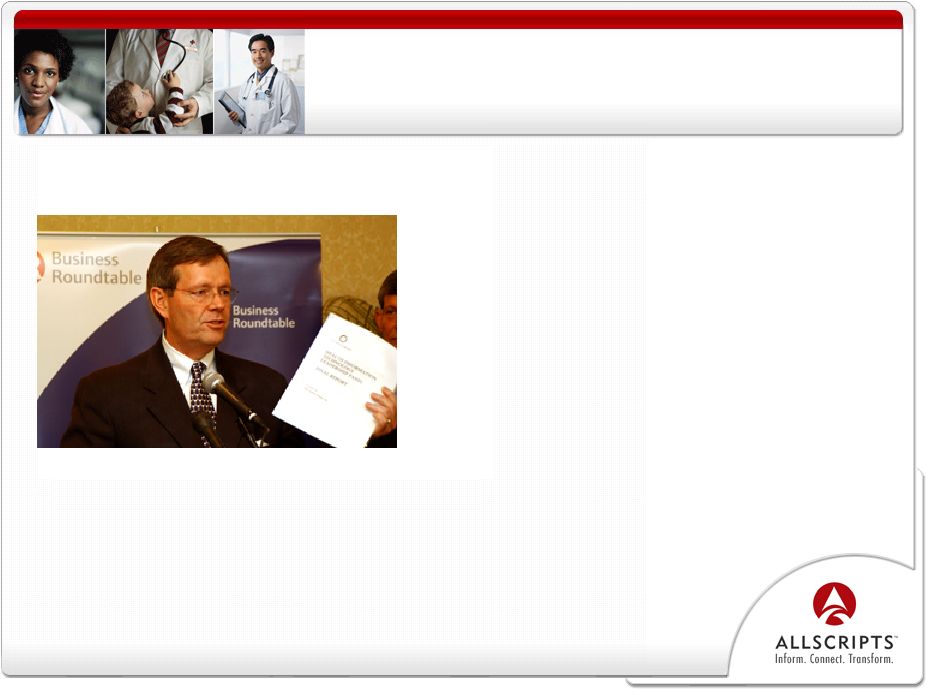
14 © 2007 Allscripts, LLC “If all we did was provide excellent patient care to sick patients who walked through our doors, I am convinced we would be out of business in five years.” - Jerry Miller, MD Chief Executive Officer Holston Medical Group Why Now? |
15 © 2007 Allscripts, LLC Delivering Results Generates Clinical Trial Revenue Holston Medical Group $3M/Yr. in Clinical Trial Revenue Delivers on Pay for Performance Facey Medical $1.2M P4P Payout from Blue Cross Produces e-Prescribing Savings Sierra Health $5M in Savings via eRx Reduces Resources in Medical Records George Washington Univ. Medical Faculty Associates Reduction of 20 FTEs in Medical Records Reduces/Eliminates Transcription Central Utah Clinic $1M in Savings in Year 1 ($20K/MD) Enhances Documentation University of Tennessee Medical Group Avg. Gross Charges Increases by > $30/Patient Visit |
16 © 2007 Allscripts, LLC The Future… Drivers in the Market Role of the Federal Government Standards/Certification Consumerism Content, Content, Content Pay for Performance/Pay for Quality Interoperability/Connect |
17 © 2007 Allscripts, LLC Shifting the Focus from a Silo… |
18 © 2007 Allscripts, LLC …to a Connected System |
19 © 2007 Allscripts, LLC Physician Office Physician Office The “Door In” and the “Door Out” of the Hospital Hospital Hospital Emergency Department (ED) Emergency Department (ED) Care Management Care Management “Door In” “Door Out” Connecting to the Hospital |
20 © 2007 Allscripts, LLC Leadership "There are three ways to handle change. You can fight it and die; accept it and survive; or lead it and prosper." - Mike Leavitt Secretary of HHS |
21 © 2007 Allscripts, LLC Leadership Advancing Patient Safety Dedicated to improving patient safety by providing free electronic prescribing for every physician in America Introducing: The National ePrescribing Patient Safety Initiative (NEPSI) A Coalition of the Nation’s Most Prominent Technology Companies, Healthcare Benefit And Medical Provider Organizations |
NEPSI Coalition Sponsors National Sponsors Technology Sponsors Connectivity Sponsors Search Sponsor Health Benefit Sponsors |
23 © 2007 Allscripts, LLC Regional Supporters |
24 © 2007 Allscripts, LLC Key Takeaways 1. The time is now 2. Our physician focus is key to transforming healthcare 3. We are a leader in the core growth markets in which we compete 4. Competitive advantage: driving utilization and results |
25 © 2007 Allscripts, LLC Financial Overview |
26 © 2007 Allscripts, LLC $0 $20 $40 $60 $80 $100 $120 $140 $160 $180 $200 $220 $240 $260 $280 $300 $320 2004 2005 2006 2007(E) $100.8 $120.6 $228.0 $300.0 Pre-packaged Medications Information Services Clinical Software and Related Services * Growth segments include Clinical Software and Related Services and Information Services Growth Segments ($ in Millions) |
27 © 2007 Allscripts, LLC $0 $20 $40 $60 $80 $100 $120 $140 $160 $180 $200 $220 $240 2004 2005 2006 2007(E) Solid Bookings Growth Information Services Clinical Software and Related Services $65.9 $89.5 $190.1 $240.0 ($ in Millions) |
28 © 2007 Allscripts, LLC $0 $20 $40 $60 $80 $100 $120 $140 $160 $180 $213.0 Million Diversified Backlog Provides Stability $110.6 $110.6 $28.0 $28.0 $24.8 $24.8 $49.6 $49.6 As of 12/31/06 Clinical Software Maintenance Support Information Services Clinical Software Subscriptions Clinical Software License/ Implementation Fees ($ in Millions) |
29 © 2007 Allscripts, LLC 2007 Guidance ($ in Millions, except per share amounts) 2005 2006 2007 (E) Revenues: Software & Related Services $65.2 $173.5 $240.0 Prepackaged Medications 45.6 43.7 44.0 Information Services 9.8 10.8 16.0 Total Revenues $120.6 $228.0 $300.0 Gross Profit 54.9 116.0 160.5 Gross Profit % 45.5% 50.9% 53.5% Income from Operations 9.2 19.9 42.5 Net Income $6.0 $11.9 $26.0 Weighted Average Shares Outstanding (Diluted) 43.1 53.4 65.2 Earnings per Share (Diluted) $0.14 (1) $0.22 $0.42 to $0.44 (1) 2005 has been adjusted for income taxes to provide for comparability: $9.7 MM Net Income, or $0.23 per diluted share, as reported less 38% taxes ($3.7 MM) = $6.0 MM, or $0.14 per diluted share |
30 © 2007 Allscripts, LLC Impact of Convertible Debt ($ in Millions, except per share) Impact of Convertible Debt (for illustrative purposes only) Non-Converted Converted Non-Converted Converted GAAP Net Income $11.9 $11.9 $26.0 $26.0 Adjustments: Add Back Interest Expense 3.5 3.5 Tax Effect of Interest Add-back @ 40% (1.4) (1.4) Adjusted GAAP Net Income $11.9 $14.0 $26.0 $28.1 Diluted Shares Outstanding 53.4 53.4 57.9 57.9 Add: Convertible Debt Shares 7.3 7.3 Adjusted Diluted Shares 53.4 60.7 57.9 65.2 GAAP Earnings Per Share $0.22 $0.23 $0.45 $0.43 Convertible Debt Convertible Debt Anti-dilutive Dilutive in 2007 in 2006 2007 2006 |
31 © 2007 Allscripts, LLC 2007 Earnings Metrics Adjusted Earnings 2005 2006 2007 (F) GAAP Net Income $6.0 $11.9 $26.0 Acquisition-Related Amortization, net of taxes @ 40% 1.1 6.4 6.2 Stock-Based Compensation, net of taxes @ 40% 0.4 1.4 3.5 Adjusted Earnings $7.5 $19.7 $35.7 Weighted Average Shares Outstanding (Diluted) 43.1 53.4 65.2 GAAP Earnings Per Share (Diluted) $0.14 $0.22 $0.42 to $0.44 Adjusted Earnings Per Share (Diluted) $0.17 $0.37 $0.58 to $0.60 ($ in Millions) |
32 © 2007 Allscripts, LLC Financial Strength $146.1 29.2 45.7 $221.0 $22.4 17.3 82.5 0.4 $122.6 98.4 $221.0 As of 12/31/05 As of 12/31/06 $83.0 55.6 339.0 $477.6 $36.2 35.5 85.4 4.3 $161.4 316.2 $477.6 Cash & Marketable Securities Accounts Receivable, Net Other Assets Total Assets Accounts Payable & Accrued Liabilities Deferred Revenue Long-term Debt Other Liabilities Total Liabilities Stockholders’ Equity Total Liabilities & Stockholders’ Equity ($ in Millions) |
33 © 2007 Allscripts, LLC Summary World-Class Technologies World-Class Technologies Return On Investment Return On Investment Our People Our People Proven Track Record Proven Track Record Strong Partnerships Strong Partnerships Leading Provider of Clinical Solutions Leading Provider of Clinical Solutions Physician-centric Physician-centric Well-Positioned for Growth and Sustained Profitability |
34 © 2007 Allscripts, LLC Allscripts Investor Presentation February, 2007 |