1 Allscripts Investor Presentation JANUARY 2012 J.P. Morgan 30 th Annual Healthcare Conference Exhibit 99.1 |
A Connected Community of Health | Copyright © 2012 Allscripts Healthcare Solutions, Inc. 2 Forward Looking Statement This presentation contains forward-looking statements within the meaning of the federal securities laws. Statements regarding future events or developments, our future performance, as well as management's expectations, beliefs, intentions, plans, estimates or projections relating to the future are forward-looking statements within the meaning of these laws. These forward-looking statements are subject to a number of risks and uncertainties, some of which are outlined below. As a result, no assurances can be given that any of the events anticipated by the forward-looking statements will transpire or occur, or if any of them do so, what impact they will have on our results of operations or financial condition. Such risks, uncertainties and other factors include, among other things: the risk that we will not achieve the strategic benefits of the merger (the “Eclipsys Merger”) with Eclipsys Corporation (“Eclipsys”); the possibility that the expected synergies and cost savings of the Eclipsys Merger will not be realized, or will not be realized within the expected time period; the risk that our business will not be integrated successfully with the business of Eclipsys; disruption from the Eclipsys Merger and related transactions making it more difficult to maintain business relationships with customers, partners and others; unexpected requirements to achieve interoperability certification pursuant to the Health Information Technology for Economic and Clinical Health Act, with resulting increases in development and other costs for us; the volume and timing of systems sales and installations, the length of sales cycles and the installation process and the possibility that our products will not achieve or sustain market acceptance; the timing, cost and success or failure of new product and service introductions, development and product upgrade releases; competitive pressures including product offerings, pricing and promotional activities; errors or similar problems in our software products; the outcome of any legal proceeding that has been or may be instituted against us and others; compliance obligations under existing laws, regulations and industry initiatives and future changes in laws or regulations in the healthcare industry, including possible regulation of our software by the U.S. Food and Drug Administration; the possibility of product-related liabilities; our ability to attract and retain qualified the implementation and speed of acceptance of the electronic record provisions of the American Recovery and Reinvestment Act of 2009, as well as elements of the Patient Protection and Affordable Care Act (aka health reform) which pertains to health IT adoption; maintaining our intellectual property rights and litigation involving intellectual property rights; legislative, regulatory and economic developments; risks related to third-party suppliers and our ability to obtain, use or successfully integrate third-party licensed technology and breach of our security by third parties. See our Transition Report on Form 10-KT for the seven months ended December 31, 2010 and our subsequent filings with the SEC for a further discussion of these and other risks and uncertainties applicable to our business. The statements herein speak only as of their date and we undertake no duty to update any forward-looking statement whether as a result of new information, future events or changes in expectations. |
A Connected Community of Health | Copyright © 2012 Allscripts Healthcare Solutions, Inc. A Connected Community of Health ™ OUR VISION Allscripts is the leading provider of Electronic Health Record (EHR), practice management and other clinical, revenue cycle, connectivity and information solutions for physicians, hospitals & post-acute organizations 3 |
A Connected Community of Health | Copyright © 2012 Allscripts Healthcare Solutions, Inc. OUR CLIENTS • 180,000 Physicians • 50,000 Physician Practices • 1,500 Hospitals • 10,000 Post-acute Facilities • 27,000 Clinicians In Patients Homes Every Day OUR COMPANY • ~$1.3BB 2010 Non-GAAP Revenue • 6,000 Employees • $160MM in R&D & Growing • Leader in Innovation • ~$3.5BB Market Capitalization • 1 Complete Set of Solutions Allscripts: Who We Are 4 Please see the Non-GAAP reconciliation and related footnotes in the appendix to this presentation. |
A Connected Community of Health | Copyright © 2012 Allscripts Healthcare Solutions, Inc. 5 Investment Highlights MARKET LEADER • Diverse, industry leading client base COMPLETE PRODUCT PORTFOLIO • Flexible, modern and complete solutions • Maximizes opportunities to expand market and wallet share DYNAMIC GROWTH MARKET • $30BB Federal stimulus program drives healthcare IT adoption • Low penetration of clinical solutions • Shift to value-based care drives strong long-term secular demand trends SIGNIFICANT OPERATING LEVERAGE • Proven and scalable platform for sales growth • Legacy of product innovation • Industry-leading brand awareness HIGH QUALITY FINANCIAL MODEL • Exceptional visibility with $2.7BB revenue backlog • ~66% recurring revenue • Strong free cash flow |
A Connected Community of Health | Copyright © 2012 Allscripts Healthcare Solutions, Inc. Agenda 6 MARKET DIFFERENTIATION GROWTH |
A Connected Community of Health | Copyright © 2012 Allscripts Healthcare Solutions, Inc. 7 MARKET DIFFERENTIATION GROWTH |
A Connected Community of Health | Copyright © 2012 Allscripts Healthcare Solutions, Inc. A National Problem A Market that is Ready A Significant Opportunity • Quality Issues • Medical Errors / Safety Concerns • Rising Cost • Significant Waste • $43BB 1 Opportunity • $30BB in Stimulus Funding • ~35% Penetration in Physician Practices • Rise in Employed Physicians • Hospitals Driving Adoption • We are at the beginning of what we expect will be the single fastest transformation of any industry in US history 8 Market: The Time is NOW 1. McKinsey & Company |
A Connected Community of Health | Copyright © 2012 Allscripts Healthcare Solutions, Inc. Market: Unsustainable Trend Requiring Change 9 VOLUME • Fragmented providers and payments • No uniform quality • Fees for volume • Demand increasing VALUE • Collaboration, connectivity • Clinical, financial data, analysis • Optimize outcomes • Accountable care Source: HFMA “Value in Healthcare: Current State & Future Directions June 2011 |
A Connected Community of Health | Copyright © 2012 Allscripts Healthcare Solutions, Inc. Market: MDRX Addresses the Entire Market Opportunity 10 Acute/Ambulatory EHR Opportunity 2010-2014 = ~$43BB • Ambulatory Stand-Alone Opportunity • Acute Stand-Alone Opportunity STAND-ALONE MARKET INTEGRATED MARKET • Integrated/Complete Solution Across Hospitals and Physician Practices |
A Connected Community of Health | Copyright © 2012 Allscripts Healthcare Solutions, Inc. 11 Market: Significant Ambulatory Potential PRACTICE SIZE TOTAL # OF PRACTICES EHR PENETRATION (July ‘11) 1-3 Physicians ~186,000 ~30% 4-9 Physicians ~28,000 ~50% 10-25 Physicians ~6,900 ~70% 26+ Physicians ~1,750 ~85% Total 226,650 ~35% Source: SK&A Information Services |
A Connected Community of Health | Copyright © 2012 Allscripts Healthcare Solutions, Inc. HOSPITALS/HEALTH SYSTEMS Market: Acute Care Growth Drivers 12 Source: HIMSS Analytics EMR Adoption Model, July 2011 LEGACY REPLACEMENT CYCLE UNDER- UTILIZATION • Obsolete mainframe systems • Integrate acute/ambulatory systems • Care Coordination • Only ~20%* of Hospitals at HIMSS Stage 4 adoption or higher • Only 1%* at HIMSS Stage 7 |
A Connected Community of Health | Copyright © 2012 Allscripts Healthcare Solutions, Inc. 13 MARKET DIFFERENTIATION GROWTH |
A Connected Community of Health | Copyright © 2012 Allscripts Healthcare Solutions, Inc. Differentiation: Leading Footprint Across the Market 14 (48% Rev) 1 of 3 MDs 1 of 3 Hospitals (43% Rev) 10,000 Post-acute Care Providers (9% Rev) Source: Allscripts Form 10Q Quarterly Report for period ended 9/30/11. GAAP revenue percentage based on 9 month period. |
A Connected Community of Health | Copyright © 2012 Allscripts Healthcare Solutions, Inc. Differentiation: Open and Connected Portfolio 15 |
A Connected Community of Health | Copyright © 2012 Allscripts Healthcare Solutions, Inc. Differentiation: The Challenge to Deliver Meaningful Care 16 • Stage 1: Application • Stage 2: Connection • Stage 3: Information • Stage 4: Insights • Stage 5: Outcomes TIME LEVEL OF IMPACT (Quality, Cost) |
A Connected Community of Health | Copyright © 2012 Allscripts Healthcare Solutions, Inc. Differentiation: The New Architecture of Healthcare 17 Old World (Monolithic/Closed Mainframe) New World (Modern/Open Platform) Connect Inside Connect Inside and Outside |
A Connected Community of Health | Copyright © 2012 Allscripts Healthcare Solutions, Inc. • Key stakeholders across the community (Allscripts Referral Network, Allscripts Community) • All points of care and all applications within their organization 18 Differentiation: Allscripts Approach |
A Connected Community of Health | Copyright © 2012 Allscripts Healthcare Solutions, Inc. “Clinical outcomes is the name of the game in ACOs. This is an area where we believe Allscripts holds a market lead, and needs to continue to focus on delivering more integrated outcomes modules for its client base.” THE ADVISORY BOARD COMPANY (APRIL 2011, “A PERSPECTIVE ON THE COMPANY”) Differentiation: Clinical Outcomes Experience and Focus 19 |
A Connected Community of Health | Copyright © 2012 Allscripts Healthcare Solutions, Inc. 20 Differentiation: i20-Insights to Outcomes Market values information, delivered to physicians leading to Better Results . . . Better Outcomes . . . Insights to Outcomes ALLSCRIPTS OPTIMALLY POSITIONED • Largest client footprint • Technology to connect • The analytics to deliver information at the point of care THIS SHOWS IN ALLSCRIPTS CLIENT RESULTS . . . • Most utilization • Most innovation • Best outcomes |
Differentiation: Deliver Solutions in a Value-Based Care Environment 21 A Connected Community of Health | Copyright © 2012 Allscripts Healthcare Solutions, Inc. |
A Connected Community of Health | Copyright © 2012 Allscripts Healthcare Solutions, Inc. Differentiation: Innovative Solutions 22 Mobile Platforms Accelerate Adoption |
A Connected Community of Health | Copyright © 2012 Allscripts Healthcare Solutions, Inc. 23 MARKET DIFFERENTIATION GROWTH |
A Connected Community of Health | Copyright © 2012 Allscripts Healthcare Solutions, Inc. Growth: Long-Term Focus 24 1. 2011 revenue guidance provided by Allscripts on November 3, 2011. This document does not subsequently update or reaffirm Allscripts financial guidance. 2. Annual revenue for Allscripts illustrated above is based on a GAAP presentation and is calenderized based on quarterly results. Please note Allscripts changed its fiscal year-end to May between the period of September, 2008 and May, 2010. GAAP revenue also includes the impact of acquisitions and divestitures. |
A Connected Community of Health | Copyright © 2012 Allscripts Healthcare Solutions, Inc. Growth: Historical Performance 25 Note: Please see the Non-GAAP reconciliation and related footnotes in the appendix to this presentation. tp://investor.allscripts.com • Non-GAAP Revenue CY 2010: $1,300MM • Non-GAAP Revenue CY 2009: $1,188MM |
A Connected Community of Health | Copyright © 2012 Allscripts Healthcare Solutions, Inc. Growth: Distribution Outpaces the Competition 26 |
A Connected Community of Health | Copyright © 2012 Allscripts Healthcare Solutions, Inc. Growth: Significant Cost Synergies 27 Projected Cost Synergies Over Three Years • Duplicative management structure • Duplicative public company costs • Duplicative back-end office and system integration • Marketing Key Cost Synergy Drivers |
A Connected Community of Health | Copyright © 2012 Allscripts Healthcare Solutions, Inc. Growth: Significant Client Sales Opportunity 28 Sell Acute Solutions to Ambulatory Care Base Sell Ambulatory Solutions to Acute Care Base |
A Connected Community of Health | Copyright © 2012 Allscripts Healthcare Solutions, Inc. Growth: Utilizing Strong Cash Flow to Enhance Value 29 CAPITALIZATION ACTUAL 9/30/2011 Cash and Marketable Securities $87 Revolver ($250mm) 0 Term Loan 377 Total Debt $377 Equity 1,439 Total Capitalization $1,816 Credit Statistics LTM EBITDA (1) $328 Total Debt / LTM EBITDA (1) 1.1x Debt / Capitalization 20.8% • Reduced debt by $193MM since merger closed (8/10); $45.5MM in Q3 2011 • Minimum required principal payments over next 12 months totals $40MM • Current borrowing cost <3% • $200MM, 3-year share repurchase program instituted in the second quarter of 2011 • Repurchased $50MM of shares to date 1 EBITDA is calculated as net income plus income tax expense, interest expense, stock-based compensation expense, depreciation & amortization, deferred revenue adjustments, certain one-time and transaction-related expenses, and non-recurring losses on the sale of investments minus non-recurring gains on the sale of assets, consistent with the calculation as defined in the Company’s Senior Credit Facilities agreement. Note: Please see the Non-GAAP reconciliation and related footnotes in the appendix to this presentation. tp://investor.allscripts.com |
A Connected Community of Health | Copyright © 2012 Allscripts Healthcare Solutions, Inc. 30 Growth: Non-GAAP Financial Outlook CY 2010 ACTUAL CY 2011 2010 TO 2011 CHANGE NON-GAAP REVENUE $1,300 $1,455 - $1,460 12% NON-GAAP OPERATING MARGIN 19% 21% +200 BPS NON-GAAP NET INCOME $148 $174 - $179 17 – 21% NON-GAAP DILUTED EPS $0.76 $0.91 - $0.93 20 – 22% ($ in millions; except per share amounts) Note: Guidance provided by the company in a press release on November 3, 2011. This presentation does not subsequently update or reaffirm Allscripts financial guidance. Please see the Non-GAAP reconciliation and related footnotes in the appendix to this presentation. tp://investor.allscripts.com |
A Connected Community of Health | Copyright © 2012 Allscripts Healthcare Solutions, Inc. 31 MARKET DIFFERENTIATION GROWTH In Summary…. |
32 Allscripts Investor Presentation JANUARY 2012 J.P. Morgan 30 th Annual Healthcare Conference |
A Connected Community of Health | Copyright © 2012 Allscripts Healthcare Solutions, Inc. Appendix: Non-GAAP Reconciliations 33 |
A Connected Community of Health | Copyright © 2012 Allscripts Healthcare Solutions, Inc. 34 Appendix: Non-GAAP Reconciliation • GAAP – non-GAAP revenue and net income reconciliation for the twelve months ended December 31, 2010. Three Months Ended Twelve Months Ended 12/31/2010 12/31/2010 Allscripts Eclipsys Q1 2010 Allscripts Eclipsys Q2 2010 Allscripts Eclipsys Additional Int Exp(a) Q3 2010 Q4 2010 CY 2010 Total revenue, as reported $184.4 $128.4 $312.8 $191.4 $134.4 $325.8 $191.2 $51.2 $0.0 $242.4 $316.2 $1,197.2 Deferred revenue adjustment 0.5 0.0 0.5 0.6 0.0 0.6 0.5 6.7 0.0 7.2 20.9 29.2 Eclipsys results pre-merger period (7/1/10-8/23/10) 0.0 0.0 0.0 0.0 0.0 0.0 0.0 79.5 0.0 79.5 0.0 79.5 Total non-GAAP revenue $184.9 $128.4 $313.3 $192.0 $134.4 $326.4 $191.7 $137.4 $0.0 $329.1 $337.1 $1,305.9 Net income, as reported $18.6 $5.4 $24.0 $13.1 $1.6 $14.7 $5.4 ($4.0) $0.0 $1.4 ($6.2) $33.9 Deferred revenue adjustment 0.3 0.0 0.3 0.3 0.0 0.3 0.3 4.0 0.0 4.3 12.7 17.6 Acquisition-related amortization 3.4 1.9 5.3 3.5 1.8 5.3 3.4 3.0 0.0 6.4 10.6 27.6 Stock-based compensation expense 2.4 3.4 5.8 1.8 2.9 4.7 4.0 0.0 0.0 4.0 2.3 16.8 Transaction-related expense 0.1 0.0 0.1 7.7 2.0 9.7 16.0 5.5 (1.9) 19.6 10.9 40.3 ARS Sales 0.0 0.0 0.0 0.0 0.9 0.9 0.0 0.0 0.0 0.0 0.0 0.9 Tax rate alignment 0.7 0.0 0.7 (0.2) 0.0 (0.2) (1.6) (0.2) 0.0 (1.8) 8.4 7.1 Eclipsys results pre-merger period (7/1/10-8/23/10) 0.0 0.0 0.0 0.0 0.0 0.0 0.0 2.9 0.0 2.9 0.0 2.9 Non-GAAP net income $25.5 $10.7 $36.2 $26.2 $9.2 $35.4 $27.5 $11.2 ($1.9) $36.8 $38.7 $147.1 (a) Transaction-related expenses are fees and expenses, including legal, investment banking and accounting fees and other integration-related expenses, incurred in connection with announced transactions. 3/31/10 6/30/10 9/30/2010 Allscripts Healthcare Solutions, Inc. Non-GAAP Financial Information - 2010 Financial Information (In millions, except per-share amounts) (unaudited) Three Months Ended Three Months Ended Three Months Ended |
A Connected Community of Health | Copyright © 2012 Allscripts Healthcare Solutions, Inc. 35 Appendix: Non-GAAP Reconciliation • GAAP – non-GAAP revenue reconciliation for the twelve months ended November 30, 2009 (Allscripts) and twelve months ended December 31, 2009 (Eclipsys). Allscripts (11/30/2009) Eclipsys (12/31/2009) Non-GAAP Total revenue, as reported $661.1 $519.1 $1,180.2 Deferred revenue adjustment 9.7 8.0 $17.7 Elimination of prepackaged medications (9.7) 0.0 ($9.7) Total non-GAAP revenue $661.1 $527.1 $1,188.2 Twelve Months Ended Allscripts Healthcare Solutions, Inc. Condensed Non-GAAP Financial Information (In millions, except per-share amounts) (Unaudited) |
A Connected Community of Health | Copyright © 2012 Allscripts Healthcare Solutions, Inc. 36 Appendix: Non-GAAP Reconciliation • GAAP – non-GAAP operating income reconciliation by quarter and twelve months ended December 31, 2009 (Eclipsys) and November 30, 2009 (Allscripts). |
A Connected Community of Health | Copyright © 2012 Allscripts Healthcare Solutions, Inc. 37 Appendix: Non-GAAP Reconciliation • GAAP – non-GAAP operating income reconciliation by quarter and twelve months ended December 31, 2010. Three Months Ended Twelve Months Ended 12/31/2010 12/31/2010 Allscripts Eclipsys Q1 2010 Allscripts Eclipsys Q2 2010 Allscripts Eclipsys Additional Int Exp(a) Q3 2010 Q4 2010 CY 2010 Operating income, as reported $32.0 $10.7 $42.7 $20.5 $5.4 $25.9 $6.0 ($7.2) $0.0 ($1.2) $9.5 $76.9 Deferred revenue adjustment 0.5 0.0 0.5 0.6 0.0 0.6 0.5 6.7 0.0 7.2 20.9 29.2 Acquisition-related amortization 5.6 3.1 8.7 5.6 3.1 8.7 5.6 4.9 0.0 10.5 17.4 45.3 Stock-based compensation expense 3.9 3.7 7.6 2.9 3.7 6.6 6.6 0.0 0.0 6.6 3.7 24.5 Transaction-related expense (a) 0.2 0.0 0.2 12.5 3.5 16.0 26.1 9.1 0.0 35.2 17.8 69.2 Eclipsys results pre-merger period (7/1/10-8/23/10) 0.0 0.0 0.0 0.0 0.0 0.0 0.0 4.7 0.0 4.7 0.0 4.7 Total non-GAAP operating income $42.2 $17.5 $59.7 $42.1 $15.7 $57.8 $44.8 $18.2 $0.0 $63.0 $69.3 $249.8 Allscripts Healthcare Solutions, Inc. Non-GAAP Financial Information - 2010 Financial Information (In millions, except per-share amounts) (unaudited) Three Months Ended Three Months Ended Three Months Ended (a) Transaction-related expenses are fees and expenses, including legal, investment banking and accounting fees and other integration-related expenses, incurred in connection with announced transactions. 3/31/10 6/30/10 9/30/2010 |
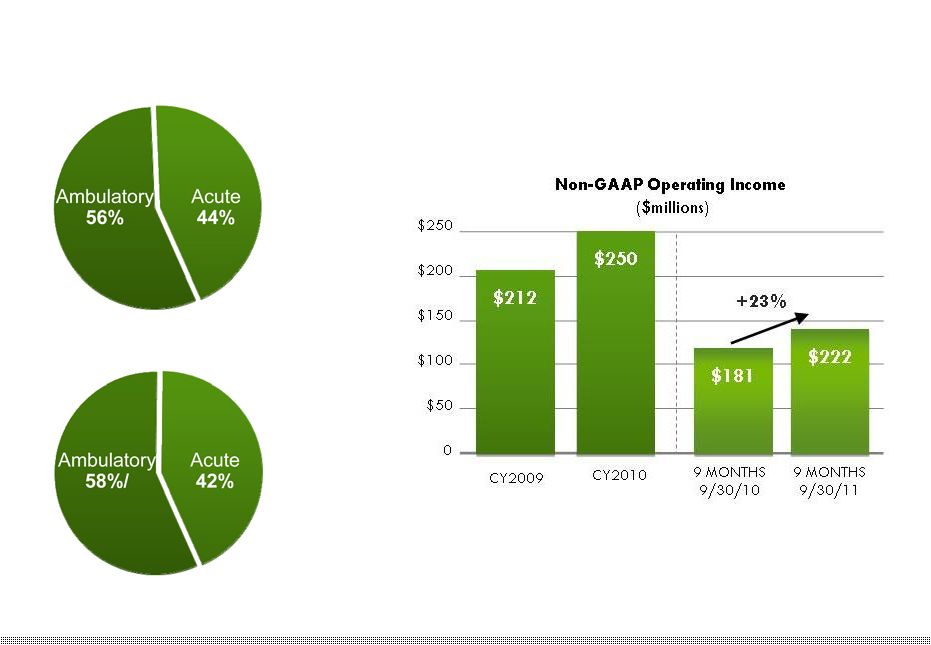
A Connected Community of Health | Copyright © 2012 Allscripts Healthcare Solutions, Inc. 38 Appendix: Non-GAAP Reconciliation • GAAP – non-GAAP operating income and margin reconciliation for the three and nine months ended September 30, 2011 and 2010. 9/30/11 9/30/10 9/30/11 9/30/10 Total revenue, as reported $368.8 $242.4 $1,060.9 $618.2 Deferred revenue adjustment 2.6 7.2 20.1 8.3 Eclipsys results pre-merger period 0.0 79.5 0.0 342.3 Total non-GAAP revenue $371.4 $329.1 $1,081.0 $968.8 Operating income (loss), as reported $37.4 ($1.2) $94.0 51.4 Deferred revenue adjustment 2.6 7.2 20.1 8.3 Acquisition-related amortization 16.6 10.5 49.9 27.9 Stock-based compensation expense 9.9 6.6 25.8 20.8 Transaction-related expense (a) 8.8 35.2 32.1 51.4 Eclipsys results pre-merger period 0.0 4.7 0.0 20.7 Total non-GAAP operating income $75.3 $63.0 $221.9 $180.5 Total non-GAAP operating income as a percentage of non-GAAP revenue 20.3% 19.1% 20.5% 18.6% (a) Transaction-related expenses are fees and expenses, including legal, investment banking and accounting fees and other integration-related expenses, incurred in connection with announced transactions. Allscripts Healthcare Solutions, Inc. Condensed Non-GAAP Financial Information (Unaudited) Three Months Ended Three Months Ended Nine Months Ended Nine Months Ended |
A Connected Community of Health | Copyright © 2012 Allscripts Healthcare Solutions, Inc. 39 Appendix: Non-GAAP Reconciliation • GAAP – non-GAAP EBITDA reconciliation for the 12 months ended September 30, 2011 EBITDA Calculation ($ in thousands) Combined Results for Allscripts and Eclipsys for the 12 months ended 9/30/11 Net income, as reported $43.3 Taxes 38.8 Stock-based compensation expense 37.3 Depreciation and Amortization 121.0 Interest expense 23.3 Transaction-related expenses 23.3 Deferred revenue adjustment 41.0 Gain on Sale of Assets (0.3) Earnings before interest, taxes, depreciation and amortization $327.5 Allscripts Healthcare Solutions, Inc. Condensed Non-GAAP Financial Information (In millions, except per-share amounts) (Unaudited) |
A Connected Community of Health | Copyright © 2012 Allscripts Healthcare Solutions, Inc. 40 Footnotes Regarding Financial Guidance Financial guidance was last provided by the company in a press release on November 3, 2011. This presentation does not subsequently update or reaffirm Allscripts financial guidance. Allscripts non-GAAP guidance for calendar 2011 assumes the following adjustment to approximately $1,458.0 million in GAAP revenue: approximately $21.0 million, pre-tax for an acquisition-related deferred revenue adjustment. Non-GAAP guidance for calendar 2011 assumes the following adjustments to GAAP operating and net income: approximately $66.5 million of acquisition- related amortization; approximately $36.0 million in stock-based compensation expense; and approximately $21.0 million in deferred revenue, all on a pre-tax basis. Allscripts 2011 non-GAAP net income and diluted earnings per share guidance assumes a 37.5-38.0 percent tax rate. |
A Connected Community of Health | Copyright © 2012 Allscripts Healthcare Solutions, Inc. 41 Explanation of Non-GAAP Financial Measures Allscripts reports its financial results in accordance with generally accepted accounting principles, or GAAP. To supplement this information, Allscripts presents in this press release total non-GAAP revenue, gross profit, operating income and net income, including non-GAAP net income on a per share basis, which are non-GAAP financial measures under Section 101 of Regulation G under the Securities Exchange Act of 1934, as amended. Total non-GAAP revenue consists of GAAP revenue as reported and Eclipsys revenue for periods prior to the August 24, 2010 consummation of the 2010 merger with Eclipsys (2010 Merger) and adds back the acquisition-related deferred revenue adjustment booked for GAAP purposes. Total non-GAAP gross profit consists of GAAP gross profit as reported and Eclipsys gross profit for periods prior to the consummation of the 2010 Merger and adds back the acquisition-related deferred revenue adjustment booked for GAAP purposes. Total non-GAAP operating income consists of GAAP operating income as reported and Eclipsys operating income for periods prior to the consummation of the 2010 Merger and adds back the acquisition-related deferred revenue adjustment booked for GAAP purposes and excludes acquisition-related amortization, stock-based compensation expense and transaction-related expenses. Non-GAAP net income consists of GAAP net income as reported and includes Eclipsys net income for periods prior to the consummation of the 2010 Merger, excludes acquisition-related amortization, stock-based compensation expense and transaction-related expenses, adds back the acquisition-related deferred revenue, in each case net of any related tax effects. Non-GAAP net income also includes a tax rate alignment adjustment. Management also believes that non-GAAP revenue, gross profit, operating income and net income and non-GAAP net income on a per share basis provide useful supplemental information to management and investors regarding the underlying performance of the Company's business operations and facilitates comparisons of the separate 2010 pre-merger results of legacy Allscripts and legacy Eclipsys to that of the Company's 2010 post- merger results. Acquisition accounting adjustments made in accordance with GAAP can make it difficult to make meaningful comparisons of the underlying operations of the business without considering the non-GAAP adjustments that we have provided and discussed herein. Management also uses this information internally for forecasting and budgeting as it believes that the measure is indicative of the Company's core operating results. In addition, the Company uses non-GAAP revenue, operating income and/or net income to measure achievement under the Company's stock and cash incentive compensation plans. Note, however, that non-GAAP revenue, gross profit, operating income and net income and non-GAAP net income on a per share basis are performance measures only, and they do not provide any measure of the Company's cash flow or liquidity. Non-GAAP financial measures are not in accordance with, or an alternative for, measures of financial performance prepared in accordance with GAAP and may be different from non-GAAP measures used by other companies. Non-GAAP measures have limitations in that they do not reflect all of the amounts associated with Allscripts results of operations as determined in accordance with GAAP. Investors and potential investors are encouraged to review the reconciliation of non-GAAP financial measures with GAAP financial measures contained within the attached condensed consolidated financial statements. |