    Allscripts Investor Presentation June 2013 Exhibit 99.1 |
 A Connected Community of Health | 1 Copyright © 2013 Allscripts Healthcare Solutions, Inc. Forward-Looking Statements This presentation contains forward-looking statements within the meaning of the federal securities laws. Statements regarding future events or developments, our future performance, as well as management’s expectations, beliefs, intentions, plans, estimates or projections relating to the future are forward-looking statements with the meaning of these laws. These forward-looking statements are subject to a number of risks and uncertainties, some of which are outlined below. As a result, no assurances can be given that any of the events anticipated by the forward- looking statements will transpire or occur, or if any of them do so, what impact they will have on our results of operations or financial condition. Such risks, uncertainties and other factors include, among other things: the possibility that our current initiatives focused on product delivery, client experience, streamlining our cost structure, and financial performance may not be successful, which could result in declining demand for our products and services, including attrition among our existing customer base; the impact of the realignment of our sales and services organization; potential difficulties or delays in achieving platform and product integration and the connection and movement of data among hospitals, physicians, patients and others; the risk that we will not achieve the strategic benefits of the merger (the “Eclipsys Merger”) with Eclipsys Corporation (Eclipsys), or other companies that we have purchased or that the Allscripts products will not be integrated successfully with these other companies products; competition within the industries in which we operate, including the risk that existing clients will switch to products of competitors; failure to maintain interoperability certification pursuant to the Health Information Technology for Economic and Clinical Health Act (HITECH), with resulting increases in development and other costs for us and possibly putting us at a competitive disadvantage in the marketplace; the volume and timing of systems sales and installations, the length of sales cycles and the installation process and the possibility that our products will not achieve or sustain market acceptance; the timing, cost and success or failure of new product and service introductions, development and product upgrade releases; any costs or customer losses we may incur relating to the standardization of our small office electronic health record and practice management systems that could adversely affect our results of operations; competitive pressures including product offerings, pricing and promotional activities; our ability to establish and maintain strategic relationships; errors or similar problems in our software products or other product quality issues; the outcome of any legal proceeding that has been or may be instituted against us and others; compliance obligations under new and existing laws, regulations and industry initiatives, including new regulations relating to HIPAA/HITECH, increasing enforcement activity in respect of anti-bribery, fraud and abuse, privacy, and similar laws, and future changes in laws or regulations in the healthcare industry, including possible regulation of our software by the U.S. Food and Drug Administration; the possibility of product-related liabilities; our ability to attract and retain qualified personnel; the continued implementation and ongoing acceptance of the electronic record provisions of the American Recovery and Reinvestment Act of 2009, as well as elements of the Patient Protection and Affordable Care Act (aka health reform) which pertain to healthcare IT adoption, including uncertainly related to changes in reimbursement methodology and the shift to pay-for-outcomes; maintaining our intellectual property rights and litigation involving intellectual property rights; legislative, regulatory and economic developments; risks related to third-party suppliers and our ability to obtain, use or successfully integrate third-party licensed technology; and breach of data security by third parties and unauthorized access to patient health information by third parties resulting in enforcement actions, fines and other litigation. See our Annual Report on Form 10-K/10K-A for 2012 and other public filings with the Securities and Exchange Commission (the “SEC”) for a further discussion of these and other risks and uncertainties applicable to our business. The statements herein speak only as of their date and we undertake no duty to update any forward-looking statement whether as a result of new information, future events or changes in expectations. |
 2 Explanation of Non-GAAP Financial Measures Non-GAAP revenue consists of GAAP revenue as reported and adds back the provision for revenue deferral as well as acquisition-related deferred revenue adjustment booked for GAAP purposes. Non-GAAP net income consists of GAAP net income as reported, excludes acquisition-related amortization, stock-based compensation expense and non-recurring expenses and transaction-related costs, and adds back the provision for revenue deferral as well as acquisition-related deferred revenue adjustments, in each case net of any related tax effects. Non-GAAP net income also includes a tax rate alignment adjustment. Adjusted EBITDA is a non-GAAP measure and consists of GAAP net income (loss) as reported and adjusts for: the provision for revenue deferral; provision/(benefit) for income taxes; net interest expense and interest income and other income/(expense); stock-based compensation expense; depreciation and amortization; deferred revenue adjustment; non-recurring and transaction-related costs; and non-cash asset impairment charges. A Connected Community of Health | Copyright © 2013 Allscripts Healthcare Solutions, Inc. Allscripts reports its financial results in accordance with generally accepted accounting principles, or GAAP. To supplement this information, Allscripts presents in this release non-GAAP revenue, and net income, including non-GAAP net income on a per share basis, and Adjusted EBITDA, which are non-GAAP financial measures under Section 101 of Regulation G under the Securities Exchange Act of 1934, as amended. |
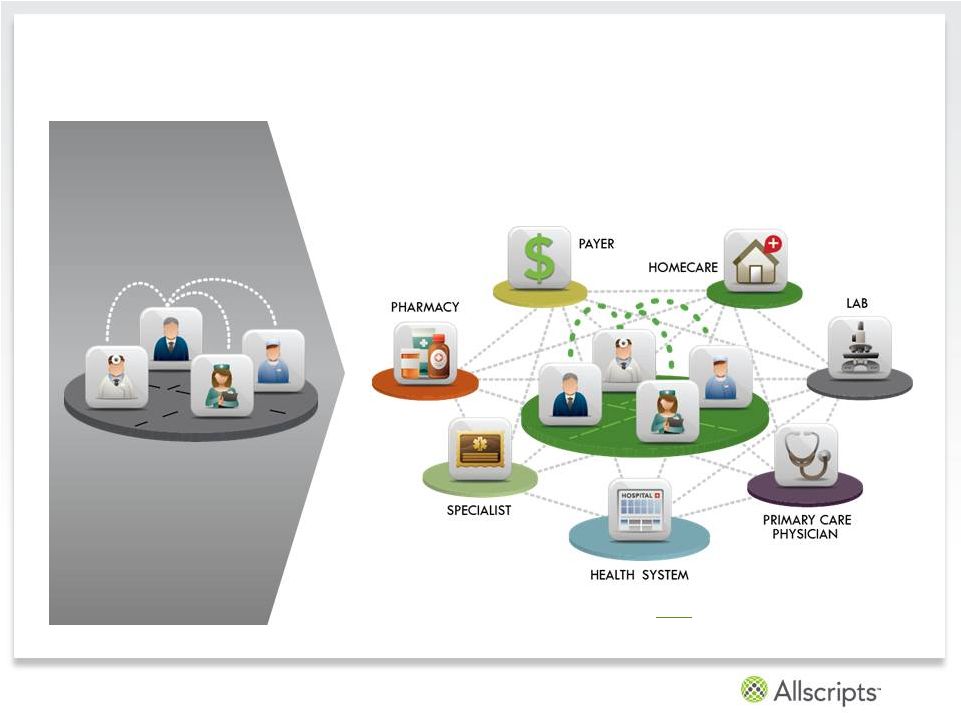
 3 An Open, Connected Community of Health ™ Our Vision We provide clinical, financial, connectivity and information SOLUTIONS and related professional services to physicians, health systems, hospitals and post-acute organizations. We deliver insights that healthcare providers require to generate world-class outcomes and transform healthcare by improving the quality and efficiency of patient care. A Connected Community of Health | Copyright © 2013 Allscripts Healthcare Solutions, Inc. |
 4 A Connected Community of Health | Copyright © 2013 Allscripts Healthcare Solutions, Inc. Who We Are and What We Do 1 Total research and development costs before software capitalization. OUR Solutions • Electronic Health Record Technology • Revenue Cycle Management • Professional Services • Clinical & Financial Transaction Management • Hosting • Connectivity • Population Health Management • IT Outsourcing OUR CLIENTS • 180,000 Physicians • 50,000 Physician Practices • 1,500 Hospitals • 10,000 Post-acute Facilities • 27,000 Individual Post-acute Providers OUR COMPANY • ~$1.45BB 2012 Revenue • ~7,100 Employees • Grow 2013 R&D 1 double-digits • Breadth and depth of solutions across the continuum of care |
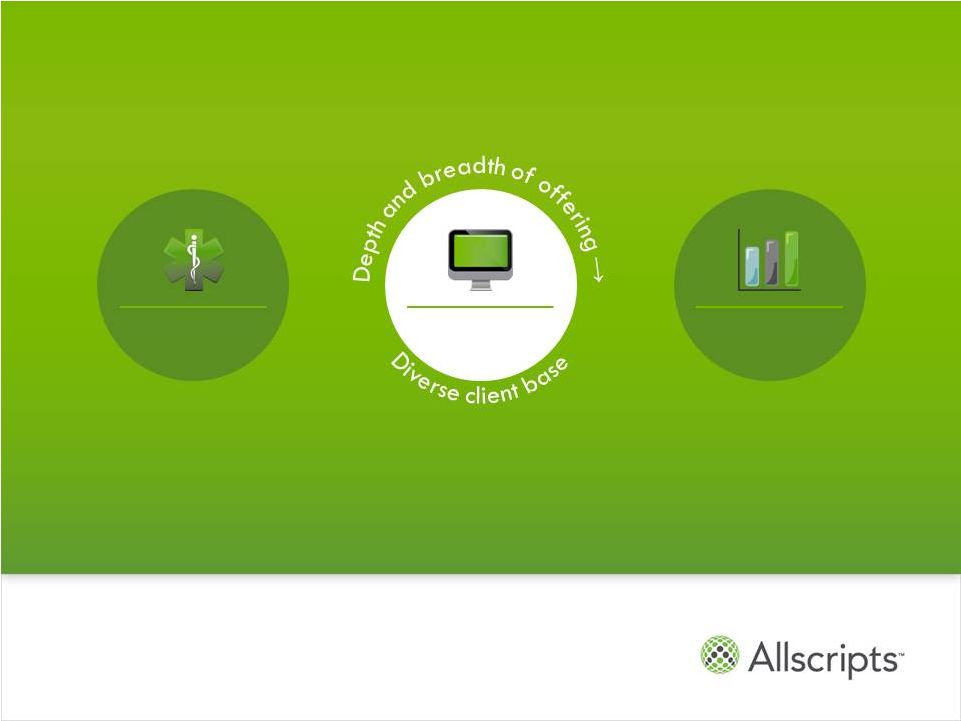
 5 Investment Highlights MARKET LEADER Diverse, industry-leading client base Brand name recognition OPEN systems COMPLETE PRODUCT PORTFOLIO Depth and breadth Maximizes opportunities to expand market and wallet share Significant investment in technology platform and mobile platforms DYNAMIC GROWTH MARKET Clinical innovation & regulatory requirements drive incremental client demand Replacement opportunity with fragmented, legacy vendors Connectivity, care coordination, analytics solutions for population health management Select global opportunities OPERATING LEVERAGE Scalable platform for sales growth $40-50MM SG&A cost savings in 2014 Making key investments today SOUND FINANCIAL MODEL ~$2.7BB revenue backlog (March 31, 2013) ~74% recurring revenue (March 31, 2013) ~$223MM 2012 operating cash flow A Connected Community of Health | Copyright © 2013 Allscripts Healthcare Solutions, Inc. |
 6 MARKET DIFFERENTIATION GROWTH Agenda A Connected Community of Health | Copyright © 2013 Allscripts Healthcare Solutions, Inc. |
 7 A Large, Dynamic Market U.S. Acute/Ambulatory EHR Opportunity ~$43BB Source: McKinsey & Company $45 $40 $35 $30 $25 $20 $15 $10 $5 $0 Ambulatory Stand-Alone Opportunity Acute Stand-Alone Opportunity Integrated/Complete Solution Across Hospitals and Physician Practices $16B $10B $17B A Connected Community of Health | Copyright © 2013 Allscripts Healthcare Solutions, Inc. |
 8 Meaningful Use ICD-10 HIPAA Population Health Management • ~$20BB federal program to drive “meaningful” adoption of electronic health records – Technology and regulatory bar increases over time – Yields opportunity for market share gains and competitor replacement/additions • Overhaul of healthcare coding system for procedures, diagnosis and billing • Opportunities to upgrade revenue cycle management systems • Professional and related services opportunity • Shift away from volume to value • Requires infrastructure above and beyond the electronic health record • Connect, analyze and coordinate care across a community • Patient and consumer engagement • The PHM technology market could grow to exceed $60BB by 2025¹ • Recent updates to HIPAA Rules drive additional HIPAA compliance requirements • Technology platform enables and facilitates sharing of information – Critical criteria for success in next generation technology systems 1 Source: Equity research reports Industry Demand Drivers Allscripts well positioned to capitalize on evolving market A Connected Community of Health | Copyright © 2013 Allscripts Healthcare Solutions, Inc. |
 9 A Connected Community of Health | Copyright © 2013 Allscripts Healthcare Solutions, Inc. Unsustainable Trend Requiring Change 9 VOLUME VALUE Source: HFMA “Value in Healthcare: Current State & Future Directions, June 2011 • Fragmented providers and payments • No uniform quality • Fees for volume • Demand increasing • Collaboration, connectivity • Clinical, financial data, analysis • Optimize outcomes • Accountable care |
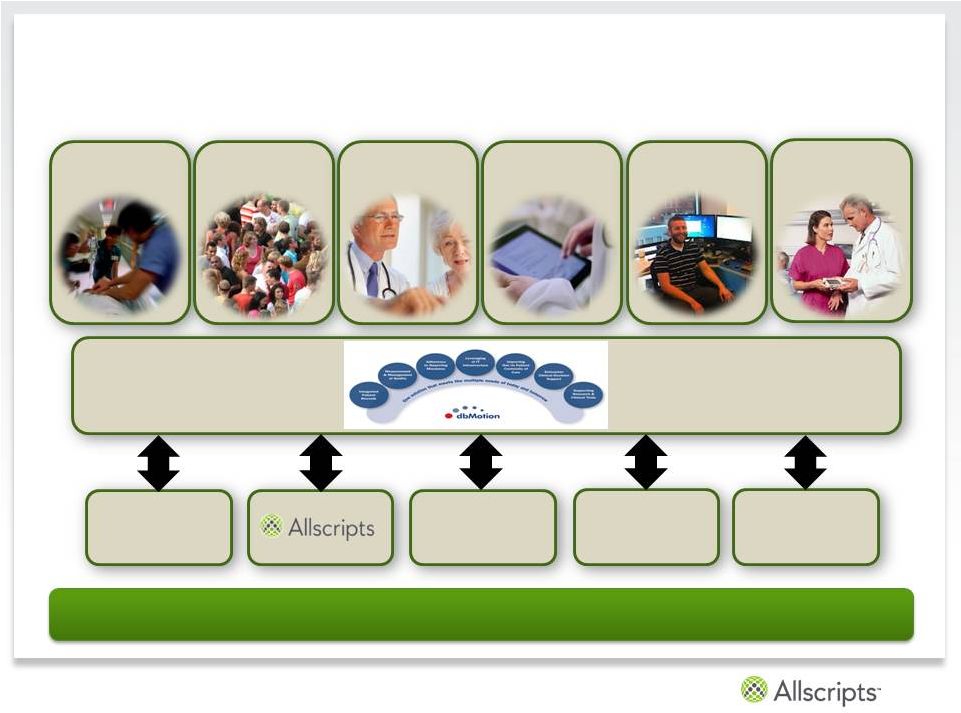 10 Unsustainable Trend Requiring Change…Will Drive Future Growth Opportunities “Above” the EHR Care Coordination Population Health Patient Engagement Enterprise Analytics Software Development Kit Health Info Exchange Physician EHRs Hospital EHRs Alternate Site EHRs Government Entities Patient-centered Platform Single health record Allscripts provides connectivity, analytics and services across the community, regardless of underlying system – a key differentiator for the future A Connected Community of Health | Copyright © 2013 Allscripts Healthcare Solutions, Inc. |
 11 MARKET GROWTH A Connected Community of Health | Copyright © 2013 Allscripts Healthcare Solutions, Inc. DIFFERENTIATION |
 12 Leading Footprint Across the Market 1 of 3 MDs 1 of 3 Hospitals 10,000 Post-acute Care Providers Used By: A Connected Community of Health | Copyright © 2013 Allscripts Healthcare Solutions, Inc. |
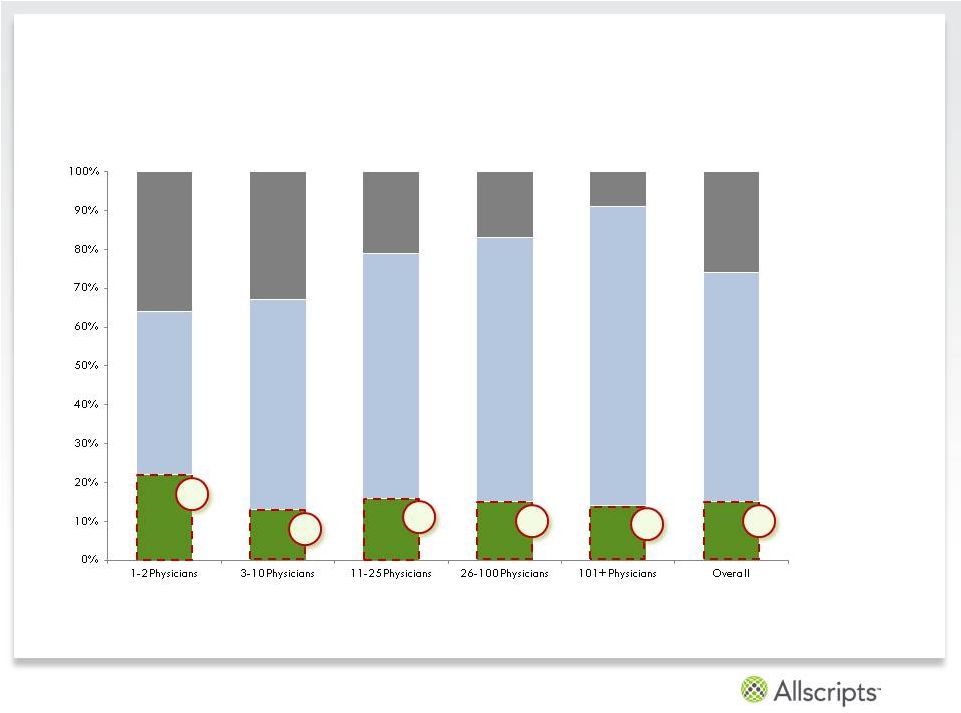 13 Leading Market Share in Ambulatory 2012 Share by Practice Size Source: Capsite, 2012 US Ambulatory EHR & PM Study, August 2012 Allscripts Market Position #1 #1 #1 #2 #2 #2 22% 13% 16% 15% 14% 15% 42% 54% 63% 68% 77% 59% 36% 33% 21% 17% 9% 26% Top 15 Vendors (ex Allscripts) Rest of Market A Connected Community of Health | Copyright © 2013 Allscripts Healthcare Solutions, Inc. |
 14 Source: Analysis of HIMSS Analytics, CDR, 2011-2012. 1. For illustrative purposes, two acute vendors with ~22% and ~9% of the hospital IT market. Total 2012 Market Share Potential replacement opportunity 31% Positioned for Growth in Acute 1 Allscripts 4.0% Other 65.0 A Connected Community of Health | Copyright © 2013 Allscripts Healthcare Solutions, Inc. |
 15 A Connected Community of Health | Copyright © 2013 Allscripts Healthcare Solutions, Inc. To Succeed in Value Based Care: Interoperability, Open Platform Traditional World (Monolithic/Closed Mainframe) New World (Modern/Open Platform) Connect Inside Connect Inside and Outside |
 16 A Connected Community of Health | Copyright © 2013 Allscripts Healthcare Solutions, Inc. Our Solutions: OPEN + Depth & Breadth |
 17 A Connected Community of Health | Copyright © 2013 Allscripts Healthcare Solutions, Inc. Complete Core Solution Set Homecare Care Management Electronic Health Records Practice Management Payerpath Clinical and Financial Management Care Management Emergency Department • Enterprise EHR and Practice Management • Professional EHR and Practice Management • Pathway Solutions • Sunrise Clinical Manager • Sunrise Financial Manager • Sunrise Ambulatory • Allscripts Care Management • Provides business, clinical and scheduling functionality for multiple lines of business – home, health, hospital & private duty • Referral Management allows home health agencies, hospice agencies, and post-acute facilities to track all patient referrals Physician Hospital & Health System At Home/Alternate Site Deploy as software, SaaS & hosted solutions |
 18 A Connected Community of Health | Copyright © 2013 Allscripts Healthcare Solutions, Inc. SOLUTIONS for the “Virtual Layer” Beyond the EHR: Patient Engagement, Connectivity, Analytics and Care Coordination Physician Hospital & Health System At Home/Alternate Site Health Information Exchange: dbMotion Patient Engagement: Follow My Health™ Clinical Analytics & Financial Analytics: CQS; dB Motion; EPSi Care Coordination Applications: e.g. Care Director, Care Management Technology platform a source of competitive advantage for the future |
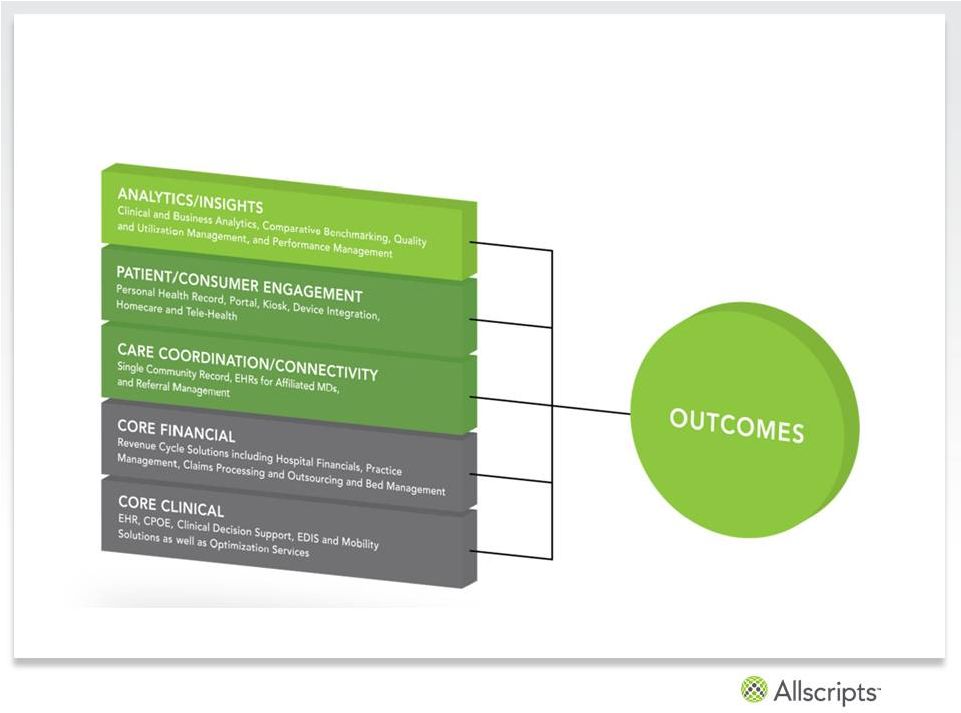
 19 A Connected Community of Health | Copyright © 2013 Allscripts Healthcare Solutions, Inc. • Stage 1: EHR/Application • Stage 2: Connection • Stage 3: Information • Stage 4: Analytics and Insights • Stage 5: Outcomes LEVEL OF IMPACT (Quality, Cost of Care) TIME Well-positioned for Next Generation of Healthcare • Significant drivers post Meaningful Use: Accountable Care Organization functionality, care coordination and predictive analytics (i.e. Population Health Management) • Interoperability, connectivity, clinical decision support to drive better outcomes Today |
 20 A Connected Community of Health | Copyright © 2013 Allscripts Healthcare Solutions, Inc. Allscripts Leadership Stabilized and experienced team comprised of HCIT and technology veterans Name Title Years Relevant Experience Experience Paul Black CEO and President 25+ Cerner, IBM Rick Poulton Chief Financial Officer 25+ AAR, United Airlines, Arthur Andersen Cliff Meltzer EVP, Solutions Development 30+ CA Technologies, Apple, Cisco, IBM Steve Shute EVP, Sales & Services 18 IBM Joe Carey Client Experience Officer 23 Enterprise Systems, HBOC Brian Farley SVP, General Counsel 20+ Motorola, Level 3, Rythyms NetConnections Dennis Olis SVP, Operations 25+ Motorola Deborah Snow SVP, Culture & Talent 18 Cisco, Bank of America Diane Bradley Chief Quality and Outcomes Officer 16 Motorola, University Health System |
 21 A Connected Community of Health | Copyright © 2013 Allscripts Healthcare Solutions, Inc. MARKET DIFFERENTIATION GROWTH |
 22 A Connected Community of Health | Copyright © 2013 Allscripts Healthcare Solutions, Inc. Strategic Imperatives for 2013 Client Commitments Position for Growth Enhance Financial Consistency Operational Effectiveness • Deliver timely, high-quality upgrades, ensuring client success with upcoming regulatory compliance requirements • Invest in improving client satisfaction • “Centers of Excellence” R&D/support strategy • $500MM R&D and M&A commitment in 2013 • Acquired leading connectivity provider dbMotion and patient engagement platform “Follow My Health” • Delivered integrated acute revenue cycle management solution • Increase deployment of hosted and mobile solutions • Launched Population Health Management applications including “Care Director” • Package offerings • Longer term client commitments • Increased subscription/SaaS revenue • Expand share of wallet through incremental IT budget • Site consolidation plan • Rationalize small physician office offering • Streamline reporting structures and management layers • Discipline in procurement and sourcing • Invest $45-$50MM in 2013 to drive in excess of $50MM in annualized savings beginning in 2014 |
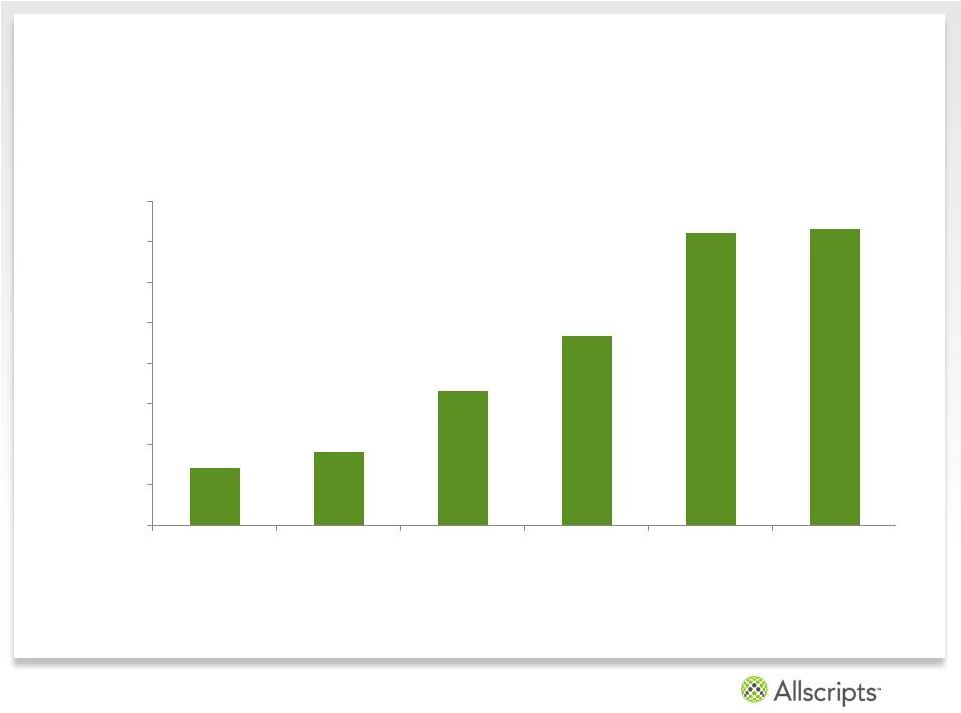 23 A Connected Community of Health | Copyright © 2013 Allscripts Healthcare Solutions, Inc. Growth: Long-Term Focus ¹ Annual revenue for Allscripts illustrated above is based on a GAAP presentation and is calenderized based on reported quarterly results. Please note Allscripts changed its fiscal year-end to May between the period of September 2008 and May 2010. Revenue includes the impact of acquisitions and divestitures, including revenue from Eclipsys beginning in 3Q 2010. ALLSCRIPTS REVENUE 1 2007 - 2012 $0 $200 $400 $600 $800 $1,000 $1,200 $1,400 $1,600 2007 2008 2009 2010 2011 2012 $934MM $1.444BB $1.446BB $282MM $364MM $661MM |
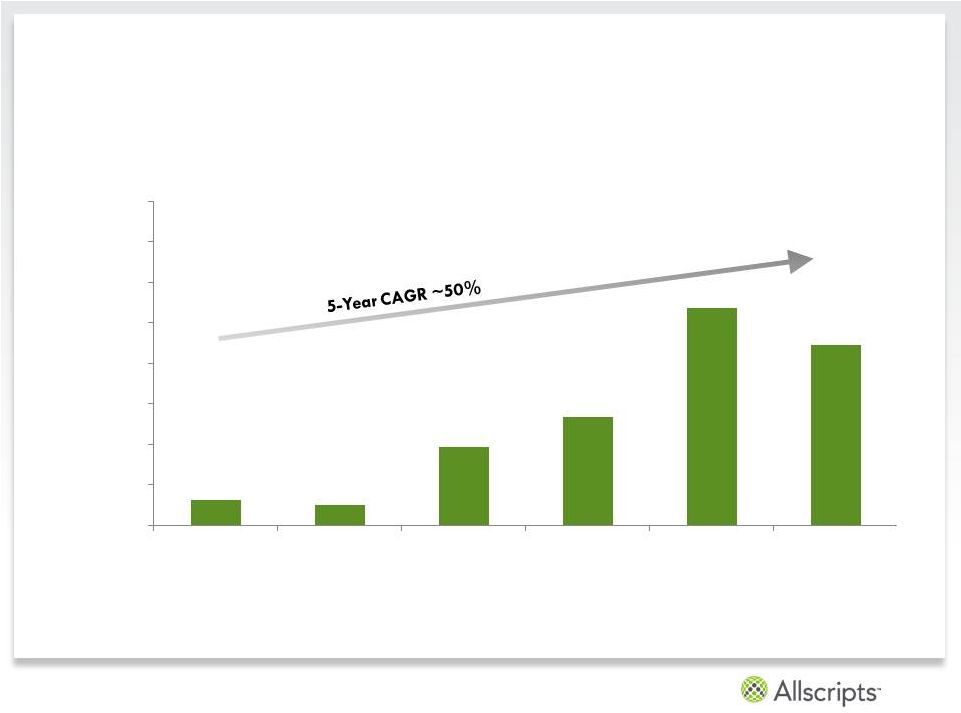 24 A Connected Community of Health | Copyright © 2013 Allscripts Healthcare Solutions, Inc. Strong Cash Flow Generation ¹ Annual cash flow from operations for Allscripts illustrated above is calenderized based on annual results. Please note Allscripts changed its fiscal year-end to May between the period of September 2008 and May 2010. Cash flows from operations also include the impact of acquisitions and divestitures CASH FLOW FROM OPERATIONS 1 2007 - 2012 $0 $50 $100 $150 $200 $250 $300 $350 $400 2007 2008 2009 2010 2011 2012 $134MM $269MM $223MM $31MM $24MM $97MM |
 25 A Connected Community of Health | Copyright © 2013 Allscripts Healthcare Solutions, Inc. 1Q’13 Results ($MM except per share) Q1’13 Q4’12 Q1’12 Y/Y % change Bookings $177.7 $180.7 $194.6 (8.7%) Non–GAAP Revenue $348.0 $368.0 $365.5 (4.8%) Adj. EBITDA margin $49.8 (2) 14% $53.6 15% $58.3 16.0% (14.6%) (1.7%) Non-GAAP EPS $0.09 (2) $0.16 $0.12 (25%) Please see the Non-GAAP reconciliation and related footnotes in the appendix to this presentation Adjusted EBITDA and non-GAAP EPS for the three months ended March 31, 2013 include a pre-tax gain of approximately $8.0 million.investor.allscripts.com 1 1 1 1. 2. Source: Company filings and publications. |
 26 A Connected Community of Health | Copyright © 2013 Allscripts Healthcare Solutions, Inc. Recent Results and Corporate Update • Q1: signed a new Sunrise community agreement (Resolute Health) and large client renewal (Phoenix Children’s Hospital) • Investing in clients /solutions • Focused on meeting commitments • Results not indicative of long-term potential • Increased Q1 2013 gross R&D expenditures 19% year-over-year • Recent acquisitions (March 2013) position Allscripts for future growth • dbMotion • Follow My Health • Non-GAAP revenue and non-GAAP operating income for the second quarter of 2013 are expected to be materially consistent with the first quarter of 2013 Source: Company filings and publications. investor.allscripts.com |
 27 Key Balance Sheet Metrics ($MM) 2010 2011 2012 Q1’13 Cash and Cash Equivalents $129.4 $157.8 $104.0 $92.3 Accounts Receivable 317.2 362.8 337.0 351.8 Total Assets 2,418.6 2,503.6 2,384.5 2,622.8 Accounts Payable 46.6 41.2 45.9 73.0 Accrued Liabilities 125.1 121.5 137.2 140.7 Total Deferred Revenue 228.6 288.9 290.7 327.9 Debt 490.5 368.1 442.0 544.3 Total Liabilities 1,034.8 1,026.9 1,100.1 1,288.5 Stockholders’ Equity 1,383.8 1,476.7 1,284.3 1,334.3 Source: Company filings A Connected Community of Health | Copyright © 2013 Allscripts Healthcare Solutions, Inc. |
 28 A Connected Community of Health | Copyright © 2013 Allscripts Healthcare Solutions, Inc. In Summary…. |
 29 Non-GAAP Reconciliations: Revenue and earnings first quarter 2013 and 2012 and fourth quarter 2012 Source: Company filings A Connected Community of Health | Copyright © 2013 Allscripts Healthcare Solutions, Inc. 3/31/13 12/31/12 3/31/12 Total revenue, as reported $347.1 $350.9 $364.7 Provision for revenue deferral (a) 0.0 16.8 0.0 Acquisition-related deferred revenue adjustment 0.9 0.3 0.8 Total non-GAAP revenue $348.0 $368.0 $365.5 Net income/(loss), as reported ($11.6) ($24.3) $5.8 Provision for revenue deferral 0.0 17.3 0.0 Acquisition-related deferred revenue adjustment 0.7 0.3 0.5 Acquisition-related amortization 12.4 15.9 10.4 Stock-based compensation expense 6.1 13.0 4.9 Non-recurring expenses and transaction-related costs 16.0 12.5 1.9 Tax rate alignment (7.4) (6.7) 0.0 Non-GAAP net income $16.2 $28.1 $23.5 Tax Rate 23% -3% 37% Weighted shares outstanding - diluted 173.7 173.5 192.9 Earnings per share - diluted, as reported ($0.07) ($0.14) $0.03 Non-GAAP earnings per share - diluted $0.09 $0.16 $0.12 Three Months Ended Allscripts Healthcare Solutions, Inc. Condensed Non-GAAP Financial Information (In millions, except per-share amounts) (Unaudited) (a) Provision for revenue deferral for the three months and year ended December 31, 2012 reflects a non-recurring revenue deferral related to clients who have long-aged accounts receivable balances. Three Months Ended Three Months Ended |
 30 Non-GAAP Reconciliations: Adjusted EBITDA first quarter 2013 and 2012 and fourth quarter 2012 Source: Company filings A Connected Community of Health | Copyright © 2013 Allscripts Healthcare Solutions, Inc. 3/31/13 12/31/12 3/31/12 Total revenue, as reported $347.1 $350.9 $364.7 Provision for revenue deferral (a) 0.0 16.8 0.0 Acquisition related deferred revenue adjustment 0.9 0.3 0.8 Total non-GAAP revenue $348.0 $368.0 $365.5 Net income/(loss), as reported ($11.6) ($24.3) $5.8 Tax provision/(benefit) (13.2) (5.8) 3.7 Interest expense (income) and other (income) expense (b) 3.2 2.2 2.0 Stock-based compensation expense 8.0 12.7 7.7 Depreciation and amortization 40.8 39.6 35.2 Acquisition-related deferred revenue adjustments 0.9 0.3 0.8 Provision for revenue deferral 0.0 16.8 0.0 Acquisition-related amortization 1.2 0.0 0.0 Non-recurring expenses and transaction-related costs (c) 20.4 12.2 3.0 Non-GAAP adjusted EBITDA $49.8 $53.6 $58.3 Non-GAAP adjusted EBITDA margin 14% 15% 16% Three Months Ended Allscripts Healthcare Solutions, Inc. Non-GAAP Financial Information - Adjusted EBITDA (In millions) Three Months Ended Three Months Ended (Unaudited) (a) Provision for revenue deferral for the three months and year ended December 31, 2012 reflects a non-recurring revenue deferral related to clients who have long-aged accounts receivable balances. (b) Interest expense (income) and other (income) expense has been adjusted from the amounts presented in the statements of operations in order to remove the amortization of deferred debt issuance costs from interest expense since such amortization is also included in depreciation and amortization. Additionally, the amount presented for the three months ended March 31, 2013 excludes gains on investments totaling $8.0 million. (c) Non-recurring expenses relate to certain severance, legal, consulting, and other charges incurred in connection with activities that are considered one-time. Depreciation expense totaling $0.4 million has been excluded from non-recurring expenses for the three months ended March 31, 2013 since this amount is also included in depreciation and amortization. |
    Allscripts Investor Presentation June 2013 |