INVESTOR DAY BEACON PRESENTS FEBRUARY 24, 2022 | HOUSTON, TX Exhibit 99.1
Disclosure Notice This presentation contains information about management's view of the Company's future expectations, plans and prospects that constitute forward-looking statements for purposes of the safe harbor provisions under the Private Securities Litigation Reform Act of 1995. In addition, oral statements made by our directors, officers and employees to the investor and analyst communities, media representatives and others, depending upon their nature, may also constitute forward-looking statements. Forward-looking statements can be identified by the fact that they do not relate strictly to historic or current facts and often use words such as “anticipate,” “estimate,” “expect,” “believe,” “will likely result,” “outlook,” “project,” and “targets” and other words and expressions of similar meaning. Investors are cautioned not to place undue reliance on forward-looking statements. Actual results may differ materially from those indicated by such forward-looking statements as a result of various important factors, including, but not limited to, those set forth in the "Risk Factors" section of the Company's Form 10-K for the fiscal year ended September 30, 2021 and subsequent filings with the U.S. Securities and Exchange Commission. The Company may not succeed in addressing these and other risks. Consequently, all forward-looking statements in this presentation are qualified by the factors, risks and uncertainties contained therein. In addition, the forward-looking statements included in this presentation represent the Company's views as of the date of this presentation and these views could change. However, while the Company may elect to update these forward-looking statements at some point, the Company specifically disclaims any obligation to do so, other than as required by federal securities laws. These forward-looking statements should not be relied upon as representing the Company's views as of any date subsequent to the date of this presentation. This presentation contains references to certain financial measures that are not presented in accordance with United States Generally Accepted Accounting Principles (“GAAP"). These non-GAAP financial measures include Adjusted EBITDA, Adjusted EBITDA margin, Adjusted Operating Expense, Adjusted Operating Expense margin, Free Cash Flow, Free Cash Flow Conversion and Net Debt Leverage. The Company uses non-GAAP financial measures to evaluate financial performance, analyze underlying business trends and establish operational goals and forecasts that are used when allocating resources. The Company believes these non-GAAP financial measures permit investors to better understand changes over comparative periods by providing financial results that are unaffected by certain items that are not indicative of ongoing operating performance. While the Company believes these measures are useful to investors when evaluating performance, they are not prepared and presented in accordance with GAAP, and therefore should be considered supplemental in nature. The Company’s non-GAAP financial measures should not be considered in isolation or as a substitute for other financial performance measures presented in accordance with GAAP. These non-GAAP financial measures may have material limitations including, but not limited to, the exclusion of certain costs without a corresponding reduction of net income for the income generated by the assets to which the excluded costs relate. In addition, these non-GAAP financial measures may differ from similarly titled measures presented by other companies. A reconciliation of these non-GAAP financial measures to their most directly comparable GAAP financial measure can be found in the Appendix. Unless otherwise specifically noted, references in this presentation to years refer to calendar years and, accordingly, historical financial information has been recast on a calendar year basis. Unless otherwise specifically noted, financial information contained in this presentation reflects continuing operations only.
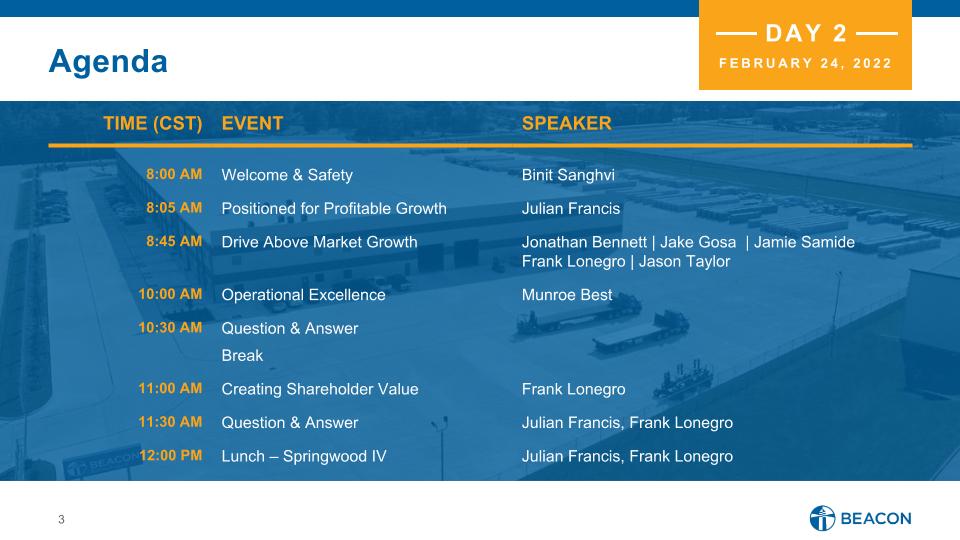
Agenda DAY 2 FEBRUARY 24, 2022 TIME (CST) EVENT SPEAKER 8:00 AM Welcome & Safety Binit Sanghvi 8:05 AM Positioned for Profitable Growth Julian Francis 8:45 AM Drive Above Market Growth Jonathan Bennett | Jake Gosa | Jamie Samide �Frank Lonegro | Jason Taylor 10:00 AM Operational Excellence Munroe Best 10:30 AM Question & Answer Break 11:00 AM Creating Shareholder Value Frank Lonegro 11:30 AM Question & Answer Julian Francis, Frank Lonegro 12:00 PM Lunch – Springwood IV Julian Francis, Frank Lonegro

Julian Francis, Chief Executive Officer Unlocking Our Potential
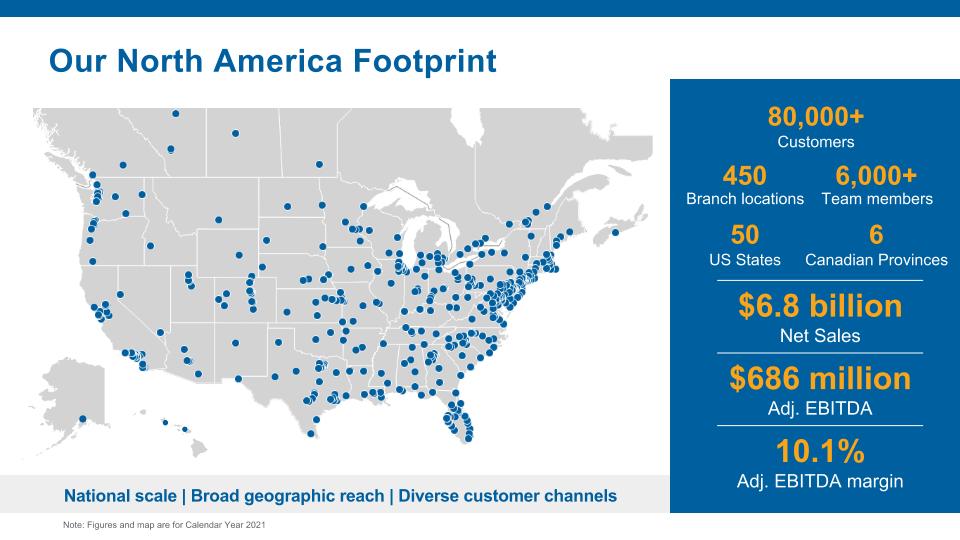
National scale | Broad geographic reach | Diverse customer channels 450 Branch locations 50 US States 80,000+ Customers 10.1% Adj. EBITDA margin 6 Canadian Provinces $6.8 billion Net Sales $686 million Adj. EBITDA Note: Figures and map are for Calendar Year 2021 Our North America Footprint 6,000+ Team members
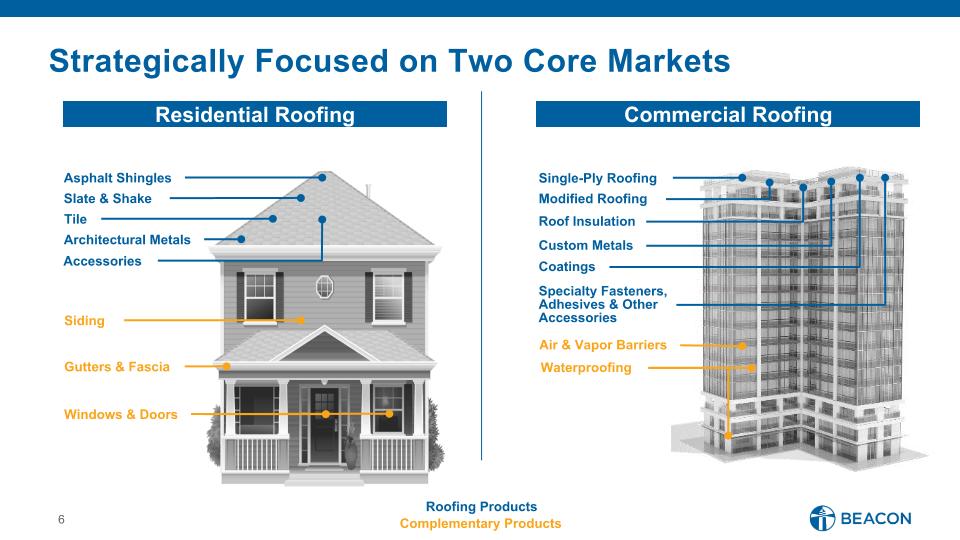
Slate & Shake Asphalt Shingles Gutters & Fascia Siding Windows & Doors Roofing Products Complementary Products Roof Insulation Single-Ply Roofing Waterproofing Air & Vapor Barriers Architectural Metals Accessories Modified Roofing Specialty Fasteners, Adhesives & Other Accessories Custom Metals Tile Coatings Strategically Focused on Two Core Markets Commercial Roofing Residential Roofing
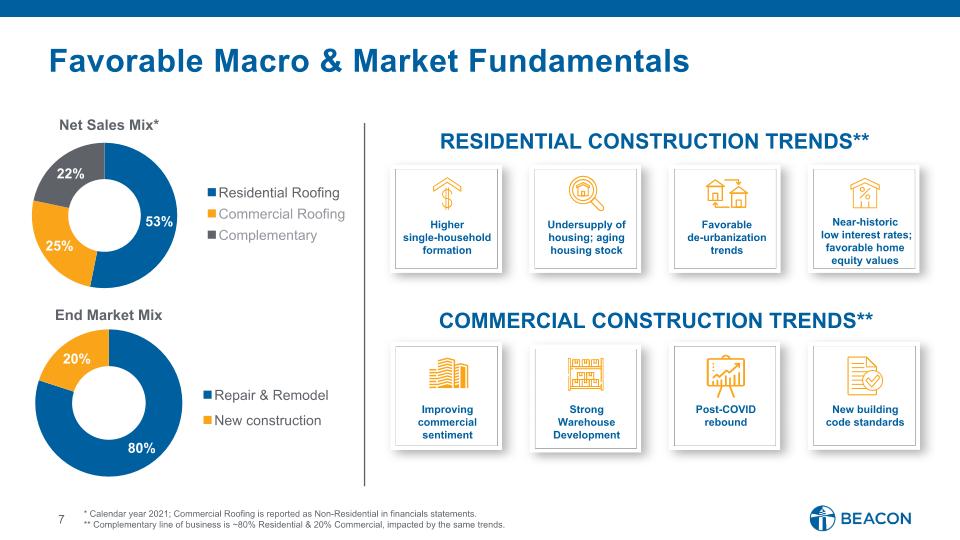
7 * Calendar year 2021; Commercial Roofing is reported as Non-Residential in financials statements. ** Complementary line of business is ~80% Residential & 20% Commercial, impacted by the same trends. Improving commercial sentiment Higher �single-household formation Undersupply of housing; aging housing stock Favorable de-urbanization trends Near-historic low interest rates; favorable home equity values New building �code standards RESIDENTIAL CONSTRUCTION TRENDS** COMMERCIAL CONSTRUCTION TRENDS** Strong Warehouse Development Post-COVID rebound Favorable Macro & Market Fundamentals
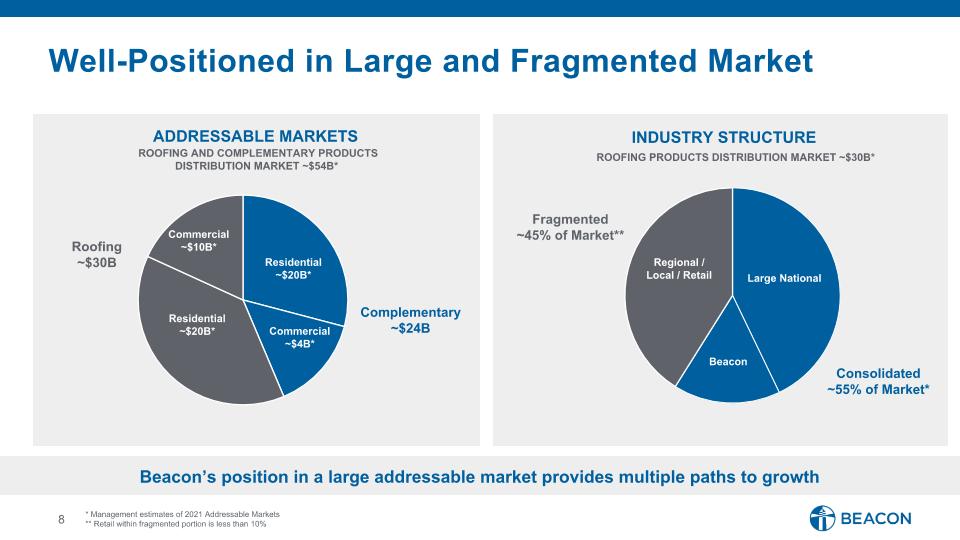
Well-Positioned in Large and Fragmented Market ADDRESSABLE MARKETS * Management estimates of 2021 Addressable Markets ** Retail within fragmented portion is less than 10% Complementary ~$24B Roofing ~$30B Residential ~$20B* Commercial ~$4B* Regional / Local / Retail Beacon Consolidated ~55% of Market* Fragmented ~45% of Market** Commercial ~$10B* Residential ~$20B* Large National Roofing products DISTRIBUTION market ~$30B* INDUSTRY STRUCTURE Beacon’s position in a large addressable market provides multiple paths to growth ROOFING AND COMPLEMENTARY PRODUCTS DISTRIBUTION market ~$54B*
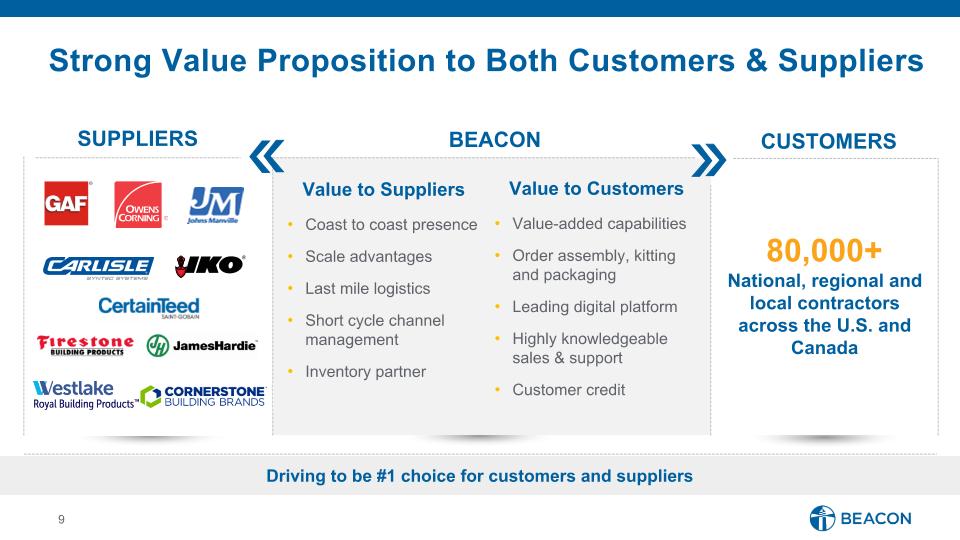
80,000+ National, regional and local contractors across the U.S. and Canada Value to Suppliers Coast to coast presence Scale advantages Last mile logistics Short cycle channel management Inventory partner Value to Customers Value-added capabilities Order assembly, kitting and packaging Leading digital platform Highly knowledgeable sales & support Customer credit CUSTOMERS SUPPLIERS BEACON Driving to be #1 choice for customers and suppliers Strong Value Proposition to Both Customers & Suppliers
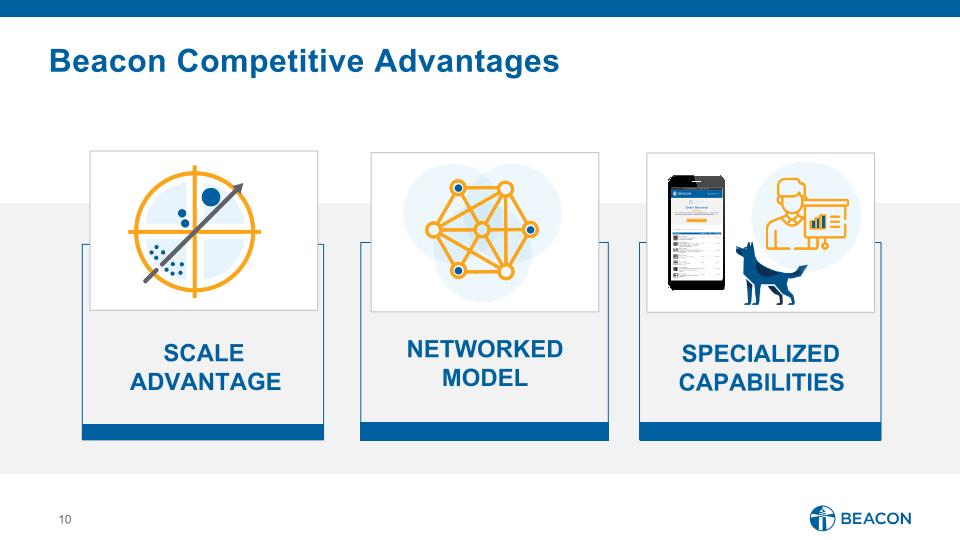
Beacon Competitive Advantages SCALE ADVANTAGE SPECIALIZED CAPABILITIES NETWORKED MODEL
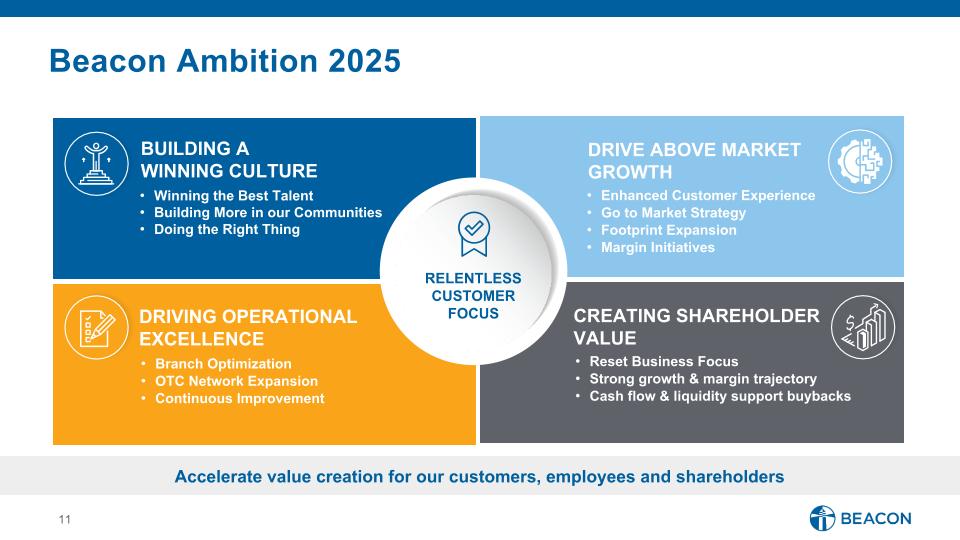
RELENTLESS CUSTOMER FOCUS DRIVING OPERATIONAL EXCELLENCE Branch Optimization OTC Network Expansion Continuous Improvement BUILDING A WINNING CULTURE Winning the Best Talent Building More in our Communities Doing the Right Thing Drive Above Market Growth Enhanced Customer Experience Go to Market Strategy Footprint Expansion Margin Initiatives Reset Business Focus Strong growth & margin trajectory Cash flow & liquidity support buybacks Creating Shareholder Value Accelerate value creation for our customers, employees and shareholders Beacon Ambition 2025
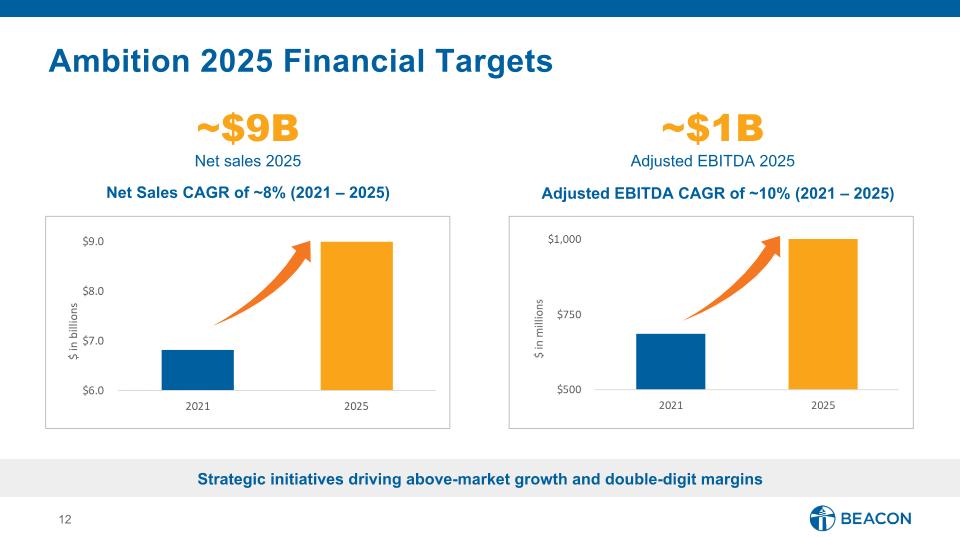
Ambition 2025 Financial Targets Strategic initiatives driving above-market growth and double-digit margins Net Sales CAGR of ~8% (2021 – 2025) Adjusted EBITDA CAGR of ~10% (2021 – 2025) ~$9B Net sales 2025 ~$1B Adjusted EBITDA 2025
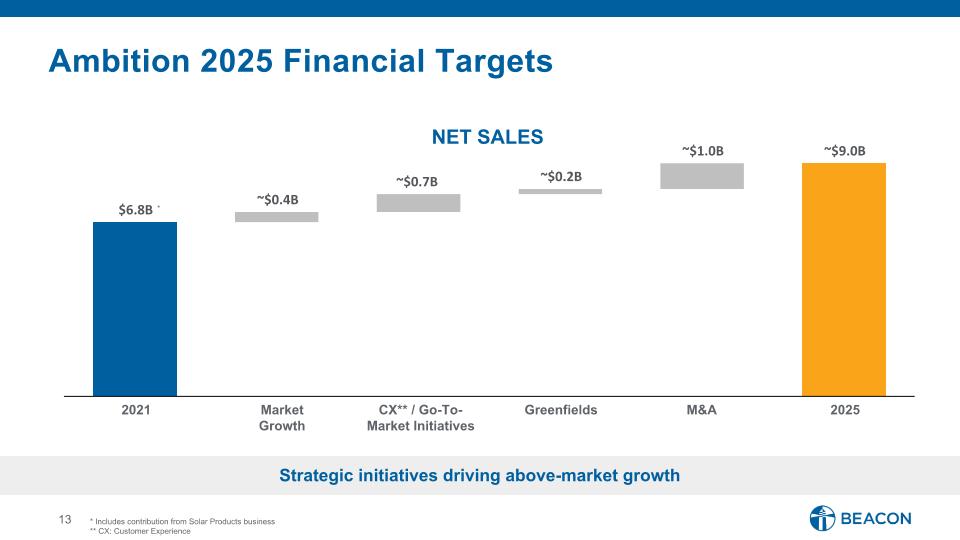
Ambition 2025 Financial Targets NET SALES * Includes contribution from Solar Products business ** CX: Customer Experience 2021 Market Growth CX** / Go-To-Market Initiatives Greenfields M&A 2025 * $6.8B ~$0.4B ~$0.7B ~$0.2B ~$1.0B ~$9.0B Strategic initiatives driving above-market growth
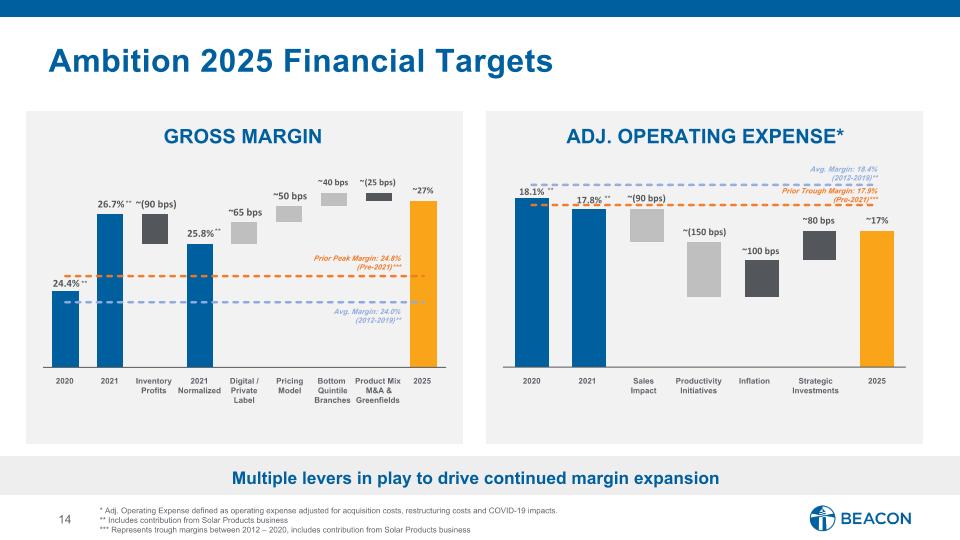
18.1% 17.8% ~(90 bps) ~(150 bps) ~100 bps ~80 bps ~17% 24.4% 26.7% ~(90 bps) 25.8% ~ 65 bps ~ 50 bps ~ 40 bps ~ (25 bps) ~27% Ambition 2025 Financial Targets Multiple levers in play to drive continued margin expansion * Adj. Operating Expense defined as operating expense adjusted for acquisition costs, restructuring costs and COVID-19 impacts. ** Includes contribution from Solar Products business *** Represents trough margins between 2012 – 2020, includes contribution from Solar Products business GROSS MARGIN 2021 2025 Digital / �Private Label Pricing Model Bottom Quintile Branches 2020 Product Mix� M&A & Greenfields ADJ. OPERATING EXPENSE* 2021 Normalized Inventory Profits Prior Peak Margin: 24.8% (Pre-2021)*** Avg. Margin: 24.0% (2012-2019)** ** ** ** 2021 2020 2025 Sales Impact Productivity Initiatives Strategic Investments Prior Trough Margin: 17.9% (Pre-2021)*** Avg. Margin: 18.4% (2012-2019)** Inflation ** **
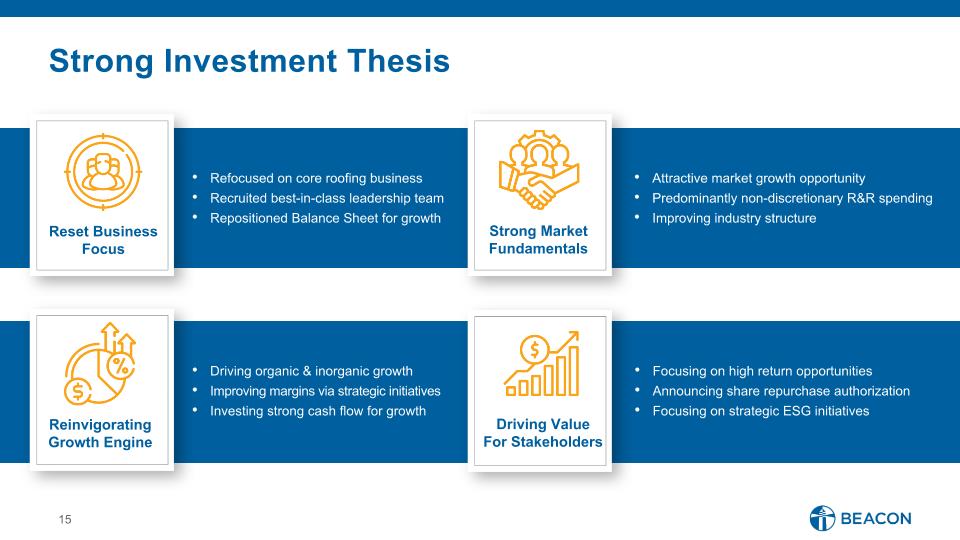
Strong Investment Thesis Refocused on core roofing business Recruited best-in-class leadership team Repositioned Balance Sheet for growth Reset Business �Focus Strong Market Fundamentals Attractive market growth opportunity Predominantly non-discretionary R&R spending Improving industry structure Driving organic & inorganic growth Improving margins via strategic initiatives Investing strong cash flow for growth Focusing on high return opportunities Announcing share repurchase authorization Focusing on strategic ESG initiatives Reinvigorating �Growth Engine Driving Value �For Stakeholders

Jonathan Bennett, Chief Commercial Officer Initiatives and Investments to Drive Above Market Growth
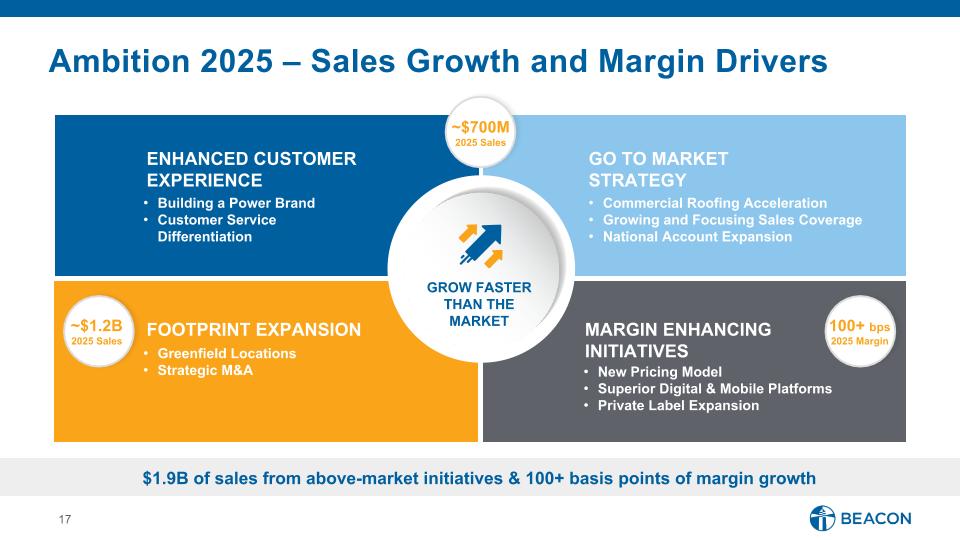
GROW FASTER THAN THE MARKET 100+ bps 2025 Margin MARGIN ENHANCING INITIATIVES New Pricing Model Superior Digital & Mobile Platforms Private Label Expansion ENHANCED CUSTOMER EXPERIENCE Building a Power Brand Customer Service �Differentiation GO TO MARKET STRATEGY Commercial Roofing Acceleration Growing and Focusing Sales Coverage National Account Expansion FOOTPRINT EXPANSION Greenfield Locations Strategic M&A ~$1.2B 2025 Sales ~$700M 2025 Sales Ambition 2025 – Sales Growth and Margin Drivers $1.9B of sales from above-market initiatives & 100+ basis points of margin growth
MARGIN ENHANCING INITIATIVES ENHANCED CUSTOMER EXPERIENCE GO TO MARKET STRATEGY FOOTPRINT EXPANSION Ambition 2025 – Sales Growth and Margin Drivers GROW FASTER THAN THE MARKET
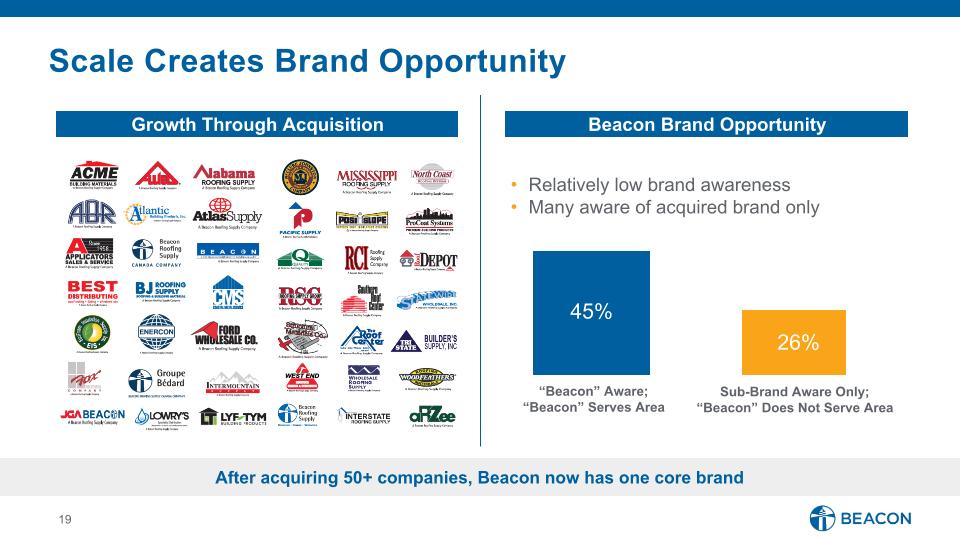
Scale Creates Brand Opportunity Relatively low brand awareness Many aware of acquired brand only “Beacon” Aware; “Beacon” Serves Area Sub-Brand Aware Only; “Beacon” Does Not Serve Area 45% 26% Beacon Brand Opportunity Growth Through Acquisition After acquiring 50+ companies, Beacon now has one core brand
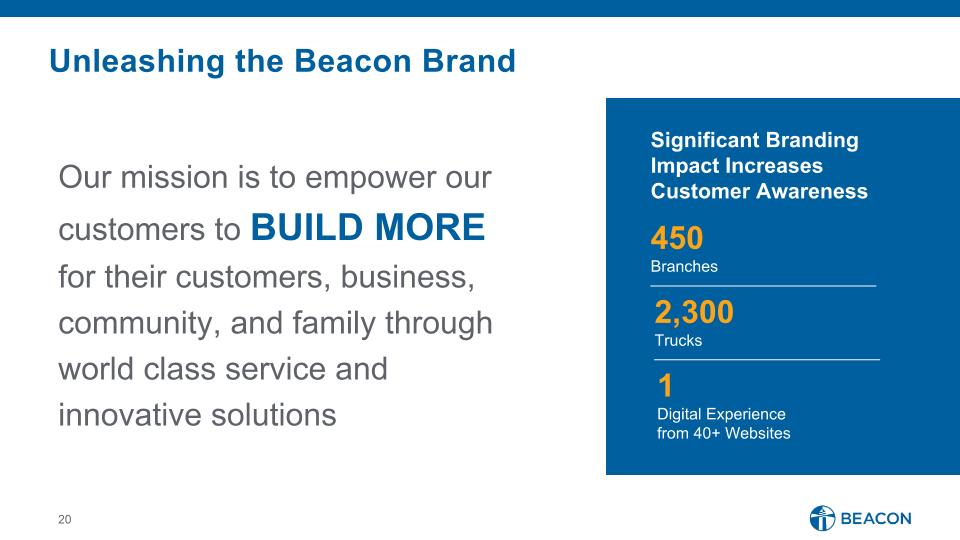
Unleashing the Beacon Brand 450 Branches 2,300 Trucks 1 Digital Experience from 40+ Websites Our mission is to empower our customers to BUILD MORE �for their customers, business, community, and family through world class service and �innovative solutions Significant Branding Impact Increases �Customer Awareness
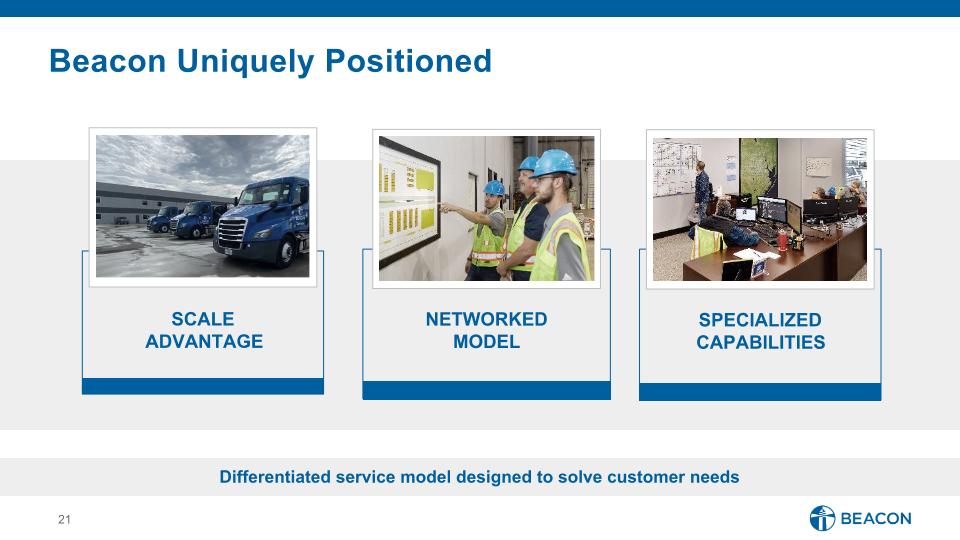
Beacon Uniquely Positioned SCALE ADVANTAGE SPECIALIZED CAPABILITIES NETWORKED MODEL Differentiated service model designed to solve customer needs
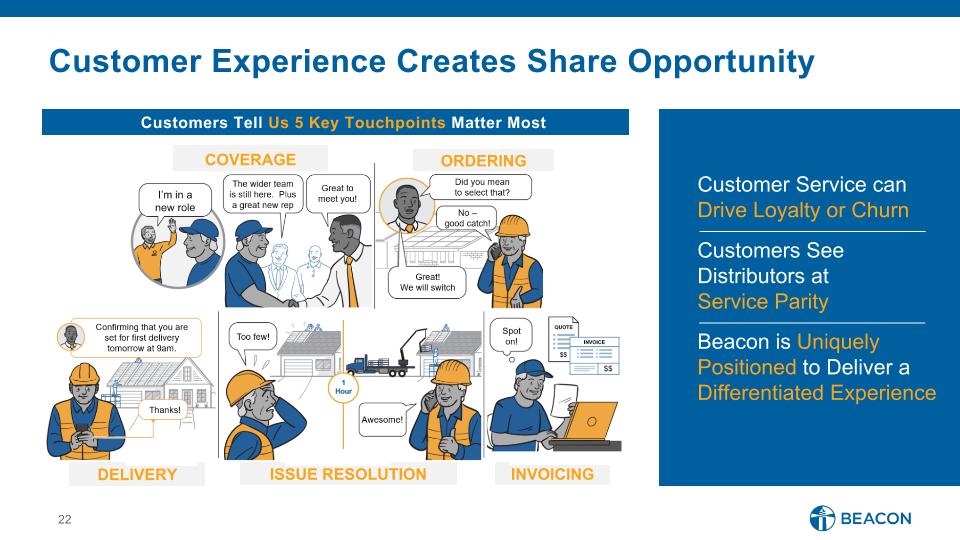
COVERAGE ORDERING DELIVERY ISSUE RESOLUTION INVOICING I’m in a new role Customer Service can Drive Loyalty or Churn Customers See Distributors at Service Parity Beacon is Uniquely Positioned to Deliver a Differentiated Experience Customers Tell Us 5 Key Touchpoints Matter Most Customer Experience Creates Share Opportunity
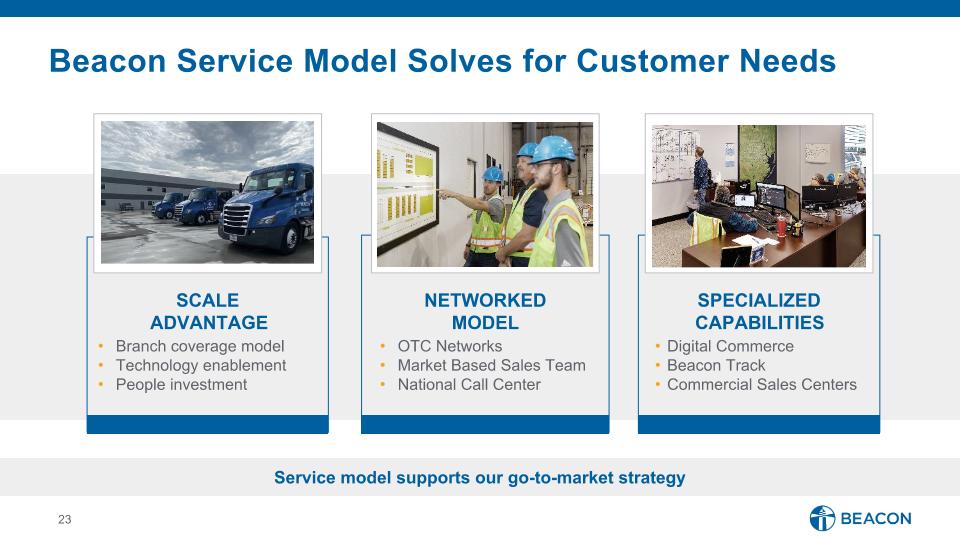
Beacon Service Model Solves for Customer Needs Service model supports our go-to-market strategy Branch coverage model Technology enablement People investment Digital Commerce Beacon Track Commercial Sales Centers OTC Networks Market Based Sales Team National Call Center SCALE ADVANTAGE SPECIALIZED CAPABILITIES NETWORKED MODEL
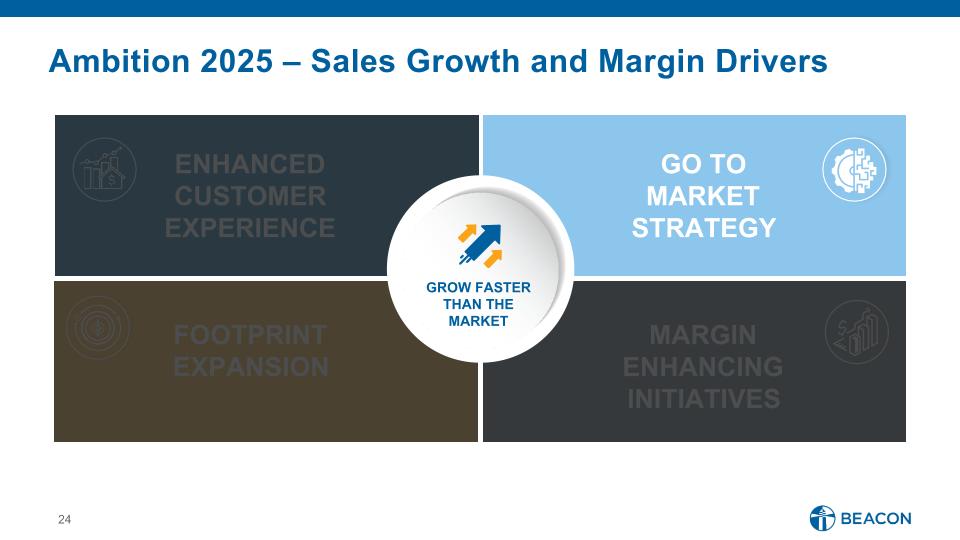
MARGIN ENHANCING INITIATIVES ENHANCED CUSTOMER EXPERIENCE GO TO MARKET STRATEGY FOOTPRINT EXPANSION Ambition 2025 – Sales Growth and Margin Drivers GROW FASTER THAN THE MARKET
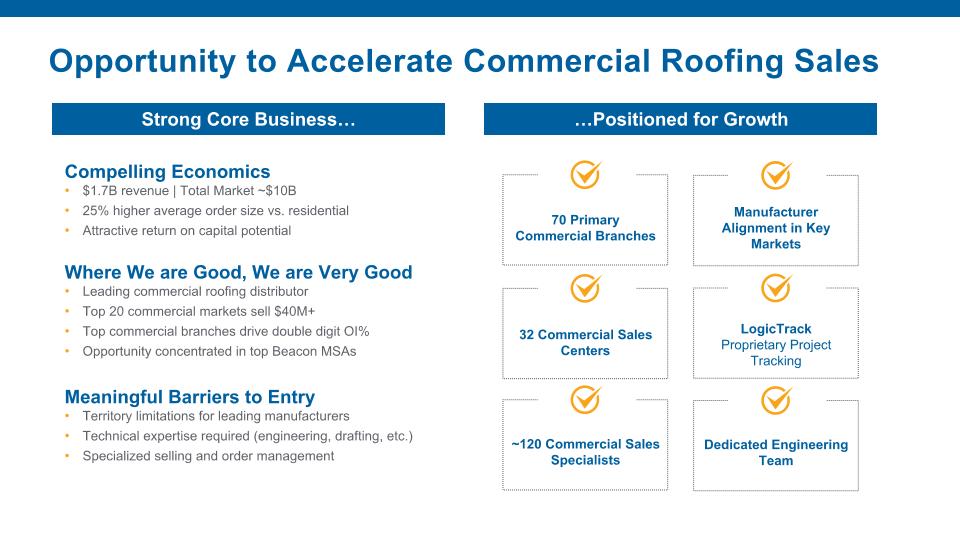
Opportunity to Accelerate Commercial Roofing Sales 70 Primary Commercial Branches LogicTrack Proprietary Project Tracking ~120 Commercial Sales Specialists 32 Commercial Sales Centers Compelling Economics $1.7B revenue | Total Market ~$10B 25% higher average order size vs. residential Attractive return on capital potential Where We are Good, We are Very Good Leading commercial roofing distributor Top 20 commercial markets sell $40M+ Top commercial branches drive double digit OI% Opportunity concentrated in top Beacon MSAs Meaningful Barriers to Entry Territory limitations for leading manufacturers Technical expertise required (engineering, drafting, etc.) Specialized selling and order management Dedicated Engineering Team Manufacturer Alignment in Key Markets Strong Core Business… …Positioned for Growth
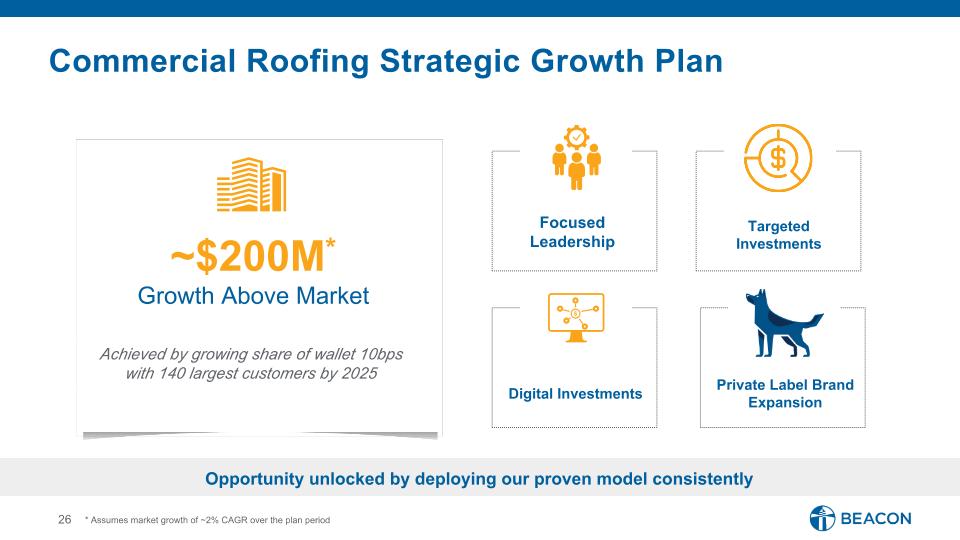
Commercial Roofing Strategic Growth Plan Focused Leadership Digital Investments Targeted Investments Private Label Brand Expansion ~$200M* Growth Above Market Opportunity unlocked by deploying our proven model consistently Achieved by growing share of wallet 10bps with 140 largest customers by 2025 * Assumes market growth of ~2% CAGR over the plan period
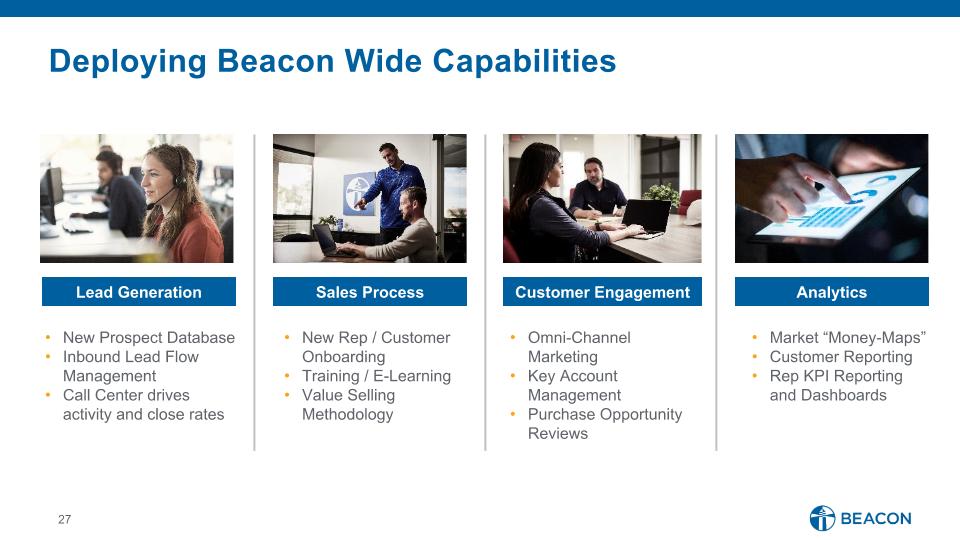
Lead Generation Deploying Beacon Wide Capabilities Market “Money-Maps” Customer Reporting Rep KPI Reporting and Dashboards New Rep / Customer Onboarding Training / E-Learning Value Selling Methodology Omni-Channel Marketing Key Account Management Purchase Opportunity Reviews New Prospect Database Inbound Lead Flow Management Call Center drives activity and close rates Sales Process Customer Engagement Analytics
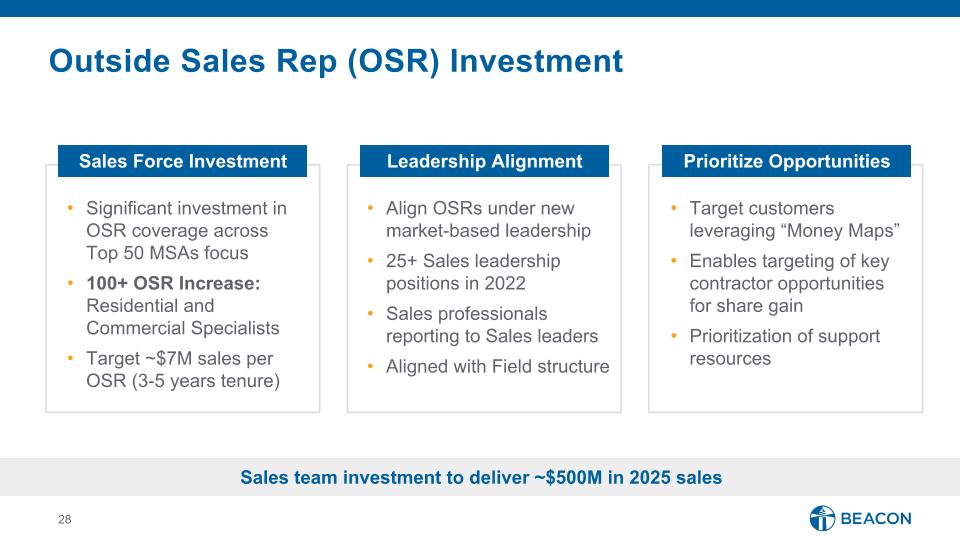
Outside Sales Rep (OSR) Investment Align OSRs under new market-based leadership 25+ Sales leadership positions in 2022 Sales professionals reporting to Sales leaders Aligned with Field structure Significant investment in OSR coverage across Top 50 MSAs focus 100+ OSR Increase: Residential and Commercial Specialists Target ~$7M sales per OSR (3-5 years tenure) Target customers leveraging “Money Maps” Enables targeting of key contractor opportunities for share gain Prioritization of support resources Sales team investment to deliver ~$500M in 2025 sales Prioritize Opportunities Leadership Alignment Sales Force Investment
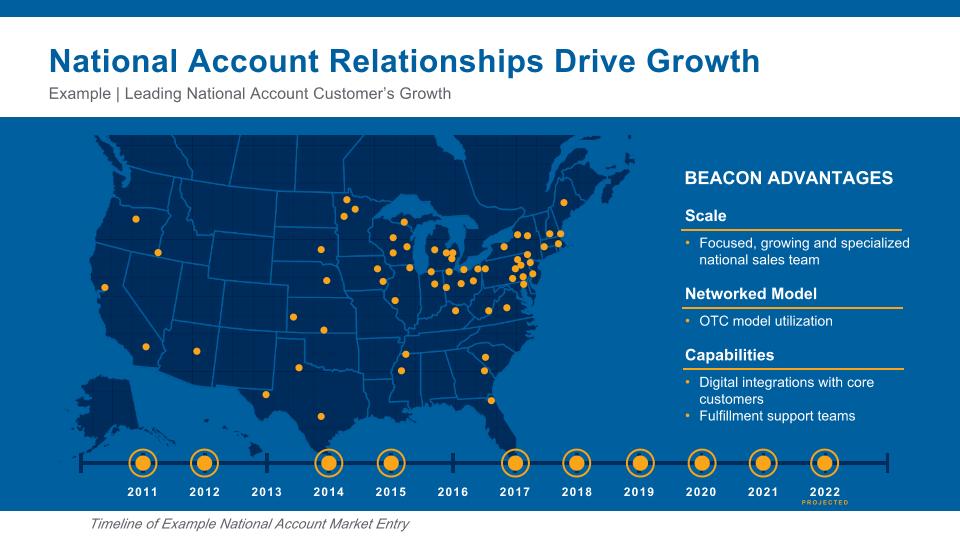
2012 2013 2014 2015 2016 2017 2018 2019 2020 2021 2022�PROJECTED 2011 Timeline of Example National Account Market Entry Example | Leading National Account Customer’s Growth National Account Relationships Drive Growth Scale Focused, growing and specialized national sales team Networked Model OTC model utilization Capabilities Digital integrations with core customers Fulfillment support teams BEACON ADVANTAGES
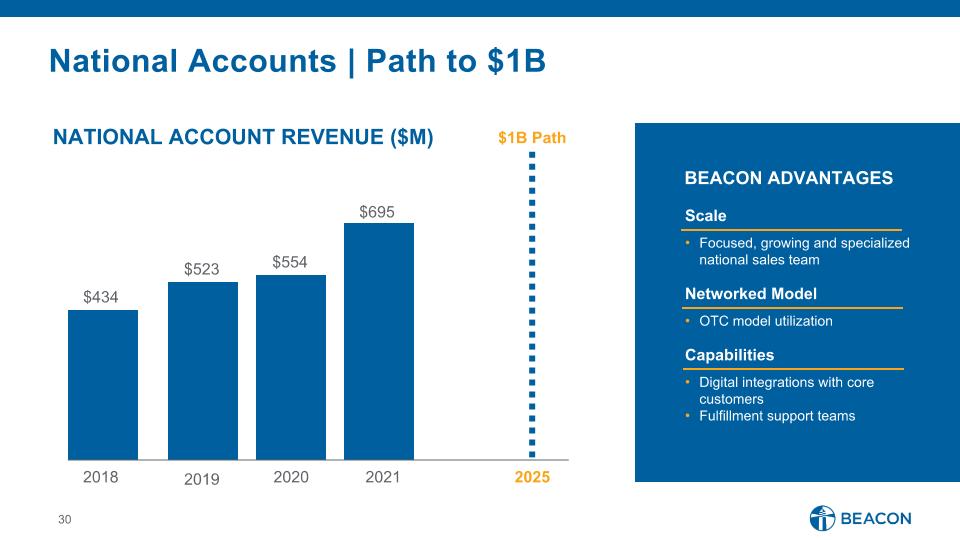
National Accounts | Path to $1B NATIONAL ACCOUNT REVENUE ($M) 2018 2019 2020 2021 $434 $523 $554 $695 $1B Path 2025 Scale Focused, growing and specialized national sales team Networked Model OTC model utilization Capabilities Digital integrations with core customers Fulfillment support teams BEACON ADVANTAGES
MARGIN ENHANCING INITIATIVES ENHANCED CUSTOMER EXPERIENCE GO TO MARKET STRATEGY FOOTPRINT EXPANSION Ambition 2025 – Sales Growth and Margin Drivers GROW FASTER THAN THE MARKET
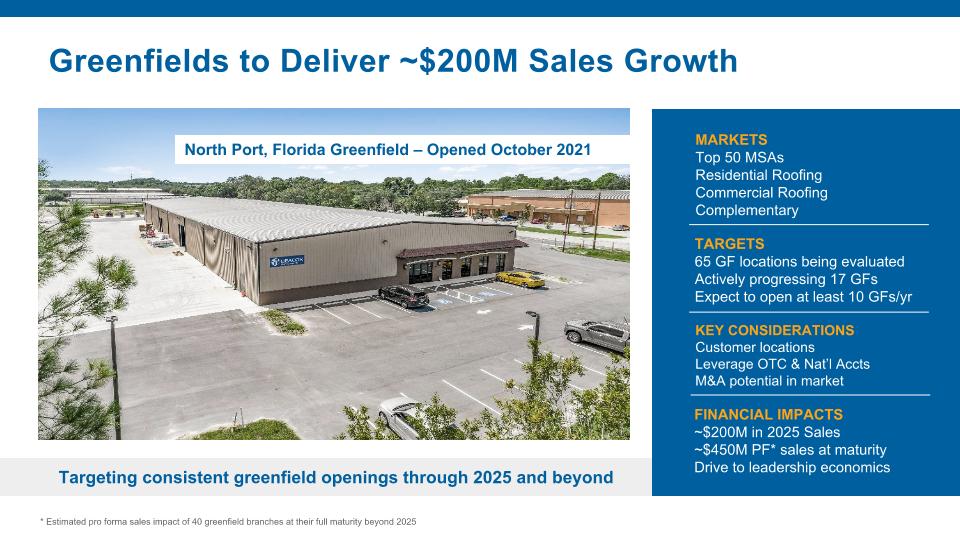
Greenfields to Deliver ~$200M Sales Growth North Port, Florida Greenfield – Opened October 2021 Targeting consistent greenfield openings through 2025 and beyond * Estimated pro forma sales impact of 40 greenfield branches at their full maturity beyond 2025 MARKETS Top 50 MSAs Residential Roofing Commercial Roofing Complementary TARGETS 65 GF locations being evaluated Actively progressing 17 GFs Expect to open at least 10 GFs/yr FINANCIAL IMPACTS ~$200M in 2025 Sales ~$450M PF* sales at maturity Drive to leadership economics KEY CONSIDERATIONS Customer locations Leverage OTC & Nat’l Accts M&A potential in market
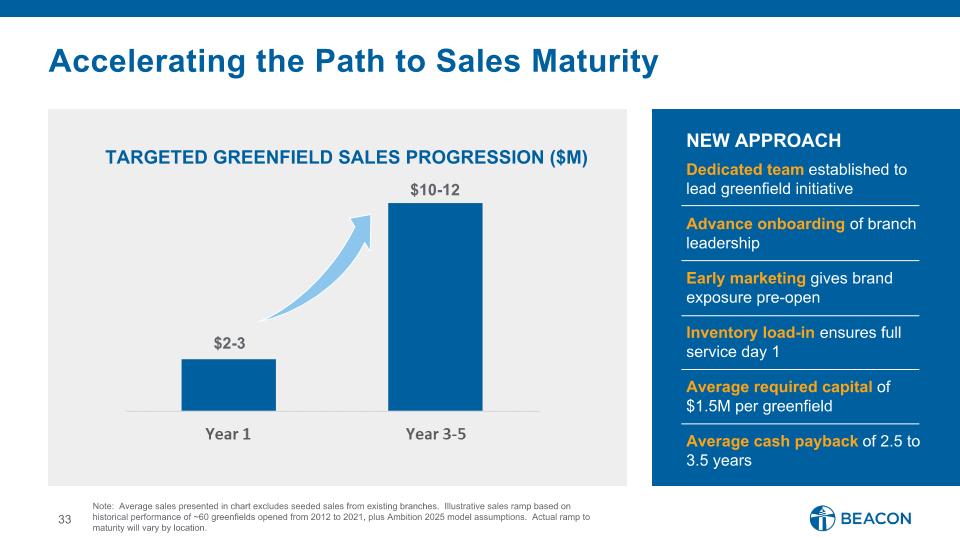
Accelerating the Path to Sales Maturity TARGETED GREENFIELD SALES PROGRESSION ($M) $2-3 $10-12 Note: Average sales presented in chart excludes seeded sales from existing branches. Illustrative sales ramp based on historical performance of ~60 greenfields opened from 2012 to 2021, plus Ambition 2025 model assumptions. Actual ramp to maturity will vary by location. . Dedicated team established to lead greenfield initiative Advance onboarding of branch leadership Early marketing gives brand exposure pre-open Inventory load-in ensures full service day 1 Average required capital of $1.5M per greenfield Average cash payback of 2.5 to 3.5 years NEW APPROACH
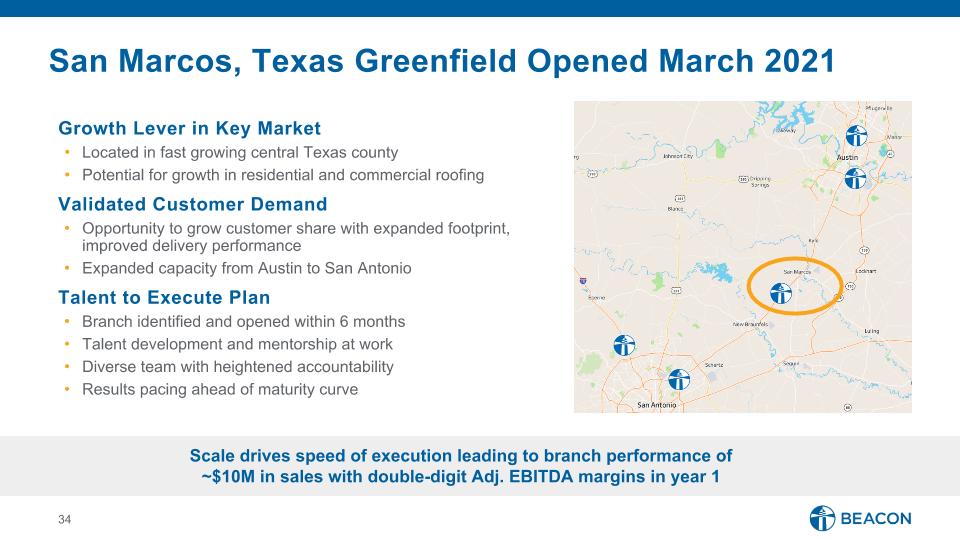
San Marcos, Texas Greenfield Opened March 2021 Growth Lever in Key Market Located in fast growing central Texas county Potential for growth in residential and commercial roofing Validated Customer Demand Opportunity to grow customer share with expanded footprint, improved delivery performance Expanded capacity from Austin to San Antonio Talent to Execute Plan Branch identified and opened within 6 months Talent development and mentorship at work Diverse team with heightened accountability Results pacing ahead of maturity curve Scale drives speed of execution leading to branch performance of ~$10M in sales with double-digit Adj. EBITDA margins in year 1
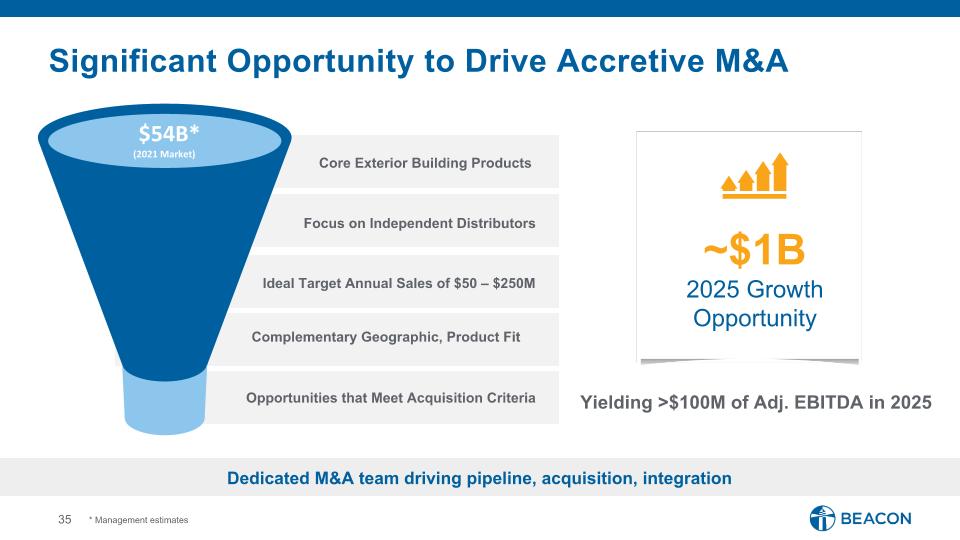
Significant Opportunity to Drive Accretive M&A ~$1B 2025 Growth Opportunity Yielding >$100M of Adj. EBITDA in 2025 $54B* (2021 Market) Core Exterior Building Products Focus on Independent Distributors Ideal Target Annual Sales of $50 – $250M Complementary Geographic, Product Fit Opportunities that Meet Acquisition Criteria * Management estimates Dedicated M&A team driving pipeline, acquisition, integration
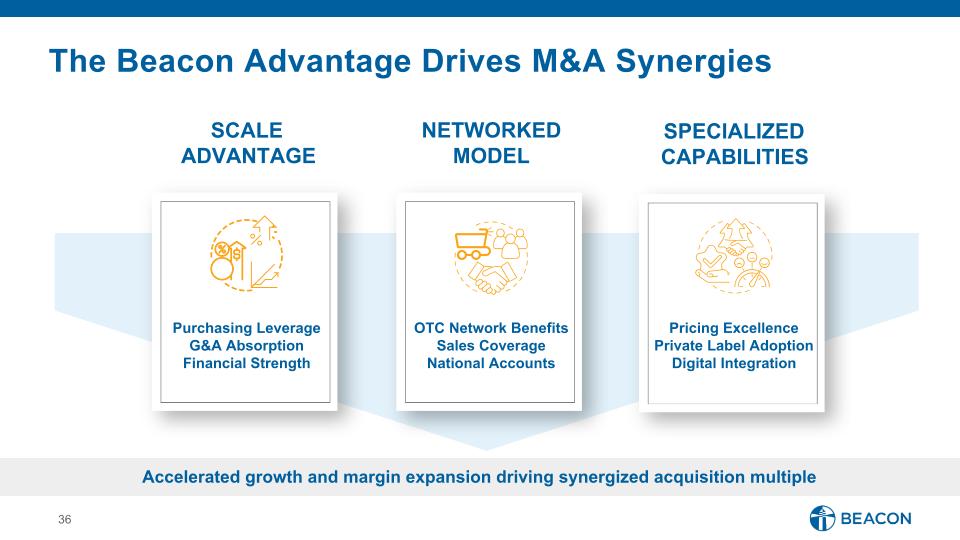
The Beacon Advantage Drives M&A Synergies Accelerated growth and margin expansion driving synergized acquisition multiple SPECIALIZED CAPABILITIES SCALE ADVANTAGE NETWORKED MODEL Purchasing Leverage G&A Absorption Financial Strength OTC Network Benefits Sales Coverage National Accounts Pricing Excellence Private Label Adoption Digital Integration
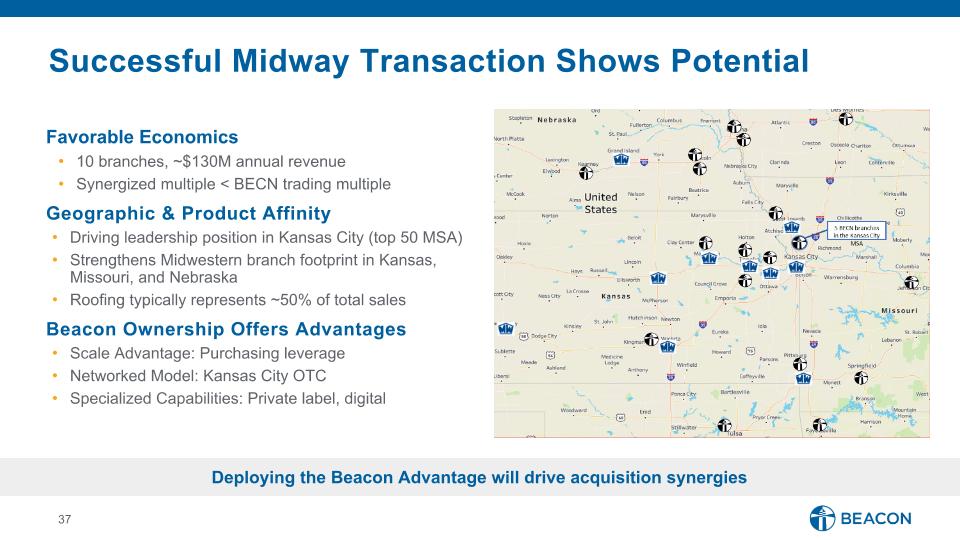
Successful Midway Transaction Shows Potential Favorable Economics 10 branches, ~$130M annual revenue Synergized multiple < BECN trading multiple Geographic & Product Affinity Driving leadership position in Kansas City (top 50 MSA) Strengthens Midwestern branch footprint in Kansas, Missouri, and Nebraska Roofing typically represents ~50% of total sales Beacon Ownership Offers Advantages Scale Advantage: Purchasing leverage Networked Model: Kansas City OTC Specialized Capabilities: Private label, digital Deploying the Beacon Advantage will drive acquisition synergies
MARGIN ENHANCING INITIATIVES ENHANCED CUSTOMER EXPERIENCE GO TO MARKET STRATEGY FOOTPRINT EXPANSION Ambition 2025 – Sales Growth and Margin Drivers GROW FASTER THAN THE MARKET
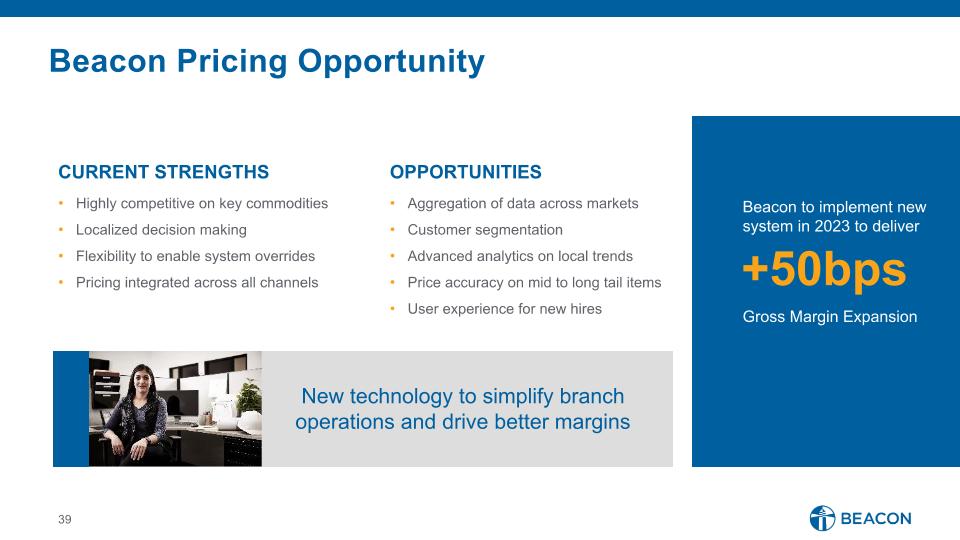
Beacon Pricing Opportunity OPPORTUNITIES Aggregation of data across markets Customer segmentation Advanced analytics on local trends Price accuracy on mid to long tail items User experience for new hires Beacon to implement new system in 2023 to deliver +50bps Gross Margin Expansion CURRENT STRENGTHS Highly competitive on key commodities Localized decision making Flexibility to enable system overrides Pricing integrated across all channels New technology to simplify branch operations and drive better margins
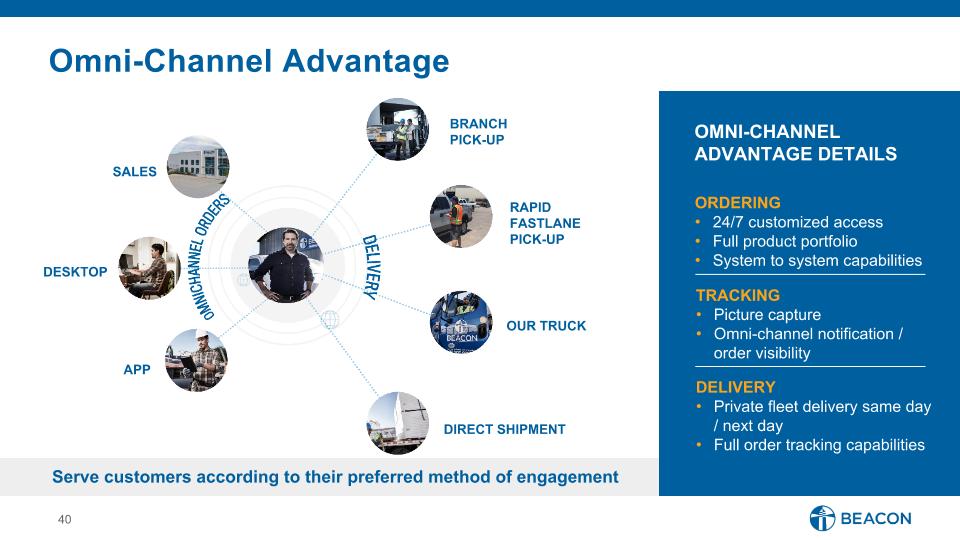
Omni-Channel Advantage ORDERING 24/7 customized access Full product portfolio System to system capabilities TRACKING Picture capture Omni-channel notification / order visibility DELIVERY Private fleet delivery same day / next day Full order tracking capabilities Serve customers according to their preferred method of engagement OMNI-CHANNEL ADVANTAGE DETAILS BRANCH PICK-UP DESKTOP APP SALES OUR TRUCK DIRECT SHIPMENT RAPID FASTLANE PICK-UP
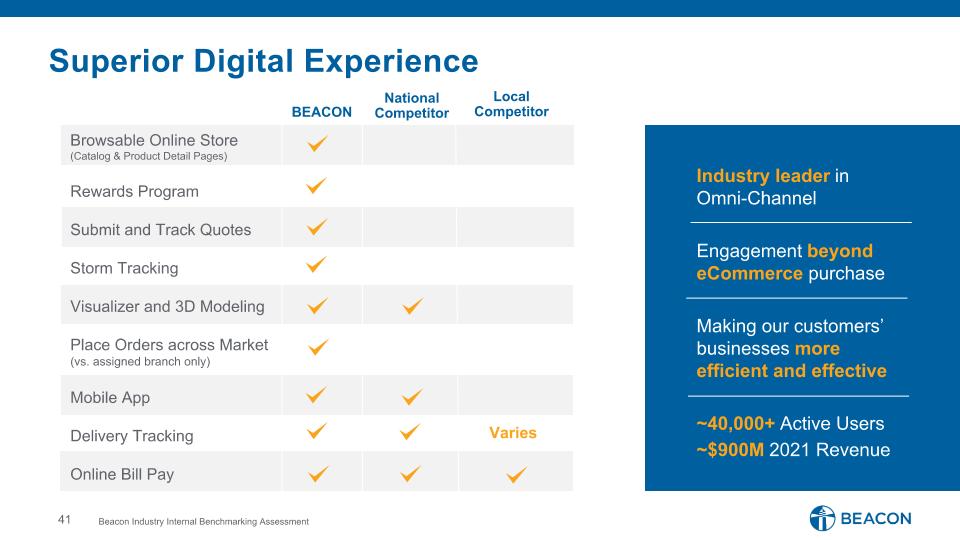
Superior Digital Experience Industry leader in �Omni-Channel Engagement beyond eCommerce purchase Making our customers’ businesses more efficient and effective ~40,000+ Active Users ~$900M 2021 Revenue Browsable Online Store (Catalog & Product Detail Pages) Rewards Program Submit and Track Quotes Storm Tracking Visualizer and 3D Modeling Place Orders across Market (vs. assigned branch only) Mobile App Delivery Tracking Online Bill Pay BEACON National Competitor Local Competitor Beacon Industry Internal Benchmarking Assessment Varies
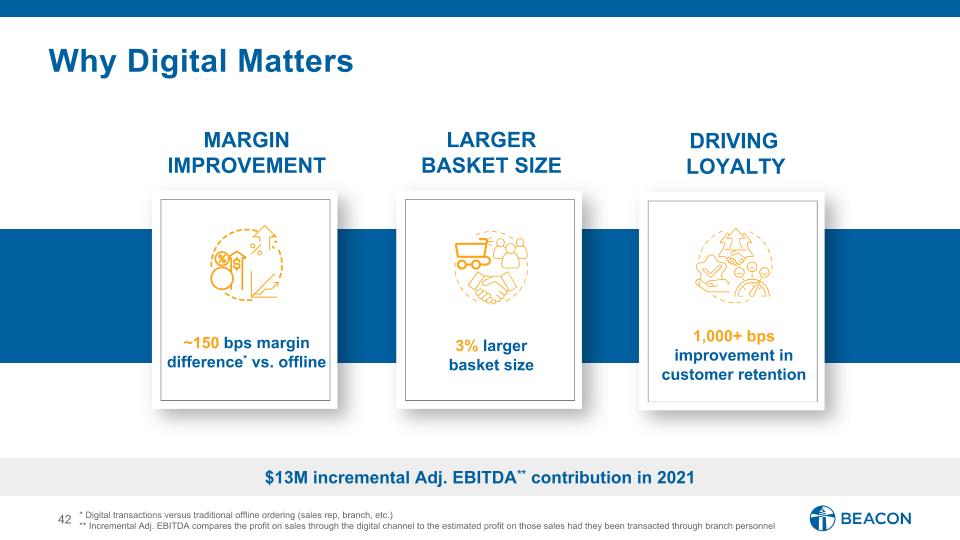
Why Digital Matters DRIVING LOYALTY MARGIN IMPROVEMENT LARGER BASKET SIZE 1,000+ bps improvement in customer retention ~150 bps margin difference* vs. offline 3% larger basket size $13M incremental Adj. EBITDA** contribution in 2021 * Digital transactions versus traditional offline ordering (sales rep, branch, etc.) ** Incremental Adj. EBITDA compares the profit on sales through the digital channel to the estimated profit on those sales had they been transacted through branch personnel
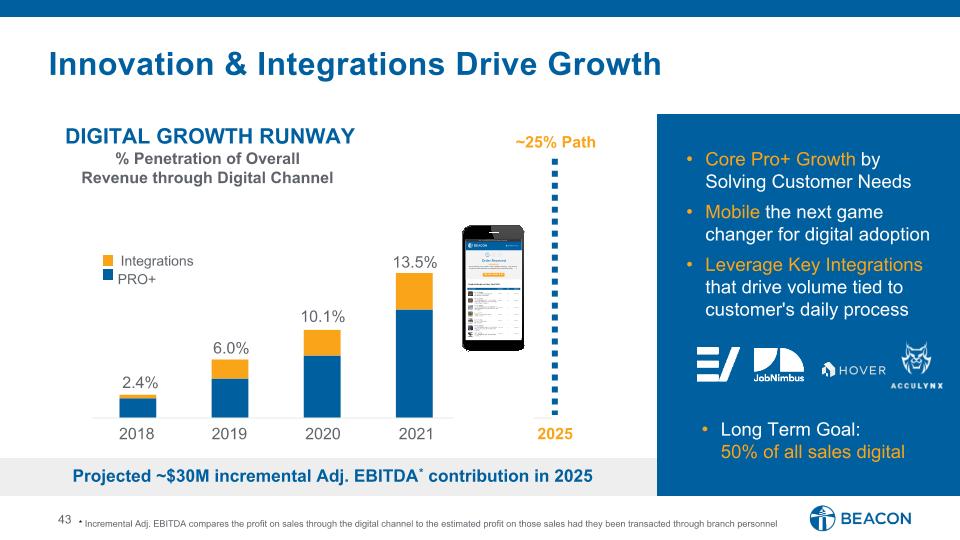
Innovation & Integrations Drive Growth Core Pro+ Growth by Solving Customer Needs Mobile the next game changer for digital adoption Leverage Key Integrations that drive volume tied to customer's daily process Long Term Goal: 50% of all sales digital Projected ~$30M incremental Adj. EBITDA* contribution in 2025 DIGITAL GROWTH RUNWAY % Penetration of Overall Revenue through Digital Channel 2025 ~25% Path Integrations PRO+ 2018 2019 2020 2021 10.1% 13.5% 2.4% 6.0% * Incremental Adj. EBITDA compares the profit on sales through the digital channel to the estimated profit on those sales had they been transacted through branch personnel
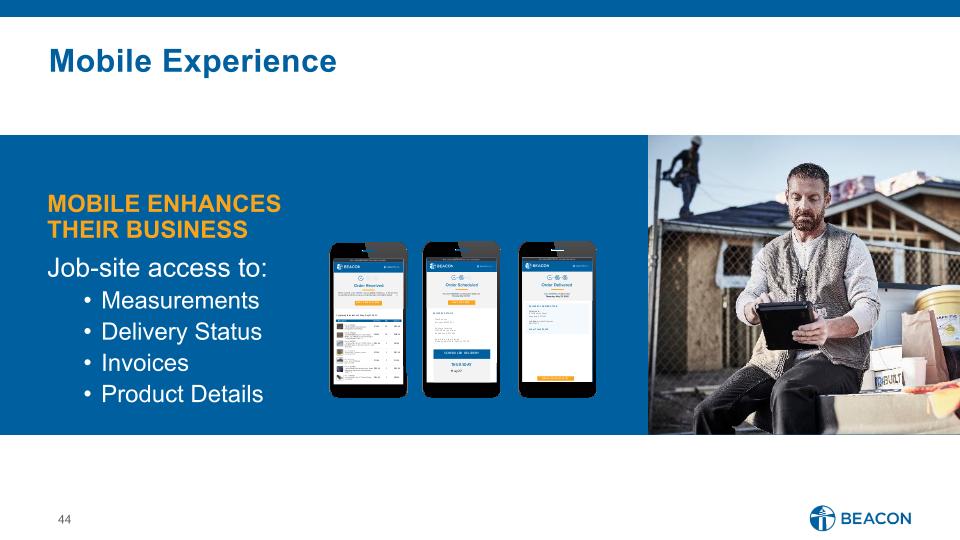
Mobile Experience MOBILE ENHANCES THEIR BUSINESS Job-site access to: Measurements Delivery Status Invoices Product Details
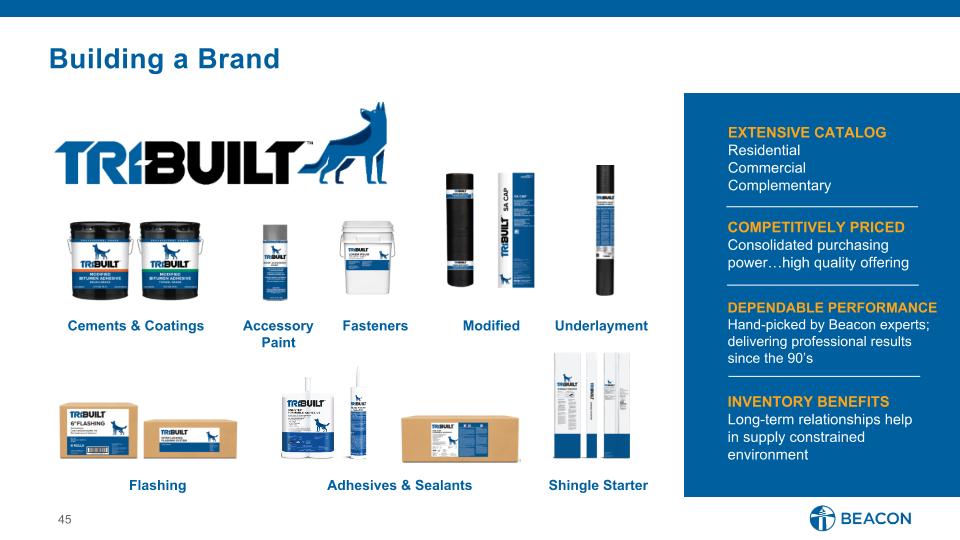
Building a Brand EXTENSIVE CATALOG Residential Commercial Complementary INVENTORY BENEFITS Long-term relationships help in supply constrained environment DEPENDABLE PERFORMANCE Hand-picked by Beacon experts; delivering professional results since the 90’s COMPETITIVELY PRICED Consolidated purchasing power…high quality offering Cements & Coatings Modified Accessory �Paint Fasteners Adhesives & Sealants Flashing Shingle Starter Underlayment
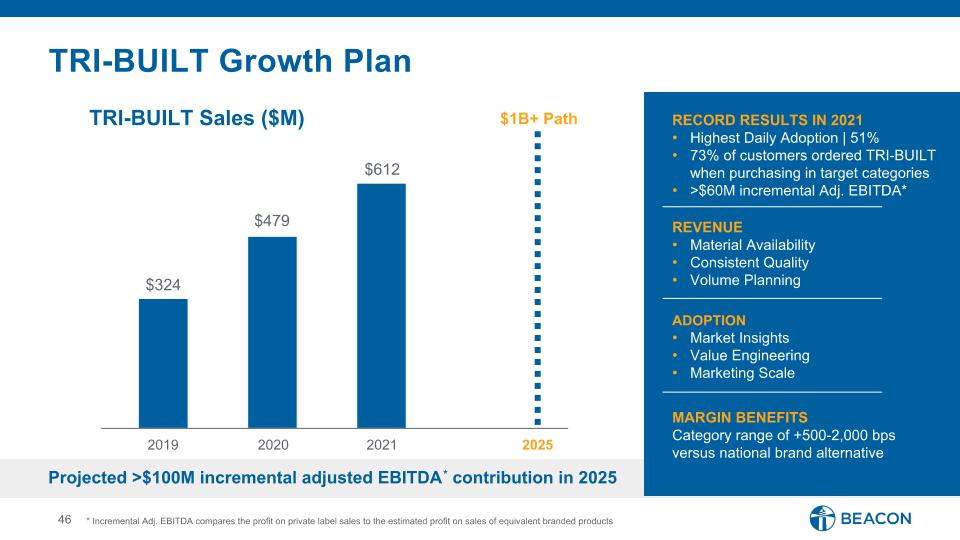
Projected >$100M incremental adjusted EBITDA* contribution in 2025 $324 $479 $612 $1B+ Path TRI-BUILT Sales ($M) 2019 2020 2021 2025 * Incremental Adj. EBITDA compares the profit on private label sales to the estimated profit on sales of equivalent branded products TRI-BUILT Growth Plan RECORD RESULTS IN 2021 Highest Daily Adoption | 51% 73% of customers ordered TRI-BUILT when purchasing in target categories >$60M incremental Adj. EBITDA* MARGIN BENEFITS Category range of +500-2,000 bps versus national brand alternative ADOPTION Market Insights Value Engineering Marketing Scale REVENUE Material Availability Consistent Quality Volume Planning
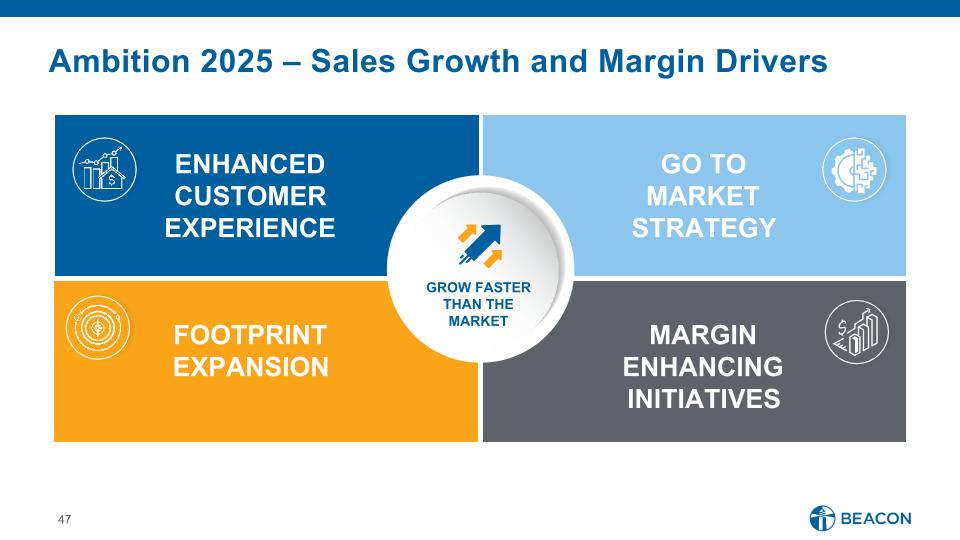
MARGIN ENHANCING INITIATIVES ENHANCED CUSTOMER EXPERIENCE GO TO MARKET STRATEGY FOOTPRINT EXPANSION Ambition 2025 – Sales Growth and Margin Drivers GROW FASTER THAN THE MARKET
Munroe Best, President, South Division Productivity & Capacity Via �Operational Excellence
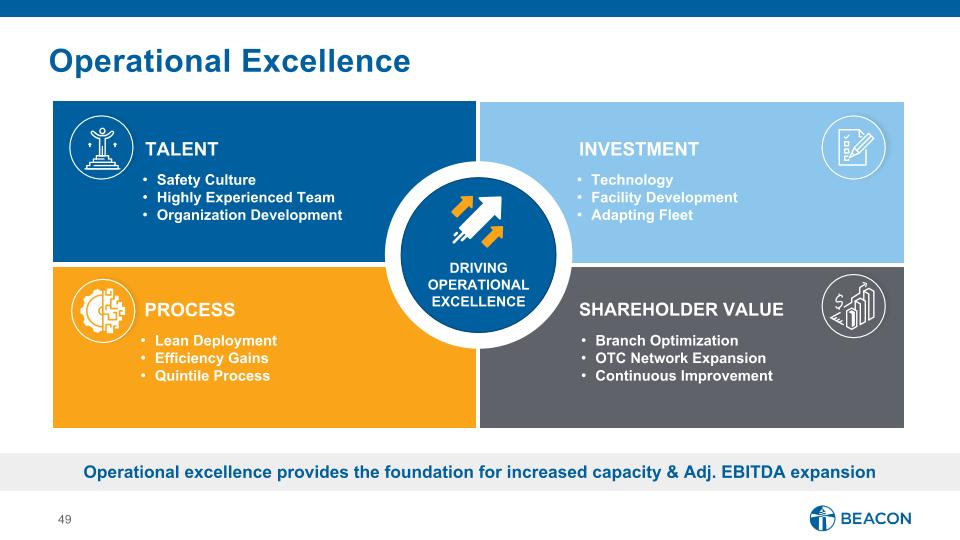
INVESTMENT TALENT Safety Culture Highly Experienced Team Organization Development Process Shareholder Value Operational excellence provides the foundation for increased capacity & Adj. EBITDA expansion DRIVING OPERATIONAL EXCELLENCE Lean Deployment Efficiency Gains Quintile Process Technology Facility Development Adapting Fleet Branch Optimization OTC Network Expansion Continuous Improvement Operational Excellence
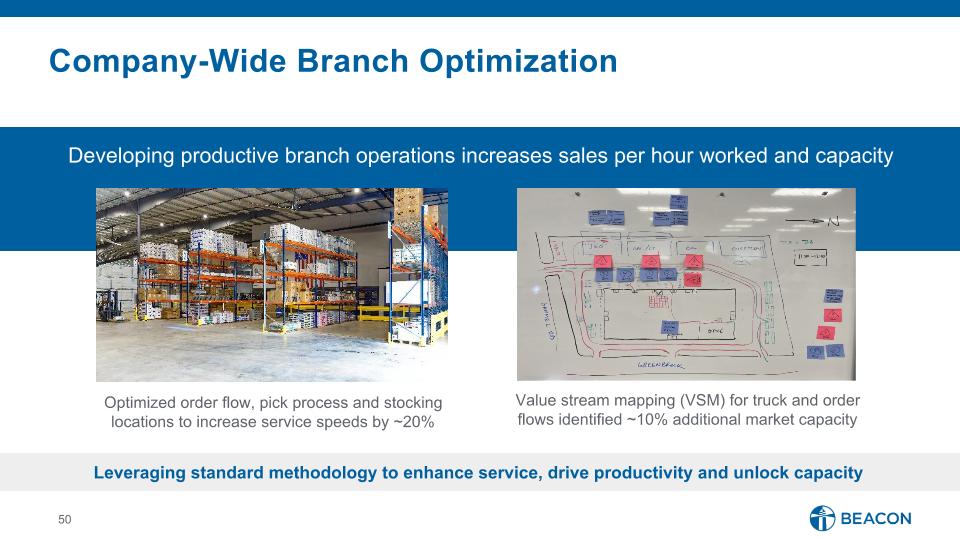
Company-Wide Branch Optimization Value stream mapping (VSM) for truck and order flows identified ~10% additional market capacity Optimized order flow, pick process and stocking locations to increase service speeds by ~20% Leveraging standard methodology to enhance service, drive productivity and unlock capacity Developing productive branch operations increases sales per hour worked and capacity
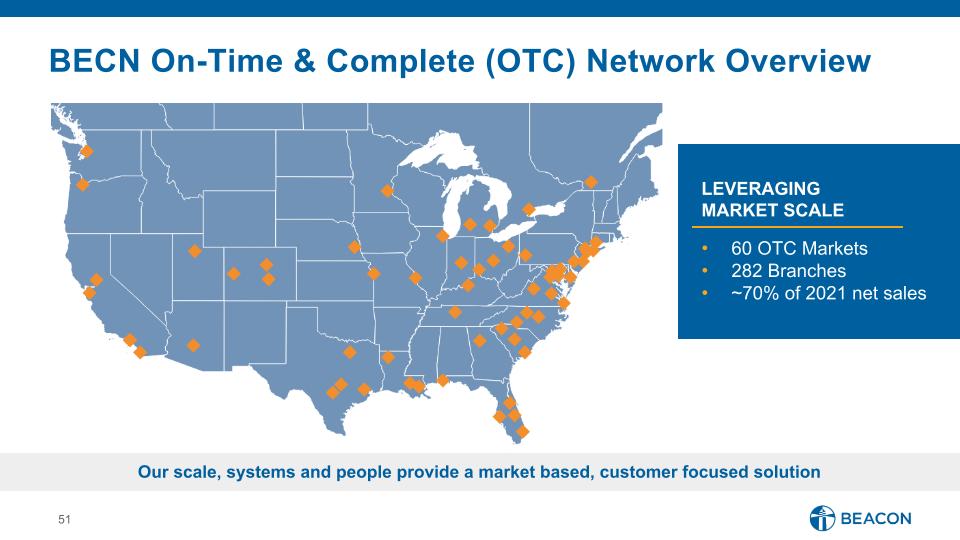
Our scale, systems and people provide a market based, customer focused solution LEVERAGING �MARKET SCALE 60 OTC Markets 282 Branches ~70% of 2021 net sales BECN On-Time & Complete (OTC) Network Overview
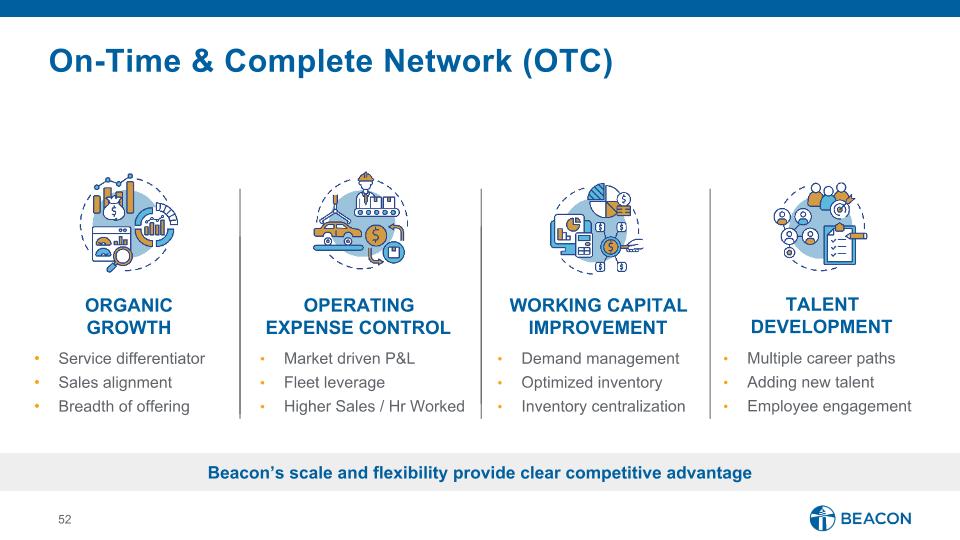
Service differentiator Sales alignment Breadth of offering Market driven P&L Fleet leverage Higher Sales / Hr Worked Demand management Optimized inventory Inventory centralization Multiple career paths Adding new talent Employee engagement ORGANIC GROWTH OPERATING EXPENSE CONTROL WORKING CAPITAL IMPROVEMENT TALENT DEVELOPMENT On-Time & Complete Network (OTC) Beacon’s scale and flexibility provide clear competitive advantage
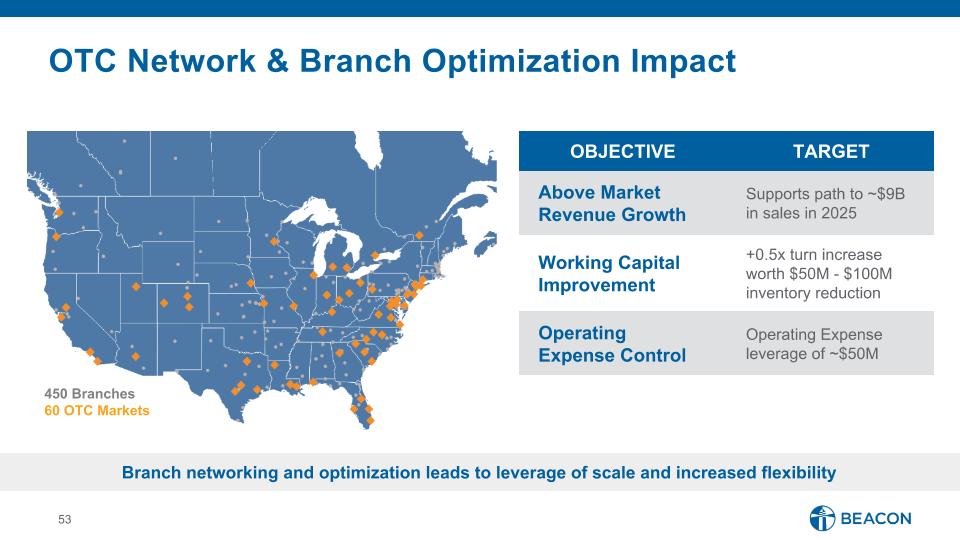
OTC Network & Branch Optimization Impact Branch networking and optimization leads to leverage of scale and increased flexibility OBJECTIVE TARGET Above Market Revenue Growth Supports path to ~$9B in sales in 2025 Working Capital Improvement +0.5x turn increase worth $50M - $100M inventory reduction Operating Expense Control Operating Expense leverage of ~$50M 450 Branches 60 OTC Markets
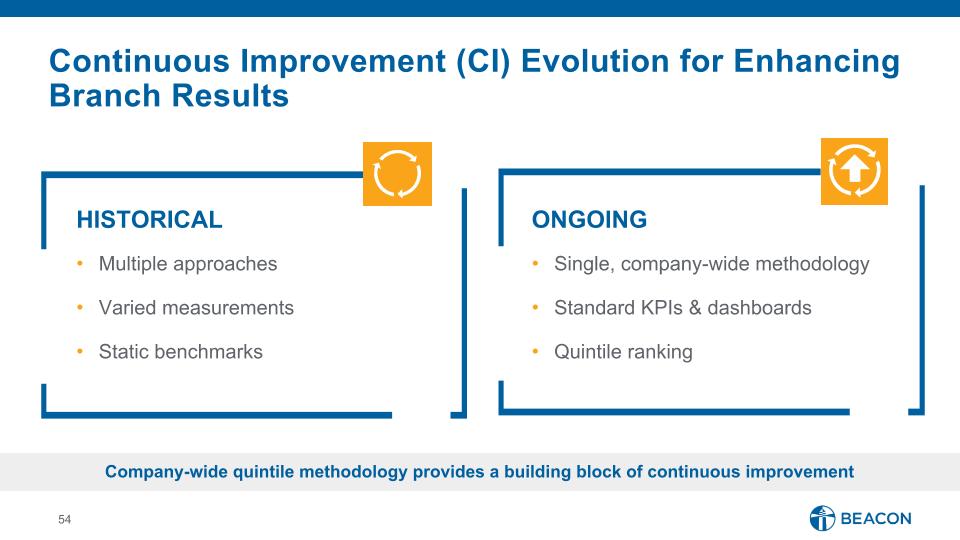
Continuous Improvement (CI) Evolution for Enhancing Branch Results HISTORICAL Multiple approaches Varied measurements Static benchmarks ONGOING Single, company-wide methodology Standard KPIs & dashboards Quintile ranking Company-wide quintile methodology provides a building block of continuous improvement
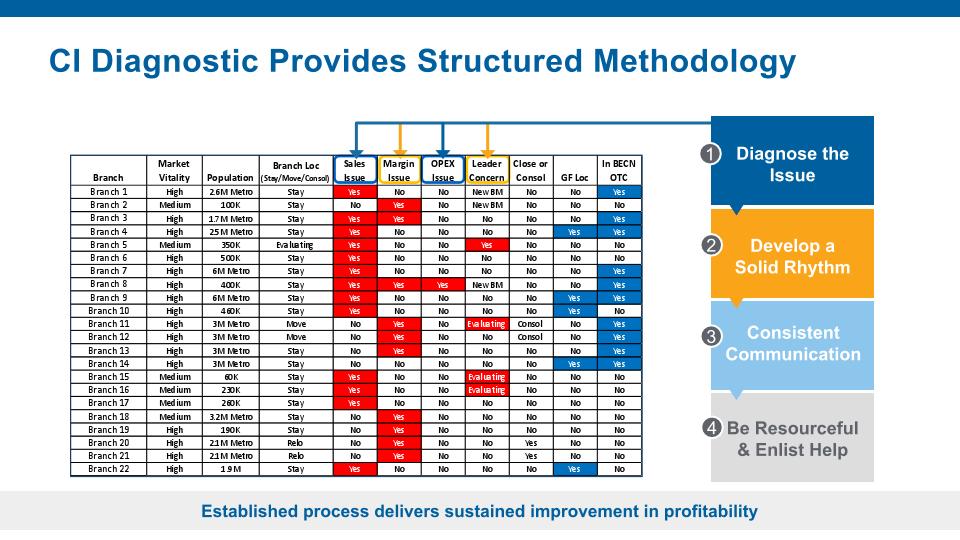
2 3 4 Consistent Communication Develop a Solid Rhythm Be Resourceful & Enlist Help Established process delivers sustained improvement in profitability Diagnose the Issue 1 CI Diagnostic Provides Structured Methodology
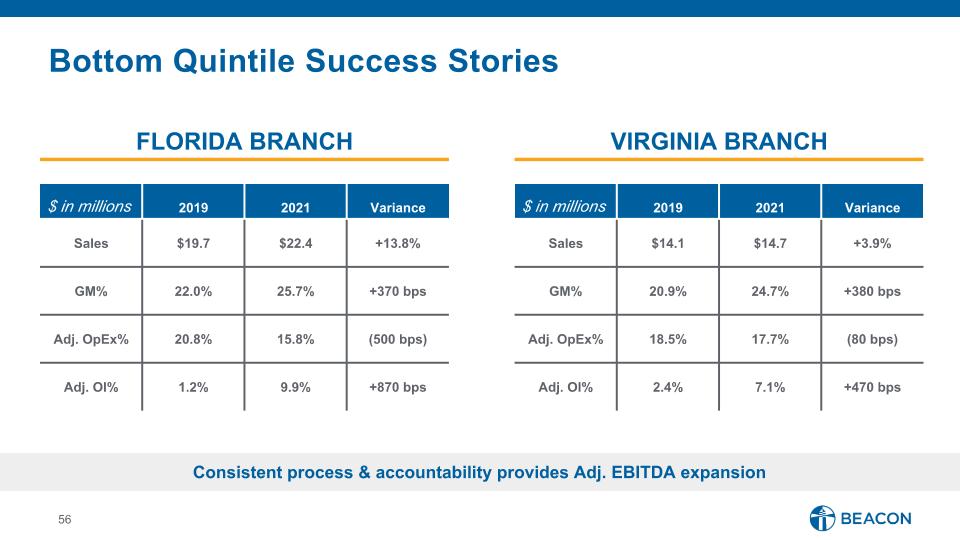
Bottom Quintile Success Stories FLORIDA BRANCH $ in millions 2019 2021 Variance Sales $19.7 $22.4 +13.8% GM% 22.0% 25.7% +370 bps Adj. OpEx% 20.8% 15.8% (500 bps) Adj. OI% 1.2% 9.9% +870 bps $ in millions 2019 2021 Variance Sales $14.1 $14.7 +3.9% GM% 20.9% 24.7% +380 bps Adj. OpEx% 18.5% 17.7% (80 bps) Adj. OI% 2.4% 7.1% +470 bps VIRGINIA BRANCH Consistent process & accountability provides Adj. EBITDA expansion

Sales increase of ~8% Gross Margin expansion ~180bps Adj. OpEx reduction ~200bps ~$75M ~$75M Process expected to result in additional ~$75M improvement through 2025 2020 – 2021 ACTUAL . . . . ADDITIONAL OPPORTUNITY * 2 Year improvements for Sales Increase, Gross Margin & Adj. OpEx Reduction achieved from Jan’20 – Dec’21 ** Additional ~$75M Adj. EBITDA through 2025 * ** Continuing Value from Quintile Process
Frank Lonegro, Chief Financial Officer Creating Shareholder Value
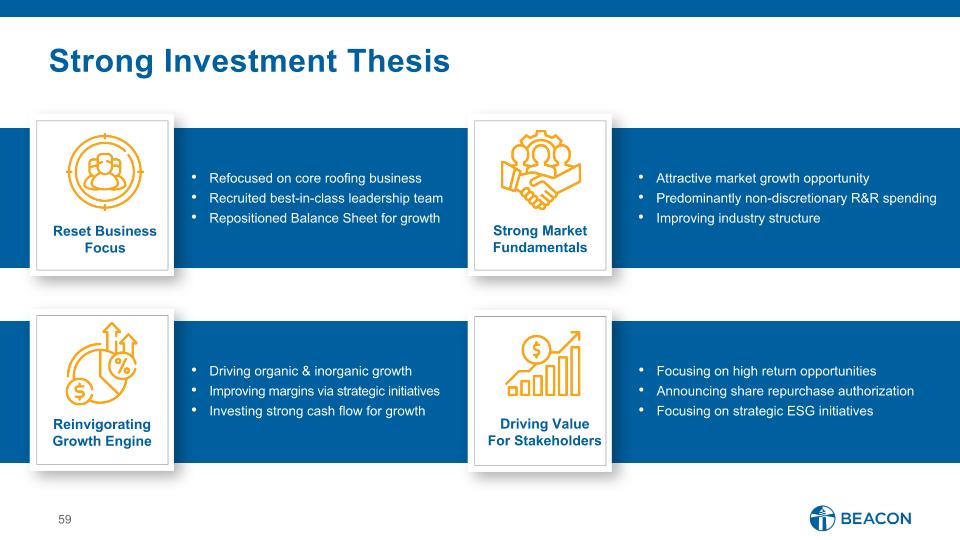
Strong Investment Thesis Refocused on core roofing business Recruited best-in-class leadership team Repositioned Balance Sheet for growth Attractive market growth opportunity Predominantly non-discretionary R&R spending Improving industry structure Driving organic & inorganic growth Improving margins via strategic initiatives Investing strong cash flow for growth Focusing on high return opportunities Announcing share repurchase authorization Focusing on strategic ESG initiatives Reset Business �Focus Strong Market Fundamentals Reinvigorating �Growth Engine Driving Value �For Stakeholders
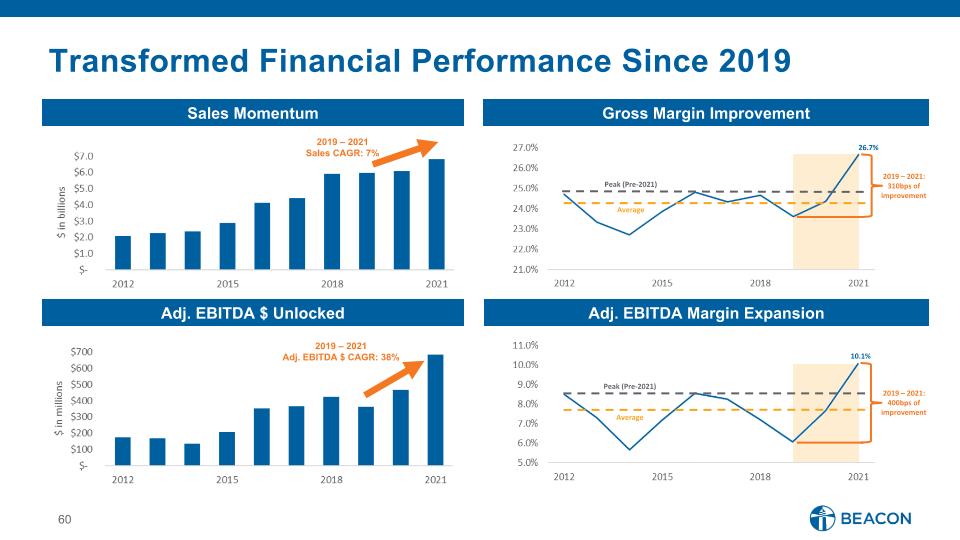
Transformed Financial Performance Since 2019 Sales Momentum Gross Margin Improvement Adj. EBITDA $ Unlocked Adj. EBITDA Margin Expansion Average Peak (Pre-2021) Average Peak (Pre-2021) 2019 – 2021: 310bps of�improvement 2019 – 2021: 400bps of�improvement 26.7% 10.1% 2019 – 2021 Adj. EBITDA $ CAGR: 38% 2019 – 2021 Sales CAGR: 7%
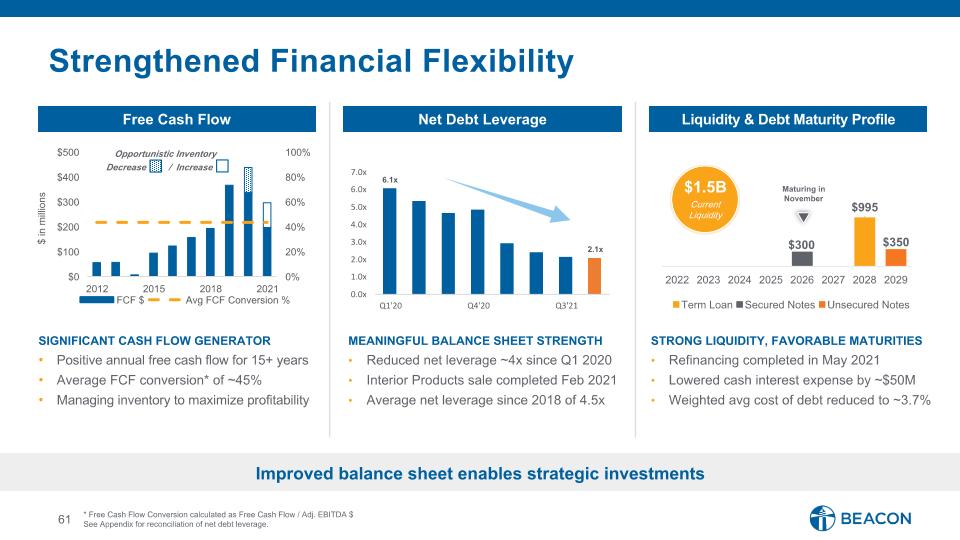
6.1x 2.1x 0.0x 1.0x 2.0x 3.0x 4.0x 5.0x 6.0x 7.0x Q1'20 Q4'20 Q3'21 Net Debt Leverage Free Cash Flow SIGNIFICANT CASH FLOW GENERATOR Positive annual free cash flow for 15+ years Average FCF conversion* of ~45% Managing inventory to maximize profitability Strengthened Financial Flexibility STRONG LIQUIDITY, FAVORABLE MATURITIES Refinancing completed in May 2021 Lowered cash interest expense by ~$50M Weighted avg cost of debt reduced to ~3.7% MEANINGFUL BALANCE SHEET STRENGTH Reduced net leverage ~4x since Q1 2020 Interior Products sale completed Feb 2021 Average net leverage since 2018 of 4.5x * Free Cash Flow Conversion calculated as Free Cash Flow / Adj. EBITDA $ See Appendix for reconciliation of net debt leverage. Opportunistic Inventory Decrease / Increase Maturing in�November $1.5B Current�Liquidity Liquidity & Debt Maturity Profile Improved balance sheet enables strategic investments
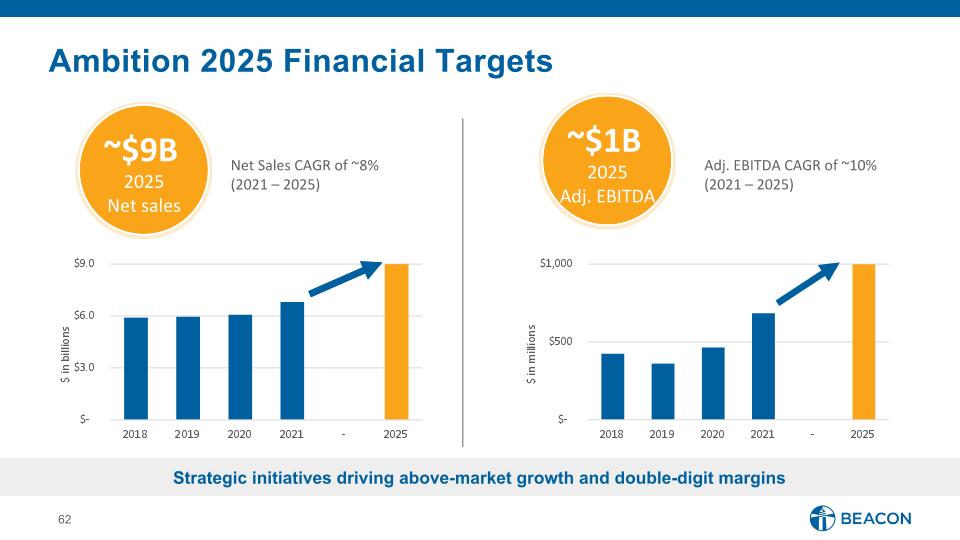
Ambition 2025 Financial Targets Net Sales CAGR of ~8%�(2021 – 2025) ~$9B 2025�Net sales ~$1B 2025�Adj. EBITDA Adj. EBITDA CAGR of ~10% (2021 – 2025) Strategic initiatives driving above-market growth and double-digit margins
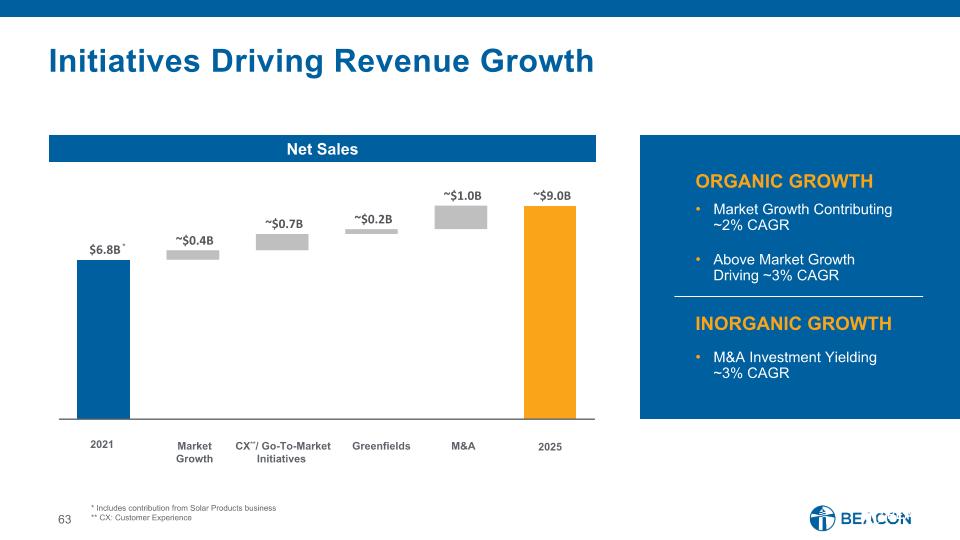
$6.8B ~$0.4B ~$0.7B ~$0.2B ~$1.0B ~$9.0B Initiatives Driving Revenue Growth Market Growth Contributing ~2% CAGR Above Market Growth Driving ~3% CAGR M&A Investment Yielding �~3% CAGR * Includes contribution from Solar Products business ** CX: Customer Experience 2021 Market Growth CX**/ Go-To-Market Initiatives Greenfields M&A 2025 * ORGANIC GROWTH INORGANIC GROWTH Net Sales
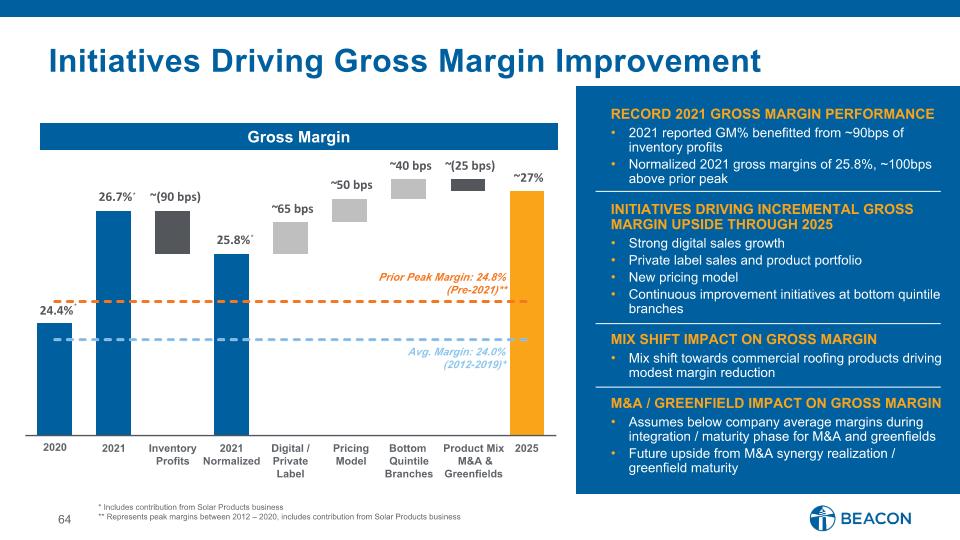
24.4% 26.7% ~(90 bps) 25.8% ~ 65 bps ~ 50 bps ~ 40 bps ~ (25 bps) ~27% Initiatives Driving Gross Margin Improvement RECORD 2021 GROSS MARGIN PERFORMANCE 2021 reported GM% benefitted from ~90bps of inventory profits Normalized 2021 gross margins of 25.8%, ~100bps above prior peak INITIATIVES DRIVING INCREMENTAL GROSS MARGIN UPSIDE THROUGH 2025 Strong digital sales growth Private label sales and product portfolio New pricing model Continuous improvement initiatives at bottom quintile branches MIX SHIFT IMPACT ON GROSS MARGIN Mix shift towards commercial roofing products driving modest margin reduction M&A / GREENFIELD IMPACT ON GROSS MARGIN Assumes below company average margins during integration / maturity phase for M&A and greenfields Future upside from M&A synergy realization / greenfield maturity * Includes contribution from Solar Products business ** Represents peak margins between 2012 – 2020, includes contribution from Solar Products business 2021 2025 Inventory Profits Pricing Model Bottom Quintile Branches Prior Peak Margin: 24.8% (Pre-2021)** Avg. Margin: 24.0% (2012-2019)* 2020 Product Mix� M&A & Greenfields 2021 Normalized Digital / Private Label * * * Gross Margin
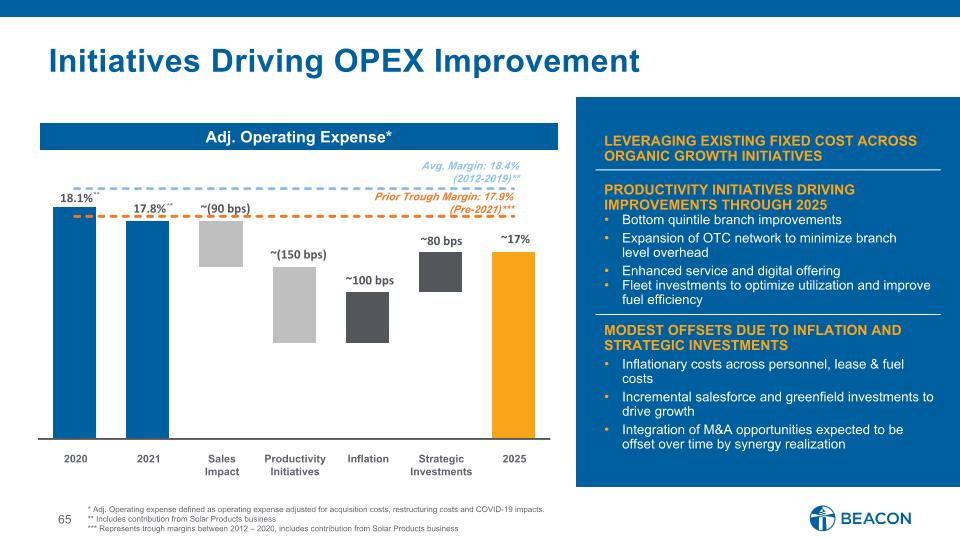
18.1% 17.8% ~(90 bps) ~(150 bps) ~100 bps ~80 bps ~17% Initiatives Driving OPEX Improvement * Adj. Operating expense defined as operating expense adjusted for acquisition costs, restructuring costs and COVID-19 impacts. ** Includes contribution from Solar Products business *** Represents trough margins between 2012 – 2020, includes contribution from Solar Products business 2021 2020 2025 Sales Impact Productivity Initiatives Strategic Investments Prior Trough Margin: 17.9% (Pre-2021)*** Avg. Margin: 18.4% (2012-2019)** Inflation ** ** LEVERAGING EXISTING FIXED COST ACROSS ORGANIC GROWTH INITIATIVES PRODUCTIVITY INITIATIVES DRIVING IMPROVEMENTS THROUGH 2025 Bottom quintile branch improvements Expansion of OTC network to minimize branch level overhead Enhanced service and digital offering Fleet investments to optimize utilization and improve fuel efficiency MODEST OFFSETS DUE TO INFLATION AND STRATEGIC INVESTMENTS Inflationary costs across personnel, lease & fuel costs Incremental salesforce and greenfield investments to drive growth Integration of M&A opportunities expected to be offset over time by synergy realization Adj. Operating Expense*
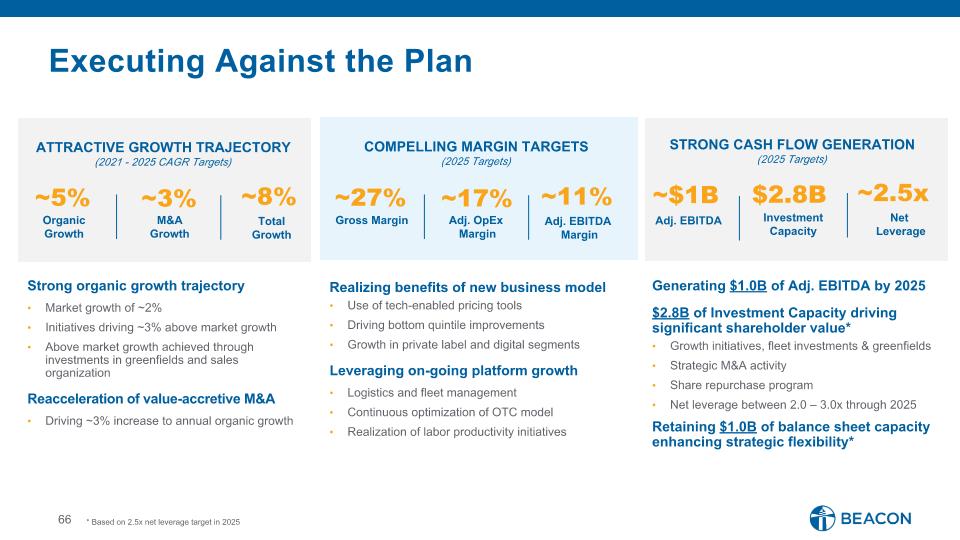
STRONG CASH FLOW GENERATION (2025 Targets) Executing Against the Plan ATTRACTIVE GROWTH TRAJECTORY (2021 - 2025 CAGR Targets) Strong organic growth trajectory Market growth of ~2% Initiatives driving ~3% above market growth Above market growth achieved through investments in greenfields and sales organization Reacceleration of value-accretive M&A Driving ~3% increase to annual organic growth COMPELLING MARGIN TARGETS (2025 Targets) Gross Margin Adj. OpEx Margin Adj. EBITDA Margin Adj. EBITDA Investment Capacity Net �Leverage ~27% ~17% $2.8B ~$1B ~2.5x ~11% * Based on 2.5x net leverage target in 2025 Organic Growth M&A Growth Total Growth ~5% ~3% ~8% Realizing benefits of new business model Use of tech-enabled pricing tools Driving bottom quintile improvements Growth in private label and digital segments Leveraging on-going platform growth Logistics and fleet management Continuous optimization of OTC model Realization of labor productivity initiatives Generating $1.0B of Adj. EBITDA by 2025 $2.8B of Investment Capacity driving significant shareholder value* Growth initiatives, fleet investments & greenfields Strategic M&A activity Share repurchase program Net leverage between 2.0 – 3.0x through 2025 Retaining $1.0B of balance sheet capacity enhancing strategic flexibility*
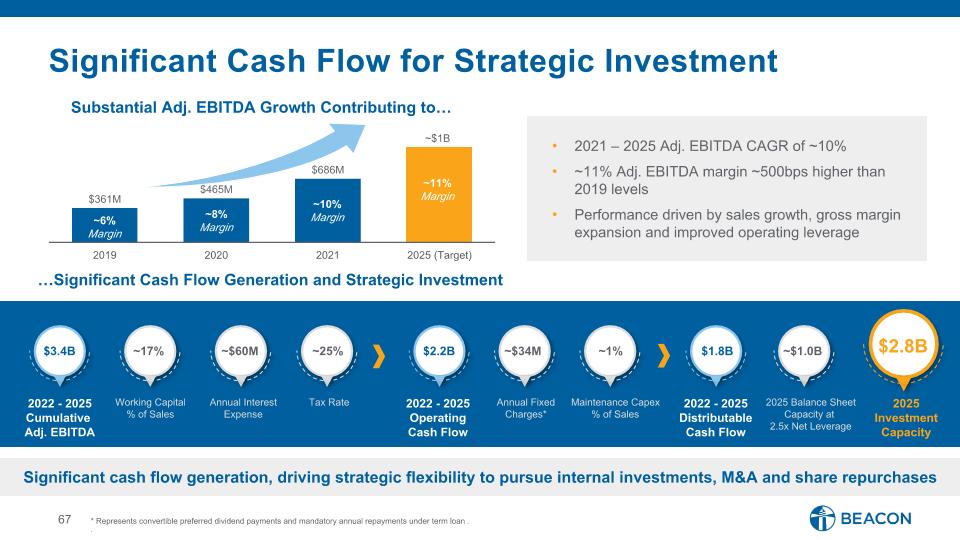
$361M $465M $686M ~$1B 2019 2020 2021 2025 (Target) Significant cash flow generation, driving strategic flexibility to pursue internal investments, M&A and share repurchases Significant Cash Flow for Strategic Investment Substantial Adj. EBITDA Growth Contributing to… 2021 – 2025 Adj. EBITDA CAGR of ~10% ~11% Adj. EBITDA margin ~500bps higher than 2019 levels Performance driven by sales growth, gross margin expansion and improved operating leverage * Represents convertible preferred dividend payments and mandatory annual repayments under term loan. . …Significant Cash Flow Generation and Strategic Investment ~10% Margin ~11% Margin ~8% Margin ~6% Margin 2022 - 2025 Cumulative Adj. EBITDA Working Capital % of Sales Tax Rate Annual Fixed Charges* 2022 - 2025 Operating�Cash Flow Annual Interest Expense 2022 - 2025 Distributable�Cash Flow Maintenance Capex�% of Sales $2.8B 2025 Investment Capacity 2025 Balance Sheet Capacity at 2.5x Net Leverage ~17% ~25% ~$34M $2.2B ~$60M $1.8B ~1% ~$1.0B $3.4B
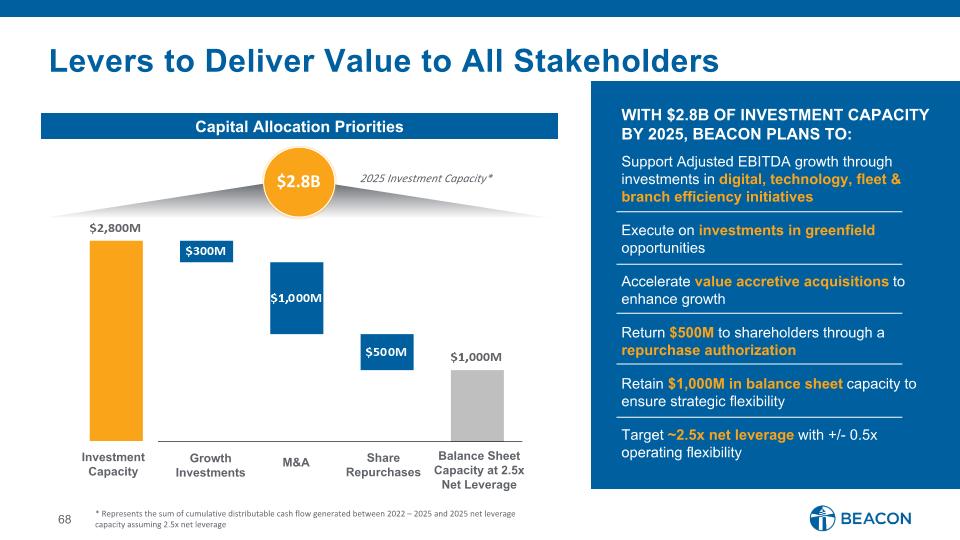
Support Adjusted EBITDA growth through investments in digital, technology, fleet & branch efficiency initiatives Execute on investments in greenfield opportunities Accelerate value accretive acquisitions to enhance growth Return $500M to shareholders through a repurchase authorization Retain $1,000M in balance sheet capacity to ensure strategic flexibility Target ~2.5x net leverage with +/- 0.5x operating flexibility WITH $2.8B OF INVESTMENT CAPACITY BY 2025, BEACON PLANS TO: Levers to Deliver Value to All Stakeholders Target ~2.5x net leverage with +/- 0.5x operating flexibility $2.8B 2025 Investment Capacity* * Represents the sum of cumulative distributable cash flow generated between 2022 – 2025 and 2025 net leverage capacity assuming 2.5x net leverage Investment Capacity Growth�Investments M&A Balance Sheet Capacity at 2.5x�Net Leverage Share�Repurchases Capital Allocation Priorities
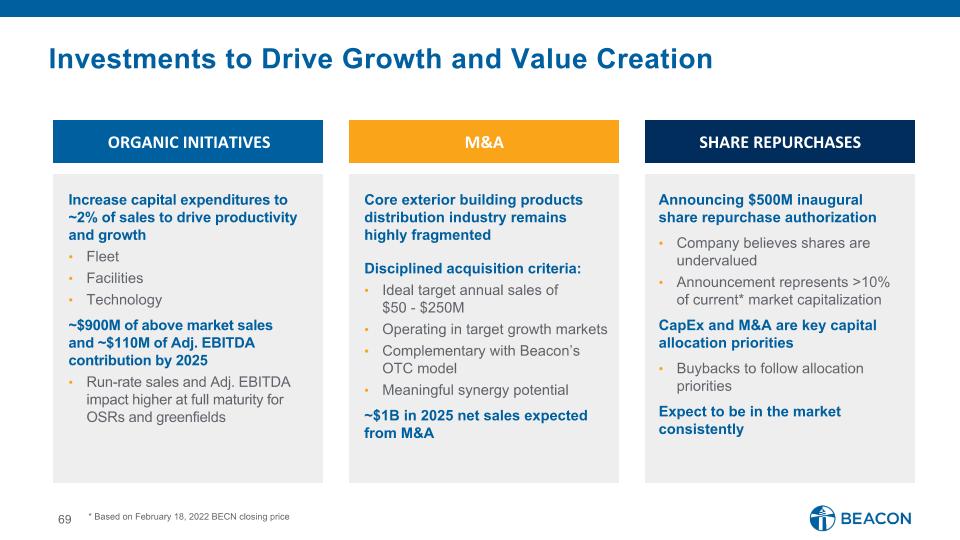
Investments to Drive Growth and Value Creation SHARE REPURCHASES ORGANIC INITIATIVES M&A Announcing $500M inaugural share repurchase authorization Company believes shares are undervalued Announcement represents >10% of current* market capitalization CapEx and M&A are key capital allocation priorities Buybacks to follow allocation priorities Expect to be in the market consistently Increase capital expenditures to �~2% of sales to drive productivity �and growth Fleet Facilities Technology ~$900M of above market sales �and ~$110M of Adj. EBITDA contribution by 2025 Run-rate sales and Adj. EBITDA impact higher at full maturity for OSRs and greenfields Core exterior building products distribution industry remains highly fragmented Disciplined acquisition criteria: Ideal target annual sales of �$50 - $250M Operating in target growth markets Complementary with Beacon’s �OTC model Meaningful synergy potential ~$1B in 2025 net sales expected from M&A * Based on February 18, 2022 BECN closing price
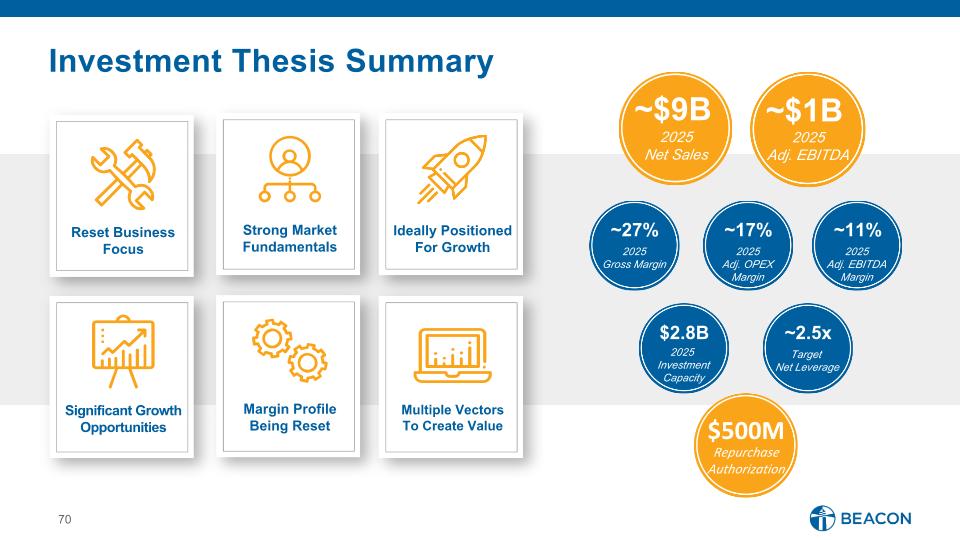
Investment Thesis Summary Reset Business �Focus Strong Market�Fundamentals Ideally Positioned�For Growth Significant Growth Opportunities Margin Profile�Being Reset Multiple Vectors To Create Value ~27% 2025 Gross Margin ~$1B 2025 Adj. EBITDA ~$9B 2025 Net Sales ~17% 2025 Adj. OPEX�Margin ~11% 2025 Adj. EBITDA�Margin $2.8B 2025 Investment�Capacity ~2.5x Target Net Leverage $500M Repurchase�Authorization
Conclusion Julian Francis, Chief Executive Officer
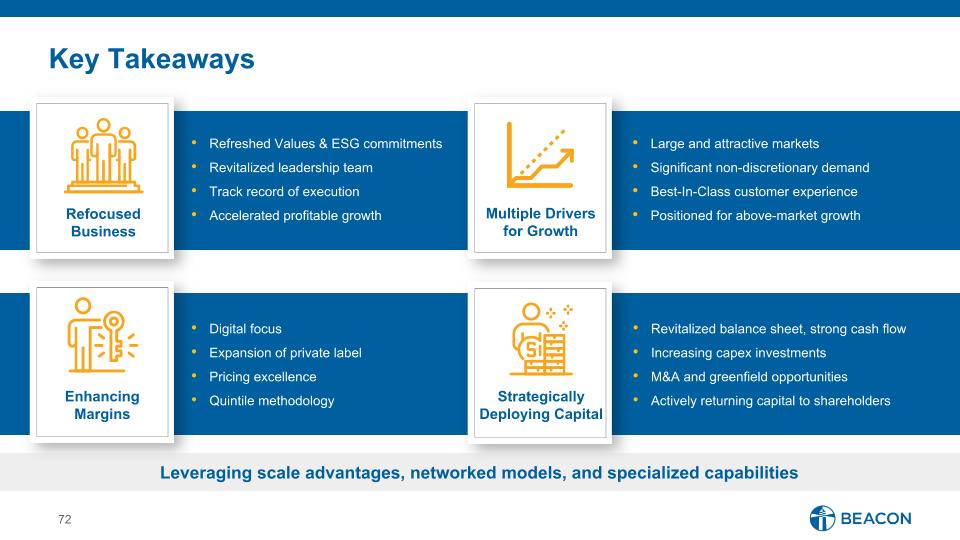
Key Takeaways Refreshed Values & ESG commitments Revitalized leadership team Track record of execution Accelerated profitable growth Refocused Business Multiple Drivers for Growth Large and attractive markets Significant non-discretionary demand Best-In-Class customer experience Positioned for above-market growth Digital focus Expansion of private label Pricing excellence Quintile methodology Revitalized balance sheet, strong cash flow Increasing capex investments M&A and greenfield opportunities Actively returning capital to shareholders Enhancing Margins Strategically Deploying Capital Leveraging scale advantages, networked models, and specialized capabilities
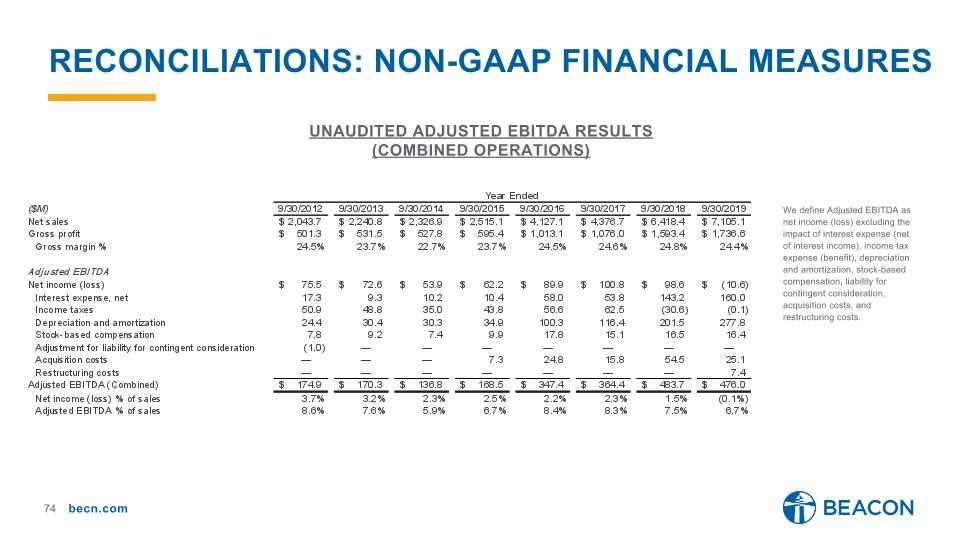
Reconciliations: non-gaap financial measures Unaudited Adjusted Ebitda results (combined operations) We define Adjusted EBITDA as net income (loss) excluding the impact of interest expense (net of interest income), income tax expense (benefit), depreciation and amortization, stock-based compensation, liability for contingent consideration, acquisition costs, and restructuring costs.
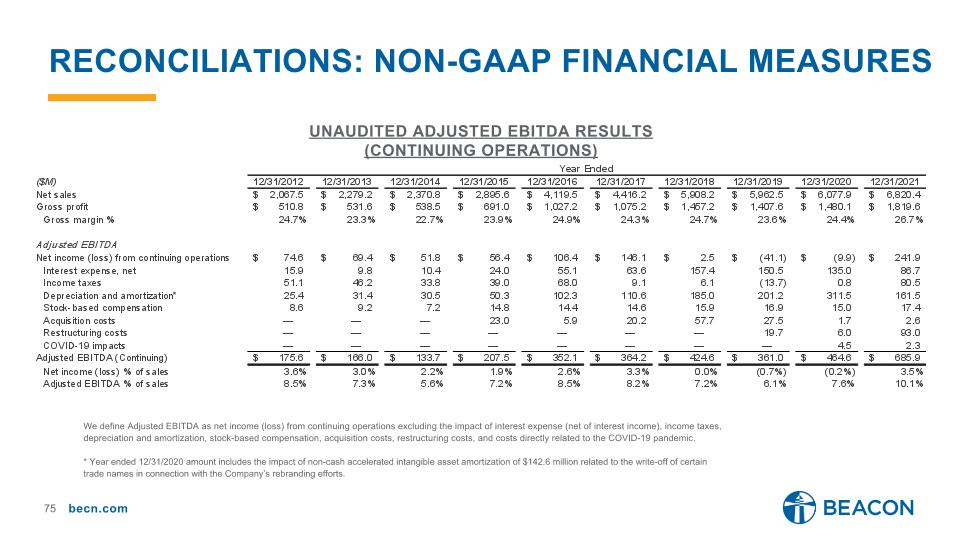
Reconciliations: non-gaap financial measures Unaudited Adjusted Ebitda results (Continuing operations) We define Adjusted EBITDA as net income (loss) from continuing operations excluding the impact of interest expense (net of interest income), income taxes, depreciation and amortization, stock-based compensation, acquisition costs, restructuring costs, and costs directly related to the COVID-19 pandemic. * Year ended 12/31/2020 amount includes the impact of non-cash accelerated intangible asset amortization of $142.6 million related to the write-off of certain trade names in connection with the Company’s rebranding efforts.
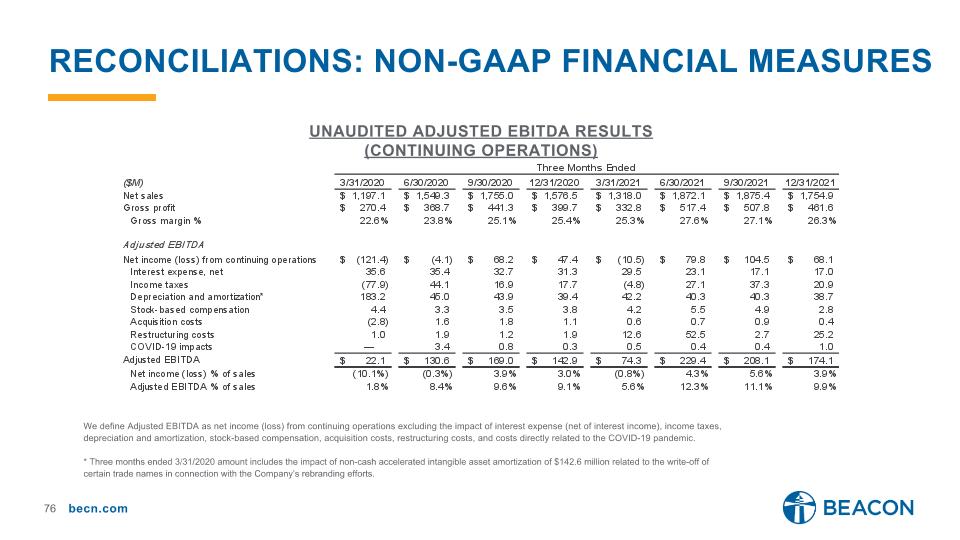
Reconciliations: non-gaap financial measures Unaudited Adjusted Ebitda results (Continuing operations) We define Adjusted EBITDA as net income (loss) from continuing operations excluding the impact of interest expense (net of interest income), income taxes, depreciation and amortization, stock-based compensation, acquisition costs, restructuring costs, and costs directly related to the COVID-19 pandemic. * Three months ended 3/31/2020 amount includes the impact of non-cash accelerated intangible asset amortization of $142.6 million related to the write-off of certain trade names in connection with the Company’s rebranding efforts.
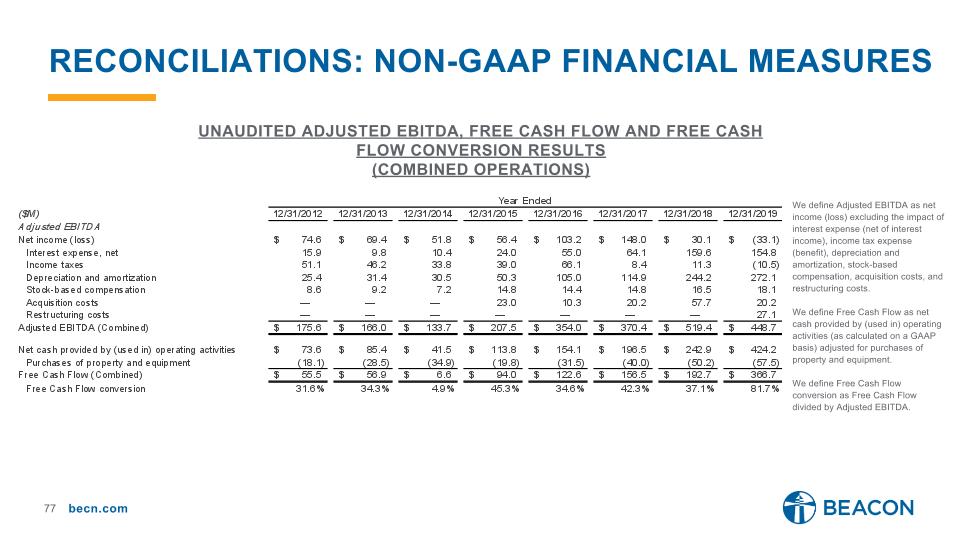
Reconciliations: non-gaap financial measures We define Adjusted EBITDA as net income (loss) excluding the impact of interest expense (net of interest income), income tax expense (benefit), depreciation and amortization, stock-based compensation, acquisition costs, and restructuring costs. We define Free Cash Flow as net cash provided by (used in) operating activities (as calculated on a GAAP basis) adjusted for purchases of property and equipment. We define Free Cash Flow conversion as Free Cash Flow divided by Adjusted EBITDA. Unaudited Adjusted ebitda, free cash flow and Free cash flow conversion results (combined operations)
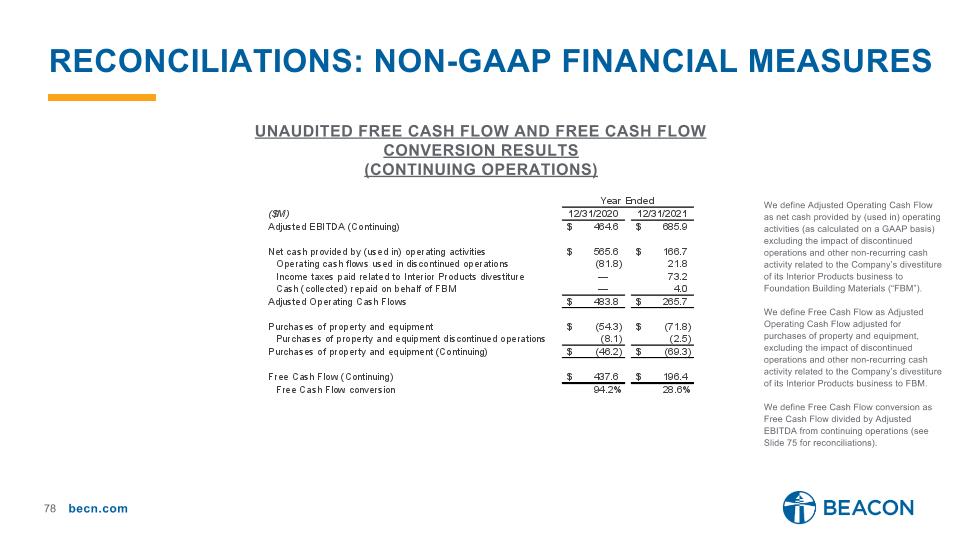
Reconciliations: non-gaap financial measures We define Adjusted Operating Cash Flow as net cash provided by (used in) operating activities (as calculated on a GAAP basis) excluding the impact of discontinued operations and other non-recurring cash activity related to the Company’s divestiture of its Interior Products business to Foundation Building Materials (“FBM”). We define Free Cash Flow as Adjusted Operating Cash Flow adjusted for purchases of property and equipment, excluding the impact of discontinued operations and other non-recurring cash activity related to the Company’s divestiture of its Interior Products business to FBM. We define Free Cash Flow conversion as Free Cash Flow divided by Adjusted EBITDA from continuing operations (see Slide 75 for reconciliations). Unaudited free cash flow and free cash flow conversion results (continuing operations)
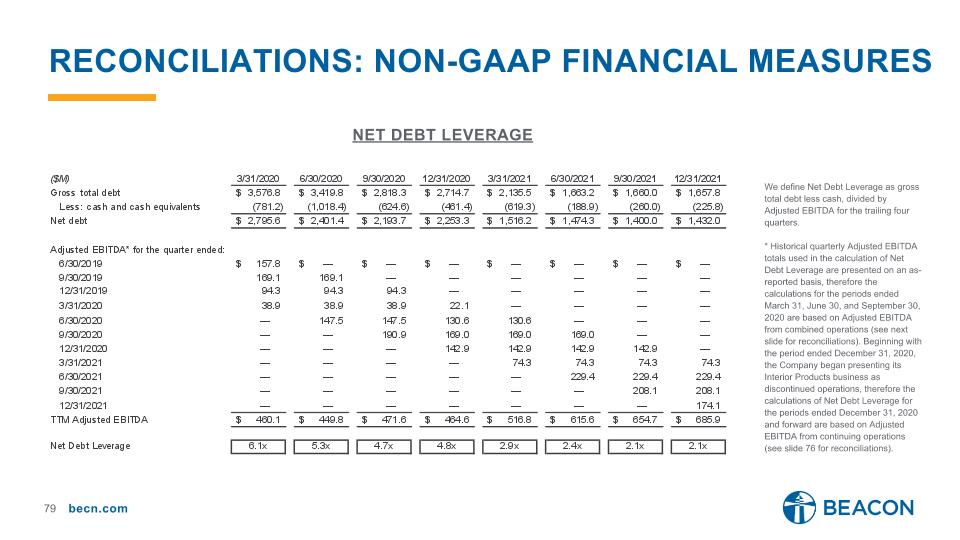
Reconciliations: non-gaap financial measures Net debt leverage We define Net Debt Leverage as gross total debt less cash, divided by Adjusted EBITDA for the trailing four quarters. * Historical quarterly Adjusted EBITDA totals used in the calculation of Net Debt Leverage are presented on an as-reported basis, therefore the calculations for the periods ended March 31, June 30, and September 30, 2020 are based on Adjusted EBITDA from combined operations (see next slide for reconciliations). Beginning with the period ended December 31, 2020, the Company began presenting its Interior Products business as discontinued operations, therefore the calculations of Net Debt Leverage for the periods ended December 31, 2020 and forward are based on Adjusted EBITDA from continuing operations (see slide 76 for reconciliations).
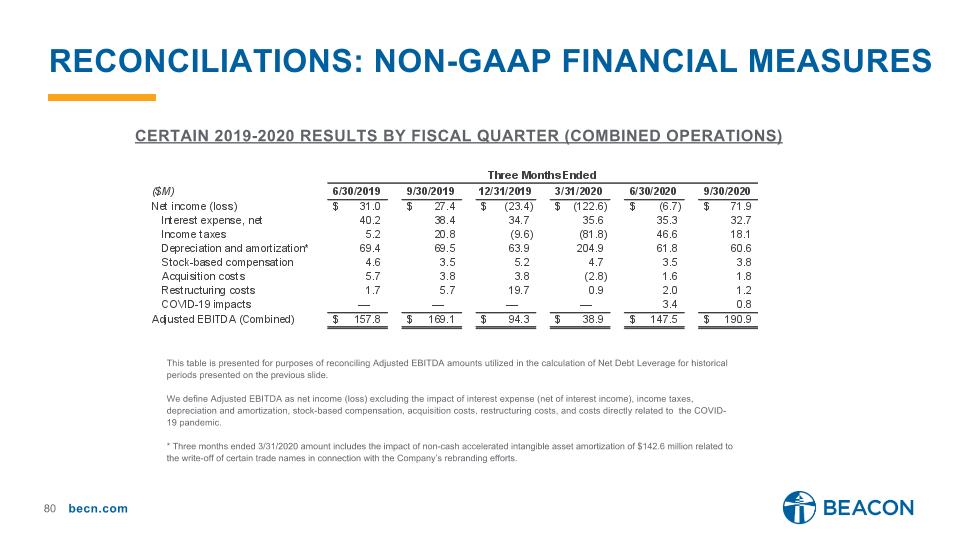
Reconciliations: non-gaap financial measures Certain 2019-2020 results by Fiscal Quarter (combined operations) This table is presented for purposes of reconciling Adjusted EBITDA amounts utilized in the calculation of Net Debt Leverage for historical periods presented on the previous slide. We define Adjusted EBITDA as net income (loss) excluding the impact of interest expense (net of interest income), income taxes, depreciation and amortization, stock-based compensation, acquisition costs, restructuring costs, and costs directly related to the COVID-19 pandemic. * Three months ended 3/31/2020 amount includes the impact of non-cash accelerated intangible asset amortization of $142.6 million related to the write-off of certain trade names in connection with the Company’s rebranding efforts.
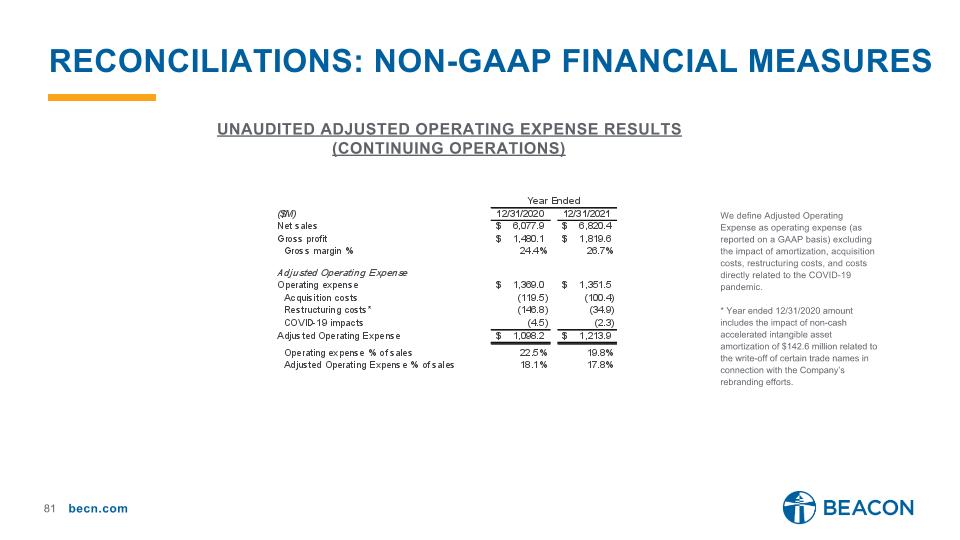
Reconciliations: non-gaap financial measures We define Adjusted Operating Expense as operating expense (as reported on a GAAP basis) excluding the impact of amortization, acquisition costs, restructuring costs, and costs directly related to the COVID-19 pandemic. * Year ended 12/31/2020 amount includes the impact of non-cash accelerated intangible asset amortization of $142.6 million related to the write-off of certain trade names in connection with the Company’s rebranding efforts. Unaudited Adjusted operating expense results (continuing operations)
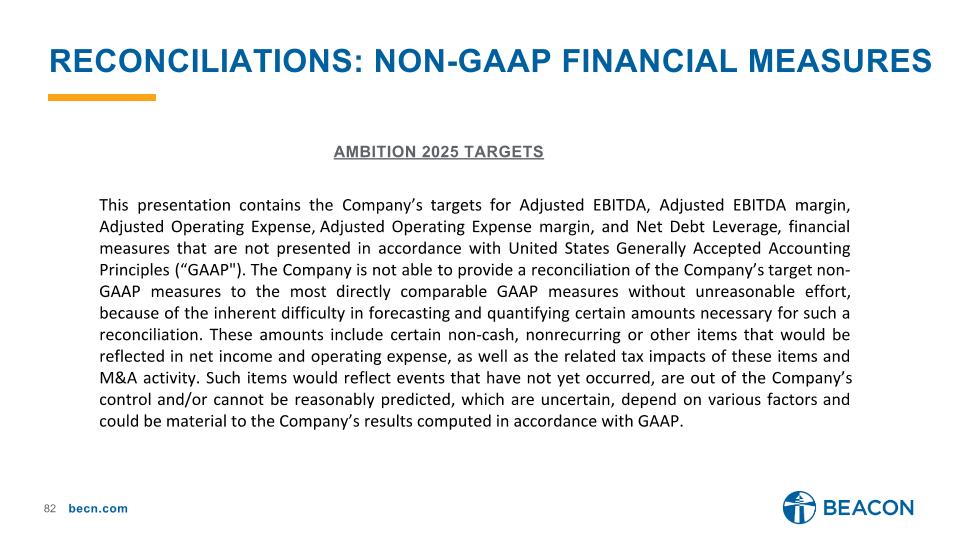
Reconciliations: non-gaap financial measures This presentation contains the Company’s targets for Adjusted EBITDA, Adjusted EBITDA margin, Adjusted Operating Expense, Adjusted Operating Expense margin, and Net Debt Leverage, financial measures that are not presented in accordance with United States Generally Accepted Accounting Principles (“GAAP"). The Company is not able to provide a reconciliation of the Company’s target non-GAAP measures to the most directly comparable GAAP measures without unreasonable effort, because of the inherent difficulty in forecasting and quantifying certain amounts necessary for such a reconciliation. These amounts include certain non-cash, nonrecurring or other items that would be reflected in net income and operating expense, as well as the related tax impacts of these items and M&A activity. Such items would reflect events that have not yet occurred, are out of the Company’s control and/or cannot be reasonably predicted, which are uncertain, depend on various factors and could be material to the Company’s results computed in accordance with GAAP. Ambition 2025 targets
