MAY 5, 2022 2022 Q1 2022 EARNINGS PRESENTATION Exhibit 99.2
Disclosure Notice This presentation contains information about management's view of the Company's future expectations, plans and prospects that constitute forward-looking statements for purposes of the safe harbor provisions under the Private Securities Litigation Reform Act of 1995. In addition, oral statements made by our directors, officers and employees to the investor and analyst communities, media representatives and others, depending upon their nature, may also constitute forward-looking statements. Forward-looking statements can be identified by the fact that they do not relate strictly to historic or current facts and often use words such as “anticipate,” “estimate,” “expect,” “believe,” “will likely result,” “outlook,” “project” and other words and expressions of similar meaning. Investors are cautioned not to place undue reliance on forward-looking statements. Actual results may differ materially from those indicated by such forward-looking statements as a result of various important factors, including, but not limited to, those set forth in the "Risk Factors" section of the Company's Form 10-K for the fiscal year ended September 30, 2021 and subsequent filings with the U.S. Securities and Exchange Commission. The Company may not succeed in addressing these and other risks. Consequently, all forward-looking statements in this presentation are qualified by the factors, risks and uncertainties contained therein. In addition, the forward-looking statements included in this presentation represent the Company's views as of the date of this presentation and these views could change. However, while the Company may elect to update these forward-looking statements at some point, the Company specifically disclaims any obligation to do so, other than as required by federal securities laws. These forward-looking statements should not be relied upon as representing the Company's views as of any date subsequent to the date of this presentation. This presentation contains references to certain financial measures that are not presented in accordance with United States Generally Accepted Accounting Principles (“GAAP"). The Company uses non-GAAP financial measures to evaluate financial performance, analyze underlying business trends and establish operational goals and forecasts that are used when allocating resources. The Company believes these non-GAAP financial measures permit investors to better understand changes over comparative periods by providing financial results that are unaffected by certain items that are not indicative of ongoing operating performance. While the Company believes these measures are useful to investors when evaluating performance, they are not prepared and presented in accordance with GAAP, and therefore should be considered supplemental in nature. The Company’s non-GAAP financial measures should not be considered in isolation or as a substitute for other financial performance measures presented in accordance with GAAP. These non-GAAP financial measures may have material limitations including, but not limited to, the exclusion of certain costs without a corresponding reduction of net income for the income generated by the assets to which the excluded costs relate. In addition, these non-GAAP financial measures may differ from similarly titled measures presented by other companies. A reconciliation of these non-GAAP financial measures to their most directly comparable GAAP financial measure can be found in the Appendix as well as the Company’s latest Form 8-K, filed with the SEC on May 5, 2022.
President & chief executive officer Julian francis
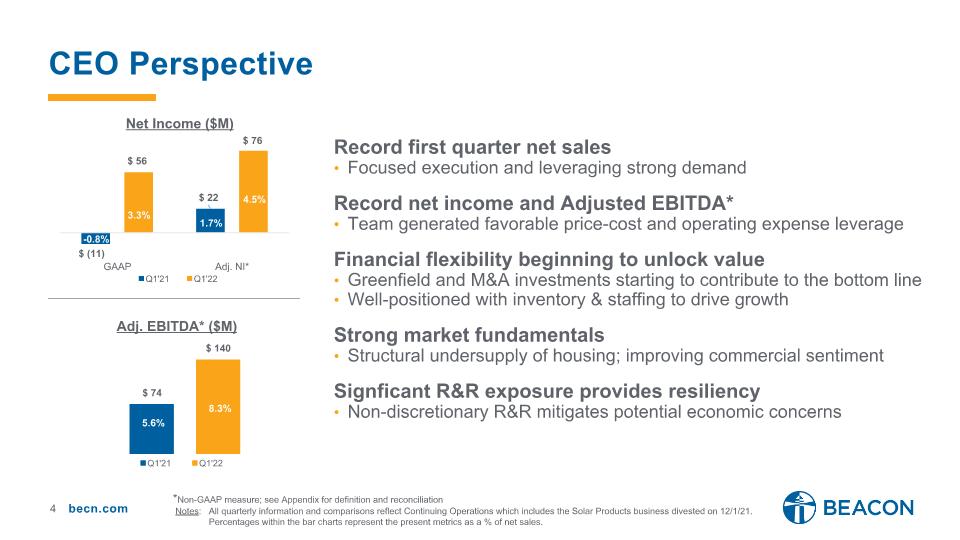
CEO Perspective 8.3% 5.6% *Non-GAAP measure; see Appendix for definition and reconciliation Notes: All quarterly information and comparisons reflect Continuing Operations which includes the Solar Products business divested on 12/1/21. Percentages within the bar charts represent the present metrics as a % of net sales. 4.5% 1.7% 3.3% -0.8% Record first quarter net sales Focused execution and leveraging strong demand Record net income and Adjusted EBITDA* Team generated favorable price-cost and operating expense leverage Financial flexibility beginning to unlock value Greenfield and M&A investments starting to contribute to the bottom line Well-positioned with inventory & staffing to drive growth Strong market fundamentals Structural undersupply of housing; improving commercial sentiment Signficant R&R exposure provides resiliency Non-discretionary R&R mitigates potential economic concerns
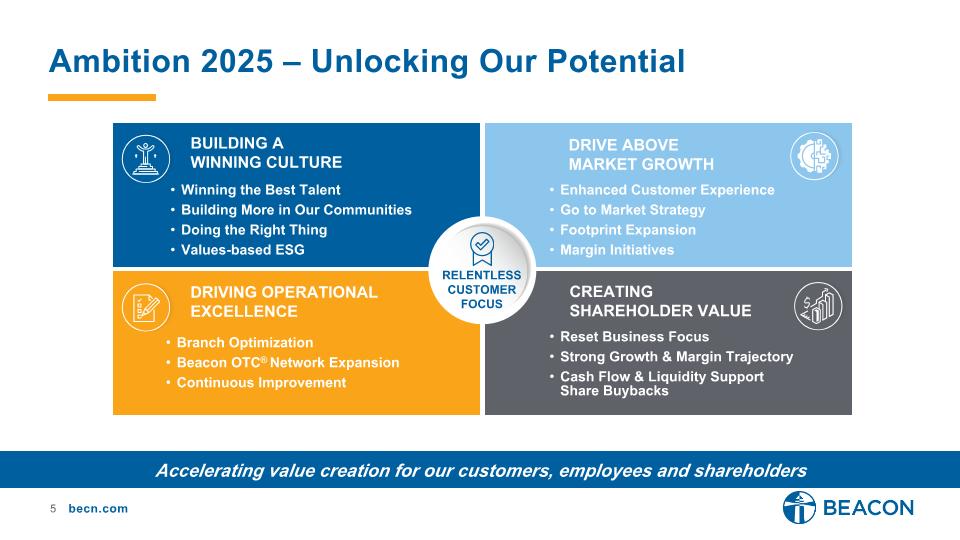
Ambition 2025 – Unlocking Our Potential Accelerating value creation for our customers, employees and shareholders RELENTLESS CUSTOMER FOCUS DRIVING OPERATIONAL EXCELLENCE Branch Optimization Beacon OTC® Network Expansion Continuous Improvement BUILDING A WINNING CULTURE Winning the Best Talent Building More in Our Communities Doing the Right Thing Values-based ESG Drive Above Market Growth Enhanced Customer Experience Go to Market Strategy Footprint Expansion Margin Initiatives Reset Business Focus Strong Growth & Margin Trajectory Cash Flow & Liquidity Support Share Buybacks Creating Shareholder Value
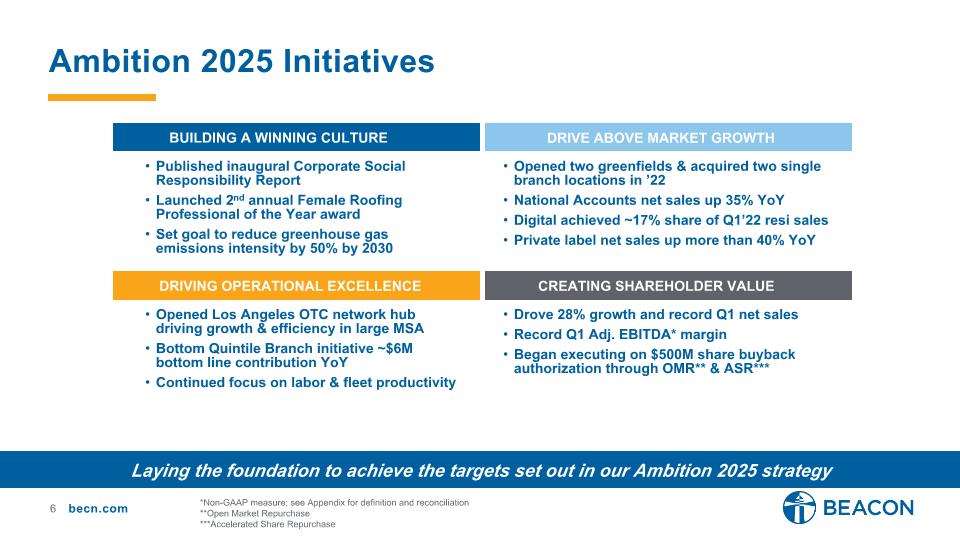
Published inaugural Corporate Social Responsibility Report Launched 2nd annual Female Roofing Professional of the Year award Set goal to reduce greenhouse gas emissions intensity by 50% by 2030 Ambition 2025 Initiatives Laying the foundation to achieve the targets set out in our Ambition 2025 strategy DRIVING OPERATIONAL EXCELLENCE BUILDING A WINNING CULTURE Drive Above Market Growth Creating Shareholder Value Opened Los Angeles OTC network hub driving growth & efficiency in large MSA Bottom Quintile Branch initiative ~$6M bottom line contribution YoY Continued focus on labor & fleet productivity Opened two greenfields & acquired two single branch locations in ’22 National Accounts net sales up 35% YoY Digital achieved ~17% share of Q1’22 resi sales Private label net sales up more than 40% YoY Drove 28% growth and record Q1 net sales Record Q1 Adj. EBITDA* margin Began executing on $500M share buyback authorization through OMR** & ASR*** *Non-GAAP measure; see Appendix for definition and reconciliation **Open Market Repurchase ***Accelerated Share Repurchase
Executive vice president & chief financial officer Frank lonegro
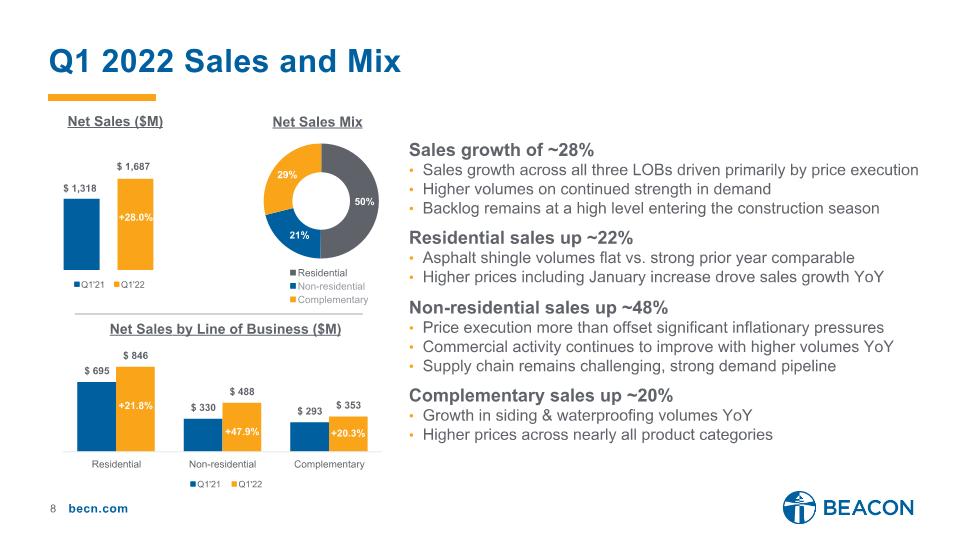
Q1 2022 Sales and Mix Sales growth of ~28% Sales growth across all three LOBs driven primarily by price execution Higher volumes on continued strength in demand Backlog remains at a high level entering the construction season Residential sales up ~22% Asphalt shingle volumes flat vs. strong prior year comparable Higher prices including January increase drove sales growth YoY Non-residential sales up ~48% Price execution more than offset significant inflationary pressures Commercial activity continues to improve with higher volumes YoY Supply chain remains challenging, strong demand pipeline Complementary sales up ~20% Growth in siding & waterproofing volumes YoY Higher prices across nearly all product categories +21.8% +47.9% +20.3% +28.0%
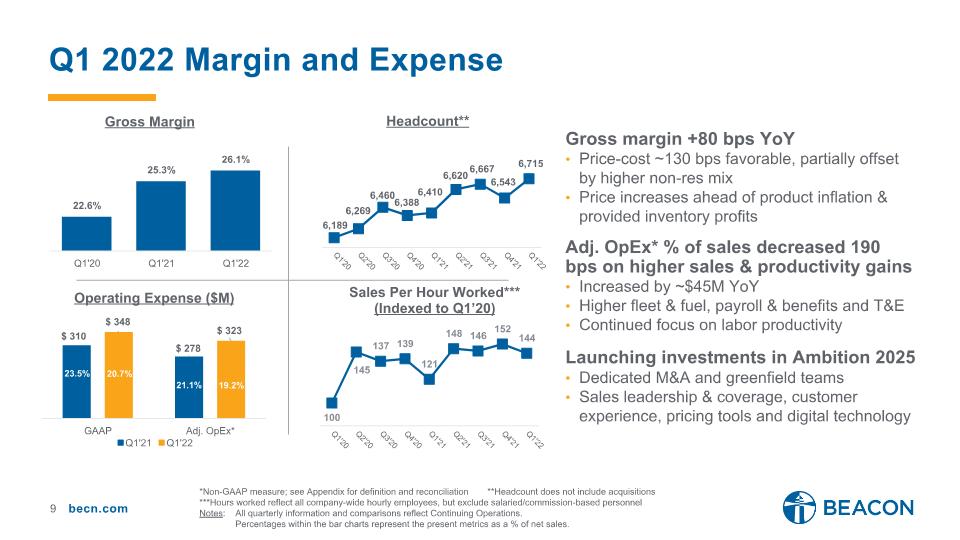
*Non-GAAP measure; see Appendix for definition and reconciliation **Headcount does not include acquisitions ***Hours worked reflect all company-wide hourly employees, but exclude salaried/commission-based personnel Notes: All quarterly information and comparisons reflect Continuing Operations. Percentages within the bar charts represent the present metrics as a % of net sales. Q1 2022 Margin and Expense Gross margin +80 bps YoY Price-cost ~130 bps favorable, partially offset by higher non-res mix Price increases ahead of product inflation & provided inventory profits Adj. OpEx* % of sales decreased 190 bps on higher sales & productivity gains Increased by ~$45M YoY Higher fleet & fuel, payroll & benefits and T&E Continued focus on labor productivity Launching investments in Ambition 2025 Dedicated M&A and greenfield teams Sales leadership & coverage, customer experience, pricing tools and digital technology 21.1% 19.2% 20.7% 23.5%
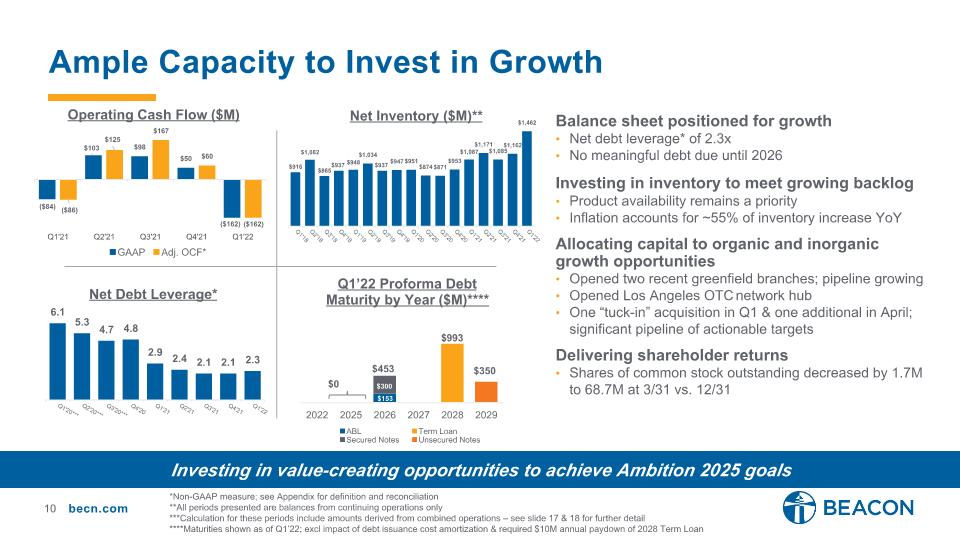
$453 $350 $993 $0 $300 $153 Ample Capacity to Invest in Growth Balance sheet positioned for growth Net debt leverage* of 2.3x No meaningful debt due until 2026 Investing in inventory to meet growing backlog Product availability remains a priority Inflation accounts for ~55% of inventory increase YoY Allocating capital to organic and inorganic growth opportunities Opened two recent greenfield branches; pipeline growing Opened Los Angeles OTC network hub One “tuck-in” acquisition in Q1 & one additional in April; significant pipeline of actionable targets Delivering shareholder returns Shares of common stock outstanding decreased by 1.7M to 68.7M at 3/31 vs. 12/31 Investing in value-creating opportunities to achieve Ambition 2025 goals *Non-GAAP measure; see Appendix for definition and reconciliation **All periods presented are balances from continuing operations only ***Calculation for these periods include amounts derived from combined operations – see slide 17 & 18 for further detail ****Maturities shown as of Q1’22; excl impact of debt issuance cost amortization & required $10M annual paydown of 2028 Term Loan

President & chief executive officer Julian francis
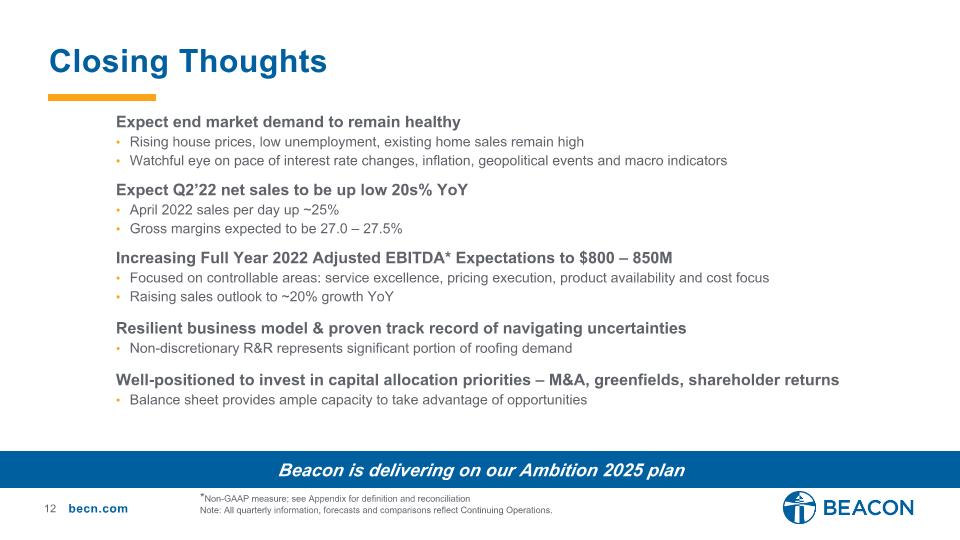
Expect end market demand to remain healthy Rising house prices, low unemployment, existing home sales remain high Watchful eye on pace of interest rate changes, inflation, geopolitical events and macro indicators Expect Q2’22 net sales to be up low 20s% YoY April 2022 sales per day up ~25% Gross margins expected to be 27.0 – 27.5% Increasing Full Year 2022 Adjusted EBITDA* Expectations to $800 – 850M Focused on controllable areas: service excellence, pricing execution, product availability and cost focus Raising sales outlook to ~20% growth YoY Resilient business model & proven track record of navigating uncertainties Non-discretionary R&R represents significant portion of roofing demand Well-positioned to invest in capital allocation priorities – M&A, greenfields, shareholder returns Balance sheet provides ample capacity to take advantage of opportunities Closing Thoughts *Non-GAAP measure; see Appendix for definition and reconciliation Note: All quarterly information, forecasts and comparisons reflect Continuing Operations. Beacon is delivering on our Ambition 2025 plan
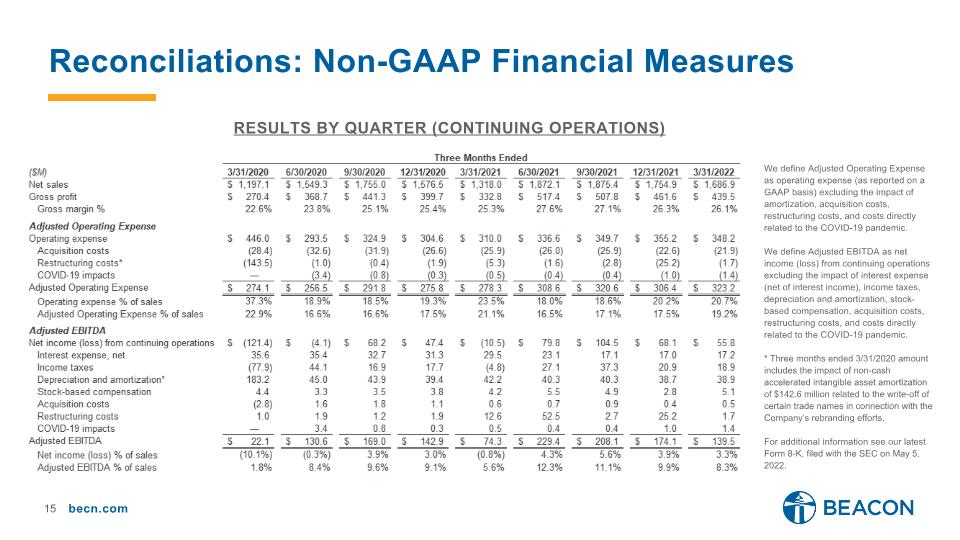
Reconciliations: Non-GAAP Financial Measures results by Quarter (Continuing operations) We define Adjusted Operating Expense as operating expense (as reported on a GAAP basis) excluding the impact of amortization, acquisition costs, restructuring costs, and costs directly related to the COVID-19 pandemic. We define Adjusted EBITDA as net income (loss) from continuing operations excluding the impact of interest expense (net of interest income), income taxes, depreciation and amortization, stock-based compensation, acquisition costs, restructuring costs, and costs directly related to the COVID-19 pandemic. * Three months ended 3/31/2020 amount includes the impact of non-cash accelerated intangible asset amortization of $142.6 million related to the write-off of certain trade names in connection with the Company’s rebranding efforts. For additional information see our latest Form 8-K, filed with the SEC on May 5, 2022.
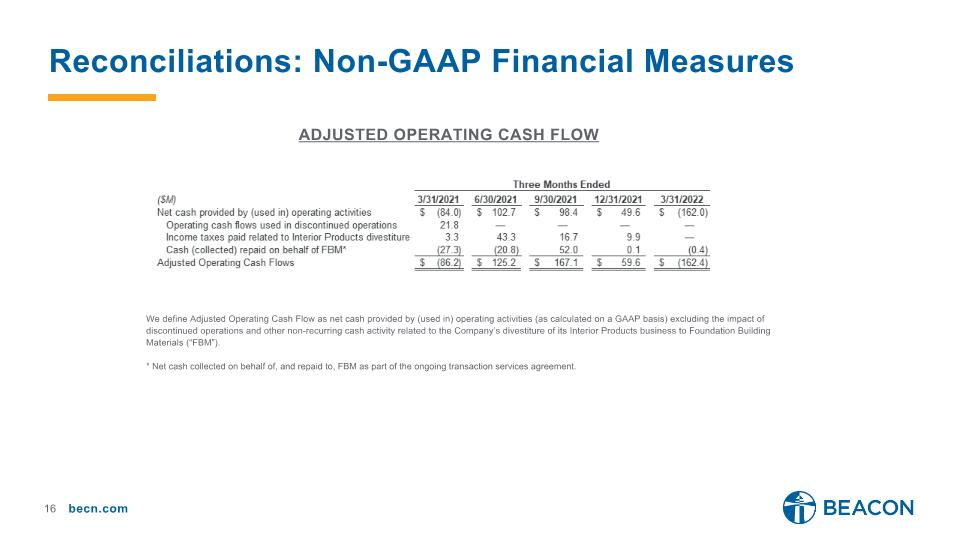
ADJUSTED OPERATING CASH FLOW We define Adjusted Operating Cash Flow as net cash provided by (used in) operating activities (as calculated on a GAAP basis) excluding the impact of discontinued operations and other non-recurring cash activity related to the Company’s divestiture of its Interior Products business to Foundation Building Materials (“FBM”). * Net cash collected on behalf of, and repaid to, FBM as part of the ongoing transaction services agreement. Reconciliations: Non-GAAP Financial Measures
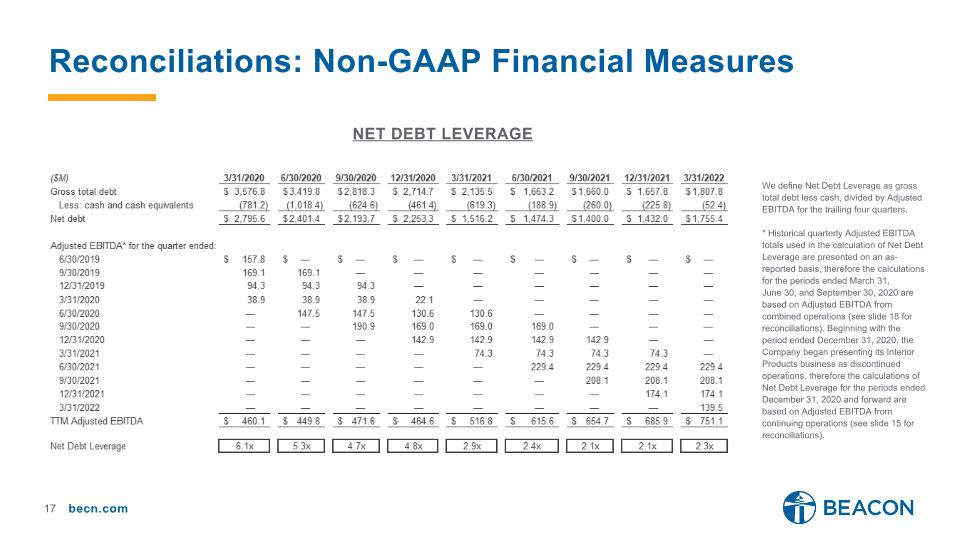
Net debt leverage We define Net Debt Leverage as gross total debt less cash, divided by Adjusted EBITDA for the trailing four quarters. * Historical quarterly Adjusted EBITDA totals used in the calculation of Net Debt Leverage are presented on an as-reported basis, therefore the calculations for the periods ended March 31, �June 30, and September 30, 2020 are based on Adjusted EBITDA from combined operations (see slide 18 for reconciliations). Beginning with the period ended December 31, 2020, the Company began presenting its Interior Products business as discontinued operations, therefore the calculations of Net Debt Leverage for the periods ended December 31, 2020 and forward are based on Adjusted EBITDA from continuing operations (see slide 15 for reconciliations). Reconciliations: Non-GAAP Financial Measures
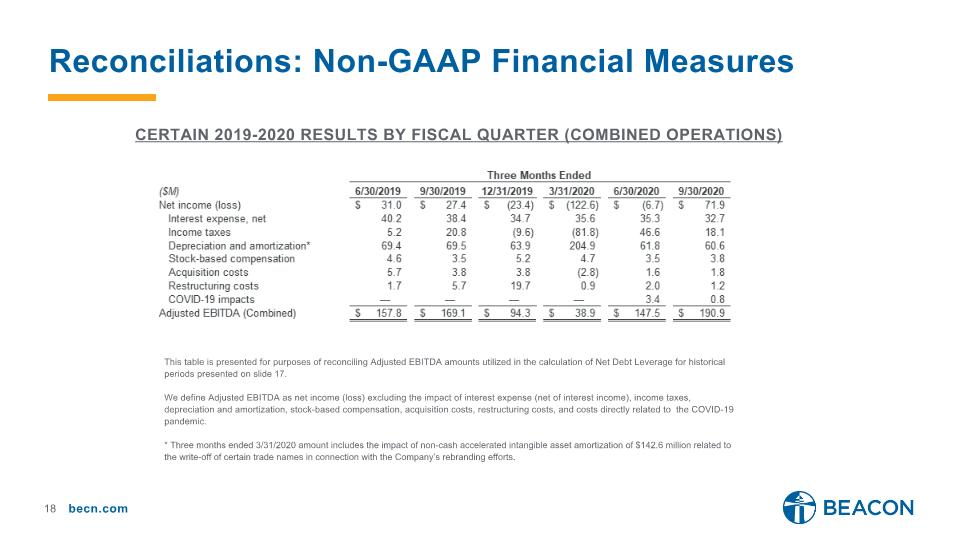
Certain 2019-2020 results by Fiscal Quarter (combined operations) This table is presented for purposes of reconciling Adjusted EBITDA amounts utilized in the calculation of Net Debt Leverage for historical periods presented on slide 17. We define Adjusted EBITDA as net income (loss) excluding the impact of interest expense (net of interest income), income taxes, depreciation and amortization, stock-based compensation, acquisition costs, restructuring costs, and costs directly related to the COVID-19 pandemic. * Three months ended 3/31/2020 amount includes the impact of non-cash accelerated intangible asset amortization of $142.6 million related to the write-off of certain trade names in connection with the Company’s rebranding efforts. Reconciliations: Non-GAAP Financial Measures
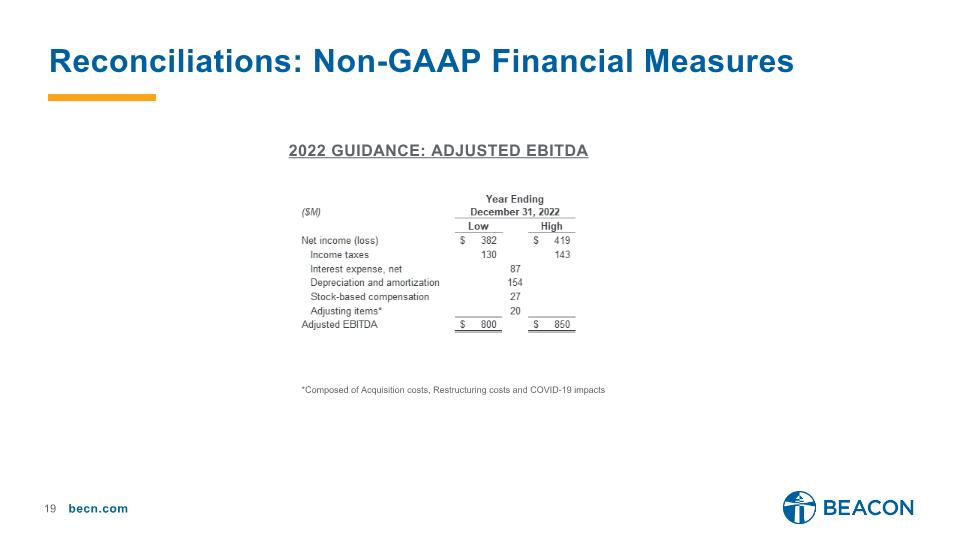
*Composed of Acquisition costs, Restructuring costs and COVID-19 impacts 2022 guidance: Adjusted ebitda Reconciliations: Non-GAAP Financial Measures


