Exhibit 99.1
Link to searchable text of slide shown above
Link to searchable text of slide shown above
Link to searchable text of slide shown above
Link to searchable text of slide shown above
Link to searchable text of slide shown above
Link to searchable text of slide shown above
Link to searchable text of slide shown above
Link to searchable text of slide shown above
Link to searchable text of slide shown above
Link to searchable text of slide shown above
Link to searchable text of slide shown above
Link to searchable text of slide shown above
Link to searchable text of slide shown above
Link to searchable text of slide shown above
Link to searchable text of slide shown above
Link to searchable text of slide shown above
Link to searchable text of slide shown above
Link to searchable text of slide shown above
Link to searchable text of slide shown above
Link to searchable text of slide shown above
Link to searchable text of slide shown above
Link to searchable text of slide shown above
Link to searchable text of slide shown above
Link to searchable text of slide shown above
Link to searchable text of slide shown above
Link to searchable text of slide shown above
Link to searchable text of slide shown above

Link to searchable text of slide shown above
Searchable text section of graphics shown above
[LOGO]
JP Morgan Small Cap
Conference
Robert Buck
Chief Executive Officer
David Grace
Chief Financial Officer
March 10, 2005
Forward looking statements
This presentation contains “forward-looking statements”. These statements relate to future events or our future financial performance and involve known and unknown risks, uncertainties and other factors that may cause our actual results, levels of activity, performance or achievements expressed or implied by these forward-looking statements to differ materially from such statements. Although we believe that the expectations reflected in the forward-looking statements are reasonable, we cannot guarantee future results, levels of activity, performance or achievements. We caution you not to place undue reliance on these forward-looking statements, which reflect our analysis only and speak only as of the date of this presentation. We undertake no obligation to update the forward-looking statements to reflect subsequent events or circumstances.
1
Company Overview
Robert Buck
Chief Executive Officer
2
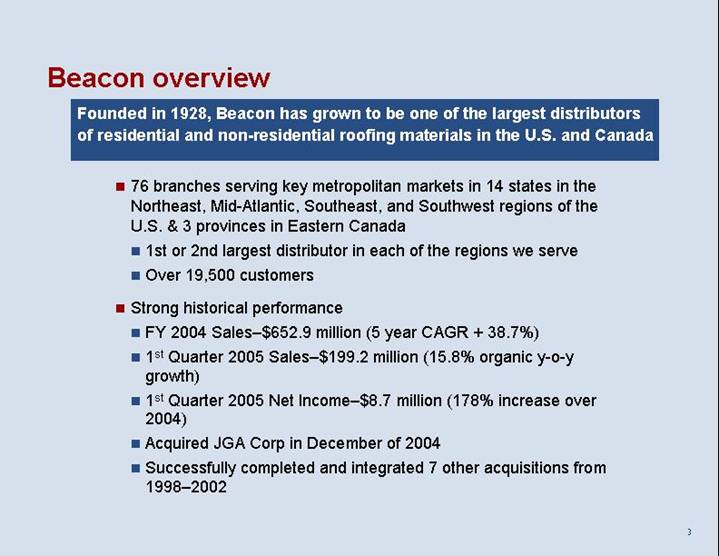
Beacon overview
Founded in 1928, Beacon has grown to be one of the largest distributors of residential and non-residential roofing materials in the U.S. and Canada
• | 76 branches serving key metropolitan markets in 14 states in the Northeast, Mid-Atlantic, Southeast, and Southwest regions of the U.S. & 3 provinces in Eastern Canada | |
| • | 1st or 2nd largest distributor in each of the regions we serve |
| • | Over 19,500 customers |
|
| |
• | Strong historical performance | |
| • | FY 2004 Sales–$652.9 million (5 year CAGR + 38.7%) |
| • | 1st Quarter 2005 Sales–$199.2 million (15.8% organic y-o-y growth) |
| • | 1st Quarter 2005 Net Income–$8.7 million (178% increase over 2004) |
| • | Acquired JGA Corp in December of 2004 |
| • | Successfully completed and integrated 7 other acquisitions from 1998-2002 |
3
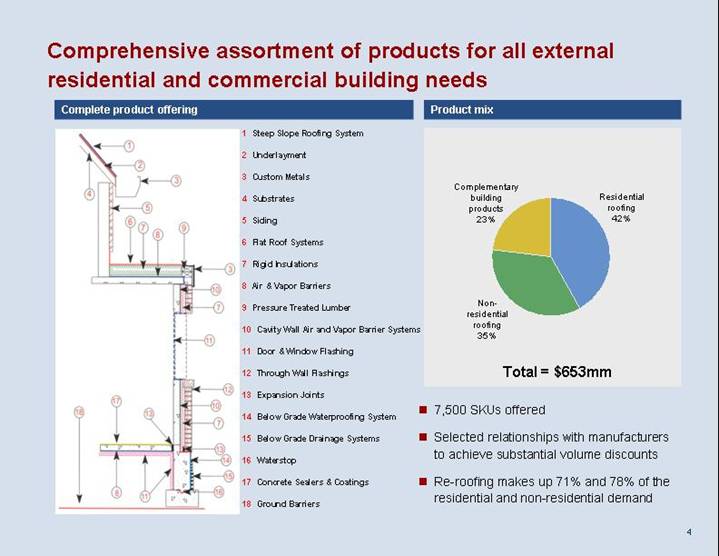
Comprehensive assortment of products for all external residential and commercial building needs
Complete product offering
[GRAPHIC]
1 Steep Slope Roofing System |
2 Underlayment |
3 Custom Metals |
4 Substrates |
5 Siding |
6 Flat Roof Systems |
7 Rigid Insulations |
8 Air & Vapor Barriers |
9 Pressure Treated Lumber |
10 Cavity Wall Air and Vapor Barrier Systems |
11 Door & Window Flashing |
12 Through Wall Flashings |
13 Expansion Joints |
14 Below Grade Waterproofing System |
15 Below Grade Drainage Systems |
16 Waterstop |
17 Concrete Sealers & Coatings |
18 Ground Barriers |
Product mix
[CHART]
• 7,500 SKUs offered
• Selected relationships with manufacturers to achieve substantial volume discounts
• Re-roofing makes up 71% and 78% of the residential and non-residential demand
4
Why invest in Beacon?
• High value-added distributor performing a critical role in the roofing supply chain
• Market leader in an attractive, growing and fragmented industry
• Highly scalable platform and proven business model with minimal capital expenditures
• Superior financial performance highlighted by attractive growth and margins
• Historical 5 year sales CAGR: 38.7%
• 1st Quarter 2005 organic sales growth: 15.8%
• Industry leading operating margins: 6.5%
• Results oriented management, corporate culture and controls
5
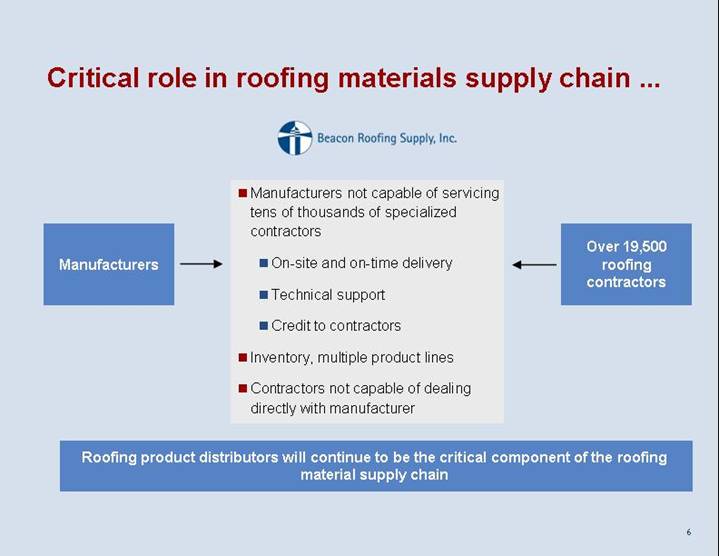
Critical role in roofing materials supply chain ...
[LOGO]
| • | Manufacturers not capable of servicing tens of thousands of specialized contractors |
|
|
|
|
|
Manufacturers |
| • On-site and on-time delivery • Technical support • Credit to contractors | Over 19,500 |
|
|
|
|
| • | Inventory, multiple product lines |
|
|
|
|
|
| • | Contractors not capable of dealing directly with manufacturer |
|
Roofing product distributors will continue to be the critical component of the roofing material supply chain
6
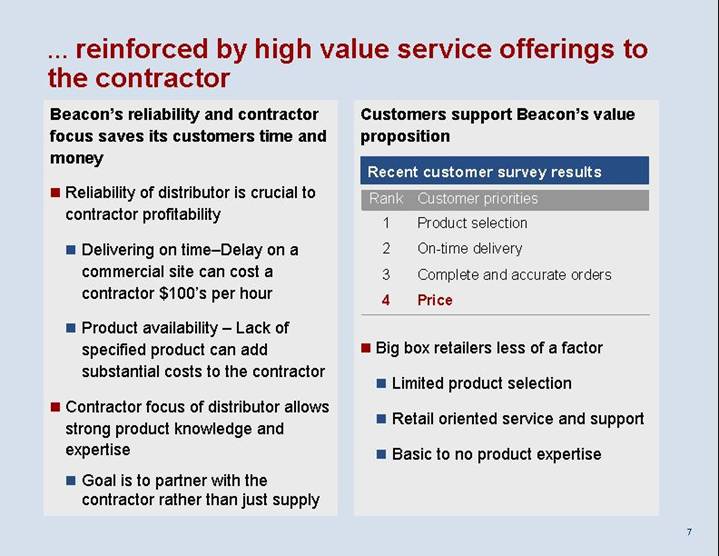
… reinforced by high value service offerings to the contractor
Beacon’s reliability and contractor focus saves its customers time and money
• | Reliability of distributor is crucial to contractor profitability | |
|
| |
| • | Delivering on time–Delay on a commercial site can cost a contractor $100’s per hour |
|
| |
| • | Product availability – Lack of specified product can add substantial costs to the contractor |
|
| |
• | Contractor focus of distributor allows strong product knowledge and expertise | |
|
| |
| • | Goal is to partner with the contractor rather than just supply |
Customers support Beacon’s value proposition
Recent customer survey results
Rank |
| Customer priorities |
|
|
|
1 |
| Product selection |
|
|
|
2 |
| On-time delivery |
|
|
|
3 |
| Complete and accurate orders |
|
|
|
4 |
| Price |
• | Big box retailers less of a factor | |
|
| |
| • | Limited product selection |
|
| |
| • | Retail oriented service and support |
|
|
|
| • | Basic to no product expertise |
7
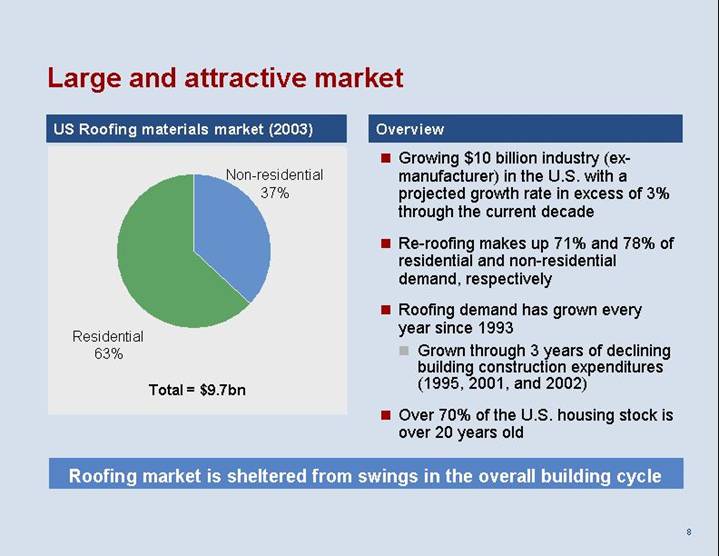
Large and attractive market
US Roofing materials market (2003)
[CHART]
Overview
• | Growing $10 billion industry (ex-manufacturer) in the U.S. with a projected growth rate in excess of 3%through the current decade | |
|
| |
• | Re-roofing makes up 71% and 78% of residential and non-residential demand, respectively | |
|
| |
• | Roofing demand has grown every year since 1993 | |
|
| |
| • | Grown through 3 years of declining building construction expenditures (1995, 2001, and 2002) |
|
| |
• | Over 70% of the U.S. housing stock is over 20 years old | |
Roofing market is sheltered from swings in the overall building cycle
8
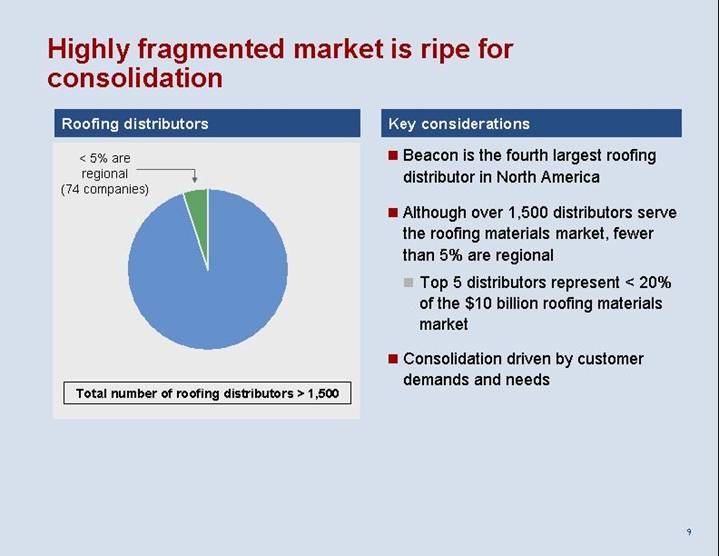
Highly fragmented market is ripe for consolidation
Roofing distributors
[CHART]
Total number of roofing distributors > 1,500
Key considerations
• | Beacon is the fourth largest roofing distributor in North America | |
|
| |
• | Although over 1,500 distributors serve the roofing materials market, fewer than 5% are regional | |
|
| |
| • | Top 5 distributors represent < 20% of the $10 billion roofing materials market |
|
| |
• | Consolidation driven by customer demands and needs | |
9
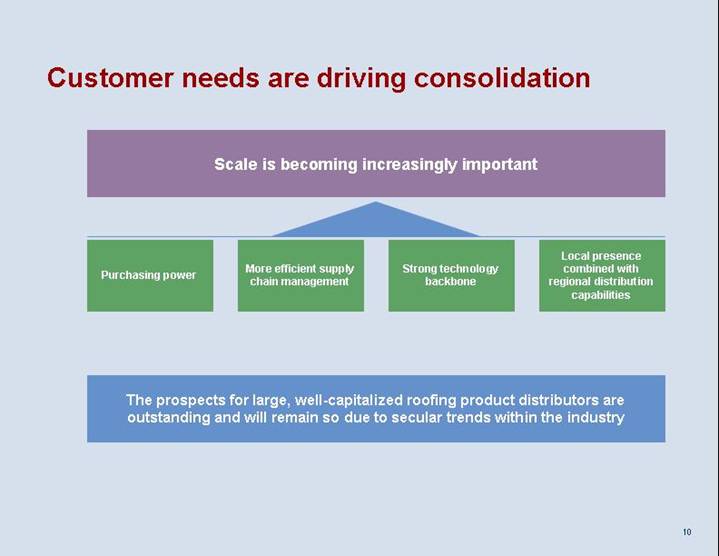
Customer needs are driving consolidation |
Scale is becoming increasingly important | ||||||
| ||||||
| ||||||
Purchasing power |
| More efficient supply |
| Strong technology |
| Local presence |
| ||||||
| ||||||
The prospects for large, well-capitalized roofing product distributors are | ||||||
10
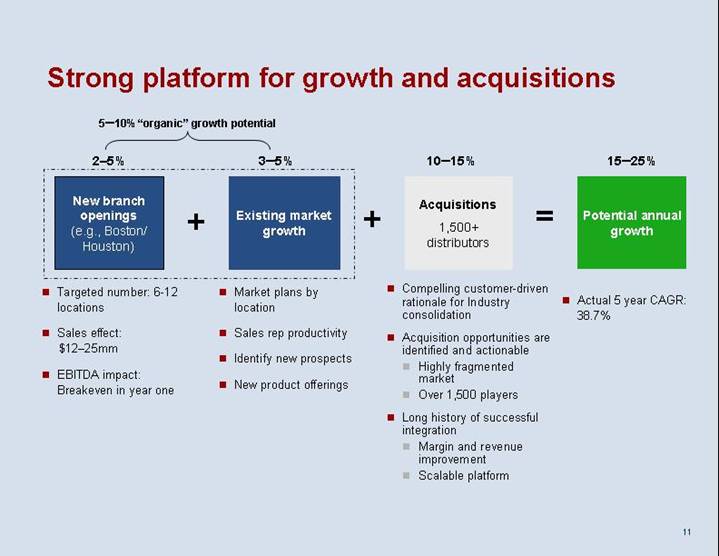
Strong platform for growth and acquisitions
5–10% “organic” growth potential |
|
|
|
| ||
|
|
|
|
| ||
2-5% |
| 3-5% |
| 10-15% |
| 15-25% |
|
|
|
|
|
|
|
New branch | + | Existing market | + | Acquisitions | = | Potential annual |
|
|
|
|
|
|
|
• Targeted number: 6-12 locations
• Sales effect: $12-25mm
• EBITDA impact: |
| • Market plans by location
• Sales rep productivity
• Identify new prospects
• New product offerings |
| • Compelling customer-driven rationale for Industry consolidation
• Acquisition opportunities are identified and actionable • Highly fragmented market • Over 1,500 players
• Long history of successful integration • Margin and revenue improvement • Scalable platform |
| • Actual 5 year CAGR: 38.7% |
11
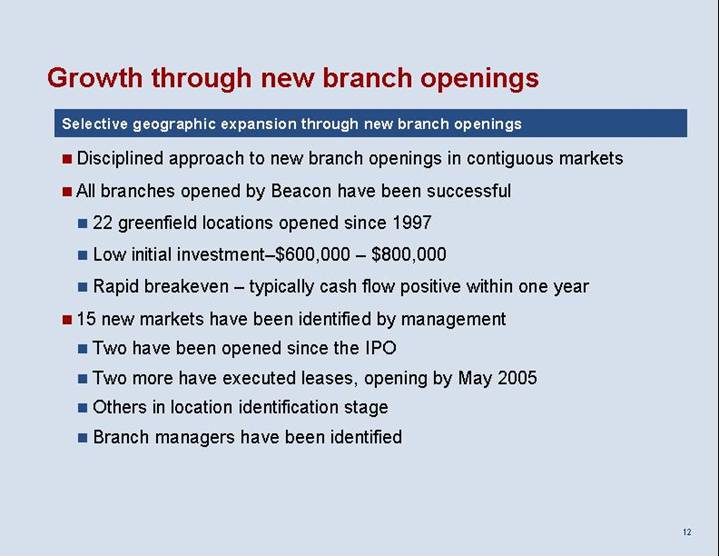
Growth through new branch openings
Selective geographic expansion through new branch openings
• | Disciplined approach to new branch openings in contiguous markets | |
|
| |
• | All branches opened by Beacon have been successful | |
| • | 22 greenfield locations opened since 1997 |
| • | Low initial investment–$600,000 – $800,000 |
| • | Rapid breakeven – typically cash flow positive within one year |
|
|
|
• | 15 new markets have been identified by management | |
| • | Two have been opened since the IPO |
| • | Two more have executed leases, opening by May 2005 |
| • | Others in location identification stage |
| • | Branch managers have been identified |
12
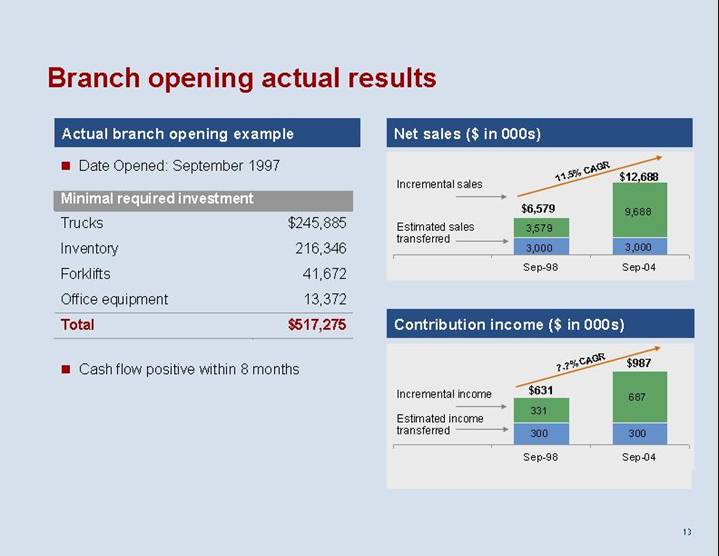
Branch opening actual results
Actual branch opening example
• Date Opened: September 1997
Minimal required investment
Trucks |
| $ | 245,885 |
|
|
|
|
| |
Inventory |
| 216,346 |
| |
|
|
|
| |
Forklifts |
| 41,672 |
| |
|
|
|
| |
Office equipment |
| 13,372 |
| |
|
|
|
| |
Total |
| $ | 517,275 |
|
• Cash flow positive within 8 months
Net sales ($ in 000s)
[CHART]
Contribution income ($ in 000s)
[CHART]
13
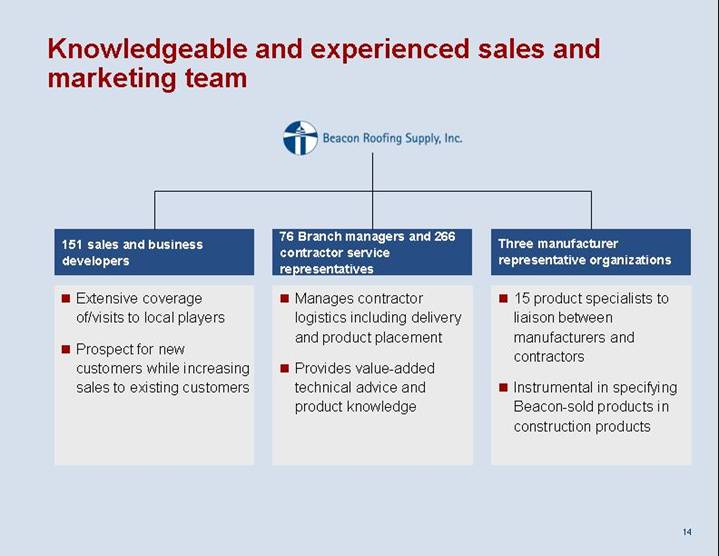
Knowledgeable and experienced sales and marketing team
[LOGO]
151 sales and business developers |
| 76 Branch managers and 266 contractor service representatives |
| Three manufacturer representative organizations |
|
|
|
|
|
• Extensive coverage of/visits to local players |
| • Manages contractor logistics including delivery and product placement |
| • 15 product specialists to liaison between manufacturers and contractors |
|
|
|
|
|
• Prospect for new customers while increasing sales to existing customers |
| • Provides value-added technical advice and product knowledge |
| • Instrumental in specifying Beacon-sold products in construction products |
14
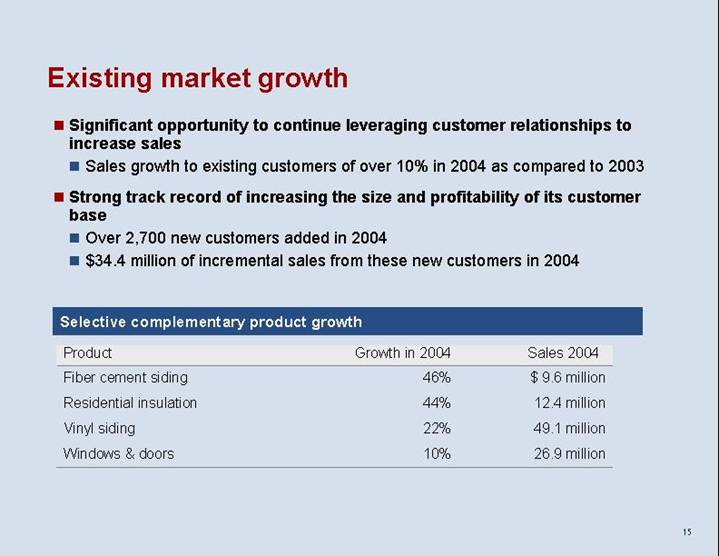
Existing market growth
• Significant opportunity to continue leveraging customer relationships to increase sales
• Sales growth to existing customers of over 10% in 2004 as compared to 2003
• Strong track record of increasing the size and profitability of its customer base
• Over 2,700 new customers added in 2004
• $34.4 million of incremental sales from these new customers in 2004
Selective complementary product growth
Product |
| Growth in 2004 |
| Sales 2004 |
| |
Fiber cement siding |
| 46 | % | $ | 9.6 million |
|
|
|
|
|
|
| |
Residential insulation |
| 44 | % | 12.4 million |
| |
|
|
|
|
|
| |
Vinyl siding |
| 22 | % | 49.1 million |
| |
|
|
|
|
|
| |
Windows & doors |
| 10 | % | 26.9 million |
| |
15
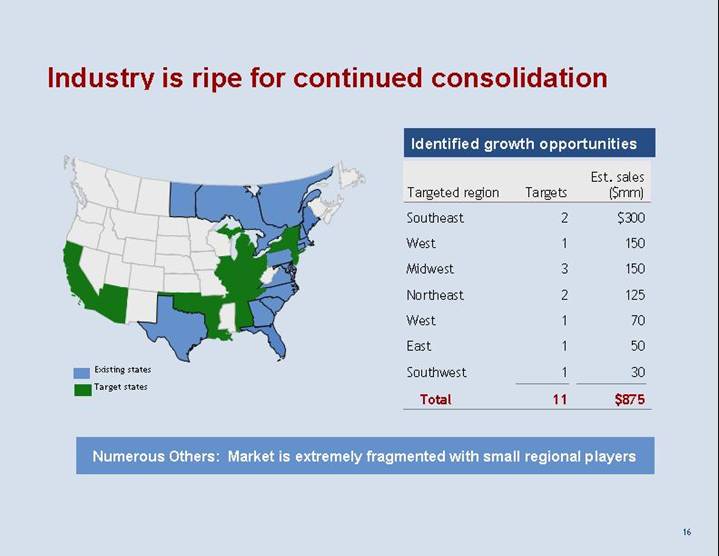
Industry is ripe for continued consolidation
[CHART]
Identified growth opportunities
Targeted region |
| Targets |
| Est. sales | |
|
|
|
| ($mm) | |
Southeast |
| 2 |
| $ | 300 |
West |
| 1 |
| 150 | |
Midwest |
| 3 |
| 150 | |
Northeast |
| 2 |
| 125 | |
West |
| 1 |
| 70 | |
East |
| 1 |
| 50 | |
Southwest |
| 1 |
| 30 | |
Total |
| 11 |
| $ | 875 |
Numerous Others: Market is extremely fragmented with small regional players
16
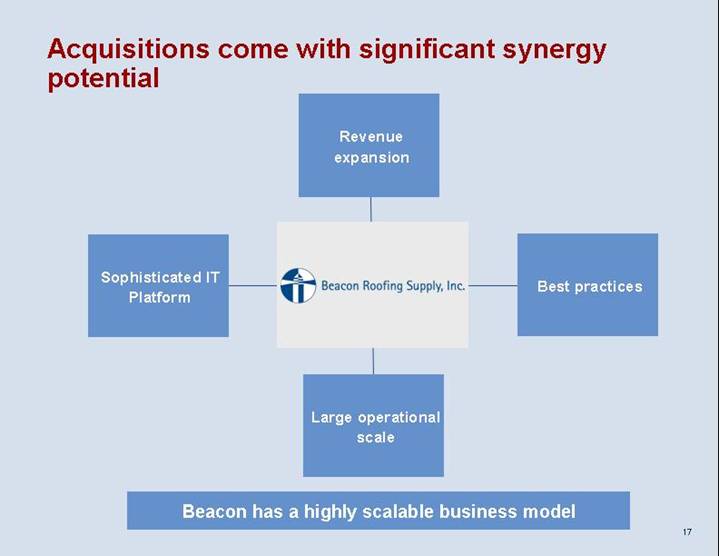
Acquisitions come with significant synergy potential
| Revenue |
|
|
|
|
Sophisticated IT | [LOGO] | Best practices |
|
|
|
| Large operational |
|
Beacon has a highly scalable business model
17
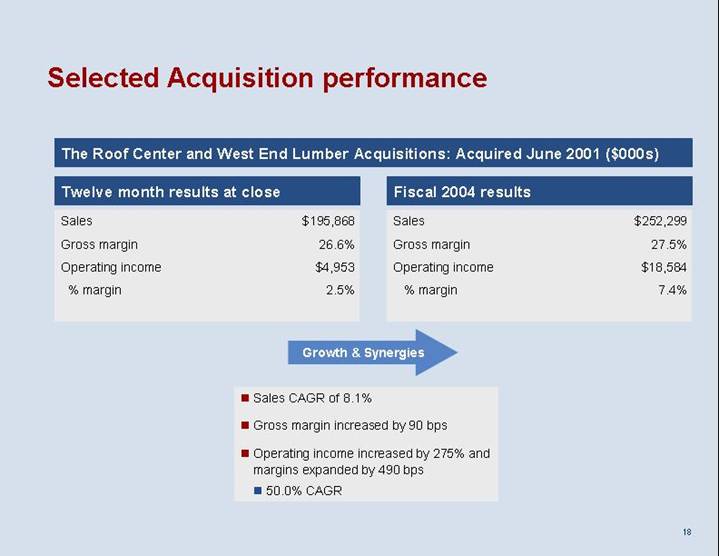
Selected Acquisition performance
The Roof Center and West End Lumber Acquisitions: Acquired June 2001 ($000s)
Twelve month results at close
Sales |
| $ | 195,868 |
|
Gross margin |
| 26.6 | % | |
Operating income |
| $ | 4,953 |
|
% margin |
| 2.5 | % | |
Fiscal 2004 results
Sales |
| $ | 252,299 |
|
Gross margin |
| 27.5 | % | |
Operating income |
| $ | 18,584 |
|
% margin |
| 7.4 | % | |
Growth & Synergies
• | Sales CAGR of 8.1% | |
• | Gross margin increased by 90 bps | |
• | Operating income increased by 275% and margins expanded by 490 bps | |
| • | 50.0% CAGR |
18
[LOGO]
Financial overview
David Grace
Chief Financial Officer
19
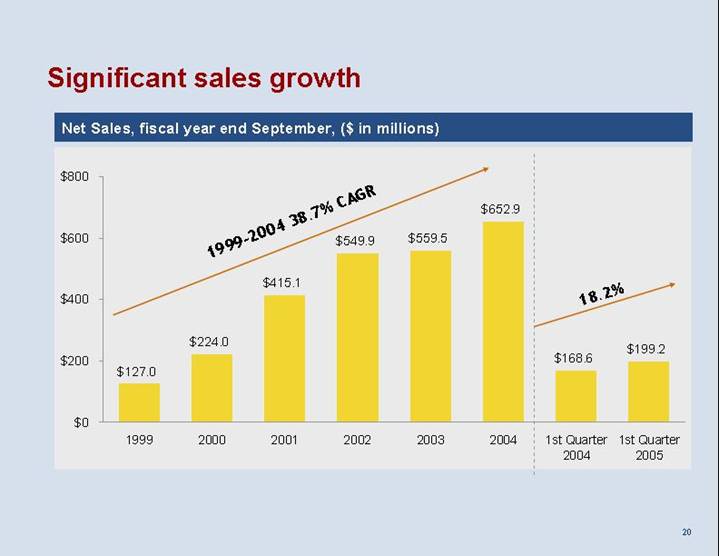
Significant sales growth
Net Sales, fiscal year end September, ($ in millions)
[CHART]
20
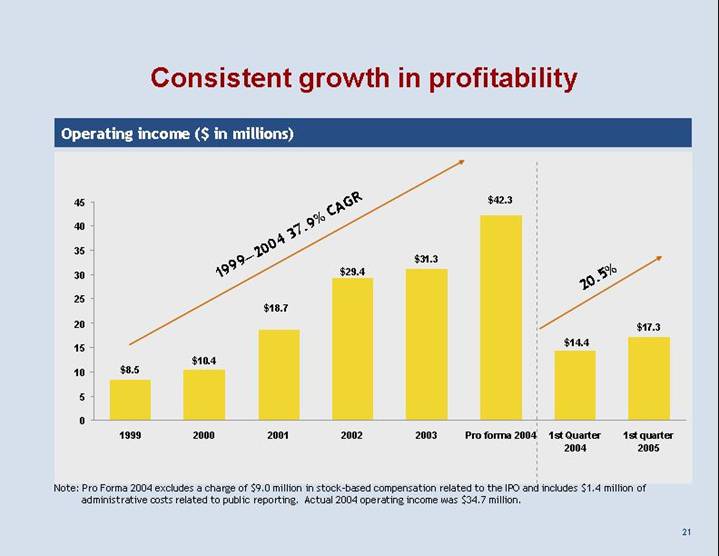
Consistent growth in profitability
Operating income ($ in millions)
[CHART]
Note: Pro Forma 2004 excludes a charge of $9.0 million in stock-based compensation related to the IPO and includes $1.4 million of administrative costs related to public reporting. Actual 2004 operating income was $34.7 million.
21
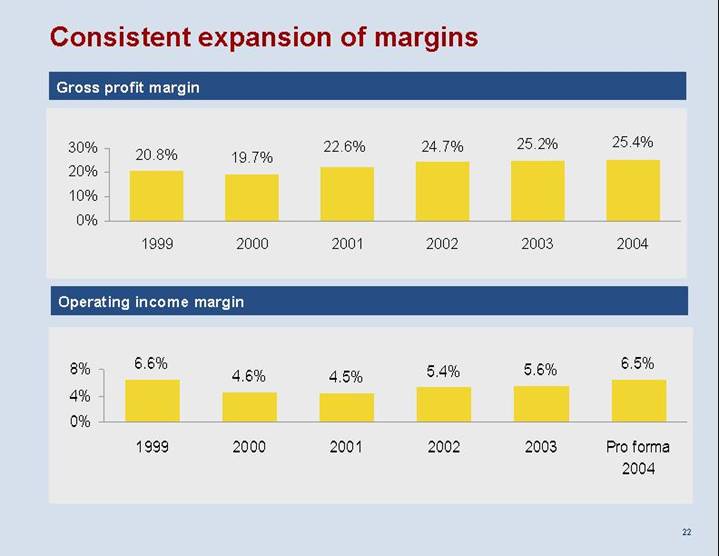
Consistent expansion of margins
Gross profit margin
[CHART]
Operating income margin
[CHART]
22
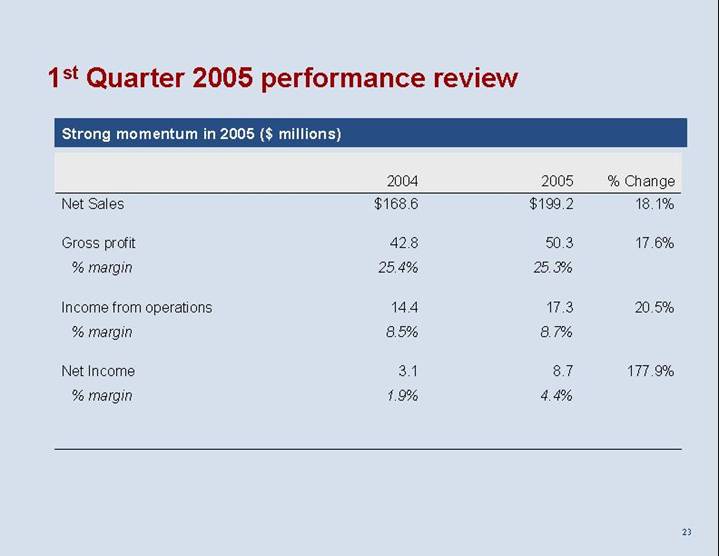
1st Quarter 2005 performance review
Strong momentum in 2005 ($ millions)
|
| 2004 |
| 2005 |
| % Change |
| ||
Net Sales |
| $ | 168.6 |
| $ | 199.2 |
| 18.1 | % |
|
|
|
|
|
|
|
| ||
Gross profit |
| 42.8 |
| 50.3 |
| 17.6 | % | ||
% margin |
| 25.4 | % | 25.3 | % |
|
| ||
|
|
|
|
|
|
|
| ||
Income from operations |
| 14.4 |
| 17.3 |
| 20.5 | % | ||
% margin |
| 8.5 | % | 8.7 | % |
|
| ||
|
|
|
|
|
|
|
| ||
Net Income |
| 3.1 |
| 8.7 |
| 177.9 | % | ||
% margin |
| 1.9 | % | 4.4 | % |
|
| ||
23
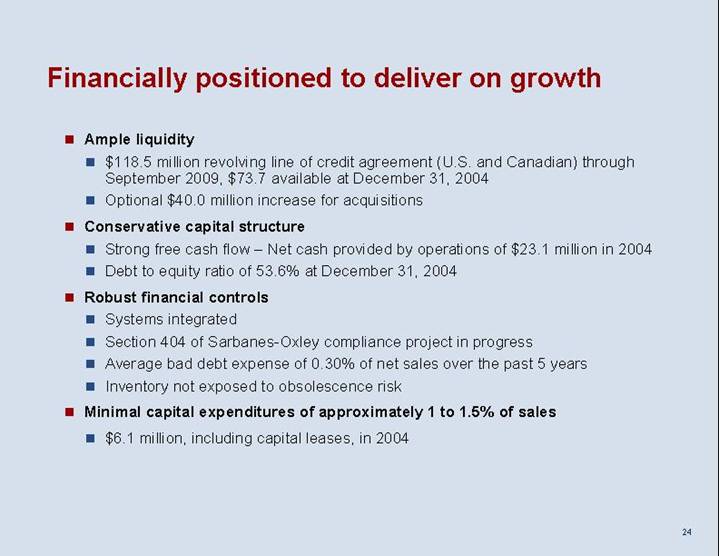
Financially positioned to deliver on growth
• | Ample liquidity | |
| • | $118.5 million revolving line of credit agreement (U.S. and Canadian) through September 2009, $73.7 available at December 31, 2004 |
| • | Optional $40.0 million increase for acquisitions |
|
|
|
• | Conservative capital structure | |
| • | Strong free cash flow – Net cash provided by operations of $23.1 million in 2004 |
| • | Debt to equity ratio of 53.6% at December 31, 2004 |
|
|
|
• | Robust financial controls | |
| • | Systems integrated |
| • | Section 404 of Sarbanes-Oxley compliance project in progress |
| • | Average bad debt expense of 0.30% of net sales over the past 5 years |
| • | Inventory not exposed to obsolescence risk |
|
|
|
• | Minimal capital expenditures of approximately 1 to 1.5% of sales | |
| • | $6.1 million, including capital leases, in 2004 |
24
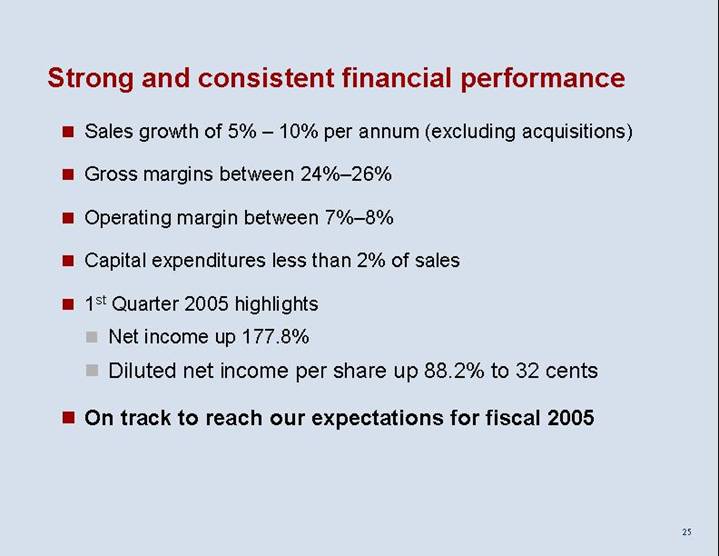
Strong and consistent financial performance
• | Sales growth of 5% – 10% per annum (excluding acquisitions) | |
• | Gross margins between 24%–26% | |
• | Operating margin between 7%–8% | |
• | Capital expenditures less than 2% of sales | |
• | 1st Quarter 2005 highlights | |
| • | Net income up 177.8% |
| • | Diluted net income per share up 88.2% to 32 cents |
• | On track to reach our expectations for fiscal 2005 | |
25
Company of substance
|
| Benchmarking |
|
|
|
|
|
|
|
Fundamentals |
|
|
| Culture |
|
|
|
|
|
|
| [LOGO] |
|
|
|
|
|
|
|
Forecasting & |
|
|
| Excellent Track |
|
|
|
|
|
|
| Routines |
|
|
26
Why invest in Beacon?
• | High value-added distributor performing a critical role in the roofing supply chain | |
|
| |
• | Market leader in an attractive, growing and fragmented industry | |
|
| |
• | Highly scalable platform and proven business model with minimal capital expenditures | |
|
| |
• | Superior financial performance highlighted by attractive growth and margins | |
| • | Historical 5 year sales CAGR: 38.7% |
| • | 1st Quarter 2005 organic sales growth: 15.8% |
| • | Industry leading operating margins: 6.5% |
|
| |
• | Results oriented management, corporate culture and controls | |
27