Exhibit 99.2
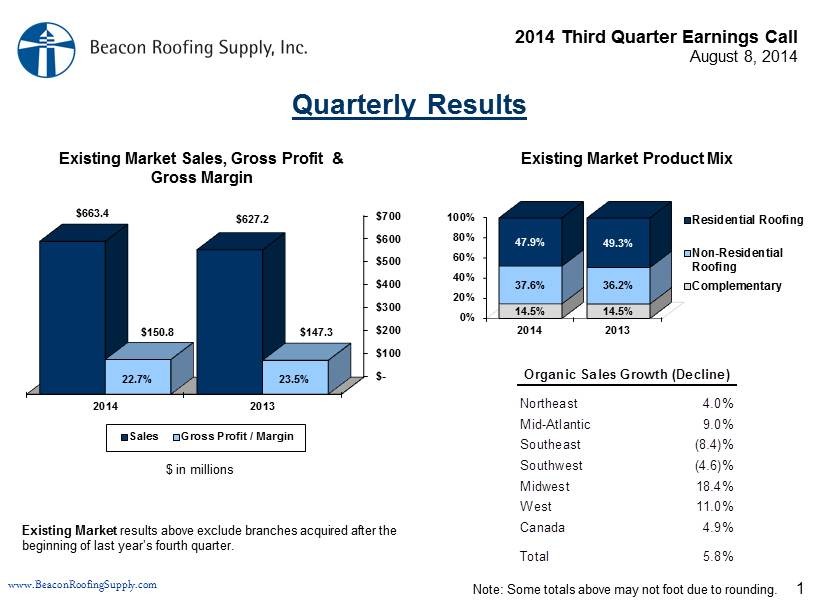
2014 Third Quarter Earnings Call August 8, 2014 www.BeaconRoofingSupply.com 0% 20% 40% 60% 80% 100% 2014 2013 14.5% 14.5% 37.6% 36.2% 47.9% 49.3% Residential Roofing Non-Residential Roofing Complementary $- $100 $200 $300 $400 $500 $600 $700 2014 2013 $663.4 $627.2 $150.8 $147.3 Sales Gross Profit / Margin 1 Quarterly Results Existing Market Product Mix Northeast 4.0% Mid-Atlantic 9.0% Southeast (8.4)% Southwest (4.6)% Midwest 18.4% West 11.0% Canada 4.9% Total 5.8% Organic Sales Growth (Decline) $ in millions Existing Market results above exclude branches acquired after the beginning of last year’s fourth quarter. 23.5% Existing Market Sales, Gross Profit & Gross Margin 22.7% Note: Some totals above may not foot due to rounding.
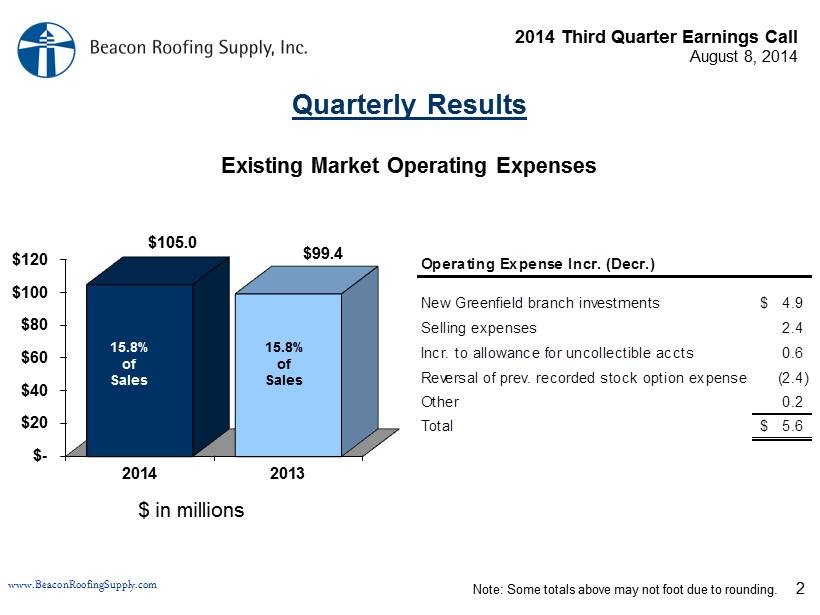
2014 Third Quarter Earnings Call August 8, 2014 www.BeaconRoofingSupply.com 2 $ in millions 15.5% of Sales $- $20 $40 $60 $80 $100 $120 2014 2013 $105.0 $99.4 15.8% of Sales 15.8% of Sales Existing Market Operating Expenses Quarterly Results New Greenfield branch investments 4.9$ Selling expenses 2.4 Incr. to allowance for uncollectible accts 0.6 Reversal of prev. recorded stock option expense (2.4) Other 0.2 Total 5.6$ Operating Expense Incr. (Decr.) Note: Some totals above may not foot due to rounding.
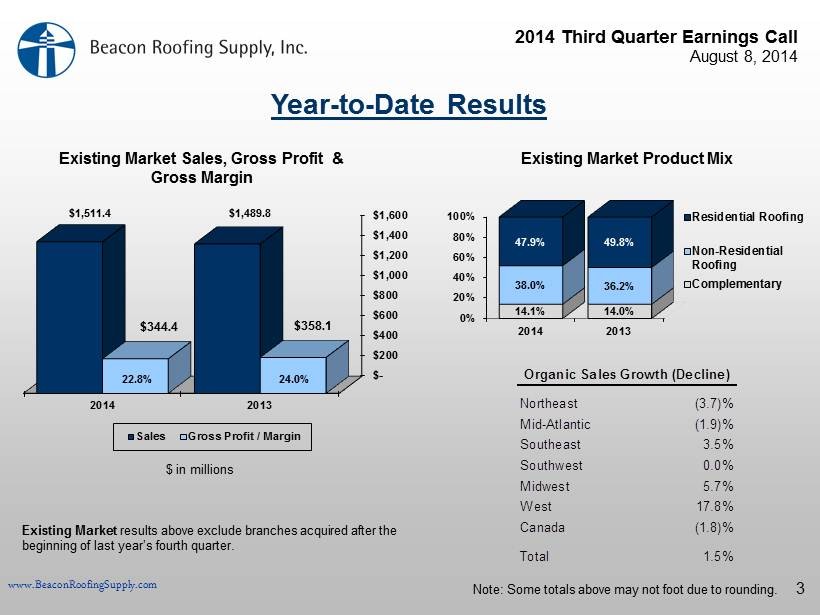
2014 Third Quarter Earnings Call August 8, 2014 www.BeaconRoofingSupply.com 0% 20% 40% 60% 80% 100% 2014 2013 14.1% 14.0% 38.0% 36.2% 47.9% 49.8% Residential Roofing Non-Residential Roofing Complementary 3 Year - to - Date Results Northeast (3.7)% Mid-Atlantic (1.9)% Southeast 3.5% Southwest 0.0% Midwest 5.7% West 17.8% Canada (1.8)% Total 1.5% Organic Sales Growth (Decline) $ in millions Existing Market results above exclude branches acquired after the beginning of last year’s fourth quarter. 24.0% Existing Market Sales, Gross Profit & Gross Margin 22.8% Existing Market Product Mix Note: Some totals above may not foot due to rounding. $- $200 $400 $600 $800 $1,000 $1,200 $1,400 $1,600 2014 2013 $1,511.4 $1,489.8 $344.4 $358.1 Sales Gross Profit / Margin 24.0% 22.8%
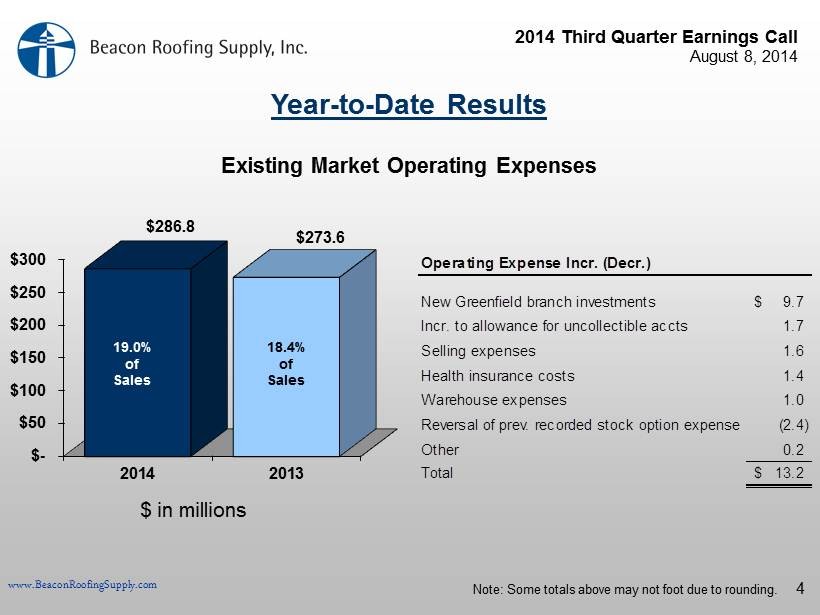
2014 Third Quarter Earnings Call August 8, 2014 www.BeaconRoofingSupply.com 4 $ in millions 15.5% of Sales $- $50 $100 $150 $200 $250 $300 2014 2013 $286.8 $273.6 19.0% of Sales 18.4% of Sales Existing Market Operating Expenses Year - to - Date Results New Greenfield branch investments 9.7$ Incr. to allowance for uncollectible accts 1.7 Selling expenses 1.6 Health insurance costs 1.4 Warehouse expenses 1.0 Reversal of prev. recorded stock option expense (2.4) Other 0.2 Total 13.2$ Operating Expense Incr. (Decr.) Note: Some totals above may not foot due to rounding.
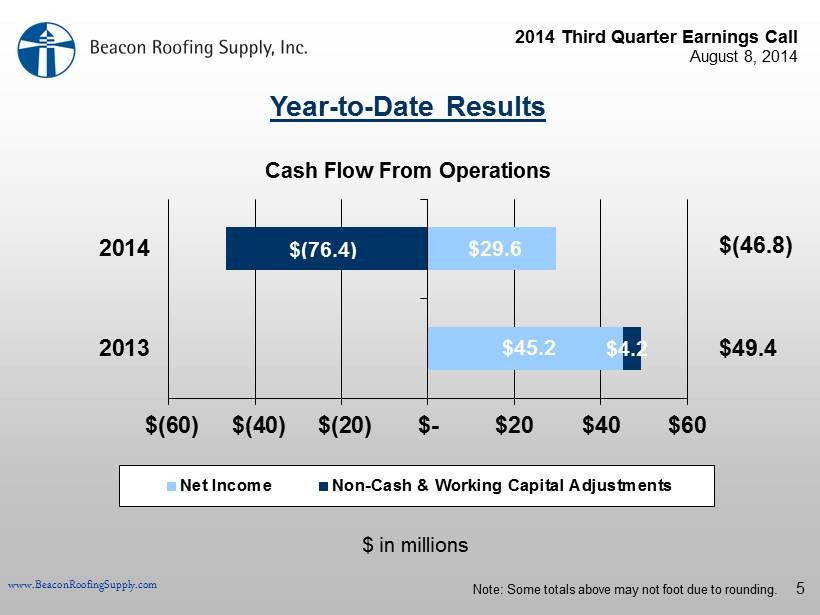
2014 Third Quarter Earnings Call August 8, 2014 www.BeaconRoofingSupply.com $45.2 $29.6 $(60) $(40) $(20) $- $20 $40 $60 2013 2014 Net Income Non-Cash & Working Capital Adjustments $(76.4) $4.2 5 $(46.8) $49.4 $ in millions Cash Flow From Operations Year - to - Date Results Note: Some totals above may not foot due to rounding.