Exhibit 99.1
| Encore Acquisition Company Analyst Meeting Tuesday, March 4, 2008 NYSE: EAC www.encoreacq.com NYSE: ENP www.encoreenp.com |
| Forward-Looking Statements This presentation includes forward-looking statements, which give our current expectations or forecasts of future events based on currently available information. Forward-looking statements are any statements that are not historical facts, including, without limitation, expected oil and natural gas production, the amount of original oil in place at our fields, the potential value of our reserves, reserve potential or upside, reserves by location, estimated decline rates, expected cash flows, expected revenues and expenses, projected differentials, expected capital expenditures (including location and amounts), rates of return, our ability to develop various plays (including the Bakken, Madison and New Mexico plays), our ability to maintain our rig program, our ability to bring CO2 to the Cedar Creek Anticline or Bell Creek and the benefits therefrom, future drilling locations and the benefits and costs associated therewith, the impact of the net profits interest, benefits of acquisitions, net asset values (in the aggregate and on a per share basis), analyst expectations for 2008 and beyond, our ability to pay down debt, the benefits of a master limited partnership, the ability of Encore Energy Partners LP to raise its distribution, the ability of Encore Energy Partners to maintain production for 10 years, and the cost and benefits of the stock repurchase program and derivative financial instruments. The assumptions of management and the future performance of our business are subject to a wide range of business risks and uncertainties and there is no assurance that these statements and projections will be met. Factors that could affect Our business include, but are not limited to: the risks associated with drilling of oil and natural gas wells; Our ability to find, acquire, market, develop, and produce new properties; the risk associated with exploratory and development drilling programs; oil and natural gas price volatility; derivative transactions (including the costs associated therewith); uncertainties in the estimation of proved, probable, and potential reserves and in the projection of future rates of production and reserve growth; inaccuracies in Our assumptions regarding items of income and expense and the level of capital expenditures; uncertainties in the timing of exploitation expenditures; operating hazards attendant to the oil and natural gas business; drilling and completion losses that are generally not recoverable from third parties or insurance; potential mechanical failure or underperformance of significant wells; climatic conditions; availability and cost of material and equipment; the risks associated with operating in a limited number of geographic areas; actions or inactions of third-party operators of Our properties; Our ability to find and retain skilled personnel; diversion of management's attention from existing operations while pursuing acquisitions; availability of capital; the strength and financial resources of Our competitors; regulatory developments; environmental risks; uncertainties in the capital markets; uncertainties with respect to asset sales; general economic and business conditions; industry trends; and other factors detailed in the most recent Form 10-K of Encore Acquisition Company and Encore Energy Partners LP, and other filings with the Securities and Exchange Commission (SEC). If one or more of these risks or uncertainties materialize (or the consequences of such a development changes), or should underlying assumptions prove incorrect, actual outcomes may vary materially from those forecasted or expected. We undertake no obligation to publicly update or revise any forward-looking statements. The SEC permits oil and natural gas entities, in their filings with the SEC, to disclose only proved reserves that have demonstrated by actual production or conclusive formation tests to be economically and legally producible under existing economic and operating conditions. We use certain terms in this presentation such as "potential", "unbooked", "unrisked", "upside", or other descriptions of volumes of reserves potentially recoverable through additional drilling or recovery techniques (such as waterfloods and high-pressure air) that the SEC's guidelines would prohibit us from including in filings with the SEC. These estimates are by their nature more speculative than estimates of proved reserves and, accordingly, are subject to substantially greater risk of being actually realized by us. Investors are urged to consider closely the disclosure in our Form 10-K, File No. 1-16295, available from us at Encore Acquisition Company, 777 Main Street, Suite 1400, Fort Worth, Texas 76102, Attention: Corporate Secretary. You can also obtain the Form 10-K on the SEC's website at www.sec.gov. |
| Encore Strategic Team I. Jon Brumley Chairman of the Board of Directors Jon S. Brumley Chief Executive Officer and President Bob Reeves Sr. Vice President, Chief Financial Officer and Treasurer Ben Nivens Sr. Vice President and Chief Operating Officer John Arms Sr. Vice President, Acquisitions Phil Devlin Sr. Vice President, General Counsel and Corporate Secretary Kevin Treadway Sr. Vice President, Land Tom Olle Vice President, Strategic Solutions Andy Lowe Vice President, Marketing Bill Francis Vice President, Southern Region Greg Barnes Vice President, Northern Region John Barnes Vice President, Drilling Operations Diane Weaver Vice President, Investor Relations Andrea Hunter Vice President and Controller Bill Pardue MLP Assets Manager Jennifer Palko Reserves and Planning Manager Bob Sutherland Manager of Reservoir Studies Bud Holmes Production Engineer Manager Dave Grahek Senior Technical Advisor - Geology |
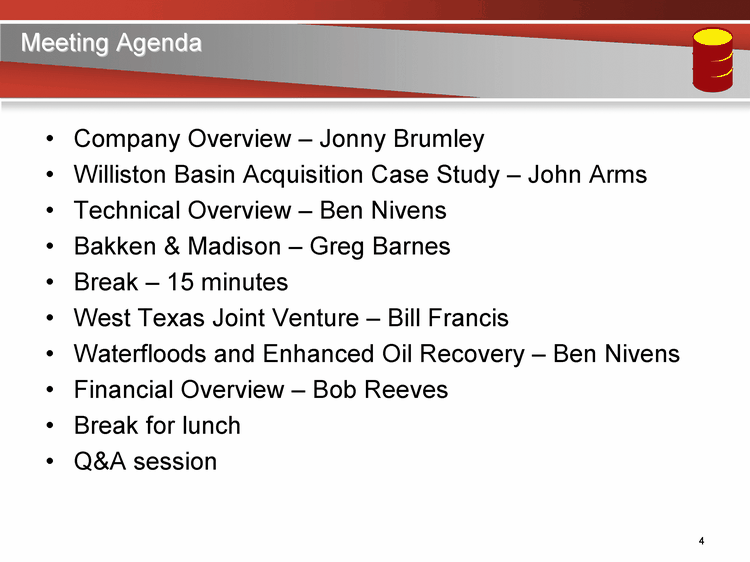
| Meeting Agenda Company Overview - Jonny Brumley Williston Basin Acquisition Case Study - John Arms Technical Overview - Ben Nivens Bakken & Madison - Greg Barnes Break - 15 minutes West Texas Joint Venture - Bill Francis Waterfloods and Enhanced Oil Recovery - Ben Nivens Financial Overview - Bob Reeves Break for lunch Q&A session |
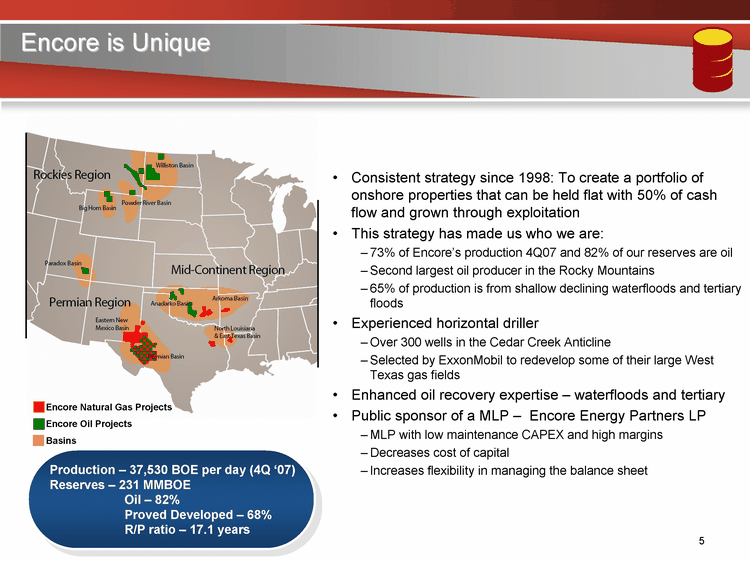
| Encore is Unique Consistent strategy since 1998: To create a portfolio of onshore properties that can be held flat with 50% of cash flow and grown through exploitation This strategy has made us who we are: 73% of Encore's production 4Q07 and 82% of our reserves are oil Second largest oil producer in the Rocky Mountains 65% of production is from shallow declining waterfloods and tertiary floods Experienced horizontal driller Over 300 wells in the Cedar Creek Anticline Selected by ExxonMobil to redevelop some of their large West Texas gas fields Enhanced oil recovery expertise - waterfloods and tertiary Public sponsor of a MLP - Encore Energy Partners LP MLP with low maintenance CAPEX and high margins Decreases cost of capital Increases flexibility in managing the balance sheet Encore Natural Gas Projects Encore Oil Projects Basins Production - 37,530 BOE per day (4Q '07) Reserves - 231 MMBOE Oil - 82% Proved Developed - 68% R/P ratio - 17.1 years |
| Encore is Innovative Beginning in 2006, Encore focused on increasing its inventory through joint ventures, farm outs, and acquisitions Plays must be low risk and high impact Growth layered on top of flat waterflood and tertiary asset base We have been successful North Dakota Bakken Shale play Grew from 34,000 net acres in April of 2007 to 155,000 net acres today Dropped drilling costs from $5.1 million to $3.9 million - expertise Building inventory for a 3 to 4 rig program for 2009 Madison play Detail remapping of old fields and uncovered 85 locations - expertise First well drilled is a 500,000 barrel well for $3.1 million West Texas JV with ExxonMobil Due to horizontal drilling expertise Encore was selected by ExxonMobil to redevelop some of the huge Mobil gas fields in West Texas 22 million barrels of development potential |
| Encore's 2007 Plan Return to Rocky Mountain oil roots Rejuvenate the development inventory Divest of non-core properties to allow Encore to be more predictable and meet or beat guidance Delever from acquisitions |
| The plan worked Repositioned the company to focus on core competencies and steady growth Big Horn Basin Acquisition - Rockies oil production Williston Basin Acquisition - Rockies oil production Grew 2007 production 20% over 2006 Divested Anadarko Basin deep natural gas properties where the spud to sales was too long and CAPEX was too high Beat guidance all four quarters Deleveraging program worked Sold high capital cost gas properties for $300 million Delevered with $200 million MLP offering Reduced debt-to-EBITDAX from a peak of 4.1x in 1Q07 down to 1.8x in 4Q07 Created lower cost of capital by creating the first C-Corp sponsored upstream MLP 2007 plan implementation |
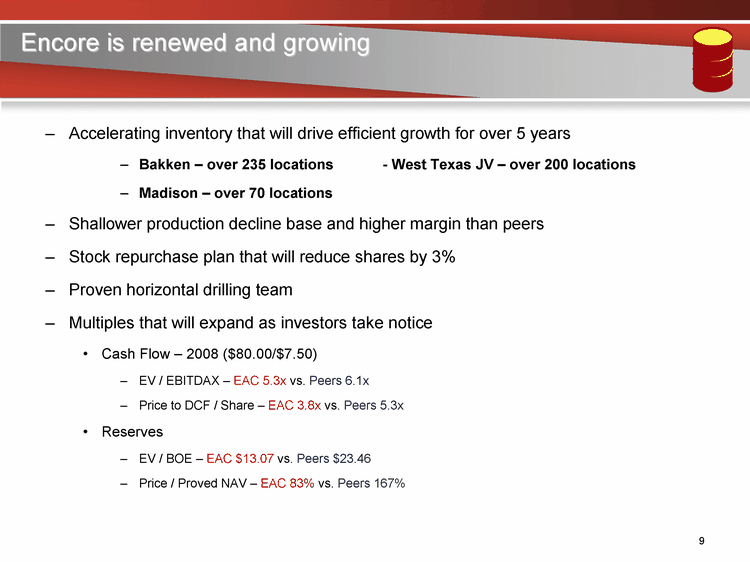
| Encore is renewed and growing Accelerating inventory that will drive efficient growth for over 5 years Bakken - over 235 locations - West Texas JV - over 200 locations Madison - over 70 locations Shallower production decline base and higher margin than peers Stock repurchase plan that will reduce shares by 3% Proven horizontal drilling team Multiples that will expand as investors take notice Cash Flow - 2008 ($80.00/$7.50) EV / EBITDAX - EAC 5.3x vs. Peers 6.1x Price to DCF / Share - EAC 3.8x vs. Peers 5.3x Reserves EV / BOE - EAC $13.07 vs. Peers $23.46 Price / Proved NAV - EAC 83% vs. Peers 167% |
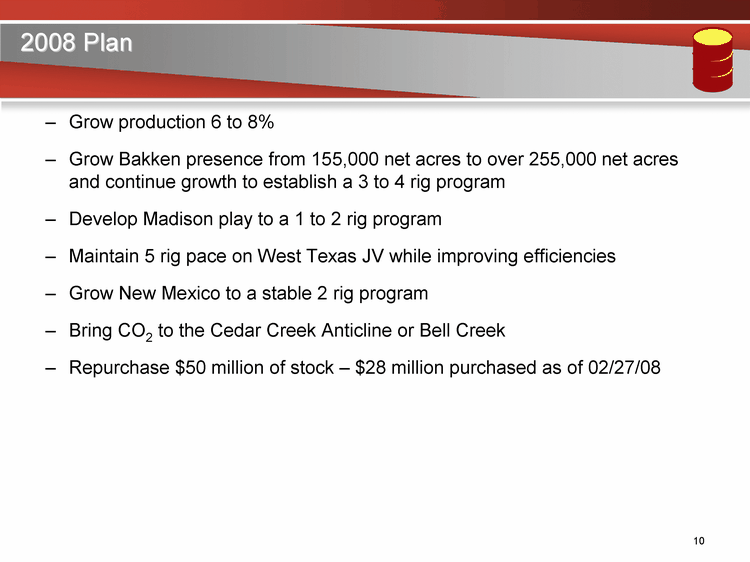
| 2008 Plan Grow production 6 to 8% Grow Bakken presence from 155,000 net acres to over 255,000 net acres and continue growth to establish a 3 to 4 rig program Develop Madison play to a 1 to 2 rig program Maintain 5 rig pace on West Texas JV while improving efficiencies Grow New Mexico to a stable 2 rig program Bring CO2 to the Cedar Creek Anticline or Bell Creek Repurchase $50 million of stock - $28 million purchased as of 02/27/08 |
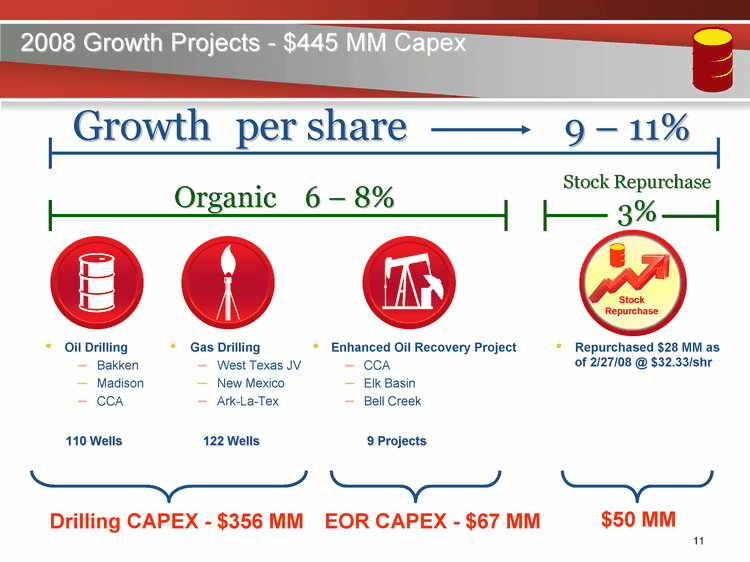
| 2008 Growth Projects - $445 MM Capex Enhanced Oil Recovery Project CCA Elk Basin Bell Creek Oil Drilling Bakken Madison CCA CCA CCA CCA CCA Gas Drilling West Texas JV New Mexico Ark-La-Tex Organic 6 - 8% Drilling CAPEX - $356 MM EOR CAPEX - $67 MM 110 Wells 122 Wells 9 Projects Stock Repurchase Stock Repurchase 3% $50 MM Repurchased $28 MM as of 2/27/08 @ $32.33/shr Growth per share 9 - 11% |
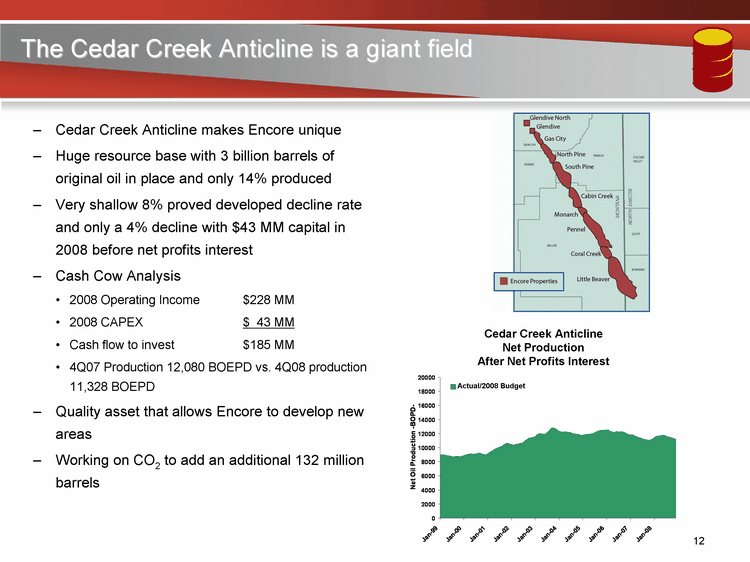
| Cedar Creek Anticline makes Encore unique Huge resource base with 3 billion barrels of original oil in place and only 14% produced Very shallow 8% proved developed decline rate and only a 4% decline with $43 MM capital in 2008 before net profits interest Cash Cow Analysis 2008 Operating Income $228 MM 2008 CAPEX $ 43 MM Cash flow to invest $185 MM 4Q07 Production 12,080 BOEPD vs. 4Q08 production 11,328 BOEPD Quality asset that allows Encore to develop new areas Working on CO2 to add an additional 132 million barrels The Cedar Creek Anticline is a giant field Cedar Creek Anticline Net Production After Net Profits Interest Actual/2008 Budget |
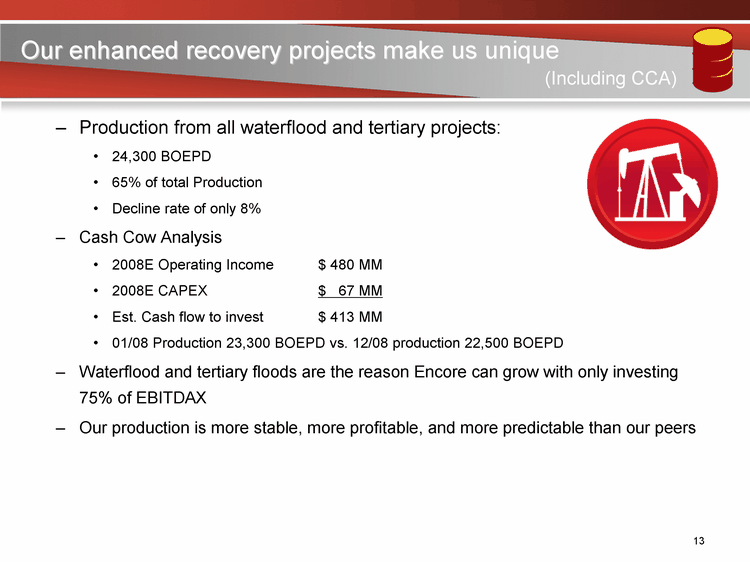
| Our enhanced recovery projects make us unique Production from all waterflood and tertiary projects: 24,300 BOEPD 65% of total Production Decline rate of only 8% Cash Cow Analysis 2008E Operating Income $ 480 MM 2008E CAPEX $ 67 MM Est. Cash flow to invest $ 413 MM 01/08 Production 23,300 BOEPD vs. 12/08 production 22,500 BOEPD Waterflood and tertiary floods are the reason Encore can grow with only investing 75% of EBITDAX Our production is more stable, more profitable, and more predictable than our peers (Including CCA) |
| Low risk investment theme with steady growth Budgeted discretionary cash flow is $506 million at $80.00 oil and $7.50 gas Why $445 million capital budget? Manageable level that will allow for efficient implementation Reliable projects that make growth predictable Good growth of 6% to 8% per share that is inside of cash flow Accelerating inventory in 2009 Repurchase $50 million of stock to reduce share count by 3% Growth of 9% to 11% per share Hedging strategy protects cash flow in 2008 and 2009 100% @ $81.29 to the downside in 2008 with only 27% @ $93.18 capped to the upside 80% @ $81.13 to the downside in 2009 with only 25% @ $90.36 capped to the upside |
| Presentation Outline Williston Basin Acquisition Case Study Bakken Madison West Texas Joint Venture Waterfloods and Enhanced Oil Recovery Projects Financial Overview |
| Encore Acquisition Company Williston Basin Case Study John Arms NYSE: EAC www.encoreacq.com NYSE: ENP www.encoreenp.com |
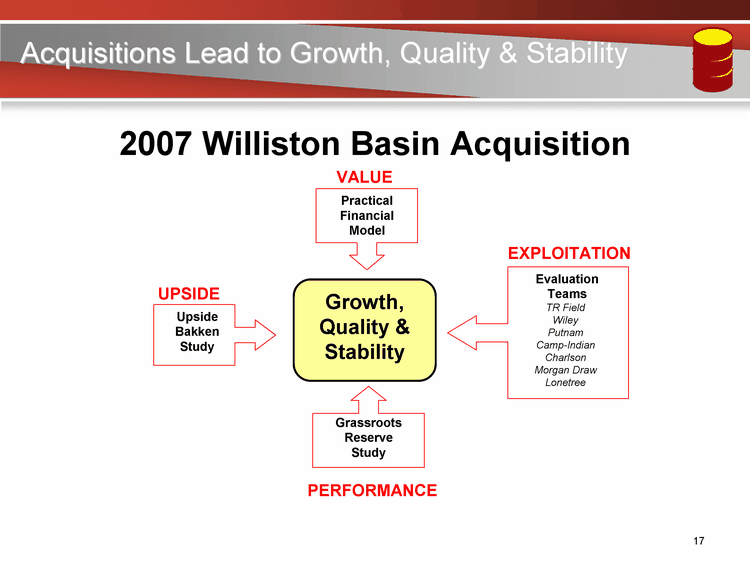
| Acquisitions Lead to Growth, Quality & Stability 2007 Williston Basin Acquisition Growth, Quality & Stability Grassroots Reserve Study PDP Value Practical Financial Model Upside Bakken Study Evaluation Teams TR Field Wiley Putnam Camp-Indian Charlson Morgan Draw Lonetree VALUE PERFORMANCE UPSIDE EXPLOITATION |
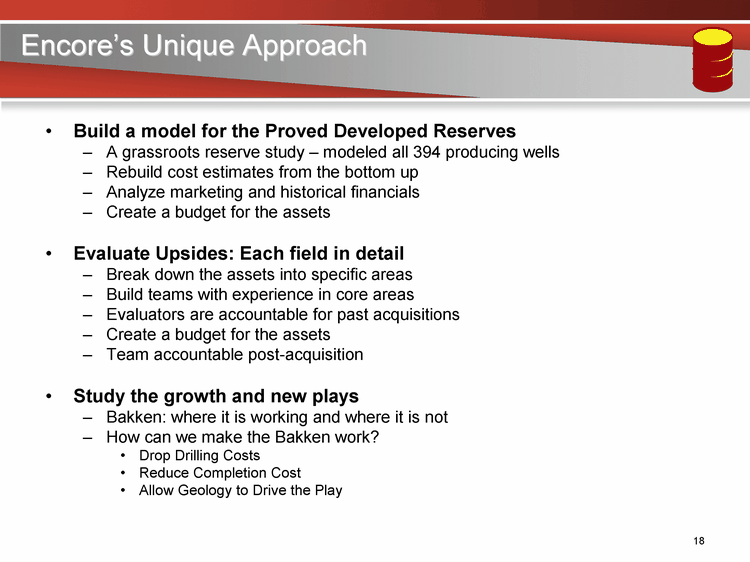
| Encore's Unique Approach Build a model for the Proved Developed Reserves A grassroots reserve study - modeled all 394 producing wells Rebuild cost estimates from the bottom up Analyze marketing and historical financials Create a budget for the assets Evaluate Upsides: Each field in detail Break down the assets into specific areas Build teams with experience in core areas Evaluators are accountable for past acquisitions Create a budget for the assets Team accountable post-acquisition Study the growth and new plays Bakken: where it is working and where it is not How can we make the Bakken work? Drop Drilling Costs Reduce Completion Cost Allow Geology to Drive the Play |
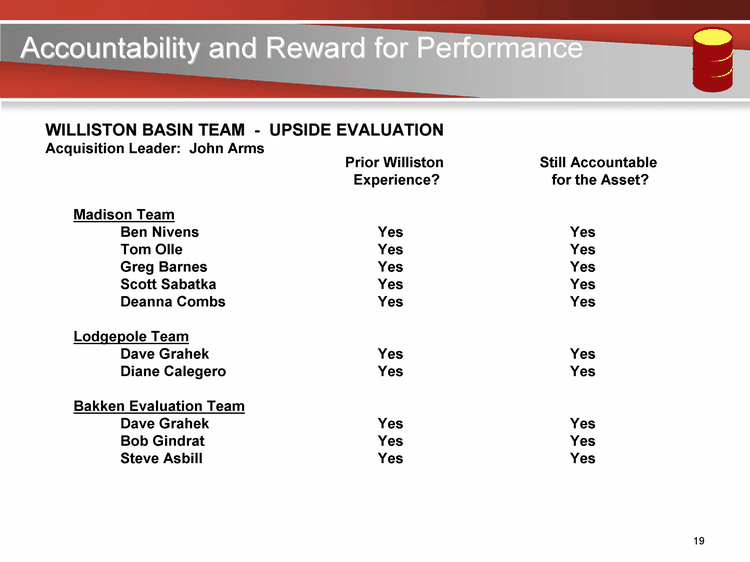
| Accountability and Reward for Performance WILLISTON BASIN TEAM - UPSIDE EVALUATION Acquisition Leader: John Arms Prior Williston Still Accountable Experience? for the Asset? Madison Team Ben Nivens Yes Yes Tom Olle Yes Yes Greg Barnes Yes Yes Scott Sabatka Yes Yes Deanna Combs Yes Yes Lodgepole Team Dave Grahek Yes Yes Diane Calegero Yes Yes Bakken Evaluation Team Dave Grahek Yes Yes Bob Gindrat Yes Yes Steve Asbill Yes Yes |
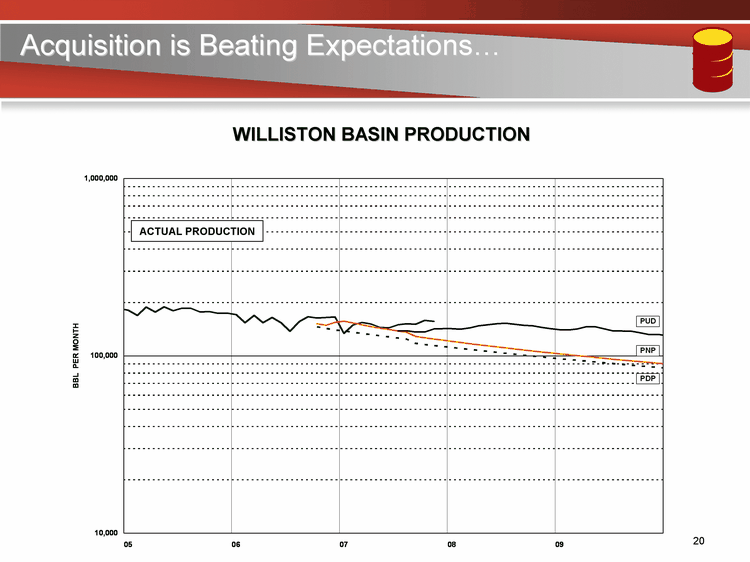
| Acquisition is Beating Expectations... Acquisition is Beating Expectations... WILLISTON BASIN PRODUCTION ACTUAL PRODUCTION |
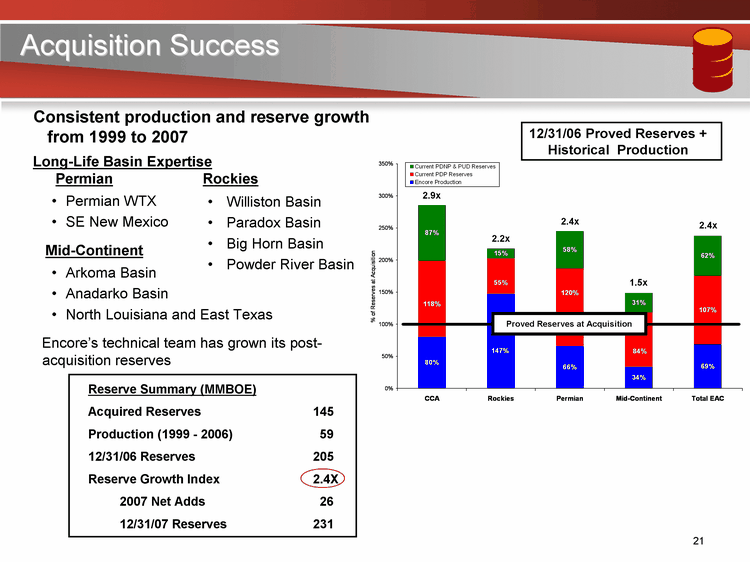
| Permian WTX SE New Mexico Arkoma Basin Anadarko Basin North Louisiana and East Texas Encore's technical team has grown its post- acquisition reserves Long-Life Basin Expertise Williston Basin Paradox Basin Big Horn Basin Powder River Basin 12/31/06 Proved Reserves + Historical Production Proved Reserves at Acquisition 2.4x 1.5x 2.4x 2.2x 2.9x Reserve Summary (MMBOE) Acquired Reserves 145 Production (1999 - 2006) 59 12/31/06 Reserves 205 Reserve Growth Index 2.4X 2007 Net Adds 26 12/31/07 Reserves 231 Permian Mid-Continent Rockies Consistent production and reserve growth from 1999 to 2007 Acquisition Success |
| Encore Acquisition Company Technical Overview Ben Nivens NYSE: EAC www.encoreacq.com NYSE: ENP www.encoreenp.com |
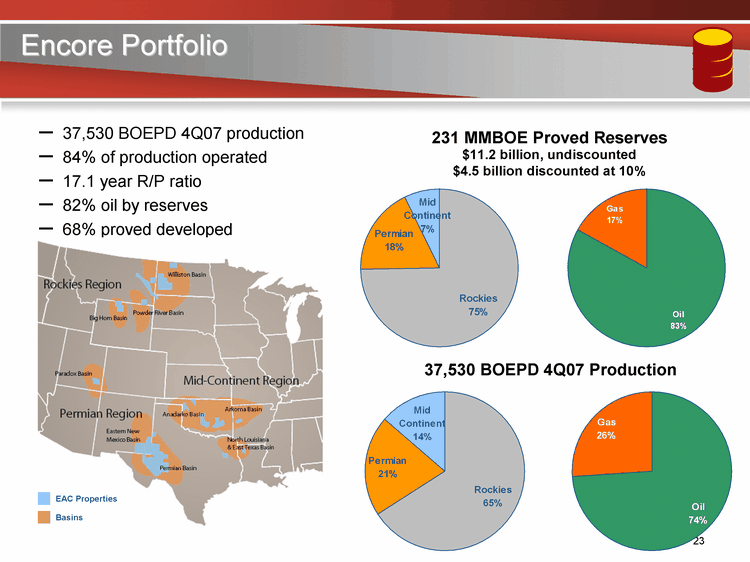
| Encore Portfolio 37,530 BOEPD 4Q07 production 84% of production operated 17.1 year R/P ratio 82% oil by reserves 68% proved developed EAC Properties Basins Oil Gas Reserves 83 17 Oil Gas Production 74 26 Rockies Permian Mid Continent Reserves 169.781 40.887 16.567 Rockies Permian Mid Continent Production 24329 7594 4994 231 MMBOE Proved Reserves $11.2 billion, undiscounted $4.5 billion discounted at 10% 37,530 BOEPD 4Q07 Production |
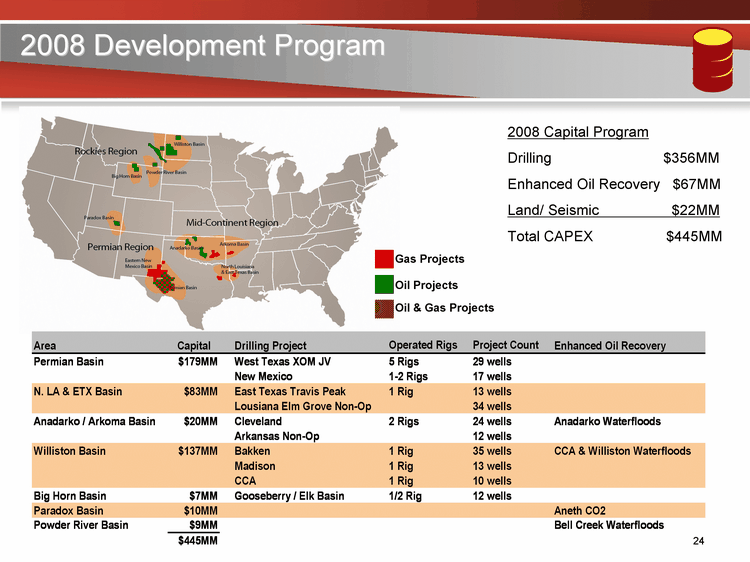
| 2008 Development Program Gas Projects Oil Projects Oil & Gas Projects 2008 Capital Program Drilling $356MM Enhanced Oil Recovery $67MM Land/ Seismic $22MM Total CAPEX $445MM Total CAPEX $445MM Total CAPEX $445MM Total CAPEX $445MM Total CAPEX $445MM Total CAPEX $445MM |
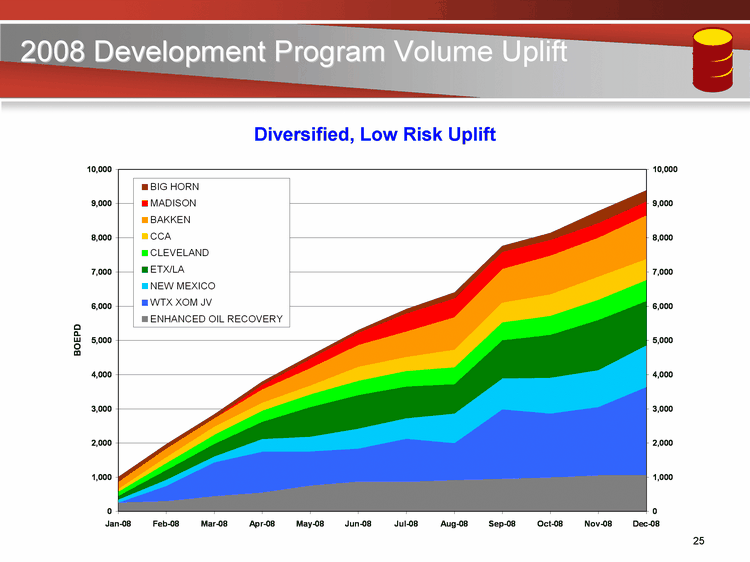
| 2008 Development Program Volume Uplift Diversified, Low Risk Uplift Diversified, Low Risk Uplift |
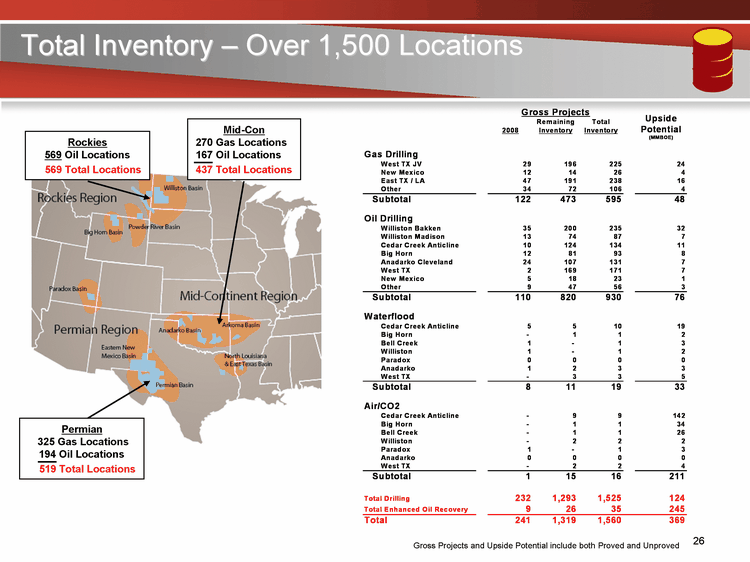
| Total Inventory - Over 1,500 Locations Total Inventory - Over 1,500 Locations Permian 325 Gas Locations 194 Oil Locations 519 Total Locations Rockies 569 Oil Locations 569 Total Locations Mid-Con 270 Gas Locations 167 Oil Locations 437 Total Locations Gross Projects and Upside Potential include both Proved and Unproved |
| Encore Acquisition Company Bakken Greg Barnes NYSE: EAC www.encoreacq.com NYSE: ENP www.encoreenp.com |
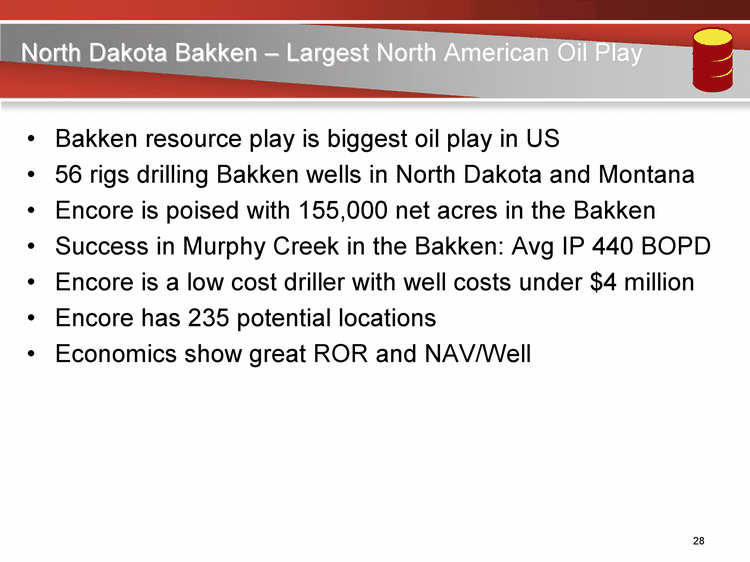
| North Dakota Bakken - Largest North American Oil Play Bakken resource play is biggest oil play in US 56 rigs drilling Bakken wells in North Dakota and Montana Encore is poised with 155,000 net acres in the Bakken Success in Murphy Creek in the Bakken: Avg IP 440 BOPD Encore is a low cost driller with well costs under $4 million Encore has 235 potential locations Economics show great ROR and NAV/Well |
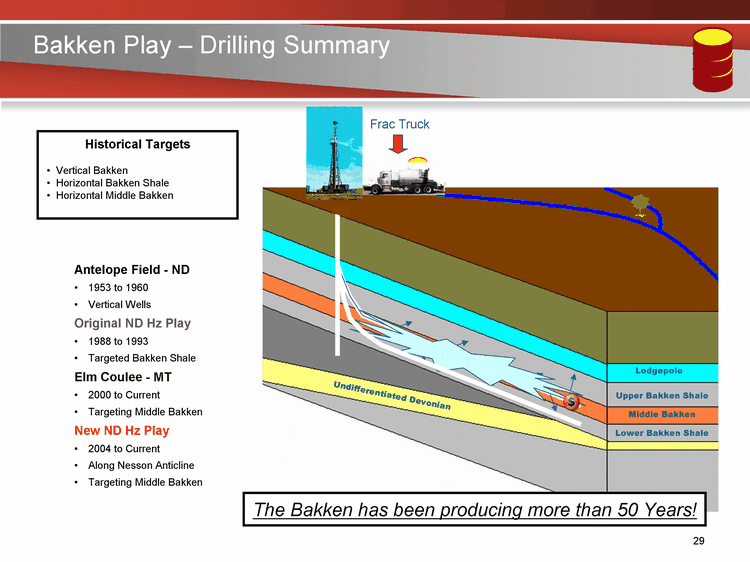
| Lodgepole Upper Bakken Shale Middle Bakken Lower Bakken Shale Undifferentiated Devonian Undifferentiated Devonian Bakken Play - Drilling Summary Historical Targets Vertical Bakken Horizontal Bakken Shale Horizontal Middle Bakken Frac Truck Antelope Field - ND 1953 to 1960 Vertical Wells Original ND Hz Play 1988 to 1993 Targeted Bakken Shale Elm Coulee - MT 2000 to Current Targeting Middle Bakken New ND Hz Play 2004 to Current Along Nesson Anticline Targeting Middle Bakken The Bakken has been producing more than 50 Years! |
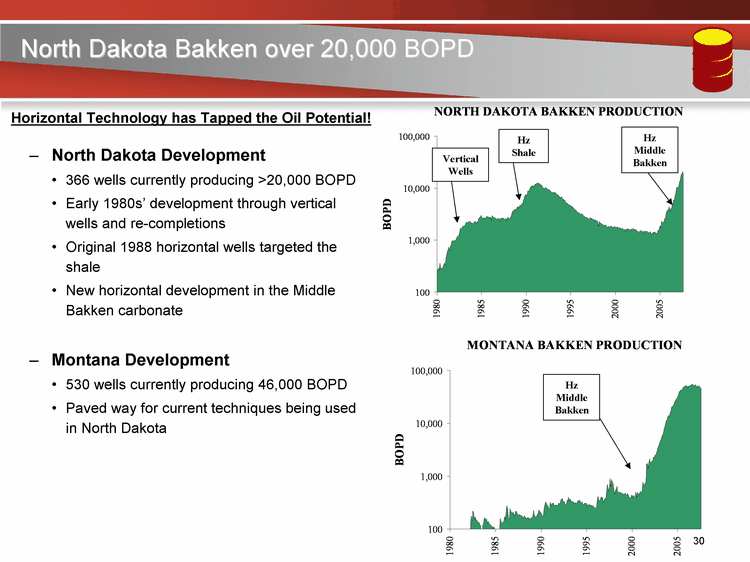
| North Dakota Bakken over 20,000 BOPD North Dakota Development 366 wells currently producing >20,000 BOPD Early 1980s' development through vertical wells and re-completions Original 1988 horizontal wells targeted the shale New horizontal development in the Middle Bakken carbonate Montana Development 530 wells currently producing 46,000 BOPD Paved way for current techniques being used in North Dakota Horizontal Technology has Tapped the Oil Potential! Vertical Wells Hz Shale Hz Middle Bakken Hz Middle Bakken |
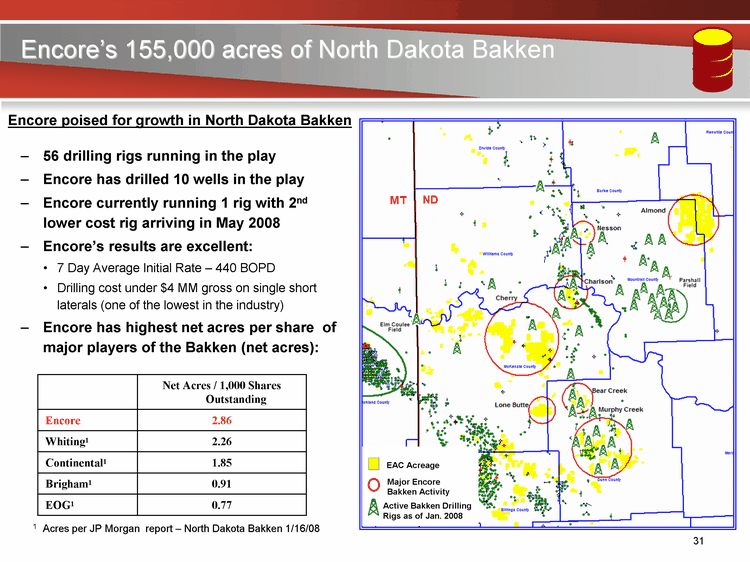
| Encore's 155,000 acres of North Dakota Bakken 56 drilling rigs running in the play Encore has drilled 10 wells in the play Encore currently running 1 rig with 2nd lower cost rig arriving in May 2008 Encore's results are excellent: 7 Day Average Initial Rate - 440 BOPD Drilling cost under $4 MM gross on single short laterals (one of the lowest in the industry) Encore has highest net acres per share of major players of the Bakken (net acres): Encore poised for growth in North Dakota Bakken 1 Acres per JP Morgan report - North Dakota Bakken 1/16/08 Net Acres / 1,000 Shares Outstanding Encore 2.86 Whiting1 2.26 Continental1 1.85 Brigham1 0.91 EOG1 0.77 EAC Acreage Major Encore Bakken Activity Active Bakken Drilling Rigs as of Jan. 2008 |
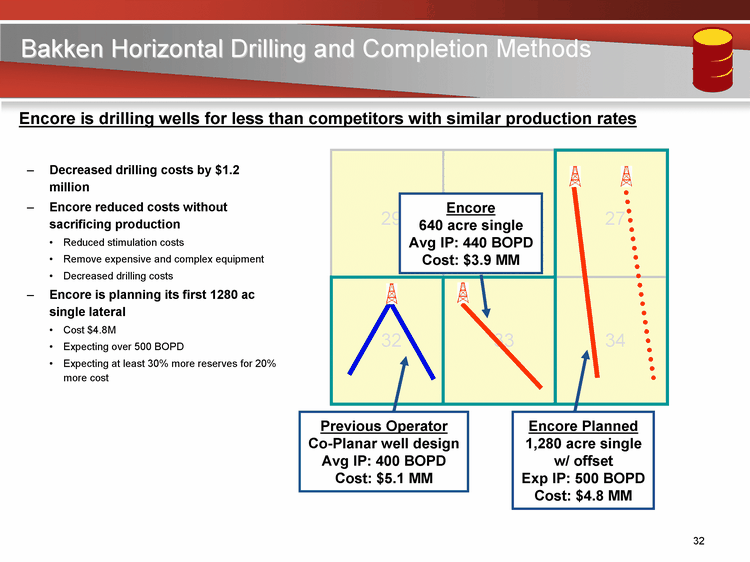
| Bakken Horizontal Drilling and Completion Methods 29 27 28 33 32 34 Decreased drilling costs by $1.2 million Encore reduced costs without sacrificing production Reduced stimulation costs Remove expensive and complex equipment Decreased drilling costs Encore is planning its first 1280 ac single lateral Cost $4.8M Expecting over 500 BOPD Expecting at least 30% more reserves for 20% more cost Encore is drilling wells for less than competitors with similar production rates Previous Operator Co-Planar well design Avg IP: 400 BOPD Cost: $5.1 MM Encore 640 acre single Avg IP: 440 BOPD Cost: $3.9 MM Encore Planned 1,280 acre single w/ offset Exp IP: 500 BOPD Cost: $4.8 MM |
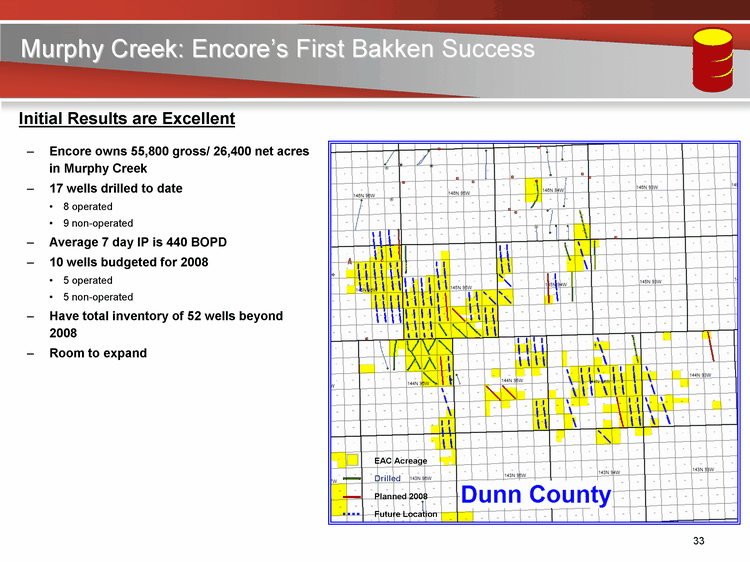
| Murphy Creek: Encore's First Bakken Success Encore owns 55,800 gross/ 26,400 net acres in Murphy Creek 17 wells drilled to date 8 operated 9 non-operated Average 7 day IP is 440 BOPD 10 wells budgeted for 2008 5 operated 5 non-operated Have total inventory of 52 wells beyond 2008 Room to expand Initial Results are Excellent Drilled Planned 2008 Future Location EAC Acreage |
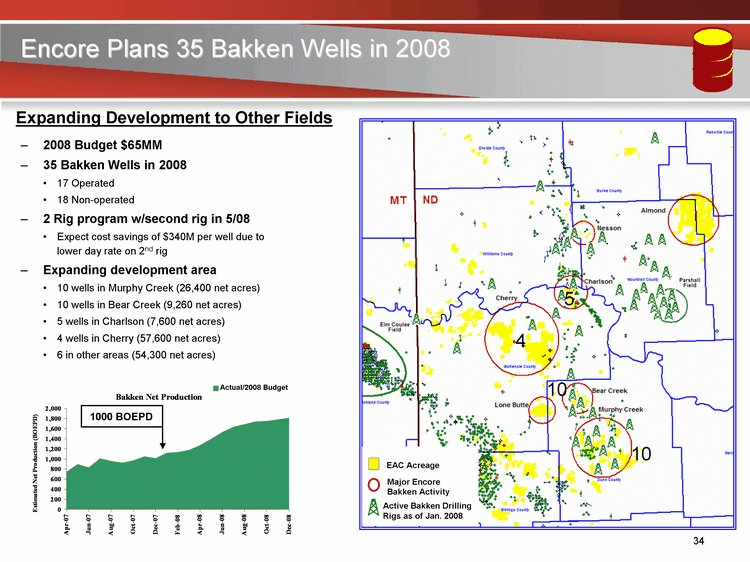
| EAC Acreage Major Encore Bakken Activity Active Bakken Drilling Rigs as of Jan. 2008 Encore Plans 35 Bakken Wells in 2008 2008 Budget $65MM 35 Bakken Wells in 2008 17 Operated 18 Non-operated 2 Rig program w/second rig in 5/08 Expect cost savings of $340M per well due to lower day rate on 2nd rig Expanding development area 10 wells in Murphy Creek (26,400 net acres) 10 wells in Bear Creek (9,260 net acres) 5 wells in Charlson (7,600 net acres) 4 wells in Cherry (57,600 net acres) 6 in other areas (54,300 net acres) Expanding Development to Other Fields Actual/2008 Budget 4 1000 BOEPD 10 10 5 |
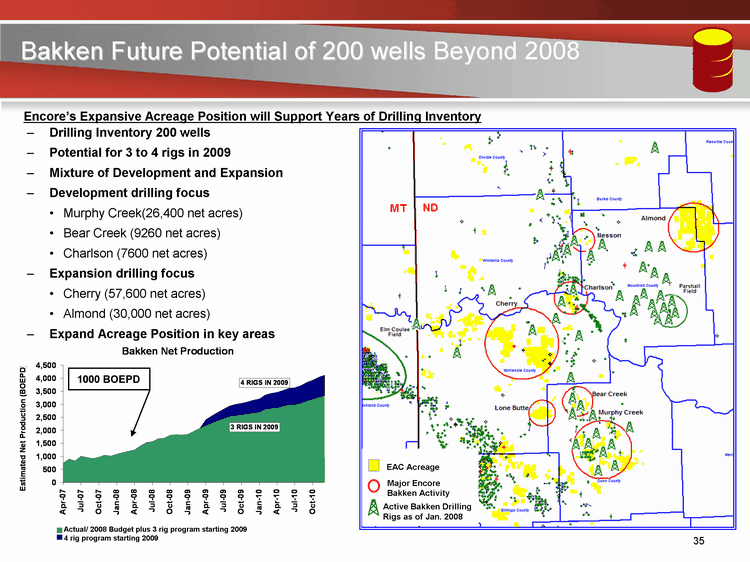
| Bakken Future Potential of 200 wells Beyond 2008 Drilling Inventory 200 wells Potential for 3 to 4 rigs in 2009 Mixture of Development and Expansion Development drilling focus Murphy Creek(26,400 net acres) Bear Creek (9260 net acres) Charlson (7600 net acres) Expansion drilling focus Cherry (57,600 net acres) Almond (30,000 net acres) Expand Acreage Position in key areas Encore's Expansive Acreage Position will Support Years of Drilling Inventory Actual/ 2008 Budget plus 3 rig program starting 2009 4 rig program starting 2009 1000 BOEPD EAC Acreage Major Encore Bakken Activity Active Bakken Drilling Rigs as of Jan. 2008 |
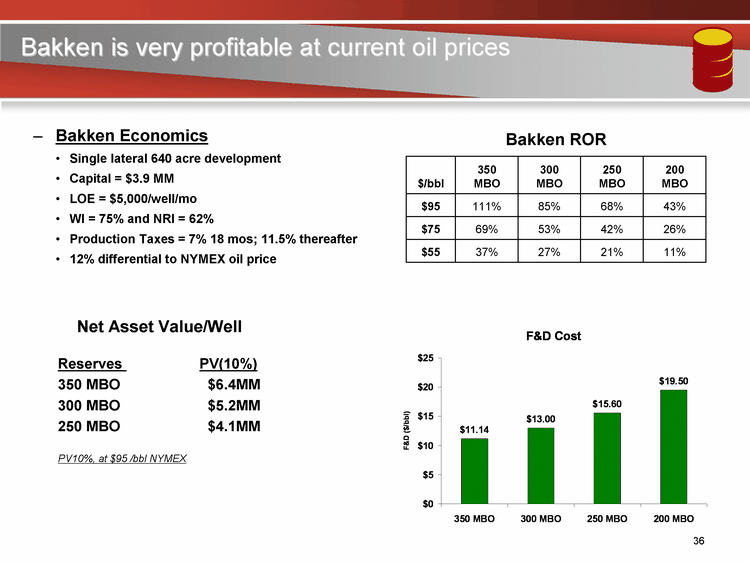
| Bakken is very profitable at current oil prices Bakken Economics Single lateral 640 acre development Capital = $3.9 MM LOE = $5,000/well/mo WI = 75% and NRI = 62% Production Taxes = 7% 18 mos; 11.5% thereafter 12% differential to NYMEX oil price Bakken ROR Net Asset Value/Well Reserves PV(10%) 350 MBO $6.4MM 300 MBO $5.2MM 250 MBO $4.1MM PV10%, at $95 /bbl NYMEX $/bbl 350 MBO 300 MBO 250 MBO 200 MBO $95 111% 85% 68% 43% $75 69% 53% 42% 26% $55 37% 27% 21% 11% |
| Encore Acquisition Company Madison Greg Barnes NYSE: EAC www.encoreacq.com NYSE: ENP www.encoreenp.com |
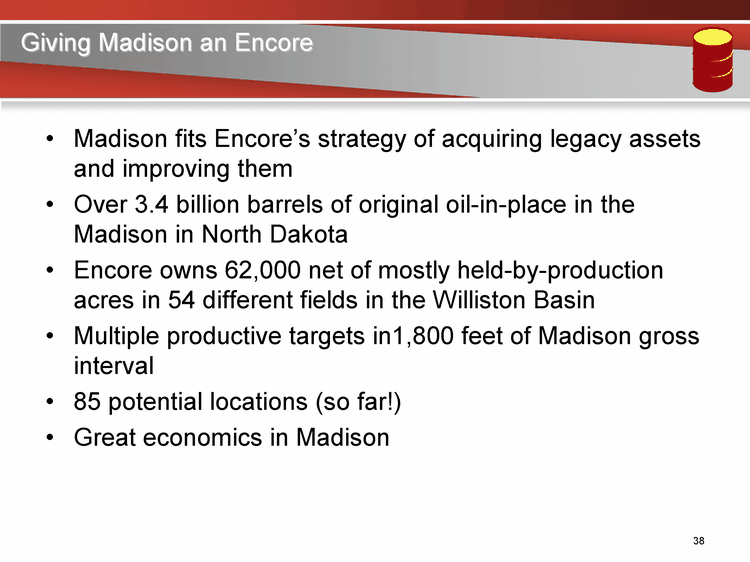
| Giving Madison an Encore Madison fits Encore's strategy of acquiring legacy assets and improving them Over 3.4 billion barrels of original oil-in-place in the Madison in North Dakota Encore owns 62,000 net of mostly held-by-production acres in 54 different fields in the Williston Basin Multiple productive targets in1,800 feet of Madison gross interval 85 potential locations (so far!) Great economics in Madison |
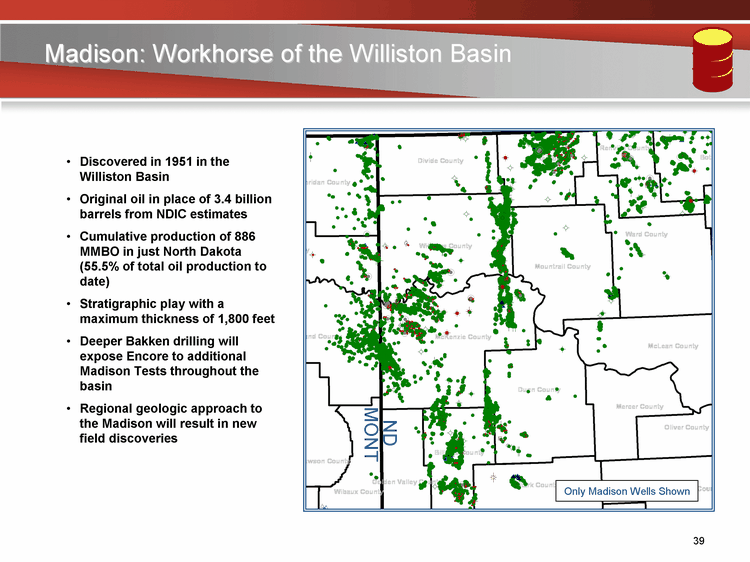
| ND MONT Only Madison Wells Shown Madison: Workhorse of the Williston Basin Discovered in 1951 in the Williston Basin Original oil in place of 3.4 billion barrels from NDIC estimates Cumulative production of 886 MMBO in just North Dakota (55.5% of total oil production to date) Stratigraphic play with a maximum thickness of 1,800 feet Deeper Bakken drilling will expose Encore to additional Madison Tests throughout the basin Regional geologic approach to the Madison will result in new field discoveries |
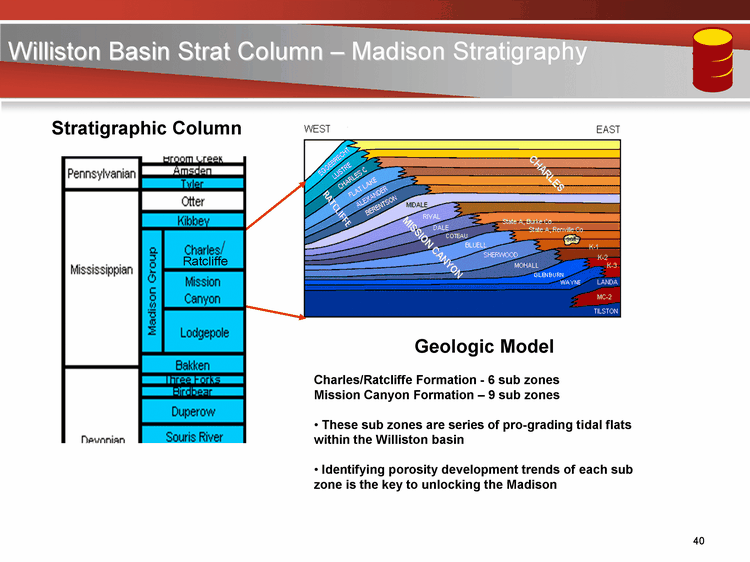
| Williston Basin Strat Column - Madison Stratigraphy Charles/Ratcliffe Formation - 6 sub zones Mission Canyon Formation - 9 sub zones These sub zones are series of pro-grading tidal flats within the Williston basin Identifying porosity development trends of each sub zone is the key to unlocking the Madison Geologic Model Geologic Model Geologic Model Ratcliffe / Stratigraphic Column |
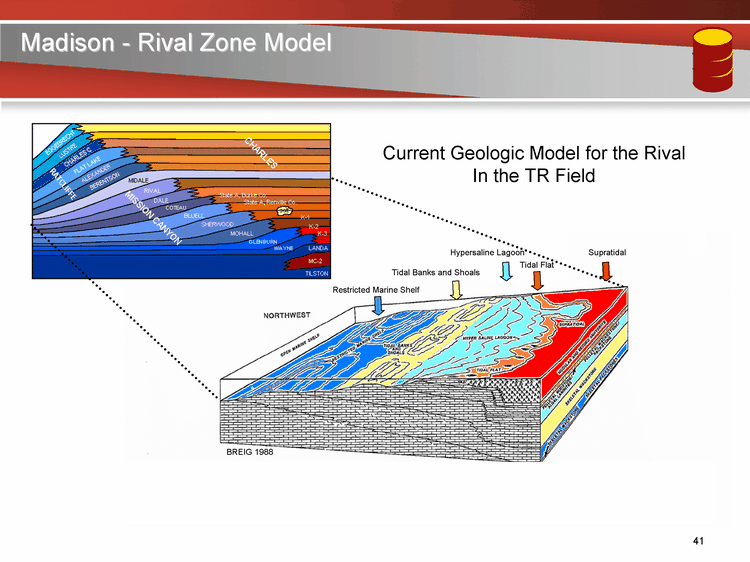
| Madison - Rival Zone Model Madison - Rival Zone Model Restricted Marine Shelf Hypersaline Lagoon Tidal Flat Supratidal Tidal Banks and Shoals Current Geologic Model for the Rival In the TR Field BREIG 1988 |
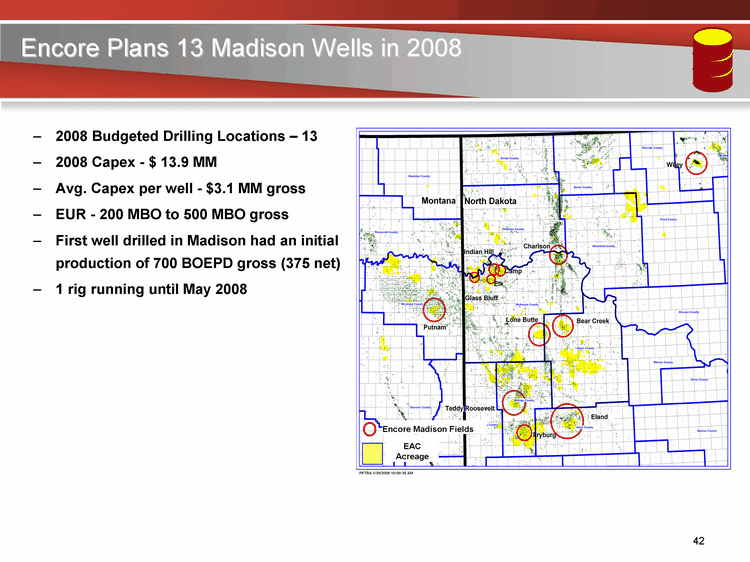
| Encore Plans 13 Madison Wells in 2008 2008 Budgeted Drilling Locations - 13 2008 Capex - $ 13.9 MM Avg. Capex per well - $3.1 MM gross EUR - 200 MBO to 500 MBO gross First well drilled in Madison had an initial production of 700 BOEPD gross (375 net) 1 rig running until May 2008 EAC Acreage Encore Madison Fields |
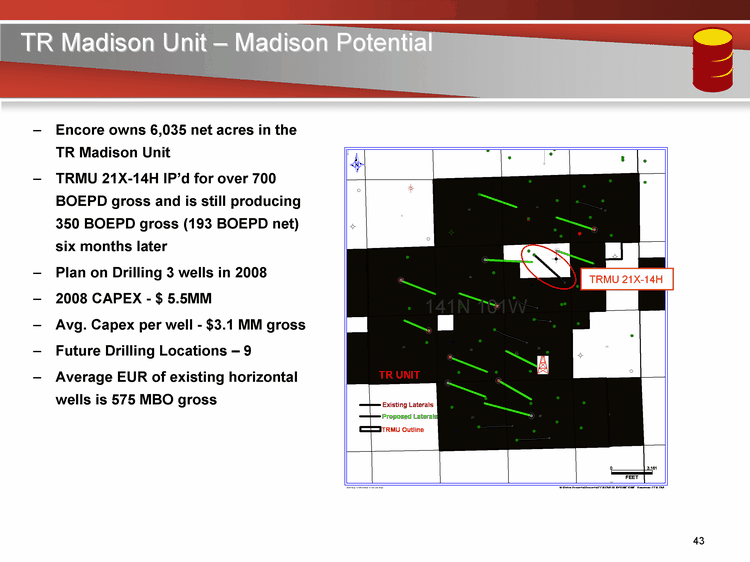
| TR Madison Unit - Madison Potential Encore owns 6,035 net acres in the TR Madison Unit TRMU 21X-14H IP'd for over 700 BOEPD gross and is still producing 350 BOEPD gross (193 BOEPD net) six months later Plan on Drilling 3 wells in 2008 2008 CAPEX - $ 5.5MM Avg. Capex per well - $3.1 MM gross Future Drilling Locations - 9 Average EUR of existing horizontal wells is 575 MBO gross wells is 575 MBO gross wells is 575 MBO gross wells is 575 MBO gross wells is 575 MBO gross wells is 575 MBO gross wells is 575 MBO gross wells is 575 MBO gross wells is 575 MBO gross wells is 575 MBO gross wells is 575 MBO gross wells is 575 MBO gross wells is 575 MBO gross TRMU 21X-14H TRMU 21X-14H |
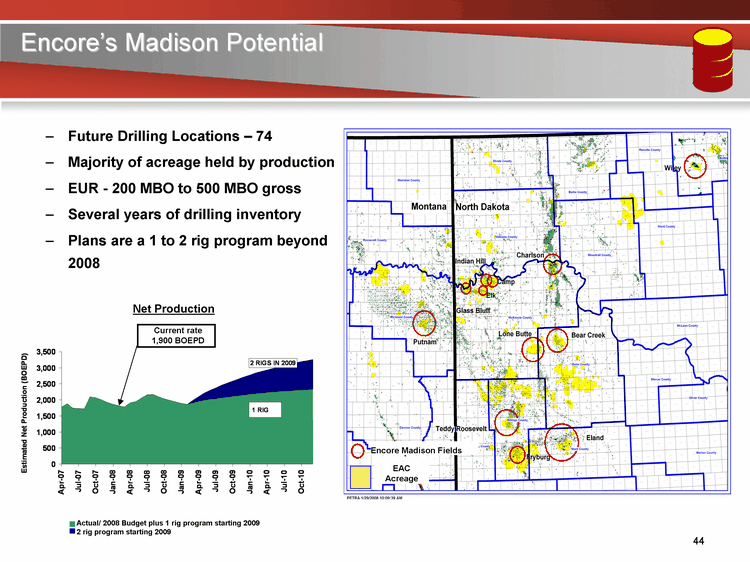
| Encore's Madison Potential Future Drilling Locations - 74 Majority of acreage held by production EUR - 200 MBO to 500 MBO gross Several years of drilling inventory Plans are a 1 to 2 rig program beyond 2008 Current rate 1,900 BOEPD Actual/ 2008 Budget plus 1 rig program starting 2009 2 rig program starting 2009 Net Production Net Production EAC Acreage Encore Madison Fields |
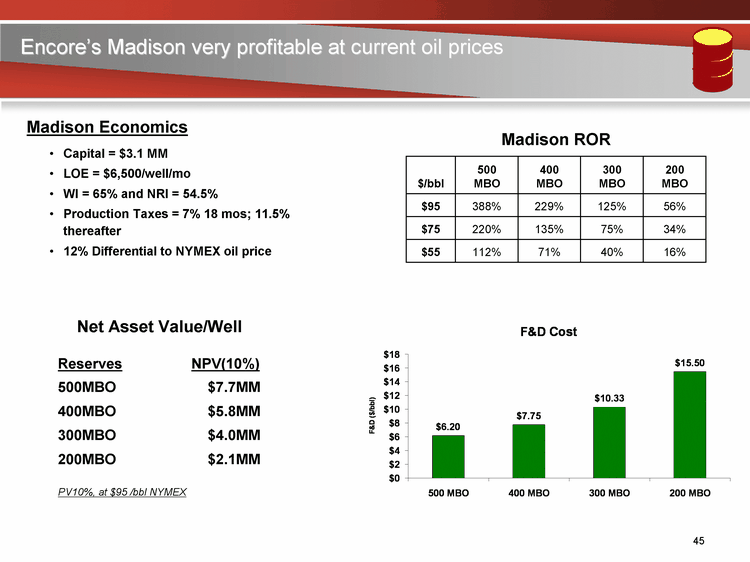
| Encore's Madison very profitable at current oil prices Capital = $3.1 MM LOE = $6,500/well/mo WI = 65% and NRI = 54.5% Production Taxes = 7% 18 mos; 11.5% thereafter 12% Differential to NYMEX oil price Madison Economics Madison ROR Net Asset Value/Well Reserves NPV(10%) 500MBO $7.7MM 400MBO $5.8MM 300MBO $4.0MM 200MBO $2.1MM PV10%, at $95 /bbl NYMEX $/bbl 500 MBO 400 MBO 300 MBO 200 MBO $95 388% 229% 125% 56% $75 220% 135% 75% 34% $55 112% 71% 40% 16% |

| Encore Acquisition Company West Texas Joint Venture Bill Francis NYSE: EAC www.encoreacq.com NYSE: ENP www.encoreenp.com |
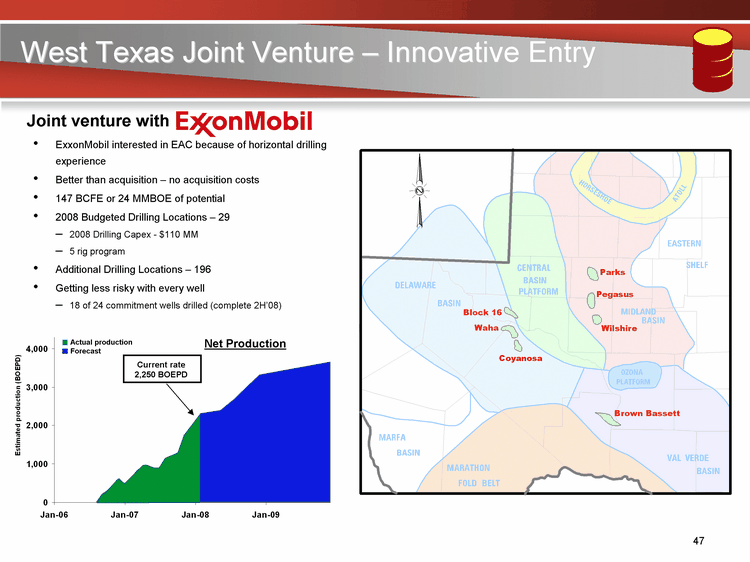
| West Texas Joint Venture - Innovative Entry Joint venture with ExxonMobil interested in EAC because of horizontal drilling experience Better than acquisition - no acquisition costs 147 BCFE or 24 MMBOE of potential 2008 Budgeted Drilling Locations - 29 2008 Drilling Capex - $110 MM 5 rig program Additional Drilling Locations - 196 Getting less risky with every well 18 of 24 commitment wells drilled (complete 2H'08) Current rate 2,250 BOEPD Actual production Forecast Net Production |
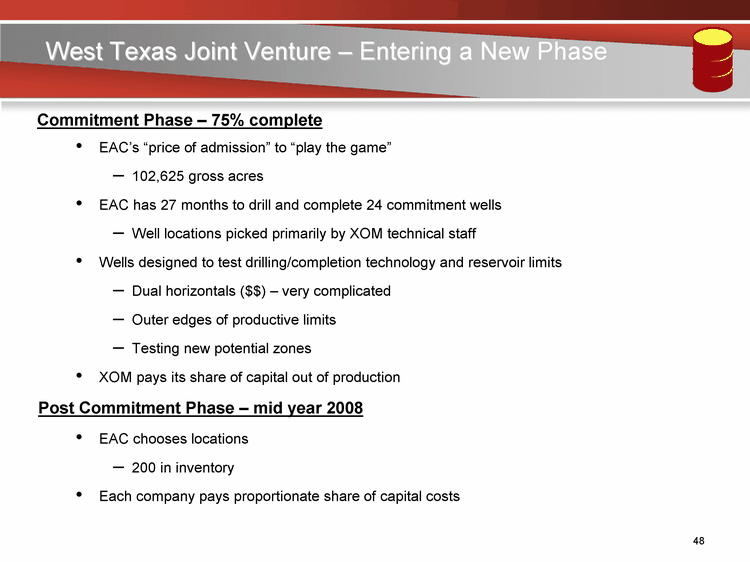
| EAC's "price of admission" to "play the game" 102,625 gross acres EAC has 27 months to drill and complete 24 commitment wells Well locations picked primarily by XOM technical staff Wells designed to test drilling/completion technology and reservoir limits Dual horizontals ($$) - very complicated Outer edges of productive limits Testing new potential zones XOM pays its share of capital out of production Post Commitment Phase - mid year 2008 EAC chooses locations 200 in inventory Each company pays proportionate share of capital costs Commitment Phase - 75% complete West Texas Joint Venture - Entering a New Phase |
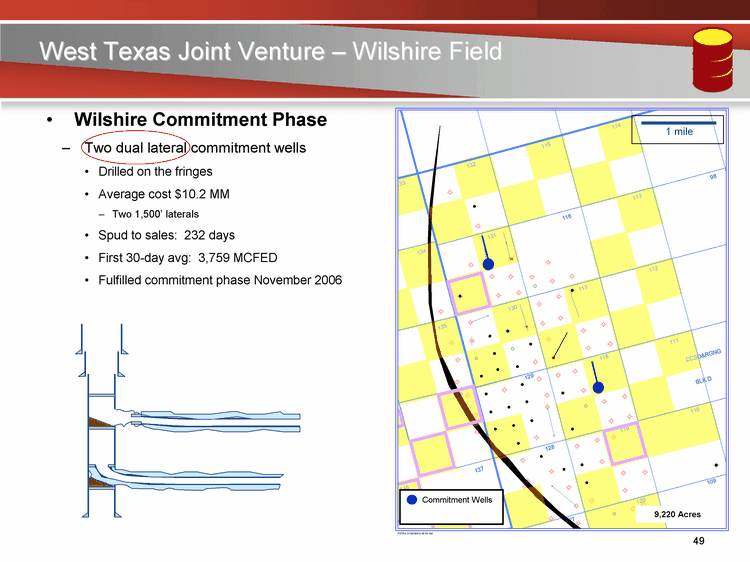
| West Texas Joint Venture - Wilshire Field Wilshire Commitment Phase Two dual lateral commitment wells Drilled on the fringes Average cost $10.2 MM Two 1,500' laterals Spud to sales: 232 days First 30-day avg: 3,759 MCFED Fulfilled commitment phase November 2006 Commitment Wells 9,220 Acres 1 mile |
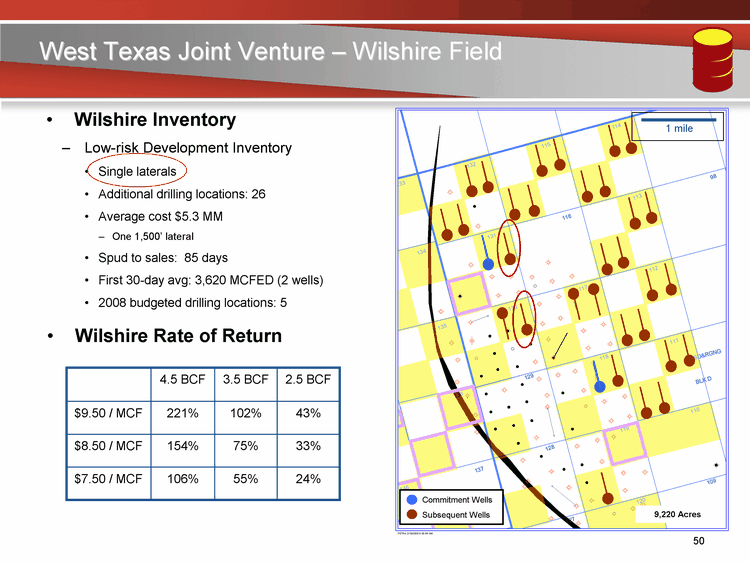
| West Texas Joint Venture - Wilshire Field Wilshire Inventory Low-risk Development Inventory Single laterals Additional drilling locations: 26 Average cost $5.3 MM One 1,500' lateral Spud to sales: 85 days First 30-day avg: 3,620 MCFED (2 wells) 2008 budgeted drilling locations: 5 4.5 BCF 3.5 BCF 2.5 BCF $9.50 / MCF 221% 102% 43% $8.50 / MCF 154% 75% 33% $7.50 / MCF 106% 55% 24% Wilshire Rate of Return Commitment Wells Subsequent Wells 9,220 Acres 1 mile |
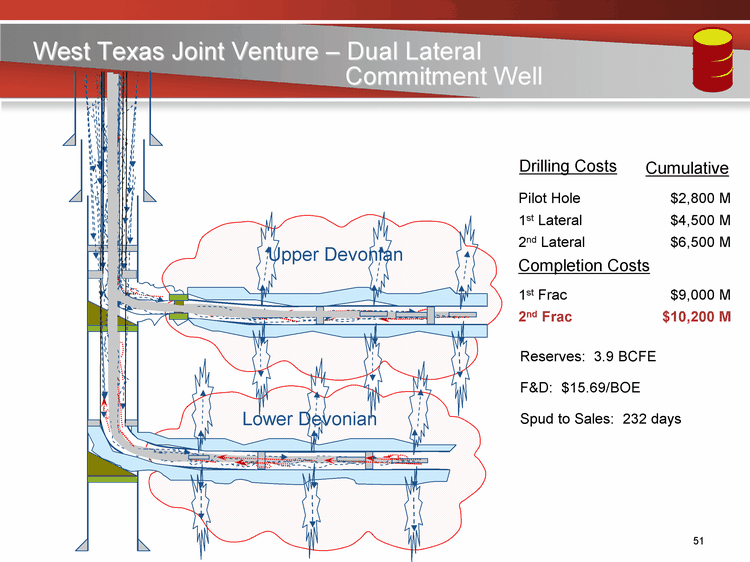
| West Texas Joint Venture - Dual Lateral Drilling Costs Pilot Hole 1st Lateral 2nd Lateral 2nd Frac 1st Frac Completion Costs Reserves: 3.9 BCFE F&D: $15.69/BOE Spud to Sales: 232 days Commitment Well Upper Devonian Lower Devonian $4,500 M $6,500 M $10,200 M $9,000 M $2,800 M Cumulative |
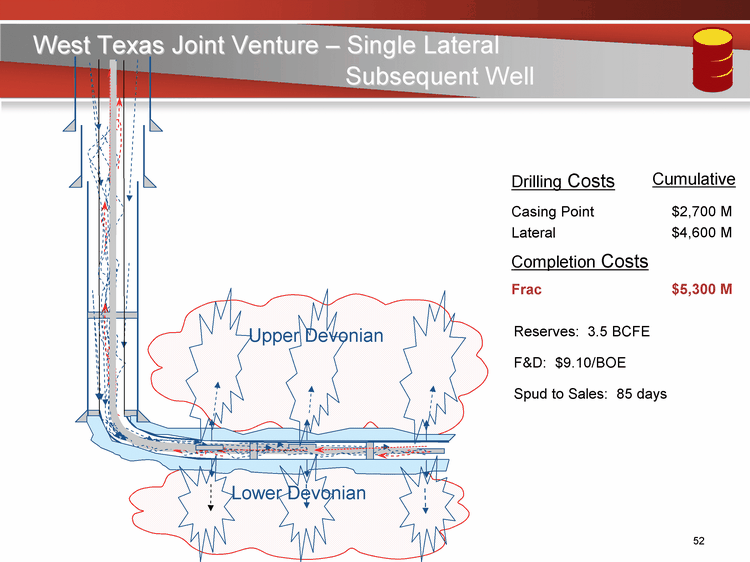
| Lateral Frac Completion Costs Drilling Costs Casing Point Reserves: 3.5 BCFE F&D: $9.10/BOE Spud to Sales: 85 days Subsequent Well West Texas Joint Venture - Single Lateral Upper Devonian Lower Devonian $4,600 M $5,300 M Cumulative $2,700 M |
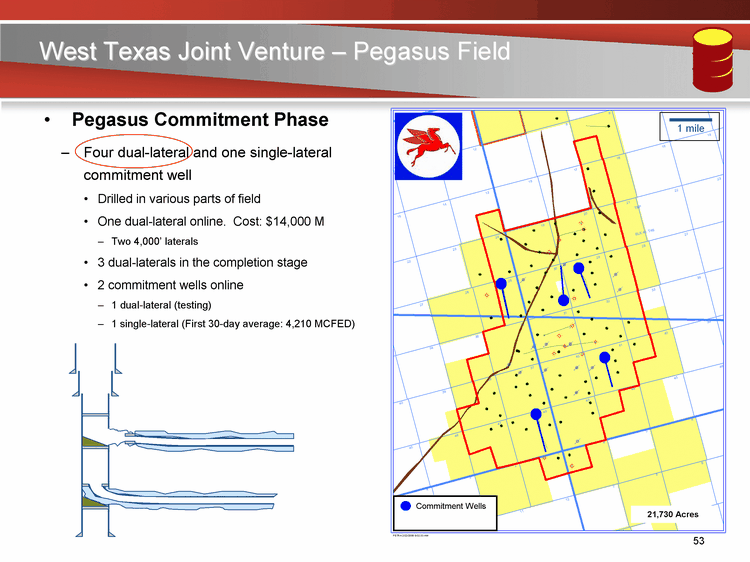
| West Texas Joint Venture - Pegasus Field Pegasus Commitment Phase Four dual-lateral and one single-lateral commitment well Drilled in various parts of field One dual-lateral online. Cost: $14,000 M Two 4,000' laterals 3 dual-laterals in the completion stage 2 commitment wells online 1 dual-lateral (testing) 1 single-lateral (First 30-day average: 4,210 MCFED) Commitment Wells 21,730 Acres 1 mile |
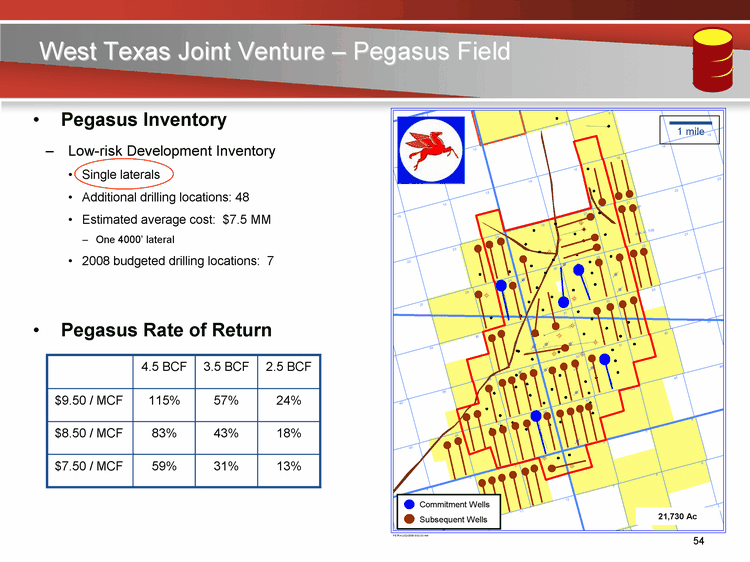
| West Texas Joint Venture - Pegasus Field Pegasus Inventory 4.5 BCF 3.5 BCF 2.5 BCF $9.50 / MCF 115% 57% 24% $8.50 / MCF 83% 43% 18% $7.50 / MCF 59% 31% 13% Pegasus Rate of Return Low-risk Development Inventory Single laterals Additional drilling locations: 48 Estimated average cost: $7.5 MM One 4000' lateral 2008 budgeted drilling locations: 7 Commitment Wells Subsequent Wells 21,730 Ac 1 mile |
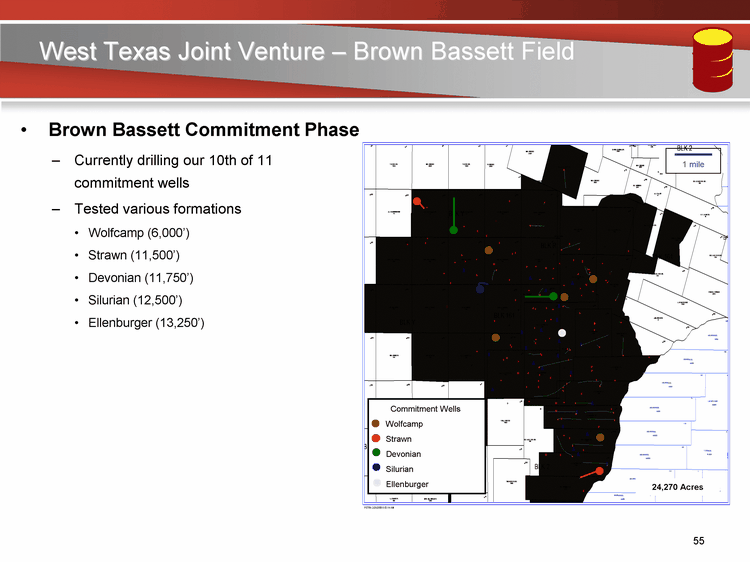
| West Texas Joint Venture - Brown Bassett Field Brown Bassett Commitment Phase Currently drilling our 10th of 11 commitment wells Tested various formations Wolfcamp (6,000') Strawn (11,500') Devonian (11,750') Silurian (12,500') Ellenburger (13,250') 1 mile |
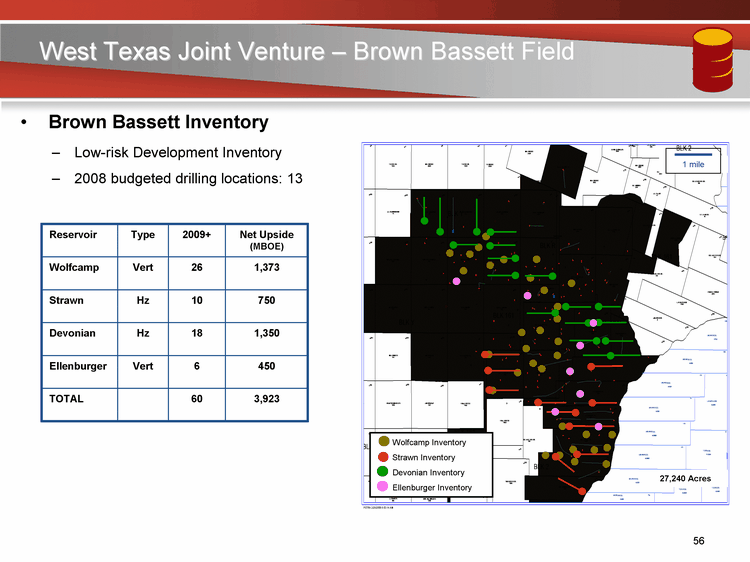
| West Texas Joint Venture - Brown Bassett Field Brown Bassett Inventory Low-risk Development Inventory 2008 budgeted drilling locations: 13 1 mile Reservoir Type 2009+ Net Upside (MBOE) Wolfcamp Vert 26 1,373 Strawn Hz 10 750 Devonian Hz 18 1,350 Ellenburger Vert 6 450 TOTAL 60 3,923 |
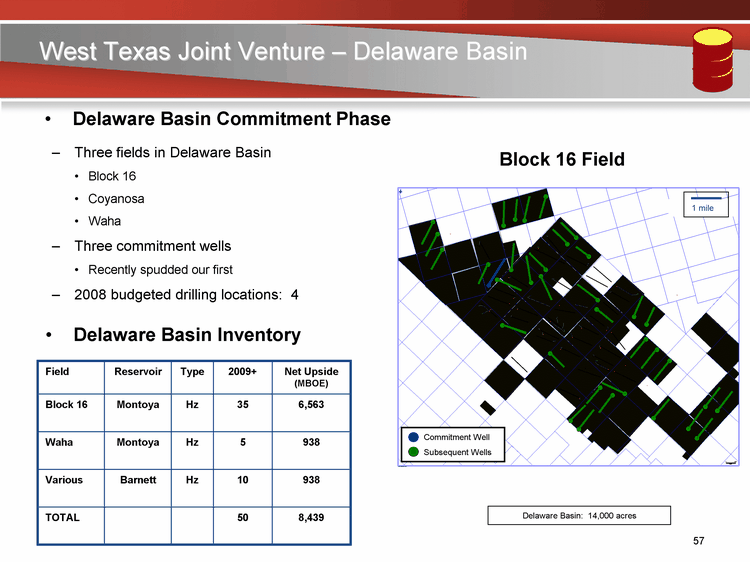
| West Texas Joint Venture - Delaware Basin Field Reservoir Type 2009+ Net Upside (MBOE) Block 16 Montoya Hz 35 6,563 Waha Montoya Hz 5 938 Various Barnett Hz 10 938 TOTAL 50 8,439 Delaware Basin Commitment Phase Three fields in Delaware Basin Block 16 Coyanosa Waha Three commitment wells Recently spudded our first 2008 budgeted drilling locations: 4 Delaware Basin Inventory Delaware Basin Inventory Block 16 Field Commitment Well Subsequent Wells Delaware Basin: 14,000 acres 1 mile |
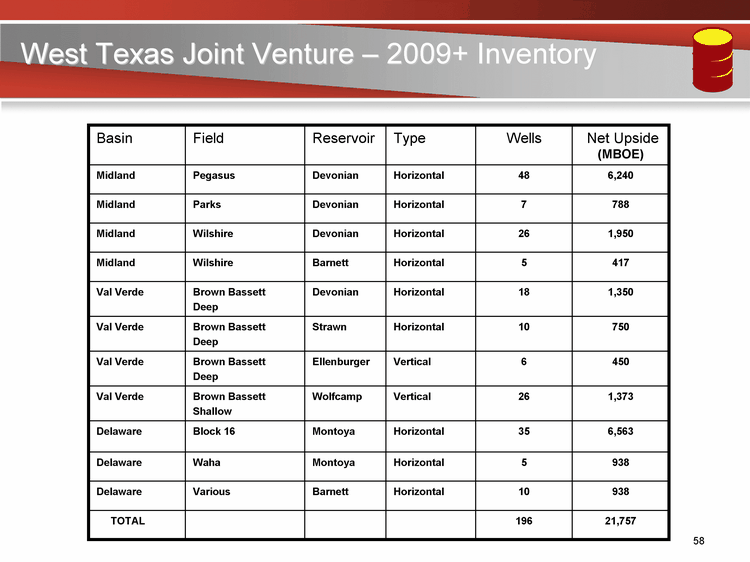
| Basin Field Reservoir Type Wells Net Upside (MBOE) Midland Pegasus Devonian Horizontal 48 6,240 Midland Parks Devonian Horizontal 7 788 Midland Wilshire Devonian Horizontal 26 1,950 Midland Wilshire Barnett Horizontal 5 417 Val Verde Brown Bassett Deep Devonian Horizontal 18 1,350 Val Verde Brown Bassett Deep Strawn Horizontal 10 750 Val Verde Brown Bassett Deep Ellenburger Vertical 6 450 Val Verde Brown Bassett Shallow Wolfcamp Vertical 26 1,373 Delaware Block 16 Montoya Horizontal 35 6,563 Delaware Waha Montoya Horizontal 5 938 Delaware Various Barnett Horizontal 10 938 TOTAL 196 21,757 West Texas Joint Venture - 2009+ Inventory |
| Encore Acquisition Company Back to the Base Enhanced Oil Recovery Ben Nivens NYSE: EAC www.encoreacq.com NYSE: ENP www.encoreenp.com |
| Enhanced Oil Recovery Fields are a Large Asset to Encore 65% of production 65% of reserves Over $400MM in projected 2008 operating income Implemented waterflood projects have shown significant uplift Current projects will develop 17 million barrels Inventory of 228 million barrels additional remaining Large CO2 Enhanced Oil Recovery potential in the Rockies |
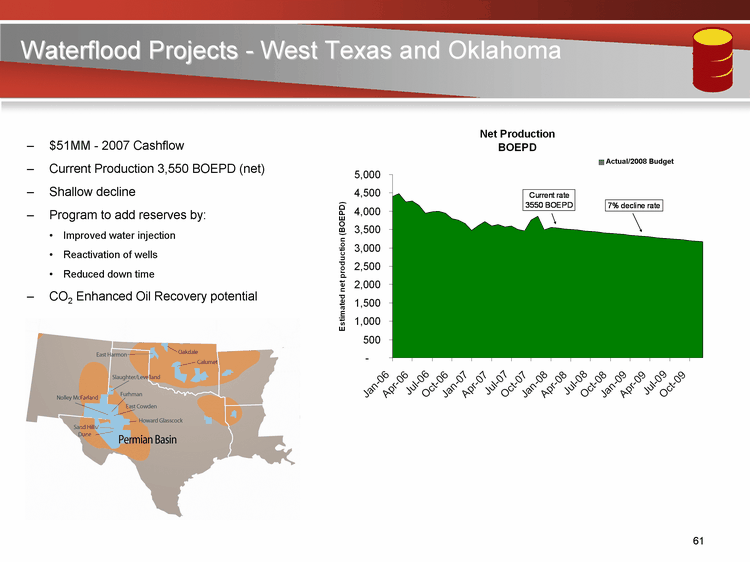
| Waterflood Projects - West Texas and Oklahoma $51MM - 2007 Cashflow Current Production 3,550 BOEPD (net) Shallow decline Program to add reserves by: Improved water injection Reactivation of wells Reduced down time CO2 Enhanced Oil Recovery potential CO2 Enhanced Oil Recovery potential CO2 Enhanced Oil Recovery potential CO2 Enhanced Oil Recovery potential CO2 Enhanced Oil Recovery potential CO2 Enhanced Oil Recovery potential CO2 Enhanced Oil Recovery potential CO2 Enhanced Oil Recovery potential CO2 Enhanced Oil Recovery potential CO2 Enhanced Oil Recovery potential Actual/2008 Budget |
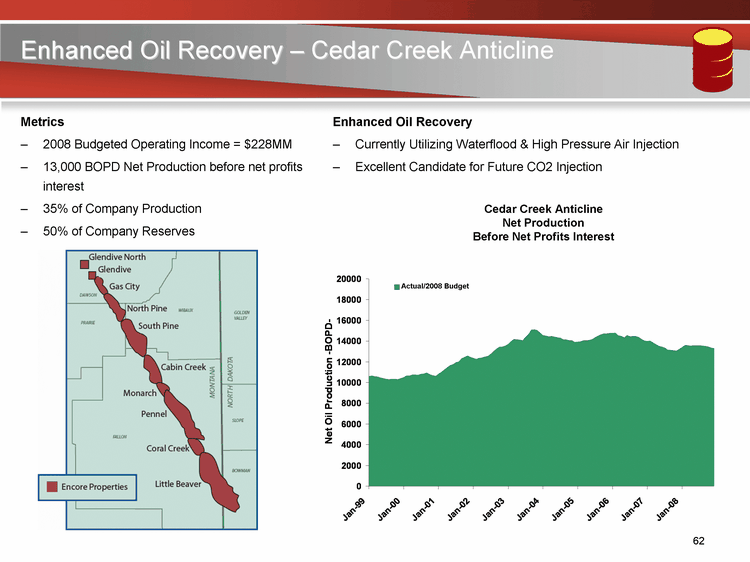
| Enhanced Oil Recovery - Cedar Creek Anticline Cedar Creek Anticline Net Production Before Net Profits Interest Metrics 2008 Budgeted Operating Income = $228MM 13,000 BOPD Net Production before net profits interest 35% of Company Production 50% of Company Reserves Enhanced Oil Recovery Currently Utilizing Waterflood & High Pressure Air Injection Excellent Candidate for Future CO2 Injection Actual/2008 Budget |
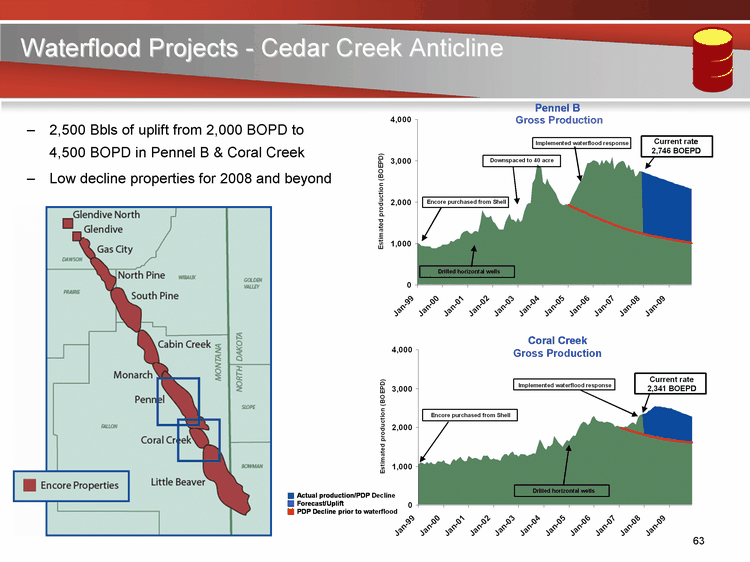
| Waterflood Projects - Cedar Creek Anticline 2,500 Bbls of uplift from 2,000 BOPD to 4,500 BOPD in Pennel B & Coral Creek Low decline properties for 2008 and beyond Low decline properties for 2008 and beyond Low decline properties for 2008 and beyond Low decline properties for 2008 and beyond Gross Production |
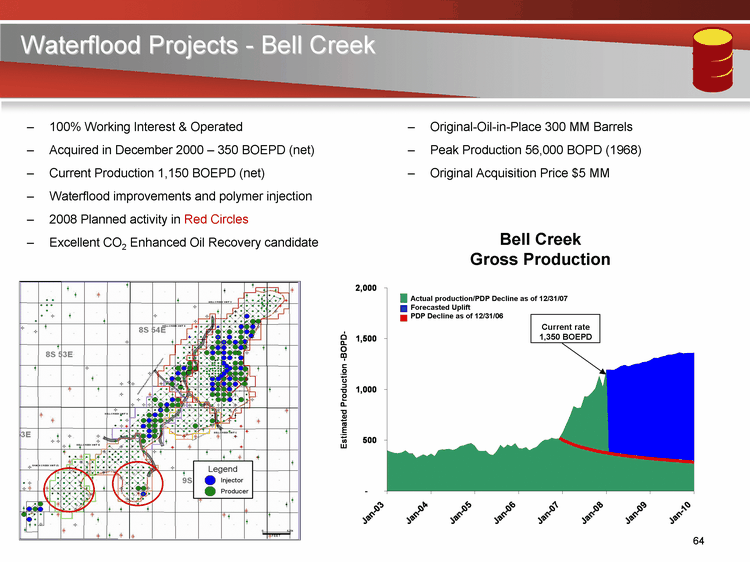
| Waterflood Projects - Bell Creek Waterflood Projects - Bell Creek 100% Working Interest & Operated Acquired in December 2000 - 350 BOEPD (net) Current Production 1,150 BOEPD (net) Waterflood improvements and polymer injection 2008 Planned activity in Red Circles Excellent CO2 Enhanced Oil Recovery candidate Original-Oil-in-Place 300 MM Barrels Peak Production 56,000 BOPD (1968) Original Acquisition Price $5 MM Bell Creek Gross Production Actual production/PDP Decline as of 12/31/07 Forecasted Uplift PDP Decline as of 12/31/06 Current rate 1,350 BOEPD |
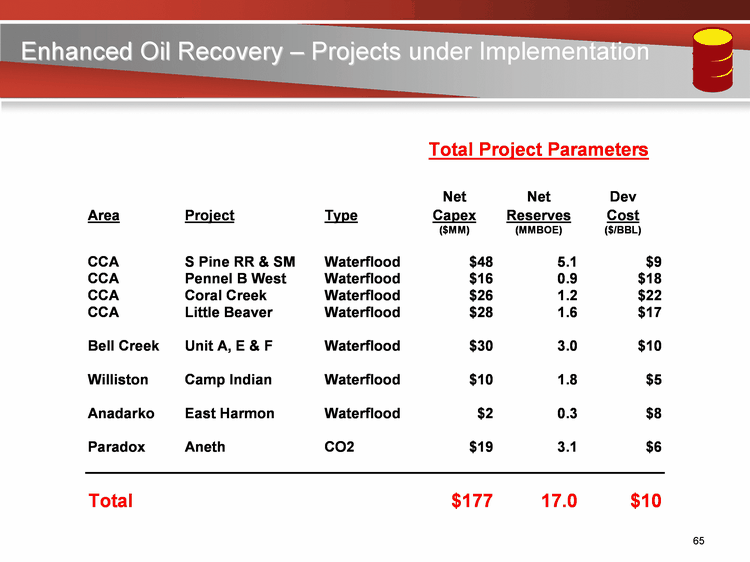
| Enhanced Oil Recovery - Projects under Implementation |
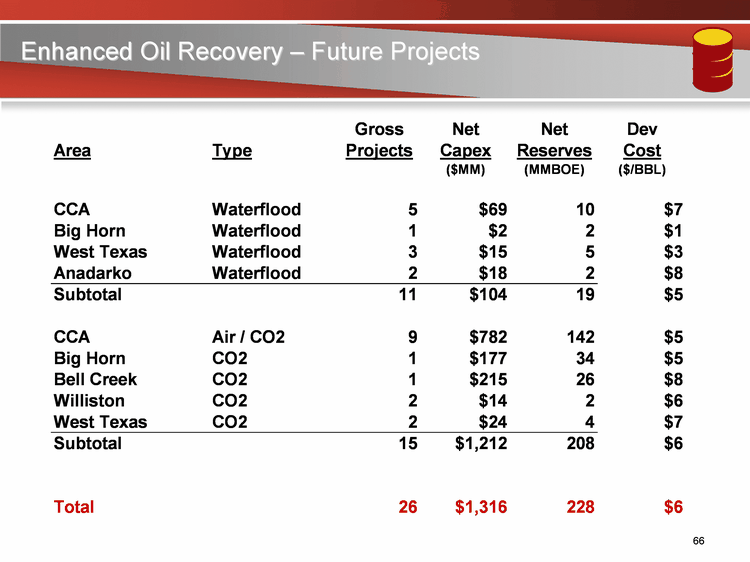
| Enhanced Oil Recovery - Future Projects |
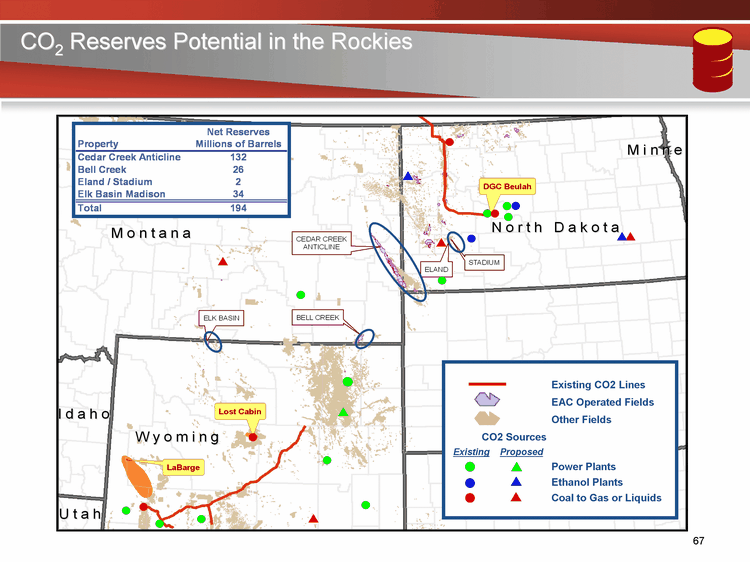
| CO2 Reserves Potential in the Rockies CO2 Reserves Potential in the Rockies Existing CO2 Lines EAC Operated Fields Other Fields CO2 Sources Existing Proposed Power Plants Ethanol Plants Coal to Gas or Liquids |
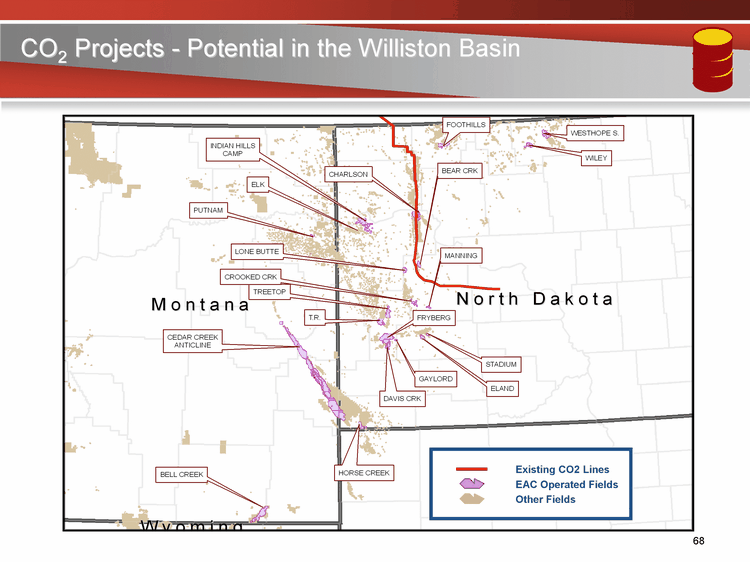
| CO2 Projects - Potential in the Williston Basin Existing CO2 Lines EAC Operated Fields Other Fields |
| Encore Acquisition Company Financial Overview Bob Reeves NYSE: EAC www.encoreacq.com NYSE: ENP www.encoreenp.com |
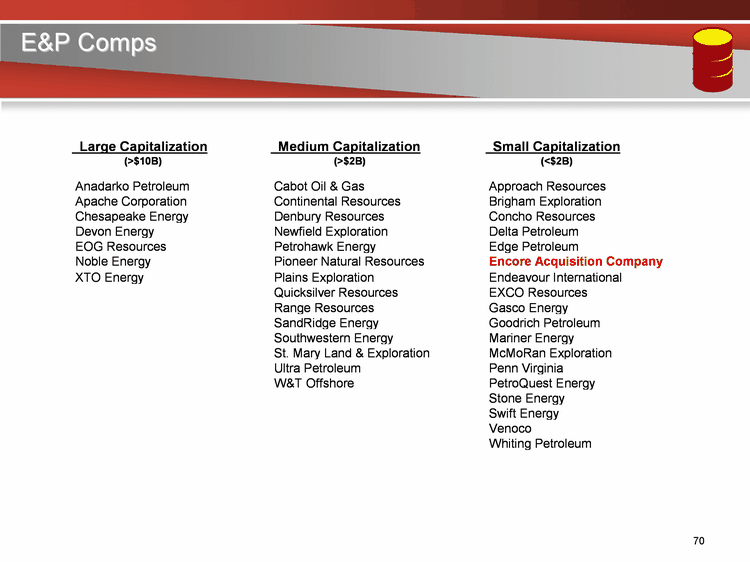
| E&P Comps E&P Comps |
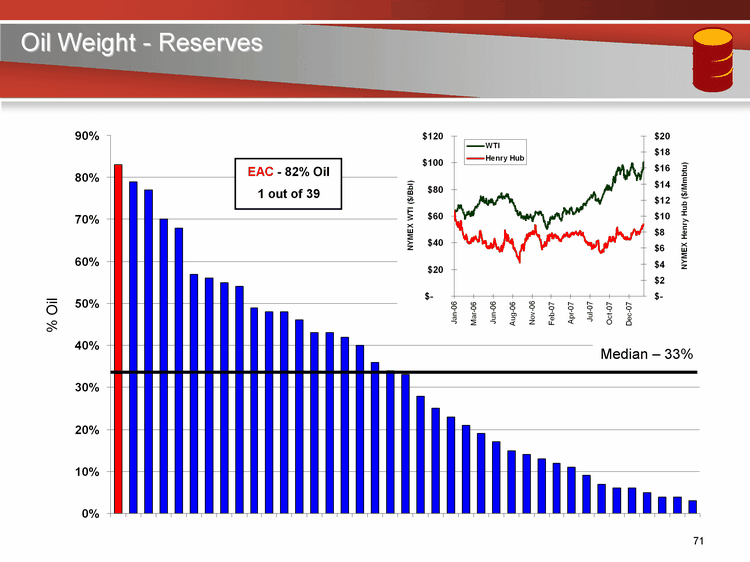
| Oil Weight - Reserves Oil Weight - Reserves Oil Weight - Reserves % Oil Median - 33% Median - 33% |
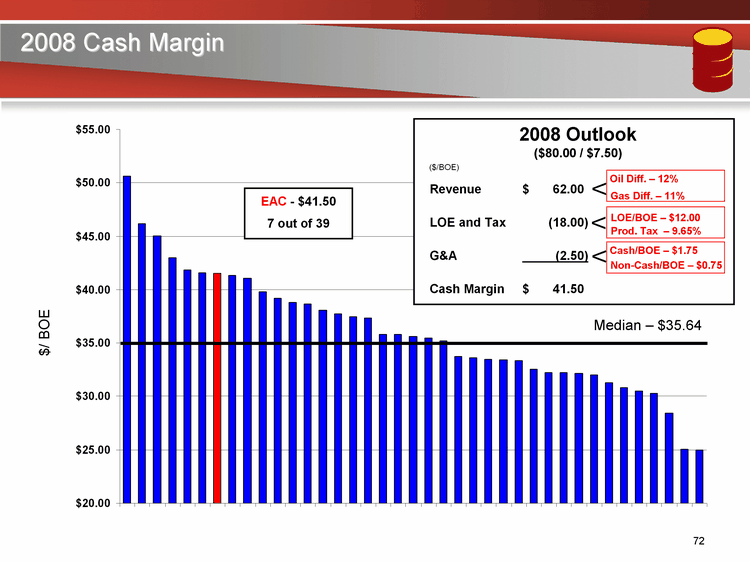
| 2008 Cash Margin 2008 Cash Margin $/ BOE Median - $35.64 V Oil Diff. - 12% Gas Diff. - 11% V LOE/BOE - $12.00 Prod. Tax - 9.65% V Cash/BOE - $1.75 Non-Cash/BOE - $0.75 2008 Outlook ($80.00 / $7.50) ($80.00 / $7.50) ($80.00 / $7.50) |
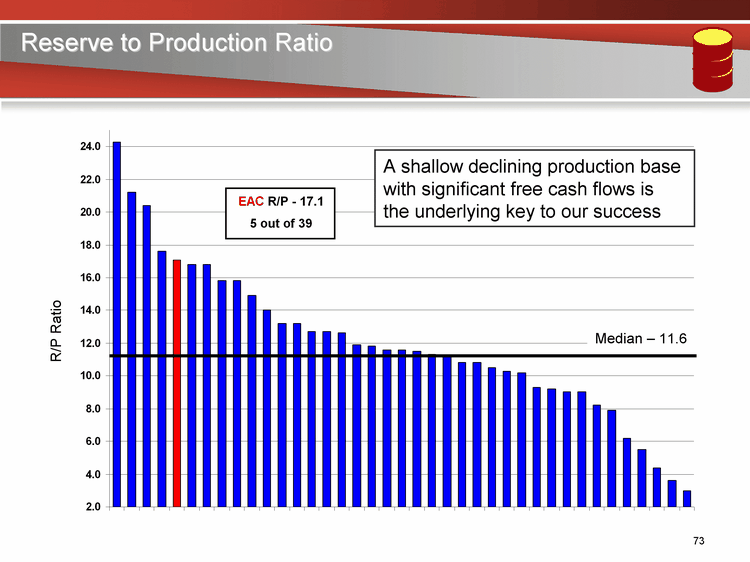
| Reserve to Production Ratio Reserve to Production Ratio R/P Ratio Median - 11.6 A shallow declining production base with significant free cash flows is the underlying key to our success the underlying key to our success the underlying key to our success the underlying key to our success |
| Efficient Production Growth Investments in unproved acreage Acreage costs in key plays increasing - Now is the time to buy Bakken Transformation of asset base in 2007 Manageable level to allow efficient implementation Technical team has built large inventory of projects for 2009 & beyond Ramped up rig activity will be steady over 2008, 2009, & beyond Investments in EOR projects affect future periods Stock repurchase EAC is undervalued - Street will eventually recognize value Capital budget set below expected Discretionary Cash Flows Prices above $80 oil/$7.50 gas will create additional cash flows to repurchase stock and reduce debt Capital budget in 2009 should equal 100% of discretionary cash flows Encore is investing 78% of EBITDAX to grow production 6 to 8% and investing 9% of EBITDAX to purchase shares Industry mean is investing 88% of EBITDAX to grow production 5% Variables of Production Growth Target: |
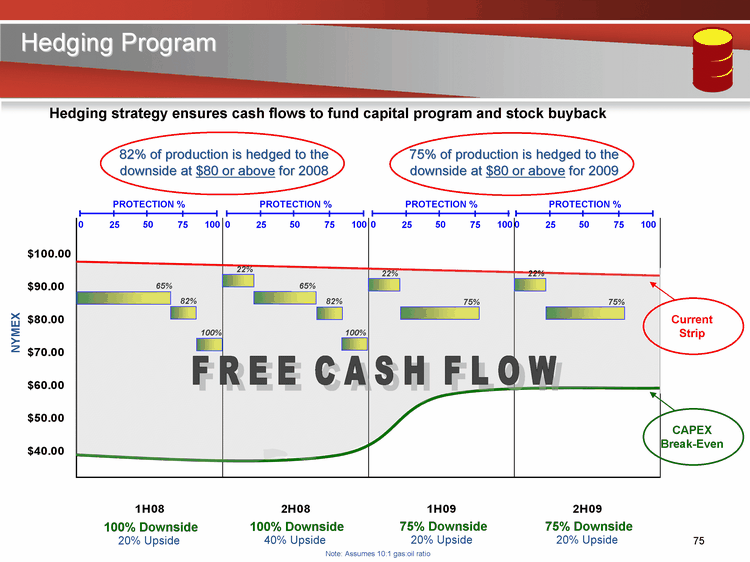
| NYMEX Note: Assumes 10:1 gas:oil ratio CAPEX Break-Even 100% Downside 20% Upside Current Strip 100% Downside 40% Upside 75% Downside 20% Upside 75% Downside 20% Upside 0 50 100 PROTECTION % 25 75 0 50 100 PROTECTION % 25 75 0 50 100 PROTECTION % 25 75 0 50 100 PROTECTION % 25 75 65% 82% 100% 22% 65% 82% 100% 22% 75% 22% 75% F R E E C A S H F L O W 82% of production is hedged to the downside at $80 or above for 2008 75% of production is hedged to the downside at $80 or above for 2009 Hedging Program Hedging strategy ensures cash flows to fund capital program and stock buyback |
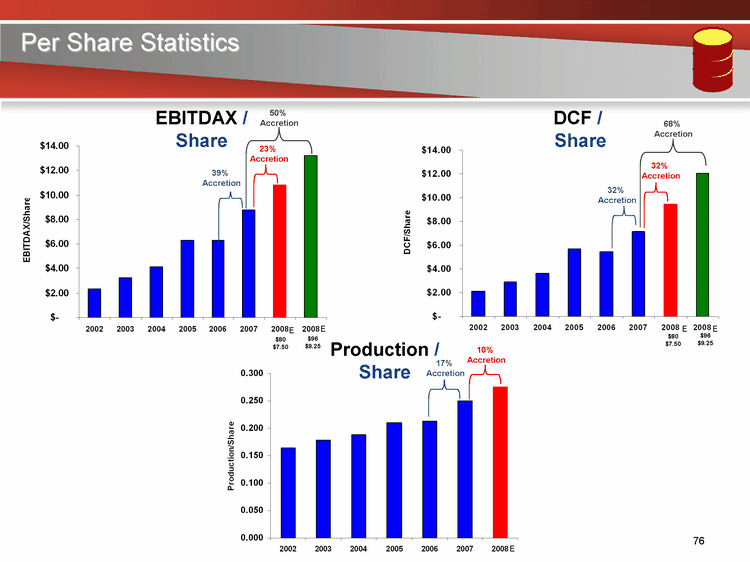
| Per Share Statistics Per Share Statistics Per Share Statistics EBITDAX / Share DCF / Share Production / Share E E E 39% Accretion 23% Accretion 32% Accretion 32% Accretion 17% Accretion 10% Accretion E E 50% Accretion $80 $7.50 $96 $9.25 $80 $7.50 $96 $9.25 68% Accretion |
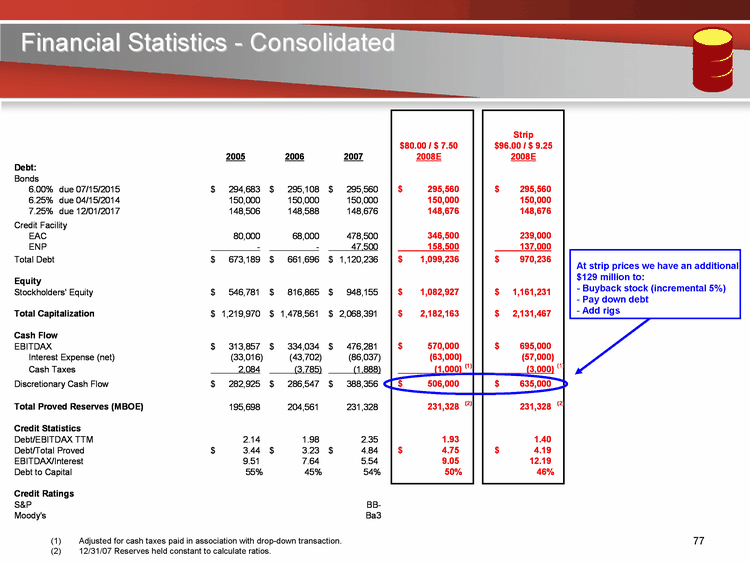
| Financial Statistics - Consolidated Adjusted for cash taxes paid in association with drop-down transaction. 12/31/07 Reserves held constant to calculate ratios. At strip prices we have an additional $129 million to: - - Buyback stock (incremental 5%) Pay down debt Add rigs |
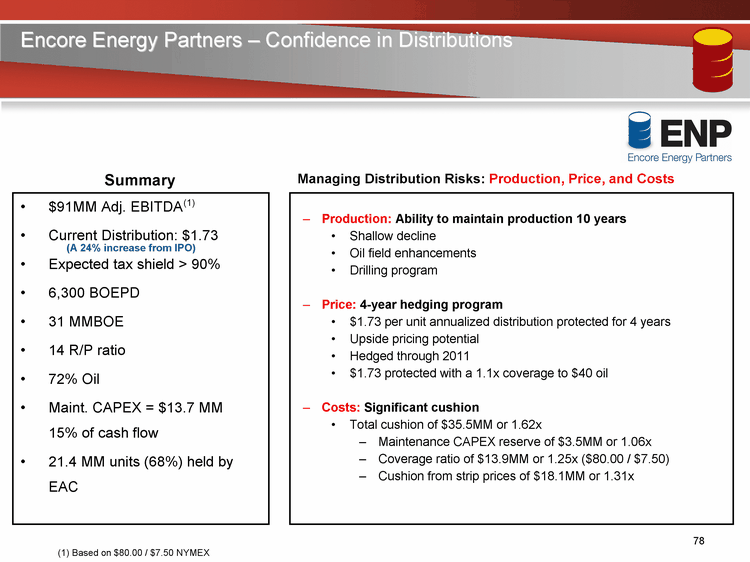
| Encore Energy Partners - Confidence in Distributions Production: Ability to maintain production 10 years Shallow decline Oil field enhancements Drilling program Price: 4-year hedging program $1.73 per unit annualized distribution protected for 4 years Upside pricing potential Hedged through 2011 $1.73 protected with a 1.1x coverage to $40 oil Costs: Significant cushion Total cushion of $35.5MM or 1.62x Maintenance CAPEX reserve of $3.5MM or 1.06x Coverage ratio of $13.9MM or 1.25x ($80.00 / $7.50) Cushion from strip prices of $18.1MM or 1.31x $91MM Adj. EBITDA Current Distribution: $1.73 Expected tax shield > 90% 6,300 BOEPD 31 MMBOE 14 R/P ratio 72% Oil Maint. CAPEX = $13.7 MM 15% of cash flow 21.4 MM units (68%) held by EAC Summary (1) Managing Distribution Risks: Production, Price, and Costs Managing Distribution Risks: Production, Price, and Costs (A 24% increase from IPO) (1) Based on $80.00 / $7.50 NYMEX |
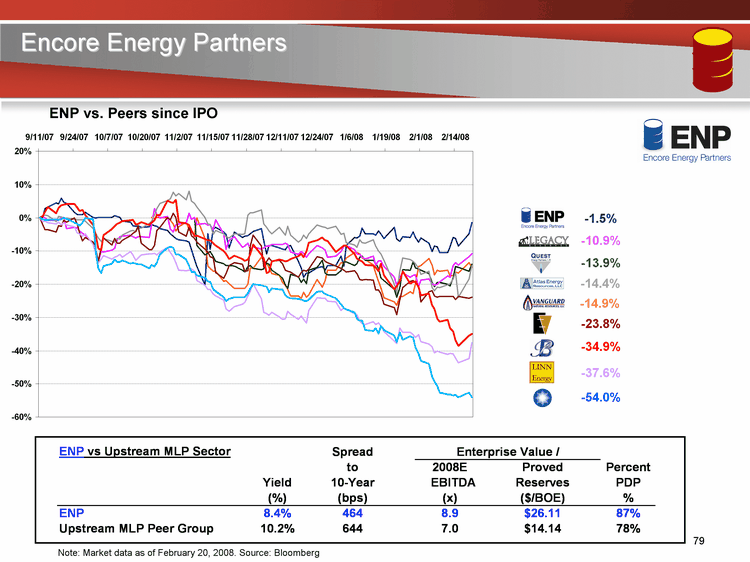
| Encore Energy Partners Encore Energy Partners Encore Energy Partners Note: Market data as of February 20, 2008. Source: Bloomberg ENP vs. Peers since IPO - -23.8% - -34.9% - -14.4% - -54.0% - -37.6% - -10.9% - -1.5% - -13.9% - -14.9% - -14.9% |
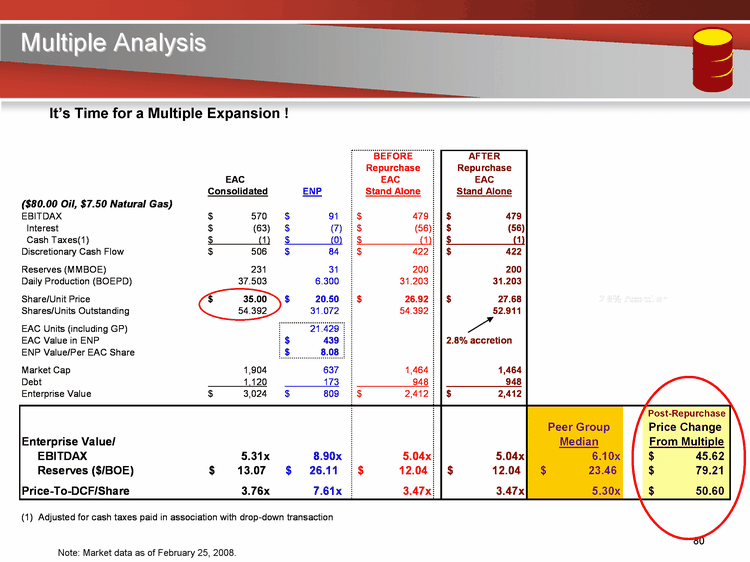
| Multiple Analysis It's Time for a Multiple Expansion ! Note: Market data as of February 25, 2008. |
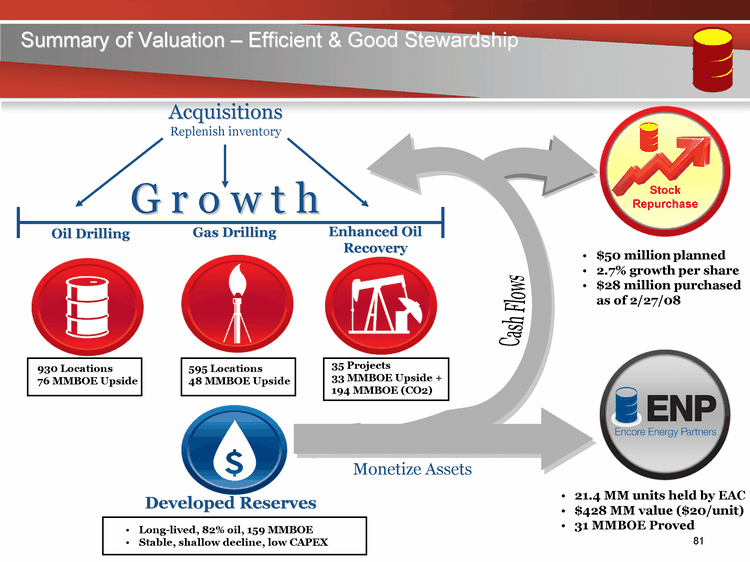
| Summary of Valuation - Efficient & Good Stewardship Acquisitions Replenish inventory Oil Drilling Gas Drilling Enhanced Oil Recovery Long-lived, 82% oil, 159 MMBOE Stable, shallow decline, low CAPEX G r o w t h Monetize Assets 21.4 MM units held by EAC $428 MM value ($20/unit) 31 MMBOE Proved Stock Repurchase Cash Flows $50 million planned 2.7% growth per share $28 million purchased as of 2/27/08 930 Locations 76 MMBOE Upside 595 Locations 48 MMBOE Upside 35 Projects 33 MMBOE Upside + 194 MMBOE (CO2) Developed Reserves |
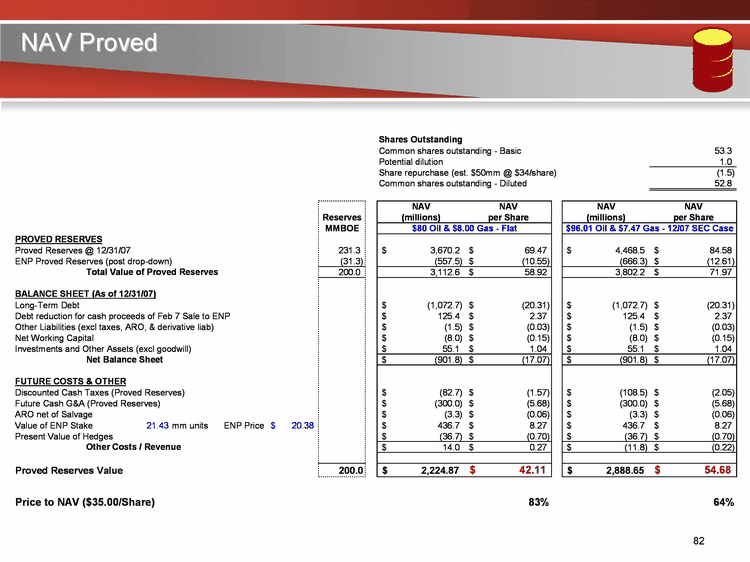
| NAV Proved NAV Proved |
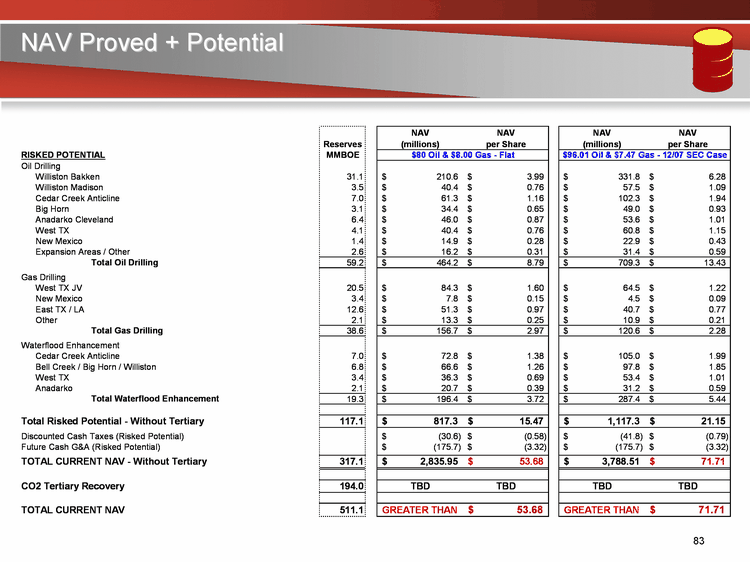
| NAV Proved + Potential NAV Proved + Potential |
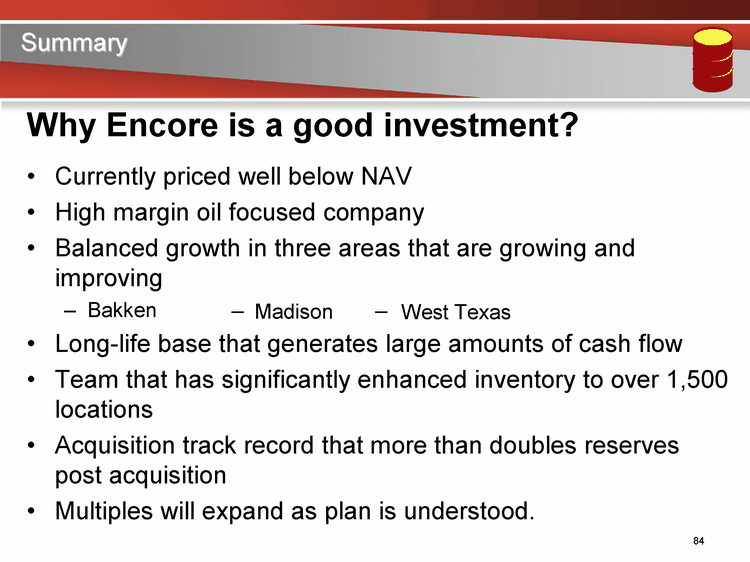
| Summary Currently priced well below NAV High margin oil focused company Balanced growth in three areas that are growing and improving Bakken Long-life base that generates large amounts of cash flow Team that has significantly enhanced inventory to over 1,500 locations Acquisition track record that more than doubles reserves post acquisition Multiples will expand as plan is understood. Why Encore is a good investment? Madison West Texas |
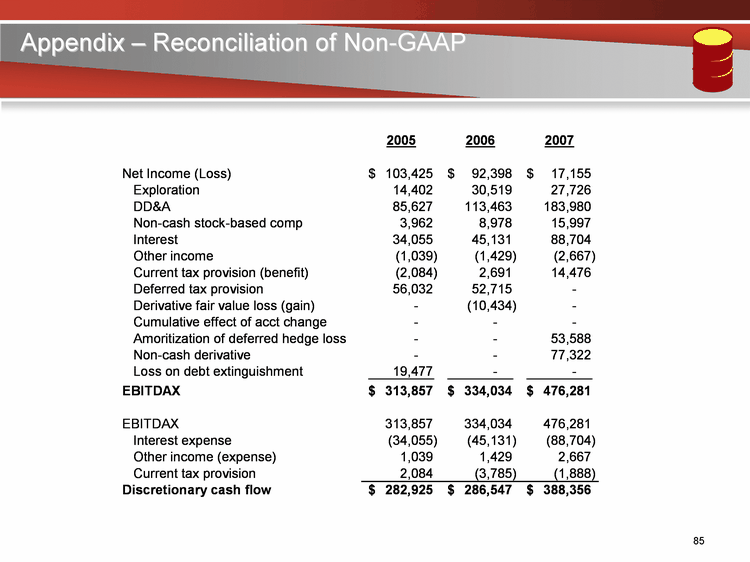
| Appendix - Reconciliation of Non-GAAP Appendix - Reconciliation of Non-GAAP |