UNITED STATES
SECURITIES AND EXCHANGE COMMISSION
Washington, D.C. 20549
FORM 10-K
(Mark One) | | | | | |
| ☑ | ANNUAL REPORT PURSUANT TO SECTION 13 OR 15(d) OF THE SECURITIES EXCHANGE ACT OF 1934 |
For the fiscal year ended November 30, 2024 or | | | | | |
| ☐ | TRANSITION REPORT PURSUANT TO SECTION 13 OR 15(d) OF THE SECURITIES EXCHANGE ACT OF 1934 |
For the transition period from ______________ to ________________
| | | | | | | | | | | | | | | | | | | | |
| Commission file number: 001-9610 | | Commission file number: 001-15136 |
| Carnival Corporation | | Carnival plc |
(Exact name of registrant as
specified in its charter) | (Exact name of registrant as
specified in its charter) |
| | | | | |
| Republic of Panama | England and Wales |
(State or other jurisdiction of
incorporation or organization) | (State or other jurisdiction of
incorporation or organization) |
| | | | | |
| 59-1562976 | 98-0357772 |
| (I.R.S. Employer Identification No.) | (I.R.S. Employer Identification No.) |
| | | | | |
| 3655 N.W. 87th Avenue | Carnival House, 100 Harbour Parade, |
| Miami, | Florida | 33178-2428 | Southampton | SO15 1ST, | United Kingdom |
(Address of principal
executive offices
and zip code) | (Address of principal
executive offices
and zip code) |
| | | | | | | | | | | | | | |
| (305) | 599-2600 | | 011 | 44 23 8065 5000 |
(Registrant’s telephone number,
including area code) | | (Registrant’s telephone number,
including area code) |
Securities registered pursuant to Section 12(b) of the Act: | | | | | | | | |
| Title of each class | Trading Symbol(s) | Name of each exchange on which registered |
| Common Stock ($0.01 par value) | CCL | New York Stock Exchange, Inc. |
| Ordinary Shares each represented by American Depositary Shares ($1.66 par value), Special Voting Share, GBP 1.00 par value and Trust Shares of beneficial interest in the P&O Princess Special Voting Trust | CUK | New York Stock Exchange, Inc. |
| 1.000% Senior Notes due 2029 | CUK29 | New York Stock Exchange LLC |
Securities registered pursuant to Section 12(g) of the Act: None
Indicate by check mark if the registrants are well-known seasoned issuers, as defined in Rule 405 of the Securities Act.
Yes ☑ No ☐
Indicate by check mark if the registrants are not required to file reports pursuant to Section 13 or Section 15(d) of the Act.
Yes ☐ No ☑
Indicate by check mark whether the registrants (1) have filed all reports required to be filed by Section 13 or 15(d) of the Securities Exchange Act of 1934 during the preceding 12 months (or for such shorter period that the registrants were required to file such reports), and (2) have been subject to such filing requirements for the past 90 days. Yes ☑ No ☐
Indicate by check mark whether the registrants have submitted electronically every Interactive Data File required to be submitted pursuant to Rule 405 of Regulation S-T (§ 232.405 of this chapter) during the preceding 12 months (or for such shorter period that the registrants were required to submit such files).
Yes ☑ No ☐
Indicate by check mark whether the registrants are large accelerated filers, accelerated filers, non-accelerated filers, smaller reporting companies, or emerging growth companies. See the definitions of “large accelerated filer,” “accelerated filer,” “smaller reporting company” and “emerging growth company” in Rule 12b-2 of the Exchange Act. | | | | | | | | | | | | | | | | | | | | | | | | | | | | | |
| Large accelerated filers | ☑ | Accelerated filers | ☐ | Non-accelerated filers | ☐ | Smaller reporting companies | ☐ | Emerging growth companies | ☐ |
If emerging growth companies, indicate by check mark if the registrants have elected not to use the extended transition period for complying with any new or revised financial accounting standards provided pursuant to Section 13(a) of the Exchange Act. ☐
Indicate by check mark whether the registrant has filed a report on and attestation to its management’s assessment of the effectiveness of its internal control over financial reporting under Section 404(b) of the Sarbanes-Oxley Act (15 U.S.C 7262(b)) by the registered public accounting firm that prepared or issued its audit report. Yes ☑ No ☐
If securities are registered pursuant to Section 12(b) of the Act, indicate by check mark whether the financial statements of the registrants included in the filing reflect the correction of an error to previously issued financial statements. ☐
Indicate by check mark whether any of those error corrections are restatements that required a recovery analysis of incentive-based compensation received by any of the registrant’s executive officers during the relevant recovery period pursuant to §240.10D-1(b). ☐
Indicate by check mark whether the registrants are shell companies (as defined in Rule 12b-2 of the Act). Yes ☐ No ☑
The aggregate market value of the voting and non-voting common equity held by non-affiliates computed by reference to the price at which the common equity was last sold was $15.6 billion as of the last business day of the registrant’s most recently completed second fiscal quarter.
At January 13, 2025, Carnival Corporation had outstanding 1,164,202,729 shares of its Common Stock, $0.01 par value.
The aggregate market value of the voting and non-voting common equity held by non-affiliates computed by reference to the price at which the common equity was last sold was $2.6 billion as of the last business day of the registrant’s most recently completed second fiscal quarter.
At January 13, 2025, Carnival plc had outstanding 187,687,583 Ordinary Shares $1.66 par value, one Special Voting Share GBP 1.00 par value and 1,164,202,729 Trust Shares of beneficial interest in the P&O Princess Special Voting Trust.
DOCUMENTS INCORPORATED BY REFERENCE
Portions of the 2025 joint definitive Proxy Statement are incorporated by reference into Part III of this report.
CARNIVAL CORPORATION & PLC
FORM 10-K
FOR THE FISCAL YEAR ENDED NOVEMBER 30, 2024
TABLE OF CONTENTS | | | | | | | | |
| | |
| PART I | | |
| Item 1. | | |
| | |
| | |
| | |
| | |
| | |
| | |
| | |
| | |
| | |
| | |
| | |
| | |
| | |
| | |
| | |
| | |
| | |
| | |
| | |
| | |
| | |
| | |
| | |
| | |
| | |
| | |
| | |
| | |
| | |
| | |
| Item 1A. | | |
| Item 1B. | | |
| Item 1C. | | |
| Item 2. | | |
| Item 3. | | |
| | | | | | | | |
| Item 4. | | |
| | |
| PART II | | |
| Item 5. | | |
| Item 6. | | |
| Item 7. | | |
| Item 7A. | | |
| Item 8. | | |
| Item 9. | | |
| Item 9A. | | |
| Item 9B. | | |
| Item 9C. | | |
| | |
| PART III | | |
| Item 10. | | |
| Item 11. | | |
| Item 12. | | |
| Item 13. | | |
| Item 14. | | |
| | |
| PART IV | | |
| Item 15. | | |
| Item 16. | | |
Cautionary Note Concerning Factors That May Affect Future Results
Some of the statements, estimates or projections contained in this document are “forward-looking statements” that involve risks, uncertainties and assumptions with respect to us, including some statements concerning future results, operations, outlooks, plans, goals, reputation, cash flows, liquidity and other events which have not yet occurred. These statements are intended to qualify for the safe harbors from liability provided by Section 27A of the Securities Act of 1933 and Section 21E of the Securities Exchange Act of 1934, as amended. All statements other than statements of historical facts are statements that could be deemed forward-looking. These statements are based on current expectations, estimates, forecasts and projections about our business and the industry in which we operate and the beliefs and assumptions of our management. We have tried, whenever possible, to identify these statements by using words like “will,” “may,” “could,” “should,” “would,” “believe,” “depends,” “expect,” “goal,” “aspiration,” “anticipate,” “forecast,” “project,” “future,” “intend,” “plan,” “estimate,” “target,” “indicate,” “outlook,” and similar expressions of future intent or the negative of such terms.
Forward-looking statements include those statements that relate to our outlook and financial position including, but not limited to, statements regarding:
| | | | | |
•Pricing | •Goodwill, ship and trademark fair values |
•Booking levels | •Liquidity and credit ratings |
•Occupancy | •Investment grade leverage metrics |
•Interest, tax and fuel expenses | •Estimates of ship depreciable lives and residual values |
•Currency exchange rates | •Adjusted return on invested capital (“ROIC”) |
Because forward-looking statements involve risks and uncertainties, there are many factors that could cause our actual results, performance or achievements to differ materially from those expressed or implied by our forward-looking statements. This note contains important cautionary statements of the known factors that we consider could materially affect the accuracy of our forward-looking statements and adversely affect our business, results of operations and financial position. These factors include, but are not limited to, the following:
•Events and conditions around the world, including geopolitical uncertainty, war and other military actions, pandemics, inflation, higher fuel prices, higher interest rates and other general concerns impacting the ability or desire of people to travel could lead to a decline in demand for cruises as well as have significant negative impacts on our financial condition and operations.
•Incidents concerning our ships, guests or the cruise industry may negatively impact the satisfaction of our guests and crew and lead to reputational damage.
•Changes in and non-compliance with laws and regulations under which we operate, such as those relating to health, environment, safety and security, data privacy and protection, anti-money laundering, anti-corruption, economic sanctions, trade protection, labor and employment, and tax may be costly and lead to litigation, enforcement actions, fines, penalties and reputational damage.
•Factors associated with climate change, including evolving and increasing regulations, increasing global concern about climate change and the shift in climate conscious consumerism and stakeholder scrutiny, and increasing frequency and/or severity of adverse weather conditions could have a material impact on our business.
•Inability to meet or achieve our targets, goals, aspirations, initiatives, and our public statements and disclosures regarding them, including those related to sustainability matters, may expose us to risks that may adversely impact our business.
•Cybersecurity incidents and data privacy breaches, as well as disruptions and other damages to our principal offices, information technology operations and system networks and failure to keep pace with developments in technology have adversely impacted and may in the future materially adversely impact our business operations, the satisfaction of our guests and crew and may lead to fines, penalties and reputational damage.
•The loss of key team members, our inability to recruit or retain qualified shoreside and shipboard team members and increased labor costs could have an adverse effect on our business and results of operations.
•Increases in fuel prices, changes in the types of fuel consumed and availability of fuel supply may adversely impact our scheduled itineraries and costs.
•We rely on suppliers who are integral to the operations of our businesses. These suppliers and service providers may be unable to deliver on their commitments, which could negatively impact our business.
•Fluctuations in foreign currency exchange rates may adversely impact our financial results.
•Overcapacity and competition in the cruise and land-based vacation industry may negatively impact our cruise sales, pricing and destination options.
•Inability to implement our shipbuilding programs and ship repairs, maintenance and refurbishments may adversely
impact our business operations and the satisfaction of our guests.
•We require a significant amount of cash to service our debt and sustain our operations. Our ability to generate cash depends on many factors, including those beyond our control, and we may not be able to generate cash required to service our debt and sustain our operations.
•Our substantial debt could adversely affect our financial health and operating flexibility.
The ordering of the risk factors set forth above is not intended to reflect our indication of priority or likelihood. Additionally, many of these risks and uncertainties are currently, and in the future may continue to be, amplified by our substantial debt balance incurred during the pause of our guest cruise operations. There may be additional risks that we consider immaterial or which are unknown.
Forward-looking statements should not be relied upon as a prediction of actual results. Subject to any continuing obligations under applicable law or any relevant stock exchange rules, we expressly disclaim any obligation to disseminate, after the date of this document, any updates or revisions to any such forward-looking statements to reflect any change in expectations or events, conditions or circumstances on which any such statements are based.
Forward-looking and other statements in this document may also address our sustainability progress, plans, and goals (including climate change- and environmental-related matters). In addition, historical, current, and forward-looking sustainability- and climate-related statements may be based on standards and tools for measuring progress that are still developing, internal controls and processes that continue to evolve, and assumptions and predictions that are subject to change in the future and may not be generally shared.
Adjusted ROIC provides additional information to us and investors about our operating performance relative to the capital we have invested in the company. We define adjusted ROIC as the twelve-month adjusted net income (loss) before interest expense and interest income divided by the monthly average of debt plus equity minus construction-in-progress, excess cash, goodwill and intangibles.
PART I
Item 1. Business.
A. Overview
I.Summary
Carnival Corporation was incorporated in Panama in 1974 and Carnival plc was incorporated in England and Wales in 2000. Carnival Corporation and Carnival plc operate a dual listed company (“DLC”), whereby the businesses of Carnival Corporation and Carnival plc are combined through a number of contracts and through provisions in Carnival Corporation’s Articles of Incorporation and By-Laws and Carnival plc’s Articles of Association. The two companies operate as if they are a single economic enterprise with a single executive management team and identical Boards of Directors, but each has retained its separate legal identity. Carnival Corporation and Carnival plc are both public companies with separate stock exchange listings and their own shareholders. Together with their consolidated subsidiaries, Carnival Corporation and Carnival plc are referred to collectively in this Form 10-K as “Carnival Corporation & plc,” “company,” “our,” “us” and “we.” We are the largest global cruise company, and among the largest leisure travel companies, with a portfolio of world-class cruise lines - AIDA Cruises, Carnival Cruise Line, Costa Cruises, Cunard, Holland America Line, P&O Cruises (Australia), P&O Cruises (UK), Princess Cruises and Seabourn.
During 2024, we announced that we will sunset the P&O Cruises (Australia) brand and fold its Australia operations into Carnival Cruise Line in March 2025.
II.Purpose & Mission, Vision, Values and Priorities
Purpose & Mission
To deliver unforgettable happiness to our guests by providing extraordinary cruise vacations, while honoring the integrity of every ocean we sail, place we visit and life we touch.
Vision
As the global leader in the cruise industry, we will lead the way in innovative and sustainable cruising to deliver memorable vacations and build borderless connections.
Culture Essentials (our Core Values)
•Speak Up - Our voice is our strength. Every one of us, regardless of level or role, speaks up when we have questions, comments, concerns, or new ideas. If we see something wrong or that does not seem right, we say something and trust our voices will be heard without fear of retaliation.
•Respect & Protect - The health, safety and well-being of our people and the planet are vital. We choose to take decisive actions to respect and protect every life we touch, the places we sail and the laws that govern us.
•Empower - We and our team members have the time, tools and support we need to do our best work. We are empowered to take personal ownership and accountability to succeed, and we take pride in our work.
•Improve - Our business is built on forward motion. We have the courage to dream big, driving innovation and continuous improvement in guest and team member experiences, operations, compliance, sustainability and beyond.
•Listen & Learn - We listen actively and seek to understand before responding, because the more perspectives we have, the better decisions we make. We value and respect the words and ideas of others, keeping an open mind, and learning from our successes and failures.
•Communicate - We openly share our knowledge, skills and information across brands, functions and the entire company to further our collective success. Together we champion our purpose & mission, vision, values and company priorities.
Priorities
Ensure each of our world-class brands owns its space in the vacation market by delivering extraordinary experiences tailored to its guests.
We understand vacation expectations and preferences vary widely among our diverse audience of potential guests. To fulfill our purpose & mission, and in the process achieve outstanding guest satisfaction levels, industry-leading demand and improved pricing, each of our brands must carve out a distinct identity for delivering cruise experiences. Our brands must effectively market their uniqueness to existing and potential guests and deliver on their promise across the entire guest journey.
Become travel and leisure’s employer of choice.
We celebrate our diverse team of over 160,000 team members representing approximately 150 countries and are committed to providing a welcoming and inclusive environment where people from different backgrounds, experiences and walks of life can succeed. We care deeply for our team members and must always cultivate an atmosphere of openness, respect and trust. We know our team members are at the heart of inspiring unforgettable happiness, so we strive to be the world’s number-one choice for hospitality, travel and leisure careers.
Maintain our commitment to seek excellence in compliance, environmental protection and in looking after the safety, health and well-being of every life we touch.
Achieving our purpose & mission depends on being good corporate citizens and stewards of the environment. Safeguarding the planet we call home, our guests, the communities we serve, and our Carnival family, and complying with the laws and regulations that govern our business, is vital to our success.
Set the pace with the industry’s smartest solutions that deliver on our sustainability roadmap to 2030.
Our earth, ecosystem and environment are vital to our success. Without the incredible communities and scenic spaces we operate in, our purpose & mission of inspiring unforgettable happiness would be impossible. We are determined to lead the way in sustainable cruising by promoting positive climate action, contributing to a circular economy, partnering with the communities we sail to and from and reducing our environmental footprint. To do this, we are investing in technology upgrades and fleet improvements, piloting alternative fuel types and optimizing itineraries.
Strengthen our balance sheet and deliver long-term shareholder value.
In recent years, travel and leisure has endured volatility unlike anything seen in modern history, including unique obstacles that disproportionately affected the cruise industry. With our operations now at full strength and the continued support of our guests, team members, investors and other stakeholders, we are focused on our financial fitness. We are determined to drive revenue, operate effectively and efficiently at scale, generate record levels of cash from operations and invest our capital wisely. We believe this will allow us to responsibly reduce our debt over time, improve our return on invested capital as well as return to investment-grade leverage metrics.
B. Global Cruise Industry
I. Overview
Cruising offers a broad range of products and services to suit vacationing guests of many ages, backgrounds and interests. Each brand in our portfolio meets the needs of a distinct set of consumer psychographics and vacation needs which allows us to penetrate large addressable customer segments. The mobility of cruise ships enables us to move our vessels between regions in order to meet changing demand across different geographic areas.
Cruise brands can be broadly classified as offering contemporary, premium and luxury cruise experiences. The contemporary experience appeals to a broad segment of the cruise vacation industry, including families with children of all ages, features a variety of activities and entertainment venues and historically includes cruises that last seven days or less. The premium experience emphasizes quality, comfort, style and more destination-focused itineraries. The premium experience generally includes cruises that last from seven to 14 days. The luxury experience is generally characterized by very high standards of accommodation and service, smaller vessel size and exotic itineraries to ports that are inaccessible by larger ships. We have product and service offerings in each of these three broad classifications.
II. Passenger Capacity by Ocean Going Vessels
| | | | | | | | | | | | | | |
| | Passenger Capacity as of December 31 (a) (b) |
| Calendar Year | | Global Cruise
Industry (c) | | Carnival
Corporation & plc |
| | | | |
| 2021 | | 636,270 | | | 253,950 | |
| 2022 | | 663,970 | | | 259,060 | |
| 2023 | | 701,110 | | | 263,300 | |
| 2024 | | 733,010 | | | 269,970 | |
| 2025 | | 777,700 | | | 272,380 | |
| 2026 | | 801,450 | | | 272,380 | |
| 2027 | | 823,630 | | | 277,710 | |
(a)2025-2027 data is estimated based on announced newbuilds and ship retirements.
(b)In accordance with cruise industry practice, passenger capacity is calculated based on the assumption of two passengers per cabin even though some cabins can accommodate three or more passengers.
(c)Global cruise industry data was obtained from Cruise Industry News.
III. Competition
We compete with land-based vacation alternatives throughout the world, such as hotels, resorts (including all-inclusive resorts), theme parks, organized tours, casinos, vacation ownership properties, and other internet-based alternative lodging sites. Based on 2024 Cruise Industry News statistics, as of December 31, 2024, we, along with our principal cruise competitors Royal Caribbean Group, Norwegian Cruise Line Holdings, Ltd. and MSC Cruises, represented approximately 80% of the cruise industry capacity.
C. Our Global Cruise Business
I. Segment and Brand Information | | | | | | | | | | | | | | | | | | | |
| November 30, 2024 |
| Passenger Capacity | | | | Percentage of Total Capacity | | Number of Cruise Ships |
| North America and Australia (“NAA”) Segment | | | | | | | |
| Carnival Cruise Line | 89,100 | (a) | | | 33 | % | | 27 |
| Princess Cruises | 50,580 | | | | 19 | % | | 16 |
| Holland America Line | 22,920 | | | | 8 | % | | 11 |
| P&O Cruises (Australia) | 7,230 | (a) | | | 3 | % | | 3 |
| Seabourn | 2,640 | | | | 1 | % | | 6 |
| 172,490 | | | | 64 | % | | 63 |
| | | | | | | |
| Europe Segment | | | | | |
| Costa Cruises (“Costa”) | 31,140 | | | | 12 | % | | 9 |
| AIDA Cruises (“AIDA”) | 32,280 | | | | 12 | % | | 11 |
| P&O Cruises (UK) | 24,300 | | | | 9 | % | | 7 |
| Cunard | 9,770 | | | | 4 | % | | 4 |
| 97,490 | | | | 36 | % | | 31 |
| 269,970 | | | | 100 | % | | 94 |
(a)During 2024, we announced that we will sunset the P&O Cruises (Australia) brand and fold its Australia operations into Carnival Cruise Line in March 2025. Pacific Encounter and Pacific Adventure will be transferred to Carnival Cruise Line in early 2025 and Pacific Explorer is expected to leave the fleet in February 2025.
We also have a Cruise Support segment that includes our portfolio of leading port destinations and exclusive islands as well as other services, all of which are operated for the benefit of our cruise brands.
In addition to our cruise operations, we own Holland America Princess Alaska Tours, the leading tour company in Alaska and the Canadian Yukon, which complements our Alaska cruise operations. Our tour company owns and operates hotels, lodges, glass-domed railcars and motorcoaches which comprise our Tour and Other segment.
II. Ships Under Contract for Construction
As of November 30, 2024, we have a total of six cruise ships expected to be delivered through 2033. Our ship construction contracts are with Fincantieri in Italy and Meyer Werft in Germany.
| | | | | | | | | | | |
| Expected Delivery Date | | Passenger Capacity
Lower Berth |
| Carnival Cruise Line | | | |
| Newbuild | April 2027 | | 5,330 | |
| Newbuild | March 2028 | | 5,330 | |
| Newbuild | July 2029 | | 6,160 | |
| Newbuild | July 2031 | | 6,160 | |
| Newbuild | June 2033 | | 6,160 | |
| Princess Cruises | | | |
| | | |
| Star Princess | September 2025 | | 4,310 | |
| | | |
| | | |
| | | |
| | | |
III. Descriptions of Cruise Brands
Carnival Cruise Line is “The World’s Most Popular Cruise Line®” and has provided multi-generational family entertainment at exceptional value to its guests for over 50 years. Carnival Cruise Line creates an environment where guests can be their most playful selves on ships that are designed to inspire the experience of bringing people together, with limitless opportunities for guests to create their own fun.
During 2024, we announced that we will sunset the P&O Cruises (Australia) brand and fold its Australia operations into Carnival Cruise Line in March 2025. Pacific Encounter and Pacific Adventure will be transferred to Carnival Cruise Line in early 2025 and Pacific Explorer is expected to leave the fleet in February 2025.
Princess Cruises is The Love Boat®, the brand that introduced the world to the elegance and romance of modern-day cruising and has delivered dream vacations to millions of guests for nearly 60 years in the most sought-after destinations. Princess combines extraordinary large ship amenities with elite service personalization and simplicity to create meaningful connections and unforgettable moments in the most incredible settings across the globe.
Holland America Line has been exploring the world for over 150 years with expertly crafted itineraries, extraordinary service and genuine connections to destinations. Holland America Line visits over 100 countries around the world and has shared the thrill of Alaska with guests for more than 75 years with its ideal mid-sized ships. Guests enjoy extraordinary entertainment at sea and dining venues featuring exclusive dishes by world-famous chefs.
Seabourn, a leader in ultra-luxury cruising, sails to legendary cities and less-traveled ports. Intimate ships with a yacht-like atmosphere, allow guests to discover the unexpected—about the world and about themselves. Guests enjoy all ocean-front suites and world-class gourmet dining as they wish. Seabourn creates moments of surprise and delight known as “Seabourn Moments” in an environment that fosters building meaningful connections with fellow travelers, crew members and the communities they visit. Seabourn’s fleet includes two purpose-built ultra-luxury expedition ships offering amenities such as submarines, Zodiacs® and kayaks.
For over 75 years, Costa has brought wonder to guests’ lives, allowing them to discover unique destinations and experiences both onboard and onshore. Costa's warm hospitality and high-quality onboard services feature a true European touch and Italian passion, setting Costa apart from any other cruise experience.
AIDA is the most recognized brand in the German cruise market. Its ships visit many beautiful destinations around the world and bring together people of all ages. AIDA inspires guests with excellent service and a variety of extraordinary experiences. The smile on the bow of the ships represents the unique AIDA attitude on life — relaxed, friendly, colorful, cosmopolitan and uncomplicated.
P&O Cruises (UK) is Britain’s largest cruise line and its heritage can be traced back over 185 years. P&O Cruises (UK) welcomes guests to extraordinary travel experiences designed in a distinctively British way - through a blend of discovery, relaxation and exceptional service catered towards British tastes. P&O Cruises (UK)’s fleet of premium ships deliver authentic travel experiences around the globe, combining style, quality and innovation with a sense of occasion and attention to detail, to create a truly memorable holiday.
For nearly 185 years, the iconic Cunard fleet has perfected the timeless art of luxury ocean travel. Cunard’s distinct voyages are meticulously crafted to offer fine dining and bars, unique entertainment, and the famous White Star Service®, comfort and style. A pioneer in transatlantic journeys and World Voyages, its destinations also include Europe, the Caribbean and Alaska.
IV. Trademarks and Other Intellectual Property
We own, use and/or have registered or licensed numerous trademarks, patents and patent pending designs and technology, copyrights and domain names, which have considerable value and some of which are widely recognized throughout the world. These intangible assets enable us to distinguish our cruise products and services, ships and programs from those of our competitors. We own or license the trademarks for the trade names of our cruise brands, each of which we believe is a widely-recognized brand in the cruise industry, as well as our ship names and a wide variety of cruise products and services.
V. Passengers Carried by Principal Source Geographic Areas
| | | | | | | | | | | | | | | | | | | | |
| Carnival Corporation & plc
Passengers Carried | |
| (in thousands) | 2024 | | 2023 | | 2022 | Brands’ Main Source Markets |
| United States and Canada | 7,938 | | 7,410 | | 5,140 | Carnival Cruise Line, Cunard, Holland America Line, Princess Cruises and Seabourn |
| Continental Europe | 2,702 | | 2,590 | | 1,610 | AIDA and Costa |
| United Kingdom | 1,087 | | 970 | | 660 | Cunard and P&O Cruises (UK) |
| Australia and New Zealand | 1,027 | | 940 | | 230 | Carnival Cruise Line, P&O Cruises (Australia) and Princess Cruises |
| | | | | | |
| Other | 754 | | 550 | | 90 | |
| Total | 13,509 | | 12,460 | | 7,730 | |
Data for 2022 is not representative of a full year of operations.
VI. Cruise Programs
| | | | | | | | | | | | | | | | | |
| Carnival Corporation & plc
Percentage of Passenger Capacity by Itinerary |
| 2025 | | 2024 | | 2023 |
| Caribbean | 34 | % | | 34 | % | | 31 | % |
| Europe without Mediterranean | 16 | | | 17 | | | 17 | |
| Mediterranean | 14 | | | 13 | | | 15 | |
| Alaska | 6 | | | 6 | | | 7 | |
| Australia and New Zealand | 6 | | | 7 | | | 7 | |
| | | | | |
| Other | 24 | | | 23 | | | 24 | |
| 100 | % | | 100 | % | | 100 | % |
VII. Cruise Pricing and Payment Terms
Each of our cruise brands establishes pricing for the upcoming seasons which are made available primarily through the internet, although published materials and electronic communications are also used. Prices vary depending on a number of factors, including the source market, category of guest accommodation, ship, season, duration and itinerary. We offer a variety of special promotions, including early booking, past guest recognition and travel agent programs.
Our bookings are generally taken several months in advance of the cruise departure date. Typically, the longer the cruise itinerary, the further in advance the bookings are made. This lead time allows us to manage our prices in relation to guest demand and the number of available cabins through our revenue management capabilities and other initiatives.
The cruise ticket price typically includes the following:
• Accommodations
• Most meals, including snacks at numerous venues
• Access to amenities such as swimming pools, water slides, water parks, whirlpools, a health club, and sun decks
• Childcare and supervised youth programs
• Entertainment, such as theatrical and comedy shows, live music and nightclubs
• Visits to multiple destinations
We offer value added packages to induce ticket sales to guests and groups and to encourage the advance purchase of certain onboard items. These packages are bundled with cruise tickets and sold to guests for a single price rather than as a separate package and may include one or more of the following:
| | | | | |
| • Beverage packages | • Internet packages |
| • Shore excursions | • Photo packages |
| • Air packages | • Onboard spending credits |
| • Specialty restaurants | • Service charges |
Our brands’ payment terms generally require that a guest pay a deposit to confirm their reservation and then pay the balance due before the departure date.
VIII. Seasonality
Our passenger ticket revenues are seasonal. Demand for cruises has been greatest during our third quarter, which includes the Northern Hemisphere summer months. This higher demand during the third quarter results in higher ticket prices and occupancy levels and, accordingly, the largest share of our operating income is typically earned during this period. Our results are also impacted by ships being taken out-of-service for planned maintenance, which we schedule during non-peak seasons. In addition, substantially all of Holland America Princess Alaska Tours’ revenue and operating income is generated from May through September in conjunction with Alaska’s cruise season.
IX. Onboard and Other Revenues
Onboard and other activities are provided either directly by us or by independent concessionaires, from which we receive either a percentage of their revenues or a fee. Concession revenues do not have direct expenses because the costs and services incurred for concession revenues are borne by our concessionaires. In 2024, we earned 34% of our cruise revenues from onboard and other revenue goods and services including: | | | | | |
• Beverage sales | • Internet and communication services |
• Casino gaming | • Full-service spas |
• Shore excursions | • Specialty restaurants |
• Retail sales | • Art sales |
• Photo sales | • Laundry and dry-cleaning services |
X. Port Destinations and Exclusive Islands
We operate a portfolio of port destinations and exclusive islands enabling us to offer exceptional experiences to 6.5 million guests by creating a wide variety of high-quality destinations that are uniquely tailored to our guests’ preferences. In addition, to secure preferential berth access to third-party ports, we enter into berthing agreements and commitments.
We recently announced plans to enhance Half Moon Cay, our highly rated and award-winning exclusive Bahamian destination. The enhancements will lean further into this destination’s natural beauty and pristine appeal, reinforcing its new name – RelaxAway, Half Moon Cay. Featuring a newly constructed pier that is expected to open in the summer of 2026, the destination will allow two ships to dock, including Carnival Cruise Line’s largest ships that will be able to visit for the first time.
During 2024, we continued construction on our new exclusive cruise port destination, Celebration Key, which is expected to open in the summer of 2025, with an additional pier opening in the fall of 2026. Celebration Key, located on the south side of Grand Bahama Island, will welcome guests to a stunning beach and further expands our experience offerings with an abundance of features and amenities for our guests. Once the additional pier is completed, Celebration Key will be able to accommodate up to four of our cruise ships simultaneously. Additionally, our investment in Celebration Key will support our efforts to design more energy efficient itineraries based on its location and will be a strategic addition to our current portfolio of six owned or operated ports and destinations:
•Puerta Maya in Cozumel, Mexico
•Grand Turk Cruise Center in Turks & Caicos
•Mahogany Bay in Isla Roatan, Honduras
•Amber Cove in the Dominican Republic
•RelaxAway, Half Moon Cay, an exclusive island in The Bahamas
•Princess Cays, an exclusive island in The Bahamas
XI. Marketing Activities
Guest feedback and research support the development of our overall marketing and business strategies to drive demand for cruises and increase the number of first-time cruisers. Our goal has always been to increase consumer awareness for cruise vacations and further grow our share of their vacation spend. We proactively gather and evaluate guest feedback about their cruise experiences for valuable insights on key drivers of guest loyalty and satisfaction, with a focus on continuous improvement. We closely monitor our net promoter scores, which reflect the likelihood that our guests will recommend our brands’ cruise products and services to friends and family, including those new-to-cruise.
During 2024, we increased our marketing and advertising programs, driving even greater demand across our portfolio of world-class cruise lines. Each of our cruise lines is focused on creating further brand differentiation and clarity around its unique value proposition, executing on a range of carefully targeted, results-driven marketing and advertising programs to reach its optimal market segment of new and loyal guests and travel agent partners. Among these programs are increasingly effective digital performance marketing and lead generation approaches that have attracted new guests online by leveraging the reach and impact of digital marketing and social media. We have also invested in new marketing technologies to deliver more engaging and personalized communications, further enhancing their effectiveness. Collectively through these programs, we have cultivated cruising advocates creating word-of-mouth demand and preference for our brands, ships, itineraries and onboard products and services.
In addition, substantially all of our cruise brands offer guest loyalty and recognition programs that motivate future purchases from our repeat guests. Each brand strategically leverages its catalog of demand-generating rewards and incentives to bring repeat guests back time and again with finely honed offers, such as special fares, onboard activity discounts, complimentary laundry and internet services, expedited ship embarkation and disembarkation and special onboard activities.
XII. Sales Channels
We sell our cruises through travel agents, tour operators, company vacation planners, our websites and onboard future cruise consultants. Our individual cruise brands’ relationships with their travel agent partners are generally independent of each of our other brands. Our travel agents’ relationships are generally not exclusive and travel agents generally receive a base commission, plus the potential of additional commissions, including discounts or complimentary tour conductor cabins, based on the achievement of pre-defined sales terms.
Travel agent partners are an integral part of our long-term cruise distribution network and are critical to our success. We utilize local sales teams to motivate travel agents to support our products and services with competitive pricing, promotional policies
and joint marketing and advertising programs. During 2024, no group of travel agencies under common control accounted for 10% or more of our revenues. We also employ a wide variety of educational programs, including websites, seminars and videos, to train agents on our cruise brands and their products and services. In 2024, we held a variety of trainings and educational programs to continue to support and develop our travel agent partners, including ship visits to familiarize our travel agent partners with our products and services.
All of our brands have internet booking engines to allow travel agents to book our cruises. Additionally, all of our cruise brands have their own consumer websites that provide access to information about their products and services to users and enable their guests to quickly and easily book cruises and other products and services online. These sites interface with our brands’ social networks, blogs and other social media sites, which allow them to develop greater contact and interaction with their guests before, during and after their cruise. We also employ vacation planners and onboard future cruise consultants who support our sales initiatives by offering our guests one-on-one cruise planning expertise and other services.
XIII. Suppliers
To provide an exceptional cruise experience for our guests, we source significant quantities of goods and services from a global supply base. In addition, we incur significant capital expenditures for materials to support the refurbishment and enhancements of our vessels as well as to build new ships. We approach our spend strategically and look for suppliers who demonstrate the ability to help us leverage our scale in terms of cost, quality, service, innovation and sustainability. Our supply base is diverse and many of our suppliers provide goods and services across our portfolio of brands. We have continued to map our supply chains and evaluate risks, including the categories of products and services sourced and their geographic locations.
We strive to build strong relationships with our suppliers based on shared values. Our Business Partner Code of Conduct applies to all of our suppliers and other business partners. It outlines our expectation that our suppliers will respect and follow applicable laws and regulations and promote ethical decisions in all aspects of their business. We have also established a Responsible and Sustainable Sourcing Policy (“RSSP”) that builds on existing policies, such as our Business Partner Code of Conduct, and our human rights and environmental policies. RSSP establishes a framework that helps us monitor compliance with our standards and helps our business partners, including suppliers, meet our requirements for compliance and progress towards industry best practices. It is designed to ensure that our sourcing practices align with our values of social responsibility and environmental stewardship. RSSP addresses labor, environmental, business ethics, management systems and health and safety risks. It also covers sustainability priorities such as sustainable food ingredients, animal welfare and sustainable shore excursions.
In recent years, global supply markets and supply chains have been impacted by certain global events and increased inflation, impacting our operations and profitability. While we have experienced stabilization in supply markets and easing of inflation, we continue to apply a number of different strategies to mitigate the impact of these challenges on our operations, including extending our demand planning, placing purchase orders earlier to secure supply, leveraging our enterprise scale through corporate-wide agreements, utilizing short-term or long-term contracts as needed, seeking alternative sources, utilizing substitute products and leveraging our supplier relationships.
XIV. Human Capital Management and Employees
Our shipboard and shoreside employees are sourced from approximately 150 countries. In 2024, we had an average of 100,000 employees onboard our ships, excluding employees on leave. Our shoreside operations had an annual average of 12,000 full-time and 3,000 part-time/seasonal employees. Holland America Princess Alaska Tours significantly increases its work force during the late spring and summer months in connection with Alaska’s cruise season.
We have entered into agreements with unions covering certain employees on our ships and in our shoreside hotel and transportation operations. The percentages of our shipboard and shoreside employees that are represented by collective bargaining agreements are 52% and 22%, respectively. We consider our employee and union relationships to be strong.
A team of highly motivated and engaged employees is key to providing extraordinary cruise vacations. To facilitate the recruitment, development and retention of our valuable employees, we strive to make Carnival Corporation & plc a diverse, inclusive and safe workplace, with opportunities for our employees to grow and develop in their careers.
a.Talent Development
We believe in investing in our team members through the training and development of both shoreside and shipboard team members. We facilitate trainings to ensure that our teams are well-prepared to carry out their individual and collective responsibilities. For our shipboard team members, our goal is to be a leader in delivering high quality professional maritime training, as evidenced by the Arison Maritime Center. The Center is home to the Center for Simulator Maritime Training (“CSMART”). The leading-edge CSMART Academy features the most advanced bridge and engine room simulator technology and equipment available, with the capacity to provide annual professional training for all our bridge, engineering and environmental officers. CSMART participants receive a maritime training experience that fosters advanced knowledge and skills development, critical thinking and problem solving; all in a professional learning environment where our corporate culture is reinforced. CSMART also offers training related to liquefied natural gas (“LNG”) technology as well as an environmental officer training program and additional environmental courses for bridge and engineering officers to further enhance our training on environmental awareness and protection.
b.Succession Planning
Our Boards of Directors believe that planning for succession is an important function. Our multi-brand structure enhances our succession planning process. We continually strive to foster the professional development of management and team members. As a result, we have developed a very experienced and strong group of leaders, with their performance subject to ongoing monitoring and evaluation, as potential successors to our senior management, including our Chief Executive Officer (“CEO”).
XV. Ethics and Compliance
We believe a strong ethics and compliance culture is imperative for the success of any company. Our compliance framework includes a Global Ethics and Compliance (“Global E&C”) department, which is led by our Chief Risk and Compliance Officer who leads the effort to promote and monitor a strong ethics and compliance culture throughout the company. The main responsibilities of the Global E&C department are to collaboratively:
•Identify, assess, monitor, prevent, detect and report on compliance risk
•Ensure compliance accountabilities and responsibilities are clear across the company
•Promote a strong culture of ethics and compliance
•Drive ethics and compliance continuous improvements
To further heighten the focus on ethics and compliance, our Boards of Directors have Compliance Committees, which oversee the Global E&C department and maintain regular communications with our Chief Risk and Compliance Officer.
XVI. Insurance
a.General
We maintain insurance to cover a number of risks associated with owning and operating our vessels and other non-ship related risks. All such insurance policies are subject to coverage limits, exclusions and deductible levels. Insurance premiums are dependent on our own loss experience and the general premium requirements of our insurers. We maintain certain levels of deductibles for substantially all the below-mentioned coverages. We may increase our deductibles to mitigate future premium increases. We do not carry coverage related to loss of earnings or revenues from our ships or other operations.
b.Protection and Indemnity (“P&I”) Coverages
Liabilities, costs and expenses for illness and injury to crew, guest injury, pollution and other third-party claims in connection with our cruise activities are covered by our P&I clubs, which are mutual indemnity associations owned by ship owners.
We are members of three P&I clubs, Gard, Steamship Mutual and UK Club, which are part of a worldwide group of 12 P&I clubs, known as the International Group of P&I Clubs (the “IG”). The IG insures directly, and through broad and established reinsurance markets, a large portion of the world’s shipping fleets. Coverage is subject to the P&I clubs’ rules and the limits of coverage are determined by the IG.
c.Hull and Machinery Insurance
We maintain insurance on the hull and machinery of each of our ships for reasonable amounts as determined by management. The coverage for hull and machinery is provided by large and well-established international marine insurers. Insurers make it a condition for insurance coverage that a ship be certified as “in class” by a classification society that is a member of the International Association of Classification Societies (“IACS”). All of our ships are routinely inspected and certified to be in class by an IACS member.
d.War Risk Insurance
We use a combination of insurance and self-insurance to cover war risk for legal liability to crew, guests and other third parties as well as loss or damage to our vessels arising from war or war-like actions. Our primary war risk insurance coverage is provided by international marine insurers and our excess war risk insurance is provided by our three P&I clubs. Under the terms of our war risk insurance coverage, which are typical for war risk policies in the marine industry, insurers can give us no less than three days’ notice that the insurance policies will be canceled. However, the policies may be reinstated at different premium rates.
e.Other Insurance
We maintain property insurance covering our shoreside assets and casualty insurance covering liabilities to third parties arising from our hotel and transportation business, shore excursion operations and shoreside operations, including our port and related commercial facilities. We also maintain workers’ compensation, director’s and officer’s liability and other insurance coverages.
XVII. Taxation
A summary of our principal taxes and exemptions in the jurisdictions where our significant operations are located is as follows:
a.U.S. Income Tax
We are primarily foreign corporations engaged in the business of operating cruise ships in international transportation. We also own and operate, among other businesses, the U.S. hotel and transportation business of Holland America Princess Alaska Tours through U.S. corporations.
Our North American cruise ship businesses and certain ship-owning subsidiaries are engaged in a trade or business within the U.S. Depending on its itinerary, any particular ship may generate income from sources within the U.S. We believe that our U.S. source income and the income of our ship-owning subsidiaries, to the extent derived from, or incidental to, the international operation of a ship or ships, is exempt from U.S. federal income and branch profit taxes.
Our domestic U.S. operations, principally the hotel and transportation business of Holland America Princess Alaska Tours, are subject to federal and state income taxation in the U.S.
1.Application of Section 883 of the Internal Revenue Code
In general, under Section 883 of the Internal Revenue Code, certain non-U.S. corporations (such as our North American cruise ship businesses) are not subject to U.S. federal income tax or branch profits tax on U.S. source income derived from, or incidental to, the international operation of a ship or ships. Applicable U.S. Treasury regulations provide in general that a foreign corporation will qualify for the benefits of Section 883 if, in relevant part, (i) the foreign country in which the foreign corporation is organized grants an equivalent exemption to corporations organized in the U.S. in respect of each category of shipping income for which an exemption is being claimed under Section 883 (an “equivalent exemption jurisdiction”) and (ii) the foreign corporation meets a defined publicly-traded corporation stock ownership test (the “publicly-traded test”). Subsidiaries of foreign corporations that are organized in an equivalent exemption jurisdiction and meet the publicly-traded test also benefit from Section 883. We believe that Panama is an equivalent exemption jurisdiction and that Carnival Corporation currently satisfies the publicly-traded test under the regulations. Accordingly, substantially all of Carnival Corporation’s income is exempt from U.S. federal income and branch profit taxes.
Regulations under Section 883 list certain activities that the Internal Revenue Service (“IRS”) does not consider to be incidental to the international operation of ships and, therefore, the income attributable to such activities, to the extent such income is U.S. source, does not qualify for the Section 883 exemption. Among the activities identified as not incidental are income from the
sale of air transportation, transfers, shore excursions and pre- and post-cruise land packages to the extent earned from sources within the U.S.
2.Exemption Under Applicable Income Tax Treaties
We believe that the U.S. source transportation income earned by Carnival plc and its subsidiaries qualifies for exemption from U.S. federal income tax under applicable bilateral U.S. income tax treaties.
3.U.S. State Income Tax
Carnival Corporation, Carnival plc and certain subsidiaries are subject to various U.S. state income taxes generally imposed on each state’s portion of the U.S. source income subject to U.S. federal income taxes. However, the state of Alaska imposes an income tax on its allocated portion of the total income of our companies doing business in Alaska and certain of their subsidiaries.
b.UK and Australian Income Tax
Cunard, P&O Cruises (UK) and P&O Cruises (Australia) are divisions of Carnival plc and have elected to enter the UK tonnage tax regime under a rolling ten-year term and, accordingly, reapply every year. Companies to which the tonnage tax regime applies pay corporation taxes on profits calculated by reference to the net tonnage of qualifying ships. UK corporation tax is not chargeable under the normal UK tax rules on these brands’ relevant shipping income. Relevant shipping income includes income from the operation of qualifying ships and from shipping related activities.
For a company to be eligible for the regime, it must be subject to UK corporation tax and, among other matters, operate qualifying ships that are strategically and commercially managed in the UK. Companies within the UK tonnage tax regime are also subject to a seafarer training requirement.
Our UK non-shipping activities that do not qualify under the UK tonnage tax regime remain subject to normal UK corporation tax.
P&O Cruises (Australia) and all of the other cruise ships operated internationally by Carnival plc for the cruise segment of the Australian vacation region are exempt from Australian corporation tax by virtue of the UK/Australian income tax treaty.
c.Italian and German Income Tax
In December 2024, the European Commission formally approved the Italian tonnage tax rules for 10 years. In 2025, Costa and AIDA will elect to remain in the Italian tonnage tax regime through 2034. Companies to which the tonnage tax regime applies pay corporation taxes on shipping profits calculated by reference to the net tonnage of qualifying ships.
Our non-shipping activities that do not qualify under the Italian tonnage tax regime remain subject to normal Italian corporation tax.
Substantially all of AIDA’s earnings are exempt from German income taxes by virtue of the Germany/Italy income tax treaty.
d. Global Minimum Tax
The Organization for Economic Co-operation and Development (“OECD”) issued Model Rules for implementation of a 15% minimum tax for multinational enterprises as part of its initiative intended to address the tax challenges arising from globalization. Subject to certain requirements, the OECD Model Rules provide an exclusion for international shipping income.
The implementation of these rules will affect Carnival plc and its subsidiaries beginning in fiscal 2025 and Carnival Corporation and certain of its subsidiaries beginning in fiscal 2026. We expect Carnival plc and its subsidiaries will be eligible for the international shipping income exclusion based on their current structure. Carnival Corporation and certain of its subsidiaries intend to align into a single tax jurisdiction where the international shipping income for its North American brands is also expected to qualify for this exemption. As a result, we do not believe the application of these rules will have a material impact on our consolidated financial statements.
e. Other
In addition to or in place of income taxes, virtually all jurisdictions where our ships call impose taxes, fees and other charges based on guest counts, ship tonnage, passenger capacity or some other measure.
XVIII. Governmental Regulations
a. Maritime Regulations
1. General
Our ships are regulated by numerous international, national, state and local laws, regulations, treaties and other legal requirements, as well as voluntary agreements, which govern health, environmental, safety and security matters in relation to our guests, crew and ships. These requirements change frequently, depending on the itineraries of our ships and the ports and countries visited. If we violate or fail to comply with any of these laws, regulations, treaties and other requirements, we could be fined or otherwise sanctioned by regulators. We are committed to complying with, or exceeding, all relevant requirements.
The primary regulatory bodies that establish maritime laws and requirements applicable to our ships include:
The International Maritime Organization (“IMO”): All of our ships, and the maritime industry as a whole, are subject to the maritime safety, security and environmental regulations established by the IMO, a specialized agency of the United Nations. The IMO’s principal sets of requirements are mandated through its International Convention for the Safety of Life at Sea (“SOLAS”), its International Convention for the Prevention of Pollution from Ships (“MARPOL”) and its International Convention on Standards of Training, Certification and Watchkeeping for Seafarers (“STCW”).
Flag States: Our ships are registered, or flagged, in The Bahamas, Bermuda, Italy, the Netherlands, Panama and the UK, which are also referred to as Flag States. Our ships are regulated by these Flag States through international conventions that govern, among other things, health, environmental, safety and security matters in relation to our guests, crew and ships. Representatives of each Flag State conduct periodic inspections, surveys and audits to verify compliance with these requirements.
Ship classification societies: Class certification is one of the necessary documents required for our ships to be flagged in a specific country, obtain liability insurance and legally operate as passenger cruise ships. Our ships are subject to periodic class surveys, including dry-dock inspections, by ship classification societies to verify that our ships have been maintained in accordance with the rules of the classification societies and that recommended repairs have been satisfactorily completed. Dry-dock frequency is a statutory requirement mandated by SOLAS.
National, regional, and other authorities: We are subject to the decrees, directives, regulations, and requirements of the European Union (“EU”), the UK, the U.S., other countries, and many other authorities, including ports that our ships visit.
Port regulatory authorities (Port State Control): Our ships are also subject to inspection by the port regulatory authorities, which are also referred to as Port State Control, in the various countries that they visit. Such inspections include verification of compliance with the maritime safety, security, environmental, customs, immigration, health and labor requirements applicable to each port, as well as with regional, national and international requirements. Many countries have joined together to form regional Port State Control authorities.
Our Boards of Directors have Health, Environment, Safety and Security (“HESS”) Committees, which were comprised of six independent directors as of November 30, 2024. The principal function of the HESS Committees is to assist the boards in fulfilling their responsibility to supervise and monitor our health, environmental, safety, security and sustainability policies, programs and initiatives at sea and ashore and compliance with related legal and regulatory requirements. The HESS Committees and our management team review significant HESS relevant risks or exposures and associated mitigating actions.
We are committed to implementing appropriate measures to manage identified risks effectively. We have a Chief Maritime Officer to oversee our global maritime operations, including maritime policy, maritime affairs, maritime standards, training, shipbuilding, asset management, health operations, and research and development. In addition, we have a Chief Risk and Compliance Officer who leads the effort to promote and monitor a strong ethics and compliance culture throughout the company, including all areas of HESS.
To help ensure that we are compliant with legal and regulatory requirements and that these areas of our business operate in an efficient and effective manner, we have taken certain actions including, but not limited to:
•Providing regular health, environmental, safety and security support, training, guidance and information to guests, team members and others working on our behalf
•Performing regular shoreside and shipboard audits and taking appropriate action when deficiencies are identified
•Developing, reviewing, and working to improve policies and procedures designed to prevent, detect, respond and correct various regulatory and other violations
•Supporting a comprehensive HESS incident investigation program that is designed to prevent re-occurrence, promote learning, and support continuous improvement
2. Maritime Safety Regulations
The IMO has safety standards as part of SOLAS. To help ensure guest and crew safety, SOLAS establishes requirements for the following: | | | | | |
| • Vessel design and structural features | • Life-saving and other equipment |
| • Construction and materials | • Fire protection and detection |
| • Refurbishment standards | • Safe management and operation |
| • Radio communications | • Musters |
All of our crew undergo regular safety training that meets or exceeds all international maritime regulations, including SOLAS requirements, which are periodically revised. Additionally, we have implemented and continue to develop policies and procedures that we believe enhance our commitment to the safety of our guests and crew.
SOLAS requires implementation of the International Safety Management Code (“ISM Code”), which provides an international standard for the safe management and operation of ships and for pollution prevention. The ISM Code is mandatory for passenger vessel operators. Under the ISM Code, vessel operators are required to:
•Develop and implement a Safety Management System (“SMS”) that includes, among other things, the adoption of safety and environmental protection policies setting forth instructions and procedures for operating vessels safely and describing procedures for responding to emergencies and protecting the environment. In addition, our SMS includes health and security procedures
•Obtain a Document of Compliance (“DOC”) for the vessel operator, as well as a Safety Management Certificate (“SMC”) for each vessel they operate. These documents are issued by the vessel’s Flag State and evidence compliance with the ISM Code and the SMS
•Verify or renew DOCs and SMCs periodically in accordance with the ISM Code
All our ships are regularly audited by our various national authorities, and we are required to maintain the relevant certificates of compliance with the ISM Code.
3. Maritime Security Regulations
Our ships are subject to numerous security requirements. These requirements include the International Ship and Port Facility Security Code, which is part of SOLAS, the U.S. Maritime Transportation Security Act of 2002, which addresses U.S. port and waterway security and the U.S. Cruise Vessel Security and Safety Act of 2010, which applies to all of our ships that embark or disembark passengers in the U.S. These regulations include requirements as to the following:
•Implementation of specific security measures, including onboard installation of a ship security alert system
•Assessment of vessel security
•Efforts to identify and deter security threats
•Training, drills and exercises
•Security plans that may include guest, vehicle and baggage screening procedures, security patrols, establishment of restricted areas, personnel identification procedures, access control measures and installation of surveillance equipment
•Establishment of procedures and policies for reporting and managing allegations of crimes
4. Maritime Environmental Regulations
We are subject to numerous international, multi-national, national, state and local environmental laws, regulations and treaties that govern air emissions, waste management, and the storage, handling, use and disposal of hazardous substances such as chemicals, solvents and paints.
As a means of managing and improving our environmental performance and compliance, we adhere to standards set by the International Organization for Standardization (“ISO”), an international standard-setting body, which produces worldwide industrial and commercial standards. The environmental management system of our company and ships is certified in accordance with ISO 14001, the environmental management standard that was developed to help organizations manage the environmental impacts of their processes, products and services.
i. International Regulations
The principal international convention governing marine pollution prevention and response is MARPOL.
a. Preventing and Minimizing Pollution
MARPOL includes six annexes, four of which are applicable to our cruise ships, containing requirements designed to prevent and minimize both accidental and operational pollution by oil, sewage, garbage and air emissions and the provision of facilities at ports and terminals for the reception of sewage and sets forth specific requirements related to vessel operations, equipment, recordkeeping and reporting that are designed to prevent and minimize pollution. All our ships must carry an International Oil Pollution Prevention Certificate, an International Sewage Pollution Prevention Certificate, an International Air Pollution Prevention Certificate and a Garbage Management Plan. Administrative, civil and criminal penalties may be assessed for violations. The ship’s Flag State issues these certificates, which evidence their compliance with the MARPOL regulations regarding prevention of pollution by oil, sewage, garbage and air emissions. Certain jurisdictions have not adopted all of these MARPOL annexes but have established various national, regional or local laws and regulations that apply to these areas.
MARPOL requires that discharges of machinery space bilge water pass through pollution prevention equipment that separates oil from the water and monitors the discharged water to ensure that the effluent does not exceed 15 parts per million oil content. Our ships have oily water separators with oil content monitors installed and maintain a record of certain engine room operations in an Oil Record Book. In addition, we have voluntarily installed redundant systems on all our ships that monitor processed bilge water a second time prior to discharge to help ensure that it contains no more than 15 parts per million oil content. This system also provides additional controls to prevent improper bilge water discharges. MARPOL also requires that our ships have Shipboard Oil Pollution Emergency Plans.
Furthermore, MARPOL addresses air emissions from vessels, establishes requirements for the prevention of air pollution from ships to reduce emissions of sulfur oxides (“SOx”), nitrogen oxides (“NOx”), particulate matter and greenhouse gases (“GHG”) emissions. It also contains restrictions on the use of ozone depleting substances (“ODS”) and requires the recording of ODS use, equipment containing ODS and the emission of ODS.
b. Sulfur Emissions
The IMO adopted a global 0.5% sulfur cap for marine fuel which began in January 2020. The EU Parliament and Council also adopted 0.5% sulfur content fuel requirement (the “EU Sulfur Directive”). The options to comply with both the global 0.5% sulfur cap and the EU Sulfur Directive include the installation and use of Advanced Air Quality Systems, or the use of low sulfur or alternative fuels.
MARPOL addresses air emissions from both auxiliary and main propulsion diesel engines on ships and further specifies requirements for Emission Control Areas (“ECAs”) with stricter limitations on sulfur emissions content in these areas, requiring ships to use fuel with a sulfur content of no more than 0.1%, or to use alternative emission reduction methods, such as Advanced Air Quality Systems.
We have Advanced Air Quality Systems on most of our ships, which are aiding in partially mitigating the financial impact from the ECAs and global sulfur requirements. We use Advanced Air Quality Systems wherever possible subject to local laws and regulations. Additionally, Advanced Air Quality Systems used with heavy fuel oil (“HFO”) result in as good or better SOx, NOx and particulate emissions compared to marine gasoil (“MGO”).
c. Greenhouse Gas Emissions
The IMO has established technical and operational measures for all ships that are intended to improve energy efficiency and reduce GHG emissions from international shipping. The technical measures apply to the design of new vessels and the operational measures apply to all vessels.
The IMO mandates a data collection system (“DCS”) for reporting fuel oil consumption. The DCS requires ships of 5,000 gross tons and above to provide fuel consumption data to their respective Flag State at the end of each calendar year. Flag States validate the data and transfer it to a database and the IMO produces a summary annual report. In January 2023, MARPOL changes in support of the IMO’s GHG emission reduction goals went into effect and include an operational measure called the Carbon Intensity Indicator (“CII”), an annual ship-level CO2 intensity emissions performance measure, and a technical measure called the Energy Efficiency Existing Ship Index (“EEXI”), a one-off measure similar to the Energy Efficiency Design Index (“EEDI”) for newbuilds, that confirms for a specific condition that a ship meets a target CO2 emission intensity. The EEXI has not had a material impact and the impact for CII is uncertain as it remains under review and the enforcement mechanism of the regulation is still to be defined. The IMO’s 2023 Strategy on Reduction of GHG Emissions from Ships (“IMO Strategy”) strives to peak GHG emissions from international shipping as soon as possible and to reach net zero GHG emissions on a well-to-wake basis by or around 2050. The IMO Strategy includes checkpoints in 2030 and 2040 that seek reductions in the absolute GHG emissions from international shipping by at least 20% and 70%, respectively, compared to 2008. It also includes a target of a 40% reduction in CO2 emissions intensity by 2030 compared to 2008. The IMO Strategy includes a range of measures planned for implementation in 2027, including fuel standards and market-based measures that could result in changes to itineraries or increased compliance related costs for which the impact is uncertain and may individually and collectively have a material impact on our profitability.
d. Ballast Water
Ballast water is water used to stabilize ships at sea and maintain safe operating conditions throughout a voyage. Ballast water can carry a multitude of marine species. The IMO’s Ballast Water Management Convention governs the discharge of ballast water from ships and requires the installation of ballast water management systems for existing ships. The convention also sets forth requirements for ballast water exchange, record keeping, and maintaining an approved Ballast Water Management Plan. The Convention is designed to regulate the treatment of ballast water prior to discharging overboard in order to avoid the transfer of marine species to new environments, as well as establishing other ballast water management practices for monitoring and environmental protection.
ii. U.S. Federal and State Regulations
The Oil Pollution Act of 1990 (“OPA 90”) established a comprehensive federal liability regime, as well as prevention and response requirements, relating to discharges of oil in U.S. waters. The major requirements include demonstrating financial responsibility up to the liability limits set by OPA 90 and having oil spill response plans in place. We have Certificates of Financial Responsibility (“COFR”) that demonstrate our ability to meet the liability limits of OPA 90 and covers releases of hazardous materials. It is possible, however, for our liability limits to be broken, which could expose us to unlimited liability. As OPA 90 expressly allows coastal states to impose liabilities and requirements beyond those imposed under federal law, many U.S. states have enacted laws more stringent than OPA 90. Some of these state laws impose unlimited liability for oil spills and contain more stringent financial responsibility and contingency planning requirements. Most coastal states have also enacted environmental regulations that impose strict liability for removal costs and damages resulting from a discharge of oil or a release of a hazardous substance, similar to OPA 90.
The Clean Water Act (“CWA”) provides the U.S. Environmental Protection Agency (“EPA”) with the authority to regulate incidental discharges from commercial vessels, including discharges of ballast water, bilge water, gray water, anti-fouling paints and other substances during normal operations within the U.S. three-mile territorial sea and inland waters. Pursuant to the CWA authority, the U.S. National Pollutant Discharge Elimination System was designed to minimize pollution within U.S. territorial waters. For our affected ships, the incidental discharge requirements are set forth in EPA’s Vessel General Permit (“VGP”) for discharges incidental to the normal operations of vessels. The VGP establishes effluent limits for specific discharges incidental to the normal operation of a vessel, many of which apply to our cruise ships. In addition to the requirements associated with these discharges and more stringent vessel-specific requirements, the VGP includes requirements for inspections, monitoring, reporting and record-keeping.
The National Invasive Species Act (“NISA”) gives the U.S. Coast Guard (“USCG”) the authority to establish U.S. ballast water management requirements to prevent the spread of invasive species. Pursuant to NISA, the USCG issued ballast water
regulations which include requirements for ballast water management (including type-approved ballast water management systems), monitoring, record-keeping and reporting.
In 2018, the Vessel Incidental Discharge Act (“VIDA”) was signed into law and was intended to clarify and streamline discharge requirements for the incidental discharges covered by the VGP and USCG ballast water regulations. In October 2024, the EPA published the final rule on the VIDA National Standards of Performance. The VIDA requires the USCG to develop corresponding implementation, compliance and enforcement regulations within two years. Until the USCG regulations are final, effective and enforceable, vessels continue to be subject to the existing discharge requirements established in the VGP and the USCG’s ballast water regulations, as well as any other applicable state and local government requirements.
The National Marine Sanctuaries Act provides the National Oceanic and Atmospheric Association with the authority to identify, designate and protect marine areas with special national significance. There are currently 17 National Marine Sanctuaries and two Marine National Monuments in force, some of which are transited through by our ships. Each area is governed by site-specific requirements that prohibit most discharges from ships.
The state of Alaska requires permitting for certain discharges from cruise ships in designated Alaskan waters. Further, the state of Alaska requires that certain discharges be reported and monitored to verify compliance with standards and repeat violators of the regulations could be prohibited from operating in Alaskan waters. Environmental regimes in Alaska are more stringent than the U.S. federal requirements with regard to discharges from vessels. The state of California also has environmental requirements significantly more stringent than federal requirements for water discharges and air emissions.
iii. EU and EU Member State Regulations
The EU has adopted a broad range of substantial environmental measures aimed at improving the quality of the environment. To support the implementation and enforcement of European environmental legislation, the EU has adopted directives on environmental liability and enforcement and a recommendation providing for minimum criteria for environmental inspections.
The European Commission’s (“EC”) strategy is to reduce emissions from ships. The EC strategy seeks to implement SOx Emission Control Areas set out in MARPOL, as discussed above via their own Sulfur Directive.
The EC has also implemented regulations aimed at reducing GHG emissions from maritime shipping through a Monitoring, Reporting and Verification regulation, which involves collecting emissions data from ships over 5,000 gross tons to monitor and report GHG emissions on all voyages to, from and between European Union ports.
The EU adopted a series of significant reforms as a part of its Fit for 55 package to meet its 2030 emissions reduction goal. The main instruments for reducing emissions are the Emissions Trading System (“ETS”), FuelEU Maritime regulation and the Energy Taxation Directive (“ETD”) as well as amendments to the alternative fuels infrastructure and renewable energy directives.
The ETS regulates emissions through a “cap and trade” principle, where a cap is set on the total amount of certain emissions that can be emitted. The maritime shipping sector is included in the scope of ETS effective January 2024 and requires ships to procure emission allowances covering 40% of their 2024 emissions inside EU waters to be surrendered in 2025, 70% of 2025 emissions to be surrendered in 2026 and 100% of annual emissions thereafter, to be surrendered in the following year. The 2024 cost of the ETS regulations was $46 million.
The FuelEU Maritime regulation, which became effective in January 2025, is a long-term framework designed to reduce maritime emissions by increasing the use of sustainable alternative fuels and, for container and passenger ships (including cruise ships), the use of shore power. The regulation requires compliance with the maximum limits of GHG intensity of energy used on board. The stringency of these limits increases over time, and there are financial penalties for non-compliance. The regulation also includes requirements for ships to connect to shore power when at EU ports. We estimate the 2025 impact of complying with the FuelEU Maritime regulation to be approximately $10 to $15 million.
The ETD is a framework for the taxation of energy products and sets minimum rates of excise duty to encourage a low carbon economy. Proposed amendments to the ETD will introduce new tax rates based on the energy content and environmental impact rather than volume. If adopted, these amendments will also widen the directive to include maritime fuels, which were previously exempt. To date, there is no timeline for adoption of these amendments.
Norway has and is considering additional regulations that supersede IMO requirements for certain air emissions from vessels. For example, all ships operating in the Norwegian World Heritage Fjords (“WHF”) must meet IMO Tier III NOx requirements
by January 1, 2025. Additionally, Norway has proposed that large ships operating in the WHF may not emit any GHG starting in 2032. Norway is also currently considering a carbon tax on fuel bunkered by international shipping in Norway.
The exact impact of the Fit for 55 and the Norwegian WHF regulations are uncertain as elements of the proposals have not yet been finalized and enacted and will depend on future deployments.
5. Maritime Health Regulations
We are committed to providing a healthy environment for all of our guests and crew. We collaborate with public health inspection programs throughout the world, such as the Centers for Disease Control and Prevention (“CDC”) in the U.S. and the SHIPSAN Project in the EU, to ensure that development of these programs leads to enhanced health and hygiene onboard our ships. Through our collaborative efforts, we work with the authorities to develop and revise guidelines, review plans and conduct on-site inspections for all newbuilds and significant ship renovations. We work closely with governments and health authorities around the world to ensure that our health and safety protocols comply with the requirements of each location. In addition, we continue to maintain our ships by meeting, and often exceeding, applicable public health guidelines and requirements, complying with inspections, reporting communicable illnesses and conducting regular crew training and guest education programs.
6. Maritime Labor Regulations
The International Labor Organization develops and oversees international labor standards and includes a broad range of requirements, such as the definition of a seafarer, minimum age of seafarers, medical certificates, recruitment practices, training, repatriation, food, recreational facilities, health and welfare, hours of work and rest, accommodations, wages and entitlements.
The STCW, as amended, establishes additional minimum standards relating to training, including security training, certification and watchkeeping for our seafarers.
b. Other Governmental Regulations
Compliance with GHG regulations and the associated potential cost is complicated by the fact that various countries and regions are following different approaches to climate-related regulations.
In most countries where we source the majority of our guests, we are required to establish financial responsibility, such as obtaining a guarantee from stable financial institutions and insurance companies, to satisfy liability in cases of our non-performance of obligations to our guests. The amount of financial responsibility varies by jurisdiction based on the amount mandated by the applicable local legislation, regulatory agency or association.
In Australia and most of Europe, we may be obligated to honor our guests’ cruise payments made by them to their travel agents and tour operators regardless of whether we receive these payments.
In addition, the UK plans to include domestic shipping under its national ETS beginning in January 2026. To date, they have proposed that the domestic legs and port calls of ships engaged in international voyages will be included, consultations with stakeholders is ongoing.
We are, or may in the future become, subject to other laws and regulations which require our compliance, including those addressing antitrust, anti-money laundering, bribery, corruption, data privacy, human rights, securities and sanctions, reporting on sustainability matters, as well as human resources related matters.
XIX. Sustainability
We strive to be a desirable workplace and a model global corporate citizen. Our efforts to ensure the safety and well-being of our guests and crew, protect the environment, create opportunities for our workforce, build strong stakeholder relationships and support the communities we operate in and visit, reflect our core values and are key to our success.
In 2021, we established goals for 2030 which incorporate six focus areas listed below that align with elements of the United Nation’s Sustainable Development Goals and build on the momentum of our successful achievement of our 2020 sustainability goals. Since then, we have achieved several goals ahead of schedule, accelerated the timeline of others and established intermediate goals. During 2024, we conducted a comprehensive review of our 2030 sustainability goals to align with our ongoing vision and progress. This review included revising existing goals, setting new targets, and retiring goals that have already been achieved. The enhancement of our sustainability road map reflects our adaptive approach to addressing evolving environmental and social challenges, both globally and within the cruise industry.
•Climate Action
•Circular Economy
•Good Health and Well-Being
•Sustainable Tourism
•Biodiversity and Conservation
•Inclusion and Belonging
We voluntarily publish Sustainability Reports that address governance, stakeholder engagement, environmental, labor, human rights, society, product responsibility, economic and other sustainability-related issues and performance indicators. These reports are not incorporated in this document and can be viewed at www.carnivalcorp.com, www.carnivalplc.com and www.carnivalsustainability.com. For further information on our 2030 sustainability goals, refer to our Sustainability Report.
We have developed a four-part strategy to help us achieve our climate action goals as follows:
•Fleet optimization: delivering larger, more efficient ships as part of our ongoing newbuild program, some of which may replace existing ships in our fleet
•Energy efficiency: continuing to improve our existing fleet’s energy efficiency through investment in projects such as service power packages (or power saver packs), air lubrication systems and expanding shore power capabilities to leverage renewable energy sources while in port, where available
•Itinerary efficiency: designing more energy-efficient itineraries, focusing on operational execution and investing in port and destination projects in strategic locations
•New technologies and alternative fuels: investing in a first-of-its-kind lithium-ion battery storage system and assessing carbon capture and storage. We also support alternative fuels including biofuels such as bio-methane and bio-methanol, as well as synthetic or e-fuels such as e-methane and e-methanol, which we are assessing as future low GHG emission fuel options for our ships
We are working to further reduce our absolute GHG emissions. We reduced our absolute GHG emissions from ship fuel by approximately 11% as compared to our peak year of 2011 despite capacity growth of nearly 37% over the same period. Additionally, we are pursuing our aspiration of net zero emissions by 2050, aligned with the revised IMO Strategy. Achieving this goal will require energy sources and technologies that do not yet exist at scale. While fossil fuels are currently the only scalable and commercially viable option for our industry, we are closely monitoring technology developments and pioneering important sustainability initiatives in the cruise industry. We have leveraged third party studies and partnered with companies and other organizations to help identify and scale new technologies. For example, we implemented maritime scale battery technology and are working with classification societies and other stakeholders to assess lower GHG emission fuel options for cruise ships and assessing carbon capture and storage technologies. We have successfully used biofuel as a replacement for fossil fuel on 6 ships. The certified biofuels used offer environmental benefits compared to using fossil fuels alone through their lifecycle GHG reductions. These biofuels can be used in existing ship engines without modifications to the engine or fuel infrastructure, including on ships already in service. To provide a path to net zero emissions, alternative low GHG emission fuels will be necessary for the maritime industry; however, there are significant supply and cost challenges that must be resolved before viability is reached. Without clarity on low and zero carbon fuel availability, we are not currently able to make absolute emissions reduction commitments along a prescribed timeline. In our view, a commitment to achieve an absolute greenhouse gas emission reduction pathway without a clear understanding of how this will be achieved is not aligned with our approach to goal setting. While we continue to pursue our aspiration of net zero emissions, our defined goals and targets are set based on feasible, achievable, and available pathways.
We continue to implement Service Power Packages (or Power Saver Packs), a comprehensive set of technology upgrades, which will be completed over the next several years across a portion of the fleet. These upgrades include the following elements designed to reduce both fuel usage and GHG emissions while also contributing to cost savings:
•Comprehensive upgrades to each ship’s hotel HVAC (heating, ventilation, and air conditioning) systems
•LED lighting systems
•Remote monitoring and optimization of energy usage and performance
Service Power Package (or Power Saver Packs) upgrades are the main part of our ongoing energy efficiency investment program and are expected to further improve energy savings and reduce fuel consumption. Upon completion, these upgrades are expected to deliver approximately 5% fuel savings per ship.
We have ten Air Lubrication Systems (“ALS”) operating in our fleet as of November 30, 2024 and have additional installations in progress and planned for the future. ALS cushions the flat bottom of a ship’s hull with air bubbles, which reduces the ship’s frictional resistance and the propulsive power required to drive the ship through the water and generate approximately 5% savings in fuel consumption for propulsion and reductions in GHG emissions on ALS equipped ships when operating in a specific speed range.
We have ten LNG powered cruise ships in operation as of November 30, 2024, which represent nearly 20% of our fleet capacity and six more that are expected to join the fleet through 2033.
While LNG is a fossil fuel and generates GHG emissions, its direct CO2 emissions are lower than those of conventional fuels. It emits virtually zero sulfur oxides (only the sulfur in the pilot fuel is present), reduces nitrogen oxides by 85% and cuts particulate matter by 95%-100%. The types of engines that we use experience small amounts of methane slip (un-combusted methane passing through the engine). There are varying views on measuring LNG’s environmental impact and our disclosures report our emissions, including methane slip, as part of our total GHG emissions (reported as CO2e) using the scientifically accepted 100-year global warming potential (“GWP”) time frame and are measured on a tank-to-wake basis.
We are part of the Methane Abatement in Maritime Innovation Initiative, partnering with other major maritime players to find solutions for this challenge, including evaluating options to remove unburnt methane from exhaust streams. The latest generation of LNG-fueled engines show significantly reduced methane slip and we are working with the engine manufacturers to update our existing engines to improve their methane slip performance. As a result of these efforts, LNG’s advantage over conventional fuels in terms of reduced GHG emissions is expected to grow.
A new ship capable of running on LNG also provides flexibility and future optionality. LNG engines are dual-fuel engines, capable of operating on MGO and LNG, including fossil, biofuel and, when available, synthetic versions of those fuels. The type of tank and system arrangements that we have on our LNG-fueled ships also allows for future conversion to other low GHG fuels such as green methanol. LNG ships are also built with larger fuel tanks, with the space necessary to retrofit for other fuels. Given the expected life of a cruise ship, this provides us with more options to continue to fuel our ships regardless of how the alternative fuel markets develop in the future.
The combined impact of the factors above makes LNG the best readily available fuel to reduce GHG emissions in the absence of market-ready zero-emission or near-zero-emission fuels.
We pioneered the use of Advanced Air Quality Systems on board our ships to aid in the reduction of sulfur and are promoting the use of shore power. Shore power enables our ships to use shoreside electric power, where available, while in port rather than running their engines to power their onboard services, resulting in reduced engine emissions and noise in port. We also pioneered the use of shore power in 2001. More than two-thirds of our ships are equipped with this capability, and that number will increase over time as more ports provide shore power. We have continued our work with several local port authorities to utilize cruise ship shore power connections.
We have considered our sustainability goals and efforts, as described above, in connection with the preparation of our consolidated financial statements and any estimates used in the preparation of our consolidated financial statements.
We have voluntarily reported our GHG footprint via the CDP each year since 2006. The CDP rates companies on the depth and scope of their disclosures and the quality of their reporting. Our submission includes details of our most recently compiled emissions data and reduction efforts, along with the results of an independent, third-party verification of our GHG emissions. We also disclose our holistic water stewardship to use less, reuse more and clean as well as purify used water to return to nature through the CDP water program.
Carnival Corporation & plc’s GHG emissions inventory management plan follows the guidance in The Greenhouse Gas Protocol and ISO 14064-1:2018 and our environmental management system is certified in accordance with the ISO 14001:2015 Environmental Management System standard.
D. Website Access to Carnival Corporation & plc SEC Reports
We use our websites as channels of distribution of company information. Our Form 10-K, joint Quarterly Reports on Form 10-Q, joint Current Reports on Form 8-K, joint Proxy Statement related to our annual shareholders meeting, Section 16 filings and all amendments to those reports are available free of charge at www.carnivalcorp.com and www.carnivalplc.com and on the SEC’s website at www.sec.gov as soon as reasonably practicable after we have electronically filed or furnished these reports with the SEC. In addition, you may automatically receive email alerts and other information when you enroll your email address by visiting the Investor Services section of our websites. The content of any website referred to in this document is not incorporated by reference into this document.
E. Industry and Market Data
This document includes market share and industry data and forecasts that we obtained from industry publications, other third-party information and internal company surveys. Industry publications, including those from Cruise Industry News, and surveys and forecasts, generally state that the information contained therein has been obtained from sources believed to be reliable. Cruise Industry News is a for profit magazine company that covers all aspects of cruise operations. Their magazines and annual report cover all cruise lines and shipyards and report on all aspects of cruise operations including relevant issues, financial results, ship building, ship reviews, etc. All other references to third party information are publicly available at nominal or no cost. We use the most currently available industry and market data to support statements as to our market positions. Although we believe that the industry publications and third-party sources are reliable, we have not independently verified any of the data. Similarly, while we believe our internal estimates with respect to our industry are reliable, they have not been verified by any independent sources. While we are not aware of any misstatements regarding any industry data presented herein, our estimates, in particular as they relate to market share and our general expectations, involve risks and uncertainties and are subject to change based on various factors, including those discussed under Part I, Item 1A. Risk Factors and Part II, Item 7, Management’s Discussion and Analysis of Financial Condition and Results of Operations, in this Form 10-K.
Item 1A. Risk Factors.
You should carefully consider the following discussion of material factors, events and uncertainties that make an investment in the company’s securities risky and provide important information for the understanding of the “forward-looking” statements discussed in this Form 10-K and elsewhere. These risk factors should be read in conjunction with other information in this Form 10-K.
The events and consequences discussed in these risk factors could have a material adverse effect on the company’s business, financial condition, operating results and stock price. These risk factors do not identify all risks that the company faces; operations could also be affected by factors, events, or uncertainties that are not presently known to the company or that the company currently does not consider to present material risks to its operations. In addition to the risk factors below, additional or unforeseen effects from our substantial debt balance incurred during the pause of our guest cruise operations could give rise to additional risks or amplify many of the risks discussed below. Some of the statements in this item and elsewhere in this document are “forward-looking statements.” For a discussion of those statements and of other factors to consider see the “Cautionary Note Concerning Factors That May Affect Future Results” section.
The ordering and lettering of the risk factors set forth below is not intended to reflect any company indication of priority or likelihood.
Operational Risk Factors
a.Events and conditions around the world, including geopolitical uncertainty, war and other military actions, pandemics, inflation, higher fuel prices, higher interest rates and other general concerns impacting the ability or desire of people to travel could lead to a decline in demand for cruises as well as have significant negative impacts on our financial condition and operations.
We have been, and may continue to be, impacted by the public’s concerns regarding the health, safety and security of travel, including pandemics, government travel advisories and travel restrictions, political instability and civil unrest, terrorist attacks, war and military action and other general concerns. The resulting impacts of these events, including a pause of our guest cruise
operations, supply chain disruptions, increased fuel prices, impact on demand for cruises to neighboring regions and international sanctions and other measures that have been imposed, have significantly adversely affected, and may in the future significantly adversely affect, our business. These factors may also have the effect of heightening many other risks to our business, any of which could materially and adversely affect our business and results of operations. Additionally, we have been, and may continue to be, impacted by heightened regulations around customs and border control, travel bans to and from certain geographical areas, voluntary changes to our itineraries in light of geopolitical events, government policies increasing the difficulty of travel and limitations on issuing international travel visas. We may be impacted by adverse changes in the perceived or actual economic climate, such as inflation, global or regional recessions, higher unemployment and underemployment rates and declines in income levels.
b. Incidents concerning our ships, guests or the cruise industry may negatively impact the satisfaction of our guests and crew and lead to reputational damage.
Our operations involve the risk of incidents and media coverage thereof. Such incidents include, but are not limited to, the improper operation or maintenance of ships, motorcoaches and trains; guest and crew illnesses; mechanical failures, fires and collisions; repair delays, groundings and navigational errors; oil spills and other maritime and environmental issues as well as other incidents at sea, while in port or on land, which have in the past and may in the future generate negative publicity or cause voyage disruptions or changes in itineraries, guest and crew discomfort, injury, or death. Although our commitment to the safety and comfort of our guests and crew is paramount to the success of our business, our ships have been involved in outbreaks, accidents and other incidents in the past and we may experience similar or other incidents in the future. Our ability to attract and retain the loyalty of our guests, our ability to hire and the amounts we must pay our crew depend, in part, upon the perception and reputation of our company and our brands and the public’s concerns regarding the health and safety of travel generally, as well as the cruising industry and our ships specifically. In addition, these and any other events which impact the travel industry more generally may negatively impact our guests’ and/or crew’s ability or desire to travel to or from our ships and/or interrupt the supply of critical goods and services.
c. Changes in and non-compliance with laws and regulations under which we operate, such as those relating to health, environment, safety and security, data privacy and protection, anti-money laundering, anti-corruption, economic sanctions, trade protection, labor and employment, and tax may be costly and lead to litigation, enforcement actions, fines, penalties and reputational damage.
We are subject to numerous international, national, state and local laws, regulations, treaties and other legal requirements that govern health, environmental, safety and security matters in relation to our guests, crew and ships. These requirements change regularly, depending on the itineraries of our ships and the ports and countries visited. Implementing these and any subsequent requirements have been, and may in the future continue to be costly and take time to implement across our global cruise operations. In addition, the accelerating pace of regulatory changes may affect our ability to comply in the future. If we violate or fail to comply with any of these laws, regulations, treaties and other requirements we could be, and have previously been, fined, placed on probation or otherwise sanctioned by regulators. In addition, there is increased global focus on climate change, which may lead to additional regulatory requirements. Refer to Operational Risk Factor “d.” below for additional discussion on climate change regulation risks.
In the course of doing business, we collect guest, team member, company and other third-party data, including personal and other sensitive data. We are subject to laws and requirements related to the treatment and protection of personal, sensitive and/or other regulated data in the jurisdictions where we operate. Various governments, agencies and regulatory organizations have enacted or are considering new rules and regulations and we expect to continue to incur costs to comply with these rules and regulations.
Our operations subject us to potential liability under anti-money laundering and anti-corruption laws and regulations. We may also be affected by economic sanctions, trade protection laws, policies and other regulatory requirements affecting trade and investment.
We are subject to compliance with tax laws, regulations and treaties in the jurisdictions in which we are incorporated or operate. These tax laws, regulations and treaties are subject to change at any time, which may result in substantially higher tax expense. For example, the implementation of the OECD’s rules will affect Carnival plc and its subsidiaries beginning in fiscal 2025 and Carnival Corporation and certain of its subsidiaries beginning in fiscal 2026. The application of these rules continues to evolve, and its outcome may alter our tax obligations in certain countries in which we operate. Refer to XVII. Taxation for additional discussion on the OECD’s rules. Other changes in domestic and international tax rules and regulations and their application could also alter our tax obligations.
d. Factors associated with climate change, including evolving and increasing regulations, increasing global concern about climate change and the shift in climate conscious consumerism and stakeholder scrutiny, and increasing frequency and/or severity of adverse weather conditions could have a material impact on our business.
Growing concerns regarding climate change have resulted in increased global regulatory focus on GHG and other emissions which have impacted us and may in the future have material impacts on our business. Refer to XVIII. Governmental Regulations for additional discussion of recent developments related to Maritime Regulations, Greenhouse Gas Emissions and EU Regulations. Fossil fuels are currently the only viable option for our industry and it is not clear when alternative fuels or other technologies will be commercially viable at scale. To provide a path to net zero emissions, alternative low GHG emission fuels will be necessary for the maritime industry; however, there are significant supply challenges that must be resolved before viability is reached. Climate change-related regulatory activity and developments that require us to reduce our emissions, which includes both the EU regulations and IMO Strategy (refer to XVIII. Governmental Regulations), have impacted us and may in the future have a material impact on our business and financial results by requiring us to make capital investments in new equipment or technologies, pay for emission allowances, purchase carbon offset credits, or otherwise incur additional costs or take additional actions related to our emissions. Such activity has impacted and may continue to impact us indirectly by increasing our operating costs, including fuel costs. Regulatory developments may also result in the inability to operate ships that do not meet certain standards, the acceleration of the removal of less fuel-efficient ships from our fleet and impact the resale value of our ships in the future. In addition, regulatory developments may restrict or limit our access to certain destinations and/or countries or impact our freedom to operate. Regulatory efforts, both internationally and in the U.S., are evolving, including the international alignment of such efforts, and we cannot determine what final regulations will be enacted, modified, or reversed or what their ultimate impact on our business will be.
Growing recognition among consumers globally of the negative effects of climate change and the impact of GHG and other emissions may lead to material changes in consumer preferences. For instance, our guests may choose a vacation option that they perceive as operating in a manner that is more sustainable for the climate, seek alternative methods of travel, or reduce the amount and frequency of their travel. In addition, some environmental focused groups have and may continue to generate negative publicity regarding the environmental impact of the cruise industry and are advocating for more stringent oversight and regulation of our industry, including of ship emissions while the ship is docked and at sea. At the same time, we may also face negative impacts from consumers who do not support climate-related initiatives or concerns. Environmental scrutiny of our operations and the industry from the investment community, other stakeholders, and the media (including social media) have impacted and may continue to impact how we are perceived, which may have a material impact on our operations and financial results. Certain climate-related actions and investments we make today may not lead us to our intended future emissions related goals or may not be favorably perceived in future years based on continuing evolving regulations and perceptions around effective emissions mitigation strategies and technologies.
Our cruise ships, hotels, land tours, port and related commercial facilities and shore excursions have been and may continue to be impacted by adverse weather patterns or other natural disasters, such as hurricanes, earthquakes, floods, fires, tornadoes, tsunamis, typhoons and volcanic eruptions. Climate change is expected to increase the frequency and intensity of certain adverse weather patterns, possibly making certain destinations less desirable or impacting our business in other ways. We have been forced to, and in the future may be forced to, alter itineraries or cancel a cruise or a series of cruises or tours due to these or other types of disruptions. The physical climate-related risks to our business include increased hurricane/typhoon intensity and frequency, increases in global temperatures and rising sea levels which may adversely impact our shoreside facilities, our investments in ports or the availability or desirability of ports and destinations in which we operate. These effects may also disrupt the supply of critical goods and services to our facilities and ships. Any of these events could have a material impact on our business and profitability.
e. Inability to meet or achieve our targets, goals, aspirations, initiatives, and our public statements and disclosures regarding them, including those related to sustainability matters, may expose us to risks that may adversely impact our business.
We have developed and will continue to establish targets, goals, aspirations, and other objectives, including those related to sustainability matters (“sustainability objectives”). These statements reflect our current plans and do not constitute a guarantee that they will be achieved. Our efforts to research, establish, accomplish, and accurately report on our sustainability objectives expose us to numerous operational, reputational, financial, legal, and other risks, any of which could have a negative impact on our business. Our ability to achieve any of our stated sustainability objectives, particularly with respect to our environmental emissions aspirations, is subject to numerous factors and conditions, many of which are outside of our control. Examples of such factors include the availability and costs of low- or non-GHG emission energy sources and technology that do not yet exist at scale for our industry, evolving regulatory requirements affecting sustainability standards or disclosures, the availability of future financing and the availability of suppliers that can meet our sustainability standards.
Our business may face increased scrutiny from our guests, our team members, the investment community, governments, regulators, destinations and other stakeholders that we serve related to our sustainability activities, including the sustainability objectives that we adopt, our methodologies and timelines for pursuing them and our ability to document and support the
achievement of those objectives, as their expectations for such matters continue to evolve. If our sustainability practices do not meet, are adverse to, or are perceived to fall short of, the expectations of our guests, team members, investors or other stakeholders, demand for cruising, our reputation, our ability to attract or retain team members, and our attractiveness as an investment could be negatively impacted. In addition, governments may restrict or limit our access to ports and destinations for which there is high guest demand. Similarly, our pursuit, or our failure or perceived failure to pursue, meet or fulfill our targets, goals, aspirations, and other objectives (including sustainability objectives) within the timelines we announce, or at all, could have the same negative impacts as well as expose us to government enforcement actions and private litigation.
f. Cybersecurity incidents and data privacy breaches, as well as disruptions and other damages to our principal offices, information technology operations and system networks and failure to keep pace with developments in technology have adversely impacted and may in the future materially adversely impact our business operations, the satisfaction of our guests and crew and may lead to fines, penalties and reputational damage.
We have been and may continue to be impacted by cybersecurity incidents and data privacy breaches, which occur from time to time. These malicious attacks can vary in scope and aim to disrupt or compromise our shoreside and shipboard operations by targeting our key operating systems or those of our third-party service providers. Breach or circumvention of our systems or the systems of third parties, including by ransomware or malware, through vulnerabilities in licensed software or hardware, generative artificial intelligence (“AI”) impersonation, targeted and coordinated attacks of our systems or as a result of other attacks, have led to and may continue to lead to disruptions in our business operations; unauthorized access to (or the loss of company access to) competitively sensitive, confidential or other critical data (including sensitive financial, medical or other personal or business information) or systems; loss of customers; financial losses; regulatory investigations, enforcement actions, fines and penalties; litigation; reputational damage; and misuse or corruption of critical data and proprietary information, any of which could be material. Additionally, integrating AI into our operations may increase our cybersecurity and data privacy risks. We also have and may continue to rely on third parties in helping us manage our cybersecurity risk management processes. Any measures that we take and such third parties take to avoid, detect, mitigate or recover from material cybersecurity threats or incidents can be expensive, and may be insufficient, circumvented, or may become ineffective.
Our physical work locations, including those that house our information technology operations, system networks and various other remote locations may be impacted by actual or threatened natural disasters (for example, hurricanes, earthquakes, floods, fires, tornadoes, tsunamis and typhoons) or other disruptive events. Our maritime and/or shoreside operations, including our ability to manage our inventory of cabins held for sale and set pricing, control costs and serve our guests, depends on the reliability of our information technology operations and system networks, as well as our ability to refine and update to more advanced systems and technologies. In addition, we may be unable to obtain appropriate technology in a timely manner or at all or we may incur significant costs in doing so. A failure to adopt the appropriate technology, or a failure, disruption or obsolescence in the technology that we do adopt, could have adverse effects on our business.
g. The loss of key team members, our inability to recruit or retain qualified shoreside and shipboard team members and increased labor costs could have an adverse effect on our business and results of operations.
Our success depends, in large part, on the skills and contributions of our team members, and on our ability to recruit, develop and retain high quality, diverse team members. We may not be successful in recruiting, developing or retaining key or other highly qualified team members. In addition, high-GHG emission industries may become a less attractive employment opportunity. At times we have, and may in the future continue to, experience difficulty in hiring sufficient qualified team members, due to general macroeconomic factors and/or increasingly competitive labor markets.
In addition, we hire a significant number of qualified shipboard team members each year and, thus, our ability to adequately recruit, develop and retain these individuals is important to our success. Incidents involving cruise ships, including disease outbreaks on our ships and increasing demand as a result of the industry’s projected growth could negatively impact our ability to recruit, develop and retain sufficient qualified shipboard team members.
h. Increases in fuel prices, changes in the types of fuel consumed and availability of fuel supply may adversely impact our scheduled itineraries and costs.
We have been and may continue to be impacted by economic, market and political conditions around the world, regulatory requirements including climate-induced regulations, supply disruptions and related infrastructure needs, which make it difficult to predict the future price and availability of fuel. The supply and availability of different fuel types in various markets in which we operate have experienced increased volatility and have led to increased fuel prices and reduced profitability. Future increases in the global price of fuel would increase the cost of our cruise ship operations as well as some of our other expenses, such as crew travel, freight and commodity prices. Increases in airfares, such as those resulting from increases in the price of fuel, have in the past and may in the future increase our guests’ overall vacation costs and reduce demand for cruises, as many of our guests depend on airlines to transport them to or from the airports near the ports where our cruises embark and
disembark. Refer to Operational Risk Factor “d.” for additional discussion on the impact of climate change and regulation changes on fuel costs.
i. We rely on suppliers who are integral to the operations of our businesses. These suppliers and service providers may be unable to deliver on their commitments, which could negatively impact our business.
We rely on suppliers to deliver key products and services to the operations of our businesses around the world. Any event impacting a supplier’s ability to deliver quality goods and services at the location and time needed could negatively impact our ability to operate our business. Events impacting our supply chain could be caused by factors beyond the control of our suppliers or us, including labor actions, increased demand, problems in production or distribution and/or disruptions in third-party logistics, information technology or transportation systems. In addition, global events in recent years have resulted in widespread global supply chain disruptions to suppliers including critical supply chain shortages, labor shortages, significant material cost inflation and extended lead times for items that are required for our operations. Any such interruptions to our supply chain could increase our costs and could limit the availability of products critical to our operations.
j. Fluctuations in foreign currency exchange rates may adversely impact our financial results.
We earn revenues, pay expenses, purchase and own assets and incur liabilities in currencies other than the U.S. dollar. Additionally, our shipbuilding contracts are typically denominated in euros. Movements in foreign currency exchange rates, which at times have been more volatile, will affect our financial results.
k. Overcapacity and competition in the cruise and land-based vacation industry may negatively impact our cruise sales, pricing and destination options.
We have been and may in the future be impacted by increases in capacity in the cruise and land-based vacation industry, which may result in capacity growth beyond demand, either globally or for a region, or for a particular itinerary. We face competition from other cruise brands on the basis of overall experience, destinations, types and sizes of ships and cabins, travel agent partner preferences and value. In addition, we may fail to sufficiently invest in or upgrade our existing cruise ships and other assets to meet the expectations of current and potential guests. We also compete with land-based vacation alternatives throughout the world on the basis of overall experience, destinations and value. In addition, certain ports and destinations have faced a surge of both cruise and non-cruise tourism and in certain destinations, countermeasures to limit the number of tourists have been proposed or contemplated and/or put into effect, including limits on cruise ships and cruise guests. Potential restrictions in ports and destinations could limit the itinerary and destination options we can offer our guests going forward.
l. Inability to implement our shipbuilding programs and ship repairs, maintenance and refurbishments may adversely impact our business operations and the satisfaction of our guests.
There are a limited number of shipyards with the capability and capacity to build, repair, maintain and/or upgrade our ships, which may limit our ability to meet our capacity growth or ship refurbishment objectives. In addition, we have in the past and may in the future be impacted by unforeseen events, such as work stoppages, supply chain issues, insolvencies, “force majeure” events or other financial difficulties experienced by shipyards, their subcontractors and our suppliers. This may result in less shipyard availability resulting in delays or preventing the delivery of our ships under construction and/or the completion of the repair, maintenance or refurbishment of our existing ships. This may lead to potential delays or cancellations of cruises. Additionally, the prices of various commodities that are used in the construction of ships and for repair, maintenance and refurbishment of existing ships, such as steel, are subject to volatility which may increase our costs.
Financial Risk Factors
a. We require a significant amount of cash to service our debt and sustain our operations. Our ability to generate cash depends on many factors, including those beyond our control, and we may not be able to generate cash required to service our debt and sustain our operations.
Our ability to meet our debt service obligations, refinance our debt or sustain our business needs and operations depends on our future operating and financial performance and our ability to generate cash. This will be affected by our ability to successfully continue to execute on our business strategy, which if unsuccessful, would negatively impact the occupancy levels and pricing of our cruises. Our future performance is also impacted by general macroeconomic, financial, geopolitical, competitive, regulatory and other factors beyond our control such as inflation, higher fuel prices, higher taxes and higher interest rates. If we cannot generate sufficient cash to meet our debt service obligations or fund our other business needs, we may, among other things, need to refinance our debt, obtain additional financing, delay planned capital expenditures or sell assets. We cannot make assurances that we will be able to generate sufficient cash through any of the foregoing. If we are not able to refinance our
debt, obtain additional financing or sell assets on commercially reasonable terms or at all, we may not be able to satisfy our obligations with respect to our debt. Refer to Liquidity, Financial Condition and Capital Resources.
b. Our substantial debt could adversely affect our financial health and operating flexibility.
We have a substantial amount of debt, significant debt service obligations and related covenant restrictions. Despite our leverage, we may incur more debt, subject to certain restrictions, in the future. Our substantial debt has had and could continue to have important negative consequences for us. Our substantial debt could, among other things:
•require us to dedicate a large portion of our cash flow from operations to servicing debt and funding repayments on our debt, thereby reducing the availability of our cash flow to fund working capital, capital expenditures and other general corporate purposes;
•increase our vulnerability to adverse general economic or industry conditions;
•limit our flexibility in planning for, or reacting to, changes in our business or the industry in which we operate;
•limit our ability to pay dividends or distributions on or redeem or repurchase stock and make other restricted payments;
•place us at a disadvantage compared to others that have less debt;
•make us more vulnerable to downturns in our business, the economy or the industry in which we operate;
•limit our ability to raise additional debt or equity capital in the future to satisfy our requirements relating to working capital, capital expenditures, development projects, strategic initiatives or other purposes;
•restrict us from introducing new technologies or exploiting business opportunities;
•make it difficult for us to satisfy our obligations with respect to our debt; and
•expose us to the risk of increased interest rates as certain of our borrowings are (and may be in the future) at a variable rate of interest.
Certain of our indebtedness accrues interest at variable rates, which subjects us to interest rate volatility with respect to such instruments and could cause our debt service obligations to increase significantly. If we breach the covenants or restrictions in our debt instruments, we could trigger a default under the terms of certain of our debt instruments. If that occurs, we may be required to seek covenant amendments or the relevant creditors could elect to declare the debt, together with accrued and unpaid interest and other fees, if any, immediately due and payable (or cancel any unfunded commitments, if applicable) and proceed against the collateral, if any, securing that debt. Borrowings under our other debt instruments that contain cross-default provisions may also be accelerated or become payable on demand, and our assets may not be sufficient to repay such indebtedness in full.
Item 1B. Unresolved Staff Comments.
None.
Item 1C. Cybersecurity.
With an increasingly technology-driven business landscape, cybersecurity is critical to safeguarding our company's shipboard and shoreside assets and maintaining our operational integrity. We have implemented cybersecurity measures that are designed to protect the confidentiality, integrity and availability of our information technology and operational technology systems against the constantly evolving cyber threats.
Risk Management
Our processes to identify and manage cybersecurity risks form part of our overall risk management framework which includes an organization wide, multi-layered approach to risk assessment and management. Our cybersecurity risk management program is designed to proactively identify, assess and mitigate potential cybersecurity threats. It leverages industry-leading cybersecurity frameworks and standards, such as the National Institute of Standards and Technology (“NIST”) Cybersecurity Framework and the ISO/IEC 27001 standard. We conduct regular risk assessments to evaluate the security posture of our systems and processes, including vulnerability assessments, penetration testing, external attack surface mitigations and monitor our network for suspicious activity and potential breaches. We engage third-party advisory firms to conduct assessments of the maturity of our cybersecurity program, including measures to improve our Payment Card Industry Data Security Standard (“PCI DSS”) compliance, as well as to conduct penetration testing of our shoreside and shipboard assets on a periodic basis. We continue to invest in our information technology, operational technology and cybersecurity programs to layer in the right mix of risk-based controls to protect against evolving threats.
We maintain an incident response plan and related policies and protocols which outline procedures for identifying, reporting and responding to cybersecurity incidents. Our incident response plan is regularly updated to address new threats and tested through crisis simulation exercises involving our shipboard and shoreside employees. We also have an incident response team who is trained to handle a wide range of security events and collaborates with external cybersecurity experts when necessary.
We have data privacy and security standards across the company that are designed to comply with relevant regulations, including the General Data Protection Regulation (“GDPR”), the California Consumer Privacy Act (“CCPA”) and PCI DSS. We employ encryption, access controls, and other data anonymization techniques to safeguard data throughout its lifecycle.
We also have data privacy and cybersecurity focused training for our shoreside and select shipboard team members. We regularly educate our shoreside and shipboard team members about the importance of handling and protecting guest and team member data, including phishing simulation exercises and annual privacy and security training to enhance awareness of how to detect and respond to cybersecurity threats.
Our cybersecurity diligence extends to third-party vendors and partners. We have operationalized processes that seek to identify and manage cybersecurity risks from our service providers, including those who have access to our guest or team member data or direct access to our network, systems and applications, with the goal of minimizing our exposure to third party risks. In addition, cybersecurity and data privacy considerations factor greatly in the sourcing, selection and oversight of our third-party service providers. We generally require third-party service providers that access or host our data, systems, or applications or could otherwise introduce cybersecurity risk to us, to complete additional risk assessments, comply with our security and privacy requirements, and agree to the timely reporting of cyber security incidents to us.
As of November 30, 2024, we are not aware of any risks from cybersecurity threats that have materially affected or are reasonably likely to materially affect our business strategy, results of our operations, or financial condition. Despite our efforts with respect to protecting information technology operations and strengthening our cybersecurity and data privacy positions, we have been, and may continue to be, impacted by breaches in data security and lapses in data privacy, which occur from time to time. In the last three fiscal years, we have not experienced any material cybersecurity incidents and the expenses incurred in connection with cybersecurity incidents were not material. For additional information on the risks from cybersecurity threats and the potential related impacts on the company, refer to Operational Risk Factor f.
Governance
Our Chief Information Security Officer (“CISO”) leads our worldwide efforts in cybersecurity risk reduction and regulatory compliance. Our CISO oversees risk management across information technology operations, cybersecurity and data privacy. With over 20 years of experience across various industries, including Fortune 50 and 100 organizations, our CISO brings a comprehensive background in strategic cybersecurity leadership and risk management. This expertise is further supported by an array of certifications (C-CISO, CISSP, CISM, CRISC, CISA, and CIPT), as well as academic credentials, including a Master’s in Information Systems from Harvard University and a Bachelor’s in Business Administration from Florida International University. Our CISO regularly updates executive management and actively engages within the cybersecurity community to stay informed on the latest industry developments.
Our CISO chairs our Cybersecurity Advisory Council (“CAC”), a cross-functional management committee that drives awareness, ownership and alignment across broad governance and risk stakeholder groups for effective cybersecurity risk management. The CAC is sponsored by our Chief Financial Officer and is composed of senior leaders from our brand information security, data privacy, legal, internal audit and information technology teams. The CAC meets at least quarterly and has responsibility for oversight of our cybersecurity strategic direction, risks and threats, priorities, resource allocation, capabilities and planning. The CISO and her team are informed about and monitor the prevention, detection, mitigation and remediation of cybersecurity incidents in accordance with our cyber incident response plan. Additionally, the CISO informs our Disclosure Committee on a quarterly basis, or more frequently if needed, of any cybersecurity risks or incidents or other information system matters that may affect our business strategy, results of operations or financial condition.
Our Chief Privacy Officer and Data Protection Officers oversee our focus on the proper processing of personal information in alignment with our privacy policy and applicable privacy laws and regulations.
The Audit Committees are responsible for oversight of our risk management with respect to information technology operations and cybersecurity while the Compliance Committees oversee risk management in the area of data privacy and the HESS Committees oversee risk management related to our maritime operational technologies. The Audit Committees receive updates from the CISO on our information technology operations, including cybersecurity developments and risks, three times a year, and our Board of Directors receive updates from the CISO on an annual basis.
Item 2. Properties.
As of November 30, 2024, the Carnival Corporation and Carnival plc headquarters and our larger shoreside locations are as follows:
| | | | | | | | | | | | | | | | | | | | |
| Location | | Square Footage (in thousands) | | Own/Lease | | Principal Operations |
| Miami, FL, U.S.A. | | 463/18 | | Own/Lease | | Carnival Corporation & plc and Carnival Cruise Line |
| Almere, Netherlands | | 253 | | Own | | Arison Maritime Center |
| Rostock, Germany | | 224 | | Own | | AIDA |
| Genoa, Italy | | 204/46 | | Own/Lease | | Costa |
| Southampton, England | | 150 | | Lease | | Carnival plc, Cunard and P&O Cruises (UK) |
| Santa Clarita, CA, U.S.A. | | 113 | | Lease | | Princess Cruises |
| Hamburg, Germany | | 87 | | Lease | | AIDA |
| Seattle, WA, U.S.A. | | 78 | | Lease | | Holland America Line and Seabourn |
| Fort Lauderdale, FL, U.S.A. | | 76 | | Lease | | Princess Cruises |
| Sydney, NSW, Australia | | 26 | | Lease | | P&O Cruises (Australia) |
Information about our cruise ships, including the number each of our cruise brands operate, as well as information regarding our cruise ships under construction may be found under Part I, Item 1. Business. C. “Our Global Cruise Business.” In addition, we own, lease or have controlling interests in port destinations, exclusive islands, hotels, and lodges.
Item 3. Legal Proceedings.
The legal proceedings described in Note 6 – “Contingencies”, are shown in Part II, Item 8. Financial Statements and Supplementary Data, in this Form 10-K. Additionally, SEC rules require disclosure of certain environmental matters when a governmental authority is a party to the proceedings and such proceedings involve potential monetary sanctions that we believe will exceed $1 million for such proceedings.
On June 20, 2022, Princess Cruises notified the Australian Maritime Safety Authorization (“AMSA”) and the flag state, Bermuda, regarding approximately six cubic meters of comminuted food waste (liquid biodigester effluent) inadvertently released by Coral Princess inside the Great Barrier Reef Marine Park. On June 23, 2022, the UK P&I Club N.V. provided a letter of undertaking for approximately $1.9 million (being the estimated maximum combined penalty). On May 31, 2023, we received a summons from the Australia Federal Prosecution Service indicating that formal charges are being pursued against Princess Cruises and the Captain of the vessel. We believe the ultimate outcome will not have a material impact on our consolidated financial statements.
On February 5, 2024, P&O Cruises (Australia) notified the AMSA and the UK Marine Accident Investigation Branch that a small amount of oil may have inadvertently contaminated grey water which was discharged by Pacific Adventure in the Great Barrier Reef Marine Park, Queensland. We intend to cooperate with any inquiries from governmental authorities. We believe the ultimate outcome will not have a material impact on our consolidated financial statements.
Item 4. Mine Safety Disclosures.
None.
PART II
Item 5. Market for Registrants’ Common Equity, Related Stockholder Matters and Issuer Purchases of Equity Securities.
A. Market Information
Carnival Corporation common stock, together with paired trust shares of beneficial interest in the P&O Princess Special Voting Trust, which holds a Special Voting Share of Carnival plc, is traded on the NYSE under the symbol “CCL.” Carnival plc ordinary shares trade on the London Stock Exchange under the symbol “CCL.” Carnival plc American Depositary Shares (“ADSs”), each one of which represents one Carnival plc ordinary share, are traded on the NYSE under the symbol “CUK.” The depositary for the ADSs is JPMorgan Chase Bank, N.A.
B. Holders
As of January 13, 2025, there were 2,315 holders of record of Carnival Corporation common stock and 28,223 holders of record of Carnival plc ordinary shares and 400 holders of record of Carnival plc ADSs.
C. Dividends
We do not expect to pay dividends on Carnival Corporation common stock and Carnival plc ordinary shares for at least the next couple of years.
D. Securities Authorized for Issuance under Equity Compensation Plans
The information required by Item 201(d) of Regulation S-K is shown in Part III, Item 12. Security Ownership of Certain Beneficial Owners and Management and Related Stockholder Matters, in this Form 10-K.
E. Performance Graph
Carnival Corporation
The following graph compares the Price Performance of $100 if invested in Carnival Corporation common stock with the Price Performance of $100 if invested in each of the Dow Jones U.S. Recreational Services Index (the “Dow Jones Recreational Index”), the FTSE 100 Index and the S&P 500 Index. The Price Performance, as used in the Performance Graph, is calculated by assuming $100 is invested at the beginning of the period in Carnival Corporation common stock at a price equal to the market value. At the end of each year, the total value of the investment is computed by taking the number of shares owned, assuming Carnival Corporation dividends are reinvested, multiplied by the market price of the shares.
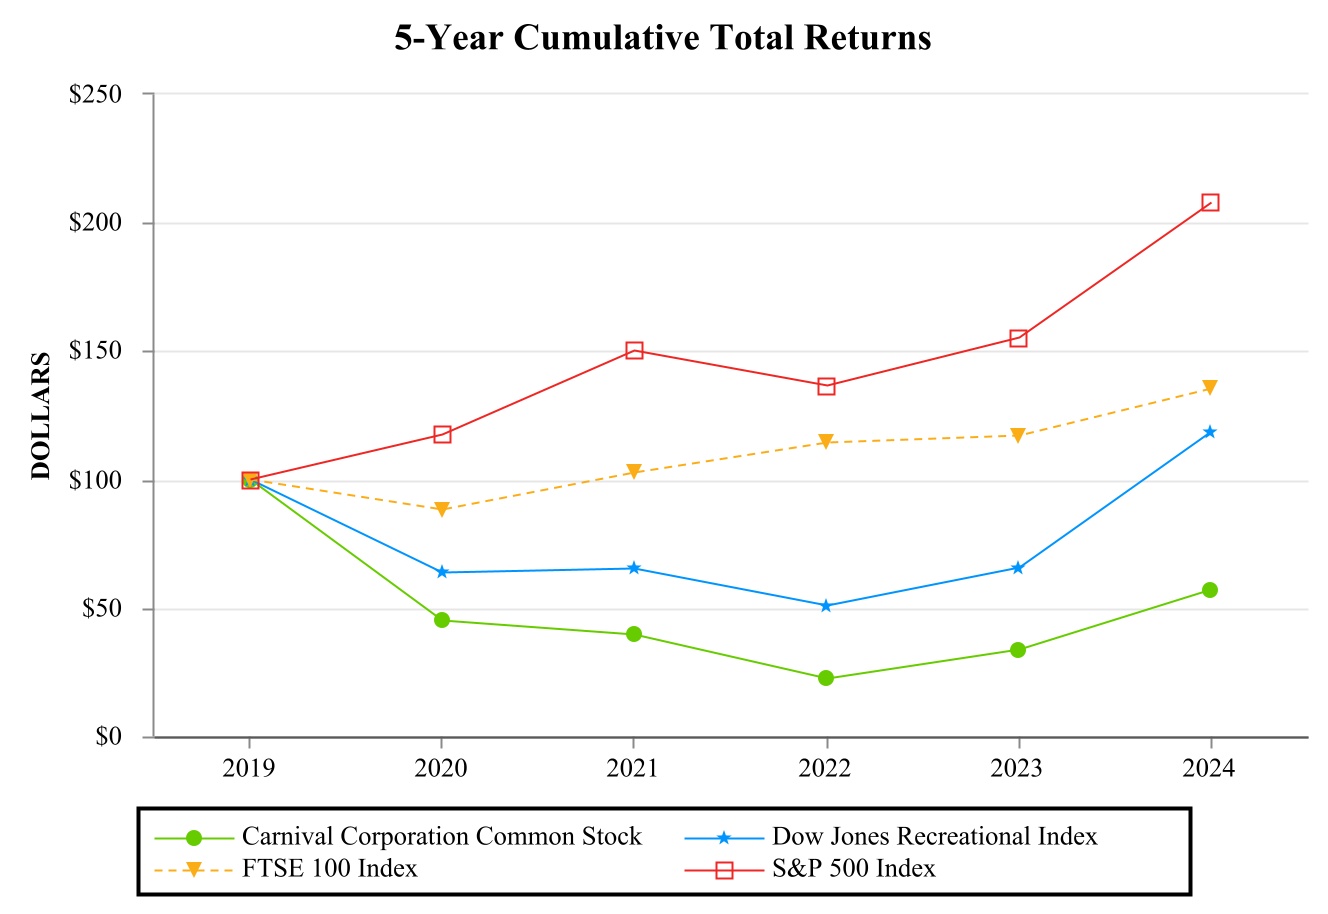
| | | | | | | | | | | | | | | | | | | | | | | | | | | | | | | | | | | | | | |
| Assumes $100 Invested on November 30, 2019
Assumes Dividends Reinvested
Years Ended November 30, |
| | 2019 | | 2020 | | 2021 | | 2022 | | 2023 | | 2024 |
| Carnival Corporation Common Stock | | $ | 100 | | | $ | 45 | | | $ | 40 | | | $ | 22 | | | $ | 34 | | | $ | 57 | |
| Dow Jones Recreational Index | | $ | 100 | | | $ | 64 | | | $ | 65 | | | $ | 51 | | | $ | 66 | | | $ | 118 | |
| FTSE 100 Index | | $ | 100 | | | $ | 88 | | | $ | 103 | | | $ | 114 | | | $ | 117 | | | $ | 135 | |
| S&P 500 Index | | $ | 100 | | | $ | 117 | | | $ | 150 | | | $ | 136 | | | $ | 155 | | | $ | 208 | |
Carnival plc
The following graph compares the Price Performance of $100 invested in Carnival plc ADSs, each representing one ordinary share of Carnival plc, with the Price Performance of $100 invested in each of the indexes noted below. The Price Performance is calculated in the same manner as previously discussed.
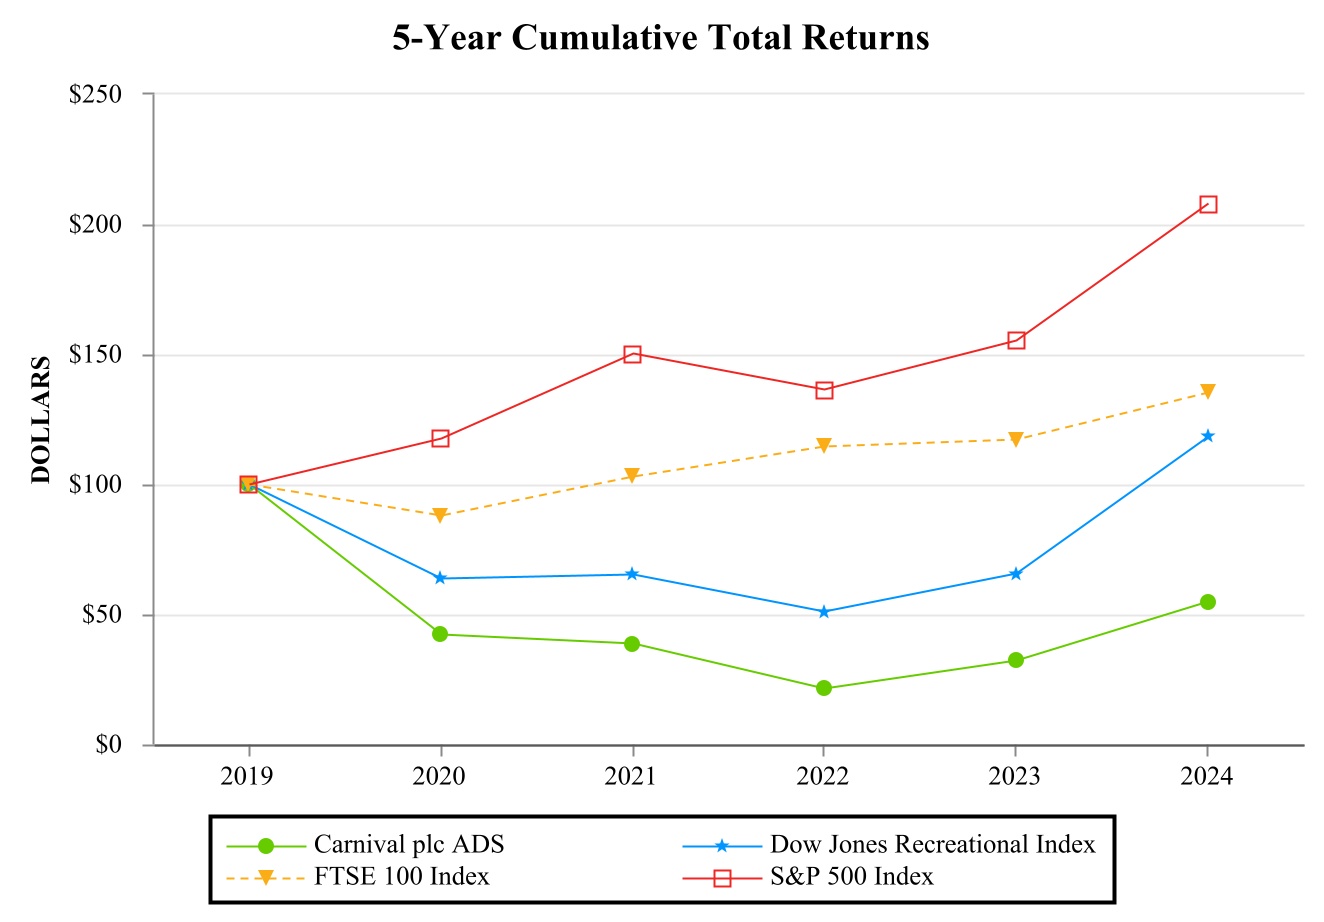
| | | | | | | | | | | | | | | | | | | | | | | | | | | | | | | | | | | |
| Assumes $100 Invested on November 30, 2019
Assumes Dividends Reinvested
Years Ended November 30, |
| 2019 | | 2020 | | 2021 | | 2022 | | 2023 | | 2024 |
| Carnival plc ADS | $ | 100 | | | $ | 42 | | | $ | 39 | | | $ | 21 | | | $ | 32 | | | $ | 55 | |
| Dow Jones Recreational Index | $ | 100 | | | $ | 64 | | | $ | 65 | | | $ | 51 | | | $ | 66 | | | $ | 118 | |
| FTSE 100 Index | $ | 100 | | | $ | 88 | | | $ | 103 | | | $ | 114 | | | $ | 117 | | | $ | 135 | |
| S&P 500 Index | $ | 100 | | | $ | 117 | | | $ | 150 | | | $ | 136 | | | $ | 155 | | | $ | 208 | |
F. Issuer Purchases of Equity Securities; Use of Proceeds from Registered Securities
I. Carnival plc Shareholder Approvals
Annual shareholder approval is required for Carnival plc to buy back its ordinary shares. The existing shareholder approval is limited to a maximum of 18.7 million ordinary shares of Carnival plc and expires at the conclusion of the Carnival plc 2025 Annual General Meeting or July 4, 2025, whichever is earlier.
Item 6. Reserved.
Item 7. Management’s Discussion and Analysis of Financial Condition and Results of Operations.
2024 Executive Overview
We had a strong year, setting records and achieving milestones, including:
•Full year revenues hit an all-time high of $25 billion, over 15 percent higher than the prior year
•Seven consecutive quarters of record revenues
•Record full year operating income of $3.6 billion, over 80 percent higher than the prior year
•All-time high cash from operations of almost $6 billion
•Higher ticket prices for 2024 versus 2023 for all of our major cruise lines and onboard spending levels that accelerated sequentially each quarter throughout the year
•Record booking trends and record year-end customer deposits, indicating a continuation of the strong momentum we’ve been experiencing for the last two years
We remain laser focused on further reducing interest expense and rebuilding our investment-grade balance sheet. During 2024, we made debt prepayments of over $3 billion, bringing our total prepayments to over $7 billion since the beginning of 2023. Additionally, we have reduced our debt balance by over $8 billion from the peak in January 2023, ending the year with $27.5 billion of debt.
We are delivering long-term value for our shareholders through improved operational execution across our cruise lines. We ended 2024 with adjusted return on invested capital (“ROIC”) comfortably above our cost of capital.
We welcomed three new ships during 2024: Carnival Jubilee, the third of five Excel class vessels for Carnival Cruise Line; Sun Princess, Princess Cruises’ next generation flagship which was just awarded Conde Nast Traveler’s 2024 Mega Ship of the year in the U.S.; and Queen Anne, Cunard’s first new ship in 14 years.
We have also been focusing on each of our cruise lines’ unique target markets, launching new marketing campaigns across all our brands. In 2024, both new-to-cruise and repeat guests were each up double-digit percentages and we continue to attract new cruise guests as we work to increase awareness and consideration for cruise travel globally.
We continue to advance our enhanced destination strategy to provide guests with yet another reason to take a cruise vacation with us. Celebration Key, our new exclusive cruise port destination on Grand Bahama Island, is scheduled to open in the summer of 2025, with an additional pier opening in the fall of 2026. Its five portals built for fun will further expand our experience offerings with an abundance of features and amenities for our guests. Celebration Key will be our largest and closest destination in our portfolio, saving fuel costs and reducing greenhouse gas emissions. In addition, we recently announced plans to enhance Half Moon Cay, our highly rated and award-winning exclusive Bahamian destination. The enhancements will lean further into this destination’s natural beauty and pristine appeal, reinforcing its new name – RelaxAway, Half Moon Cay. Featuring a newly constructed pier that is expected to be ready in the summer of 2026, the destination will allow two ships to dock, including Carnival Cruise Line’s largest ships that will be able to visit for the first time. We believe developing and promoting these unique assets will help us cast the net wider and capture even more new-to-cruise demand.
During 2024, we also continued making progress towards our sustainability goals. We reduced our greenhouse gas emission intensity by approximately 17.5 percent compared to 2019, on track to achieve our targeted reduction of 20 percent by the end of 2026, a goal that was previously pulled forward by four years. We have also lowered our absolute greenhouse gas emissions by almost 10 percent since 2019, despite capacity growth of over nine percent over the same period.
We are grateful for the efforts of our hard working and dedicated team who delivered a step change improvement in 2024 and set us up very well for 2025 and beyond, while consistently delivering unforgettable happiness to over 13 and a half million people in 2024, by providing them with extraordinary cruise vacations while honoring the integrity of every ocean we sail, place we visit and life we touch.
New Accounting Pronouncements
Refer to our consolidated financial statements for further information on Accounting Pronouncements.
Critical Accounting Estimates
Our critical accounting estimates are those we believe require our most significant judgments about the effect of matters that are inherently uncertain. A discussion of our critical accounting estimates, the underlying judgments and uncertainties used to make them and the likelihood that materially different estimates would be reported under different conditions or using different assumptions is as follows:
Ship Accounting
We make several critical accounting estimates with respect to our ship accounting including ship improvement costs, estimated useful lives and residual values.
We account for ship improvement costs, including replacements of certain significant components and parts, by capitalizing those costs that we believe add value to our ships and have a useful life greater than one year and depreciating those improvements over their estimated remaining useful life. The costs of repairs and maintenance, including those incurred when a ship is taken out-of-service for scheduled maintenance, and minor improvement costs and expenses, are charged to expense as incurred. If we change our assumptions in making our determinations as to whether improvements to a ship add value, the amounts we expense each year as repair and maintenance expense could increase, which would be partially offset by a decrease in depreciation expense, resulting from a reduction in capitalized costs.
In addition, the specifically identified or estimated cost and accumulated depreciation of previously capitalized ship components are written-off upon retirement, which may result in a loss on disposal that is also included in other operating expenses. We do not have cost segregation studies performed to specifically componentize our ships. In addition, since we do not separately componentize our ships, we do not identify and track depreciation of original ship components. Therefore, we typically have to estimate the net book value of components that are retired, based primarily upon their replacement cost, their age and their original estimated useful lives. Given the large size and complexity of our ships, ship accounting estimates require considerable judgment and are inherently uncertain.
In order to compute our ships’ depreciation expense, we apply judgment to determine their useful lives as well as their residual values. We have estimated our ships’ useful lives at 30 years and residual values at 15% of our original ship cost. Our ships’ useful life and residual value estimates take into consideration the estimated weighted-average useful lives of the ships’ major component systems, such as hull, superstructure, main electric, engines and cabins. We also take into consideration the impact of technological changes, historical useful lives of similarly-built ships, long-term cruise and vacation market conditions and regulatory changes, including those related to the environment and climate change. We determine the residual value of our ships based on our long-term estimates of their resale value at the end of their useful lives to us but before the end of their physical and economic lives to others, historical resale values of our and other cruise ships as well as our expectations of the long-term viability of the secondary cruise ship market. We review estimated useful lives and residual values for reasonableness whenever events or circumstances significantly change. During the pause of our guest cruise operations, we disposed of ships for amounts significantly below their book values. Management estimates that this trend will continue to normalize in the coming years.
The IMO’s 2023 Strategy on Reduction of GHG Emissions from Ships (“IMO Strategy”) strives to peak GHG emissions from international shipping as soon as possible and to reach net zero GHG emissions on a well-to-wake basis by or around 2050. The IMO Strategy includes checkpoints in 2030 and 2040 that seek reductions in the absolute GHG emissions from international shipping by at least 20% and 70%, respectively, compared to 2008. It also includes a target of a 40% reduction in CO2 emissions intensity by 2030 compared to 2008. The EU has also proposed several regulations that will likely impact the cost of fossil fuels and has recently adopted the inclusion of maritime shipping in the EU’s Emissions Trading System. We have established Climate Action Goals, which include a GHG intensity reduction goal of 20% by 2030 from the 2019 baseline and we are pursuing our aspiration of net zero emissions by 2050. Given a 30-year estimated useful life for our ships, our most recently delivered vessels’ lives will extend beyond this 2050 date. To provide a path to net zero emissions, alternative low GHG emission fuels will be necessary for the maritime industry; however, there are significant supply challenges that must be resolved before viability is reached. We are closely monitoring technology developments and partnering with organizations on research and development to support our sustainability goals and aspirations. Our fleet’s engines are capable of being modified for use with certain alternative fuels and we have completed tests on the use of marine biofuel blends on certain ships in our fleet. In addition, and in support of our Climate Action Goals, we invest in technologies, including the use of LNG powered cruise ships, the installation of Advanced Air Quality Systems on board our ships to aid in the reduction of sulfur emissions, the use of shore power, enabling ships to use shoreside electric power where available while in port and various other efficiency related upgrades intended to reduce our emissions. It is uncertain how proposed and possible future regulatory changes related to the environment and climate change and our aspiration of net zero emissions by 2050, may impact our ships’ useful lives and residual values and the impact is dependent on future regulatory actions and technological advances. As of November 30, 2024, management concluded that there were no changes in our ship useful lives and residual value estimates.
If materially different conditions existed, or if we materially changed our assumptions of ship useful lives and residual values, then our depreciation expense, loss on retirement of ship components and net book value of our ships would be materially different. Our 2024 ship depreciation expense would have increased by approximately:
•$51 million assuming we had reduced our estimated 30-year ship useful life estimate by one year at the time we took delivery or acquired each of our ships
•$260 million assuming we had estimated our ships to have no residual value
We believe that the estimates we made for ship accounting purposes are reasonable and our methods are consistently applied in all material respects and result in depreciation expense that is based on a rational and systematic method to equitably allocate the costs of our ships to the periods during which we use them.
Valuation of Ships
We review our ships for impairment whenever events or changes in circumstances indicate that the carrying value of a ship may not be recoverable. When an impairment review is appropriate, such as an expected sale of a ship before the end of its useful life, impairment reviews of our ships require us to make significant estimates. We evaluate ship asset impairments at the individual ship level which is the lowest level for which identifiable cash flows are largely independent of the cash flows of other assets and liabilities. If estimated future cash flows are less than the carrying value of a ship, an impairment charge is recognized to the extent its carrying value exceeds its estimated fair value.
The estimation of a ship’s fair value includes numerous assumptions that are subject to various risks and uncertainties. The principal assumption used in determining the fair value of our ships tested for impairment in 2022 was the estimated sales proceeds.
We determined the fair value of these ships based on their respective estimated selling values, for those ships expected to be disposed of, or estimated discounted future cash flows and comparable market transactions. Where estimated future cash flows are used to estimate the recoverable value of a ship, the cash flows include estimated regulatory costs, including those related to proposed regulations, which are likely to impact costs and capital expenditures, including those expected to meet our 2030 Climate Action Goals.
Refer to our consolidated financial statements for additional discussion of our property and equipment policy and ship impairment reviews.
We believe that we have made reasonable estimates.
Contingencies
We periodically assess the potential liabilities related to any lawsuits or claims brought against us, as well as for other known unasserted claims, including environmental, legal, regulatory and guest and crew matters. While it is typically very difficult to determine the timing and ultimate outcome of these matters, we use our best judgment to determine the appropriate amounts to record in our consolidated financial statements.
We accrue a liability and establish a reserve when we believe a loss is probable and the amount of the loss can be reasonably estimated. In assessing probable losses, we make estimates of the amount of probable insurance recoveries, if any, which are recorded as assets where appropriate. Such accruals and reserves are typically based on developments to date, management’s estimates of the outcomes of these matters, our experience in contesting, litigating and settling other similar matters, historical claims experience, actuarially determined estimates of liabilities and any related insurance coverage.
Given the inherent uncertainty related to the eventual outcome of these matters and potential insurance recoveries, it is possible that all or some of these matters may be resolved for amounts materially different from any provisions or disclosures that we may have made. In addition, as new information becomes available, we may need to reassess amounts accrued related to our contingencies. All such changes in our estimates could materially impact our results of operations and financial position.
Refer to our consolidated financial statements for additional discussion of contingencies.
Known Trends and Uncertainties
•We believe the volatility in the cost of fuel is reasonably likely to continue to impact our profitability in both the short and long-term.
•We believe the increasing global focus on climate change, including the reduction of GHG emissions and new and evolving regulatory requirements, is reasonably likely to have a material negative impact on our future financial results. We became subject to the EU Emissions Trading System (“ETS”) on January 1, 2024, which includes a three-year phase-in period. Refer to XVIII. Governmental Regulations.
Results of Operations
We have historically earned substantially all of our cruise revenues from the following:
•Sales of passenger cruise tickets and, in some cases, the sale of air and other transportation to and from airports near our ships’ home ports and cancellation fees. The cruise ticket price typically includes the following:
•Accommodations
•Most meals, including snacks at numerous venues
•Access to amenities such as swimming pools, water slides, water parks, whirlpools, a health club and sun decks
•Child care and supervised youth programs
•Entertainment, such as theatrical and comedy shows, live music and nightclubs
•Visits to multiple destinations
•Sales of onboard goods and services not included in the cruise ticket price. This generally includes the following: | | | | | |
| • Beverage sales | • Internet and communication services |
| • Casino gaming | • Full service spas |
| • Shore excursions | • Specialty restaurants |
| • Retail sales | • Art sales |
| • Photo sales | • Laundry and dry cleaning services |
These goods and services are provided either directly by us or by independent concessionaires, from which we receive either a percentage of their revenues or a fee. Concession revenues do not have direct expenses because the costs and services incurred for concession revenues are borne by our concessionaires. In 2024, we earned 34% of our cruise revenues from onboard and other revenue goods and services.
We earn our tour and other revenues from our hotel and transportation operations and other revenues.
We incur cruise operating expenses for the following:
•The costs of passenger cruise bookings, which include travel agent commissions, cost of air and other transportation, port fees, taxes, and charges that directly vary with guest head counts and credit and debit card fees
•Onboard and other cruise costs, which include the costs of beverage sales, costs of shore excursions, costs of retail sales, internet and communication costs, credit and debit card fees, other onboard costs, costs of cruise vacation protection programs and pre- and post-cruise land packages
•Payroll and related costs, which include the costs of officers and crew in bridge, engineering and hotel operations. Substantially all costs associated with our shoreside personnel are included in selling and administrative expenses
•Fuel costs, which include fuel delivery costs and European Union Allowance costs
•Food costs, which include both our guest and crew food costs
•Other ship operating expenses, which include port costs that do not vary with guest head counts; repairs and maintenance, including minor improvements and dry-dock expenses; hotel costs; entertainment; gains and losses on ship sales; ship impairments; freight and logistics; insurance premiums and all other ship operating expenses
We incur tour and other costs and expenses for our hotel and transportation operations and other expenses.
Statistical Information | | | | | | | | | | | | | | | | | |
| Years Ended November 30, |
| 2024 | | 2023 | | 2022 |
Passenger Cruise Days (“PCDs”) (in millions) (a) | 100.5 | | | 91.4 | | | 54.6 | |
Available Lower Berth Days (“ALBDs”) (in millions) (b) (c) | 95.6 | | | 91.3 | | | 72.5 | |
| Occupancy percentage (d) | 105 | % | | 100 | % | | 75 | % |
Passengers carried (in millions) | 13.5 | | | 12.5 | | | 7.7 | |
| | | | | |
Fuel consumption in metric tons (in millions) | 2.9 | | | 2.9 | | | 2.6 | |
| Fuel consumption in metric tons per thousand ALBDs | 30.9 | | | 32.1 | | | 36.1 | |
| Fuel cost per metric ton consumed (excluding European Union Allowance) | $ | 665 | | | $ | 701 | | | $ | 830 | |
| | | | | |
| | | | | |
| | | | | |
| Currencies (USD to 1) | | | | | |
| AUD | $ | 0.66 | | | $ | 0.66 | | | $ | 0.70 | |
| CAD | $ | 0.73 | | | $ | 0.74 | | | $ | 0.77 | |
| EUR | $ | 1.09 | | | $ | 1.08 | | | $ | 1.06 | |
| GBP | $ | 1.28 | | | $ | 1.24 | | | $ | 1.25 | |
Notes to Statistical Information
(a)PCD represents the number of cruise passengers on a voyage multiplied by the number of revenue-producing ship operating days for that voyage.
(b)ALBD is a standard measure of passenger capacity for the period that we use to approximate rate and capacity variances, based on consistently applied formulas that we use to perform analyses to determine the main non-capacity driven factors that cause our cruise revenues and expenses to vary. ALBDs assume that each cabin we offer for sale accommodates two passengers and is computed by multiplying passenger capacity by revenue-producing ship operating days in the period.
(c)In 2024 compared to 2023, we had a 4.7% capacity increase in ALBDs comprised of a 7.9% capacity increase in our NAA segment and a 0.5% capacity decrease in our Europe segment.
Our NAA segment’s capacity increase was caused by the following:
•Carnival Cruise Line 4,090-passenger capacity ship that transferred from Costa Cruises and entered into service in May 2023
•Seabourn 260-passenger capacity ship that entered into service in July 2023
•Carnival Cruise Line 5,360-passenger capacity ship that entered into service in December 2023
•Princess Cruises 4,310-passenger capacity ship that entered into service in February 2024
•Carnival Cruise Line 4,130-passenger capacity ship that transferred from Costa Cruises and entered into service in April 2024
The increase in our NAA segment’s capacity was partially offset by a Seabourn 460-passenger capacity ship that was removed from service in September 2024.
Our Europe segment’s capacity decrease was caused by the following:
•Costa Cruises 4,090-passenger capacity ship that transferred to Carnival Cruise Line in March 2023
•AIDA Cruises 1,270-passenger capacity ship that was removed from service in November 2023
•Costa Cruises 4,240-passenger capacity ship that transferred to Carnival Cruise Line and was removed from Costa Cruises’ fleet in February 2024
•The Red Sea rerouting as certain ships repositioned without guests
The decrease in our Europe segment’s capacity was partially offset by the following:
•The return to service of two ships as part of the completion of our return to guest cruise operations
•P&O Cruises (UK) 5,280-passenger capacity ship that entered into service in December 2022
•Cunard 2,960-passenger capacity ship that entered into service in May 2024
(d)Occupancy, in accordance with cruise industry practice, is calculated using a numerator of PCDs and a denominator of ALBDs, which assumes two passengers per cabin even though some cabins can accommodate three or more passengers. Percentages in excess of 100% indicate that on average more than two passengers occupied some cabins.
2024 Compared to 2023
The discussion below compares the results of operations for the year ended November 30, 2024 to the year ended November 30, 2023. This discussion should be read in conjunction with the consolidated financial statements and the notes thereto included elsewhere in this annual report. For a comparison of the Company’s results of operations for the year ended November 30, 2023 to the year ended November 30, 2022, see “Item 7, Management’s Discussion and Analysis of Financial Condition and Results of Operations” in the Company’s Annual Report on Form 10-K for the year ended November 30, 2023, which was filed with the U.S. Securities and Exchange Commission on January 26, 2024.
Revenues
Consolidated
Passenger ticket revenues made up 66% of our 2024 total revenues. Passenger ticket revenues increased by $2.4 billion, or 17%, to $16.5 billion in 2024 from $14.1 billion in 2023.
This increase was caused by:
•$988 million - higher ticket prices driven by continued strength in demand
•$705 million - 5.1 percentage point increase in occupancy
•$691 million - 4.7% capacity increase in ALBDs
•$86 million - net favorable foreign currency translational impact
These increases were partially offset by a decrease of $60 million in other passenger revenue.
The remaining 34% of 2024 total revenues was comprised of onboard and other revenues, which increased by $1.0 billion, or 14%, to $8.6 billion in 2024 from $7.5 billion in 2023.
This increase was driven by:
•$422 million - 4.7% capacity increase in ALBDs
•$286 million - 5.1 percentage point increase in occupancy
•$264 million - higher onboard spending by our guests
NAA Segment
Passenger ticket revenues made up 63% of our NAA segment’s 2024 total revenues. Passenger ticket revenues increased by $1.5 billion, or 16%, to $10.6 billion in 2024 from $9.1 billion in 2023.
This increase was caused by:
•$717 million - 7.9% capacity increase in ALBDs
•$609 million - higher ticket prices driven by continued strength in demand
•$241 million - 2.7 percentage point increase in occupancy
These increases were partially offset by a decrease of $64 million in other passenger revenue.
The remaining 37% of our NAA segment’s 2024 total revenues were comprised of onboard and other revenues, which increased by $753 million, or 14%, to $6.2 billion in 2024 from $5.5 billion in 2023.
This increase was caused by:
•$430 million - 7.9% capacity increase in ALBDs
•$191 million - higher onboard spending by our guests
•$145 million - 2.7 percentage point increase in occupancy
Europe Segment
Passenger ticket revenues made up 77% of our Europe segment’s 2024 total revenues. Passenger ticket revenues increased by $945 million, or 19%, to $5.9 billion in 2024 from $5.0 billion in 2023.
This increase was driven by:
•$463 million - 8.8 percentage point increase in occupancy
•$379 million - higher ticket prices driven by continued strength in demand
•$87 million - net favorable foreign currency translational impact
These increases were partially offset by a 0.5% capacity decrease in ALBDs, representing $26 million.
The remaining 23% of our Europe segment’s 2024 total revenues were comprised of onboard and other revenues, which increased by $231 million, or 15%, to $1.8 billion in 2024 from $1.5 billion in 2023.
This increase was driven by:
•$142 million - 8.8 percentage point increase in occupancy
•$72 million - higher onboard spending by our guests
Costs and Expenses
Consolidated
Operating expenses increased by $1.3 billion, or 9.2%, to $15.6 billion in 2024 from $14.3 billion in 2023.
This increase was caused by:
•$731 million - 4.7% capacity increase in ALBDs
•$333 million - higher commissions, transportation costs, and other expenses driven by higher commission on increased ticket pricing and an increase in the number of guests
•$144 million - higher onboard and other cost of sales driven by higher onboard revenues
•$139 million - 5.1 percentage point increase in occupancy
•$63 million - higher repair and maintenance expenses (including dry-dock expenses)
•$59 million - net unfavorable foreign currency translational impact
•$47 million - decreases in gains on ship sales realized in 2024 compared to 2023
•$36 million - higher port expenses
These increases were partially offset by:
•$89 million - lower fuel consumption per ALBD
•$58 million - lower fuel prices
•$23 million - change in pension valuation
Selling and administrative expenses increased by $302 million, or 10%, to $3.3 billion in 2024 from $2.9 billion in 2023. This increase was driven by higher compensation expense, increased investment in advertising and higher information technology expense.
Depreciation and amortization expenses increased by $187 million, or 7.9%, to $2.6 billion in 2024 from $2.4 billion in 2023. This increase was driven by capacity increases, fleet enhancements and investments in shoreside assets for our NAA segment.
NAA Segment
Operating expenses increased by $968 million, or 10%, to $10.6 billion in 2024 from $9.6 billion in 2023.
This increase was caused by:
•$753 million - 7.9% capacity increase in ALBDs
•$160 million - higher commissions, transportation costs, and other expenses driven by higher commission on increased ticket pricing and an increase in the number of guests
•$81 million - higher onboard and other cost of sales driven by higher onboard revenues
•$76 million - higher repair and maintenance expenses (including dry-dock expenses)
•$46 million - 2.7 percentage point increase in occupancy
These increases were partially offset by:
•$86 million - lower fuel consumption per ALBD
•$50 million - lower fuel prices
Selling and administrative expenses increased by $199 million, or 11%, to $2.0 billion in 2024 from $1.8 billion in 2023. This increase was driven by higher compensation expense, increased investment in advertising and higher information technology expense.
Depreciation and amortization expenses increased by $168 million, or 11%, to $1.7 billion in 2024 from $1.5 billion in 2023.
This increase was caused by:
•$117 million - 7.9% capacity increase in ALBDs
•$51 million - fleet enhancements and investments in shoreside assets
Europe Segment
Operating expenses increased by $336 million, or 7.6%, to $4.7 billion in 2024 from $4.4 billion in 2023.
This increase was caused by:
•$174 million - higher commissions, transportation costs, and other expenses driven by an increase in the number of guests
•$92 million - 8.8 percentage point increase in occupancy
•$63 million - higher onboard and other cost of sales driven by higher onboard revenues
•$62 million - net unfavorable foreign currency translational impact
•$47 million - nonrecurrence of gains on sale of three Europe segment ships in 2023
These increases were partially offset by a $23 million change in pension valuation.
Selling and administrative expenses increased by $85 million, or 9.7%, to $961 million in 2024 from $876 million in 2023.
Depreciation and amortization expenses increased by $8 million, or 1.2%, to $676 million in 2024 from $668 million in 2023.
Operating Income
Our consolidated operating income increased by $1.6 billion to $3.6 billion in 2024 from $2.0 billion in 2023. Our NAA segment’s operating income increased by $879 million to $2.6 billion in 2024 from $1.8 billion in 2023, and our Europe segment’s operating income increased by $747 million to $1.3 billion in 2024 from $593 million in 2023. These changes were primarily due to the reasons discussed above.
Nonoperating Income (Expense)
Interest expense, net of capitalized interest, decreased by $311 million, or 15%, to $1.8 billion in 2024 from $2.1 billion in 2023. The decrease was substantially all due to a decrease in total debt and lower average interest rates.
Debt extinguishment and modification costs decreased by $32 million, or 28%, to $79 million in 2024 from $111 million in 2023 as a result of debt transactions occurring during the respective periods.
Other income (expense), net increased by $157 million to $83 million in 2024 from ($75) million in 2023. The increase primarily relates to a non-recurring favorable result related to litigation.
Liquidity, Financial Condition and Capital Resources
As of November 30, 2024, we had $4.2 billion of liquidity including $1.2 billion of cash and cash equivalents and $2.9 billion of borrowings available under our multi-currency revolving credit facility (“Revolving Facility”). In addition, we had $7.8 billion of undrawn export credit facilities to fund ship deliveries planned through 2033. We will continue to pursue various opportunities to repay portions of our existing indebtedness and refinance future debt maturities to extend maturity dates and
reduce interest expense. Refer to Note 5 - “Debt” of the consolidated financial statements and Funding Sources below for additional details.
We had a working capital deficit of $8.2 billion as of November 30, 2024 compared to a working capital deficit of $6.2 billion as of November 30, 2023. The increase in working capital deficit was caused by increases in customer deposits and accrued liabilities and other and decreases in the current portion of long-term debt, cash and cash equivalents and prepaid expenses and other. We operate with a substantial working capital deficit. This deficit is mainly attributable to the fact that, under our business model, substantially all of our passenger ticket receipts are collected in advance of the applicable sailing date. These advance passenger receipts generally remain a current liability on our balance sheet until the sailing date. The cash generated from these advance receipts is used interchangeably with cash on hand from other sources, such as our borrowings and other cash from operations. The cash received as advanced receipts can be used to fund operating expenses, pay down our debt, make long-term investments or any other use of cash. Included within our working capital are $6.4 billion and $6.1 billion of customer deposits as of November 30, 2024 and 2023. We have agreements with a number of credit card processors that transact customer deposits related to our cruise vacations. Certain of these agreements allow the credit card processors to request, under certain circumstances, that we provide a capped reserve fund in cash. As of November 30, 2024, we were not required to maintain any reserve funds. In addition, we have a relatively low level of accounts receivable and limited investment in inventories.
Sources and Uses of Cash
Operating Activities
Our business provided $5.9 billion of net cash flows from operating activities during 2024, an increase of $1.6 billion, compared to $4.3 billion provided in 2023. This was caused by cash provided by the release of $0.8 billion credit card reserve funds (included in the change in prepaid expenses and other assets) and our net income position of $1.9 billion in 2024 compared to our net loss position of $74 million in 2023, partially offset by a decrease in other working capital changes.
Investing Activities
During 2024, net cash used in investing activities was $4.5 billion. This was caused by:
•Capital expenditures of $4.6 billion primarily attributable to the delivery of two NAA segment ships, one Europe segment ship and developments in our port destinations and exclusive islands
•Proceeds of $58 million primarily from the sale of an NAA segment ship
During 2023, net cash used in investing activities was $2.8 billion. This was driven by:
•Capital expenditures of $3.3 billion with the majority attributable to the delivery of one Europe segment ship and one NAA segment ship
•Proceeds from sales of three Europe segment ships, one NAA segment ship and other totaling $340 million
Financing Activities
During 2024, net cash used in financing activities of $2.6 billion was caused by:
•Repayments of $5.4 billion of long-term debt
•Debt issuance costs of $203 million
•Debt extinguishment costs of $41 million
•Issuances of $3.1 billion of long-term debt
During 2023, net cash used in financing activities of $5.1 billion was driven by:
•Repayments of $200 million of short-term borrowings
•Repayments of $5.9 billion of long-term debt and refinancing of $1.8 billion of long-term debt to extend maturities
•Issuances of $3.0 billion of long-term debt
•Debt issuance costs of $131 million
•Debt extinguishment costs of $79 million
•Proceeds from issuance of $22 million of Carnival Corporation common stock and purchases of $20 million of Carnival plc ordinary shares under our Stock Swap Program
For our cash flow activities for the fiscal year ended November 30, 2022, see “Item 7, Management’s Discussion and Analysis of Financial Condition and Results of Operations” in our Annual Report on Form 10-K for the year ended November 30, 2023, which was filed with the U.S. Securities and Exchange Commission on January 26, 2024.
Material Cash Requirements
| | | | | | | | | | | | | | | | | | | | | | | | | | | | | | | | | | | | | | | | | |
| Payments Due by | | |
| (in millions) | 2025 | | 2026 | | 2027 | | 2028 | | 2029 | | Thereafter | | Total |
| Debt (a) | $ | 2,969 | | | $ | 3,991 | | | $ | 6,016 | | | $ | 9,534 | | | $ | 4,706 | | | $ | 6,495 | | | $ | 33,712 | |
| Newbuild capital expenditures (b) | 893 | | | 423 | | | 1,302 | | | 1,263 | | | 1,502 | | | 3,182 | | | 8,565 | |
| Total | $ | 3,862 | | | $ | 4,414 | | | $ | 7,318 | | | $ | 10,797 | | | $ | 6,208 | | | $ | 9,677 | | | $ | 42,277 | |
| | | | | | | | | | | | | |
(a)Includes principal as well as estimated interest payments and does not include the impact of any future possible refinancings. Excludes undrawn export credits.
(b)As of November 30, 2024, we have undrawn export credit facilities of $7.8 billion which fund a portion of our newbuild contractual commitments.
Funding Sources
As of November 30, 2024, we had $4.2 billion of liquidity including $1.2 billion of cash and cash equivalents and $2.9 billion of borrowings available under our Revolving Facility. In addition, we had $7.8 billion of undrawn export credit facilities to fund ship deliveries planned through 2033. We plan to use existing liquidity and future cash flows from operations to fund our cash requirements including capital expenditures not funded by our export credit facilities. We seek to manage our credit risk exposures, including counterparty nonperformance associated with our cash and cash equivalents, and future financing facilities by conducting business with well-established financial institutions, and export credit agencies and diversifying our counterparties.
| | | | | | | | | | | | | | | | | | | | | | | | | | | | | | | | | | | | | | | | | | | | |
| (in billions) | | 2025 | | 2026 | | 2027 | | 2028 | | 2029 | | Thereafter | | | | | | |
| Future export credit facilities at November 30, 2024 | | $ | 0.7 | | | $ | — | | | $ | 1.2 | | | $ | 1.2 | | | $ | 1.6 | | | $ | 3.1 | | | | | | | |
Our export credit facilities contain various financial covenants as described in Note 5 - “Debt.” At November 30, 2024, we were in compliance with the applicable covenants under our debt agreements.
Item 7A. Quantitative and Qualitative Disclosures About Market Risk.
For a discussion of our hedging strategies and market risks, see the discussion below and the consolidated financial statements.
Fuel Price Risks
Substantially all our exposure to market risk for changes in fuel prices relates to the consumption of fuel on our ships.
Foreign Currency Exchange Rate Risks
Operational Currency Risks
Our operations primarily utilize the U.S. dollar, Euro, Sterling or the Australian dollar as their functional currencies. Our operations also have revenue and expenses denominated in non-functional currencies. Movements in foreign currency exchange rates will affect our consolidated financial statements.
Investment Currency Risks
The foreign currency exchange rates were as follows: | | | | | | | | | | | |
| November 30, |
| USD to 1: | 2024 | | 2023 |
| AUD | $ | 0.65 | | | $ | 0.66 | |
| CAD | $ | 0.71 | | | $ | 0.74 | |
| EUR | $ | 1.06 | | | $ | 1.10 | |
| GBP | $ | 1.27 | | | $ | 1.27 | |
If the November 30, 2023 currency exchange rates had been used to translate our November 30, 2024 non-U.S. dollar functional currency operations’ assets and liabilities (instead of the November 30, 2024 U.S. dollar exchange rates), our total assets would have been higher by $468 million and our total liabilities would have been higher by $408 million.
Newbuild Currency Risks
At November 30, 2024, our newbuild currency exchange rate risk primarily relates to euro-denominated newbuild contract payments, which represent a total commitment of $8.6 billion and relate to newbuilds scheduled to be delivered to non-euro functional currency brands. The functional currency cost of each of these ships will increase or decrease based on changes in the exchange rates until the payments are made under the shipbuilding contract. We may utilize foreign currency derivatives to mitigate some of this foreign currency exchange rate risk. Based on a 1% change in euro to U.S. dollar exchange rates as of November 30, 2024, the remaining cost of these ships would have a corresponding change of $86 million.
Interest Rate Risks
The composition of our debt, interest rate swaps and cross currency swaps was as follows: | | | | | |
| November 30, 2024 |
| Fixed rate | 60 | % |
| EUR fixed rate | 23 | % |
| Floating rate | 7 | % |
| EUR floating rate | 10 | % |
| |
At November 30, 2024, we had an interest rate swap that effectively changed $11 million of EURIBOR-based floating rate euro debt to fixed rate euro debt. We also had interest rate swap agreements which effectively changed $1.0 billion at November 30, 2024 of SOFR-based floating rate USD debt to fixed rate USD debt. Based on a 100 basis point change in the market interest rates, our annual interest expense on floating rate debt, including the effect of our interest rate swaps, will change by approximately $48 million.
Item 8. Financial Statements and Supplementary Data.
CARNIVAL CORPORATION & PLC
CONSOLIDATED FINANCIAL STATEMENTS
FOR THE YEAR ENDED NOVEMBER 30, 2024
TABLE OF CONTENTS
CARNIVAL CORPORATION & PLC
CONSOLIDATED STATEMENTS OF INCOME (LOSS)
(in millions, except per share data)
| | | | | | | | | | | | | | | | | |
| | Years Ended November 30, |
| | 2024 | | 2023 | | 2022 |
| Revenues | | | | | |
| Passenger ticket | $ | 16,463 | | | $ | 14,067 | | | $ | 7,022 | |
| Onboard and other | 8,558 | | | 7,526 | | | 5,147 | |
| 25,021 | | | 21,593 | | | 12,168 | |
| Operating Expenses | | | | | |
| Commissions, transportation and other | 3,232 | | | 2,761 | | | 1,630 | |
| Onboard and other | 2,678 | | | 2,375 | | | 1,528 | |
| Payroll and related | 2,464 | | | 2,373 | | | 2,181 | |
| Fuel | 2,007 | | | 2,047 | | | 2,157 | |
| Food | 1,457 | | | 1,335 | | | 863 | |
| Ship and other impairments | — | | | — | | | 440 | |
| Other operating | 3,801 | | | 3,426 | | | 2,958 | |
| Cruise and tour operating expenses | 15,638 | | | 14,317 | | | 11,757 | |
| Selling and administrative | 3,252 | | | 2,950 | | | 2,515 | |
| Depreciation and amortization | 2,557 | | | 2,370 | | | 2,275 | |
| | | | | |
| 21,447 | | | 19,637 | | | 16,547 | |
| Operating Income (Loss) | 3,574 | | | 1,956 | | | (4,379) | |
| Nonoperating Income (Expense) | | | | | |
| Interest income | 93 | | | 233 | | | 74 | |
| Interest expense, net of capitalized interest | (1,755) | | | (2,066) | | | (1,609) | |
| Debt extinguishment and modification costs | (79) | | | (111) | | | (1) | |
| Other income (expense), net | 83 | | | (75) | | | (165) | |
| (1,659) | | | (2,018) | | | (1,701) | |
| Income (Loss) Before Income Taxes | 1,915 | | | (62) | | | (6,080) | |
| Income Tax Benefit (Expense), Net | 1 | | | (13) | | | (14) | |
| Net Income (Loss) | $ | 1,916 | | | $ | (74) | | | $ | (6,093) | |
| Earnings Per Share | | | | | |
| Basic | $ | 1.50 | | | $ | (0.06) | | | $ | (5.16) | |
| Diluted | $ | 1.44 | | | $ | (0.06) | | | $ | (5.16) | |
The accompanying notes are an integral part of these consolidated financial statements.
CARNIVAL CORPORATION & PLC
CONSOLIDATED STATEMENTS OF COMPREHENSIVE INCOME (LOSS)
(in millions)
| | | | | | | | | | | | | | | | | |
| | Years Ended November 30, |
| | 2024 | | 2023 | | 2022 |
| Net Income (Loss) | $ | 1,916 | | | $ | (74) | | | $ | (6,093) | |
| Items Included in Other Comprehensive Income (Loss) | | | | | |
| Change in foreign currency translation adjustment | (3) | | | 52 | | | (503) | |
| Other | (34) | | | (8) | | | 22 | |
| Other Comprehensive Income (Loss) | (36) | | | 44 | | | (481) | |
| Total Comprehensive Income (Loss) | $ | 1,879 | | | $ | (30) | | | $ | (6,574) | |
The accompanying notes are an integral part of these consolidated financial statements.
CARNIVAL CORPORATION & PLC
CONSOLIDATED BALANCE SHEETS
(in millions, except par values)
| | | | | | | | | | | |
| | November 30, |
| | 2024 | | 2023 |
| ASSETS | | | |
| Current Assets | | | |
| Cash and cash equivalents | $ | 1,210 | | | $ | 2,415 | |
| | | |
| | | |
| Trade and other receivables, net | 590 | | | 556 | |
| Inventories | 507 | | | 528 | |
| Prepaid expenses and other | 1,070 | | | 1,767 | |
| Total current assets | 3,378 | | | 5,266 | |
| Property and Equipment, Net | 41,795 | | | 40,116 | |
| Operating Lease Right-of-Use Assets, Net | 1,368 | | | 1,265 | |
| Goodwill | 579 | | | 579 | |
| Other Intangibles | 1,163 | | | 1,169 | |
| Other Assets | 775 | | | 725 | |
| $ | 49,057 | | | $ | 49,120 | |
| LIABILITIES AND SHAREHOLDERS’ EQUITY | | | |
| Current Liabilities | | | |
| | | |
| Current portion of long-term debt | $ | 1,538 | | | $ | 2,089 | |
| Current portion of operating lease liabilities | 163 | | | 149 | |
| Accounts payable | 1,133 | | | 1,168 | |
| Accrued liabilities and other | 2,358 | | | 2,003 | |
| Customer deposits | 6,425 | | | 6,072 | |
| Total current liabilities | 11,617 | | | 11,481 | |
| Long-Term Debt | 25,936 | | | 28,483 | |
| Long-Term Operating Lease Liabilities | 1,239 | | | 1,170 | |
| Other Long-Term Liabilities | 1,012 | | | 1,105 | |
| Contingencies and Commitments | | | |
| Shareholders’ Equity | | | |
| Carnival Corporation common stock, $0.01 par value; 1,960 shares authorized; 1,294 shares issued at 2024 and 1,250 shares issued at 2023 | 13 | | | 12 | |
| Carnival plc ordinary shares, $1.66 par value; 217 shares issued at 2024 and 2023 | 361 | | | 361 | |
| Additional paid-in capital | 17,155 | | | 16,712 | |
| Retained earnings | 2,101 | | | 185 | |
| Accumulated other comprehensive income (loss) (“AOCI”) | (1,975) | | | (1,939) | |
| Treasury stock, 130 shares at 2024 and 2023 of Carnival Corporation and 73 shares at 2024 and 2023 of Carnival plc, at cost | (8,404) | | | (8,449) | |
| Total shareholders’ equity | 9,251 | | | 6,882 | |
| $ | 49,057 | | | $ | 49,120 | |
The accompanying notes are an integral part of these consolidated financial statements.
CARNIVAL CORPORATION & PLC
CONSOLIDATED STATEMENTS OF CASH FLOWS
(in millions)
| | | | | | | | | | | | | | | | | |
| | Years Ended November 30, |
| | 2024 | | 2023 | | 2022 |
| OPERATING ACTIVITIES | | | | | |
| Net income (loss) | $ | 1,916 | | | $ | (74) | | | $ | (6,093) | |
| Adjustments to reconcile net income (loss) to net cash provided by (used in) operating activities | | | | | |
| Depreciation and amortization | 2,557 | | | 2,370 | | | 2,275 | |
| Impairments | — | | | 21 | | | 470 | |
| (Gain) loss on debt extinguishment | 76 | | | 98 | | | 1 | |
| (Income) loss from equity-method investments | (9) | | | 13 | | | 38 | |
| Share-based compensation | 62 | | | 53 | | | 101 | |
| Amortization of discounts and debt issue costs | 141 | | | 161 | | | 171 | |
| Non-cash lease expense | 142 | | | 145 | | | 148 | |
| Gain on sales of ships | (41) | | | (88) | | | (7) | |
| Greenhouse gas regulatory expense | 46 | | | — | | | — | |
| Other | 71 | | | 56 | | | 65 | |
| 4,963 | | | 2,756 | | | (2,832) | |
| Changes in operating assets and liabilities | | | | | |
| Receivables | (49) | | | (180) | | | (171) | |
| Inventories | 9 | | | (85) | | | (95) | |
| | | | | |
| Prepaid expenses and other assets | 352 | | | 397 | | | (874) | |
| Accounts payable | (26) | | | 77 | | | 283 | |
| Accrued liabilities and other | 167 | | | 147 | | | 341 | |
| Customer deposits | 507 | | | 1,169 | | | 1,679 | |
| Net cash provided by (used in) operating activities | 5,923 | | | 4,281 | | | (1,670) | |
| INVESTING ACTIVITIES | | | | | |
| Purchases of property and equipment | (4,626) | | | (3,284) | | | (4,940) | |
| Proceeds from sales of ships and other property and equipment | 58 | | | 340 | | | 70 | |
| | | | | |
| Purchase of short-term investments | — | | | — | | | (315) | |
| Proceeds from maturity of short-term investments | — | | | — | | | 515 | |
| Other | 34 | | | 134 | | | (97) | |
| Net cash provided by (used in) investing activities | (4,535) | | | (2,810) | | | (4,767) | |
| FINANCING ACTIVITIES | | | | | |
| Repayments of short-term borrowings | — | | | (200) | | | (2,590) | |
| Principal repayments of long-term debt | (5,436) | | | (7,660) | | | (2,075) | |
| Debt issuance costs | (203) | | | (131) | | | (153) | |
| Debt extinguishment costs | (41) | | | (79) | | | (1) | |
| Proceeds from issuance of long-term debt | 3,095 | | | 2,961 | | | 7,209 | |
| | | | | |
| | | | | |
| Proceeds from issuance of common stock | — | | | 5 | | | 1,180 | |
| Proceeds from issuance of common stock under the Stock Swap Program | — | | | 22 | | | 95 | |
| Purchase of treasury stock under the Stock Swap Program | — | | | (20) | | | (87) | |
| Other | 1 | | | 13 | | | (1) | |
| Net cash provided by (used in) financing activities | (2,584) | | | (5,089) | | | 3,577 | |
| Effect of exchange rate changes on cash, cash equivalents and restricted cash | (8) | | | 17 | | | (79) | |
| Net increase (decrease) in cash, cash equivalents and restricted cash | (1,204) | | | (3,601) | | | (2,940) | |
| Cash, cash equivalents and restricted cash at beginning of year | 2,436 | | | 6,037 | | | 8,976 | |
| Cash, cash equivalents and restricted cash at end of year | $ | 1,231 | | | $ | 2,436 | | | $ | 6,037 | |
The accompanying notes are an integral part of these consolidated financial statements.
CARNIVAL CORPORATION & PLC
CONSOLIDATED STATEMENTS OF SHAREHOLDERS’ EQUITY
(in millions)
| | | | | | | | | | | | | | | | | | | | | | | | | | | | | | | | | | | | | | | | | |
| Common
stock | | Ordinary
shares | | Additional
paid-in
capital | | Retained
earnings | | AOCI | | Treasury
stock | | Total
shareholders’
equity |
| At November 30, 2021 | $ | 11 | | | $ | 361 | | | $ | 15,292 | | | $ | 6,448 | | | $ | (1,501) | | | $ | (8,466) | | | $ | 12,144 | |
| | | | | | | | | | | | | |
| Net income (loss) | — | | | — | | | — | | | (6,093) | | | — | | | — | | | (6,093) | |
| Other comprehensive income (loss) | — | | | — | | | — | | | — | | | (481) | | | — | | | (481) | |
| Issuances of common stock, net | 1 | | | — | | | 1,178 | | | — | | | — | | | — | | | 1,180 | |
| Issuance of Convertible Notes | — | | | — | | | 229 | | | — | | | — | | | — | | | 229 | |
| Purchases and issuances under the Stock Swap Program, net | — | | | — | | | 95 | | | — | | | — | | | (87) | | | 8 | |
| Issuance of treasury shares for vested share-based awards | — | | | — | | | — | | | (85) | | | — | | | 85 | | | — | |
| Share-based compensation and other | — | | | — | | | 79 | | | (1) | | | — | | | — | | | 78 | |
| At November 30, 2022 | 12 | | | 361 | | | 16,872 | | | 269 | | | (1,982) | | | (8,468) | | | 7,065 | |
| Change in accounting principle (a) | — | | | — | | | (229) | | | (10) | | | — | | | — | | | (239) | |
| Net income (loss) | — | | | — | | | — | | | (74) | | | — | | | — | | | (74) | |
| Other comprehensive income (loss) | — | | | — | | | — | | | — | | | 44 | | | — | | | 44 | |
| | | | | | | | | | | | | |
| Issuances of common stock, net | — | | | — | | | 5 | | | — | | | — | | | — | | | 5 | |
| Conversion of Convertible Notes | — | | | — | | | 3 | | | — | | | — | | | — | | | 3 | |
| Purchases and issuances under the Stock Swap Program, net | — | | | — | | | 22 | | | — | | | — | | | (20) | | | 2 | |
| Issuance of treasury shares for vested share-based awards | — | | | — | | | (41) | | | — | | | — | | | 41 | | | — | |
| Share-based compensation and other | — | | | — | | | 79 | | | — | | | — | | | (2) | | | 78 | |
| At November 30, 2023 | 12 | | | 361 | | | 16,712 | | | 185 | | | (1,939) | | | (8,449) | | | 6,882 | |
| | | | | | | | | | | | | |
| | | | | | | | | | | | | |
| Net income (loss) | — | | | — | | | — | | | 1,916 | | | — | | | — | | | 1,916 | |
| Other comprehensive income (loss) | — | | | — | | | — | | | — | | | (36) | | | — | | | (36) | |
| | | | | | | | | | | | | |
| Conversion of Convertible Notes | — | | | — | | | 414 | | | — | | | — | | | — | | | 415 | |
| | | | | | | | | | | | | |
| Issuance of treasury shares for vested share-based awards | — | | | — | | | (47) | | | — | | | — | | | 47 | | | — | |
| Share-based compensation and other | — | | | — | | | 76 | | | — | | | — | | | (2) | | | 75 | |
| At November 30, 2024 | $ | 13 | | | $ | 361 | | | $ | 17,155 | | | $ | 2,101 | | | $ | (1,975) | | | $ | (8,404) | | | $ | 9,251 | |
(a)We adopted the provisions of Debt - Debt with Conversion and Other Options and Derivative and Hedging - Contracts in Entity’s Own Equity on December 1, 2022.
The accompanying notes are an integral part of these consolidated financial statements.
CARNIVAL CORPORATION & PLC
NOTES TO CONSOLIDATED FINANCIAL STATEMENTS
NOTE 1 – General
Description of Business
Carnival Corporation was incorporated in Panama in 1974 and Carnival plc was incorporated in England and Wales in 2000. Together with their consolidated subsidiaries, they are referred to collectively in these consolidated financial statements and elsewhere in this 2024 Annual Report as “Carnival Corporation & plc,” “our,” “us” and “we.” The consolidated financial statements include the accounts of Carnival Corporation and Carnival plc and their respective subsidiaries.
We are the largest global cruise company, and among the largest leisure travel companies, with a portfolio of world-class cruise lines – AIDA Cruises, Carnival Cruise Line, Costa Cruises, Cunard, Holland America Line, P&O Cruises (Australia), P&O Cruises (UK), Princess Cruises, and Seabourn.
In June 2024, we announced that we will sunset the P&O Cruises (Australia) brand and fold its Australia operations into Carnival Cruise Line in March 2025.
DLC Arrangement
Carnival Corporation and Carnival plc operate a dual listed company (“DLC”) arrangement, whereby the businesses of Carnival Corporation and Carnival plc are combined through a number of contracts and provisions in Carnival Corporation’s Articles of Incorporation and By-Laws and Carnival plc’s Articles of Association. The two companies operate as a single economic enterprise with a single senior management team and identical Boards of Directors, but each has retained its separate legal identity. Carnival Corporation’s shares of common stock are publicly traded on the New York Stock Exchange (“NYSE”) and Carnival plc’s ordinary shares are publicly traded on the London Stock Exchange. The Carnival plc American Depositary Shares are traded on the NYSE.
The constitutional documents of each company provide that, on most matters, the holders of the common equity of both companies effectively vote as a single body. The Equalization and Governance Agreement between Carnival Corporation and Carnival plc provides for the equalization of dividends and liquidation distributions based on an equalization ratio and contains provisions relating to the governance of the DLC arrangement. Because the equalization ratio is 1 to 1, one share of Carnival Corporation common stock and one Carnival plc ordinary share are generally entitled to the same distributions.
Under deeds of guarantee executed in connection with the DLC arrangement, as well as stand-alone guarantees executed since that time, each of Carnival Corporation and Carnival plc have effectively cross guaranteed all indebtedness and certain other monetary obligations of each other. Once the written demand is made, the holders of indebtedness or other obligations may immediately commence an action against the relevant guarantor.
Under the terms of the DLC arrangement, Carnival Corporation and Carnival plc are permitted to transfer assets between the companies, make loans to or investments in each other and otherwise enter into intercompany transactions. In addition, the cash flows and assets of one company are required to be used to pay the obligations of the other company, if necessary.
Given the DLC arrangement, we believe that providing separate financial statements for each of Carnival Corporation and Carnival plc would not present a true and fair view of the economic realities of their operations. Accordingly, separate financial statements for Carnival Corporation and Carnival plc have not been presented.
NOTE 2 – Summary of Significant Accounting Policies
Basis of Presentation
We consolidate entities over which we have control, as typically evidenced by a voting control of greater than 50% or for which we are the primary beneficiary, whereby we have the power to direct the most significant activities and the obligation to absorb significant losses or receive significant benefits from the entity. We do not separately present our noncontrolling interests in the consolidated financial statements since the amounts are immaterial. For affiliates we do not control but where significant influence over financial and operating policies exists, as typically evidenced by a voting control of 20% to 50%, the investment is accounted for using the equity method.
For 2023, we reclassified $11 million from restricted cash to prepaid expenses and other in the Consolidated Balance Sheets to conform to the current year presentation.
Preparation of Consolidated Financial Statements
The preparation of our consolidated financial statements in conformity with accounting principles generally accepted in the United States of America (“U.S. GAAP”) requires management to make estimates and assumptions that affect the amounts reported and disclosed in our consolidated financial statements. We have made reasonable estimates and judgments of such items within our consolidated financial statements and there may be changes to those estimates in future periods. Actual results may differ from the estimates used in preparing our consolidated financial statements. All material intercompany balances and transactions are eliminated in consolidation.
Cash and Cash Equivalents
Cash and cash equivalents include investments with maturities of three months or less at acquisition which are stated at cost and present insignificant risk of changes in value.
Trade and Other Receivables
Although we generally require full payment from our customers prior to or concurrently with their cruise, we grant credit terms to a relatively small portion of our revenue source. We have receivables from credit card merchants and travel agents for cruise ticket purchases and onboard revenue. These receivables are included within trade and other receivables, net and are less allowances for expected credit losses.
Inventories
Inventories consist substantially of food, beverages, hotel supplies, fuel and retail merchandise, which are all carried at the lower of cost or net realizable value. Cost is determined using the weighted-average or first-in, first-out methods and applied consistently between major categories of inventory.
Property and Equipment
Property and equipment are stated at cost less accumulated depreciation and any impairment charges. We capitalize interest as part of the cost of capital projects incurred during construction. Depreciation is computed using the straight-line method over our estimated useful lives of the assets to a residual value, as a percentage of original cost, as follows: | | | | | | | | | | | |
| Years | | Residual
Values |
| Ships | 30 | | 15% |
| Ship improvements | 3-30 | | 0% |
| Buildings and improvements | 10-40 | | 0% |
| Computer hardware and software | 2-12 | | 0% |
| Transportation equipment and other | 3-20 | | 0% |
| Leasehold improvements, including port facilities | Shorter of the remaining lease term or related asset life (3-30) | | 0% |
The cost of ships under construction includes progress payments for the construction of new ships, as well as design and engineering fees, capitalized interest, construction oversight costs and various owner supplied items. Any liquidated damages received from shipyards are recorded as reductions to the cost basis of the ship.
We have a capital program for the improvement of our ships and for asset replacements to enhance the effectiveness and efficiency of our operations; to comply with, or exceed, all relevant legal and statutory requirements related to health, environment, safety, security and sustainability; and to gain strategic benefits or provide improved product innovations to our guests. We account for ship improvement costs, including replacements of certain significant components and parts, by capitalizing those costs we believe add value to our ships and have a useful life greater than one year and depreciating those improvements over their estimated remaining useful life. The costs of repairs and maintenance, including those incurred when a
ship is taken out-of-service for scheduled maintenance, and minor improvement costs and expenses, are charged to expense as incurred.
In addition, specifically identified or estimated cost and accumulated depreciation of previously capitalized ship components are written-off upon retirement, which may result in a loss on disposal that is also included in other operating expenses.
We have estimated our ships’ useful lives at 30 years and residual values at 15% of our original ship cost. Our ships’ useful life and residual value estimates take into consideration the estimated weighted-average useful lives of the ships’ major component systems, such as hull, superstructure, main electric, engines and cabins. We also take into consideration the impact of technological changes, historical useful lives of similarly-built ships, long-term cruise and vacation market conditions and regulatory changes, including those related to the environment and climate change. We determine the residual value of our ships based on our long-term estimates of their resale value at the end of their useful lives to us but before the end of their physical and economic lives to others, historical resale values of our and other cruise ships as well as our expectations of the long-term viability of the secondary cruise ship market. We review estimated useful lives and residual values for reasonableness whenever events or circumstances significantly change.
We evaluate ship asset impairments at the individual ship level which is the lowest level for which identifiable cash flows are largely independent of the cash flows of other assets and liabilities. We review our ships for impairment whenever events or circumstances indicate that the carrying value of a ship may not be recoverable. If estimated future cash flows are less than the carrying value of a ship, an impairment charge is recognized to the extent its carrying value exceeds its estimated fair value.
Leases
Substantially all of our leases for which we are the lessee are operating leases of port facilities and real estate and are included within operating lease right-of-use assets, net, long-term operating lease liabilities and current portion of operating lease liabilities in our Consolidated Balance Sheets. We determine if an arrangement is or contains a lease at the lease inception date by evaluating whether the arrangement conveys the right to use an identified asset and whether we obtain substantially all of the economic benefits from and have the ability to direct the use of the asset.
We have port facilities and real estate lease agreements with lease and non-lease components, and in such cases, we account for the components as a single lease component.
We do not recognize lease assets and lease liabilities for any leases that have an initial term of twelve months or less and do not include an option to purchase the underlying asset that we are reasonably certain to exercise. For some of our port facilities and real estate lease agreements, we have the option to extend our current lease term by 1 to 10 years. Generally, we do not include renewal options as a component of our present value calculation as we are not reasonably certain that we will exercise the options.
As our leases do not have a readily determinable implicit rate, we estimate the incremental borrowing rate (“IBR”) to determine the present value of lease payments. We apply judgment in determining the IBR including considering the term of the lease, the currency in which the lease is denominated, and the impact of collateral and our credit risk on the rate.
We recognize lease expense for our operating leases on a straight-line basis over the lease term.
Goodwill and Other Intangibles
Goodwill represents the excess of the purchase price over the fair value of identifiable net assets acquired in a business acquisition. We review our goodwill for impairment as of July 31 every year, or more frequently if events or circumstances dictate. All of our goodwill has been allocated to our reporting units. The impairment review for goodwill allows us to first assess qualitative factors to determine whether it is necessary to perform a more detailed quantitative goodwill impairment test. We would perform the quantitative test if our qualitative assessment determined it is more-likely-than-not that a reporting unit’s estimated fair value is less than its carrying amount. We may also elect to bypass the qualitative assessment and proceed directly to the quantitative test for any reporting unit. When performing the quantitative test, if the estimated fair value of the reporting unit exceeds its carrying value, no further analysis is required. However, if the estimated fair value of the reporting unit is less than the carrying value, goodwill is written down based on the difference between the reporting unit’s carrying amount and its fair value, limited to the amount of goodwill allocated to the reporting unit. Judgment is required in estimating the fair value of our reporting unit.
Trademarks represent substantially all of our other intangibles. Trademarks are estimated to have an indefinite useful life and are not amortizable but are reviewed for impairment at least annually and as events or circumstances dictate. The impairment review for trademarks also allows us to first assess qualitative factors to determine whether it is necessary to perform a more detailed quantitative trademark impairment test. We would perform the quantitative test if our qualitative assessment determined it was more-likely-than-not that the trademarks are impaired. We may also elect to bypass the qualitative assessment and proceed directly to the quantitative test. Our trademarks would be considered impaired if their carrying value exceeds their estimated fair value.
Emission Allowances
We became subject to the EU Emissions Trading System (“ETS”) on January 1, 2024, which includes a three-year phase-in period. The ETS regulates emissions through a “cap and trade” principle, where a cap is set on the total amount of certain emissions that can be emitted and requires us to procure emission allowances for certain emissions inside EU waters (as defined in the ETS). Emission allowances are recorded at cost and are included in prepaid expenses and other or other assets. Purchases of emission allowances are classified as operating activities in our Consolidated Statements of Cash Flows. Emission obligations are recorded when generated and are included in accrued liabilities and other and other long-term liabilities. The funded portion of the emission obligations are measured at the carrying value of the emission allowances and the unfunded portion of emission obligations is measured at the fair value of emission allowances necessary to settle. We record expense for emissions in EU waters in fuel expense in the period incurred. Emission allowances and obligations are derecognized when surrendered based on the first-in, first-out method, and are non-cash activities.
Equity Method Investments
Equity method investments are initially recognized at cost and are included in other assets in the Consolidated Balance Sheets. Our proportionate interest in their results is included in other income (expense), net in the Consolidated Statements of Income (Loss).
Debt and Debt Issuance Costs
Debt is recorded at initial fair value, which normally reflects the proceeds received by us, net of debt issuance costs. Debt is subsequently stated at amortized cost. Debt issuance costs, discounts and premiums are generally amortized to interest expense using the straight-line method, which approximates the effective interest method, over the term of the debt. Debt issuance costs related to a recognized debt liability are presented in the Consolidated Balance Sheets as a direct deduction from the carrying amount of that debt liability, consistent with debt discounts. For our revolving facility, and those export credit facilities not yet drawn, the related debt issuance costs are deferred and recorded as an asset. Debt instruments are evaluated for the existence of features that require separation and accounting as a derivative. In our Consolidated Statements of Cash Flows, debt issuance costs paid to lenders related to a recognized debt liability are netted against the proceeds from the related long-term debt while debt issuance costs paid to third parties, or related to undrawn credit facilities, are presented separately within financing activities.
Derivatives and Other Financial Instruments
We have in the past and may in the future utilize derivative and non-derivative financial instruments, such as foreign currency forwards, options and swaps, foreign currency debt obligations and foreign currency cash balances, to manage our exposure to fluctuations in certain foreign currency exchange rates. We use interest rate swaps primarily to manage our interest rate exposure to achieve a desired proportion of fixed and floating rate debt. Our policy is to not use financial instruments for trading or other speculative purposes.
All derivatives are recorded at fair value. If a derivative is designated as a cash flow hedge, then the change in the fair value of the derivative is recognized as a component of AOCI until the underlying hedged item is recognized in earnings or the forecasted transaction is no longer probable. If a derivative or a non-derivative financial instrument is designated as a hedge of our net investment in a foreign operation, then changes in the effective portion of the fair value of the financial instrument are recognized as a component of AOCI to offset the change in the translated value of the designated portion of net investment being hedged until the investment is sold or substantially liquidated, while the impact attributable to components excluded from the assessment of hedge effectiveness is recorded in interest expense, net of capitalized interest, on a systematic and rational basis. For derivatives that do not qualify for hedge accounting treatment, the change in fair value is recognized in earnings.
We classify the fair value of all our derivative contracts as either current or long-term, depending on the maturity date of the derivative contract. The cash flows from derivatives treated as cash flow hedges are classified in our Consolidated Statements of Cash Flows in the same category as the item being hedged.
Derivative valuations are based on observable inputs such as interest rates and commodity price curves, forward currency exchange rates, credit spreads, maturity dates, volatilities, and cross currency basis spreads. We use the income approach to value derivatives for foreign currency options and forwards, interest rate swaps and cross currency swaps using observable market data for all significant inputs and standard valuation techniques to convert future amounts to a single present value amount, assuming that participants are motivated but not compelled to transact.
Foreign Currency Translation and Transactions
These consolidated financial statements are presented in U.S. dollars. Each foreign entity determines its functional currency by reference to its primary economic environment. Our most significant foreign entities utilize the U.S. dollar, Euro, Sterling or the Australian dollar as their functional currencies. We translate the assets and liabilities of our foreign entities that have functional currencies other than the U.S. dollar at exchange rates in effect at the balance sheet date. Revenues and expenses of these foreign entities are translated at the average rate for the period. Equity is translated at historical rates and the resulting foreign currency translation adjustments are included as a component of AOCI, which is a separate component of shareholders’ equity. Therefore, the U.S. dollar value of the non-equity translated items in our consolidated financial statements will fluctuate from period to period, depending on the changing value of the U.S. dollar versus these currencies.
We execute transactions in a number of different currencies. At the date that the transaction is recognized, each asset, liability, revenue, expense, gain or loss arising from the transaction is measured and recorded in the functional currency of the recording entity using the exchange rate in effect at that date. At each balance sheet date, recorded monetary balances denominated in a currency other than the functional currency are adjusted using the exchange rate at the balance sheet date, with gains or losses recorded in other income or other expense, unless such monetary balances have been designated as hedges of net investments in our foreign entities. The net gains or losses resulting from foreign currency transactions were not material in 2024, 2023 and 2022. In addition, the unrealized gains or losses on our long-term intercompany receivables and payables which are denominated in a non-functional currency and which are not expected to be repaid in the foreseeable future are recorded as foreign currency translation adjustments included as a component of AOCI.
Revenue and Expense Recognition
Guest cruise deposits and advance onboard purchases are initially included in customer deposits when received. Customer deposits are subsequently recognized as cruise revenues, together with revenues from onboard and other activities, and all associated direct costs and expenses of a voyage are recognized as cruise costs and expenses, upon completion of voyages with durations of ten nights or less and on a pro rata basis for voyages in excess of ten nights. The impact of recognizing these shorter duration cruise revenues and costs and expenses on a completed voyage basis versus on a pro rata basis is not material. Certain of our product offerings are bundled and we allocate the value of the bundled services and goods between passenger ticket revenues and onboard and other revenues based upon the estimated standalone selling prices of those goods and services. Future travel discount vouchers are included as a reduction of cruise passenger ticket revenues when such vouchers are utilized. Guest cancellation fees, when applicable, are recognized in passenger ticket revenues at the time of cancellation.
Our sales to guests of air and other transportation to and from airports near the home ports of our ships are included in passenger ticket revenues, and the related costs of these services are included in prepaid expenses and other when paid prior to the start of a voyage and are subsequently recognized in transportation costs at the time of revenue recognition. The cost of prepaid air and other transportation costs at November 30, 2024 was $219 million. The proceeds that we collect from the sales of third-party shore excursions are included in onboard and other revenues and the related costs are included in onboard and other costs. The amounts collected on behalf of our onboard concessionaires, net of the amounts remitted to them, are included in onboard and other revenues as concession revenues. All of these amounts are recognized on a completed voyage or pro rata basis as discussed above.
Fees, taxes and charges that vary with guest head counts are expensed in commissions, transportation and other costs when the corresponding revenues are recognized. The remaining portion of fees, taxes and charges are expensed in other operating expenses when the corresponding revenues are recognized.
Revenues and expenses from our hotel and transportation operations, which are included in our Tour and Other segment, are recognized at the time the services are performed.
Customer Deposits
Our payment terms generally require an initial deposit to confirm a reservation, with the balance due prior to the voyage. Cash received from guests in advance of the cruise is recorded in customer deposits and in other long-term liabilities on our
Consolidated Balance Sheets. These amounts include refundable deposits. We had total customer deposits of $6.8 billion and $6.4 billion as of November 30, 2024 and 2023, which includes approximately $25 million of unredeemed Future Cruise Credits (“FCCs”) as of November 30, 2024. At November 30, 2023, we had approximately $134 million of unredeemed FCCs, of which $111 million were refundable. During 2024 and 2023, we recognized revenues of $5.5 billion and $4.1 billion related to our customer deposits as of November 30, 2023 and 2022. Our customer deposits balance changes due to the seasonal nature of cash collections, which typically results from higher ticket prices and occupancy levels during the third quarter, the recognition of revenue, refunds of customer deposits and foreign currency changes.
Contract Costs
We recognize incremental travel agent commissions and credit and debit card fees incurred as a result of obtaining the ticket contract as assets when paid prior to the start of a voyage. We record these amounts within prepaid expenses and other and subsequently recognize these amounts as commissions, transportation and other at the time of revenue recognition or at the time of voyage cancellation. We had incremental costs of obtaining contracts with customers recognized as assets of $336 million and $294 million as of November 30, 2024 and 2023.
Insurance
We use a combination of insurance and self-insurance to cover a number of risks including illness and injury to crew, guest injuries, pollution, other third-party claims in connection with our cruise activities, damage to hull and machinery for each of our ships, war risks, workers’ compensation, directors’ and officers’ liability, property damage and general liability for shoreside third-party claims. We recognize insurance recoverables from third-party insurers up to the amount of recorded losses at the time the recovery is probable and upon settlement for amounts in excess of the recorded losses. All of our insurance policies are subject to coverage limits, exclusions and deductible levels. The liabilities associated with crew illnesses and crew and guest injury claims, including all legal costs, are estimated based on the specific merits of the individual claims or actuarially estimated based on historical claims experience, loss development factors and other assumptions.
Selling and Administrative Expenses
Selling expenses include a broad range of advertising, marketing and promotional expenses. Advertising is charged to expense as incurred, except for media production costs, which are expensed upon the first airing of the advertisement. Selling expenses totaled $925 million in 2024, $851 million in 2023 and $744 million in 2022. Administrative expenses represent the costs of our shoreside support, reservations and other administrative functions, and include salaries and related benefits, professional fees and building occupancy costs, which are typically expensed as incurred.
Share-Based Compensation
We recognize compensation expense for all share-based compensation awards using the fair value method. For time-based share awards, we recognize compensation cost ratably using the straight-line attribution method over the expected vesting period or to the retirement eligibility date, if earlier than the vesting period. For performance-based share awards, we estimate compensation cost based on the probability of the performance condition being achieved and recognize expense ratably using the straight-line attribution method over the expected vesting period. If all or a portion of the performance condition is not expected to be met, the appropriate amount of previously recognized compensation expense is reversed and future compensation expense is adjusted accordingly. We account for forfeitures as they occur.
Earnings Per Share
Basic earnings per share is computed by dividing net income (loss) by the weighted-average number of shares outstanding during each period. Diluted earnings per share is computed by dividing net income by the weighted-average number of shares and common stock equivalents outstanding during each period including the dilutive effect of convertible notes using the if-converted method. For earnings per share purposes, Carnival Corporation common stock and Carnival plc ordinary shares are considered a single class of shares since they have equivalent rights.
Accounting Pronouncements
In September 2022, the Financial Accounting Standards Board (“FASB”) issued guidance, Liabilities-Supplier Finance Programs - Disclosure of Supplier Finance Program Obligations. This guidance requires that a buyer in a supplier finance program disclose sufficient information about the program to allow a user of financial statements to understand the program’s nature, activity during the period, changes from period to period, and potential magnitude. On December 1, 2023, we adopted this guidance using the retrospective method for each period presented. The adoption of this guidance had no impact on our consolidated financial statements and related disclosures.
In November 2023, the FASB issued guidance, Segment Reporting - Improvements to Reportable Segment Disclosures. This guidance requires annual and interim disclosure of significant segment expenses that are provided to the chief operating decision maker (“CODM”) as well as interim disclosures for all reportable segments’ profit or loss and assets. This guidance also requires disclosure of the title and position of the CODM and an explanation of how the CODM uses the reported measures of segment profit or loss in assessing segment performance and deciding how to allocate resources. This guidance is required to be adopted by us in 2025. We are currently evaluating the impact this guidance will have on our consolidated financial statements and related disclosures.
In December 2023, the FASB issued guidance, Income Taxes - Improvements to Income Tax Disclosures. This guidance requires disaggregation of rate reconciliation categories and income taxes paid by jurisdiction, as well as other amendments relating to income tax disclosures. This guidance is required to be adopted by us in 2026. We are currently evaluating the impact this guidance will have on our consolidated financial statements and related disclosures.
In November 2024, the FASB issued guidance, Income Statement - Reporting Comprehensive Income - Expense Disaggregation Disclosures - Disaggregation of Income Statement Expenses. This guidance requires annual and interim disclosure of disaggregated information for certain costs and expenses. This guidance is required to be adopted by us in 2028. We are currently evaluating the impact this guidance will have on our consolidated financial statements and related disclosures.
In November 2024, the FASB issued guidance, Debt - Debt with Conversion and Other Options - Induced Conversions of Convertible Debt Instruments. This guidance clarifies the requirements for determining whether certain settlements of convertible debt instruments should be accounted for as induced conversions or extinguishments. This guidance is required to be adopted by us in 2027. We are currently evaluating the impact this guidance will have on our consolidated financial statements.
NOTE 3 – Property and Equipment | | | | | | | | | | | |
| | November 30, |
| (in millions) | 2024 | | 2023 |
| Ships and ship improvements | $ | 58,649 | | | $ | 55,026 | |
| Ships under construction | 535 | | | 1,284 | |
| Other property and equipment | 4,705 | | | 4,213 | |
| Total property and equipment | 63,889 | | | 60,523 | |
| Less accumulated depreciation | (22,094) | | | (20,407) | |
| $ | 41,795 | | | $ | 40,116 | |
Capitalized interest amounted to $61 million in 2024, $64 million in 2023 and $48 million in 2022.
Sales of Ships
During 2024, we completed the sale of one North America and Australia (“NAA”) segment ship, which represents a passenger-capacity reduction of 2,000 berths. We will continue to operate this ship under a bareboat charter agreement through February 2025.
Refer to Note 10 - “Fair Value Measurements, Derivative Instruments and Hedging Activities and Financial Risks, Nonfinancial Instruments that are Measured at Fair Value on a Nonrecurring Basis, Impairment of Ships” for additional discussion.
NOTE 4 – Equity Method Investments
At November 30, 2024 and 2023, we had a 49% and 40% noncontrolling interest in Grand Bahama Shipyard Ltd. (“Grand Bahama”), a ship repair and maintenance facility. During 2024, we acquired an additional 9% ownership interest in Grand Bahama. As of November 30, 2024, our investment in Grand Bahama was $45 million, consisting of $28 million in equity and a loan of $18 million. As of November 30, 2023, our investment in Grand Bahama was $43 million, consisting of $25 million in equity and a loan of $18 million. Grand Bahama provided an immaterial amount of services to us in 2024, 2023 and 2022.
We have a 50% noncontrolling interest in Floating Docks S. de RL. (“Floating Docks”), an entity that will purchase two floating drydocks and will then lease them to Grand Bahama. As of November 30, 2024 and 2023 our investment in Floating Docks was $81 million and $21 million. We have provided payment guarantees on behalf of Floating Docks. As of November 30, 2024 and 2023, the amounts outstanding under these guarantees were $37 million and $46 million.
In November 2024, we entered into an agreement to sell one-third of our interest in Grand Bahama and Floating Docks. The closing is subject to government approval. If approved, the sale will not have a material impact to our consolidated financial statements.
We have a 45% noncontrolling interest in the White Pass & Yukon Route (“White Pass”) that includes port, railroad and retail operations in Skagway, Alaska. White Pass provided an immaterial amount of services to us in 2024, 2023 and 2022. In 2022, we evaluated whether our investment in White Pass was other than temporarily impaired and performed an impairment assessment. As a result of our assessment, we recognized impairment charges for 2022 of $30 million in other income (expense), net. As of November 30, 2024, our investment in White Pass was $58 million, consisting of $26 million in equity and a loan of $32 million. As of November 30, 2023, our investment in White Pass was $53 million, consisting of $21 million in equity and a loan of $32 million.
During 2023, we completed the exit of our noncontrolling interest in Adora Cruises Limited, formerly CSSC Carnival Cruise Shipping Limited, a China-based cruise company (“Adora Cruises”), and recognized losses on exit of $21 million within other income (expense).
Our proportionate interest in the results of our equity method investments is not material.
NOTE 5 – Debt
| | | | | | | | | | | | | | | | | | | | | | | |
| | | November 30, |
| (in millions) | Maturity | | Rate (a) | | 2024 | | 2023 |
| Secured Subsidiary Guaranteed | | | | | | | |
| Notes | | | | | | | |
| | | | | | | |
| | | | | | | |
| | | | | | | |
| Notes | Jun 2027 | | 7.9% | | $ | 192 | | | $ | 192 | |
| Notes (b) | Aug 2027 | | 9.9% | | — | | | 623 | |
| Notes | Aug 2028 | | 4.0% | | 2,406 | | | 2,406 | |
| Notes | Aug 2029 | | 7.0% | | 500 | | | 500 | |
| Loans | | | | | | | |
| EUR floating rate (b) | Jun 2025 | | EURIBOR + 3.8% | | — | | | 851 | |
| Floating rate | Aug 2027 - Oct 2028 | | SOFR + 2.8% (c) | | 2,449 | | | 3,567 | |
| Total Secured Subsidiary Guaranteed | | | | 5,547 | | | 8,138 | |
| Senior Priority Subsidiary Guaranteed | | | | | | | |
| Notes | May 2028 | | 10.4% | | 2,030 | | | 2,030 | |
| Unsecured Subsidiary Guaranteed | | | | | | | |
| | | | | | | |
| | | | | | | |
| Notes | | | | | | | |
| | | | | | | |
| | | | | | | |
| Convertible Notes | Oct 2024 | | 5.8% | | — | | | 426 | |
| Notes | Mar 2026 | | 7.6% | | 1,351 | | | 1,351 | |
| EUR Notes (b) | Mar 2026 | | 7.6% | | — | | | 550 | |
| Notes (b) | Mar 2027 | | 5.8% | | 2,722 | | | 3,100 | |
| Convertible Notes | Dec 2027 | | 5.8% | | 1,131 | | | 1,131 | |
| Notes | May 2029 | | 6.0% | | 2,000 | | | 2,000 | |
| EUR Notes | Jan 2030 | | 5.8% | | 528 | | | — | |
| Notes | Jun 2030 | | 10.5% | | 1,000 | | | 1,000 | |
| Loans | | | | | | | |
| | | | | | | |
| | | | | | | |
| | | | | | | |
| EUR floating rate (b) (d) | Apr 2025 | | EURIBOR + 3.3% | | 211 | | | 678 | |
| Export Credit Facilities | | | | | | | |
| Floating rate | Dec 2031 | | SOFR + 1.2% (e) | | 514 | | | 583 | |
| Fixed rate | Aug 2027 - Dec 2032 | | 2.4 - 3.4% | | 2,370 | | | 2,756 | |
| EUR floating rate | Mar 2025 - Nov 2034 | | EURIBOR + 0.2 - 0.8% | | 2,590 | | | 3,086 | |
| EUR fixed rate | Feb 2031 - Sep 2037 | | 1.1 - 4.0% | | 5,386 | | | 3,652 | |
| Total Unsecured Subsidiary Guaranteed | | | | 19,803 | | | 20,312 | |
| | | | | | | |
| Unsecured Notes (No Subsidiary Guarantee) | | | | | | |
| | | | | | | |
| Notes | Jan 2028 | | 6.7% | | 200 | | | 200 | |
| EUR Notes | Oct 2029 | | 1.0% | | 633 | | | 659 | |
| Total Unsecured Notes (No Subsidiary Guarantee) | | | | 833 | | | 859 | |
| Total Debt | | | | | 28,213 | | | 31,339 | |
| Less: unamortized debt issuance costs and discounts | | | | | (738) | | | (768) | |
| Total Debt, net of unamortized debt issuance costs and discounts | | | | | 27,475 | | | 30,572 | |
| | | | | | | |
| Less: current portion of long-term debt | | | | | (1,538) | | | (2,089) | |
| Long-Term Debt | | | | | $ | 25,936 | | | $ | 28,483 | |
(a)The reference rates, together with any applicable credit adjustment spread, for substantially all of our variable debt have 0.0% to 0.75% floors.
(b)See “Debt Prepayments” below.
(c)As part of the repricing of our senior secured term loans, we amended the loans’ margin from 3.0% – 3.4% (inclusive of credit adjustment spread) to 2.8%. See “Repricing of senior secured term loans” below.
(d)The maturity of the principal amount of $211 million was extended from April 2024 to April 2025.
(e)Includes applicable credit adjustment spread.
Carnival Corporation and/or Carnival plc is the primary obligor of all our outstanding debt excluding the following:
•$2.9 billion under an undrawn $1.9 billion, €0.9 billion and £0.1 billion multi-currency revolving credit facility (“Revolving Facility”) of Carnival Holdings (Bermuda) II Limited (“Carnival Holdings II”), a subsidiary of Carnival Corporation
•$2.0 billion of senior priority notes (the “2028 Senior Priority Notes”), issued by Carnival Holdings (Bermuda) Limited (“Carnival Holdings”), a subsidiary of Carnival Corporation
•$0.9 billion under an export credit facility of Sun Princess Limited, a subsidiary of Carnival Corporation
•$0.2 billion under an export credit facility of Sun Princess II Limited, a subsidiary of Carnival Corporation
All of our outstanding debt is issued or guaranteed by substantially the same entities with the exception of the following:
•Our 2028 Senior Priority Notes, issued by Carnival Holdings, which does not guarantee our other outstanding debt
•The export credit facilities of Sun Princess Limited and Sun Princess II Limited, which do not guarantee our other outstanding debt
•The Revolving Facility of Carnival Holdings II, which does not guarantee our other outstanding debt
As of November 30, 2024, the scheduled maturities of our debt are as follows:
| | | | | | | | |
| (in millions) | | |
| Year | | Principal Payments |
| 2025 | | $ | 1,538 | |
| 2026 | | 2,683 | |
| 2027 | | 4,894 | |
| 2028 | | 8,726 | |
| 2029 | | 4,328 | |
| Thereafter | | 6,044 | |
| Total | | $ | 28,213 | |
Revolving Facility
As of November 30, 2024, Carnival Holdings II had $2.9 billion available for borrowing under the Revolving Facility. Carnival Holdings II may continue to borrow or otherwise utilize available amounts under the Revolving Facility through August 2027, subject to the satisfaction of the conditions in the facility.
Borrowings under the Revolving Facility bear interest at a rate of term SOFR, in relation to any loan in U.S. dollars, EURIBOR, in relation to any loan in euros, or daily compounding SONIA, in relation to any loan in sterling, plus a margin based on the long-term credit ratings of Carnival Corporation. This facility also includes an emissions linked margin adjustment whereby, after the initial applicable margin is set per the margin pricing grid, the margin may be adjusted based on performance in achieving certain agreed annual GHG emissions goals. In addition, we are required to pay certain fees on the aggregate unused commitments under the Revolving Facility.
During 2023, in connection with the Revolving Facility, Carnival Corporation and Carnival plc contributed three unencumbered vessels with a net book value of $2.9 billion on the date of contribution (the “Revolving Facility Subject Vessels”) to Carnival Holdings II with each of the vessels continuing to be operated under one of the Carnival Corporation & plc brands.
Repricing of Senior Secured Term Loans
During 2024, we entered into amendments with the lender syndicate to reprice $1.7 billion of our first-priority senior secured term loan facility maturing in 2028 and $1.0 billion of our first-priority senior secured term loan facility maturing in 2027, which are included within the total Secured Subsidiary Guaranteed Loans balance in the debt table above. Subsequent to November 30, 2024, we entered into further amendments with the lender syndicate to reprice the outstanding principal amounts under these facilities (“Repriced Loans”). The Repriced Loans bear interest at a rate per annum equal to SOFR with a 0.75% floor, plus a margin equal to 2.0%.
2030 Senior Unsecured Notes
During 2024, we issued $535 million aggregate principal amount of 5.8% senior unsecured euro notes due 2030. We used the net proceeds from the issuance, together with cash on hand, to redeem the outstanding principal amount of the 7.6% senior unsecured euro notes due 2026.
Debt Prepayments
During 2024, we made prepayments for the following debt instruments:
•Euro-denominated tranche of our first-priority senior secured term loan facility maturing in 2025
•First-priority senior secured term loan facilities maturing in 2027 and 2028
•9.9% second-priority secured notes due 2027
•7.6% senior unsecured euro notes due 2026
•5.8% senior unsecured notes due 2027
•Euro floating rate loan due 2026
The aggregate amount of these prepayments was $3.8 billion.
Export Credit Facility Borrowings
During 2024, we borrowed $2.4 billion under export credit facilities due in semi-annual installments through 2037. As of November 30, 2024, we had $7.8 billion of undrawn export credit facilities to fund ship deliveries planned through 2033. As of November 30, 2024, the net book value of the vessels, excluding ships under construction, subject to negative pledges pursuant to export credit facilities was $18.5 billion.
Convertible Notes
On July 1, 2024, our 5.8% convertible senior notes due 2024 (the “2024 Convertible Notes”) became convertible, at the option of the holders, at any time prior to the close of business on September 27, 2024. Pursuant to the terms of the indenture governing the 2024 Convertible Notes, we irrevocably elected to settle conversions of the 2024 Convertible Notes during this period in shares of Carnival Corporation common stock. Substantially all of the 2024 Convertible Notes were converted to shares of common stock, which resulted in the issuance of approximately 41.5 million shares of common stock, and the remaining principal balance was repaid at maturity on October 1, 2024.
In November 2022, we issued $1.1 billion aggregate principal amount of 5.8% convertible senior notes due 2027 (the “2027 Convertible Notes” and, together with the 2024 Convertible Notes, the “Convertible Notes”). The 2027 Convertible Notes mature on December 1, 2027, unless earlier repurchased or redeemed by us or earlier converted in accordance with their terms prior to the maturity date.
The 2027 Convertible Notes are convertible by holders, subject to the conditions described within the indenture governing the 2027 Convertible Notes, into cash, shares of Carnival Corporation common stock, or a combination thereof, at our election. The 2027 Convertible Notes have an initial conversion rate of approximately 75 shares of Carnival Corporation common stock per $1,000 principal amount of notes, equivalent to an initial conversion price of approximately $13.39 per share of common stock. The initial conversion price of the 2027 Convertible Notes is subject to certain anti-dilutive adjustments and may also increase if such 2027 Convertible Notes are converted in connection with a tax redemption or certain corporate events as described within the indenture governing the 2027 Convertible Notes. Effective December 1, 2024, the 2027 Convertible Notes became convertible for the period beginning December 1, 2024 and ending February 28, 2025. Refer to Note 15 - “Supplemental Cash Flow Information” for additional detail on transactions related to the 2027 Convertible Notes.
We may redeem the 2027 Convertible Notes, in whole but not in part, at any time on or prior to the 40th scheduled trading day immediately before the maturity date at a redemption price equal to 100% of the principal amount thereof, plus accrued and unpaid interest to the redemption date, if we or any guarantor would have to pay any additional amounts on the 2027 Convertible Notes due to a change in tax laws, regulations or rulings or a change in the official application, administration or interpretation thereof.
On or after December 5, 2025 and on or before the 40th scheduled trading day immediately before the maturity date, we may redeem for cash all or part of the 2027 Convertible Notes, at our option, if the last reported sale price of Carnival Corporation’s common stock exceeds 130% of the conversion price then in effect for at least 20 trading days (whether or not consecutive), including the trading day immediately preceding the date on which we provide notice of redemption, during the 30 consecutive
trading day period ending on, and including, the trading day immediately preceding the date on which we provide notice of redemption. The redemption price will equal 100% of the principal amount of the 2027 Convertible Notes being redeemed, plus accrued and unpaid interest to, but excluding, the redemption date.
The net carrying value of the Convertible Notes was as follows:
| | | | | | | | | | | | | | |
| | November 30, |
| (in millions) | | 2024 | | 2023 |
| Principal | | $ | 1,131 | | | $ | 1,557 | |
| Less: Unamortized debt discount and debt issue costs | | (19) | | | (27) | |
| | $ | 1,112 | | | $ | 1,530 | |
The interest expense recognized related to the Convertible Notes was as follows:
| | | | | | | | | | | | | | | | | | | | |
| | November 30, |
| (in millions) | | 2024 | | 2023 | | 2022 |
| Contractual interest expense | | $ | 86 | | | $ | 91 | | | $ | 32 | |
| Amortization of debt discount and debt issue costs | | 8 | | | 9 | | | 29 | |
| | $ | 94 | | | $ | 100 | | | $ | 61 | |
As of November 30, 2024, the if-converted value above par was $1.0 billion on 84.5 million available shares for the 2027 Convertible Notes.
Collateral and Priority Pool
As of November 30, 2024, the net book value of our ships and ship improvements, excluding ships under construction, is $39.3 billion. Our secured debt is secured on a first-priority basis by certain collateral, which includes vessels and certain assets related to those vessels and material intellectual property (combined net book value of approximately $22.4 billion, including $20.8 billion related to vessels and certain assets related to those vessels) as of November 30, 2024 and certain other assets.
As of November 30, 2024, $8.0 billion in net book value of our ships and ship improvements relate to the priority pool vessels included in the priority pool of 12 unencumbered vessels (the “Senior Priority Notes Subject Vessels”) for our 2028 Senior Priority Notes and $2.8 billion in net book value of our ship and ship improvements relate to the priority pool vessels included in the priority pool of the three Revolving Facility Subject Vessels for our Revolving Facility. As of November 30, 2024, there was no change in the identity of the Senior Priority Notes Subject Vessels or the Revolving Facility Subject Vessels.
Covenant Compliance
As of November 30, 2024, our Revolving Facility, unsecured loans and export credit facilities contain certain covenants listed below:
•Maintain minimum interest coverage (adjusted EBITDA to consolidated net interest charges, as defined in the agreements) at a ratio of not less than 2.0 to 1.0 for each testing date occurring from November 30, 2024 until May 31, 2025, at a ratio of not less than 2.5 to 1.0 for the August 31, 2025 and November 30, 2025 testing dates, and at a ratio of not less than 3.0 to 1.0 for the February 28, 2026 testing date onwards and as applicable through their respective maturity dates
•For certain of our unsecured loans and export credit facilities, maintain minimum issued capital and consolidated reserves (as defined in the agreements) of $5.0 billion
•Limit our debt to capital (as defined in the agreements) percentage to a percentage not to exceed 65%
•Maintain minimum liquidity of $1.5 billion
•Adhere to certain restrictive covenants through August 2027 (subject to such covenants terminating if we reach an investment grade credit rating in accordance with the agreement governing the Revolving Facility)
•Limit the amounts of our secured assets as well as secured and other indebtedness
At November 30, 2024, we were in compliance with the applicable covenants under our debt agreements. Generally, if an event of default under any debt agreement occurs, then, pursuant to cross-default and/or cross-acceleration clauses therein, substantially all of our outstanding debt and derivative contract payables could become due, and our debt and derivative
contracts could be terminated. Any financial covenant amendment may lead to increased costs, increased interest rates, additional restrictive covenants and other available lender protections that would be applicable.
NOTE 6 – Contingencies
Litigation
We are routinely involved in legal proceedings, claims, disputes, regulatory matters and governmental inspections or investigations arising in the ordinary course of or incidental to our business. We have insurance coverage for certain of these claims and actions, or any settlement of these claims and actions, and historically the maximum amount of our liability, net of any insurance recoverables, has been limited to our self-insurance retention levels.
We record provisions in the consolidated financial statements for pending litigation when we determine that an unfavorable outcome is probable and the amount of the loss can be reasonably estimated.
Legal proceedings and government investigations are subject to inherent uncertainties, and unfavorable rulings or other events could occur. Unfavorable resolutions could involve substantial monetary damages. In addition, in matters for which conduct remedies are sought, unfavorable resolutions could include an injunction or other order prohibiting us from selling one or more products at all or in particular ways, precluding particular business practices or requiring other remedies. An unfavorable outcome might result in a material adverse impact on our business, results of operations, financial position or liquidity.
As previously disclosed, on May 2, 2019, the Havana Docks Corporation filed a lawsuit against Carnival Corporation in the U.S. District Court for the Southern District of Florida under Title III of the Cuban Liberty and Democratic Solidarity Act, also known as the Helms-Burton Act, alleging that Carnival Corporation “trafficked” in confiscated Cuban property when certain ships docked at certain ports in Cuba, and that this alleged “trafficking” entitles the plaintiffs to treble damages. On March 21, 2022, the court granted summary judgment in favor of Havana Docks Corporation as to liability. On December 30, 2022, the court entered judgment against Carnival Corporation in the amount of $110 million plus $4 million in fees and costs. We appealed. On October 22, 2024, the Court of Appeals for the 11th Circuit reversed the District Court’s judgment against us. The case will be remanded to the District Court for further proceedings in accordance with the decision. We believe the ultimate outcome of this matter will not have a material impact on our consolidated financial statements.
As of November 30, 2024, two purported class actions brought against us by former guests in the Federal Court in Australia and in Italy remain pending, as previously disclosed. These actions include claims based on a variety of theories, including negligence, gross negligence and failure to warn, physical injuries and severe emotional distress associated with being exposed to and/or contracting COVID-19 onboard our ships. On October 24, 2023, the court in the Australian matter held that we were liable for negligence and for breach of consumer protection warranties as it relates to the lead plaintiff. The court ruled that the lead plaintiff was not entitled to any pain and suffering or emotional distress damages on the negligence claim and awarded medical costs. In relation to the consumer protection warranties claim, the court found that distress and disappointment damages amounted to no more than the refund already provided to guests and therefore made no further award. Further proceedings will determine the applicability of this ruling to the remaining class participants. We continue to take actions to defend against the above claims. We believe the ultimate outcome of these matters will not have a material impact on our consolidated financial statements.
Regulatory or Governmental Inquiries and Investigations
We have been, and may continue to be, impacted by breaches in data security and lapses in data privacy, which occur from time to time. These can vary in scope and range from inadvertent events to malicious motivated attacks.
We have incurred legal and other costs in connection with cyber incidents that have impacted us. The penalties and settlements paid in connection with cyber incidents over the last three years were not material. While these incidents did not have a material adverse effect on our business, results of operations, financial position or liquidity, no assurances can be given about the future and we may be subject to future attacks, incidents or litigation that could have such a material adverse effect.
On March 14, 2022, the U.S. Department of Justice and the U.S. Environmental Protection Agency notified us of potential civil penalties and injunctive relief for alleged Clean Water Act violations by owned and operated vessels covered by the 2013 Vessel General Permit. We are working with these agencies to reach a resolution of this matter. We believe the ultimate outcome will not have a material impact on our consolidated financial statements.
Under the European Union Treaty, certain economic benefits that are provided under Italian law are subject to approval on a periodic basis by the European Commission, with the most recent approval granted through December 31, 2023. One of our
subsidiaries continues to receive and recognize these benefits. The Italian Government has requested approval for these benefits to continue to be applied after December 31, 2023. The timing of the European Commission’s decision is uncertain and could take more than a year. If the European Commission were to deny a portion or all of the benefits, the Italian Government may be required to retroactively disallow these benefits and seek reimbursement from us which would result in a reversal of the recognition of such benefits, which depending on the timing of resolution, could have a material impact on our consolidated financial statements.
Other Contingent Obligations
Some of the debt contracts we enter into include indemnification provisions obligating us to make payments to the counterparty if certain events occur. These contingencies generally relate to changes in taxes or changes in laws which increase the lender’s costs. There are no stated or notional amounts included in the indemnification clauses, and we are not able to estimate the maximum potential amount of future payments, if any, under these indemnification clauses.
We have agreements with a number of credit card processors that transact customer deposits related to our cruise vacations. Certain of these agreements allow the credit card processors to request, under certain circumstances, that we provide a capped reserve fund in cash. Although the agreements vary, these requirements may generally be satisfied either through a withheld percentage of customer payments or providing cash funds directly to the credit card processor.
As of November 30, 2024 we were not required to maintain any reserve funds or compensating deposits. As of November 30, 2023, we had $844 million in reserve funds and $158 million in compensating deposits we were required to maintain, which were included within other assets.
NOTE 7 – Ship Commitments
As of November 30, 2024, our new ship growth capital commitments were $0.9 billion, $0.4 billion, $1.3 billion, $1.3 billion, $1.5 billion and $3.2 billion for the years ending November 30, 2025, 2026, 2027, 2028, 2029 and thereafter.
NOTE 8 – Taxation
A summary of our principal taxes and exemptions in the jurisdictions where our significant operations are located is as follows:
U.S. Income Tax
We are primarily foreign corporations engaged in the business of operating cruise ships in international transportation. We also own and operate, among other businesses, the U.S. hotel and transportation business of Holland America Princess Alaska Tours through U.S. corporations.
Our North American cruise ship businesses and certain ship-owning subsidiaries are engaged in a trade or business within the U.S. Depending on its itinerary, any particular ship may generate income from sources within the U.S. We believe that our U.S. source income and the income of our ship-owning subsidiaries, to the extent derived from, or incidental to, the international operation of a ship or ships, is exempt from U.S. federal income and branch profit taxes.
Our domestic U.S. operations, principally the hotel and transportation business of Holland America Princess Alaska Tours, are subject to federal and state income taxation in the U.S.
In general, under Section 883 of the Internal Revenue Code, certain non-U.S. corporations (such as our North American cruise ship businesses) are not subject to U.S. federal income tax or branch profits tax on U.S. source income derived from, or incidental to, the international operation of a ship or ships. Applicable U.S. Treasury regulations provide in general that a foreign corporation will qualify for the benefits of Section 883 if, in relevant part, (i) the foreign country in which the foreign corporation is organized grants an equivalent exemption to corporations organized in the U.S. in respect of each category of shipping income for which an exemption is being claimed under Section 883 (an “equivalent exemption jurisdiction”) and (ii) the foreign corporation meets a defined publicly-traded corporation stock ownership test (the “publicly-traded test”). Subsidiaries of foreign corporations that are organized in an equivalent exemption jurisdiction and meet the publicly-traded test also benefit from Section 883. We believe that Panama is an equivalent exemption jurisdiction and that Carnival Corporation currently satisfies the publicly-traded test under the regulations. Accordingly, substantially all of Carnival Corporation’s income is exempt from U.S. federal income and branch profit taxes.
Regulations under Section 883 list certain activities that the Internal Revenue Service (“IRS”) does not consider to be incidental to the international operation of ships and, therefore, the income attributable to such activities, to the extent such income is U.S.
source, does not qualify for the Section 883 exemption. Among the activities identified as not incidental are income from the sale of air transportation, transfers, shore excursions and pre- and post-cruise land packages to the extent earned from sources within the U.S.
We believe that the U.S. source transportation income earned by Carnival plc and its subsidiaries qualifies for exemption from U.S. federal income tax under applicable bilateral U.S. income tax treaties.
Carnival Corporation, Carnival plc and certain subsidiaries are subject to various U.S. state income taxes generally imposed on each state’s portion of the U.S. source income subject to U.S. federal income taxes. However, the state of Alaska imposes an income tax on its allocated portion of the total income of our companies doing business in Alaska and certain of their subsidiaries.
UK and Australian Income Tax
Cunard, P&O Cruises (UK) and P&O Cruises (Australia) are divisions of Carnival plc and have elected to enter the UK tonnage tax regime under a rolling ten-year term and, accordingly, reapply every year. Companies to which the tonnage tax regime applies pay corporation taxes on profits calculated by reference to the net tonnage of qualifying ships. UK corporation tax is not chargeable under the normal UK tax rules on these brands’ relevant shipping income. Relevant shipping income includes income from the operation of qualifying ships and from shipping related activities.
For a company to be eligible for the regime, it must be subject to UK corporation tax and, among other matters, operate qualifying ships that are strategically and commercially managed in the UK. Companies within the UK tonnage tax regime are also subject to a seafarer training requirement.
Our UK non-shipping activities that do not qualify under the UK tonnage tax regime remain subject to normal UK corporation tax.
P&O Cruises (Australia) and all of the other cruise ships operated internationally by Carnival plc for the cruise segment of the Australian vacation region are exempt from Australian corporation tax by virtue of the UK/Australian income tax treaty.
Italian and German Income Tax
In December 2024, the European Commission formally approved the Italian tonnage tax rules for 10 years. In 2025, Costa and AIDA will elect to remain in the Italian tonnage tax regime through 2034. Companies to which the tonnage tax regime applies pay corporation taxes on shipping profits calculated by reference to the net tonnage of qualifying ships.
Our non-shipping activities that do not qualify under the Italian tonnage tax regime remain subject to normal Italian corporation tax.
Substantially all of AIDA’s earnings are exempt from German income taxes by virtue of the Germany/Italy income tax treaty.
Global Minimum Tax
The Organization for Economic Co-operation and Development (“OECD”) issued Model Rules for implementation of a 15% minimum tax for multinational enterprises as part of its initiative intended to address the tax challenges arising from globalization. Subject to certain requirements, the OECD Model Rules provide an exclusion for international shipping income.
The implementation of these rules will affect Carnival plc and its subsidiaries beginning in fiscal 2025 and Carnival Corporation and certain of its subsidiaries beginning in fiscal 2026. We expect Carnival plc and its subsidiaries will be eligible for the international shipping income exclusion based on their current structure. Carnival Corporation and certain of its subsidiaries intend to align into a single tax jurisdiction where the international shipping income for its North American brands is also expected to qualify for this exemption. As a result, we do not believe the application of these rules will have a material impact on our consolidated financial statements.
Other
In addition to or in place of income taxes, virtually all jurisdictions where our ships call impose taxes, fees and other charges based on guest counts, ship tonnage, passenger capacity or some other measure.
NOTE 9 – Shareholders’ Equity
Carnival Corporation’s Articles of Incorporation authorize its Boards of Directors, at its discretion, to issue up to 40.0 million shares of preferred stock. At November 30, 2024 and 2023, no Carnival Corporation preferred stock or Carnival plc preference shares had been issued.
Public Equity Offerings
In August 2022, we completed a public offering of 117.5 million shares of Carnival Corporation common stock at a price per share of $9.95, resulting in net proceeds of $1.2 billion.
Accumulated Other Comprehensive Income (Loss) | | | | | | | | | | | | | | | | | |
| |
| | November 30, |
| (in millions) | 2024 | | 2023 | | 2022 |
| Cumulative foreign currency translation adjustments, net | $ | (1,955) | | | $ | (1,952) | | | $ | (2,004) | |
| Unrecognized pension expenses | (45) | | | (34) | | | (31) | |
| | | | | |
| Net gains on cash flow derivative hedges and other | 26 | | | 48 | | | 53 | |
| $ | (1,975) | | | $ | (1,939) | | | $ | (1,982) | |
During 2024, 2023 and 2022, we had an immaterial amount of unrecognized pension expenses that were reclassified out of accumulated other comprehensive loss and were included within payroll and related expenses and selling and administrative expenses.
NOTE 10 – Fair Value Measurements, Derivative Instruments and Hedging Activities and Financial Risks
Fair Value Measurements
Fair value is defined as the amount that would be received for selling an asset or paid to transfer a liability in an orderly transaction between market participants at the measurement date and is measured using inputs in one of the following three categories:
•Level 1 measurements are based on unadjusted quoted prices in active markets for identical assets or liabilities that we have the ability to access. Valuation of these items does not entail a significant amount of judgment
•Level 2 measurements are based on quoted prices for similar assets or liabilities in active markets, quoted prices for identical or similar assets or liabilities in markets that are not active or market data other than quoted prices that are observable for the assets or liabilities
•Level 3 measurements are based on unobservable data that are supported by little or no market activity and are significant to the fair value of the assets or liabilities
Considerable judgment may be required in interpreting market data used to develop the estimates of fair value. Accordingly, certain estimates of fair value presented herein are not necessarily indicative of the amounts that could be realized in a current or future market exchange.
Financial Instruments that are not Measured at Fair Value on a Recurring Basis | | | | | | | | | | | | | | | | | | | | | | | | | | | | | | | | | | | | | | | | | | | | | | | |
| | November 30, 2024 | | November 30, 2023 |
| | Carrying
Value | | Fair Value | | Carrying
Value | | Fair Value |
| (in millions) | | Level 1 | | Level 2 | | Level 3 | | Level 1 | | Level 2 | | Level 3 |
| | | | | | | | | | | | | | | |
| | | | | | | | | | | | | | | |
| | | | | | | | | | | | | | | |
| Liabilities | | | | | | | | | | | | | | | |
| Fixed rate debt (a) | $ | 22,449 | | | $ | — | | | $ | 23,241 | | | $ | — | | | $ | 22,575 | | | $ | — | | | $ | 21,503 | | | $ | — | |
| Floating rate debt (a) | 5,764 | | | — | | | 5,685 | | | — | | | 8,764 | | | — | | | 8,225 | | | — | |
| Total | $ | 28,213 | | | $ | — | | | $ | 28,927 | | | $ | — | | | $ | 31,339 | | | $ | — | | | $ | 29,728 | | | $ | — | |
(a)The debt amounts above do not include the impact of interest rate swaps or debt issuance costs and discounts. The fair values of our publicly-traded notes were based on their unadjusted quoted market prices in markets that are not sufficiently active to be Level 1 and, accordingly, are considered Level 2. The fair values of our other debt were estimated based on current market interest rates being applied to this debt.
Financial Instruments that are Measured at Fair Value on a Recurring Basis | | | | | | | | | | | | | | | | | | | | | | | | | | | | | | | | | | | |
| | November 30, 2024 | | November 30, 2023 |
| (in millions) | Level 1 | | Level 2 | | Level 3 | | Level 1 | | Level 2 | | Level 3 |
| Assets | | | | | | | | | | | |
| Cash equivalents (a) | $ | 404 | | | $ | — | | | $ | — | | | $ | 1,021 | | | $ | — | | | $ | — | |
| | | | | | | | | | | |
| | | | | | | | | | | |
| Derivative financial instruments | — | | | 2 | | | — | | | — | | | 22 | | | — | |
| Total | $ | 404 | | | $ | 2 | | | $ | — | | | $ | 1,021 | | | $ | 22 | | | $ | — | |
| Liabilities | | | | | | | | | | | |
| Derivative financial instruments | $ | — | | | $ | 4 | | | $ | — | | | $ | — | | | $ | 28 | | | $ | — | |
| Total | $ | — | | | $ | 4 | | | $ | — | | | $ | — | | | $ | 28 | | | $ | — | |
(a)Consists of money market funds and cash investments with original maturities of less than 90 days.
Nonfinancial Instruments that are Measured at Fair Value on a Nonrecurring Basis
Valuation of Goodwill and Trademarks
As of July 31, 2024, we performed our annual goodwill and trademark impairment reviews and determined there was no impairment for goodwill or trademarks.
As of November 30, 2024 and November 30, 2023, goodwill for our NAA segment was $579 million.
| | | | | | | | | | | | | | | | | |
| Trademarks |
| (in millions) | NAA
Segment | | Europe Segment | | Total |
| At November 30, 2022 | $ | 927 | | | $ | 224 | | | $ | 1,151 | |
| Exchange movements | — | | | 14 | | | 14 | |
| At November 30, 2023 | 927 | | | 237 | | | 1,164 | |
| Exchange movements | — | | | (4) | | | (4) | |
| At November 30, 2024 | $ | 927 | | | $ | 234 | | | $ | 1,161 | |
Impairment of Ships
In 2022, we determined that two ships had net carrying values that exceeded their respective estimated undiscounted future cash flows. We then estimated the fair value of these ships, based on their estimated selling values, and recognized ship impairment charges of $428 million which are included in ship and other impairments in our Consolidated Statements of Income (Loss). On a segment level, we recognized $8 million for our NAA segment and $421 million for our Europe segment. The principal assumption used in determining the fair value of these ships were the estimated sales proceeds, which are considered a Level 3 input.
We believe we have made reasonable estimates and judgments as part of our assessments. A change in the principal judgments or estimates may result in a need to perform additional impairment reviews.
Refer to Note 2 - “Summary of Significant Accounting Policies, Preparation of Consolidated Financial Statements” for additional discussion.
Derivative Instruments and Hedging Activities | | | | | | | | | | | | | | | | | |
| | | | November 30, |
| (in millions) | Balance Sheet Location | | 2024 | | 2023 |
| Derivative assets | | | | | |
| Derivatives designated as hedging instruments | | | | | |
| | | | | |
| Interest rate swaps (a) | Prepaid expenses and other | | $ | 2 | | | $ | — | |
| Other assets | | — | | | 22 | |
| Derivatives not designated as hedging instruments | | | | | |
| Interest rate swaps (a) | Prepaid expenses and other | | — | | | 1 | |
| | | | | |
| Total derivative assets | | | $ | 2 | | | $ | 22 | |
| Derivative liabilities | | | | | |
| Derivatives designated as hedging instruments | | | | | |
| Cross currency swaps (b) | Other long-term liabilities | | $ | — | | | $ | 12 | |
| | | | | |
| | | | | |
| | | | | |
| Interest rate swaps (a) | Other long-term liabilities | | 4 | | | 16 | |
| Total derivative liabilities | | | $ | 4 | | | $ | 28 | |
(a)We have interest rate swaps whereby we receive floating interest rate payments in exchange for making fixed interest rate payments. These interest rate swap agreements effectively changed $11 million at November 30, 2024 and $46 million at November 30, 2023 of EURIBOR-based floating rate euro debt to fixed rate euro debt, and $1.0 billion at November 30, 2024 and $2.5 billion at November 30, 2023 of SOFR-based variable rate debt to fixed rate debt. In 2024, we terminated a portion of our SOFR-based interest rate swaps with a notional amount of $1.5 billion. As of November 30, 2024 and November 30, 2023, the EURIBOR-based interest rate swaps settle through 2025 and were not designated as cash flow hedges; the SOFR-based interest rate swaps settle through 2027 and were designated as cash flow hedges.
(b)At November 30, 2023, we had a cross currency swap with a notional amount of $670 million that was designated as a hedge of our net investment in foreign operations with euro-denominated functional currencies. This cross currency swap was terminated in 2024.
Our derivative contracts include rights of offset with our counterparties. As of November 30, 2024 and 2023, there was no netting for our derivative assets and liabilities. The amounts that were not offset in the balance sheet were not material.
The effect of our derivatives qualifying and designated as hedging instruments recognized in other comprehensive income (loss) and in net income (loss) was as follows: | | | | | | | | | | | | | | | | | |
| | November 30, |
| (in millions) | 2024 | | 2023 | | 2022 |
| Gains (losses) recognized in AOCI: | | | | | |
| Cross currency swaps – net investment hedges - included component | $ | — | | | $ | (4) | | | $ | 72 | |
| Cross currency swaps – net investment hedges - excluded component | $ | — | | | $ | (4) | | | $ | (26) | |
| | | | | |
| | | | | |
| Interest rate swaps – cash flow hedges | $ | 3 | | | $ | 32 | | | $ | 11 | |
| (Gains) losses reclassified from AOCI – cash flow hedges: | | | | | |
| Interest rate swaps – Interest expense, net of capitalized interest | $ | (25) | | | $ | (34) | | | $ | 2 | |
| Foreign currency zero cost collars - Depreciation and amortization | $ | (1) | | | $ | (2) | | | $ | (2) | |
| Gains (losses) recognized on derivative instruments (amount excluded from effectiveness testing – net investment hedges) | | | | | |
| Cross currency swaps – Interest expense, net of capitalized interest | $ | 2 | | | $ | 11 | | | $ | 5 | |
The amount of gains and losses on derivatives not designated as hedging instruments recognized in earnings during the year ended November 30, 2024 and estimated cash flow hedges’ unrealized gains and losses that are expected to be reclassified to earnings in the next twelve months are not material.
Financial Risks
Fuel Price Risks
We manage our exposure to fuel price risk by managing our consumption of fuel. Substantially all of our exposure to market risk for changes in fuel prices relates to the consumption of fuel on our ships. We manage fuel consumption through fleet optimization, energy efficiency, itinerary efficiency, and new technologies and alternative fuels.
Foreign Currency Exchange Rate Risks
Overall Strategy
We manage our exposure to fluctuations in foreign currency exchange rates through our normal operating and financing activities, including netting certain exposures to take advantage of any natural offsets and, when considered appropriate, through the use of derivative and non-derivative financial instruments. Our primary focus is to monitor our exposure to, and manage, the economic foreign currency exchange risks faced by our operations and realized if we exchange one currency for another. We consider hedging certain of our ship commitments and net investments in foreign operations. The financial impacts of our hedging instruments generally offset the changes in the underlying exposures being hedged.
Operational Currency Risks
Our operations primarily utilize the U.S. dollar, Euro, Sterling or the Australian dollar as their functional currencies. Our operations also have revenue and expenses denominated in non-functional currencies. Movements in foreign currency exchange rates affect our consolidated financial statements.
Investment Currency Risks
We consider our investments in foreign operations to be denominated in stable currencies and of a long-term nature. We have euro-denominated debt which provides an economic offset for our operations with euro functional currency. In addition, we have in the past and may in the future utilize derivative financial instruments, such as cross currency swaps, to manage our exposure to investment currency risks.
Newbuild Currency Risks
Our shipbuilding contracts are typically denominated in euros. At November 30, 2024, our newbuild currency exchange rate risk relates to euro-denominated newbuild contract payments for non-euro functional currency brands. The cost of shipbuilding orders that we may place in the future that are denominated in a different currency than our cruise brands’ functional currency will be affected by foreign currency exchange rate fluctuations. These foreign currency exchange rate fluctuations may affect our decision to order new cruise ships. We have in the past and may in the future utilize derivative financial instruments, such as foreign currency derivatives, to manage our exposure to newbuild currency risks. Our decisions to hedge non-functional currency ship commitments for our cruise brands are made on a case-by-case basis, considering the amount and duration of the exposure, market volatility, economic trends, our overall expected net cash flows by currency and other offsetting risks.
Interest Rate Risks
We manage our exposure to fluctuations in interest rates through our debt portfolio management and investment strategies. We evaluate our debt portfolio to determine whether to make periodic adjustments to the mix of fixed and floating rate debt through the use of interest rate swaps and the issuance of new debt.
Concentrations of Credit Risk
As part of our ongoing control procedures, we monitor concentrations of credit risk associated with financial and other institutions with which we conduct significant business. We seek to manage these credit risk exposures, including counterparty nonperformance primarily associated with our cash and cash equivalents, investments, notes receivables, reserve funds related to customer deposits (when required), future financing facilities, contingent obligations, derivative instruments, insurance contracts and new ship progress payment guarantees, by:
•Conducting business with well-established financial institutions, insurance companies and export credit agencies
•Diversifying our counterparties
•Having guidelines regarding credit ratings and investment maturities that we follow to help safeguard liquidity and minimize risk
•Generally requiring collateral and/or guarantees to support notes receivable on significant asset sales and new ship progress payments to shipyards
We also monitor the creditworthiness of travel agencies and tour operators in Australia and Europe and credit and debit card providers to which we extend credit in the normal course of our business. Our credit exposure also includes contingent obligations related to cash payments received directly by travel agents and tour operators for cash collected by them on cruise sales in Australia and most of Europe where we are obligated to honor our guests’ cruise payments made by them to their travel agents and tour operators regardless of whether we have received these payments.
Concentrations of credit risk associated with trade receivables and other receivables, charter-hire agreements and contingent obligations are not considered to be material, principally due to the large number of unrelated accounts, the nature of these contingent obligations and their short maturities. Normally, we have not required collateral or other security to support normal credit sales and have not experienced significant credit losses.
NOTE 11 – Leases
The components of expense were as follows:
| | | | | | | | | | | | | | | | | | | | |
| | November 30, |
| (in millions) | | 2024 | | 2023 | | 2022 |
| Operating lease expense | | $ | 215 | | | $ | 213 | | | $ | 192 | |
| Variable lease expense (a) (b) | | $ | 211 | | | $ | 116 | | | $ | (39) | |
(a)Variable lease expense represents costs associated with our multi-year preferential berthing agreements which vary based on the number of passengers. These costs are recorded within commissions, transportation and other in our Consolidated Statements of Income (Loss). Variable lease expense related to operating leases, other than the port facilities, were not material to our consolidated financial statements.
(b)Several of our preferential berthing agreements have force majeure provisions which were in effect during the pause in guest cruise operations due to COVID-19.
During 2024, 2023 and 2022, the cash outflow for leases was materially consistent with the lease expense recognized and short-term lease costs were not material.
Right-of-use assets obtained in exchange for new and amended operating lease liabilities was $247 million in 2024 and $108 million in 2023.
Weighted average of the remaining lease terms and weighted average discount rates are as follows:
| | | | | | | | | | | | | | |
| | November 30, 2024 | | November 30, 2023 |
| Weighted average remaining lease term - operating leases (in years) | | 12 | | 12 |
| Weighted average discount rate - operating leases | | 5.9 | % | | 5.9 | % |
As of November 30, 2024, maturities of operating lease liabilities were as follows:
| | | | | | | | |
(in millions) Year | | |
| 2025 | | $ | 228 | |
| 2026 | | 227 | |
| 2027 | | 213 | |
| 2028 | | 200 | |
| 2029 | | 147 | |
| Thereafter | | 931 | |
| Total lease payments | | 1,947 | |
| Less: Present value discount | | (545) | |
| Present value of lease liabilities | | $ | 1,402 | |
For time charter arrangements where we are the lessor and for transactions with cruise guests related to the use of cabins, we do not separate lease and non-lease components since (1) the lease on a standalone basis would be classified as an operating lease and (2) the timing and pattern of transfer for the lease component and associated non-lease component are the same. As the non-lease components are the predominant components in the agreements, we account for these transactions under the Revenue Recognition guidance.
NOTE 12 – Segment Information
The chief operating decision maker, who is the President, Chief Executive Officer and Chief Climate Officer of Carnival Corporation and Carnival plc assesses performance and makes decisions to allocate resources for Carnival Corporation & plc based upon review of the results across all of our segments. The operating segments within each of our reportable segments have been aggregated based on the similarity of their economic and other characteristics, including geographic guest sourcing. Our four reportable segments are comprised of (1) NAA cruise operations, (2) Europe cruise operations (“Europe”), (3) Cruise Support and (4) Tour and Other.
Our Cruise Support segment includes our portfolio of leading port destinations and exclusive islands as well as other services, all of which are operated for the benefit of our cruise brands. Our Tour and Other segment represents the hotel and transportation operations of Holland America Princess Alaska Tours and other operations.
| | | | | | | | | | | | | | | | | | | | | | | | | | | | | | | | | | | | | | | | | | |
| As of and for the years ended November 30, | |
| (in millions) | Revenues | | Operating expenses | | Selling and administrative | | Depreciation and amortization | | Operating income (loss) | | Capital expenditures | | Total assets | |
| 2024 | | | | | | | | | | | | | | |
| NAA | $ | 16,802 | | | $ | 10,555 | | | $ | 1,952 | | | $ | 1,664 | | | $ | 2,631 | | | $ | 3,943 | | | $ | 30,892 | | |
| Europe | 7,710 | | | 4,734 | | | 961 | | | 676 | | | 1,340 | | | 270 | | | 15,042 | | |
| Cruise Support | 255 | | | 156 | | | 320 | | | 193 | | | (414) | | | 382 | | | 2,732 | | |
| Tour and Other | 255 | | | 193 | | | 19 | | | 24 | | | 18 | | | 32 | | | 390 | | |
| $ | 25,021 | | | $ | 15,638 | | | $ | 3,252 | | | $ | 2,557 | | | $ | 3,574 | | | $ | 4,626 | | | $ | 49,057 | | |
| 2023 | | | | | | | | | | | | | | |
| NAA | $ | 14,588 | | | $ | 9,587 | | | $ | 1,753 | | | $ | 1,495 | | | $ | 1,752 | | | $ | 1,932 | | | $ | 28,547 | | |
| Europe | 6,535 | | | 4,398 | | | 876 | | | 668 | | | 593 | | | 1,161 | | | 16,524 | | |
| Cruise Support | 206 | | | 127 | | | 294 | | | 184 | | | (399) | | | 179 | | | 3,667 | | |
| Tour and Other | 265 | | | 205 | | | 27 | | | 23 | | | 11 | | | 12 | | | 382 | | |
| $ | 21,593 | | | $ | 14,317 | | | $ | 2,950 | | | $ | 2,370 | | | $ | 1,956 | | | $ | 3,284 | | | $ | 49,120 | | |
| 2022 | | | | | | | | | | | | | | |
| NAA | $ | 8,281 | | | $ | 7,526 | | | $ | 1,517 | | | $ | 1,408 | | | $ | (2,170) | | | $ | 2,568 | | | $ | 27,413 | | |
| Europe | 3,531 | | | 3,925 | | | 745 | | | 692 | | | (1,830) | | | 2,213 | | | 15,317 | | |
| Cruise Support | 171 | | | 120 | | | 225 | | | 140 | | | (315) | | | 155 | | | 8,461 | | |
| Tour and Other | 185 | | | 187 | | | 27 | | | 36 | | | (64) | | | 4 | | | 512 | | |
| $ | 12,168 | | | $ | 11,757 | | | $ | 2,515 | | | $ | 2,275 | | | $ | (4,379) | | | $ | 4,940 | | | $ | 51,703 | | |
Revenue by geographic areas, which are based on where our guests are sourced, were as follows: | | | | | | | | | | | | | | | | | |
| Years Ended November 30, |
| (in millions) | 2024 | | 2023 | | 2022 |
| North America | $ | 15,089 | | | $ | 13,112 | | | $ | 7,866 | |
| Europe | 7,573 | | | 6,565 | | | 3,918 | |
| Australia | 1,445 | | | 1,181 | | | 252 | |
| Other | 915 | | | 735 | | | 132 | |
| $ | 25,021 | | | $ | 21,593 | | | $ | 12,168 | |
Substantially all of our long-lived assets consist of our ships and move between geographic areas.
NOTE 13 – Compensation Plans and Post-Employment Benefits
Equity Plans
We issue our share-based compensation awards, which at November 30, 2024 included time-based share awards (restricted stock awards and restricted stock units) and performance-based share awards (restricted stock units) (collectively “equity awards”), under the Carnival Corporation and Carnival plc stock plans. Equity awards are principally granted to management level employees and members of our Boards of Directors. The plans are administered by the Compensation Committees which are made up of independent directors who determine which employees are eligible to participate, the monetary value or number of shares for which equity awards are to be granted and the amounts that may be exercised or sold within a specified term. We had an aggregate of 26.8 million shares available for future grant at November 30, 2024. We fulfill our equity award obligations using shares purchased in the open market or with unissued or treasury shares. Our equity awards generally vest over a three-year period, subject to earlier vesting under certain conditions. | | | | | | | | | | | |
| | Shares | | Weighted-Average
Grant Date Fair
Value |
| | | |
| | | |
| | | |
| | | |
| | | |
| | | |
| | | |
| | | |
| Outstanding at November 30, 2023 | 10,289,628 | | | $ | 11.45 | |
| Granted | 5,746,531 | | | $ | 15.29 | |
| Vested | (3,802,982) | | | $ | 13.91 | |
| Forfeited | (310,931) | | | $ | 12.71 | |
| Outstanding at November 30, 2024 | 11,922,246 | | | $ | 12.48 | |
As of November 30, 2024, there was $109 million of total unrecognized compensation cost related to equity awards, which is expected to be recognized over a weighted-average period of 1.6 years.
Single-employer Defined Benefit Pension Plans
We maintain several single-employer defined benefit pension plans, which cover certain shipboard and shoreside employees. The U.S. and UK shoreside employee plans are closed to new membership and are funded at or above the level required by U.S. or UK regulations. The remaining defined benefit plans are primarily unfunded. These plans provide pension benefits primarily based on employee compensation and years of service.
| | | | | | | | | | | | | | | | | | | | | | | | | | |
| | UK Plan (a) | | All Other Plans |
| (in millions) | | 2024 | | 2023 | | 2024 | | 2023 |
| Change in projected benefit obligation: | | | | | | | | |
| Projected benefit obligation as of December 1 | | $ | 181 | | | $ | 198 | | | $ | 226 | | | $ | 223 | |
| Past service cost | | 1 | | | 1 | | | 18 | | | 18 | |
| Interest cost | | 8 | | | 8 | | | 12 | | | 11 | |
| | | | | | | | |
| Benefits paid | | (7) | | | (6) | | | (17) | | | (20) | |
| Actuarial (gain) loss on plans’ liabilities | | (3) | | | (19) | | | 12 | | | (4) | |
| | | | | | | | |
| | | | | | | | |
| Plan curtailments, settlements and other | | — | | | — | | | (1) | | | (1) | |
| Administrative expenses | | (1) | | | (1) | | | — | | | — | |
| | | | | | | | |
| Exchange movements and other | | (21) | | | — | | | — | | | — | |
| Projected benefit obligation as of November 30 | | 159 | | | 181 | | | 250 | | | 226 | |
| | | | | | | | |
| Change in plan assets: | | | | | | | | |
| Fair value of plan assets as of December 1 | | 196 | | | 222 | | | 9 | | | 10 | |
| | | | | | | | |
| Return (loss) on plans’ assets | | 4 | | | (20) | | | 1 | | | — | |
| Employer contributions | | — | | | 1 | | | 17 | | | 20 | |
| | | | | | | | |
| Benefits paid | | (7) | | | (6) | | | (17) | | | (20) | |
| Plan settlements | | — | | | — | | | (1) | | | (1) | |
| Administrative expenses | | (1) | | | (1) | | | — | | | — | |
| | | | | | | | |
| Exchange movements and other | | (25) | | | — | | | — | | | — | |
| Fair value of plan assets as of November 30 | | 168 | | | 196 | | | 8 | | | 9 | |
| Funded status as of November 30 | | $ | 9 | | | $ | 15 | | | $ | (242) | | | $ | (218) | |
(a)The P&O Princess Cruises (UK) Pension Scheme (“UK Plan”)
The amounts recognized in the Consolidated Balance Sheets for these plans were as follows:
| | | | | | | | | | | | | | | | | | | | | | | | | | |
| | UK Plan | | All Other Plans |
| | November 30, | | November 30, |
| (in millions) | | 2024 | | 2023 | | 2024 | | 2023 |
| Other assets | | $ | 9 | | | $ | 15 | | | $ | — | | | $ | — | |
| Accrued liabilities and other | | $ | — | | | $ | — | | | $ | 32 | | | $ | 29 | |
| Other long-term liabilities | | $ | — | | | $ | — | | | $ | 210 | | | $ | 188 | |
The accumulated benefit obligation for all defined benefit pension plans was $244 million and $220 million at November 30, 2024 and 2023.
Amounts for pension plans with accumulated benefit obligations in excess of fair value of plan assets are as follows:
| | | | | | | | | | | | | | |
| | November 30, |
| (in millions) | | 2024 | | 2023 |
| Projected benefit obligation | | $ | 250 | | | $ | 226 | |
| Accumulated benefit obligation | | $ | 244 | | | $ | 220 | |
| Fair value of plan assets | | $ | 8 | | | $ | 9 | |
The net periodic pension cost recognized in the Consolidated Statements of Income (Loss) were as follows:
| | | | | | | | | | | | | | | | | | | | | | | | | | | | | | | | | | | | | | |
| | UK Plan | | All Other Plans |
| | November 30, | | November 30, |
| (in millions) | | 2024 | | 2023 | | 2022 | | 2024 | | 2023 | | 2022 |
| Service cost | | $ | 1 | | | $ | 1 | | | $ | — | | | $ | 18 | | | $ | 18 | | | $ | 18 | |
| Interest cost | | 8 | | | 8 | | | 5 | | | 12 | | | 11 | | | 5 | |
| Expected return on plan assets | | (9) | | | (8) | | | (6) | | | — | | | — | | | — | |
| | | | | | | | | | | | |
| Amortization of net loss (gain) | | 2 | | | — | | | — | | | — | | | — | | | 3 | |
| Settlement loss recognized | | — | | | — | | | — | | | — | | | 1 | | | 1 | |
| Net periodic pension cost (income) | | $ | 2 | | | $ | 1 | | | $ | (1) | | | $ | 31 | | | $ | 30 | | | $ | 26 | |
The components of net periodic pension cost other than the service cost component are included in other income (expense), net in the Consolidated Statements of Income (Loss).
Weighted average assumptions used to determine the projected benefit obligation are as follows: | | | | | | | | | | | | | | | | | | | | | | | | | | |
| | UK Plan | | All Other Plans |
| | 2024 | | 2023 | | 2024 | | 2023 |
| Discount rate | | 5.2 | % | | 5.2 | % | | 5.2 | % | | 5.7 | % |
| Rate of compensation increase | | 2.9 | % | | 2.9 | % | | 3.0 | % | | 3.0 | % |
Weighted average assumptions used to determine net pension income are as follows:
| | | | | | | | | | | | | | | | | | | | | | | | | | | | | | | | | | | | | | |
| | UK Plan | | All Other Plans |
| | 2024 | | 2023 | | 2022 | | 2024 | | 2023 | | 2022 |
| Discount rate | | 5.2 | % | | 4.3 | % | | 1.6 | % | | 5.6 | % | | 5.4 | % | | 3.2 | % |
| Expected return on assets | | 5.6 | % | | 4.3 | % | | — | % | | 6.0 | % | | 3.5 | % | | 2.3 | % |
| Rate of compensation increase | | 2.9 | % | | 2.9 | % | | 2.7 | % | | 3.0 | % | | 3.0 | % | | 3.0 | % |
The discount rate used to determine the UK Plan’s projected benefit obligation was determined as the single equivalent rate based on applying a yield curve determined from AA credit rated bonds at the balance sheet date to the cash flows making up the pension plan’s obligations. The discount rate used to determine the UK Plan’s future net periodic pension cost was determined as the equivalent rate based on applying each individual spot rate from a yield curve determined from AA credit rated bonds at the balance sheet date for each year’s cash flow. The UK Plan’s expected long-term return on plan assets is consistent with the long-term investment return target provided to the UK Plan’s fiduciary manager (UK government fixed interest bonds (gilts)) plus 1.0% and was 5.7% per annum as of November 30, 2024.
Amounts recognized in AOCI are as follows:
| | | | | | | | | | | | | | | | | | | | | | | | | | |
| | UK Plan | | All Other Plans |
| | November 30, | | November 30, |
| | 2024 | | 2023 | | 2024 | | 2023 |
| Actuarial losses (gains) recognized in the current year | | $ | 2 | | | $ | 9 | | | $ | 12 | | | $ | (4) | |
| Amortization and settlements included in net periodic pension cost | | $ | (2) | | | $ | (1) | | | $ | (1) | | | $ | (1) | |
| | | | | | | | |
We anticipate making contributions of $33 million to the plans during 2025. Estimated future benefit payments to be made during each of the next five fiscal years and in the aggregate during the succeeding five fiscal years are as follows:
| | | | | | | | | | | | | | |
| (in millions) | | UK Plan | | All Other Plans |
| 2025 | | $ | 7 | | | $ | 33 | |
| 2026 | | 7 | | | 30 | |
| 2027 | | 7 | | | 29 | |
| 2028 | | 8 | | | 31 | |
| 2029 | | 8 | | | 30 | |
| 2030-2034 | | 50 | | | 146 | |
| | $ | 88 | | | $ | 298 | |
Our investment strategy for our pension plan assets is to maintain a diversified portfolio of asset classes to produce a sufficient level of diversification and investment return over the long term. The investment policy for each plan specifies the type of investment vehicles appropriate for the plan, asset allocation guidelines, criteria for selection of investment managers and procedures to monitor overall investment performance, as well as investment manager performance. As of November 30, 2024 and 2023, the All Other Plans were unfunded.
The fair values of the plan assets of the UK Plan by investment class are as follows:
| | | | | | | | | | | | | | |
| | November 30, |
| | 2024 | | 2023 |
| Equities | | $ | 11 | | | $ | 47 | |
| UK government fixed interest bonds (gilts) | | 157 | | | 149 | |
| | $ | 168 | | | $ | 196 | |
Multiemployer Defined Benefit Pension Plans
We participate in two multiemployer defined benefit pension plans in the UK, the British Merchant Navy Officers Pension Fund (registration number 10005645) (“MNOPF”), which is divided into two sections, the “Old Section” and the “New Section,” and the British Merchant Navy Ratings Pension Fund (registration number 10005646) (“MNRPF”). Collectively, we refer to these as “the multiemployer plans.” The multiemployer plans are maintained for the benefit of the employees of the participating employers who make contributions to the plans. The risks of participating in these multiemployer plans are different from single-employer plans, including:
•Contributions made by employers, including us, may be used to provide benefits to employees of other participating employers
•If any of the participating employers were to withdraw from the multiemployer plans or fail to make their required contributions, any unfunded obligations would be the responsibility of the remaining participating employers.
We are contractually obligated to make all required contributions as determined by the plans’ trustees. All of our multiemployer plans are closed to new membership and future benefit accrual.
The MNOPF Old Section is fully funded and covered by a third-party insurer, with no further funding obligations.
We expense our portion of the MNOPF New Section deficit as amounts are invoiced by, and become due and payable to, the trustees. Based on the most recent triennial valuation at March 31, 2024 of the MNOPF New Section, it was determined that this plan was 100% funded. In 2024, 2023 and 2022, our contributions to the MNOPF New Section did not exceed 5% of total contributions to the fund.
We accrue and expense our portion of the MNRPF deficit based on our estimated probable obligation from the most recent actuarial review. Based on the most recent triennial valuation at March 31, 2023 of the MNRPF, it was determined that this plan was 85% funded. Our share of the deficit of $3 million was paid in 2024. In 2024, 2023 and 2022, our contributions to the MNRPF did not exceed 5% of total contributions to the fund.
Total expense (benefit) for the multiemployer plans was $(19) million in 2024, $1 million in 2023 and $2 million in 2022.
Defined Contribution Plans
We have several defined contribution plans available to most of our employees. We contribute to these plans based on employee contributions, salary levels and length of service. Total expense for these plans was $47 million in 2024, $48 million in 2023 and $40 million in 2022.
NOTE 14 – Earnings Per Share | | | | | | | | | | | | | | | | | |
| | Years Ended November 30, |
| (in millions, except per share data) | 2024 | | 2023 | | 2022 |
| Net income (loss) | $ | 1,916 | | | $ | (74) | | | $ | (6,093) | |
| Interest expense on dilutive Convertible Notes | 94 | | | — | | | — | |
| Net income (loss) for diluted earnings per share | $ | 2,009 | | | $ | (74) | | | $ | (6,093) | |
| | | | | |
| Weighted-average shares outstanding | 1,274 | | | 1,262 | | | 1,180 | |
| Dilutive effect of equity awards | 5 | | | — | | | — | |
| Dilutive effect of Convertible Notes | 119 | | | — | | | — | |
| Diluted weighted-average shares outstanding | 1,398 | | | 1,262 | | | 1,180 | |
| | | | | |
| Basic earnings per share | $ | 1.50 | | | $ | (0.06) | | | $ | (5.16) | |
| Diluted earnings per share | $ | 1.44 | | | $ | (0.06) | | | $ | (5.16) | |
| | | | | |
Antidilutive shares excluded from diluted earnings per share computations were as follows:
| | | | | | | | | | | | | | | | | |
| November 30, |
| (in millions) | 2024 | | 2023 | | 2022 |
| Equity awards | — | | | 4 | | | 1 | |
| Convertible Notes | — | | | 130 | | | 55 | |
| Total antidilutive securities | — | | | 134 | | | 56 | |
NOTE 15 – Supplemental Cash Flow Information | | | | | | | | | | | | | | | | | |
| November 30, |
| (in millions) | 2024 | | 2023 | | 2022 |
| Cash and cash equivalents (Consolidated Balance Sheets) | $ | 1,210 | | | $ | 2,415 | | | $ | 4,029 | |
| | | | | |
| Restricted cash (a) | 21 | | | 21 | | | 2,008 | |
| Total cash, cash equivalents and restricted cash (Consolidated Statements of Cash Flows) | $ | 1,231 | | | $ | 2,436 | | | $ | 6,037 | |
(a)Substantially all restricted cash as of November 30, 2022 related to the net proceeds from the issuance of our 2028 Senior Priority Notes. The contractual restrictions on these proceeds were satisfied in December 2022 at which time these amounts became unrestricted.
Cash paid for interest, net of capitalized interest, was $1.6 billion in 2024, $2.0 billion in 2023 and $1.4 billion in 2022. Cash benefit received (paid) for income taxes, net was not material in 2024, 2023 and 2022. Non-cash purchases of property and equipment included in accrued liabilities and other were $392 million in 2024, $307 million in 2023 and $100 million in 2022.
In August 2022, we issued $339 million aggregate principal amount of 2024 Convertible Notes pursuant to privately-negotiated non-cash exchange agreements with certain holders of the 2023 Convertible Notes, pursuant to which such holders agreed to exchange their 2023 Convertible Notes for an equal amount of 2024 Convertible Notes. In November 2022, we issued an additional $87 million aggregate principal amount of the 2024 Convertible Notes pursuant to privately-negotiated non-cash exchange agreements with certain holders of the 2023 Convertible Notes, pursuant to which such holders agreed to exchange their 2023 Convertible Notes for an equal amount of additional 2024 Convertible Notes. In September 2024, substantially all of the 2024 Convertible Notes were converted to shares of common stock.
Refer to Note 5 - “Debt” for additional detail relating to our 2028 Senior Priority Notes and the 2024 Convertible Notes.
For the years ended November 30, 2024, 2023 and 2022, we did not have borrowings or repayments of commercial paper with original maturities greater than three months.
REPORT OF INDEPENDENT REGISTERED PUBLIC ACCOUNTING FIRM
To the Boards of Directors and Shareholders of Carnival Corporation and Carnival plc
Opinions on the Financial Statements and Internal Control over Financial Reporting
We have audited the accompanying consolidated balance sheet of Carnival Corporation & plc (comprising Carnival Corporation and Carnival plc and their respective subsidiaries, the “Company”) as of November 30, 2024, the related consolidated statements of income (loss), comprehensive income (loss), shareholders’ equity, and cash flows, for the year ended November 30, 2024, and the related notes (collectively referred to as the “financial statements”). We also have audited the Company’s internal control over financial reporting as of November 30, 2024, based on criteria established in Internal Control — Integrated Framework (2013) issued by the Committee of Sponsoring Organizations of the Treadway Commission (COSO).
In our opinion, the financial statements referred to above present fairly, in all material respects, the financial position of the Company as of November 30, 2024, and the results of its operations and its cash flows for the year ended November 30, 2024, in conformity with accounting principles generally accepted in the United States. Also, in our opinion, the Company maintained, in all material respects, effective internal control over financial reporting as of November 30, 2024, based on criteria established in Internal Control — Integrated Framework (2013) issued by COSO.
Basis for Opinions
The Company’s management is responsible for these financial statements, for maintaining effective internal control over financial reporting, and for its assessment of the effectiveness of internal control over financial reporting, included in the accompanying Management’s Annual Report on Internal Control over Financial Reporting. Our responsibility is to express an opinion on these financial statements and an opinion on the Company’s internal control over financial reporting based on our audits. We are a public accounting firm registered with the Public Company Accounting Oversight Board (United States) (PCAOB) and are required to be independent with respect to the Company in accordance with the U.S. federal securities laws and the applicable rules and regulations of the Securities and Exchange Commission and the PCAOB.
We conducted our audits in accordance with the standards of the PCAOB. Those standards require that we plan and perform the audits to obtain reasonable assurance about whether the financial statements are free of material misstatement, whether due to error or fraud, and whether effective internal control over financial reporting was maintained in all material respects.
Our audit of the financial statements included performing procedures to assess the risks of material misstatement of the financial statements, whether due to error or fraud, and performing procedures to respond to those risks. Such procedures included examining, on a test basis, evidence regarding the amounts and disclosures in the financial statements. Our audit also included evaluating the accounting principles used and significant estimates made by management, as well as evaluating the overall presentation of the financial statements. Our audit of internal control over financial reporting included obtaining an understanding of internal control over financial reporting, assessing the risk that a material weakness exists, and testing and evaluating the design and operating effectiveness of internal control based on the assessed risk. Our audits also included performing such other procedures as we considered necessary in the circumstances. We believe that our audits provide a reasonable basis for our opinions.
Definition and Limitations of Internal Control over Financial Reporting
A company’s internal control over financial reporting is a process designed to provide reasonable assurance regarding the reliability of financial reporting and the preparation of financial statements for external purposes in accordance with generally accepted accounting principles. A company’s internal control over financial reporting includes those policies and procedures that (1) pertain to the maintenance of records that, in reasonable detail, accurately and fairly reflect the transactions and dispositions of the assets of the company; (2) provide reasonable assurance that transactions are recorded as necessary to permit preparation of financial statements in accordance with generally accepted accounting principles, and that receipts and expenditures of the company are being made only in accordance with authorizations of management and directors of the company; and (3) provide reasonable assurance regarding prevention or timely detection of unauthorized acquisition, use, or disposition of the company’s assets that could have a material effect on the financial statements.
Because of its inherent limitations, internal control over financial reporting may not prevent or detect misstatements. Also, projections of any evaluation of effectiveness to future periods are subject to the risk that controls may become inadequate because of changes in conditions, or that the degree of compliance with the policies or procedures may deteriorate.
Critical Audit Matter
The critical audit matter communicated below is a matter arising from the current-period audit of the financial statements that was communicated or required to be communicated to the audit committee and that (1) relates to accounts or disclosures that
are material to the financial statements and (2) involved our especially challenging, subjective, or complex judgments. The communication of critical audit matters does not alter in any way our opinion on the financial statements, taken as a whole, and we are not, by communicating the critical audit matter below, providing a separate opinion on the critical audit matter or on the accounts or disclosures to which it relates.
Debt – Refer to Notes 2 and 5 to the Financial Statements
Critical Audit Matter Description
The Company has current and long-term debt of $1.5 billion and $25.9 billion, respectively, as of November 30, 2024. Debt is recorded at initial fair value, which normally reflects the proceeds received by the Company, net of debt issuance costs. Debt is subsequently stated at amortized cost. Debt issuance costs, discounts and premiums are generally amortized to interest expense using the straight-line method, which approximates the effective interest method, over the term of the debt. Debt issuance costs related to a recognized debt liability are presented as a direct deduction of the carrying amount of that debt, consistent with debt discounts. Debt issuance costs related to the Company’s revolving facility and export credit facilities not yet drawn are deferred and recorded as an asset. Debt issuance costs paid to lenders related to a recognized debt liability are netted against the proceeds from the related debt while debt issuance costs paid to third parties, or related to undrawn credit facilities, are presented separately within financing activities. Debt instruments are also evaluated by the Company for the existence of features that must be separated and accounted for as a derivative. During the year ended November 30, 2024, the Company entered into various debt transactions that involved issuance of new debt, modification and extinguishment of existing debt, and refinancing of existing syndicated debt.
We identified the accounting for debt and the related debt transactions, as a critical audit matter because of the complexity involved in (i) evaluating the accounting for the refinanced debt including whether such refinancing transactions resulted in a debt modification or extinguishment and the associated impact on debt issuance costs, (ii) evaluating the appropriate statement of cash flows presentation for a debt transaction that involved a syndicated loan with multiple lenders, and (iii) evaluating the existence of and accounting for features embedded in new or amended debt agreements that must be separated and accounted for as a derivative. This required an increased extent of effort due to the potential magnitude and complexity of the debt transactions, including the assistance of our professionals with specialized knowledge and skills in the relevant technical accounting guidance required when performing audit procedures to address these matters.
How the Critical Audit Matter Was Addressed in the Audit
Our audit procedures related to the accounting for debt and related debt transactions included the following, among others:
•We tested the effectiveness of controls over debt including those over the application of relevant technical accounting guidance to complex and significant debt transactions.
•We evaluated and tested management’s debt modification or extinguishment analysis by:
◦Testing the accuracy and completeness, including mathematical accuracy, of management’s analysis.
◦Evaluating management’s analysis over whether the debt transactions met the conditions to be treated as a debt modification or extinguishment by evaluating it against the relevant technical accounting guidance.
•We evaluated and tested management’s analysis of the cash receipts and repayment amounts, on a lender-by-lender basis, related to the refinancing of existing syndicated debt to assess the appropriateness of such amounts in the statement of cash flows presentation by:
◦Reading the terms of the debt agreements related to the syndicated loan with multiple lenders.
◦Testing the completeness and accuracy, including mathematical accuracy, of the Company’s lender-by-lender analysis.
◦Evaluating management’s analysis over whether the cash receipts and repayment amounts, on a lender-by-lender basis, met the conditions to be accounted for as a debt modification or extinguishment.
◦Utilizing the assistance of our professionals with specialized knowledge and skills in the relevant technical accounting guidance we evaluated the Company’s conclusion regarding the appropriate statement of cash flows presentation.
•We evaluated the conclusions reached by management on its analysis of the terms in the new, amended and refinanced debt agreements to evaluate the existence of features in the new or amended debt agreements that must be separated and accounted for as a derivative by:
◦Reading the terms for a selection of debt agreements to evaluate the existence of features in the new or amended debt agreements that must be separated and accounted for as a derivative.
◦Evaluating management’s analysis identifying the existence of and accounting for the features in the new, amended and refinanced debt agreements that must be separated and accounted for as a derivative by evaluating it against the relevant technical accounting guidance.
/s/ Deloitte & Touche LLP
Miami, Florida
January 27, 2025
We have served as the Company’s auditor since fiscal 2024.
Report of Independent Registered Public Accounting Firm
To the Boards of Directors and Shareholders of Carnival Corporation and Carnival plc
Opinion on the Financial Statements
We have audited the accompanying consolidated balance sheet of Carnival Corporation & plc (comprising Carnival Corporation and Carnival plc and their respective subsidiaries, the “Company”) as of November 30, 2023, and the related consolidated statements of income (loss), of comprehensive income (loss), of shareholders’ equity and of cash flows for each of the two years in the period ended November 30, 2023, including the related notes (collectively referred to as the “consolidated financial statements”). In our opinion, the consolidated financial statements present fairly, in all material respects, the financial position of the Company as of November 30, 2023, and the results of its operations and its cash flows for each of the two years in the period ended November 30, 2023 in conformity with accounting principles generally accepted in the United States of America.
Change in Accounting Principle
As discussed in Note 2 to the consolidated financial statements, the Company changed the manner in which it accounts for convertible instruments in 2023.
Basis for Opinion
These consolidated financial statements are the responsibility of the Company's management. Our responsibility is to express an opinion on the Company’s consolidated financial statements based on our audits. We are a public accounting firm registered with the Public Company Accounting Oversight Board (United States) (PCAOB) and are required to be independent with respect to the Company in accordance with the U.S. federal securities laws and the applicable rules and regulations of the Securities and Exchange Commission and the PCAOB.
We conducted our audits of these consolidated financial statements in accordance with the standards of the PCAOB. Those standards require that we plan and perform the audits to obtain reasonable assurance about whether the consolidated financial statements are free of material misstatement, whether due to error or fraud.
Our audits included performing procedures to assess the risks of material misstatement of the consolidated financial statements, whether due to error or fraud, and performing procedures that respond to those risks. Such procedures included examining, on a test basis, evidence regarding the amounts and disclosures in the consolidated financial statements. Our audits also included evaluating the accounting principles used and significant estimates made by management, as well as evaluating the overall presentation of the consolidated financial statements. We believe that our audits provide a reasonable basis for our opinion.
/s/ PricewaterhouseCoopers LLP
Miami, Florida
January 26, 2024
We served as the Company's auditor from 2003 to 2024. Prior to that, we served as Carnival Corporation’s auditor since at least 1986. We were not able to determine the specific year we began serving as auditor of Carnival Corporation.
Item 9. Changes in and Disagreements with Accountants on Accounting and Financial Disclosure.
None.
Item 9A. Controls and Procedures.
A. Evaluation of Disclosure Controls and Procedures
Disclosure controls and procedures are designed to provide reasonable assurance that information required to be disclosed by us in the reports that we file or submit under the Securities Exchange Act of 1934, is recorded, processed, summarized and reported within the time periods specified in the U.S. Securities and Exchange Commission’s rules and forms. Disclosure controls and procedures include, without limitation, controls and procedures designed to ensure that information required to be disclosed by us in our reports that we file or submit under the Securities Exchange Act of 1934 is accumulated and communicated to our management, including our principal executive and principal financial officers, or persons performing similar functions, as appropriate, to allow timely decisions regarding required disclosure.
Our President, Chief Executive Officer and Chief Climate Officer and our Chief Financial Officer and Chief Accounting Officer have evaluated our disclosure controls and procedures and have concluded, as of November 30, 2024, that they are effective as described above.
B. Management’s Annual Report on Internal Control over Financial Reporting
Our management is responsible for establishing and maintaining adequate internal control over financial reporting, as such term is defined in the Securities Exchange Act of 1934 Rule 13a-15(f). Our management, with the participation of our President, Chief Executive Officer and Chief Climate Officer and our Chief Financial Officer and Chief Accounting Officer, conducted an evaluation of the effectiveness of our internal control over financial reporting based on the 2013 Internal Control – Integrated Framework (the “COSO Framework”). Based on this evaluation under the COSO Framework, our management concluded that our internal control over financial reporting was effective as of November 30, 2024.
Deloitte & Touche LLP, the independent registered public accounting firm that audited our consolidated financial statements incorporated in this Form 10-K, has also audited the effectiveness of our internal control over financial reporting as of November 30, 2024 as stated in their report, which is shown in Part II, Item 8. Financial Statements and Supplementary Data, in this Form 10-K.
C. Changes in Internal Control over Financial Reporting
There have been no changes in our internal control over financial reporting during the quarter ended November 30, 2024 that have materially affected or are reasonably likely to materially affect our internal control over financial reporting.
Item 9B. Other Information.
Trading Plans
During the quarter ended November 30, 2024, no director or Section 16 officer adopted or terminated any Rule 10b5-1 trading arrangements or non-Rule 10b5-1 trading arrangements (in each case, as defined in Item 408(a) of Regulation S-K).
Item 9C. Disclosure Regarding Foreign Jurisdictions that Prevent Inspections.
None.
PART III
Item 10. Directors, Executive Officers and Corporate Governance.
Directors
Information regarding our directors, as required by Item 10, is incorporated herein by reference from the Carnival Corporation and Carnival plc joint definitive Proxy Statement to be filed with the U.S. Securities and Exchange Commission not later than 120 days after the close of the 2024 fiscal year.
Information About Our Executive Officers
The table below sets forth the name, age, years of service and title of each of our executive officers as of January 27, 2025. Titles listed relate to positions within Carnival Corporation and Carnival plc unless otherwise noted. | | | | | | | | | | | | | | | | | |
|
Age | | Years of Service (a) | | Title |
| Micky Arison | 75 | | 53 | | Chair of the Boards of Directors |
| David Bernstein | 67 | | 26 | | Chief Financial Officer and Chief Accounting Officer |
| Vice Admiral William R. Burke (Ret.) (b) | 68 | | 11 | | Chief Maritime Officer |
| Bettina Deynes | 52 | | 6 | | Global Chief Human Resources Officer |
| Lars Ljoen (b) | 55 | | 9 | | Chief Operations Officer of Carnival Cruise Line |
| Enrique Miguez | 60 | | 27 | | General Counsel |
| Josh Weinstein | 50 | | 22 | | President, Chief Executive Officer and Chief Climate Officer |
(a)Years of service with us or Carnival plc predecessor companies.
(b)Effective February 1, 2025, Vice Admiral William R. Burke (Ret.) will step down from his role and Lars Ljoen will become an executive officer and assume the role of Chief Maritime Officer.
Business Experience of Executive Officers
Micky Arison has been Chair of the Boards of Directors since 1990 and a Director since 1987. He was Chief Executive Officer from 1979 to 2013.
David Bernstein has been Chief Financial Officer since 2007 and Chief Accounting Officer since 2016.
William R. Burke, retired Vice Admiral, has been Chief Maritime Officer since 2013.
Bettina Deynes has been Global Chief Human Resources Officer since 2022 and she was Chief Human Resources Officer of Carnival Cruise Line from 2019 to 2022.
Lars Ljoen has been appointed as our Chief Maritime Officer effective February 1, 2025. He was Chief Operations Officer for Carnival Cruise Line from 2022 to January 2025 and Executive Vice President, Maritime of Carnival Cruise Line from 2018 to 2022.
Enrique Miguez has been General Counsel since 2021. He was Vice President and Deputy General Counsel from 2003 to 2021.
Josh Weinstein has been President, Chief Executive Officer and Chief Climate Officer since 2022. He was Chief Operations Officer from 2020 to 2022, President of Carnival UK from 2017 to 2022 and Treasurer from 2007 to 2017.
Corporate Governance
Our Code of Business Conduct and Ethics applies to all our team members and our Boards of Directors and states our commitment to conduct business ethically, without the influence of bribes or acts of corruption. We are committed to complying with the laws prohibiting bribery and other corrupt practices that apply everywhere we operate. Additionally, we provide trainings on anti-corruption laws and regulations and how to identify bribery to our team members. This Code of Business Conduct and Ethics is posted on our website, which is located at www.carnivalcorp.com and www.carnivalplc.com. We intend to satisfy the disclosure requirement under Item 5.05 of the Form 8-K regarding any amendments to, or waivers from, provisions of this Code of Business Conduct and Ethics by posting such information on our website, at the addresses specified above.
The additional information required by Item 10 is incorporated herein by reference from the Carnival Corporation and Carnival plc joint definitive Proxy Statement to be filed with the U.S. Securities and Exchange Commission not later than 120 days after the close of the 2024 fiscal year.
Item 11. Executive Compensation.
The information required by Item 11 is incorporated herein by reference from the Carnival Corporation and Carnival plc joint definitive Proxy Statement to be filed with the U.S. Securities and Exchange Commission not later than 120 days after the close of the 2024 fiscal year.
Item 12. Security Ownership of Certain Beneficial Owners and Management and Related Stockholder Matters.
A. Securities Authorized for Issuance under Equity Compensation Plans
I. Carnival Corporation
Set forth below is a table that summarizes compensation plans (including individual compensation arrangements) under which Carnival Corporation equity securities are authorized for issuance as of November 30, 2024. | | | | | | | | | | | | | | | | | | | | | | | |
| Plan category | | Number of securities to be issued upon exercise of warrants and rights
(in millions) | | Weighted-average exercise price of outstanding warrants and rights | | Number of securities remaining available for future issuance under equity compensation plans (excluding securities reflected in column (1))
(in millions) | |
| | (1) | | | | | |
| Equity compensation plans approved by security holders | | 9.2 | (a) | — | | | 24.7 | (b) |
| Equity compensation plans not approved by security holders | | — | | | — | | | — | | |
| | 9.2 | | — | | | 24.7 | |
(a)Represents 9.2 million of restricted share units outstanding under the Carnival Corporation 2020 Stock Plan.
(b)Includes Carnival Corporation common stock available for issuance as of November 30, 2024 as follows: 0.6 million under the Carnival Corporation Employee Stock Purchase Plan, which includes 118,406 subject to purchase during the current purchase period and 24.1 million under the Carnival Corporation 2020 Stock Plan.
II. Carnival plc
Set forth below is a table that summarizes compensation plans (including individual compensation arrangements) under which Carnival plc equity securities are authorized for issuance as of November 30, 2024. | | | | | | | | | | | | | | | | | | | | |
Plan category | | Number of securities to be issued upon exercise of warrants and rights
(in millions) | | Weighted-average exercise price of outstanding warrants and rights | | Number of securities remaining available for future issuance under equity compensation plans (excluding securities reflected in column (1))
(in millions) |
| | (1) | | | | |
| Equity compensation plans approved by security holders | | 2.3 | (a) | — | | | 11.7 |
| Equity compensation plans not approved by security holders | | — | | | — | | | — | |
| | 2.3 | | — | | | 11.7 |
(a)Represents 2.3 million restricted share units outstanding under the Carnival plc 2014 Employee Share Plan.
The additional information required by Item 12 is incorporated herein by reference to the Carnival Corporation and Carnival plc joint definitive Proxy Statement to be filed with the U.S. Securities and Exchange Commission not later than 120 days after the close of the 2024 fiscal year.
Items 13 and 14. Certain Relationships and Related Transactions, and Director Independence and Principal Accountant Fees and Services.
The information required by Items 13 and 14 is incorporated herein by reference from the Carnival Corporation and Carnival plc joint definitive Proxy Statement to be filed with the U.S. Securities and Exchange Commission not later than 120 days after the close of the 2024 fiscal year.
PART IV
Item 15. Exhibits and Financial Statement Schedules.
(a) (1) Financial Statements
Our Consolidated Financial Statements have been prepared in accordance with Item 8. Financial Statements and Supplementary Data and are included beginning on page 48 of this report.
(2) Financial Statement Schedules
None.
(3) Exhibits
The exhibits listed below on the Index to Exhibits are filed or incorporated by reference as part of this Form 10-K.
| | | | | | | | | | | | | | | | | | | | | | | | | | |
| INDEX TO EXHIBITS | | | | | | |
| | Incorporated by Reference |
| Exhibit Number | Exhibit Description | Form | | Exhibit | | Filing Date | | Filed Herewith |
| | | | | | | |
| Articles of incorporation and by-laws | | | | | | | |
| | | | | | | | |
| 3.1 | | 8-K | | 3.1 | | 4/17/03 | | |
| | | | | | | | |
| 3.2 | | 8-K | | 3.1 | | 4/20/09 | | |
| | | | | | | | |
| 3.3 | | 8-K | | 3.3 | | 4/20/09 | | |
| | | | | | | | |
| Instruments defining the rights of security holders, including indenture | | | | | | |
| | | | | | | | |
| 4.1 | | | | | | | | X |
| | | | | | | | |
| 4.2 | | 10-Q | | 4.1 | | 10/15/03 | | |
| | | | | | | | |
| 4.3 | | 10-Q | | 4.2 | | 10/15/03 | | |
| | | | | | | | |
| 4.4 | | S-4 | | 4.3 | | 5/30/03 | | |
| | | | | | | | |
| 4.5 | | S-3 & F-3 | | 4.10 | | 6/19/03 | | |
| | | | | | | | |
| 4.6 | | S-3 & F-3 | | 4.16 | | 6/19/03 | | |
| | | | | | | | |
| 4.7 | | 8-K | | 4.1 | | 4/17/03 | | |
| | | | | | | | |
| 4.8 | | 8-K | | 4.2 | | 4/17/03 | | |
| | | | | | | | |
| | | | | | | | | | | | | | | | | | | | | | | | | | |
| INDEX TO EXHIBITS | | | | | | |
| | Incorporated by Reference |
| Exhibit Number | Exhibit Description | Form | | Exhibit | | Filing Date | | Filed Herewith |
| 4.9 | | 8-K | | 4.3 | | 4/17/03 | | |
| | | | | | | | |
| 4.10 | | Post
Amend-
ment to
Form F-6 | | 99-a | | 4/15/03 | | |
| | | | | | | | |
| 4.11 | | S-3 | | 4.1 | | 7/2/09 | | |
| | | | | | | | |
| 4.12 | | 10-K | | 4.12 | | 1/28/20 | | |
| | | | | | | | |
| 4.13 | | 10-K | | 4.15 | | 1/28/20 | | |
| | | | | | | | |
Material contracts | | | | | | | |
| | | | | | | | |
| 10.1* | |
10-Q | | 10.1 | | 6/27/08 | | |
| | | | | | | | |
| 10.2* | | 10-Q | | 10.2 | | 6/27/08 | | |
| | | | | | | | |
| 10.3 | | 10-Q | | 10.2 | | 7/12/02 | | |
| | | | | | | | |
| 10.4* | | 10-Q | | 10.3 | | 7/10/20 | | |
| | | | | | | | |
| 10.5* | | 10-Q | | 10.5 | | 7/10/20 | | |
| | | | | | | | |
| 10.6# | Term Loan Agreement dated as of June 30, 2020 among Carnival Finance, LLC and Carnival Corporation, as borrowers, Carnival plc and the other Guarantors party hereto, the various financial institutions as are or shall become parties hereto, JPMorgan Chase Bank, N.A., as administrative agent for the lenders, and U.S. Bank National Association, as security agent. | 10-Q | | 10.6 | | 7/10/20 | | |
| | | | | | | | |
| | | | | | | | | | | | | | | | | | | | | | | | | | |
| INDEX TO EXHIBITS | | | | | | |
| | Incorporated by Reference |
| Exhibit Number | Exhibit Description | Form | | Exhibit | | Filing Date | | Filed Herewith |
| 10.7 | | 10-K | | 10.52 | | 1/26/21 | | |
| | | | | | | | |
| 10.8 | | 10-Q | | 10.1 | | 4/7/21 | | |
| | | | | | | | |
| 10.9* | | 10-Q | | 10.1 | | 6/28/21 | | |
| | | | | | | | |
| 10.10 | Indenture dated as of July 26, 2021, among Carnival Corporation, as issuer, Carnival plc, the other Guarantors party hereto and U.S. Bank National Association, as trustee, principal paying agent, transfer agent, registrar and security agent, relating to the 4.00% First-Priority Senior Secured Notes due 2028. | 10-Q | | 10.3 | | 9/30/21 | | |
| | | | | | | | |
| 10.11 | Indenture dated as of November 2, 2021, among Carnival Corporation, as issuer, Carnival plc, the other Guarantors party hereto and U.S. Bank National Association, as trustee, principal paying agent, transfer agent, registrar and security agent, relating to the 6.000% Senior Unsecured Notes due 2029. | 8-K | | 10.1 | | 11/2/21 | | |
| | | | | | | | |
| 10.12* | | 10-Q | | 10.4 | | 3/28/22 | | |
| | | | | | | | |
| 10.13 | Indenture, dated as of May 25, 2022, among Carnival Corporation, as issuer, Carnival plc, the other Guarantors party hereto and U.S. Bank Trust Company, National Association, as trustee, principal paying agent, transfer agent, registrar and security agent, relating to the 10.500% Senior Unsecured Notes due 2030. | 8-K | | 10.1 | | 5/25/22 | | |
| | | | | | | | |
| 10.14* | | 10-Q | | 10.1 | | 6/29/22 | | |
| | | | | | | | |
| 10.15* | | 10-Q | | 10.2 | | 9/30/22 | | |
| | | | | | | | |
| | | | | | | | | | | | | | | | | | | | | | | | | | |
| INDEX TO EXHIBITS | | | | | | |
| | Incorporated by Reference |
| Exhibit Number | Exhibit Description | Form | | Exhibit | | Filing Date | | Filed Herewith |
| 10.16 | Indenture dated as of October 25, 2022, among Carnival Holdings (Bermuda) Limited, as issuer, Carnival Corporation, Carnival plc, the other Guarantors party thereto and U.S. Bank Trust Company, National Association, as trustee, principal paying agent, transfer agent and registrar, relating to the 10.375% Senior Unsecured Notes due 2028. | 8-K | | 10.1 | | 10/25/22 | | |
| | | | | | | | |
| 10.17 | | 8-K | | 10.1 | | 11/18/22 | | |
| | | | | | | | |
| 10.18* | | 10-Q | | 10.1 | | 3/29/23 | | |
| | | | | | | | |
| 10.19* | | 10-Q | | 10.3 | | 3/29/23 | | |
| | | | | | | | |
| 10.20 | | 10-Q | | 10.5 | | 3/29/23 | | |
| | | | | | | | |
| 10.21* | | 10-Q | | 10.1 | | 6/28/23 | | |
| | | | | | | | |
| 10.22* | | 10-Q | | 10.2 | | 6/28/23 | | |
| | | | | | | | |
| 10.23* | | 10-Q | | 10.3 | | 6/28/23 | | |
| | | | | | | | |
| 10.24 | Term Loan Agreement, dated as of August 8, 2023, among Carnival Finance, LLC and Carnival Corporation, as borrowers, Carnival plc, the other guarantors party thereto, the various financial institutions as are or shall become parties thereto, JPMorgan Chase Bank, N.A., as administrative agent for the lenders, and U.S. Bank Trust Company, National Association, as security agent. | 10-Q | | 10.2 | | 9/29/23 | | |
| | | | | | | | |
| 10.25 | Indenture, dated as of August 8, 2023, among Carnival Corporation, as issuer, Carnival plc, the guarantors party thereto and U.S. Bank Trust Company, National Association, as trustee, principal paying agent, transfer agent, registrar and security agent, related to the 7.000% First-Priority Senior Secured Notes due 2029. | 10-Q | | 10.3 | | 9/29/23 | | |
| | | | | | | | |
| | | | | | | | | | | | | | | | | | | | | | | | | | |
| INDEX TO EXHIBITS | | | | | | |
| | Incorporated by Reference |
| Exhibit Number | Exhibit Description | Form | | Exhibit | | Filing Date | | Filed Herewith |
| 10.26 | Repricing Amendment No. 1, dated as of April 25, 2024, to Term Loan Agreement, dated as of August 8, 2023, among Carnival Finance, LLC and Carnival Corporation, as borrowers, Carnival plc, the other guarantors party thereto, the various financial institutions as are or shall become parties thereto, and JPMorgan Chase Bank, N.A., as administrative agent for the lenders. | 10-Q | | 10.1 | | 6/27/24 | | |
| | | | | | | | |
| 10.27 | Repricing Amendment No. 6, dated as of April 25, 2024, to Term Loan Agreement, dated as of June 30, 2020, among Carnival Finance, LLC and Carnival Corporation, as borrowers, Carnival plc, the other guarantors party thereto, the various financial institutions as are or shall become parties thereto, and JPMorgan Chase Bank, N.A., as administrative agent for the lenders. | 10-Q | | 10.2 | | 6/27/24 | | |
| | | | | | | | |
| 10.28 | | 10-Q | | 10.3 | | 6/27/24 | | |
| | | | | | | | |
| 10.29* | | 10-Q | | 10.4 | | 6/27/24 | | |
| | | | | | | | |
| 10.30* | | 10-Q | | 10.5 | | 6/27/24 | | |
| | | | | | | | |
| 10.31* | | 10-Q | | 10.6 | | 6/27/24 | | |
| | | | | | | | |
| 10.32* | | 10-Q | | 10.7 | | 6/27/24 | | |
| | | | | | | | |
| 10.33 | | 10-Q | | 10.1 | | 9/30/24 | | |
| | | | | | | | |
| Insider Trading Policies and Procedures | | | | | | | |
| 19 | | | | | | | | X |
| | | | | | | | |
| Subsidiaries of the registrants | | | | | | | |
| | | | | | | | |
| 21 | | | | | | | | X |
| | | | | | | |
| Consents of experts and counsel | | | | | | | |
| | | | | | | | | | | | | | | | | | | | | | | | | | |
| INDEX TO EXHIBITS | | | | | | |
| | Incorporated by Reference |
| Exhibit Number | Exhibit Description | Form | | Exhibit | | Filing Date | | Filed Herewith |
| | | | | | | | |
| 23.1 | | | | | | | | X |
| | | | | | | | |
| 23.2 | | | | | | | | X |
| | | | | | | | |
| Power of attorney | | | | | |
| | | | | | |
| 24 | | | | | | X |
| | | | | | |
| Rule 13a-14(a)/15d-14(a) certifications | | | | | |
| | | | | | |
| 31.1 | | | | | | X |
| | | | | |
| 31.2 | | | | | | X |
| | | | | | |
| 31.3 | | | | | | X |
| | | | | | |
| 31.4 | | | | | | X |
| | | | | |
| Section 1350 certifications | | | | | |
| | | | | | |
| 32.1** | | | | | | X |
| | | | | | |
| 32.2** | | | | | | X |
| | | | | | |
| | | | | | | | | | | | | | | | | | | | | | | | | | |
| INDEX TO EXHIBITS | | | | | | |
| | Incorporated by Reference |
| Exhibit Number | Exhibit Description | Form | | Exhibit | | Filing Date | | Filed Herewith |
| 32.3** | | | | | | X |
| | | | | | |
| 32.4** | | | | | | X |
| | | | | | |
| Policy Relating to Recovery of Erroneously Awarded Compensation | | | | | |
| | | | | | | | |
| 97 | | 10-K | | 97 | | 1/26/24 | | |
| | | | | |
| Interactive data file | | | | | |
| | | | | | | | |
| 101 | The consolidated financial statements from Carnival Corporation & plc’s Form 10-K for the year ended November 30, 2024, as filed with the SEC on January 27, 2025 formatted in Inline XBRL, are as follows: | | | | | |
| (i) the Consolidated Statements of Income (Loss) for the years ended November 30, 2024, 2023 and 2022; | | | | | X |
| (ii) the Consolidated Statements of Comprehensive Income (Loss) for the years ended November 30, 2024, 2023 and 2022; | | | | | X |
| (iii) the Consolidated Balance Sheets at November 30, 2024 and 2023; | | | | | X |
| (iv) the Consolidated Statements of Cash Flows for the years ended November 30, 2024, 2023 and 2022; | | | | | X |
| (v) the Consolidated Statements of Shareholders’ Equity for the years ended November 30, 2024, 2023 and 2022
and | | | | | X |
| (vi) the notes to the consolidated financial statements, tagged in summary and detail. | | | | | X |
| | | | | |
| 104 | The cover page from Carnival Corporation & plc’s Form 10-K for the year ended November 30, 2024, as filed with the Securities and Exchange Commission on January 27, 2025, formatted in Inline XBRL (included as Exhibit 101) | | | | | |
* Indicates a management contract or compensation plan or arrangement.
** These items are furnished and not filed.
# Certain portions of this exhibit have been omitted pursuant to Item 601(b)(10) of Regulation S-K.
Item 16. Form 10-K Summary.
None.
SIGNATURES
Pursuant to the requirements of Section 13 or 15(d) of the Securities Exchange Act of 1934, each of the registrants has duly caused this report to be signed on its behalf by the undersigned, thereunto duly authorized.
| | | | | |
| CARNIVAL CORPORATION | CARNIVAL PLC |
| /s/ Josh Weinstein | /s/ Josh Weinstein |
| Josh Weinstein | Josh Weinstein |
| President, Chief Executive Officer and | President, Chief Executive Officer and |
| Chief Climate Officer and Director | Chief Climate Officer and Director |
| January 27, 2025 | January 27, 2025 |
Pursuant to the requirements of the Securities Exchange Act of 1934, this report has been signed below by the following persons on behalf of each of the registrants and in the capacities and on the dates indicated.
| | | | | |
| CARNIVAL CORPORATION | CARNIVAL PLC |
| /s/ Josh Weinstein | /s/ Josh Weinstein |
| Josh Weinstein | Josh Weinstein |
| President, Chief Executive Officer and | President, Chief Executive Officer and |
| Chief Climate Officer and Director | Chief Climate Officer and Director |
| January 27, 2025 | January 27, 2025 |
| |
| /s/ David Bernstein | /s/ David Bernstein |
| David Bernstein | David Bernstein |
| Chief Financial Officer and Chief Accounting Officer | Chief Financial Officer and Chief Accounting Officer |
| January 27, 2025 | January 27, 2025 |
| |
| /s/*Micky Arison | /s/*Micky Arison |
| Micky Arison | Micky Arison |
| Chair of the Board of | Chair of the Board of |
| Directors | Directors |
| January 27, 2025 | January 27, 2025 |
| |
| /s/*Sir Jonathon Band | /s/*Sir Jonathon Band |
| Sir Jonathon Band | Sir Jonathon Band |
| Director | Director |
| January 27, 2025 | January 27, 2025 |
| |
| /s/*Jason Glen Cahilly | /s/*Jason Glen Cahilly |
| Jason Glen Cahilly | Jason Glen Cahilly |
| Director | Director |
| January 27, 2025 | January 27, 2025 |
| |
| /s/*Nelda Connors | /s/*Nelda Connors |
| Nelda Connors | Nelda Connors |
| Director | Director |
| January 27, 2025 | January 27, 2025 |
| |
| | | | | |
| /s/*Helen Deeble | /s/*Helen Deeble |
| Helen Deeble | Helen Deeble |
| Director | Director |
| January 27, 2025 | January 27, 2025 |
| |
| /s/*Jeffrey J. Gearhart | /s/*Jeffrey J. Gearhart |
| Jeffrey J. Gearhart | Jeffrey J. Gearhart |
| Director | Director |
| January 27, 2025 | January 27, 2025 |
| |
| /s/*Katie Lahey | /s/*Katie Lahey |
| Katie Lahey | Katie Lahey |
| Director | Director |
| January 27, 2025 | January 27, 2025 |
| |
| /s/*Sara Mathew | /s/*Sara Mathew |
| Sara Mathew | Sara Mathew |
| Director | Director |
| January 27, 2025 | January 27, 2025 |
| |
| /s/*Stuart Subotnick | /s/*Stuart Subotnick |
| Stuart Subotnick | Stuart Subotnick |
| Director | Director |
| January 27, 2025 | January 27, 2025 |
| |
| /s/*Laura Weil | /s/*Laura Weil |
| Laura Weil | Laura Weil |
| Director | Director |
| January 27, 2025 | January 27, 2025 |
| |
| /s/*Randall Weisenburger | /s/*Randall Weisenburger |
| Randall Weisenburger | Randall Weisenburger |
| Director | Director |
| January 27, 2025 | January 27, 2025 |
| |
| *By: /s/ Enrique Miguez | *By: /s/ Enrique Miguez |
| Enrique Miguez | Enrique Miguez |
| (Attorney-in-fact) | (Attorney-in-fact) |
| January 27, 2025 | January 27, 2025 |