Forward-looking statements should not be relied upon as a prediction of actual results. Subject to any continuing obligations under applicable law or any relevant listing rules, we expressly disclaim any obligation to disseminate, after the date of this 2007 Annual Report, any updates or revisions to any such forward-looking statements to reflect any change in expectations or events, conditions or circumstances on which any such statements are based.
During most of 2007, the cruise industry continued to experience solid growth for non-Caribbean product offerings. However, there were a number of factors, such as a weaker U.S. economy, including the impact on consumers of higher fuel costs and tighter credit markets and higher U.S. interest rates, which we believe had adverse effects on vacationers’ discretionary income and their confidence in the U.S. economy. Some of these factors, as well as the lingering effects of the 2005 hurricane season, contributed to a reduction in North American-sourced demand for Caribbean cruises and, accordingly, resulted in lower pricing for most of our Caribbean cruise itineraries during the first half of 2007. During the second half of fiscal 2007 we experienced a modest increase in most of our North American brands’ net revenue yields, while most of our European brands’ net revenue yields decreased slightly on a constant dollar basis.
From 2003 through 2007, the cruise industry has been adversely impacted by substantial increases in fuel prices, which reduced earnings per share for the 2007 fiscal year by $0.10 compared to fiscal 2006. In 2003 our per metric ton of fuel cost was $179, whereas in 2007, our per metric ton cost of fuel was $361, an increase of 102%. Partially offsetting this has been the weakening of the U. S. dollar relative to the Euro and Sterling, which benefited us in higher dollar profits from our European operations. It is possible that fuel prices will remain at high levels throughout fiscal 2008 and thereafter. We have recently implemented a new fuel supplement fee across substantially all of our brands, which should help to reduce a portion of the impact of the higher fuel costs. However, we cannot be certain of the ultimate impact of the fuel supplement on our net revenue yields because this increase may be partially offset by a reduction in ticket prices.
Throughout this five year period we generated significant cash flows and remained in a strong financial position, which is a high priority for us and we believe provides us with a competitive advantage in the capital intensive cruise industry. We continued to distribute excess cash to shareholders through increased dividends and opportunistic share repurchases. However, our operations are subject to many risks, as briefly noted under the caption “Cautionary Note Concerning Factors That May Affect Future Results” which could adversely impact our future results.
As of December 20, 2007, we said that we expected our 2008 full year earnings per share will be in the range of $3.10 to $3.30. We also said that we expected our first quarter 2008 earnings per share to be in the range of $0.29 to $0.31. Our guidance was based on the then
current forward fuel price for full year 2008 and the 2008 first quarter of $486 and $484 per metric ton, respectively. In addition, this guidance was also based on currency exchange rates of $1.44 to the Euro and $2.02 to Sterling.
Our 2008 full year earnings per share guidance remains unchanged based on our most recent internal forecast, as adjusted by our January 22, 2008 full year forward fuel price estimate of $484 per metric ton and foreign currency exchange rates of $1.46 to the Euro and $1.95 to Sterling.
Our 2008 first quarter forward fuel price estimate has increased to $505 per metric ton compared to our December guidance, which reduced our earnings per share guidance by $0.02. In addition, our first quarter 2008 results were adversely impacted by $0.01 per share from AIDAaura’s unexpected cruise disruptions. There has also been some softness in onboard revenues at certain of our contemporary brands, which is expected to be offset by other cruise operating items. Accordingly, our earnings per share for the first quarter of 2008 is now expected to be in the range of $0.26 to $0.28.
The above forward-looking statements involve risks and uncertainties. Various factors could cause our actual results to differ materially from those expressed above including, but not limited to, fuel costs, economic conditions, weather, regulatory changes, geopolitical factors and other factors that could impact consumer demand or costs. You should read the above forward-looking statements together with the discussion of these and other risks under “Cautionary Note Concerning Factors That May Affect Future Results.”
Key Performance Indicators
We use net cruise revenues per ALBD (“net revenue yields”) and net cruise costs per ALBD as significant non-GAAP financial measures of our cruise segment financial performance. We believe that net revenue yields are commonly used in the cruise industry to measure a company’s cruise segment revenue performance. This measure is also used for revenue management purposes. In calculating net revenue yields, we use “net cruise revenues” rather than “gross cruise revenues.” We believe that net cruise revenues is a more meaningful measure in determining revenue yield than gross cruise revenues because it reflects the cruise revenues earned by us net of our most significant variable costs, which are travel agent commissions, cost of air transportation and certain other variable direct costs associated with onboard and other revenues. Substantially all of our remaining cruise costs are largely fixed once our ship capacity levels have been determined, except for the impact of changing prices.
Net cruise costs per ALBD is the most significant measure we use to monitor our ability to control our cruise segment costs rather than gross cruise costs per ALBD. In calculating net cruise costs, we exclude the same variable costs that are included in the calculation of net cruise revenues. This is done to avoid duplicating these variable costs in these two non-GAAP financial measures.
In addition, because a significant portion of our operations utilize the Euro or Sterling to measure their results and financial condition, the translation of those operations to our U.S. dollar reporting currency results in increases in reported U.S. dollar revenues and expenses if the U.S. dollar weakens against these foreign currencies, and decreases in reported U.S. dollar revenues and expenses if the U.S. dollar strengthens against these foreign currencies. Accordingly, we also monitor and report our two non-GAAP financial measures assuming the current period currency exchange rates have remained constant with the prior year’s comparable period rates, or on a “constant dollar basis,” in order to remove the impact of changes in exchange rates on our non-U.S. dollar cruise operations. We believe that this is a useful measure as it facilitates a comparative view of the growth of our business in a fluctuating currency exchange rate environment.
On a constant dollar basis, net cruise revenues and net cruise costs would be $9.92 billion and $6.26 billion for fiscal 2007, respectively. On a constant dollar basis, gross cruise revenues and gross cruise costs would be $12.27 billion and $8.62 billion for fiscal 2007, respectively. In addition, our non-U.S. dollar cruise operations’ depreciation and net interest expense were impacted by the changes in exchange rates for fiscal 2007 compared to 2006.
Critical Accounting Estimates
Our critical accounting estimates are those which we believe require our most significant judgments about the effect of matters that are inherently uncertain. A discussion of our critical accounting estimates, the underlying judgments and uncertainties used to make them and the likelihood that materially different estimates would be reported under different conditions or using different assumptions is as follows:
Ship Accounting
Our most significant assets are our ships and ships under construction, which represent 75% of our total assets. We make several critical accounting estimates dealing with our ship accounting. First, we compute our ships’ depreciation expense, which represented approximately 10% of our cruise costs and expenses in fiscal 2007, which requires us to estimate the average useful life of each of our ships, as well as their residual values. Secondly, we account for ship improvement costs by capitalizing those costs which we believe will add value to our ships and depreciate those improvements over their estimated useful lives, while expensing repairs and maintenance and minor improvement costs as they are
F-30
incurred. Finally, when we record the retirement of a ship component that is included within the ship’s cost basis, we may have to estimate its net book value to determine the amount of ship component retired.
We determine the average useful life of our ships and their residual values based primarily on our estimates of the weighted-average useful lives and residual values of the ships’ major component systems, such as cabins, main diesels, main electric, superstructure and hull. In addition, we consider, among other things, long-term vacation market conditions and competition and historical useful lives of similarly-built ships. We have estimated our new ships’ average useful lives at 30 years and their average residual values at 15% of our original ship cost.
Given the very large and complex nature of our ships, ship accounting estimates require considerable judgment and are inherently uncertain. We do not have cost segregation studies performed to specifically componentize our ships. In addition, since we do not separately componentize our ships, we do not identify and track depreciation of specific original ship components. Therefore, we have to estimate the net book value of components that are replaced or refurbished, based primarily upon their replacement or refurbishment cost and their age.
If materially different conditions existed, or if we materially changed our assumptions of ship lives and residual values, our depreciation expense or loss on replacement or refurbishment of ship assets and net book value of our ships would be materially different. In addition, if we change our assumptions in making our determinations as to whether improvements to a ship add value, the amounts we expense each year as repair and maintenance costs could increase, partially offset by a decrease in depreciation expense, as less costs would have been initially capitalized to our ships. Our fiscal 2007 ship depreciation expense would have increased by approximately $26 million for every year we reduced our estimated average 30 year ship useful life. In addition, if our ships were estimated to have no residual value, our fiscal 2007 depreciation expense would have increased by approximately $133 million.
We believe that the estimates we made for ship accounting purposes are reasonable and our methods are consistently applied in all material respects and, accordingly, result in depreciation expense that is based on a rational and systematic method to equitably allocate the costs of our ships to the periods during which services are obtained from their use. In addition, we believe that the estimates we made are reasonable and our methods consistently applied in all material respects (1) in determining the average useful life and average residual values of our ships; (2) in determining which ship improvement costs add value to our ships; and (3) in determining the net book value of ship component assets being replaced or refurbished. Finally, we believe our critical ship accounting estimates are generally comparable with those of other major cruise companies.
Asset Impairment
The impairment reviews of our ships, goodwill and trademarks, which has been allocated to our cruise line reporting units, require us to make significant estimates to determine the fair values of these assets or reporting units.
The determination of fair value includes numerous uncertainties, unless a viable actively traded market exists for the asset or for a comparable reporting unit, which is usually not the case for cruise ships, cruise lines and trademarks. For example, in determining fair values of ships utilizing discounted forecasted cash flows, significant judgments are made concerning, among other things, future net revenue yields, net cruise costs per ALBD, interest and discount rates, cruise itineraries, technological changes, consumer demand, governmental regulations and the effects of competition. In addition, third party appraisers are sometimes used to determine fair values of ships and cruise lines and some of their valuation methodologies are also subject to similar types of uncertainties. Also, the determination of fair values of cruise line reporting units using a price earnings multiple approach also requires significant judgments, such as determining reasonable multiples. Finally, determining trademark fair values also requires significant judgments in determining both the estimated trademark cash flows, and the appropriate royalty rates to be applied to those cash flows to determine their fair value. We believe that we have made
F-31
reasonable estimates and judgments in determining whether our ships, goodwill and trademarks have been impaired. However, if there is a material change in the assumptions used in our determination of fair value or if there is a material change in the conditions or circumstances influencing fair value, we could be required to recognize a material impairment charge.
Contingencies
We periodically assess the potential liabilities related to any lawsuits or claims brought against us, as well as for other known unasserted claims, including environmental, legal, guest and crew, and tax matters. While it is typically very difficult to determine the timing and ultimate outcome of these matters, we use our best judgment to determine if it is probable that we will incur an expense related to the settlement or final adjudication of such matters and whether a reasonable estimation of such probable loss, if any, can be made. In assessing probable losses, we make estimates of the amount of probable insurance recoveries, if any, which are recorded as assets. We accrue a liability when we believe a loss is probable and the amount of the loss can be reasonably estimated, in accordance with the provisions of SFAS No. 5, “Accounting for Contingencies,” as amended. Such accruals are typically based on developments to date, management’s estimates of the outcomes of these matters, our experience in contesting, litigating and settling other similar matters, historical claims experience and actuarially determined assumptions of liabilities, and any related insurance coverage. See Note 7 in the accompanying financial statements for additional information concerning our contingencies.
Given the inherent uncertainty related to the eventual outcome of these matters and potential insurance recoveries, it is possible that all or some of these matters may be resolved for amounts materially different from any provisions or disclosures that we may have made with respect to their resolution. In addition, as new information becomes available, we may need to reassess the amount of probable liability that needs to be accrued related to our contingencies. All such revisions in our estimates could materially impact our results of operations and financial position.
F-32
Results of Operations
| | |
| We earn our cruise revenues primarily from the following: |
| | |
| - | Sales of passenger cruise tickets and, in some cases, the sale of air and other transportation to and from our ships. The cruise ticket price includes accommodations, most meals, some non-alcoholic beverages, entertainment and many onboard activities, and |
| | |
| - | the sale of goods and/or services primarily onboard our ships (which include bar and some beverage sales, casino gaming, shore excursions, gift shop and spa sales and photo and art sales) and pre and post-cruise land packages. These goods and services are either provided directly by us or by independent concessionaires, from which we receive a percentage of their revenues or a fee. |
| | |
| We incur cruise operating costs and expenses for the following: |
| | |
| - | the costs of passenger cruise bookings, which represent costs that vary directly with passenger cruise ticket revenues, and include travel agent commissions, air and other travel related costs, |
| | |
| - | onboard and other cruise costs, which represent costs that vary directly with onboard and other revenues, and include the costs of liquor and some beverages, costs of tangible goods sold by us from our gift, photo and art auction activities, pre and post-cruise land packages and credit card fees. Concession revenues do not have any significant amount of costs associated with them, as the costs and services incurred for these activities are provided by our concessionaires, |
| | |
| - | payroll and related costs, which represent costs for all our shipboard personnel, including deck and engine officers and crew and hotel and administrative employees, |
| | |
| - | fuel costs, which include fuel delivery costs, |
| | |
| - | food costs, which include both our guest and crew food costs, and |
| | |
| - | other ship operating costs, which include repairs and maintenance, including minor improvements and dry-dock expenses, port costs, entertainment, insurance, and all other shipboard operating costs and expenses. |
For segment information related to our revenues, expenses, operating income and other financial information see Note 11 in the accompanying financial statements.
F-33
Selected Information and Non-GAAP Financial Measures
| | | | | | | | | | |
Selected information was as follows: | | | |
| | Years Ended November 30, | |
| |
| |
| | 2007 | | 2006 | | 2005 | |
| |
| |
| |
| |
| | | | | | | | | | |
Passengers carried (in thousands) | | | 7,672 | | | 7,008 | | | 6,848 | |
| |
|
| |
|
| |
|
| |
Occupancy percentage | | | 105.6 | % | | 106.0 | %(a) | | 105.6 | %(a) |
| |
|
| |
|
| |
|
| |
Fuel cost per metric ton (b) | | $ | 361 | | $ | 334 | | $ | 259 | |
| |
|
| |
|
| |
|
| |
| |
(a) | Occupancy percentage includes the three ships chartered to the Military Sealift Command in connection with our Hurricane Katrina relief efforts in the first quarter of 2006 and the fourth quarter of 2005 at 100%. |
| |
(b) | Fuel cost per metric ton is calculated by dividing the cost of our fuel by the number of metric tons consumed. |
Gross and net revenue yields were computed by dividing the gross or net revenues, without rounding, by ALBDs as follows:
| | | | | | | | | | |
| | Years Ended November 30, | |
| |
| |
| | 2007 | | 2006 | | 2005 | |
| |
| |
| |
| |
| | (in millions, except ALBDs and yields) | |
| | | |
Cruise revenues | | | | | | | | | | |
Passenger tickets | | $ | 9,792 | | $ | 8,903 | | $ | 8,399 | |
Onboard and other | | | 2,846 | | | 2,514 | | | 2,338 | |
| |
|
| |
|
| |
|
| |
Gross cruise revenues | | | 12,638 | | | 11,417 | | | 10,737 | |
Less cruise costs | | | | | | | | | | |
Commissions, transportation and other | | | (1,941 | ) | | (1,749 | ) | | (1,645 | ) |
Onboard and other | | | (495 | ) | | (453 | ) | | (412 | ) |
| |
|
| |
|
| |
|
| |
Net cruise revenues | | $ | 10,202 | | $ | 9,215 | | $ | 8,680 | |
| |
|
| |
|
| |
|
| |
| | | | | | | | | | |
ALBDs(a) | | | 54,132,927 | | | 49,945,184 | | | 47,754,627 | |
| |
|
| |
|
| |
|
| |
| | | | | | | | | | |
Gross revenue yields | | $ | 233.47 | | $ | 228.58 | | $ | 224.84 | |
| |
|
| |
|
| |
|
| |
| | | | | | | | | | |
Net revenue yields | | $ | 188.48 | | $ | 184.50 | | $ | 181.77 | |
| |
|
| |
|
| |
|
| |
Gross and net cruise costs per ALBD were computed by dividing the gross or net cruise costs, without rounding, by ALBDs as follows:
| | | | | | | | | | |
| | Years Ended November 30, | |
| |
| |
| | 2007 | | 2006 | | 2005 | |
| |
| |
| |
| |
| | (in millions, except ALBDs and costs per ALBD) | |
| | | |
Cruise operating expenses | | $ | 7,332 | | $ | 6,477 | | $ | 5,964 | |
Cruise selling and administrative expenses | | | 1,547 | | | 1,405 | | | 1,289 | |
| |
|
| |
|
| |
|
| |
Gross cruise costs | | | 8,879 | | | 7,882 | | | 7,253 | |
Less cruise costs included in net cruise revenues | | | | | | | | | | |
Commissions, transportation and other | | | (1,941 | ) | | (1,749 | ) | | (1,645 | ) |
Onboard and other | | | (495 | ) | | (453 | ) | | (412 | ) |
| |
|
| |
|
| |
|
| |
Net cruise costs | | $ | 6,443 | | $ | 5,680 | | $ | 5,196 | |
| |
|
| |
|
| |
|
| |
| | | | | | | | | | |
ALBDs(a) | | | 54,132,927 | | | 49,945,184 | | | 47,754,627 | |
| |
|
| |
|
| |
|
| |
| | | | | | | | | | |
Gross cruise costs per ALBD | | $ | 164.02 | | $ | 157.81 | | $ | 151.89 | |
| |
|
| |
|
| |
|
| |
| | | | | | | | | | |
Net cruise costs per ALBD | | $ | 119.03 | | $ | 113.73 | | $ | 108.81 | |
| |
|
| |
|
| |
|
| |
| |
(a) | ALBDs is a standard measure of passenger capacity for the period. It assumes that each cabin we offer for sale accommodates two passengers. ALBDs are computed by multiplying passenger capacity by revenue-producing ship operating days in the period. |
F-34
Fiscal 2007 (“2007”) Compared to Fiscal 2006 (“2006”)
Net cruise revenues increased $987 million, or 10.7%, to $10.20 billion in 2007 from $9.22 billion in 2006. The 8.4% increase in ALBDs between 2007 and 2006 accounted for $772 million of the increase, and the remaining $215 million was from increased net revenue yields, which increased 2.2% in 2007 compared to 2006 (gross revenue yields increased by 2.1%). Net revenue yields increased in 2007 primarily due to the weaker U.S. dollar relative to the Euro and Sterling and higher onboard guest spending, partially offset by slightly lower occupancy. Net revenue yields as measured on a constant dollar basis decreased 0.7% in 2007 compared to 2006. This decrease in constant dollar net revenue yields was primarily driven by the softer cruise ticket pricing from North American-sourced contemporary Caribbean cruises especially in the first half of 2007. We believe this decrease in yields was primarily the result of a weaker U.S. economy, including the impact of higher fuel costs and interest rates which impacted demand and the lingering effects of the 2005 hurricane season, which was partially offset by the higher prices we achieved from our European brands, also mostly in the first half of 2007. Gross cruise revenues increased $1.22 million, or 10.7%, to $12.64 billion in 2007 from $11.42 billion in 2006 for largely the same reasons as net cruise revenues.
Onboard and other revenues included concessionaire revenues of $830 million in 2007 and $694 million in 2006. Onboard and other revenues increased in 2007 compared to 2006, primarily because of the 8.4% increased ALBDs and increased guest spending on our ships.
Other non-cruise revenues increased $20 million, or 3.8%, to $553 million in 2007 from $533 million in 2006 primarily due to the increase in the number of cruise/tours sold and higher cruise/tour prices.
Costs and Expenses
Net cruise costs increased $763 million, or 13.4%, to $6.44 billion in 2007 from $5.68 billion in 2006. The 8.4% increase in ALBDs between 2007 and 2006 accounted for $476 million of the increase. The balance of $287 million was from increased net cruise costs per ALBD, which increased 4.7% in 2007 compared to 2006 (gross cruise costs per ALBD increased 3.9%). Net cruise costs per ALBD increased in 2007 primarily due to a weaker U.S. dollar relative to the Euro and Sterling, a $27 per metric ton increase in fuel cost to $361 per metric ton in 2007, which resulted in an increase in fuel expense of $82 million compared to 2006, a $20 million Merchant Navy Officers Pension Fund expense and higher repair costs from ship incidents. These increases were partially offset by $21 million of lower dry-dock costs as fewer ships went into dry-dock in 2007 compared to 2006. Net cruise costs per ALBD as measured on a constant dollar basis increased 1.7% in 2007 compared to 2006. On a constant dollar basis, net cruise costs per ALBD, excluding fuel costs were up 1.0%, compared to 2006. Gross cruise costs increased $997 million, or 12.6%, in 2007 to $8.88 billion from $7.88 billion in 2006 for largely the same reasons as net cruise costs.
Other non-cruise operating and selling and administrative expenses increased $19 million, or 4.1%, to $486 million in 2007 from $467 million in 2006 primarily due to the increase in the number of cruise/tours sold.
Depreciation and amortization expense increased $113 million, or 11.4%, to $1.10 billion in 2007 from $988 million in 2006 largely due to the 8.4% increase in ALBDs through the addition of new ships, the weaker U.S. dollar compared to the Euro and Sterling and additional ship improvement expenditures.
Nonoperating (Expense) Income
Net interest expense, excluding capitalized interest, increased $21 million to $344 million in 2007 from $323 million in 2006. This increase was primarily due to a $57 million increase in interest expense from a higher level of average borrowings and a $6 million increase from higher average interest rates on average borrowings, partially offset by $33 million of higher interest income due to a higher average level of invested cash and $9 million due to higher average interest rates on invested balances. Capitalized interest increased $7 million during 2007 compared to 2006 primarily due to higher average levels of investment in ship construction projects.
F-35
Other expenses in 2006 included a $10 million expense for the write-down of a non-cruise investment, partially offset by a $4 million gain on the subsequent sale of this investment.
Income Taxes
Income tax expense decreased by $23 million to $16 million in 2007 from $39 million in 2006 primarily because 2006 included $11 million of income tax expense for the Military Sealift Command charters and the reversal in 2007 of some uncertain income tax position liabilities, partially offset by higher state income taxes in Alaska.
Fiscal 2006 (“2006”) Compared to Fiscal 2005 (“2005”)
Revenues
Net cruise revenues increased $535 million, or 6.2%, to $9.22 billion in 2006 from $8.68 billion in 2005. The 4.6% increase in ALBDs between 2006 and 2005 accounted for $398 million of the increase, and the remaining $137 million was from increased net revenue yields, which increased 1.5% on both a current and constant dollar basis in 2006 compared to 2005 (gross revenue yields increased by 1.7% in current dollars). Net revenue yields increased in 2006 primarily from higher cruise ticket prices, higher onboard revenues and, to a lesser extent, a 0.4% increase in occupancy. Gross cruise revenues increased $680 million, or 6.3%, in 2006 to $11.42 billion from $10.74 billion in 2005 for largely the same reasons as net cruise revenues.
Our 2006 cruise ticket prices for Caribbean itineraries were lower than in 2005, which were offset by price increases we achieved primarily from our Alaska and European cruises. We believe that this reduction in Caribbean pricing was the result of weaker consumer demand caused primarily from the lingering effects of the unusually strong 2005 hurricane season and higher fuel and other costs’ adverse impacts on our customers’ discretionary income.
Onboard and other revenues included concession revenues of $694 million in 2006 and $638 million in 2005. Onboard and other revenues increased in 2006 compared to 2005, primarily because of the 4.6% increased ALBDs and increased guest spending on our ships.
Other non-cruise revenues increased $72 million, or 15.6%, to $533 million in 2006 from $461 million in 2005 primarily due to the increase in the number of cruise/tours sold.
Costs and Expenses
Net cruise costs increased $484 million, or 9.3%, to $5.68 billion in 2006 from $5.20 billion in 2005. The 4.6% increase in ALBDs between 2005 and 2006 accounted for $238 million of the increase whereas $246 million was from increased net cruise costs per ALBD, which increased 4.5% in 2006 compared to 2005 (gross cruise costs per ALBD increased 3.9%). Net cruise costs per ALBD increased primarily due to a $75 increase in fuel cost per metric ton, or 29.0%, to $334 per metric ton in 2006, which resulted in an additional $209 million of expense, and a $57 million increase in share-based compensation expense, which was as the result of our adoption of SFAS No. 123(R) (see Notes 2 and 12 in the accompanying financial statements). This increase was partially offset by the non-recurrence in 2006 of a $23 million MNOPF expense. Net cruise costs per ALBD as measured on a constant dollar basis increased 4.8% in 2006 compared to 2005. On a constant dollar basis, net cruise costs per ALBD, excluding increased fuel prices and incremental share-based compensation expenses were flat compared to 2005. Gross cruise costs increased $629 million, or 8.7%, in 2006 to $7.88 billion from $7.25 billion in 2005 for largely the same reasons as net cruise costs.
Other non-cruise operating and selling and administrative expenses increased $63 million, or 15.6%, to $467 million in 2006 from $404 million in 2005 primarily due to the increase in the number of cruise/tours sold.
Depreciation and amortization expense increased by $86 million, or 9.5%, to $988 million in 2006 from $902 million in 2005 largely due to the 4.6% increase in ALBDs through the addition of new ships, and additional ship improvement expenditures.
F-36
Nonoperating (Expense) Income
Net interest expense, excluding capitalized interest, was $323 million in both 2006 and 2005. This flat interest expense was primarily due to lower average borrowings offsetting the impact of higher average interest rates on borrowings. Capitalized interest increased $16 million during 2006 compared to 2005 primarily due to higher average levels of investment in ship construction projects and higher average interest rates on borrowings.
Income Taxes
Income tax expense decreased by $33 million to $39 million in 2006 from $72 million in 2005 primarily as a result of lower U.S. income taxes related to the MSC charter in 2006 compared to 2005, and the reversal in 2006 of previously recorded tax liabilities and deferred tax valuation allowances, which were no longer required based upon the results of tax authority audits and other factors.
Liquidity and Capital Resources
Sources and Uses of Cash
Our business provided $4.07 billion of net cash from operations during fiscal 2007, an increase of $436 million, or 12.0%, compared to fiscal 2006. We continue to generate substantial cash from operations and remain in a strong financial position, thus providing us with substantial financial flexibility in meeting operating, investing and financing needs.
During fiscal 2007, our net expenditures for capital projects were $3.31 billion, of which $2.77 billion was spent for our ongoing new shipbuilding program, including $2.06 billion for the final delivery payments forCarnival Freedom,Emerald Princess,AIDAdiva,Costa Serena andQueen Victoria. In addition to our new shipbuilding program, we had capital expenditures of $383 million for ship improvements and refurbishments and $161 million for Alaska tour assets, cruise port facility developments and information technology assets.
During fiscal 2007, we borrowed $2.65 billion of long-term debt, which included $1.49 billion to pay part ofCarnival Freedom,Emerald Princess,AIDAdiva andQueen Victoriapurchase prices, and Ibero Cruises borrowed €185 million ($274 million U.S. dollars at November 30, 2007 exchange rate) under our Facility to finance a portion of its purchase price. In addition during fiscal 2007, we repaid $1.66 billion of long-term debt, which included $323 million for the early repayment of £165 million of debt and $835 million upon maturity of our 3.75% Senior and other fixed rate notes. We also repaid net short-term borrowings of $330 million under our commercial paper programs and short-term bank loans during fiscal 2007. Finally, we paid cash dividends of $990 million and purchased $326 million of Carnival Corporation common stock and Carnival plc ordinary shares in open market transactions during fiscal 2007.
Future Commitments and Funding Sources
At November 30, 2007, our contractual cash obligations, including new ship orders placed in December 2007, and the effects such obligations are expected to have on our liquidity and cash flow in future periods were as follows (in millions):
F-37
| | | | | | | | | | | | | | | | | | | | | | |
| | Payments Due by Fiscal Year | |
| |
| |
| | Total | | 2008 | | 2009 | | 2010 | | 2011 | | 2012 | | Thereafter | |
| |
| |
| |
| |
| |
| |
| |
| |
| | | | | | | | | | | | | | | |
Contractual Cash
Obligations | | | | | | | | | | | | | | | | | | | | | | |
Recorded Contractual
Obligations | | | | | | | | | | | | | | | | | | | | | | |
Debt(a) | | $ | 8,852 | | $ | 2,539 | | $ | 329 | | $ | 1,342 | | $ | 325 | | $ | 1,028 | | $ | 3,289 | |
Other long-term liabilities reflected on the balance sheet(b) | | | 499 | | | 32 | | | 59 | | | 52 | | | 38 | | | 30 | | | 288 | |
Unrecorded Contractual Obligations | | | | | | | | | | | | | | | | | | | | | | |
Shipbuilding(a) | | | 12,328 | | | 2,680 | | | 2,964 | | | 3,334 | | | 2,202 | | | 1,148 | | | | |
Port facilities and other(a) | | | 561 | | | 111 | | | 95 | | | 75 | | | 51 | | | 45 | | | 184 | |
Operating leases(a) | | | 330 | | | 38 | | | 40 | | | 33 | | | 31 | | | 30 | | | 158 | |
Purchase obligations(c) | | | 747 | | | 650 | | | 56 | | | 29 | | | 5 | | | 2 | | | 5 | |
Fixed-rate interest payments(d) | | | 1,884 | | | 251 | | | 226 | | | 217 | | | 204 | | | 191 | | | 795 | |
Variable rate interest payments(d) | | | 379 | | | 110 | | | 93 | | | 72 | | | 34 | | | 29 | | | 41 | |
| |
|
| |
|
| |
|
| |
|
| |
|
| |
|
| |
|
| |
Total contractual cash obligations(e) | | $ | 25,580 | | $ | 6,411 | | $ | 3,862 | | $ | 5,154 | | $ | 2,890 | | $ | 2,503 | | $ | 4,760 | |
| |
|
| |
|
| |
|
| |
|
| |
|
| |
|
| |
|
| |
| |
(a) | See Notes 5 and 6 in the accompanying financial statements for additional information regarding these contractual cash obligations. |
| |
(b) | Represents cash outflows for certain of our long-term liabilities that could be reasonably estimated. The primary outflows are for estimates of our employee benefit plan obligations, crew and guest claims, certain deferred income taxes, derivative contracts payable, and other long-term liabilities. Other long-term liabilities, such as deferred income and certain deferred income taxes, have been excluded from the table as they do not require cash settlement in the future or the timing of the cash outflow cannot be reasonably estimated. |
| |
(c) | Represents legally-binding commitments to purchase inventory and other goods and services made in the normal course of business to meet operational requirements. Many of our contracts contain clauses that allow us to terminate the contract with notice, and with or without a termination penalty. Termination penalties are generally an amount less than the original obligation. Historically, we have not had any significant defaults of our contractual obligations or incurred significant penalties for termination of our contractual obligations. |
| |
(d) | Fixed-rate interest payments represent cash outflows for fixed interest payments, including interest swapped from a variable-rate to a fixed-rate. Variable-rate interest payments represent forecasted cash outflows for interest payments on variable-rate debt, including interest swapped from a fixed-rate to a variable-rate, using the November 30, 2007 interest rates for the remaining terms of the loans. |
| |
(e) | Foreign currency payments are based on the November 30, 2007 exchange rates. |
In June 2006, the Boards of Directors authorized the repurchase of up to an aggregate of $1 billion of Carnival Corporation common stock and/or Carnival plc ordinary shares subject to certain restrictions. On September 19, 2007, the Boards of Directors increased the remaining $578 million authorization back to $1 billion. The repurchase program does not have an expiration date and may be discontinued by our Boards of Directors at any time. The Carnival plc share repurchase authorization requires annual shareholder approval. During the 2007 fourth quarter and from December 1, 2007 through January 28, 2008 we purchased 4.8 million and 1.3 million ordinary shares of Carnival plc, which are not registered under Section 12 of the Securities Exchange Act at an average price of $43.28 and $43.77, respectively, and 0.2 million and 0.6 million shares, respectively of Carnival Corporation common stock at an average share price of $44.58 and $44.63, respectively. Carnival plc ordinary shares are listed on the London Stock Exchange. At January 28, 2008 the remaining availability pursuant to our repurchase program was $788 million.
F-38
At November 30, 2007, as adjusted for the $1.50 billion short-term revolving credit facilities we entered into in January 2008, we had liquidity of $5.31 billion, which consisted of $943 million of cash and cash equivalents, $1.08 billion available for borrowing under our Facility, $1.50 billion under our short-term revolving credit facilities and $1.78 billion under committed ship financing facilities. Substantially all of our Facility matures in 2012. In addition, in June 2007 we entered into an agreement to sell Cunard Line’sQE2 for delivery to the buyer in November 2008 for $100 million. A key to our access to liquidity is the maintenance of our strong credit ratings.
Based primarily on our historical results, current financial condition and future forecasts, we believe that our existing liquidity and cash flow from future operations will be sufficient to fund most of our expected capital projects, debt service requirements, convertible debt redemptions, dividend payments, working capital and other firm commitments over the next several years. In addition, based on our future forecasted operating results and cash flows for fiscal 2008, we expect to be in compliance with our debt covenants during 2008. However, our forecasted cash flow from future operations, as well as our credit ratings, may be adversely affected by various factors including, but not limited to, those factors noted under “Cautionary Note Concerning Factors That May Affect Future Results.” To the extent that we are required, or choose, to fund future cash requirements, including our future shipbuilding commitments, from sources other than as discussed above, we believe that we will be able to secure such financing from banks or through the issuance of debt and/or offering of equity securities in the public or private markets. However, we cannot be certain that our future operating cash flow will be sufficient to fund future obligations or that we will be able to obtain additional financing, if necessary.
Off-Balance Sheet Arrangements
We are not a party to any off-balance sheet arrangements, including guarantee contracts, retained or contingent interests, certain derivative instruments and variable interest entities, that either have, or are reasonably likely to have, a current or future material effect on our financial statements.
Foreign Currency Exchange Rate Risks
Our growing international business operations are conducted primarily through AIDA in Germany, Costa in Southern Europe and China, Ibero Cruises in Spain, P&O Cruises, Ocean Village and Cunard in the UK and P&O Cruises Australia in Australia, which subject us to an increasing level of foreign currency exchange risk related to the Euro, Sterling and Australian dollar because these operations have either the Euro, Sterling or Australian dollar as their functional currency. Accordingly, exchange rate fluctuations of the Euro, Sterling or Australian dollar against the U.S. dollar will affect our reported financial results since the reporting currency for our consolidated financial statements is the U.S. dollar and the functional currency for our international operations is generally the local currency. Any weakening of the U.S. dollar against these local functional currencies has the financial statement effect of increasing the U.S. dollar values reported for cruise revenues and cruise expenses in our Consolidated Statements of Operations. Strengthening of the U.S. dollar has the opposite effect.
We seek to minimize the impact of fluctuations in foreign currency exchange rates through our normal operating and financing activities, including netting certain exposures to take advantage of any natural offsets and, when considered appropriate, through the use of derivative and nonderivative financial instruments. The financial impacts of these hedging instruments are generally offset by corresponding changes in the underlying exposures being hedged. Our policy is to not use any financial instruments for trading or other speculative purposes.
One of our primary foreign currency exchange rate risks is related to our outstanding commitments under ship construction contracts denominated in a currency other than the functional currency of the cruise brand that is expected to be operating the ship. These foreign currency commitments are affected by fluctuations in the value of the functional currency as compared to the currency in which the shipbuilding contract is denominated. We use foreign currency swaps and nonderivative financial instruments to manage foreign currency
F-39
exchange rate risk from some of our ship construction contracts (see Notes 2, 6 and 10 in the accompanying financial statements). Accordingly, increases and decreases in the fair value of these foreign currency swaps offset changes in the fair value of the foreign currency denominated ship construction commitments, thus resulting in the elimination of such risk.
Specifically, we have foreign currency swaps for one of our Euro-denominated shipbuilding contracts and a portion of another shipbuilding contract. At November 30, 2007, the fair value of these foreign currency swaps was an unrealized gain of $13 million which is recorded, along with an offsetting $13 million fair value liability related to our shipbuilding firm commitments, on our accompanying 2007 balance sheet. Based upon a 10% strengthening or weakening of the Sterling and U.S. dollar compared to the Euro as of November 30, 2007, assuming no changes in comparative interest rates, the estimated fair value of these foreign currency swaps would decrease or increase by $66 million, which would be offset by a decrease or increase of $66 million in the U.S. dollar value of the related foreign currency ship construction commitments resulting in no net dollar impact to us.
In addition, we have €296 million of cash equivalents that are designated as a fair value hedge for a portion of a ship that is expected to operate in a U.S. dollar functional currency brand, which has resulted in a $44 million firm commitment gain. Based upon a 10% strengthening or weakening of the U.S. dollar compared to the Euro cash equivalent balance as of November 30, 2007, assuming no changes in comparative interest rates, the estimated fair value of this cash equivalent balance would decrease or increase by $44 million, which would be offset by a decrease or increase of $44 million in the U.S. dollar balance of the related foreign currency ship construction commitment resulting in no net dollar impact to us.
At November 30, 2007, we have six Euro-denominated shipbuilding commitments (for delivery between June 2009 and May 2011) aggregating €2.16 billion assigned to three of our U.S. dollar functional currency brands for which we have not entered into any foreign currency swaps. Therefore, the U.S. dollar cost of these ships will increase or decrease based upon changes in the exchange rate until the payments are made under the shipbuilding contracts or we enter into foreign currency hedges. A portion of our net investment in Euro-denominated cruise operations effectively act as an economic hedge against a portion of these Euro commitments. Accordingly, a portion of any increase or decrease in our ship costs resulting from changes in the exchange rates will be offset by a corresponding change in the net assets of our Euro-denominated cruise operations. Based upon a 10% hypothetical increase or decrease in the November 30, 2007 U.S. dollar to the Euro foreign currency exchange rate, the cost of these ships would decrease or increase by $320 million.
In addition, at November 30, 2007 we have two Euro-denominated shipbuilding commitments (for delivery in March and September 2010) aggregating €1.05 billion assigned to two of our Sterling functional currency brands for which we have not entered into any foreign currency swaps. Therefore, the Sterling cost of these ships will increase or decrease based upon changes in the exchange rate until the payments are made under the shipbuilding contracts or we enter into foreign currency hedges. Since the Euro to Sterling exchange rate has traded in a narrow band for most of the last three years, we have not yet hedged these Euro-denominated commitments. Based upon a 10% hypothetical increase or decrease in the November 30, 2007 Sterling to Euro foreign currency exchange rate, assuming the U.S. dollar exchange rate remains constant, the cost of these ships would decrease or increase by $155 million.
Our decisions regarding whether or not to hedge a given ship commitment are made on a case-by-case basis, taking into consideration the amount and duration of the exposure, market volatility, exchange rate correlation, economic trends and other offsetting risks.
The cost of shipbuilding orders that we may place in the future for our cruise lines who generate their cash flows in a currency that is different than the shipyard’s operating currency, generally the Euro, is expected to be affected by foreign currency exchange rate fluctuations. Given the decline in the U.S. dollar relative to the Euro over the past several years, the U.S. dollar cost to order new cruise ships at current exchange rates has increased significantly. If the U.S. dollar remains at current levels or declines further, this may affect our ability to order future new cruise ships for U.S. dollar functional currency brands.
F-40
We consider our investments in foreign subsidiaries to be denominated in relatively stable currencies and of a long-term nature. In addition to the net investment hedging strategy discussed above, we also partially address these net investment currency exposures by denominating a portion of our debt including the effect of foreign currency swaps, in our subsidiaries’ functional currencies (generally the Euro or Sterling). Specifically, we have debt of $1.89 billion in Euros and $457 million in Sterling and have $378 million of foreign currency swaps, whereby we have converted $378 million of U.S. dollar debt into Euro debt, thus partially offsetting these foreign currency exchange rate risks. At November 30, 2007, the fair value of these foreign currency swaps was an unrealized loss of $30 million, which is recorded in AOCI and offsets a portion of the gains recorded in AOCI upon translating these foreign subsidiaries net assets into U.S. dollars. Based upon a 10% hypothetical increase or decrease in the November 30, 2007 foreign currency exchange rates, assuming no changes in comparative interest rates, we estimate that these derivative contracts’ fair values would increase or decrease by $38 million, which would be offset by a decrease or increase of $38 million in the U.S. dollar value of our net investments.
Finally, during 2007, we entered into cash flow foreign currency swaps that effectively converted $438 million of U.S. dollar fixed interest rate debt into £210 million fixed interest rate debt that is the functional currency of our operation that has the obligation to repay this debt. At November 30, 2007, the fair value of these foreign currency swaps was an unrealized gain of $3 million.
Interest Rate Risks
We seek to minimize the impact of fluctuations in interest rates through our investment and debt portfolio management strategies, which includes purchasing high quality short-term investments with variable interest rates, and issuing substantial amounts of fixed rate debt instruments. We continuously evaluate our debt portfolio, and make periodic adjustments to the mix of floating rate and fixed rate debt based on our view of interest rate movements, through the use of interest rate swaps. At November 30, 2007 and 2006, 69% and 68% of the interest cost on our debt was fixed and 31% and 32% was variable, including the effect of our interest rate swaps, respectively.
Specifically, we have interest rate swaps at November 30, 2007, which effectively changed $204 million of fixed rate debt to LIBOR-based floating rate debt. In addition, we have interest rate swaps at November 30, 2007 which effectively changed $16 million of EURIBOR-based floating rate debt to fixed rate debt. The fair value of our debt and interest rate swaps at November 30, 2007 was $9.01 billion. Based upon a hypothetical 10% decrease or increase in the November 30, 2007 market interest rates, assuming no change in currency exchange rates, the fair value of our debt and interest rate swaps would increase or decrease by approximately $143 million. In addition, based upon a hypothetical 10% decrease or increase in the November 30, 2007 interest rates, our annual interest expense on variable rate debt, including the effect of our interest rate swaps, would decrease or increase by approximately $13 million.
In addition, based upon a hypothetical 10% increase or decrease in Carnival Corporation’s November 30, 2007 common stock price, the fair value of our convertible notes would increase or decrease by approximately $102 million.
These hypothetical amounts are determined by considering the impact of the hypothetical interest rates and common stock price on our existing debt and interest rate swaps. This analysis does not consider the effects of the changes in the level of overall economic activity that could exist in such environments or any relationships which may exist between interest rate and stock price movements. Furthermore, since substantially all of our fixed rate debt cannot currently be called or prepaid it is unlikely we would be able to take any significant steps in the short-term to mitigate our exposure in the event of a significant decrease in market interest rates.
Bunker Fuel Price Risks
We do not use financial instruments to hedge our exposure to the bunker fuel price market risk. We estimate that our fiscal 2008 fuel cost would increase or decrease by approximately $3.3 million for each $1 per metric ton increase or decrease in our average bunker fuel price.
F-41
Selected Financial Data
The selected consolidated financial data presented below for fiscal 2003 through 2007 and as of the end of each such year, are derived from our audited financial statements and should be read in conjunction with those financial statements and the related notes.
| | | | | | | | | | | | | | | | |
| | Years Ended November 30, | |
| |
| |
| | 2007 | | 2006 | | 2005 | | 2004 | | 2003 | |
| |
| |
| |
| |
| |
| |
| | (in millions, except per share and other operating data) | |
Statement of Operations and Cash Flow Data(a) | | | | | | | | | | | | | | | | |
Revenues | | $ | 13,033 | | $ | 11,839 | | $ | 11,094 | | $ | 9,727 | | $ | 6,718 | |
Operating income | | $ | 2,725 | | $ | 2,613 | | $ | 2,639 | | $ | 2,128 | | $ | 1,376 | |
Net income | | $ | 2,408 | | $ | 2,279 | | $ | 2,253 | | $ | 1,809 | | $ | 1,187 | |
Earnings per share | | | | | | | | | | | | | | | | |
Basic | | $ | 3.04 | | $ | 2.85 | | $ | 2.80 | | $ | 2.25 | | $ | 1.65 | |
Diluted | | $ | 2.95 | | $ | 2.77 | | $ | 2.70 | | $ | 2.18 | | $ | 1.62 | |
Dividends declared per share | | $ | 1.375 | | $ | 1.025 | | $ | 0.800 | | $ | 0.525 | | $ | 0.440 | |
Cash from operations | | $ | 4,069 | | $ | 3,633 | | $ | 3,410 | | $ | 3,216 | | $ | 1,933 | |
Capital expenditures | | $ | 3,312 | | $ | 2,480 | | $ | 1,977 | | $ | 3,586 | | $ | 2,516 | |
Dividends paid | | $ | 990 | | $ | 803 | | $ | 566 | | $ | 400 | | $ | 292 | |
| | | | | | | | | | | | | | | | |
Other Operating Data(a) | | | | | | | | | | | | | | | | |
Available lower berth days | | | 54,132,927 | | | 49,945,184 | | | 47,754,627 | | | 44,009,061 | | | 33,309,785 | |
Passengers carried (in thousands) | | | 7,672 | | | 7,008 | | | 6,848 | | | 6,306 | | | 5,038 | |
Occupancy percentages(b) | | | 105.6 | % | | 106.0 | % | | 105.6 | % | | 104.5 | % | | 103.4 | % |
Fuel cost per metric ton | | $ | 361 | | $ | 334 | | $ | 259 | | $ | 194 | | $ | 179 | |
|
| | As of November 30, |
| |
| |
| | 2007 | | 2006 | | 2005 | | 2004 | | 2003 | |
| |
| |
| |
| |
| |
| |
| | (in millions, except percentages) | |
Balance Sheet and Other Data(a) | | | | | | | | | | | | | | | | |
Total assets | | $ | 34,181 | | $ | 30,552 | | $ | 28,349 | | $ | 27,548 | | $ | 24,450 | |
Total debt | | $ | 8,852 | | $ | 7,847 | | $ | 7,352 | | $ | 7,953 | | $ | 7,404 | |
Total shareholders’ equity | | $ | 19,963 | | $ | 18,210 | | $ | 16,883 | | $ | 15,672 | | $ | 13,752 | |
Total debt to capital(c) | | | 30.7 | % | | 30.1 | % | | 30.3 | % | | 33.7 | % | | 35.0 | % |
EBITDA (d) | | $ | 3,825 | | $ | 3,593 | | $ | 3,528 | | $ | 2,935 | | $ | 1,969 | |
| |
(a) | Includes the results of Carnival plc since April 17, 2003. Accordingly, the information for 2003 is not comparable to other periods. In addition, the 2006 net income was reduced by $57 million of share-based compensation expense related to the expensing of stock options and RSUs as a result of our adoption of SFAS No. 123(R) in 2006 (see Note2). |
| |
(b) | In accordance with cruise industry practice, occupancy percentage is calculated using a denominator of two passengers per cabin even though some cabins can accommodate three or more passengers. The percentages in excess of 100% indicate that more than two passengers occupied some cabins. |
| |
(c) | Percentage of total debt to the sum of total debt and shareholders’ equity. |
| |
(d) | Net income plus interest, taxes, depreciation and amortization. |
Market Price for Common Stock and Ordinary Shares
Carnival Corporation’s common stock, together with paired trust shares of beneficial interest in the P&O Princess Special Voting Trust (which holds a Special Voting Share of Carnival plc) is traded on the NYSE under the symbol “CCL.” Carnival plc’s ordinary shares trade on the London Stock Exchange under the symbol “CCL.” Carnival plc’s American Depository Shares (“ADSs”), each one of which represents one Carnival plc ordinary share, are traded on the NYSE under the symbol “CUK.” The depository for the ADSs is JPMorgan Chase Bank. The high and low stock sales price for the periods indicated was as follows:
F-42
| | | | | | | | | | | | | | | | | | | |
| | Carnival Corporation | | Carnival plc | |
| |
| |
| |
| | | | | | | | Price per Ordinary
Share (GBP) | | Price per ADS (USD) | |
| | | | | | | |
| |
| |
| | High | | Low | | High | | Low | | High | | Low | |
| |
| |
| |
| |
| |
| |
| |
Fiscal 2007 | | | | | | | | | | | | | | | | | | | |
Fourth Quarter | | $ | 52.10 | | $ | 42.06 | | £ | 25.00 | | £ | 19.83 | | $ | 50.65 | | $ | 40.92 | |
Third Quarter | | $ | 51.85 | | $ | 41.70 | | £ | 26.51 | | £ | 20.32 | | $ | 52.68 | | $ | 40.73 | |
Second Quarter | | $ | 50.77 | | $ | 44.39 | | £ | 26.74 | | £ | 23.53 | | $ | 52.16 | | $ | 45.66 | |
First Quarter | | $ | 52.73 | | $ | 45.75 | | £ | 28.40 | | £ | 23.50 | | $ | 55.45 | | $ | 47.20 | |
| | | | | | | | | | | | | | | | | | | |
Fiscal 2006 | | | | | | | | | | | | | | | | | | | |
Fourth Quarter | | $ | 50.99 | | $ | 41.63 | | £ | 26.68 | | £ | 22.21 | | $ | 50.78 | | $ | 42.65 | |
Third Quarter | | $ | 42.14 | | $ | 36.40 | | £ | 23.34 | | £ | 19.62 | | $ | 43.49 | | $ | 37.00 | |
Second Quarter | | $ | 52.16 | | $ | 39.36 | | £ | 31.57 | | £ | 21.02 | | $ | 55.64 | | $ | 40.01 | |
First Quarter | | $ | 56.14 | | $ | 50.81 | | £ | 34.16 | | £ | 30.85 | | $ | 59.47 | | $ | 54.40 | |
As of January 22, 2008, there were 3,690 holders of record of Carnival Corporation common stock and 42,342 holders of record of Carnival plc ordinary shares and 97 holders of record of Carnival plc ADSs. The past performance of our stock prices cannot be relied on as a guide to their future performance.
All dividends for both Carnival Corporation and Carnival plc are declared in U.S. dollars. Holders of Carnival Corporation common stock and Carnival plc ADSs receive a dividend payable in U.S. dollars. The dividends payable for Carnival plc ordinary shares are payable in Sterling, unless the shareholders elect to receive the dividends in U.S. dollars. Dividends payable in Sterling will be converted from U.S. dollars into Sterling at the U.S. dollar/Sterling exchange rate quoted by the Bank of England in London at 12:00 p.m. on the next combined U.S. and UK business day that follows the quarter end.
Stock Performance Graphs
Carnival Corporation
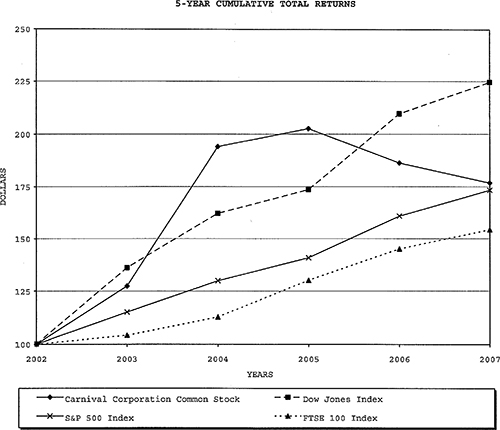
The following graph compares the Price Performance of $100 if invested in Carnival Corporation common stock with the Price Performance of $100 if invested in each of the S&P 500 Index, the Dow Jones U.S. Travel and Leisure Index (the “Dow Jones Index”) and the FTSE 100 Index. The Price Performance, as used in the Performance Graph, is calculated by assuming $100 is invested at the beginning of the period in Carnival Corporation common stock at a price equal to the market value. At the end of each fiscal year the total value of the investment is computed by taking the number of shares owned, assuming Carnival Corporation dividends are reinvested on an annual basis, multiplied by the market price of the shares at the end of each fiscal year.
F-43
| | | | | | | | | | | | | | | | | | | |
| | Assumes $100 Invested on December 1, 2002
Assumes Dividends Reinvested
Years Ended November 30, | |
| | | | | | | | | | | | | | | | | | | |
| | 2002 | | 2003 | | 2004 | | 2005 | | 2006 | | 2007 | |
| |
| |
| |
| |
| |
| |
| |
| | | | | | | | | | | | | | | | | | | |
Carnival Corporation Common Stock | | $ | 100 | | $ | 127 | | $ | 194 | | $ | 203 | | $ | 186 | | $ | 177 | |
Dow Jones Index | | $ | 100 | | $ | 136 | | $ | 162 | | $ | 174 | | $ | 210 | | $ | 225 | |
S&P 500 Index | | $ | 100 | | $ | 115 | | $ | 130 | | $ | 141 | | $ | 161 | | $ | 173 | |
FTSE 100 Index | | $ | 100 | | $ | 104 | | $ | 113 | | $ | 130 | | $ | 145 | | $ | 154 | |
Carnival plc
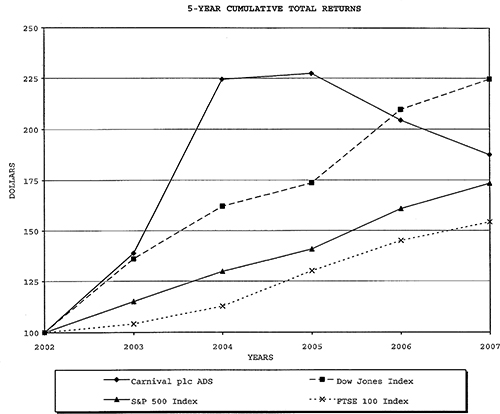
The following graph compares the Price Performance of $100 invested in Carnival plc ADSs, each representing one ordinary share of Carnival plc (prior to April 17, 2003 each ADS represented four ordinary shares of Carnival plc), with the Price Performance of $100 invested in each of the indexes noted below. The Price Performance is calculated in a similar manner as noted above.
F-44
| | | | | | | | | | | | | | | | | | | |
| | Assumes $100 Invested on December 1, 2002
Assumes Dividends Reinvested
Years Ended November 30, | |
| | | | | | | | | | | | | | | | | | | |
| | 2002 | | 2003 | | 2004 | | 2005 | | 2006 | | 2007 | |
| |
| |
| |
| |
| |
| |
| |
| | | | | | | | | | | | | | | | | | | |
Carnival plc ADS | | $ | 100 | | $ | 139 | | $ | 224 | | $ | 227 | | $ | 204 | | $ | 187 | |
Dow Jones Index | | $ | 100 | | $ | 136 | | $ | 162 | | $ | 174 | | $ | 210 | | $ | 225 | |
S&P 500 Index | | $ | 100 | | $ | 115 | | $ | 130 | | $ | 141 | | $ | 161 | | $ | 173 | |
FTSE 100 Index | | $ | 100 | | $ | 104 | | $ | 113 | | $ | 130 | | $ | 145 | | $ | 154 | |
Selected Quarterly Financial Data(Unaudited)
Our revenues from the sale of passenger tickets are seasonal. Historically, demand for cruises has been greatest during our third fiscal quarter, which includes the Northern Hemisphere summer months, and holidays. This higher demand during the third quarter results in higher net revenue yields and, accordingly, the largest share of our net income is earned during this period. The seasonality of our results is increased due to ships being taken out of service for maintenance, which we typically schedule during non-peak demand periods. Substantially all of Holland America Tours’ and Princess Tours’ revenues and net income are generated from May through September in conjunction with the Alaska cruise season.
F-45
Quarterly financial results for fiscal 2007 were as follows:
| | | | | | | | | | | | | | | | | | | |
| | Quarters Ended | |
| |
| |
| | February 28 | | May 31 | | August 31 | | November 30 | |
| |
| |
| |
| |
| |
| | (in millions, except per share data) | |
| | | | | | | | | | | | | |
Revenues | | | $ | 2,688 | | | $ | 2,900 | | | $ | 4,321 | | | | $ | 3,124 | | |
Operating income | | | $ | 353 | | | $ | 459 | | | $ | 1,490 | | | | $ | 423 | | |
Net income | | | $ | 283 | | | $ | 390 | | | $ | 1,377 | | | | $ | 358 | | |
Earnings per share | | | | | | | | | | | | | | | | | | | |
Basic | | | $ | 0.36 | | | $ | 0.49 | | | $ | 1.73 | | | | $ | 0.45 | | |
Diluted | | | $ | 0.35 | | | $ | 0.48 | | | $ | 1.67 | | | | $ | 0.44 | | |
Dividends declared per share | | | $ | 0.35 | | | $ | 0.35 | | | $ | 0.35 | | | | $ | 0.40 | | |
| | | | | | | | | | | | | | | | | | | |
Quarterly financial results for fiscal 2006 were as follows: |
| | | | | | | | | | | | | | | | | | | |
| | Quarters Ended | |
| |
| |
| | February 28 | | May 31 | | August 31 | | November 30 | |
| |
| |
| |
| |
| |
| | (in millions, except per share data) | |
| | | | | | | | | | | | | | | | | | | |
Revenues | | | $ | 2,463 | | | $ | 2,662 | | | $ | 3,905 | | | | $ | 2,809 | | |
Operating income | | | $ | 349 | | | $ | 448 | | | $ | 1,340 | | | | $ | 476 | | |
Net income | | | $ | 251 | | | $ | 380 | | | $ | 1,232 | | | | $ | 416 | | |
Earnings per share | | | | | | | | | | | | | | | | | | | |
Basic | | | $ | 0.31 | | | $ | 0.47 | | | $ | 1.55 | | | | $ | 0.53 | | |
Diluted | | | $ | 0.31 | | | $ | 0.46 | | | $ | 1.49 | | | | $ | 0.51 | | |
Dividends declared per share | | | $ | 0.25 | | | $ | 0.25 | | | $ | 0.25 | | | | $ | 0.275 | | |
F-46