Exhibit (c)(2)
DECEMBER 16, 2007
PROJECT WOLF
Presentation to the Special Committee of the Board of Directors of Waste Industries
STRICTLY PRIVATE AND CONFIDENTIAL
This presentation was prepared exclusively for the benefit and internal use of the JPMorgan client to whom it is directly addressed and delivered (including such client’s subsidiaries, the “Company”) in order to assist the Company in evaluating, on a preliminary basis, the feasibility of a possible transaction or transactions and does not carry any right of publication or disclosure, in whole or in part, to any other party. This presentation is for discussion purposes only and is incomplete without reference to, and should be viewed solely in conjunction with, the oral briefing provided by JPMorgan. Neither this presentation nor any of its contents may be disclosed or used for any other purpose without the prior written consent of JPMorgan.
The information in this presentation is based upon any management forecasts supplied to us and reflects prevailing conditions and our views as of this date, all of which are accordingly subject to change. JPMorgan’s opinions and estimates constitute JPMorgan’s judgment and should be regarded as indicative, preliminary and for illustrative purposes only. In preparing this presentation, we have relied upon and assumed, without independent verification, the accuracy and completeness of all information available from public sources or which was provided to us by or on behalf of the Company or which was otherwise reviewed by us. In addition, our analyses are not and do not purport to be appraisals of the assets, stock, or business of the Company or any other entity. JPMorgan makes no representations as to the actual value which may be received in connection with a transaction nor the legal, tax or accounting effects of consummating a transaction. Unless expressly contemplated hereby, the information in this presentation does not take into account the effects of a possible transaction or transactions involving an actual or potential change of control, which may have significant valuation and other effects.
Notwithstanding anything herein to the contrary, the Company and each of its employees, representatives or other agents may disclose to any and all persons, without limitation of any kind, the U.S. federal and state income tax treatment and the U.S. federal and state income tax structure of the transactions contemplated hereby and all materials of any kind (including opinions or other tax analyses) that are provided to the Company relating to such tax treatment and tax structure insofar as such treatment and/or structure relates to a U.S. federal or state income tax strategy provided to the Company by JPMorgan.
JPMorgan’s policies prohibit employees from offering, directly or indirectly, a favorable research rating or specific price target, or offering to change a rating or price target, to a subject company as consideration or inducement for the receipt of business or for compensation. JPMorgan also prohibits its research analysts from being compensated for involvement in investment banking transactions except to the extent that such participation is intended to benefit investors.
IRS Circular 230 Disclosure: JPMorgan Chase & Co. and its affiliates do not provide tax advice. Accordingly, any discussion of U.S. tax matters included herein (including any attachments) is not intended or written to be used, and cannot be used, in connection with the promotion, marketing or recommendation by anyone not affiliated with JPMorgan Chase & Co. of any of the matters addressed herein or for the purpose of avoiding U.S. tax-related penalties.
JPMorgan is a marketing name for investment banking businesses of JPMorgan Chase & Co. and its subsidiaries worldwide. Securities, syndicated loan arranging, financial advisory and other investment banking activities are performed by a combination of J.P. Morgan Securities Inc., J.P. Morgan plc, J.P. Morgan Securities Ltd. and the appropriately licensed subsidiaries of JPMorgan Chase & Co. in Asia-Pacific, and lending, derivatives and other commercial banking activities are performed by JPMorgan Chase Bank, N.A. JPMorgan deal team members may be employees of any of the foregoing entities.
PROJECT WOLF
Agenda
Page
Situation overview 1
Valuation analysis 6
Appendix 18
PROJECT WOLF
1 |
|
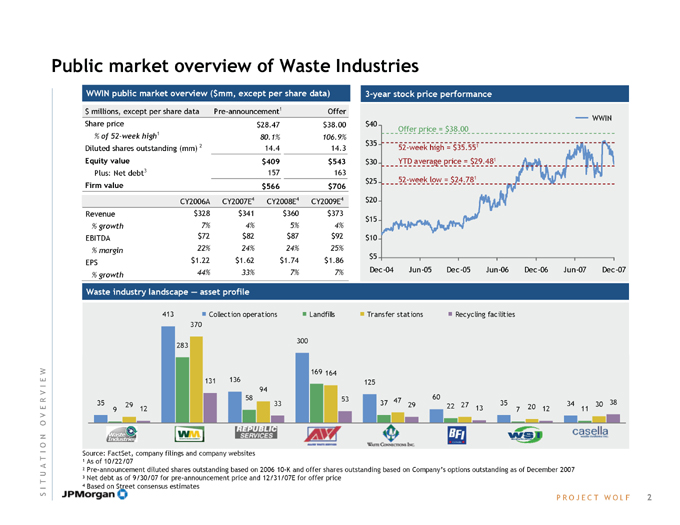
Public market overview of Waste Industries
WWIN public market overview ($mm, except per share data) $ millions, except per share data Pre-announcement1 Offer Share price $28.47 $38.00
% of 52-week high1 80.1% 106.9%
Diluted shares outstanding (mm) 2 14.4 14.3
Equity value $409 $543
Plus: Net debt3 157 163
Firm value $566 $706
CY2006A CY2007E4 CY2008E4 CY2009E4 Revenue $328 $341 $360 $373
% growth 7% 4% 5% 4%
EBITDA $72 $82 $87 $92
% margin 22% 24% 24% 25%
EPS $1.22 $1.62 $1.74 $1.86
% growth 44% 33% 7% 7%
3-year stock price performance
WWIN $40 Offer price = $38.00 $35 52-week high = $35.551
$30 YTD average price = $29.481
$25 52-week low = $24.781 $20 $15 $10
$5
Dec-04 Jun-05 Dec-05 Jun-06 Dec-06 Jun-07 Dec-07
Waste industry landscape — asset profile
Collection operations Landfills Transfer stations Recycling facilities
35
9 29 12
413
370
283
131 136
94 58 33
300
169 164
125
53 47 60
37 29 27 35 34 30 38
22 13 7 20 12 11
Source: FactSet, company filings and company websites
1 |
| As of 10/22/07 |
2 Pre-announcement diluted shares outstanding based on 2006 10-K and offer shares outstanding based on Company’s options outstanding as of December 2007
3 |
| Net debt as of 9/30/07 for pre-announcement price and 12/31/07E for offer price |
4 |
| Based on Street consensus estimates |
PROJECT WOLF
2 |
|
SITUATION OVERVIEW
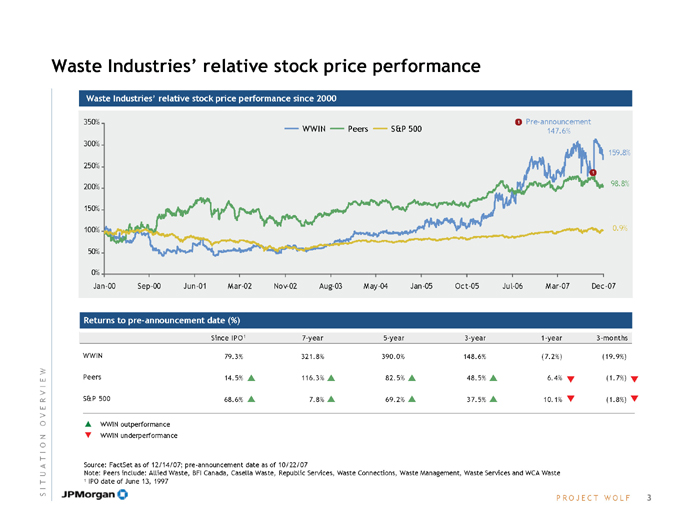
Waste Industries’ relative stock price performance
Waste Industries’ relative stock price performance since 2000
WWIN Peers S&P 500
1 Pre-announcement 147.6% 350% 159.8% 98.8% 0.9%
300%
250%
200%
150%
100%
50%
0%
Jan-00 Sep-00 Jun-01 M ar-02 Nov-02 Aug-03 May-04 Jan-05 Oct-05 Jul-06 Mar-07 Dec-07
Returns to pre-announcement date (%)
Since IPO1 7-year 5-year 3-year 1-year 3-months
WWIN 79.3% 321.8% 390.0% 148.6% (7.2%) (19.9%)
Peers 14.5% ? 116.3% ? 82.5% ? 48.5% ? 6.4% ?? (1.7%) ??S&P 500 68.6% ? 7.8% ? 69.2% ? 37.5% ? 10.1% ?? (1.8%) ?
? WWIN outperformance ? WWIN underperformance
Source: FactSet as of 12/14/07; pre-announcement date as of 10/22/07
Note: Peers include: Allied Waste, BFI Canada, Casella Waste, Republic Services, Waste Connections, Waste Management, Waste Services and WCA Waste
1 |
| IPO date of June 13, 1997 |
PROJECT WOLF
3 |
|
SITUATION OVERVIEW
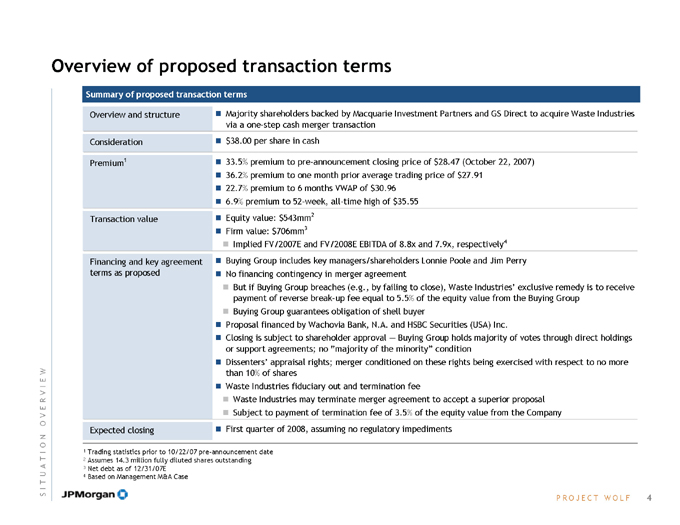
Overview of proposed transaction terms
Summary of proposed transaction terms
Overview and structure Majority shareholders backed by Macquarie Investment Partners and GS Direct to acquire Waste Industries
via a one-step cash merger transaction
Consideration $38.00 per share in cash
Premium1 33.5% premium to pre-announcement closing price of $28.47 (October 22, 2007)
36.2% premium to one month prior average trading price of $ 27.91
22.7% premium to 6 months VWAP of $ 30.96
6.9% premium to 52-week, all-time high of $ 35.55
Transaction value Equity value: $543mm2
Firm value: $706mm3
Implied FV/2007E and FV/2008E EBITDA of 8.8x and 7.9x, respectively4
Financing and key agreement Buying Group includes key managers/shareholders Lonnie Poole and Jim Perry
terms as proposed No financing contingency in merger agreement
But if Buying Group breaches (e.g., by failing to close), Waste Industries’ exclusive remedy is to receive payment of reverse break-up fee equal to 5.5% of the equity value from the Buying Group
Buying Group guarantees obligation of shell buyer
Proposal financed by Wachovia Bank, N.A. and HSBC Securities (USA) Inc.
Closing is subject to shareholder approval Buying Group holds majority of votes through direct holdings or support agreements; no “majority of the minority” condition
Dissenters’ appraisal rights; merger conditioned on these rights being exercised with respect to no more than 10% of shares
Waste Industries fiduciary out and termination fee
Waste Industries may terminate merger agreement to accept a superior proposal
Subject to payment of termination fee of 3.5% of the equity value from the Company
Expected closing First quarter of 2008, assuming no regulatory impediments
1 |
| Trading statistics prior to 10/22/07 pre-announcement date |
2 |
| Assumes 14.3 million fully diluted shares outstanding |
3 |
| Net debt as of 12/31/07E |
4 |
| Based on Management M&A Case |
PROJECT WOLF
4 |
|
SITUATION OVERVIEW
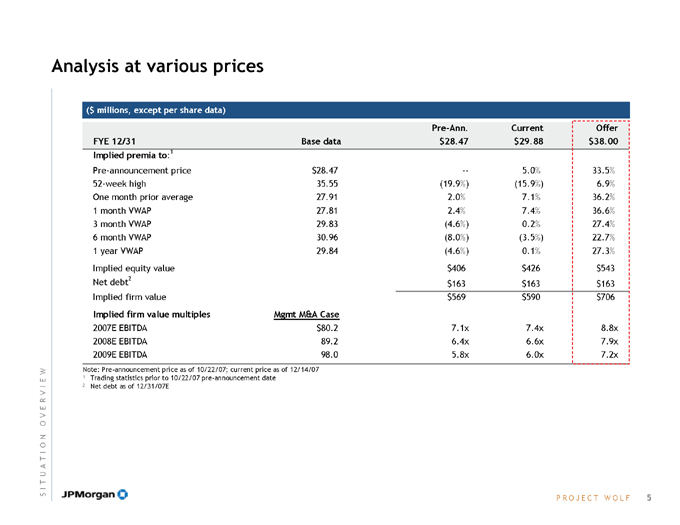
Analysis at various prices
($ millions, except per share data)
Pre-Ann. Current Offer
FYE 12/31 Base data $ 28.47 $ 29.88 $ 38.00
Implied premia to:1
Pre-announcement price $ 28.47 — 5.0% 33.5%
52-week high 35.55 (19.9%) (15.9%) 6.9%
One month prior average 27.91 2.0% 7.1% 36.2%
1 |
| month VWAP 27.81 2.4% 7.4% 36.6% |
3 |
| month VWAP 29.83 (4.6%) 0.2% 27.4% |
6 |
| month VWAP 30.96 (8.0%) (3.5%) 22.7% |
1 |
| year VWAP 29.84 (4.6%) 0.1% 27.3% |
Implied equity value $ 406 $ 426 $ 543
Net debt2 $ 163 $ 163 $ 163
Implied firm value $ 569 $ 590 $ 706
Implied firm value multiples Mgmt M&A Case
2007E EBITDA $80.2 7.1x 7.4x 8.8x
2008E EBITDA 89.2 6.4x 6.6x 7.9x
2009E EBITDA 98.0 5.8x 6.0x 7.2x
Note: Pre-announcement price as of 10/22/07; current price as of 12/14/07
1 |
| Trading statistics prior to 10/22/07 pre-announcement date |
2 |
| Net debt as of 12/31/07E |
SITUATION OVERVIEW
PROJECT WOLF
5 |
|
Agenda
Page
Situation overview 1
Valuation analysis 6
Appendix 18
PROJECT WOLF
6 |
|
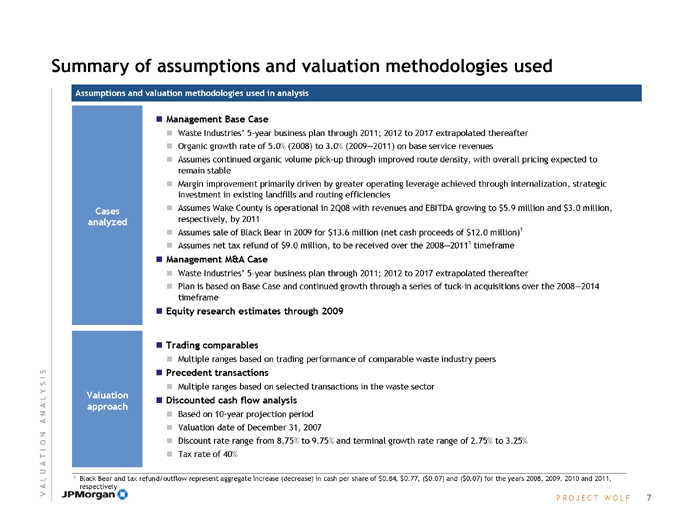
Summary of assumptions and valuation methodologies used
Assumptions and valuation methodologies used in analysis
Cases analyzed
Valuation approach
? Management Base Case
? Waste Industries’ 5-year business plan through 2011; 2012 to 2017 extrapolated thereafter
? Organic growth rate of 5.0% (2008) to 3.0% (2009—2011) on base service revenues
? Assumes continued organic volume pick-up through improved route density, with overall pricing expected to remain stable
? Margin improvement primarily driven by greater operating leverage achieved through internalization, strategic investment in existing landfills and routing efficiencies
? Assumes Wake County is operational in 2Q08 with revenues and EBITDA growing to $5.9 million and $3.0 million, respectively, by 2011
? Assumes sale of Black Bear in 2009 for $13.6 million (net cash proceeds of $12.0 million)1
? Assumes net tax refund of $9.0 million, to be received over the 2008—20111 timeframe
? Management M&A Case
? Waste Industries’ 5-year business plan through 2011; 2012 to 2017 extrapolated thereafter
? Plan is based on Base Case and continued growth through a series of tuck-in acquisitions over the 2008—2014 timeframe
? Equity research estimates through 2009
? Trading comparables
? Multiple ranges based on trading performance of comparable waste industry peers
? Precedent transactions
? Multiple ranges based on selected transactions in the waste sector
? Discounted cash flow analysis
? Based on 10-year projection period
? Valuation date of December 31, 2007
? Discount rate range from 8.75% to 9.75% and terminal growth rate range of 2.75% to 3.25%
? Tax rate of 40%
1 Black Bear and tax refund/outflow represent aggregate increase (decrease) in cash per share of $0.84, $0.77, ($0.07) and ($0.07) for the years 2008, 2009, 2010 and 2011, respectively
PROJECT WOLF
7 |
|
VALUATION ANALYSIS
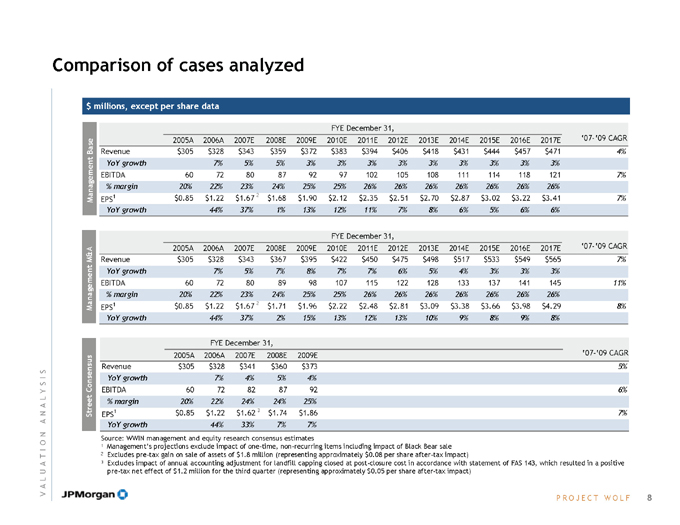
Comparison of cases analyzed $ millions, except per share data
Management Base
FYE December 31,
2005A 2006A 2007E 2008E 2009E 2010E 2011E 2012E 2013E 2014E 2015E 2016E 2017E ‘07-’09 CAGR Revenue $305 $328 $343 $359 $372 $383 $394 $406 $418 $431 $444 $457 $471 4% YoY growth 7% 5% 5% 3% 3% 3% 3% 3% 3% 3% 3% 3%
EBITDA 60 72 80 87 92 97 102 105 108 111 114 118 121 7% % margin 20% 22% 23% 24% 25% 25% 26% 26% 26% 26% 26% 26% 26%
EPS1 $0.85 $1.22 $1.67 2 $1.68 $1.90 $2.12 $2.35 $2.51 $2.70 $2.87 $3.02 $3.22 $3.41 7% YoY growth 44% 37% 1% 13% 12% 11% 7% 8% 6% 5% 6% 6%
Management M&A
FYE December 31,
2005A 2006A 2007E 2008E 2009E 2010E 2011E 2012E 2013E 2014E 2015E 2016E 2017E ‘07-’09 CAGR Revenue $305 $328 $343 $367 $395 $422 $450 $475 $498 $517 $533 $549 $565 7% YoY growth 7% 5% 7% 8% 7% 7% 6% 5% 4% 3% 3% 3%
EBITDA 60 72 80 89 98 107 115 122 128 133 137 141 145 11% % margin 20% 22% 23% 24% 25% 25% 26% 26% 26% 26% 26% 26% 26%
EPS1 $0.85 $1.22 $1.67 2 $1.71 $1.96 $2.22 $2.48 $2.81 $3.09 $3.38 $3.66 $3.98 $4.29 8% YoY growth 44% 37% 2% 15% 13% 12% 13% 10% 9% 8% 9% 8%
Street Consensus
FYE December 31,
2005A 2006A 2007E 2008E 2009E ‘07-’09 CAGR Revenue $305 $328 $341 $360 $373 5% YoY growth 7% 4% 5% 4%
EBITDA 60 72 82 87 92 6% % margin 20% 22% 24% 24% 25%
EPS1 $0.85 $1.22 $1.62 3 $1.74 $1.86 7% YoY growth 44% 33% 7% 7%
Source: WWIN management and equity research consensus estimates
1 |
| Management’s projections exclude impact of one-time, non-recurring items including impact of Black Bear sale |
2 Excludes pre-tax gain on sale of assets of $1.8 million (representing approximately $0.08 per share after-tax impact)
3 Excludes impact of annual accounting adjustment for landfill capping closed at post-closure cost in accordance with statement of FAS 143, which resulted in a positive pre-tax net effect of $1.2 million for the third quarter (representing approximately $0.05 per share after-tax impact)
PROJECT WOLF
8 |
|
VALUATION ANALYSIS
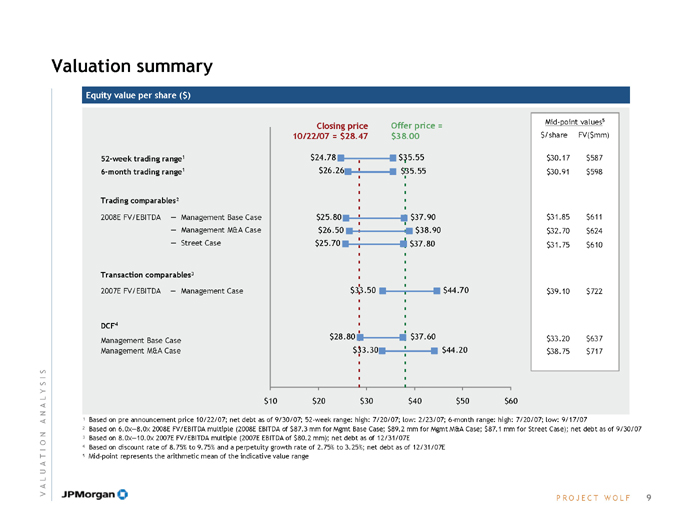
Valuation summary
Equity value per share ($)
Closing price Offer price = Mid-point values5 10/22/07 = $28.47 $38.00 $/share FV($mm)
52-week trading range1 $24.78 $35.55 $30.17 $587 6-month trading range1 $26.26 $35.55 $30.91 $598
Trading comparables²
2008E FV/EBITDA — Management Base Case $25.80 $37.90 $31.85 $611
— Management M&A Case $26.50 $38.90 $32.70 $624
— Street Case $25.70 $37.80 $31.75 $610
Transaction comparables³
2007E FV/EBITDA — Management Case $33.50 $44.70 $39.10 $722
DCF4 $28.80 $37.60 $33.20 $637 Management Base Case Management M&A Case $33.30 $44.20 $38.75 $717
$10 $ 20 $30 $40 $50 $60
1 Based on pre announcement price 10/22/07; net debt as of 9/30/07; 52-week range: high: 7/20/07; low: 2/23/07; 6-month range: high: 7/20/07; low: 9/17/07
2 Based on 6.0x—8.0x 2008E FV/EBITDA multiple (2008E EBITDA of $87.3 mm for Mgmt Base Case; $89.2 mm for Mgmt M&A Case; $87.1 mm for Street Case); net debt as of 9/30/07
3 |
| Based on 8.0x—10.0x 2007E FV/EBITDA multiple (2007E EBITDA of $80.2 mm); net debt as of 12/31/07E |
4 |
| Based on discount rate of 8.75% to 9.75% and a perpetuity growth rate of 2.75% to 3.25%; net debt as of 12/31/07E |
5 |
| Mid-point represents the arithmetic mean of the indicative value range |
VALUATION ANALYSIS
PROJECT WOLF
9
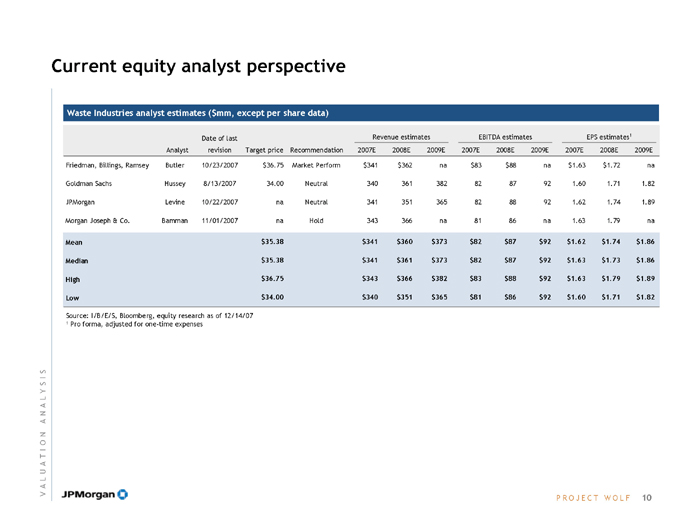
Current equity analyst perspective
Waste Industries analyst estimates ($mm, except per share data)
Revenue estimates EBITDA estimates EPS estimates1
Analyst Date of last revision Target price Recommendation 2007E 2008E 2009E 2007E 2008E 2009E 2007E 2008E 2009E
Friedman, Billings, Ramsey Butler 10/23/2007 $36.75 Market Perform $341 $362 na $83 $88 na $1.63 $1.72 na Goldman Sachs Hussey 8/13/2007 34.00 Neutral 340 361 382 82 87 92 1.60 1.71 1.82 JPMorgan Levine 10/22/2007 na Neutral 341 351 365 82 88 92 1.62 1.74 1.89 Morgan Joseph & Co. Bamman 11/01/2007 na Hold 343 366 na 81 86 na 1.63 1.79 na
Mean $35.38 $341 $360 $373 $82 $87 $92 $1.62 $1.74 $1.86 Median $35.38 $341 $361 $373 $82 $87 $92 $1.63 $1.73 $1.86 High $36.75 $343 $366 $382 $83 $88 $92 $1.63 $1.79 $1.89 Low $34.00 $340 $351 $365 $81 $86 $92 $1.60 $1.71 $1.82
Source: I/B/E/S, Bloomberg, equity research as of 12/14/07
1 |
| Pro forma, adjusted for one-time expenses |
VALUATION ANALYSIS
PROJECT WOLF
10
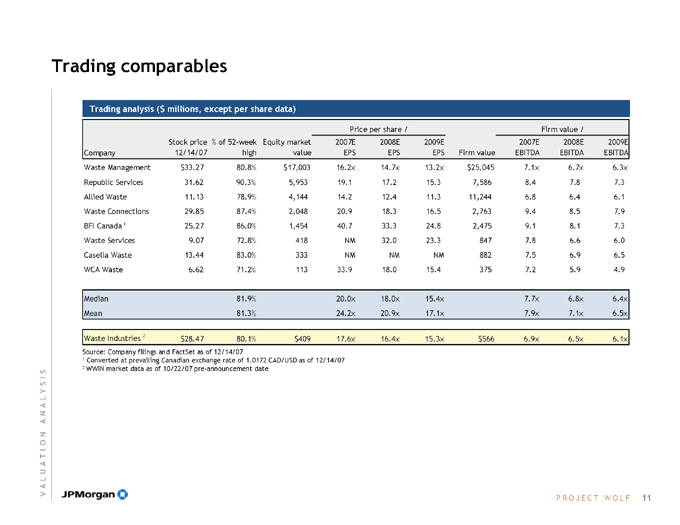
Trading comparables
Trading analysis ($ millions, except per share data)
Price per share / Firm value /
Company Stock price 12/14/07 % of 52-week high Equity market value 2007E EPS 2008E EPS 2009E EPS Firm value 2007E EBITDA 2008E EBITDA 2009E EBITDA
Waste Management $33.27 80.8% $17,003 16.2x 14.7x 13.2x $25,045 7.1x 6.7x 6.3x Republic Services 31.62 90.3% 5,953 19.1 17.2 15.3 7,586 8.4 7.8 7.3 Allied Waste 11.13 78.9% 4,144 14.2 12.4 11.3 11,244 6.8 6.4 6.1 Waste Connections 29.85 87.4% 2,048 20.9 18.3 16.5 2,763 9.4 8.5 7.9 BFI Canada 1 25.27 86.0% 1,454 40.7 33.3 24.8 2,475 9.1 8.1 7.3 Waste Services 9.07 72.8% 418 NM 32.0 23.3 847 7.8 6.6 6.0 Casella Waste 13.44 83.0% 333 NM NM NM 882 7.5 6.9 6.5 WCA Waste 6.62 71.2% 113 33.9 18.0 15.4 375 7.2 5.9 4.9
Median 81.9% 20.0x 18.0x 15.4x 7.7x 6.8x 6.4x Mean 81.3% 24.2x 20.9x 17.1x 7.9x 7.1x 6.5x
Waste Industries 2 $28.47 80.1% $409 17.6x 16.4x 15.3x $566 6.9x 6.5x 6.1x
Source: Company filings and FactSet as of 12/14/07
1 |
| Converted at prevailing Canadian exchange rate of 1.0172 CAD/USD as of 12/14/07 |
2 |
| WWIN market data as of 10/22/07 pre-announcement date |
VALUATION ANALYSIS
PROJECT WOLF
11
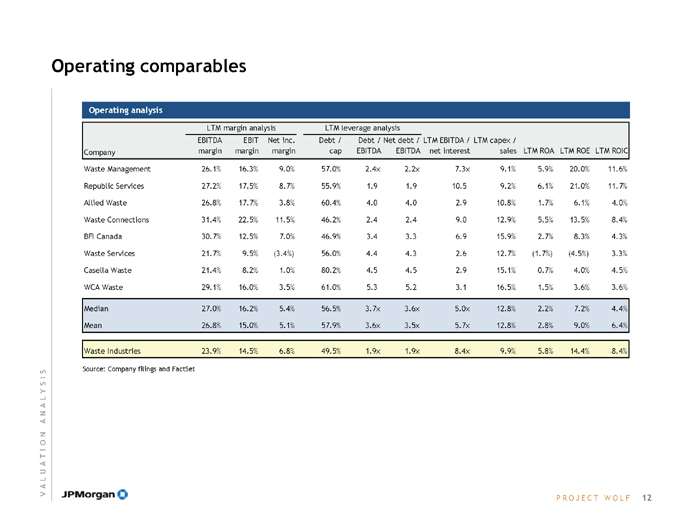
Operating comparables
Operating analysis
LTM margin analysis LTM leverage analysis
Company EBITDA margin EBIT margin Net inc. margin Debt / cap Debt / EBITDA Net debt / EBITDA LTM EBITDA / net interest LTM capex / sales LTM ROA LTM ROE LTM ROIC
Waste Management 26.1% 16.3% 9.0% 57.0% 2.4x 2.2x 7.3x 9.1% 5.9% 20.0% 11.6% Republic Services 27.2% 17.5% 8.7% 55.9% 1.9 1.9 10.5 9.2% 6.1% 21.0% 11.7% Allied Waste 26.8% 17.7% 3.8% 60.4% 4.0 4.0 2.9 10.8% 1.7% 6.1% 4.0% Waste Connections 31.4% 22.5% 11.5% 46.2% 2.4 2.4 9.0 12.9% 5.5% 13.5% 8.4% BFI Canada 30.7% 12.5% 7.0% 46.9% 3.4 3.3 6.9 15.9% 2.7% 8.3% 4.3% Waste Services 21.7% 9.5% (3.4%) 56.0% 4.4 4.3 2.6 12.7% (1.7%) (4.5%) 3.3% Casella Waste 21.4% 8.2% 1.0% 80.2% 4.5 4.5 2.9 15.1% 0.7% 4.0% 4.5% WCA Waste 29.1% 16.0% 3.5% 61.0% 5.3 5.2 3.1 16.5% 1.5% 3.6% 3.6% Median 27.0% 16.2% 5.4% 56.5% 3.7x 3.6x 5.0x 12.8% 2.2% 7.2% 4.4% Mean 26.8% 15.0% 5.1% 57.9% 3.6x 3.5x 5.7x 12.8% 2.8% 9.0% 6.4%
Waste Industries 23.9% 14.5% 6.8% 49.5% 1.9x 1.9x 8.4x 9.9% 5.8% 14.4% 8.4%
Source: Company filings and FactSet
VALUATION ANALYSIS
PROJECT WOLF
12
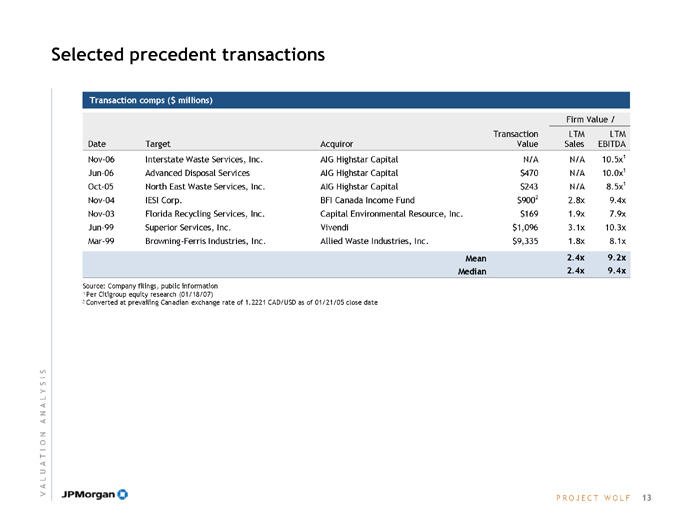
Selected precedent transactions
Transaction comps ($ millions)
Firm Value /
Date Target Acquiror Transaction Value LTM Sales LTM EBITDA
Nov-06 Interstate Waste Services, Inc. AIG Highstar Capital N/A N/A 10.5x1
Jun-06 Advanced Disposal Services AIG Highstar Capital $ 470 N/A 10.0x1
Oct-05 North East Waste Services, Inc. AIG Highstar Capital $ 243 N/A 8.5x1
Nov-04 IESI Corp. BFI Canada Income Fund $ 9002 2.8x 9.4x
Nov-03 Florida Recycling Services, Inc. Capital Environmental Resource, Inc. $ 169 1.9x 7.9x
Jun-99 Superior Services, Inc. Vivendi $ 1,096 3.1x 10.3x
Mar-99 Browning-Ferris Industries, Inc. Allied Waste Industries, Inc. $ 9,335 1.8x 8.1x
Mean 2.4x 9.2x
Median 2.4x 9.4x
Source: Company filings, public information
1 |
| Per Citigroup equity research (01/18/07) |
2 |
| Converted at prevailing Canadian exchange rate of 1.2221 CAD/USD as of 01/21/05 close date |
VALUATION ANALYSIS
PROJECT WOLF
13
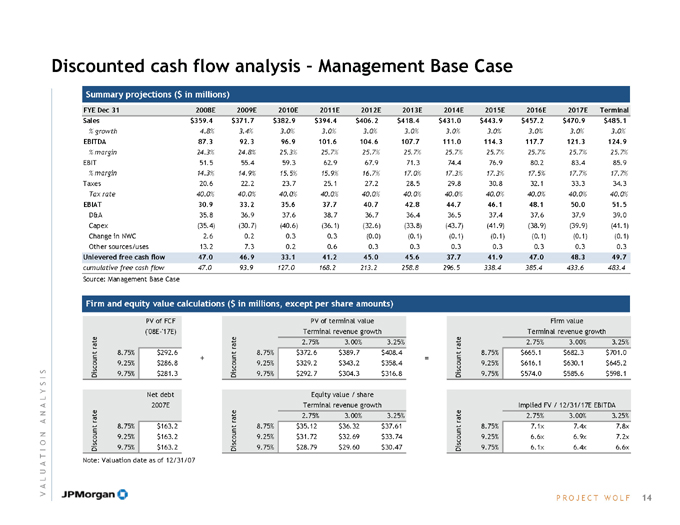
Discounted cash flow analysis – Management Base Case
Summary projections ($ in millions)
FYE Dec 31 2008E 2009E 2010E 2011E 2012E 2013E 2014E 2015E 2016E 2017E Terminal Sales $359.4 $371.7 $382.9 $394.4 $406.2 $418.4 $431.0 $443.9 $457.2 $470.9 $485.1
% growth 4.8% 3.4% 3.0% 3.0% 3.0% 3.0% 3.0% 3.0% 3.0% 3.0% 3.0%
EBITDA 87.3 92.3 96.9 101.6 104.6 107.7 111.0 114.3 117.7 121.3 124.9
% margin 24.3% 24.8% 25.3% 25.7% 25.7% 25.7% 25.7% 25.7% 25.7% 25.7% 25.7%
EBIT 51.5 55.4 59.3 62.9 67.9 71.3 74.4 76.9 80.2 83.4 85.9
% margin 14.3% 14.9% 15.5% 15.9% 16.7% 17.0% 17.3% 17.3% 17.5% 17.7% 17.7%
Taxes 20.6 22.2 23.7 25.1 27.2 28.5 29.8 30.8 32.1 33.3 34.3
Tax rate 40.0% 40.0% 40.0% 40.0% 40.0% 40.0% 40.0% 40.0% 40.0% 40.0% 40.0%
EBIAT 30.9 33.2 35.6 37.7 40.7 42.8 44.7 46.1 48.1 50.0 51.5
D&A 35.8 36.9 37.6 38.7 36.7 36.4 36.5 37.4 37.6 37.9 39.0 Capex (35.4) (30.7) (40.6) (36.1) (32.6) (33.8) (43.7) (41.9) (38.9) (39.9) (41.1) Change in NWC 2.6 0.2 0.3 0.3 (0.0) (0.1) (0.1) (0.1) (0.1) (0.1) (0.1) Other sources/uses 13.2 7.3 0.2 0.6 0.3 0.3 0.3 0.3 0.3 0.3 0.3
Unlevered free cash flow 47.0 46.9 33.1 41.2 45.0 45.6 37.7 41.9 47.0 48.3 49.7 cumulative free cash flow 47.0 93.9 127.0 168.2 213.2 258.8 296.5 338.4 385.4 433.6 483.4
Source: Management Base Case
Firm and equity value calculations ($ in millions, except per share amounts)
PV of FCF (‘08E-’17E) rate 8.75% $292.6 Discount 9.25% $286.8 9.75% $281.3
Net debt 2007E rate 8.75% $163.2 Discount 9.25% $163.2 9.75% $163.2 Note: Valuation date as of 12/31/07
Discount rate +
PV of terminal value Terminal revenue growth
2.75% 3.00% 3.25% 8.75% $372.6 $389.7 $408.4 9.25% $329.2 $343.2 $358.4 9.75% $292.7 $304.3 $316.8
=
Discount rate
8.75% 9.25% 9.75%
Firm value Terminal revenue growth
2.75% 3.00% 3.25% $665.1 $682.3 $701.0 $616.1 $630.1 $645.2 $574.0 $585.6 $598.1
Discount rate
Equity value / share Terminal revenue growth
2.75% 3.00% 3.25% 8.75% $35.12 $36.32 $37.61 9.25% $31.72 $32.69 $33.74 9.75% $28.79 $29.60 $30.47
Discount rate
8.75% 9.25% 9.75%
Implied FV / 12/31/17E EBITDA
2.75% 3.00% 3.25% 7.1x 7.4x 7.8x 6.6x 6.9x 7.2x 6.1x 6.4x 6.6x
VALUATION ANALYSIS
PROJECT WOLF
14

Discounted cash flow analysis – Management M&A Case
Summary projections ($ in millions)
FYE Dec 31 2008E 2009E 2010E 2011E 2012E 2013E 2014E 2015E 2016E 2017E Terminal Sales $367.0 $394.6 $421.7 $449.5 $475.2 $498.0 $517.4 $532.9 $548.9 $565.4 $582.3
% growth 7.0% 7.5% 6.9% 6.6% 5.7% 4.8% 3.9% 3.0% 3.0% 3.0% 3.0%
EBITDA 89.2 98.0 106.6 115.3 121.9 127.8 132.7 136.7 140.8 145.1 149.4
% margin 24.3% 24.8% 25.3% 25.7% 25.7% 25.7% 25.7% 25.7% 25.7% 25.7% 25.7%
EBIT 52.4 58.0 63.7 69.1 76.5 81.9 87.5 92.6 98.5 104.3 107.4
% margin 14.3% 14.7% 15.1% 15.4% 16.1% 16.5% 16.9% 17.4% 18.0% 18.4% 18.4%
Taxes 20.9 23.2 25.5 27.7 30.6 32.8 35.0 37.1 39.4 41.7 43.0
Tax rate 40.0% 40.0% 40.0% 40.0% 40.0% 40.0% 40.0% 40.0% 40.0% 40.0% 40.0%
EBIAT 31.4 34.8 38.2 41.5 45.9 49.2 52.5 55.6 59.1 62.6 64.5
D&A 36.8 40.0 42.9 46.2 45.4 45.8 45.3 44.1 42.3 40.8 42.0 Capex—incl acquisitions (44.8) (49.5) (59.3) (54.8) (47.0) (44.0) (49.8) (43.8) (41.3) (42.9) (44.2) Change in NWC 1.7 (0.7) (0.6) (0.7) (0.3) (0.3) (0.2) (0.2) (0.2) (0.2) (0.2) Other sources/uses 13.2 7.3 0.2 0.6 0.5 0.4 0.4 0.3 0.3 0.3 0.3
Unlevered free cash flow 38.3 31.9 21.4 32.8 44.5 51.1 48.1 56.0 60.2 60.6 62.4 cumulative free cash flow 38.3 70.2 91.6 124.4 168.9 220.0 268.1 324.1 384.3 444.8 507.2
Source: Management M&A Case
Firm and equity value calculations ($ in millions, except per share amounts)
Discount rate
PV of FCF (‘08E-’17E)
8.75% $283.9 9.25% $277.5 9.75% $271.3
+
Discount rate
PV of terminal value Terminal revenue growth
2.75% 3.00% 3.25% 8.75% $467.4 $488.9 $512.4 9.25% $413.1 $430.6 $449.7 9.75% $367.3 $381.8 $397.4
=
Discount rate
Firm value Terminal revenue growth
2.75% 3.00% 3.25% 8.75% $751.3 $772.9 $796.3 9.25% $690.6 $708.1 $727.2 9.75% $638.6 $653.1 $668.8
Discount rate
Net debt 2007E
8.75% $163.2 9.25% $163.2 9.75% $163.2
Discount rate
8.75% 9.25% 9.75%
Equity value / share Terminal revenue growth
2.75% 3.00% 3.25% $41.12 $42.61 $44.24 $36.89 $38.11 $39.44 $33.28 $34.29 $35.38
Discount rate
8.75% 9.25% 9.75%
Implied FV / 12/31/17E EBITDA
2.75% 3.00% 3.25% 7.5x 7.8x 8.2x 6.9x 7.2x 7.5x 6.4x 6.7x 6.9x
VALUATION ANALYSIS
PROJECT WOLF
15
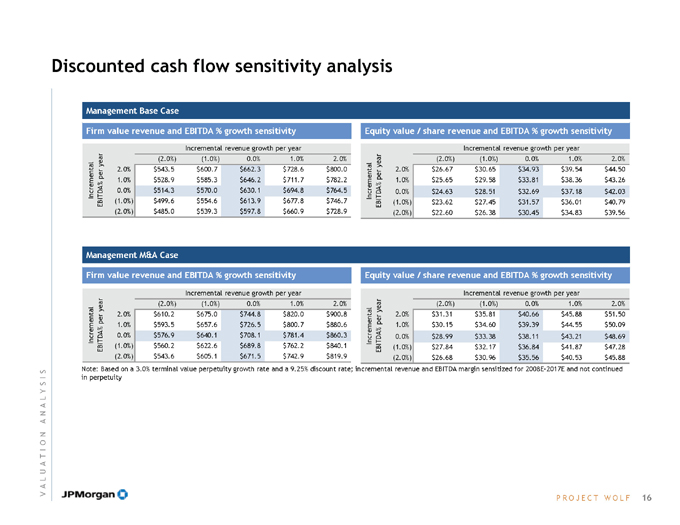
Discounted cash flow sensitivity analysis
Management Base Case
Firm value revenue and EBITDA % growth sensitivity
Incremental EBITDA% per year
Incremental revenue growth per year
(2.0%) (1.0%) 0.0% 1.0% 2.0% 2.0% $543.5 $600.7 $662.3 $728.6 $800.0 1.0% $528.9 $585.3 $646.2 $711.7 $782.2 0.0% $514.3 $570.0 $630.1 $694.8 $764.5 (1.0%) $499.6 $554.6 $613.9 $677.8 $746.7 (2.0%) $485.0 $539.3 $597.8 $660.9 $728.9
Equity value / share revenue and EBITDA % growth sensitivity
Incremental EBITDA% per year
Incremental revenue growth per year
(2.0%) (1.0%) 0.0% 1.0% 2.0% 2.0% $26.67 $30.65 $34.93 $39.54 $44.50 1.0% $25.65 $29.58 $33.81 $38.36 $43.26 0.0% $24.63 $28.51 $32.69 $37.18 $42.03 (1.0%) $23.62 $27.45 $31.57 $36.01 $40.79 (2.0%) $22.60 $26.38 $30.45 $34.83 $39.56
Management M&A Case
Firm value revenue and EBITDA % growth sensitivity
Equity value / share revenue and EBITDA % growth sensitivity
Incremental EBITDA% per year
Incremental revenue growth per year
(2.0%) (1.0%) 0.0% 1.0% 2.0% 2.0% $610.2 $675.0 $744.8 $820.0 $900.8 1.0% $593.5 $657.6 $726.5 $800.7 $880.6 0.0% $576.9 $640.1 $708.1 $781.4 $860.3 (1.0%) $560.2 $622.6 $689.8 $762.2 $840.1 (2.0%) $543.6 $605.1 $671.5 $742.9 $819.9
Incremental EBITDA% per year
Incremental revenue growth per year
(2.0%) (1.0%) 0.0% 1.0% 2.0% 2.0% $31.31 $35.81 $40.66 $45.88 $51.50 1.0% $30.15 $34.60 $39.39 $44.55 $50.09 0.0% $28.99 $33.38 $38.11 $43.21 $48.69 (1.0%) $27.84 $32.17 $36.84 $41.87 $47.28 (2.0%) $26.68 $30.96 $35.56 $40.53 $45.88
Note: Based on a 3.0% terminal value perpetuity growth rate and a 9.25% discount rate; incremental revenue and EBITDA margin sensitized for 2008E–2017E and not continued in perpetuity
VALUATION ANALYSIS
PROJECT WOLF
16
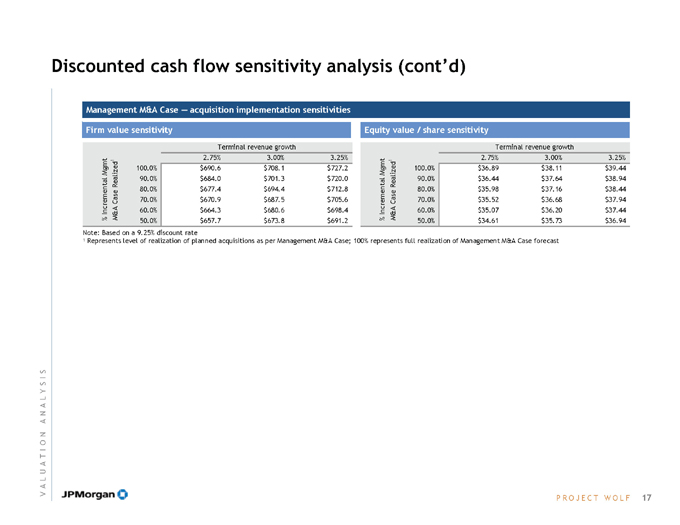
Discounted cash flow sensitivity analysis (cont’d)
Management M&A Case — acquisition implementation sensitivities
Firm value sensitivity
% Incremental Mgmt M&A Case Realized1
Terminal revenue growth
2.75% 3.00% 3.25% 100.0% $690.6 $708.1 $727.2 90.0% $684.0 $701.3 $720.0 80.0% $677.4 $694.4 $712.8 70.0% $670.9 $687.5 $705.6 60.0% $664.3 $680.6 $698.4 50.0% $657.7 $673.8 $691.2
Equity value / share sensitivity
% Incremental Mgmt M&A Case Realized1
Terminal revenue growth
2.75% 3.00% 3.25% 100.0% $36.89 $38.11 $39.44 90.0% $36.44 $37.64 $38.94 80.0% $35.98 $37.16 $38.44 70.0% $35.52 $36.68 $37.94 60.0% $35.07 $36.20 $37.44 50.0% $34.61 $35.73 $36.94
Note: Based on a 9.25% discount rate
1 Represents level of realization of planned acquisitions as per Management M&A Case; 100% represents full realization of Management M&A Case forecast
VALUATION ANALYSIS
PROJECT WOLF
17
Agenda
Page
Situation overview 1
Valuation analysis 6
Appendix 18
PROJECT WOLF
18
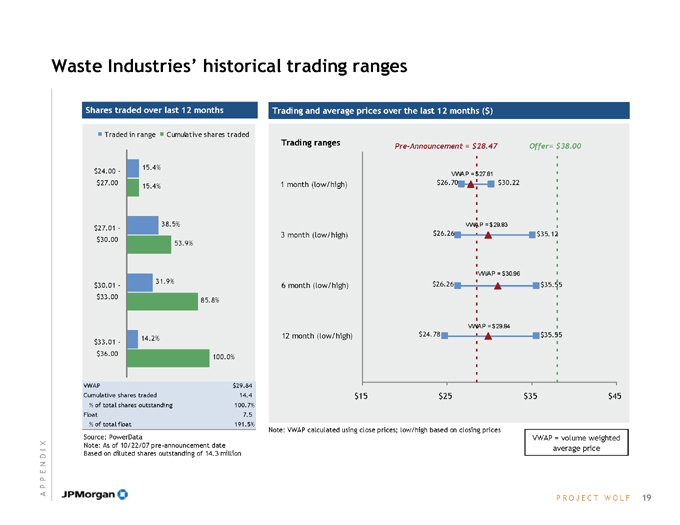
Waste Industries’ historical trading ranges
Shares traded over last 12 months
Traded in range Cumulative shares traded
15.4% $24.00 -$27.00 15.4%
38.5% $27.01 -$30.00 53.9%
31.9% $30.01 -$33.00 85.8%
14.2% $33.01 -$36.00 100.0% Source: PowerData
VWAP $29.84 Cumulative shares traded 14.4 % of total shares outstanding 100.7% Float 7.5 % of total float 191.5%
Note: As of 10/22/07 pre-announcement date Based on diluted shares outstanding of 14.3 million
Trading and average prices over the last 12 months ($)
Trading ranges Pre-Announcement = $28.47 Offer= $38.00
VWAP = $27.81
1 |
| month (low/high) $26.70 $30.22 |
VWAP = $29.83
3 |
| month (low/high) $26.26 $35.12 |
VWAP = $30.96
6 |
| month (low/high) $26.26 $35.55 |
VWAP = $29.84
12 month (low/high) $24.78 $35.55
$15$ 25 $35 $45
Note: VWAP calculated using close prices; low/high based on closing prices
VWAP = volume weighted average price
APPENDIX
PROJECT WOLF
19
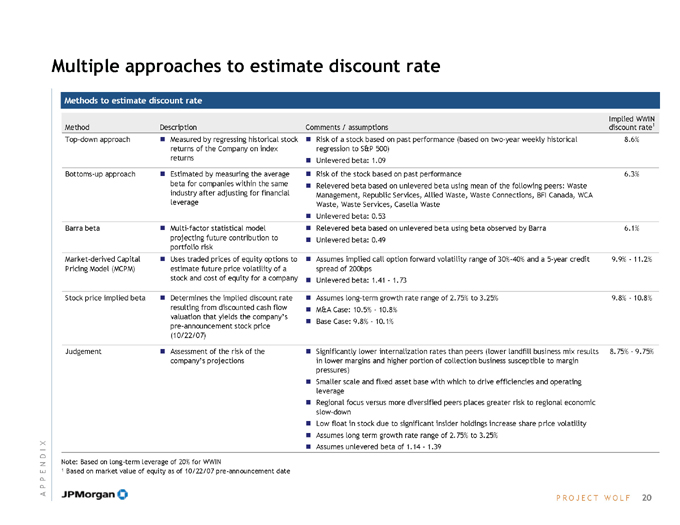
Multiple approaches to estimate discount rate
Methods to estimate discount rate
Implied WWIN
Method Description Comments / assumptions discount rate1
Top-down approach Measured by regressing historical stock returns of the Company on index Risk of a stock based on past performance (based on two-year weekly historical regression to S&P 500) 8.6%
returns Unlevered beta: 1.09
Bottoms-up approach Estimated by measuring the average beta for companies within the same industry after adjusting for financial leverage Risk of the stock based on past performance 6.3%
Relevered beta based on unlevered beta using mean of the following peers: Waste Management, Republic Services, Allied Waste, Waste Connections, BFI Canada, WCA Waste, Waste Services, Casella Waste
Unlevered beta: 0.53
Barra beta Multi-factor statistical model projecting future contribution to portfolio risk Relevered beta based on unlevered beta using beta observed by Barra 6.1%
Unlevered beta: 0.49
Market-derived Capital Uses traded prices of equity options to estimate future price volatility of a stock and cost of equity for a company Assumes implied call option forward volatility range of 30%-40% and a 5-year credit spread of 200bps 9.9%—11.2%
Pricing Model (MCPM)
Unlevered beta: 1.41 1.73
Stock price implied beta Determines the implied discount rate resulting from discounted cash flow valuation that yields the company’s pre-announcement stock price (10/22/07) Assumes long-term growth rate range of 2.75% to 3.25% 9.8%—10.8%
M&A Case: 10.5%—10.8%
Base Case: 9.8%—10.1%
Judgement Assessment of the risk of the Significantly lower internalization rates than peers (lower landfill business mix results in lower margins and higher portion of collection business susceptible to margin pressures) 8.75%—9.75%
company’s projections
Smaller scale and fixed asset base with which to drive efficiencies and operating leverage
Regional focus versus more diversified peers places greater risk to regional economic slow-down
Low float in stock due to significant insider holdings increase share price volatility
Assumes long term growth rate range of 2.75% to 3.25%
Assumes unlevered beta of 1.14 1.39
Note: Based on long-term leverage of 20% for WWIN
¹ Based on market value of equity as of 10/22/07 pre-announcement date
APPENDIX
PROJECT WOLF
20
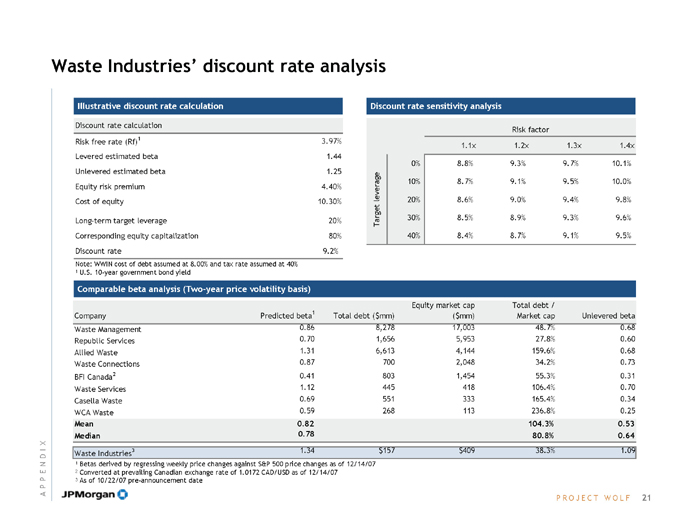
Waste Industries’ discount rate analysis
Illustrative discount rate calculation
Discount rate calculation
Risk free rate (Rf)1 3.97% Levered estimated beta 1.44 Unlevered estimated beta 1.25 Equity risk premium 4.40% Cost of equity 10.30%
Long-term target leverage 20% Corresponding equity capitalization 80% Discount rate 9.2%
Note: WWIN cost of debt assumed at 8.00% and tax rate assumed at 40%
1 |
| U.S. 10-year government bond yield |
Discount rate sensitivity analysis
Target leverage
Risk factor
1.1x 1.2x 1.3x 1.4x
0% 8.8% 9.3% 9.7% 10.1% 10% 8.7% 9.1% 9.5% 10.0% 20% 8.6% 9.0% 9.4% 9.8% 30% 8.5% 8.9% 9.3% 9.6% 40% 8.4% 8.7% 9.1% 9.5%
Comparable beta analysis (Two-year price volatility basis)
Equity market cap Total debt /
Company Predicted beta1 Total debt ($mm) ($mm) Market cap Unlevered beta Waste Management 0.86 8,278 17,003 48.7% 0.68 Republic Services 0.70 1,656 5,953 27.8% 0.60 Allied Waste 1.31 6,613 4,144 159.6% 0.68 Waste Connections 0.87 700 2,048 34.2% 0.73 BFI Canada2 0.41 803 1,454 55.3% 0.31 Waste Services 1.12 445 418 106.4% 0.70 Casella Waste 0.69 551 333 165.4% 0.34 WCA Waste 0.59 268 113 236.8% 0.25
Mean 0.82 104.3% 0.53 Median 0.78 80.8% 0.64
Waste Industries3 1.34 $157 $409 38.3% 1.09
1 |
| Betas derived by regressing weekly price changes against S&P 500 price changes as of 12/14/07 |
2 |
| Converted at prevailing Canadian exchange rate of 1.0172 CAD/USD as of 12/14/07 |
3 |
| As of 10/22/07 pre-announcement date |
APPENDIX
PROJECT WOLF
21
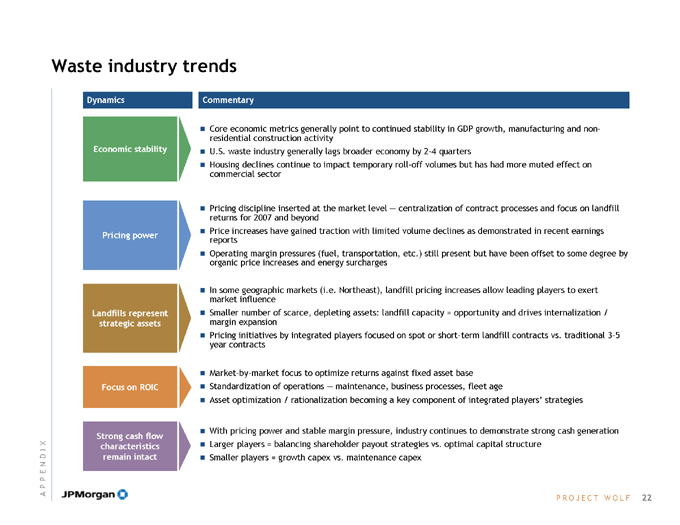
Waste industry trends
Dynamics Commentary
Economic stability
Pricing power
Landfills represent strategic assets
Focus on ROIC
Strong cash flow characteristics remain intact
? Core economic metrics generally point to continued stability in GDP growth, manufacturing and non-residential construction activity
? U.S. waste industry generally lags broader economy by 2-4 quarters
? Housing declines continue to impact temporary roll-off volumes but has had more muted effect on commercial sector
? Pricing discipline inserted at the market level — centralization of contract processes and focus on landfill returns for 2007 and beyond
? Price increases have gained traction with limited volume declines as demonstrated in recent earnings reports
? Operating margin pressures (fuel, transportation, etc.) still present but have been offset to some degree by organic price increases and energy surcharges
? In some geographic markets (i.e. Northeast), landfill pricing increases allow leading players to exert market influence
? Smaller number of scarce, depleting assets: landfill capacity = opportunity and drives internalization / margin expansion
? Pricing initiatives by integrated players focused on spot or short-term landfill contracts vs. traditional 3-5 year contracts
? Market-by-market focus to optimize returns against fixed asset base
? Standardization of operations — maintenance, business processes, fleet age
? Asset optimization / rationalization becoming a key component of integrated players’ strategies
? With pricing power and stable margin pressure, industry continues to demonstrate strong cash generation
? Larger players = balancing shareholder payout strategies vs. optimal capital structure
? Smaller players = growth capex vs. maintenance capex
APPENDIX
PROJECT WOLF
22