UNITED STATES
SECURITIES AND EXCHANGE COMMISSION
WASHINGTON, D. C. 20549
FORM 10-K
(Mark One)
| x | ANNUAL REPORT PURSUANT TO SECTION 13 OR 15(d) OF THE SECURITIES EXCHANGE ACT OF 1934 |
For the fiscal year ended December 31, 2007
OR
| ¨ | TRANSITION REPORT PURSUANT TO SECTION 13 OR 15(d) OF THE SECURITIES EXCHANGE ACT OF 1934 |
For the transition period from to
Commission file number 0-31050
WASTE INDUSTRIES USA, INC.
(Exact name of registrant as specified in its charter)
| | |
| NORTH CAROLINA | | 56-0954929 |
(State or other jurisdiction of incorporation or organization) | | (I.R.S. Employer Identification No.) |
3301 BENSON DRIVE, SUITE 601
RALEIGH, NORTH CAROLINA 27609
(Address of principal executive offices) (Zip Code)
REGISTRANT’S TELEPHONE NUMBER, INCLUDING AREA CODE: (919) 325-3000
SECURITIES REGISTERED PURSUANT TO SECTION 12(b) OF THE ACT:
| | |
Title of Each Class | | Name of Exchange on which Registered |
| Common Stock, No Par Value | | Nasdaq Global Select Market |
SECURITIES REGISTERED PURSUANT TO SECTION 12(g) OF THE ACT: None
Indicate by check mark if the registrant is a well-known seasoned issuer, as defined in Rule 405 of the Securities Act. Yes ¨ No x
Indicate by check mark if the registrant is not required to file reports pursuant to Section 13 or Section 15(d) of the Act. Yes ¨ No x
Indicate by check mark whether the registrant (1) has filed all reports required to be filed by Section 13 or 15(d) of the Securities Exchange Act of 1934 during the preceding 12 months (or for such shorter period that the registrant was required to file such reports), and (2) has been subject to such filing requirements for the past 90 days. Yes x No ¨
Indicate by check mark if disclosure of delinquent filers pursuant to Item 405 of Regulation S-K is not contained herein, and will not be contained, to the best of registrant’s knowledge, in definitive proxy or information statements incorporated by reference in Part III of this Form 10-K or any amendment to this Form 10-K. ¨
Indicate by check mark whether the registrant is a large accelerated filer, an accelerated filer, a non-accelerated filer, or a smaller reporting company. See definitions of large accelerated filer, accelerated filer and smaller reporting company in Rule 12b-2 of the Exchange Act.
Large accelerated filer ¨ Accelerated filer x Non accelerated filer ¨ Smaller reporting company ¨
Indicate by check mark whether the registrant is a shell company (as defined in Rule 12b-2 of the Act). Yes ¨ No x
The aggregate market value of the voting stock held by non-affiliates of the registrant based upon the closing price of the common stock on February 29, 2008, on the NASDAQ Global Select Market was approximately $244,563,535 as of such date. Shares of common stock held by each executive officer and director and by each person who owns 10% or more of the outstanding common stock have been excluded in that such persons may be deemed to be affiliates. This determination of affiliate status may not be conclusive for other purposes.
As of March 14, 2008, the registrant had outstanding 14,168,559 shares of common stock.
DOCUMENTS INCORPORATED BY REFERENCE
Certain information omitted from Part III of this report will be incorporated by reference into Part III by an amendment on
Form 10-K/A or a definitive proxy statement for a 2008 Annual Meeting of Shareholders to be filed with the Securities and Exchange Commission within 120 days after the close of the fiscal year covered by this report.
NOTE RELATING TO FORWARD-LOOKING STATEMENTS
Statements in this Annual Report on Form 10-K that are not descriptions of historical facts are forward-looking statements that are subject to risks and uncertainties. These statements and other statements made elsewhere by us or our representatives, which are identified or qualified by words such as “likely,” “will,” “suggests,” “expects,” “may,” “believe,” “could,” “should,” “would,” “anticipates,” “plans” or similar expressions, are based on a number of assumptions. Actual events or results could differ materially from those currently anticipated due to a number of factors, including those set forth herein and in our other SEC filings and including, in particular: fuel prices, general economic conditions, the regulation, development and operation of landfills, our ability to manage growth, the availability and integration of acquisition targets, regulatory permitting processes, the cost of complying with the Sarbanes-Oxley Act, impairment of goodwill, competition, geographic concentration, weather conditions, and government regulation. With regard to the proposed going private transaction pursuant to the executed merger agreement described herein, factors that could cause the merger not to occur or could cause results to otherwise differ from the results expressed or implied by any forward-looking statements regarding the merger include, but are not limited to: the occurrence of any event, change or other circumstances that could give rise to the termination of the merger agreement or the failure of required conditions to close the merger; the outcome of any legal proceedings that have been or may be instituted against us and others as a result of the proposed merger; the inability to obtain shareholder approval or the failure to satisfy other conditions to completion of the merger, including the receipt of certain regulatory approvals; the failure to obtain any contemplated debt or equity financing; risks that the proposed transaction disrupts current plans and operations and the potential difficulties in employee retention as a result of the merger; and the potential impact of current unsettled conditions in the credit markets. You are urged to consider these factors carefully in evaluating the forward-looking statements and are cautioned not to place undue reliance on such forward-looking statements. The forward-looking statements made herein are only made as of the date of this report and we undertake no obligation to publicly update such forward-looking statements to reflect subsequent events or circumstances.
TABLE OF CONTENTS
2
PART I
ITEM 1. BUSINESS
Introduction
Our website address iswww.wasteindustries.com. We make available free of charge through our website our annual report on Form 10-K, quarterly reports on Form 10-Q, current reports on Form 8-K, and all amendments to those reports as soon as reasonably practicable after such material is electronically filed with or furnished to the Securities and Exchange Commission.
Waste Industries USA, Inc. is a regional, vertically integrated solid waste services company. We provide solid waste collection, transfer, disposal and recycling services to commercial, industrial and residential customer locations in North Carolina, South Carolina, Virginia, Tennessee, Mississippi, and Georgia. Our principal operations as of December 31, 2007 consisted of 34 collection operations, 29 transfer stations, approximately 66 county convenience drop-off centers,12 recycling facilities and nine landfills, serving approximately 875,000 municipal, residential, commercial and industrial service locations.
The Chairman of the Board of Directors who founded our company in 1970 and our Chief Executive Officer are recognized for their leadership roles throughout the solid waste management industry and trade organizations. Our management team collectively has over 223 years of experience in the solid waste industry and over 154 years with our company.
Proposed Going Private Transaction
On December 17, 2007, we entered into an agreement and plan of merger with Marlin HoldCo LP, a Delaware limited partnership, and its wholly owned subsidiary, Marlin MergeCo Inc., a North Carolina corporation. Pursuant to the terms of the merger agreement, Marlin MergeCo will merge with and into our company, and, as a result, our company will continue as the surviving corporation and a wholly owned subsidiary of Marlin HoldCo. Marlin HoldCo is owned by an investor group led by Lonnie C. Poole, Jr., our founder and Chairman, and Jim W. Perry, our President and Chief Executive Officer, and financial partners MIP Waste Holdings, L.P., an affiliate of Macquarie Infrastructure Partners, and GS Direct, LLC, an affiliate of Goldman, Sachs & Co., whom we refer to collectively as the Investor Group.
Upon the completion of the merger, we would cease to be a publicly reporting company and would cease all filings under the Securities Exchange Act of 1934, as amended,.
The merger agreement was unanimously approved by the Special Committee of our Board of Directors that was appointed by the Board of Directors to consider this matter. The merger agreement was also approved by our Board of Directors, with Lonnie C. Poole, Jr. and Jim W. Perry abstaining.
At the effective time of the merger, each outstanding share of our common stock, other than a portion of the shares owned by the Investor Group (as discussed in the next paragraph) and by any shareholders who properly exercise dissenters’ rights under North Carolina law, will be cancelled and converted into the right to receive $38.00 in cash, without interest.
A portion of the shares of common stock owned by Lonnie C. Poole, Jr., Jim W. Perry and certain of their family members and affiliates will not receive the cash merger consideration, but will instead be exchanged for equity ownership in HoldCo.
The merger agreement and the transactions contemplated thereby will be submitted to a vote of our shareholders at a special meeting of our shareholders. The members of the Investor Group who hold shares of our common stock, including Mr. Poole and Mr. Perry and their family members and affiliates, have entered into a support agreement with the other members of the Investor Group in which they have agreed to vote their shares in favor of the merger. The vote of the shares subject to the support agreement is sufficient to approve the merger.
The closing of the merger is conditioned upon the approval of our shareholders, certain regulatory approvals, including the expiration of the waiting period under the Hart-Scott-Rodino Antitrust Improvements Act of 1976, which period expired on February 6, 2008, the exercise of dissenters’ rights by holders of not more than 10% of our common stock and other customary closing conditions. The closing of the merger is not conditioned on the receipt of any financing by the Investor Group. The Investor Group has received a commitment from Wachovia Bank, HSBC Securities (USA) and HSBC Bank for up to $455 million in debt financing to finance the transaction.
Pursuant to the merger agreement, we may not solicit other proposals subject to exceptions that permit our Board of Directors (or the Special Committee) to take actions as required by their fiduciary duties to participate in any discussions or negotiations regarding unsolicited alternative business combination transactions
3
The merger agreement contains certain termination rights for HoldCo, including if our Board of Directors (or the Special Committee) changes its recommendation to the shareholders in response to a superior proposal as required by its fiduciary duties under applicable law. The merger agreement also provides that, upon the termination of the merger agreement, under specified circumstances, we will be required to reimburse Marlin HoldCo for its reasonable merger expenses up to $8.75 million and that, under specified circumstances, we will be required to pay Marlin HoldCo a termination fee of approximately $19.0 million. Additionally, under specified circumstances, Marlin HoldCo will be required to pay us a termination fee of approximately $29.9 million. The members of the Investor Group have severally, but not jointly, agreed to guarantee their proportionate liability of any such amounts payable by Marlin HoldCo to us pursuant to a limited guarantee. As of December 31, 2007, we had incurred approximately $1.9 million in professional fees associated with this proposed transaction.
We have made customary representations, warranties and covenants in the merger agreement, which generally expire at the effective time of the merger. Some of these covenants relate to, and limit our discretion to, take certain actions or business decisions without the prior consent of Marlin HoldCo, including, but not limited to:
| | • | | declaring or paying any dividend on shares of our common stock; |
| | • | | purchasing, selling, mortgaging or otherwise disposing of any properties or assets having a value in excess of $5 million in the aggregate; |
| | • | | making any investment or material acquisition of another person or business having a value in excess of $5 million in the aggregate; |
| | • | | making any capital expenditures not contemplated by the capital expenditure budget having an aggregate value in excess of $5 million for any 12 consecutive month period; |
| | • | | incurring, assuming, guaranteeing, or becoming obligated with respect to, any debt, which, when taken together with all our other debt would result in indebtedness greater than $180 million in the aggregate outstanding at any given time (excluding intercompany debt); |
| | • | | entering into, renewing, extending, amending or terminating any contract which if entered into prior to the date of the merger would be a material contract, other than any contract relating to indebtedness that would not be prohibited in the merger agreement, or any contracts not in the ordinary course, involving the commitment or transfer of value in excess of $5 million in the aggregate in any year; or |
| | • | | waiving, releasing, assigning, settling or compromising any claim, action or proceeding, other than waivers, releases, assignments, settlements or compromises that involve only the payment of monetary damages not in excess of $1 million in the aggregate, or otherwise paying, discharging or satisfying any claims, liabilities or obligations in excess of such amount, in each case, other than in the ordinary course consistent with past practice. |
The discussion in this report of our business, operations, strategy, plans, financing and other matters is based on, and assumes, our continued existence as a publicly held company, and is qualified in all respects by the terms of the proposed going private transaction and the limitations imposed by the merger agreement on our ability to take certain actions while the merger is pending. These constraints on our business could significantly impact our operations and business strategy as discussed in this report prior to the consummation of the proposed merger or the termination of the merger agreement.
In addition, if the proposed merger is consummated, our business, operations, strategy, plans, financing and other matters as described in this report will no longer be subject to oversight by our current board of directors and may differ materially from the description of these matters in this report.
The full text of the merger agreement may be found as an exhibit to our Securities Exchange Act filings. Please see Item 15 – “Exhibits and Financial Statement Schedules” for the reference cite to the merger agreement.
Industry Overview
In the last 15 years, the solid waste collection and disposal industry has undergone a period of significant consolidation and integration. We believe that this consolidation and integration has been caused primarily by:
| | • | | increasingly stringent environmental regulation and enforcement resulting in increased capital requirements for collection companies and landfill operators; |
| | • | | the ability of larger integrated operators to achieve certain economies of scale; |
| | • | | the increased integration of collection, transfer, disposal and recycling capabilities; and |
| | • | | the continued privatization of solid waste collection and disposal services by municipalities and other governmental bodies and authorities. |
Despite the considerable consolidation and integration that has occurred in the solid waste industry in recent years, we believe, based on our experience in the industry, that the industry remains primarily regional in nature due to the localized nature of collecting and disposing of waste and highly fragmented due to the many small competitors in many markets.
The increasingly stringent industry regulations, such as the Subtitle D regulations of the Environmental Protection Agency, or EPA, have resulted in rising operating and capital costs and have caused the consolidation and acquisition activities in the solid waste collection and disposal industry in the last 15 years. Many of the smaller industry participants have found these costs difficult to bear and have decided to either close their operations or sell them to larger operators. In addition, Subtitle D requires more stringent engineering of solid waste landfills including liners, leachate collection and monitoring and gas collection and monitoring. These ongoing costs are coupled with increased financial reserves from solid waste landfill operators for closure and post-closure monitoring. As a result, we believe, based on our market research, the number of solid waste landfills is declining while the size of solid waste landfills is increasing.
In many markets in which we operate or intend to expand, competitive pressures are forcing operators to become more efficient by establishing an integrated network of solid waste collection operations and transfer stations, through which they secure solid waste streams for disposal. Operators have adopted a variety of disposal strategies, including owning landfills, establishing strategic relationships to secure access to landfills, or by otherwise capturing significant waste stream volumes to gain leverage in negotiating lower landfill fees and securing long-term contracts with high capacity landfills on most favored pricing terms.
In the Southeastern U.S. solid waste market, which is our market, city and county governments have historically provided a variety of solid waste services using their own personnel. Over time, many municipalities have opted to privatize or contract out their collection and disposal services to the private sector. Landfills, transfer stations and incinerators located in our market area are predominantly municipally owned. The Southeastern market has been and is currently undergoing significant economic and population growth. Several states in the Southeastern U.S. exceed the national average in terms of economic growth as measured by gains in jobs, personal income and population.
There is an increasing trend at the state and local levels to encourage waste reduction at the source and to prohibit the disposal of certain types of wastes, such as yard wastes and recyclable materials, at landfills. For example, North Carolina, South Carolina and Virginia have each established quantifiable goals and time frames to reduce the solid waste disposed of in their respective landfills. We believe, based on our experience in the industry, that these trends and laws have created significant opportunities for solid waste services companies to provide additional recycling services to generators of solid waste who are not otherwise able to dispose of such waste.
4
Strategy
Our objective is to build the premier solid waste services company in the Southeastern U.S. by expanding our operations and capitalizing on our strong market presence. Our strategy for achieving this objective is:
| | • | | to generate internal growth by adding customers and services to our existing operations; |
| | • | | to acquire solid waste collection companies, customers and, under appropriate circumstances, landfills in existing and new areas of our target market; and |
| | • | | to increase operating efficiencies and enhance profitability in our existing and acquired operations. |
We intend to implement this strategy primarily through internal growth supplemented by tuck-in acquisitions in our existing markets. We continue to examine opportunities to expand our presence in new and existing markets in the Southeastern U.S. There can be no assurance that we will be able to identify suitable acquisition candidates or, if identified, successfully negotiate their acquisition. If we fail to implement successfully our acquisition strategy, our growth potential will be limited.
Internal Growth
In order to continue to achieve internal growth, we intend to focus on increasing sales penetration in current and adjacent market areas, marketing upgrades or additional services (such as on-site solid waste compaction) to existing customers and implementing selective price increases. We strive to be the first or second largest provider, in terms of market share, of waste services in the majority of the markets in which we operate. Current levels of population growth and economic development in the Southeastern U.S. and our strong market presence should provide an opportunity for us to increase revenues and market share in our region. As customers are added in existing markets, our density is improved, which should increase our collection efficiencies and profitability. At December 31, 2007, we had an approximately 42-person sales force dedicated to maintaining and increasing our sales to new and existing commercial, industrial, municipal and residential customers.
An important part of our internal growth strategy is to operate transfer stations strategically located throughout our geographic area to improve our consolidation of collected solid waste and permit us to deliver the collected solid waste to landfills where we have negotiated favorable volume rates with landfill operators or to dispose of it at sites we own. At December 31, 2007, we operated 29 transfer stations, 11 of which we own. By operating transfer stations, we engage in direct communication with municipalities that own the transfer stations regarding waste disposal services, better positioning us to gain additional business in our markets in the event any of these municipalities privatize their solid waste operations. To the extent we are unable to operate existing transfer stations owned by municipalities, we would consider constructing our own transfer station.
Expansion Through Acquisitions
Our strategy for growth includes:
| | • | | “tuck-in” and other acquisitions of solid waste collection companies and customers in existing and adjacent markets; |
| | • | | the acquisition of solid waste collection companies and customers in new markets; and |
| | • | | the acquisition of landfills in certain circumstances. |
We seek to acquire companies with a significant market presence, high service standards and an experienced management team willing to remain with our company.
Based on our market research, we believe that numerous “tuck-in” acquisition opportunities exist within our current market area. A “tuck-in” acquisition refers to an acquisition in which we acquire a solid waste collection company, a division of a company or customer routes of a company located in our existing market area, and integrate the acquired operations or customers into the operations of one of our existing branch facilities. These acquisitions have become an integral part of the industry competitive model due to the efficiencies involved. Such acquisitions, if consummated, provide us with opportunities to improve market share and route density.
5
As we enter new markets through acquisitions, we intend to continue to implement a regional expansion strategy. The regional expansion strategy provides us with a base of operations to grow internally through price increases, providing additional services to existing customers, adding new private and public customers as well as tuck-in acquisitions. We can then expand our presence in the targeted region by adding solid waste collection and transfer operations in regional markets adjacent to or contiguous with the new location. Because our goal is to increase the scale of our operations through internal growth and through the acquisition of other solid waste businesses, we might experience periods of rapid growth with significantly increased staffing requirements. Such growth, if it were to occur, could place a significant strain on our management and on our operational, financial and other resources. Our ability to maintain and manage our growth effectively will require us to expand our management information systems capabilities and improve our operational and financial systems and controls. Moreover, we will need to attract, train, motivate, retain and manage our senior managers, technical professionals and other employees. Any failure to expand our management information systems capabilities and our operational and financial systems and controls or to recruit appropriate additional personnel in an efficient manner at a pace consistent with any business growth we may experience would have a material adverse effect on our operations.
The consolidation and integration activity in the solid waste industry, which peaked in the 1990’s, as well as the difficulties, uncertainties and expenses relating to the development and permitting of solid waste landfills and transfer stations, has increased competition for the acquisition of existing solid waste collection, transfer and disposal operations. Increased competition for acquisition candidates as well as less advantageous acquisition terms, including increased purchase prices, might result in fewer acquisition opportunities being available to us. These circumstances might increase acquisition costs to levels beyond our financial capability or pricing parameters. Such circumstances might have an adverse effect on our results of operations. Many of our competitors for acquisitions are larger, better known companies that possess significantly greater resources than we have. We also believe, based on our experience, that a significant factor in our ability to consummate acquisitions will be the relative attractiveness of shares of our common stock as an investment instrument to potential acquisition candidates. This attractiveness will, in large part, be dependent upon the relative market price and capital appreciation prospects of our common stock compared to the equity securities of our competitors.
In the past several years, we have been and expect to continue to be actively engaged in identifying solid waste landfill acquisition candidates in the Southeastern U.S., although the number of candidates is limited in our current market area. Based on our experience in the industry, we believe that the successful acquisition of landfills will provide us with opportunities to integrate vertically our collection, transfer and disposal operations while improving operating margins. Generally, we will evaluate a landfill target by determining, among other things, whether access to the landfill is economically feasible from our existing market areas either directly or through strategically located transfer stations, expected landfill life, the potential for landfill expansion, and current disposal costs compared with the cost to acquire the landfill. In addition, where the acquisition of a landfill site is either not available or not economically feasible, we seek to enter into long-term disposal contracts with facilities that are located in proximity to our market areas.
Acquisition Program
From 1990 through December 31, 2007, we acquired, either by merger or asset purchase, 115 solid waste collection or disposal operations, with nine being acquired in 2007, eight being acquired in 2006 and fourteen being acquired in 2005. We have developed a set of financial, geographic and management criteria designed to assist management in the evaluation of acquisition candidates engaged in solid waste collection and disposal. These criteria evaluate a variety of factors, including, but not limited to:
| | • | | historical and projected financial performance; |
| | • | | internal rate of return, return on assets and return on revenue; |
| | • | | experience and reputation of the candidate’s management and customer service reputation and relationships with the local communities; |
| | • | | composition and size of the candidate’s customer base; |
| | • | | whether the geographic location of the candidate will enhance or expand our market area or ability to attract other acquisition candidates; |
6
| | • | | whether the acquisition will augment or increase our market share or help protect our existing customer base; |
| | • | | any synergies anticipated to be gained by combining the acquisition candidate with our existing operations; and |
| | • | | actual and contingent liabilities of the candidate. |
We have an established integration procedure for newly acquired companies designed to effect a prompt and efficient integration of the acquired business while minimizing disruption to our ongoing business and that of the acquired business. Once a solid waste collection operation is acquired, programs designed to improve collection and disposal routing, equipment maintenance and utilization, employee productivity, operating efficiencies and overall profitability are implemented. To improve an acquired business’ operational productivity, administrative efficiency and profitability, we apply the same benchmarking programs and systems to the acquired business as are employed at our existing operations. We also solicit new commercial, industrial and residential customers in areas within and surrounding the markets served by the acquired collection operations as a means of further improving operating efficiencies and increasing the volumes of solid waste collected by the acquired operation. We typically attempt to retain the acquired company’s management and key employees and consolidate administrative and management information systems through our corporate offices.
Prior to completing an acquisition, we perform extensive environmental, operational, engineering, legal, human resource and financial due diligence. All acquisitions are subject to initial evaluation and approval by our management before being recommended to our Board of Directors. See Note 2 in our Notes to Consolidated Financial Statements for discussion of our acquisition and disposition activity.
Operating Enhancements
We have implemented advanced management information systems, financial controls, shared support services and benchmarking systems designed to improve the productivity, efficiency and profitability of our existing and acquired operations. Each branch facility has on-line real time access to our financial, operating, cost and customer information. This access enables our managers to evaluate continuously our performance record and to establish benchmarks in all phases of our operations. Management utilizes these systems to:
| | • | | improve collection and transportation efficiencies; |
| | • | | enhance equipment and personnel utilization; |
| | • | | reduce equipment acquisition and maintenance costs; |
| | • | | reduce disposal costs by maximizing waste streams directed to lower cost landfills; |
| | • | | monitor and collect customer accounts on a timely basis; and |
| | • | | provide current information to our sales force to ensure properly structured pricing for new customers. |
Through the utilization of our systems and controls, we will continue to manage our landfill disposal costs and to negotiate long-term disposal contracts with Subtitle D landfill operators. In addition, we have developed an extensive network of transfer stations that we use to consolidate waste streams to gain greater leverage in negotiating landfill disposal fees. As of December 31, 2007, 42% of our waste volume was directed through transfer stations owned or operated by us.
Contracts Program
We currently have 258 municipal contracts that represent approximately $98.9 million of revenue on an annualized basis. In most cases, only larger disposal services companies such as us are financially acceptable to the municipality. Historically, in the Southeastern U.S., city and county governments have provided a variety of solid waste services using their own personnel. Over time, many municipalities have opted to privatize or contract out their collection and disposal services to the private sector. Typically, these contracts are competitively bid and have initial terms of one to five years. In bidding for large contracts, our management team draws on its experience in the waste industry and its knowledge of local service areas in existing and target markets. We engage in extensive due diligence using our advanced management information systems and productivity and cost modeling analyses to respond to requests for proposals to provide services. Our regional managers are responsible for managing the
7
relationships with local governmental officials within their respective service area and sales representatives may be assigned specific municipalities for coverage. We may be required to bid for renewal of a contract previously awarded to us, or in certain cases to renegotiate the contract as a result of changed market conditions. While longer-term contracts can provide more consistent cash flow, increases in the cost of fuel and other operating costs during the contract’s term could reduce the contract’s profitability. To minimize this risk, we generally include price increases in our longer-term contracts. However, our ability to pass on price increases is sometimes limited by the terms of our contracts. Long-term solid waste collection contracts typically contain a formula, generally based on a predetermined published price index such as the Consumer Price Index, for automatic adjustment of fees, generally, on an annual basis, to cover increases in some, but not all, operating costs. These fee increases are recognized as revenue when earned (as the service is provided).
During 2007, we net increased our municipal contract base by 4.5% to 258 customers. No single customer of ours accounted for more than 5% of our revenues in 2005, 2006, or 2007. We do not believe that the loss of any single customer would have a material adverse effect on our results of operations.
Services
Commercial, Industrial and Residential Waste Services
We provide commercial and industrial collection and disposal services under one-year to five-year service agreements, typically. Fees are determined by such factors as collection frequency, level of service, route density, the type, volume and weight of the waste collected, the type of equipment and containers furnished, the distance to the disposal or processing facility, the cost of disposal or processing and prices charged in our markets for similar service. Collection of larger volumes associated with commercial and industrial waste streams generally helps improve our operating efficiencies and, through consolidation of these volumes, we generally can negotiate more favorable disposal prices. Our commercial and industrial customers utilize portable containers for storage thereby enabling us to service many customers with fewer collection vehicles. Commercial and industrial collection vehicles normally require one operator. We provide two to eight cubic yard containers to commercial customers and 10 to 42 cubic yard containers to industrial customers. As a part of the services we provide under our waste services contract, we install, for an additional fee, stationary compactors that compact waste prior to collection on the premises of a substantial number of large volume customers. We do not believe that any single commercial or industrial contract is individually material to our results of operations.
Our residential solid waste collection and disposal services are performed either on a subscription basis with individual households, or under contracts with municipalities, homeowners associations, apartment owners or mobile home park operators. Municipal contracts grant us the right to service all or a portion of the residences in a specified community or to provide a central repository for residential waste drop-off. Municipal contracts in our market areas are typically awarded on a competitive bid basis and thereafter on a bid or negotiated basis and usually range in duration from one to five years. Residential contract fees are based primarily on route density, the frequency and level of service, the distance to the disposal or processing facility, the cost of disposal or processing and prices charged in that market for similar service. Municipal collection fees are paid either by the municipalities from tax revenues or through direct service charges to the residents receiving the service. We do not believe that any single municipal or other residential contract is individually material to our results of operations.
Transfer Station Services
The 29 transfer stations we operated at December 31, 2007 receive, compact and transfer solid waste to larger vehicles for transport to landfills. We believe that transfer stations benefit us by:
| | • | | providing access to multiple landfills; |
| | • | | improving utilization of collection personnel and equipment; |
| | • | | concentrating the waste stream to gain leverage in negotiating more favorable disposal rates; and |
| | • | | building relationships with municipalities that can lead to opportunities for additional business in the future. |
Depending on the location, size and local regulatory environment, transfer stations can be constructed for as little as $150,000 for a small rural facility or as much as $1.5 million or more for larger sites. We believe that we have obtained all permits and authorizations necessary to operate our existing transfer stations and that each of our existing transfer stations has been operated in compliance in all material respects with applicable environmental regulations.
8
At December 31, 2007, we owned 11 of the transfer stations we operated, and operate the remaining 18 transfer stations pursuant to operating agreements. We generally receive a fixed monthly operating fee for our services under these agreements, together with a variable fee based upon the number of hauls made by us from the station. At December 31, 2007, approximately 41.8% of waste directed to the transfer stations we operated was delivered by third parties, who pay us a fee based on the tonnage delivered. Control of these third-party waste streams coupled with our waste stream adds to our bargaining power in our negotiations for favorable solid waste disposal rates with landfill operators.
Since 2005, we have outsourced the majority of our transportation services related to transfer station operations. We believe outsourcing these operations reduces capital expenditures, improves maintenance capacity for other core services, reduces ownership costs, such as insurance, fuel, labor and maintenance costs, and improves the aging of our remaining transfer fleet.
Landfills
At December 31, 2007, we owned eight solid waste landfills, and operated, but did not own, one landfill under a life-of-site operating contract. We are responsible for all final capping, closure and post-closure liabilities for these nine landfills. Additionally, in June 2006 we signed an agreement with Wake County, North Carolina to design, construct and operate a solid waste landfill under a 25-year operating agreement. Wake County is the owner of the property and permit and is responsible for all final capping, closure and post-closure liabilities. Wake County is responsible for billing and collecting from customers and pays us an operating fee based on tonnage received at the landfill. The landfill became operational in February 2008. As of December 31, 2007, the costs related to this contract totaled approximately $6.7 million and are included in property, plant, and equipment on our consolidated balance sheets.
Our landfill facilities are designed and operated to meet federal, state and local regulations in all material respects and we believe each of our landfill sites is in compliance with current applicable state and federal Subtitle D regulations in all material respects. None of our landfills are permitted to accept hazardous waste.
Recycling Services
Recycling involves the removal of reusable materials from the waste stream for processing and sale in various applications. Based on our experience in the industry, we believe that recycling will continue to be an important component of local and state solid waste management plans as a result of the public’s increasing environmental awareness and expanding regulations mandating or encouraging waste recycling. We offer commercial, industrial and residential customers recycling for office paper, cardboard, newspaper, aluminum and steel cans, plastic, glass, pallets and yard waste. At December 31, 2007, we operated approximately 66 convenience sites where residents can dispose of recyclables. In 2007, less than 2.0% of our revenues represented recycling services. We do not believe that our recycling services revenue is material, nor do we currently expect this revenue stream to be material to our results from operations, cash flows or capital expenditures in the foreseeable future.
Through a centralized effort, we resell recycled waste products using commercially reasonable practices and seek to manage commodity-pricing risk by spreading the risk among our customers. These commodities are delivered either to third-party processing facilities in exchange for a fee or to one of five facilities operated by us for processing prior to resale. The resale prices of, and demand for, recyclable commodities, particularly wastepaper, can be volatile and subject to changing market conditions.
Convenience Sites and Other Specialized Services
In 1982, we developed the concept of a convenience site in response to increasing volumes of waste dumped randomly in rural areas. Each site typically consists of a ramp for easy disposal access, a trash compactor and trash and recycling containers. Most sites have posted operating hours during which our personnel assist residents with the deposit of waste and recyclables while monitoring the types of waste deposited at the sites. Because these convenience sites reduce the amount of trash dumped along roads and in recreational areas, we believe that county and local governments will contract for these sites to be strategically located. At December 31, 2007, we operated approximately 66 convenience sites located in nine counties in our market area.
In addition, we have increased our efforts to win additional contracts to manage comprehensive disposal services for large corporations and municipalities. For example, after thorough review and evaluation, we may provide a lump sum quote for handling all the waste in a company’s facility. This would include separating at the source various wastes into commodities for resale and non-recyclables for disposal. The process of sorting at the source, processing through a compaction system and scheduling waste and recyclable removals only when the containers are full reduces our cost and increases our operating efficiency. Furthermore, confidential documents can be controlled throughout the process and destroyed to the customer’s satisfaction.
9
Operations
Branch Facility Structure
Based on our experience in the industry, we believe that a branch facility structure enables some decision-making authority to remain close to the customer and enables us to identify customers’ needs quickly and implement cost-effective solutions. Furthermore, we believe that it provides a low-overhead, highly efficient operational structure that allows us to branch into geographically contiguous markets and operate in small communities that larger competitors might not find attractive. Based on our experience in the industry, we believe that branch facilities provide us with a strategic competitive advantage given the relatively rural nature of the Southeastern U.S.
We deliver our waste services from branch locations in contiguous service areas, which permits our branch facilities to provide back-up services and support to one another. Each manager of a branch facility has some decision-making authority for the local market area, primarily with pricing, although monitored by corporate management to ensure that company-wide goals are attained.
Our managerial philosophy centers on the principle that customers’ needs can best be served at the local level by a staff of well-trained personnel led by a branch manager. Each branch manager is responsible for implementing sales programs, maintaining service quality, promoting safety in the branch’s operations and overseeing the day-to-day operations for the branch, including contract administration. Branch managers also assist division managers in identifying potential acquisition candidates. Frequently, the branch manager is also the branch facility’s sales manager; but in larger market areas, branch facilities will have one or more sales persons. Branch managers are compensated based on the performance of their branch. Each branch manager reports to a division vice president, who reports to our chief operating officer.
In addition to delivering our services, branch staff responsibilities include setting up customer accounts, answering customer questions, processing accounts payable and maintaining payroll and personnel information. Maintenance support for collection equipment is also provided at the branch facility. The facility size, number of maintenance personnel and capabilities are determined by the number of vehicles operated and the type of services provided within the branch facility’s market area.
On a monthly basis, the corporate and/or division officers meet with each branch manager to discuss and evaluate the branch operations. This evaluation is conducted through the use of flash reports on a weekly basis at the branch and division levels. Flash reports highlight key operating data such as employee-hours, overtime hours, truck hours, revenues and extraordinary costs. These meetings are oriented to identifying trends, opportunities and strategies in the branch facility’s proximate geographic area. Using a decentralized approach, but with strong division and corporate monitoring and strict budgetary and operating guidelines and quality control standards, each branch manager has the authority to exercise some discretion in business decisions. Our management information systems provide corporate management timely oversight of branch performance.
Information Technologies
A cornerstone of our desire to deliver responsive and cost-effective waste services is our management information systems network. Many of our information systems, controls and services are designed to assist branch facilities’ personnel in making decisions based upon centralized information. Financial control is maintained through personnel, fiscal and accounting policies that are established at the corporate level for implementation at the branch locations. Our systems allow for centralized billing and collection through a lock-box system, thus enhancing cash management. This information system links our IBM AS/400 computer to each branch using the Internet that allows each branch on-line, real-time financial, productivity, maintenance and customer information.
Support Services
Our Support Services Teams provide our branch operations with significant assistance in maintaining existing customers, winning new customers and integrating newly acquired operations. These services consist of:
Risk Management Services:
10
| | • | | Safety Policy and Procedures Manual |
| | • | | Safety Training Programs |
| | • | | Site Specific Safety Awareness Programs |
| | • | | Heads up the Corporate Safety Committee |
| | • | | Emergency Task Force for Natural Disaster Response |
Productivity Improvement Services:
| | • | | Route Optimization Tools |
| | • | | Global Information System Routing Tools |
| | • | | Route Planning Protocol that maximize truck utilization |
Centralized Purchasing and Asset Control for:
| | • | | Collection and Support Vehicles |
Centralized Purchasing Negotiations for:
| | • | | High Volume Parts and Supplies |
| | • | | Office and Shop Supplies |
Acquisition Due Diligence and Integration Support:
| | • | | Data Management and Customer Account Data Integration |
| | • | | Maintenance and Corporate Identity Program Implementation |
| | • | | Employee Benefits and Related Human Resource Services |
| | • | | Customer Account Profitability Analysis |
Centralized Maintenance Support in order to:
| | • | | Standardize vehicle and heavy equipment maintenance procedure |
| | • | | Establish standards for truck and heavy equipment rebuilds |
| | • | | Provide guidance and approval for truck and heavy equipment rebuilds |
| | • | | Manage our compactor rebuild facility |
| | • | | Head up the Corporate Maintenance Council that establishes and rolls out “Best Maintenance Practices”. |
Disposal Management
We manage our disposal cost by maximizing the use of our own disposal sites whenever economically viable, by negotiating favorable disposal rates with third parties based on volume commitments, by a network of transfer stations that provide us with more final disposal options and a disciplined transfer station and landfill development program designed to improve our future internalization rates and reduce our cost of disposal.
We use our network of transfer stations to consolidate waste from local collection vehicles and ship the consolidated waste in tractor/trailer loads to our landfills, thereby internalizing the waste. In some markets, our transfer stations ship to third party disposal facilities, but generally only when we have either negotiated favorable long-term disposal rates with these facilities or the disposal rates generally are the same for all users.
In general, there is no shortage of potential landfill space in the Southeast. There is, however, a need for additional landfill disposal capacity in some very specific Southeast markets. To address these opportunities, we may acquire existing landfills, we may develop landfills, or we may partner with an experienced landfill operator for the acquisition, development or assumption of the operation of additional landfills. Generally, we would pursue such arrangements in our market area if we believe that ownership or operation of a landfill would provide cost benefits and create shareholder value.
11
Most Southeast markets have surplus landfill capacity. In these markets, landfill operators are aggressively soliciting solid waste volumes to ensure cash flows sufficient to support ongoing landfill operating and construction cost. In these markets, we will continue to use our traditional system of consolidating waste and negotiating favorable disposal rates unless we believe that ownership or operation of a landfill would provide cost benefits and create shareholder value.
In some of our markets, we rely on municipally owned waste-to-energy plants for the disposal of our solid waste. In these markets, disposal cost is the same for all users; as a result, no one has a competitive edge when it comes to the cost of disposal.
Recycling, composting and waste reduction continue to play a role as alternate disposal methods. State and local governments have mandated specific rules and regulations for the recycling of construction and demolition waste, residential recyclables, used tires and yard waste. In some jurisdictions, materials such as yard waste and cardboard have been banned for landfill disposal, and yard waste must be disposed of at a composting or yard waste facility and cardboard at a recycling center. Where applicable, we have adjusted our collection and disposal operations to be in compliance.
Landfill Capping, Closure and Post-Closure Costs
We have financial obligations relating to capping, closure and post-closure costs for the landfill sites we own and operate, except for the Wake County Landfill in North Carolina which we operate but are not contractually responsible for capping, closure and post-closure costs. Our obligations for these costs will increase if we decide to develop or acquire additional landfill sites in the future.
Landfill capping, closure and post-closure costs include estimated costs to be incurred for final closure of landfills and estimated costs for providing required post-closure monitoring and maintenance of landfills. We estimate these future cost requirements based on our interpretation of the technical standards of the Environmental Protection Agency’s Subtitle D Regulations. Our estimate of these costs considers when the costs would actually be paid and factor in inflation and discount rates. We provide accruals for these future costs (generally for a term of 30 years after final closure of any landfill), and will provide additional accruals for these and other landfills we might acquire or develop in the future, based on engineering estimates of consumption of airspace over the useful lives of such facilities. While the precise amounts of these future obligations cannot be determined, we paid $0.2 million in 2007 and, at December 31, 2007, we estimate total landfill closure and post-closure costs of approximately $7.9 million for the airspace consumed to date. There can be no assurance that our ultimate financial obligations for actual closure or post-closure costs will not exceed the amount accrued and reserved or amounts otherwise receivable pursuant to insurance policies or trust funds. Such a circumstance could have a material adverse effect on our financial condition and results of operations.
Marketing and Sales
We market our services locally through our regional and branch managers and approximately 42 direct sales representatives who focus on commercial, industrial and residential customers. In addition to traditional methods of obtaining customers through cold calls, referrals, yellow page and other local market print advertising and overall market reputation, we focus on new account sales through an integrated prospect data base system which targets new account development. Some branch locations have dedicated sales representatives that market residential services. We engage in direct mail campaigns and door-to-door marketing and work with real estate agents and developers to sell services to new developments. Additionally, we attend and make presentations at municipal and state conferences and advertise in governmental associations’ membership publications.
Our sales representatives visit customers on a regular basis and make sales calls to potential new customers. These sales representatives receive a significant portion of their compensation based upon certain incentive formulas. We emphasize providing quality services, customer satisfaction and retention, and believe that this focus on quality service will help retain existing customers as well as attract additional customers. Maintenance of a local presence and identity is an important aspect of our marketing plan. In order to accomplish these objectives, many of our managers are involved in local governmental, civic and business organizations.
Competition
The solid waste management industry is highly competitive, very fragmented and requires substantial labor and capital resources. Intense competition exists within the industry not only for collection, transportation and disposal volume, but also for acquisition candidates. The industry includes three large national waste companies: Waste Management, Inc.; Allied Waste
12
Industries, Inc.; and Republic Services, Inc. There are several other public companies in the industry with annual revenue in excess of $100 million, including Casella Waste Systems, Inc. and Waste Connections, Inc. We compete with a number of these and other regional and local companies, including publicly and privately owned providers of incineration services.
We also compete with certain municipalities that operate their own solid waste collection and disposal facilities. These municipalities may have certain advantages over us due to the availability of tax revenues and tax-exempt financing.
We compete for collection and recycling accounts primarily on the basis of price and quality of our services. From time to time, competitors may reduce the price of their services in an effort to expand market share or to win a competitively bid municipal contract. These practices may also lead to reduced pricing for our services or the loss of business.
Competitive Bid Contracts
We provide a substantial portion of our residential collection services under municipal contracts and, at December 31, 2007, approximately 29% of our revenues came from municipal contracts. As is generally the case in the industry, municipal contracts are subject to periodic competitive bidding. The balance of our residential services is provided on a subscription basis. At December 31, 2007, we had not lost, nor do we reasonably expect to lose, a contract that would have a material adverse effect on our financial condition or results of operations because the contract either was or is not material. Our inability to compete with larger and better capitalized companies, or to replace a significant number of municipal contracts lost through the competitive bidding process with comparable contracts or other revenue sources within a reasonable time period, could have a material adverse effect on our results of operations.
Employees
At December 31, 2007, we employed approximately 1,600 full-time employees. None of our employees are represented by unions and we believe that our employee relations are good. We are highly dependent upon the services of the members of our management team, the loss of any of whom might have an adverse effect on our operations.
Risk Management, Insurance and Performance Bonds
We actively maintain environmental and other risk management programs appropriate for our business. Our environmental risk management program includes evaluating both existing facilities, as well as potential acquisitions, for environmental law compliance and operating procedures. We also maintain a worker safety program that encourages safe practices in the workplace. Operating practices at all of our existing operations stress minimizing the possibility of environmental contamination and litigation.
We carry a range of insurance intended to protect our assets and operations, including a commercial general liability policy and a property damage policy. If a partially or completely uninsured claim were made against us (including liabilities associated with cleanup or remediation at our own facilities) and it was successful and of sufficient magnitude, it could have a material adverse effect on our results of operations or financial condition. Any future difficulty in obtaining insurance could also impair our ability to secure future contracts, which might be conditioned upon the availability of adequate insurance coverage.
Municipal solid waste collection contracts may require performance bonds or other means of financial assurance to secure contractual performance. We have not experienced difficulty in obtaining performance bonds or letters of credit for our current operations. At December 31, 2007, we had provided customers and various regulatory authorities with bonds and letters of credit of approximately $56.3 million to secure our obligations. If we were unable to obtain surety bonds or letters of credit in sufficient amounts or at acceptable rates, we may be precluded from entering into additional municipal solid waste collection contracts or obtaining or retaining landfill operating permits.
Regulation
Introduction
We are subject to extensive and evolving federal, state and local environmental laws and regulations that have been enacted in response to technological advances and increased concern over environmental issues. These regulations not only strictly regulate the conduct of our operations but also are related directly to the demand for many of the services we offer.
13
The regulations affecting us are administered by the EPA and various other federal, state and local environmental, zoning, health and safety agencies. We believe that we are currently in material compliance with applicable federal, state and local laws, permits, orders and regulations, and we do not currently anticipate any material environmental costs although there can be no assurance in this regard. We anticipate there will continue to be increased regulation, legislation and regulatory enforcement actions related to the solid waste services industry. As a result, we attempt to anticipate future regulatory requirements and to plan accordingly to remain in compliance with the regulatory framework.
In order to transport waste, we must have one or more permits from state or local agencies. These permits also must be periodically renewed and are subject to modification and revocation by the issuing agency. None of our permits has ever been revoked. Similarly, we often are required to have a local government franchise, which franchise may expire and be subject to modification or revocation. None of our franchises has ever been revoked.
In order to develop, own or operate a landfill, a transfer station or other solid waste facilities, we are required to go through several governmental review processes and obtain one or more permits and often zoning or other land use and local government approvals. Obtaining these permits and zoning, land use and local government approvals is difficult, time consuming and expensive. In addition, this process is often opposed by various local elected officials and citizens’ groups. Once obtained, operating permits generally must be periodically renewed and are subject to modification and revocation by the issuing agency.
Our facilities are subject to a variety of operational, monitoring, site maintenance, closure, post-closure and financial assurance obligations that change from time to time and which could give rise to increased capital expenditures and operating costs. In connection with any such landfills, it is often necessary to expend considerable time, effort and money in complying with the governmental review and permitting process necessary to maintain or increase the capacity of these landfills. Governmental authorities have broad power to enforce compliance with these laws and regulations and to obtain injunctions or impose civil or criminal penalties in the case of violations.
The principal federal, state and local statutes and regulations applicable to our various operations are as follows:
The Resource Conservation and Recovery Act of 1976
The Resource Conservation and Recovery Act of 1976, also known as RCRA, regulates the generation, treatment, storage, handling, transportation and disposal of solid waste and requires states to develop programs to ensure the safe disposal of solid waste. RCRA divides solid waste into two groups, hazardous and non-hazardous. Wastes are generally classified as hazardous if they either are specifically included on a list of hazardous wastes or exhibit certain hazardous characteristics and are not specifically designated as non-hazardous. Wastes classified as hazardous under RCRA are subject to much stricter regulation than wastes classified as non-hazardous. Among the wastes that are specifically designated as non-hazardous waste are household waste and “special” waste, including items such as petroleum contaminated soils, asbestos, foundry sand, shredder fluff and most non-hazardous industrial waste products.
Although we currently are not involved with transportation or disposal of hazardous substances, we transported hazardous substances in the past and might become involved with hazardous substance transportation and disposal in the future. The EPA regulations issued under Subtitle C of RCRA impose a comprehensive “cradle to grave” system for tracking the generation, transportation, treatment, storage and disposal of hazardous wastes. The Subtitle C Regulations provide standards for generators, transporters and disposers of hazardous wastes, and for the issuance of permits for sites where such material is treated, stored or disposed. Subtitle C imposes detailed operating, inspection, training and emergency preparedness and response standards, as well as requirements for manifesting, record keeping and reporting, facility closure, post-closure and financial responsibilities.
In October 1991, the EPA adopted the Subtitle D Regulations governing solid waste landfills. Because we own and operate landfills, we must comply with these regulations.
The Subtitle D Regulations, which generally became effective in October 1993, include location restrictions, facility design standards, operating criteria, closure and post-closure requirements, financial assurance requirements, groundwater monitoring requirements, groundwater remediation standards and corrective action requirements. In addition, the Subtitle D Regulations require that new landfill sites meet more stringent liner design criteria (typically, composite soil and synthetic liners or two or more synthetic liners) designed to keep leachate out of groundwater and have extensive collection systems to carry away leachate for treatment prior to disposal. Groundwater monitoring wells must also be installed at virtually all landfills to monitor groundwater quality and, indirectly, the leachate collection system operation. The Subtitle D Regulations also require, where threshold test levels are present, that methane gas generated at landfills be controlled in a manner that protects human health and the environment. We are not aware of any problem with methane gas at any of our facilities. Each state is required to revise its landfill regulations to meet these requirements or such requirements will be automatically imposed upon it by the EPA. Each state is also required to adopt and
14
implement a permit program or other appropriate system to ensure that landfills within the state comply with the Subtitle D Regulations criteria. Various states in which we operate now or might in the future have adopted regulations or programs as stringent as, or more stringent than, the Subtitle D Regulations. Failure to comply with these regulations could require us to undertake investigatory or remedial activities, to curtail operations or to close a landfill temporarily or permanently. Future changes in these regulations might require us to modify, supplement or replace equipment or facilities at costs that might be substantial. The failure of regulatory agencies to enforce these regulations vigorously or consistently might give an advantage to our competitors whose facilities do not comply with the Subtitle D Regulations or its state counterparts. Our ultimate financial obligations related to any failure to comply with these regulations could have a material adverse effect on our operations and financial condition.
The Federal Water Pollution Control Act of 1972
The Federal Water Pollution Control Act of 1972, known as the Clean Water Act, establishes rules regulating the discharge of pollutants from a variety of sources, including solid waste disposal sites and transfer stations, into waters of the U.S. Because we own and operate landfills and transfer stations, we must comply with this Act. For example, if run-off or collected leachate from our transfer stations or from our owned or operated landfills is discharged into streams, rivers or other surface waters, the Clean Water Act would require us to apply for and obtain a discharge permit, conduct sampling and monitoring and possibly reduce the quantity of pollutants in such discharge. Also, virtually all landfills are required to comply with the EPA’s storm water regulations issued in November 1990. Such regulations are designed to prevent possibly contaminated landfill storm water runoff from flowing into surface waters. We believe that our facilities are in compliance in all material respects with Clean Water Act requirements, including these state requirements. Various states in which we operate now or might in the future have delegated authority to implement the Clean Water Act permitting requirements, and some of these states have adopted regulations that are more stringent than the federal requirements. Further, under certain circumstances, the Act authorizes the institution of lawsuits by private citizens to enforce provisions of the Act.
The Comprehensive Environmental Response, Compensation and Liability Act of 1980
The Comprehensive Environmental Response, Compensation and Liability Act of 1980, also known as CERCLA, established a regulatory and remedial program intended to provide for the investigation and cleanup of facilities from which there has been, or is threatened, a release of any hazardous substance into the environment. CERCLA’s primary mechanism for remedying such problems is to impose strict joint and several liability for cleanup of facilities on current owners and operators of the site and former owners and operators of the site at the time of the disposal of the hazardous substances, as well as the generators of the hazardous substances and the transporters who arranged for disposal or transportation of the hazardous substances. The costs of CERCLA investigation and cleanup can be very substantial. Liability under CERCLA does not depend upon the existence or disposal of “hazardous waste” as defined by RCRA, but can also be founded upon the existence of even very small amounts of the more than 700 “hazardous substances” listed by the EPA, many of which can be found in household waste.
We currently do not handle hazardous waste as defined by RCRA, but because we did in the past and because we own and operate landfills and transfer stations, we might be subject to CERCLA. If we were to be found to be a responsible party for a CERCLA cleanup, the enforcing agency could hold us, or any other generator, transporter or the owner or operator of the facility, completely responsible for all investigative and remedial costs even if others might also be liable. CERCLA also authorizes the imposition of a lien in favor of the U.S. upon all real property subject to, or affected by, a remedial action for all costs for which a party is liable. CERCLA provides a responsible party with the right to bring legal action against other responsible parties for their allocable share of investigative and remedial costs. Our ability to get others to reimburse us for their allocable share of such costs would be limited by our ability to find other responsible parties and prove the extent of their responsibility and by the financial resources of such other parties.
The Clean Air Act
The Clean Air Act provides for regulation, through state implementation of federal requirements, of the emission of air pollutants from certain landfills based upon the date of the landfill construction and volume per year of emissions of regulated pollutants. Because we own and operate landfills, we must comply with this Act. We believe we are in compliance with this Act. The EPA has adopted new source performance standards regulating air emissions of certain regulated pollutants (methane and non-methane organic compounds) from municipal solid waste landfills. Landfills located in areas with air pollution problems might be subject to even more extensive air pollution controls and emission limitations. In addition, the EPA has issued standards regulating the disposal of asbestos-containing materials. Some of the federal statutes described above contain provisions authorizing the institution of lawsuits by private citizens to enforce the provisions of the statutes.
15
The Occupational Safety and Health Act of 1970
The Occupational Safety and Health Act of 1970, also known as OSHA, establishes employer responsibilities and authorizes the promulgation by the Occupational Safety and Health Administration of occupational health and safety standards, including the obligation to maintain a workplace free of recognized hazards likely to cause death or serious injury, to comply with worker protection standards established by OSHA, to maintain records, to provide workers with required disclosures and to implement health and safety training programs. Various of those promulgated standards might apply to our operations, including those standards concerning notices of hazards, safety in excavation and demolition work, the handling of asbestos and asbestos-containing materials, and worker training and emergency response programs. Our employees are trained to respond appropriately in the event there is an accidental spill or release of packaged asbestos-containing materials or other regulated substances during transportation or landfill disposal.
State and Local Regulations
Each state in which we now operate or might operate in the future has laws and regulations, as well as common law doctrines, governing the generation, storage, treatment, handling, transportation and disposal of solid waste, water and air pollution and, in most cases, the siting, design, operation, maintenance, closure and post-closure maintenance of landfills and transfer stations. Because of our business, we must comply with these laws and regulations. In addition, many states have adopted Superfund statutes comparable to, and in some cases more stringent than, CERCLA. These statutes impose requirements for investigation and cleanup of contaminated sites and liability for costs and damages associated with such sites, and some provide for the imposition of liens on property owned by responsible parties. Furthermore, many municipalities also have ordinances, local laws and regulations affecting our operations. These include zoning and health measures that limit solid waste management activities to specified sites or activities, flow control provisions that direct the delivery of solid wastes to specific facilities, laws that grant the right to establish franchises for collection services and then put out for bid the right to provide collection services, and bans or other restrictions on the movement of solid wastes into a municipality.
Permits and approvals may limit the types of waste that may be accepted at a landfill or the quantity of waste that may be accepted at a landfill during a given time period. In addition, permits and approvals, as well as some state and local regulations, might limit a landfill to accepting waste that originates from specified geographic areas or seek to restrict the importation of out-of-state waste or otherwise discriminate against out-of-state waste. Generally, restrictions on the importation of out-of-state waste have not withstood judicial challenge. However, from time to time federal legislation is proposed which would allow individual states to prohibit the disposal of out-of-state waste or to limit the amount of out-of-state waste that could be imported for disposal and would require states to reduce the amounts of waste exported to other states. Although Congress has not yet passed such legislation, if this or similar legislation were enacted, states in which we operate landfills could act to limit or prohibit the importation of out-of-state waste. Such state actions could materially adversely affect landfills within those states that receive a significant portion of waste originating from out-of-state.
In addition, some states and localities may for economic or other reasons restrict the exportation of waste from their jurisdiction or require that a specified amount of waste be disposed of at facilities within their jurisdiction. In 1994, the U.S. Supreme Court held unconstitutional, and therefore invalid, a local ordinance that sought to impose flow controls on taking waste out of the locality. However, some state and local jurisdictions continue to seek to adopt and enforce such restrictions and, in certain cases, we might elect not to challenge such restrictions based upon various considerations. In addition, the aforementioned proposed federal legislation would allow states and localities to impose certain flow control restrictions.
These restrictions could result in the volume of waste going to landfills being reduced in some areas, which might materially adversely affect our ability to operate our landfills at their full capacity and/or affect the prices that can be charged for landfill disposal services. These restrictions might also result in higher disposal costs for our collection operations. If we were unable to pass such higher costs through to our customers, our business, financial condition and results of operations could be materially adversely affected.
There has been an increasing trend at the state and local level to mandate and encourage waste reduction at the source and waste recycling, and to prohibit or restrict the disposal of some types of solid wastes, such as yard wastes, leaves and tires, in landfills. The enactment of regulations reducing the volume and types of wastes available for transport to and disposal in landfills could affect our ability to operate our facilities at their full capacity.
16
ITEM 1A. RISK FACTORS
RISK FACTORS
As previously mentioned in our Note Relating to Forward-Looking Statements, there are numerous risks and uncertainties associated with our business and the ownership of our stock. Set forth below are the risks that are known to us as of the date of this report that could affect our business and results of operations.
State legislation or rulemaking has changed recently and in the future could change the regulatory oversight, including the permitting process, for landfills, which could negatively impact our operations.
The operation of landfills is governed by the laws of the state in which the landfill is or is proposed to be located. Any new landfill must apply for and receive a permit to allow its opening and operation. This regulatory oversight, including the permitting process, is subject to change at both the agency and the legislative levels in each state. Any changes to the permitting process and regulatory oversight of landfills in a state in which we operate or intend to operate could negatively affect our operations.
In July 2006, the North Carolina legislature enacted a one-year moratorium on permits for new landfills. The moratorium ran from August 1, 2006 to August 1, 2007 and was applicable to the landfill that we are developing in Camden County, North Carolina. The legislation that imposed the moratorium also required the Environmental Review Commission, with the assistance of the Division of Waste Management of the Department of Environmental and Natural Resources, to study ways to reduce the amount of solid waste disposed of in North Carolina landfills and to study measures concerning, among other things, financial responsibility requirements, franchise and local government requirements, and siting, design and operational requirements for solid waste landfills in the state.
As a result of those studies, on August 2, 2007, the North Carolina legislature approved legislation that, among other things, imposes stringent limitations on landfill siting. Specifically, no landfill may be approved that:
| | • | | Is within five miles of a national wildlife refuge, two miles of a state park or one mile of a state gameland; |
| | • | | Is closer than 200 feet to a stream, as opposed to the prior 50 foot requirement; |
| | • | | Will have a capacity in excess of 55 million cubic yards of waste; |
| | • | | Will have a disposal area greater than 350 acres; or |
| | • | | Will have a height, including cap and cover vegetation, that is 250 feet above the mean natural elevation of the proposed site. |
The legislation imposes an excise tax, effective July 1, 2008, of $2.00 per ton on any solid waste disposed of in North Carolina or transferred out of North Carolina. Part of the proceeds of this tax may be used to reimburse applicants whose landfill applications were pending on the date of and impacted by the new legislation for the cost of the preparation of their permit applications incurred through August 2006.
The Black Bear landfill we are developing in Camden County, North Carolina is approximately 3,500 feet from a national wildlife refuge. We have filed a lawsuit challenging application of the legislation to the Black Bear project on the grounds that applying the legislation to the Black Bear project violates the contract, interstate commerce, equal protection and due process clauses of the United State constitution, the corresponding clauses of the North Carolina constitution and our common law vested rights. We also are reviewing all other options and remedies available to us to either continue developing the Black Bear landfill or recover our investment in the project.
If, as a result of the legislation, the landfill cannot be constructed as planned, we would have to charge off that portion of the project’s book value that exceeded its fair value. Fair value would include any reimbursement that we expect to receive from the state. At December 31, 2007, the book value of the project was approximately $14.0 million, including approximately $9.1 million in land purchase costs. While any such impairment charge would not have a material adverse effect on our cash flows, it could have a material adverse impact on our earnings for the period in which the charge is taken.
17
The new legislation will make the landfill permitting process and the construction and operation of landfills in North Carolina more difficult, lengthy and expensive, and, we believe, will reduce the number and size of landfills that can be built and operated in the state. New statutes or rules could be adopted in the future that are even more onerous than the new legislation. Other states in which we operate could adopt similar moratoriums or change their current landfill regulatory oversight or permitting processes. Any moratorium or statutory or rule change that increases the time and cost to develop and operate landfills could negatively affect our operations. In addition, the new North Carolina legislation, and any similar legislation in another state, if adopted, could have a negative impact on our business strategy as well as our operations due to possible reductions in operating margin and charges to earnings of capitalized expenditures for the development of landfills.
Increases in the cost of fuel for any extended period of time would increase our operating expenses, which could negatively affect our earnings.
The price and supply of fuel are unpredictable, and can fluctuate significantly based on international political and economic circumstances, as well as other events outside our control, such as actions by OPEC and other oil and gas producers, regional production patterns and environmental concerns. The price of fuel has increased significantly since 2006, which has increased our cost of operations significantly. We need fuel to run our collection and transfer trucks and equipment used in our landfill operations, and price escalations or reductions in the supply will likely increase our operating expenses and have a negative impact on income from operations and cash flows. We have in place a fuel surcharge program, designed to offset increased fuel expenses; however, we are not able to pass through all of the increased costs and some customers’ contracts prohibit any pass through of the increased costs. Additionally, as fuel prices increase, many of our vendors raise their prices as a means to offset their own rising costs.
The waste industry is highly competitive and if we fail to compete successfully our financial condition and results of operations may be materially adversely affected.
We encounter intense competition from governmental, quasi-governmental and private sources in all aspects of our operations. The waste industry currently consists of large national waste management companies, and local and regional companies of varying sizes and financial resources. We compete with these companies as well as with counties and municipalities that maintain their own waste collection and disposal operations. These counties and municipalities may have financial competitive advantages because tax revenues and tax-exempt financing are available to them. Also, such governmental units may attempt to impose flow control or other restrictions that would give them a competitive advantage.
In addition, competitors may reduce their prices to expand sales volume or to win competitively bid contracts. When this happens, we may rollback prices or offer lower pricing to attract or retain our customers, resulting in a negative impact to our yield on base business.
Economic conditions have had and in the future may have an adverse impact on our operating performance and results of operations.
Weaknesses in the overall U.S. economy or Southeast, where we conduct business, had a negative effect on our operating results, including decreases in revenues and operating cash flows and may continue to do so in the future due to decreases in economic activity, during which businesses tend to produce less waste. Additionally, in a down-cycle economic environment, we may experience the negative effects of increased competitive pricing pressure and customer turnover. If economic conditions deteriorate, we will experience pressure on the pricing that we are able to achieve for our services. In addition, worsening economic conditions may lead to further negative effects of customer turnover. There can be no assurance that current economic conditions or worsening economic conditions or a prolonged or recurring recession will not have a significant adverse impact on our operating results. Additionally, there can be no assurance that an improvement in economic conditions will result in an immediate, if at all, positive improvement in our operating results.
We may not be able to continue our strategy of growth through acquisitions, which could have a material adverse effect on our financial condition and results of operations.
Our growth strategy includes expanding through acquisitions, acquiring additional exclusive arrangements and generating
18
internal growth. Most of our growth has been through acquisitions. Although we have identified numerous acquisition candidates that we believe are suitable, we may not be able to acquire them at prices or on terms and conditions favorable to us. Our ability to grow also depends on several other factors, including:
| | • | | the availability of capital to support our growth; |
| | • | | our ability to compete with existing and emerging companies; |
| | • | | our ability to maintain profit margins in the face of competitive pressures; |
| | • | | our ability to continue to recruit, train and retain qualified employees; and |
| | • | | continued strong demand for our services. |
Difficulties in any of these areas could hinder our growth and negatively affect our financial condition and results of operations.
We are subject to costly environmental regulations and environmental litigation that could negatively affect our financial condition and results of operations.
Our equipment, facilities, and operations are subject to extensive and changing federal, state, and local environmental laws and regulations relating to environmental protection and occupational health and safety. These include, among other things, laws and regulations governing the use, treatment, storage, and disposal of solid and hazardous wastes and materials, air quality, water quality and the remediation of contamination associated with the release of hazardous substances.
Our compliance with these regulatory requirements is costly. Government laws and regulations often require us to enhance or replace our equipment and to modify landfill operations or initiate final closure of a landfill. We cannot assure you that we will be able to implement price increases sufficient to offset the cost of complying with these laws and regulations. In addition, environmental regulatory changes could accelerate or increase expenditures for closure and post-closure monitoring at solid waste facilities and obligate us to spend sums in addition to those presently accrued for such purposes.
In addition to the costs of complying with environmental regulations, we incur costs to defend against litigation brought by government agencies and private parties who allege we are in violation of our permits and applicable environmental laws and regulations. As a result, we may be required to pay fines, implement corrective measures or may have our permits and licenses modified or revoked. We are, and also may be in the future, defendants in lawsuits brought by governmental agencies and surrounding landowners who assert claims alleging environmental damage, personal injury, property damage and/or violations of permits and licenses by us. A significant judgment against us, the loss of a significant permit or license or the imposition of a significant fine could have a material negative effect on our financial condition.
Certain of our waste disposal operations traverse state and county boundaries. In the future, our collection, transfer and landfill operations may also be affected by proposed federal legislation that authorizes the states to enact legislation governing interstate shipments of waste. Such proposed federal legislation may allow individual states to prohibit the disposal of out-of-state waste or to limit the amount of out-of-state waste that could be imported for disposal and may require states, under some circumstances, to reduce the amount of waste exported to other states. If this or similar legislation is enacted in states in which we operate landfills that receive a significant portion of waste originating from out-of-state, our operations could be negatively affected. We believe that several states have proposed or have considered adopting legislation that would regulate the interstate transportation and disposal of waste in the states’ landfills. Our collection, transfer and landfill operations may also be affected by “flow control” legislation which may be proposed in the United States Congress. This proposed federal legislation may allow states and local governments to direct waste generated within their jurisdictions to a specific facility for disposal or processing. If this or similar legislation is enacted, state or local governments with jurisdiction over our landfills could act to limit or prohibit disposal or processing of waste in our landfills.
Adverse weather could hamper our operations, which could increase our operating costs and negatively impact our results of operations.
Our collection and landfill operations could be adversely affected by long periods of inclement weather, which interfere with collection and landfill operations, delay the development of landfill capacity and/or reduce the volume of waste generated by our customers. In addition, certain of our operations may be temporarily suspended as a result of particularly harsh weather conditions. Severe weather can negatively affect the costs of collection and disposal. Long periods of inclement weather could have an adverse effect on our results of operations.
19
Our business is seasonal, which causes our quarterly results to fluctuate.
Our results of operations tend to vary seasonally, with the first quarter typically generating the least amount of revenues, higher revenues in the second and third quarters, and a decline in the fourth quarter. This seasonality reflects the lower volume of waste during the fall and winter months primarily due to lower construction activities. Also, certain operating and selling, general, and administrative costs remain relatively constant throughout the calendar year, which, when offset by these revenues, results in a similar seasonality of operating income.
Our significant leverage exposes us to increased expense and operational restrictions which could make it difficult to operate our business.
We have a significant amount of indebtedness. As of December 31, 2007, we had consolidated debt, including capital lease obligations, of approximately $165.2 million. As of December 31, 2007, our availability under our senior credit facility was approximately $26.0 million.
We are vulnerable to increases in interest rates because the debt under our senior credit facility is at a variable interest rate. Although in the past we have on occasion entered into certain hedging instruments in an effort to manage our interest rate risk, there is no assurance that we will continue to do so, on favorable terms or at all, in the future.
Our substantial indebtedness could have important consequences. For example, it could:
| | • | | make it more difficult for us to satisfy our obligations with respect to our debt and our leases; |
| | • | | increase our vulnerability to general adverse economic and industry conditions; |
| | • | | require us to dedicate a substantial portion of our cash flow from operations to payments on our debt and lease obligations, thereby reducing the availability or our cash flow to fund working capital, capital expenditures and other general corporate purposes; |
| | • | | limit our flexibility in planning for, or reacting to, changes in our business and the industry in which we operate; |
| | • | | place us at a competitive disadvantage compared to our competitors that have less indebtedness or better access to capital by, for example, limiting our ability to enter into new markets or acquire new or renovate our existing facilities and equipment; and |
| | • | | limit our ability to borrow additional funds in the future. |
If we are unable to meet our debt and lease obligations, we could be forced to restructure or refinance our obligations, seek additional equity financing or sell assets, which we may not be able to do on satisfactory terms or at all. As a result, we could default on those obligations. In addition, our credit facilities contain financial and other restrictive covenants that limit our ability to engage in activities that may be in our long-term best interests. Any new facility likely will contain similar covenants and restrictions. Our failure to comply with those covenants could result in an event of default which, if not cured or waived, could result in the acceleration of all of our indebtedness, which could adversely affect our financial health and could prevent us from fulfilling our obligations.
We are required to make accounting and tax-related estimates and judgments in preparing our financial statements.
In preparing our consolidated financial statements in accordance with U.S. generally accepted accounting principles, we make several estimates and assumptions that affect the accounting for and recognition of assets, liabilities, revenues and expenses. These estimates and assumptions must be made because certain information that is used in the preparation of our financial statements is dependent on future events or cannot be calculated with a high degree of precision from data available. In some cases, these estimates are particularly difficult to determine and we must exercise significant judgment. The estimates and the assumptions having the greatest amount of uncertainty, subjectivity and complexity are related to our accounting for landfills, derivatives, self-insurance reserves, reserve for doubtful accounts, intangibles, allocation of acquisition purchase prices, deferred income taxes, asset impairments, litigation, claims and assessments. Actual results could differ materially from the estimates and assumptions that we use, which could have a material adverse effect on our financial condition and results of operations.
20
Our stock is thinly traded, which can cause volatility in its price.
There currently is a public market for our common stock, but there is no assurance that there will always be such a market, even if the proposed going private transaction is not consummated. Our stock is thinly traded due in part, we believe, to the high level of insider ownership of our company. Thinly traded stock can be more susceptible to market volatility. This market volatility could significantly affect the market price of our common stock without regard to our operating performance. Securities markets worldwide experience significant price and volume fluctuations. In addition, the price of our common stock could be subject to wide fluctuations in response to the following factors, among others:
| | • | | a deviation in our results from the expectations of public market analysts and investors; |
| | • | | a decrease in or cessation of our cash dividend; |
| | • | | statements by research analysts about our common stock, our company or our industry; |
| | • | | changes in market valuations of companies in our industry and market evaluations of our industry generally; |
| | • | | actions taken by our competitors; |
| | • | | sales or other issuances of common stock by us, our senior officers or other affiliates; or |
| | • | | other general economic, political or market conditions, many of which are beyond our control. |
The market price of our common stock will also be impacted by our quarterly operating results which can fluctuate from quarter to quarter. Factors that may impact our quarterly results include, among others, failure to obtain required permits, costs of regulatory compliance, fuel prices, general regional and national economic conditions, competition, unexpected costs and changes in pricing, consumer trends, costs of compliance with corporate governance and Sarbanes-Oxley requirements, and other factors discussed in Item 1A - “Risk Factors” beginning on page 17 and in Item 7 -“Management’s Discussion and Analysis of Financial Condition and Results of Operations.”
ITEM 1B. UNRESOLVED STAFF COMMENTS
None.
ITEM 2. PROPERTIES
Our principal executive offices are located at 3301 Benson Drive, Raleigh, North Carolina, where we currently lease approximately 33,730 square feet of office space. Our principal property and equipment consists of land (primarily transfer stations, bases for collection operations and landfill sites), buildings, and vehicles and equipment. Our land and buildings are located in North Carolina, South Carolina, Virginia, Tennessee, Georgia, and Mississippi. We also lease real property in the states in which we do business. At December 31, 2007, we operated 34 collection operations, 29 transfer stations, 12 recycling facilities and nine landfills. All our property and equipment are used in our one industry segment, which includes collection, transfer, recycling, processing and disposal of municipal solid and industrial waste.
21
Landfills
As of December 31, 2007, we owned or operated under life-of-site operating agreements nine landfills with total available disposal capacity of approximately 120.1 million cubic yards. Total available disposal capacity includes estimated permitted airspace plus an estimate of the expansion airspace that we believe has a probable likelihood of being permitted.
Containers
Some type of container is used in almost every service we provide, and we therefore have an extensive inventory on-hand or on-site at customers’ locations throughout North Carolina, South Carolina, Virginia, Tennessee and Georgia. We own all of our containers and centrally manage our inventory located at the branch facility level. We also own a significant number of on-site compaction containers, which provide efficiency for high-volume solid waste generators. Container life is dependent on the location of the container, the type of waste that is deposited into the container and how the container is maintained. Proper maintenance of commercial and industrial front loader and roll-off containers consists of regular repainting, scheduled repairs and switch-outs, quality cleaning, sanding and priming and monitoring of the container by our employees to check for needed repairs. Residential collection containers require minor maintenance.
Collection Vehicles
We use a fleet of specialized collection vehicles to collect and transport waste and to provide recycling and convenience site services. We have implemented an aggressive maintenance program to maximize the life of our equipment. Preventative and long-term maintenance is performed on regularly scheduled cycles that are more frequent than most manufacturers’ suggested schedules. Preventative maintenance is performed on collection vehicles after every 150 to 250 hours of operation depending on their class, and long-term maintenance (reconstruction of engines, transmissions, etc.) is performed every four to six years. Additionally, cosmetic repairs (painting, interior upholstery repairs) are performed as needed. The majority of the maintenance program is performed by our personnel located in branch facilities.
ITEM 3. LEGAL PROCEEDINGS
Except as disclosed below, we are not a party to any pending legal proceedings that we believe, if resolved unfavorably against us, would have a material adverse effect on our business, results of operations or financial condition. In the normal course of our business and as a result of the extensive governmental regulation of the waste industry, we might periodically become subject to various judicial and administrative proceedings involving federal, state or local agencies. In these proceedings, an agency might seek to impose fines on us or to revoke, or to deny renewal of, an operating permit held by us. In addition, we might become party to various claims and suits pending for alleged damages to persons and property, alleged violation of certain laws and for alleged liabilities arising out of matters occurring during the normal operation of the waste management business.
The City of Chesapeake, et al v. Camden County, et al, Superior Court of Camden County, Docket No. 05 CVS 95
Black Bear Disposal, LLC , one of our wholly owned subsidiaries, entered into a Franchise Agreement with Camden County, North Carolina, effective November 4, 2002. The Franchise Agreement gave Black Bear the exclusive right to build and operate a municipal solid waste landfill in the County, on a tract of approximately 1,000 acres. On November 3, 2005, the City of Chesapeake, Virginia, 13 individuals and a limited partnership alleging to own property in the vicinity of the proposed landfill, and the Camden Citizens Action League, Inc. filed suit in Camden County Superior Court against Camden County, the Board of Commissioners of Camden County, the five Camden County Commissioners and the County Manager in both their official and individual capacities, and Black Bear. In their complaint, the plaintiffs seek a number of judicial determinations, including a declaration that the Franchise Agreement and underlying Franchise Ordinance are void, that certain prerequisites to the approval of the Franchise Ordinance and execution of the Franchise Agreement were not met, and that certain prerequisites to Black Bear’s permit application to the North Carolina Department of Environment and Natural Resources, or “DENR”, were not met. The defendants, including Black Bear, filed a Motion to Dismiss, Answer, Affirmative Defenses and Counterclaims on January 19, 2006, moving to dismiss the plaintiffs’ complaint on the basis of the applicable statutes of limitation, the failure to join a necessary party, lack of subject matter and personal jurisdiction, sovereign and governmental immunity, lack of standing, and the failure to exhaust administrative remedies, denying many of the factual allegations of the plaintiffs’ complaint, and raising as affirmative defenses the applicable statutes of limitation, the terms of a November 22, 2004 Nondisclosure Agreement between the Company and the Southeastern Public Service Authority of Virginia, or “SPSA”, in which SPSA, for itself and its members (Chesapeake is a member of SPSA), had agreed not to interfere with or oppose our plans for a landfill in
22
Camden County, and the doctrines of estoppel, waiver, release, sovereign, governmental and legislative immunities, laches, and the failure to exhaust administrative remedies. The defendants’ counterclaims included claims that the plaintiffs had tortiously interfered with Black Bear’s Franchise Agreement, that Chesapeake had breached the Nondisclosure Agreement, and that Chesapeake had misused Black Bear’s confidential information in violation of the Nondisclosure Agreement and the North Carolina Trade Secrets Protection Act. In the counterclaims, the defendants, including Black Bear, sought the damages suffered as a result of plaintiffs’ tortious interference, and Chesapeake’s breach of the Nondisclosure Agreement and misuse of confidential information, including damages in excess of $3,000,000 per year for any delay in the opening of the proposed landfill. The plaintiffs filed Motions to Dismiss, Strike, Separate Claims, Answer, Affirmative Defenses and Motion to Amend Complaint in response to defendants’ counterclaims, arguing that the counterclaims should be dismissed or stricken, or, in the alternative, separated for trial, and that plaintiffs should be given leave to amend their complaint to add Waste Industries USA, Inc. as a party, given Waste’s agreement to be considered a co-permittee on the landfill, with Black Bear.
Black Bear’s and the County defendants’ Motion to Dismiss the plaintiffs’ claims came on for hearing on April 24, 2006, as did Chesapeake’s and the other plaintiffs’ Motions to Dismiss the defendants’ counterclaims. The Court denied Black Bear’s, the County defendants’ and Chesapeake’s Motions to Dismiss, while granting the remaining plaintiffs’ Motion to Dismiss Black Bear’s and the County defendants’ counterclaims. As a result, the plaintiffs’ challenges to the Franchise Ordinance and Franchise Agreement remain pending, as do Black Bear’s and the County defendants’ counterclaims against Chesapeake. Plaintiff’s Motions to Strike, Separate and Amend were not reached by the Court and remain pending.
The matter is now in discovery on the plaintiffs’ claims and the defendants’ counterclaims, including written discovery and the depositions of the various party and third-party witnesses. The defendants anticipate renewing the defenses underlying their Motion to Dismiss in a Motion for Summary Judgment at the close of discovery.
If the plaintiffs succeed in this matter, Black Bear would have to re-negotiate the Franchise Agreement or re-apply for a franchise with the County and/or re-submit and/or amend its request for a site suitability determination to DENR in order to develop the landfill. We intend to vigorously defend this matter and pursue these and any other potential counterclaims against the plaintiffs.
Pursuant to the Franchise Agreement, Black Bear has agreed to indemnify the County, its officers, employees and agents, which would include the County Commissioners, against all claims arising out of the Franchise Agreement. As a result, Black Bear is liable for the expenses of, and any damages or other awards ultimately determined against, those defendants.
The Franchise Agreement gave Black Bear until November 4, 2007 to open the landfill. Given the litigation brought by Chesapeake and passage of the moratorium (discussed below), the County on April 16, 2007 adopted an Ordinance authorizing a five-year extension on the November 4, 2007 date in return for consideration to the County totaling $450,000, which was paid through a transfer of property. In accordance with the Ordinance, the County, we, along with Black Bear, entered into an Amended and Restated Franchise Agreement, effective April 16, 2007, pursuant to which they also agreed that the service area will be decreased to include only the states of North Carolina, Virginia, Maryland, New Jersey, New York, Connecticut and Massachusetts, and the estimated life of the landfill is 27 years (based on an assumed volume of waste of 10,000 tons a day). The Amended and Restated Franchise Agreement may need to be modified to address issues raised in the Chesapeake litigation.
In July 2006, the North Carolina legislature enacted a one-year moratorium on permits for new landfills. The moratorium ran from August 1, 2006 to August 1, 2007. The legislation that imposed the moratorium also required the Environmental Review Commission, with the assistance of the Division of Waste Management of the DENR, to study ways to reduce the amount of solid waste disposed of in North Carolina and measures concerning, among other things, financial responsibility requirements, franchise and local government requirements, and siting, design and operational requirements for solid waste landfills in the state.
As a result of those studies, on August 2, 2007, the North Carolina legislature approved legislation that regulates new landfills. The law prohibits a new landfill from being constructed within five miles of a national wildlife refuge, two miles of a state park or one mile of a state game land. The new legislation also requires any landfill to be set back at least 200 feet from streams, as opposed to the prior 50 foot requirement. The Black Bear landfill site is within approximately 3,500 feet of a national wildlife refuge. As part of our continuing analysis of the impact of the new legislation on the Black Bear project, we have filed a legal challenge to the new legislation as applied to the Black Bear project (discussed below).
If, as a result of the legislation, the landfill cannot be constructed as planned, we would have to charge off that portion of the project’s book value that exceeded its fair value. Fair value would include any reimbursement that we expect to receive from the state, as discussed below. At September 30, 2007, the book value of the project was approximately $14.0 million, including approximately $9.1 million in land purchase costs. While such an impairment charge would not have a material adverse effect on our cash flows, it could have a material adverse impact on our earnings for the period in which the charge is
23
taken. Due to the passage of the legislation, we performed impairment tests (as of September 30, 2007 and December 31, 2007) as required by SFAS No. 144 by comparing the probability-weighted cash flows from alternative courses of action to the carrying value of the Black Bear project and determined that no impairment was indicated.
The new legislation provides that companies that had pending landfill applications as of August 1, 2007 and whose landfills are impacted by the setback provisions in the new legislation can apply for a reimbursement of the reasonable costs of the preparation of the application incurred prior to August 2006, including site plans, engineering and construction plans, geologic and hydrologic investigations and closure and post-closure plans. The reimbursement funds would come from a tax imposed by the legislation of $2.00 per ton on all solid waste disposed of in North Carolina landfills, beginning on July 1, 2008. On December 18, 2007, we applied to DENR for the reimbursement of $13,612,554 in costs related to the Black Bear project, pursuant to the terms of the legislation. By letter dated February 22, 2008, DENR contacted us seeking additional information and documentation for certain of the expenses for which reimbursement is sought, and we are working to provide the requested information and documentation. DENR has not yet provided an estimated timeframe for a decision on our requested reimbursement.
On December 3, 2007, we filed a Complaint against the State of North Carolina and DENR in the Superior Court of Wake County, North Carolina, challenging application of the legislation to the Black Bear project. We believe that applying the legislation to the Black Bear project violates the contract, interstate commerce, equal protection and due process clauses of the United States Constitution, the corresponding clauses of the North Carolina Constitution and our common law vested rights. The defendants filed an Answer to the Complaint on February 1, 2008, denying all of our claims. We served discovery requests on the defendants, to which the defendants have responded. On February 8, 2008, the defendants filed a Motion to Dismiss and Motion for Judgment on the Pleadings on the following grounds: lack of standing; the session laws at issue do not violate any provision of the North Carolina or United States Constitutions; the doctrines of waiver and estoppel; lack of arbitrary and capricious conduct; lack of interference with a vested right; and lack of entitlement to a writ of mandamus. Our motion to dismiss the hearing (which had been scheduled for March 24, 2008) on the defendants’ motions to dismiss was granted and the defendants’ motions have been re-scheduled for hearing during the week of May 5, 2008. We will vigorously oppose the defendants’ motions to dismiss. If the motions are denied, we plan to proceed with depositions and additional discovery to support our claims in the case.
We are reviewing all other options and remedies available to us to either continue developing the Black Bear landfill or recover our investment in the project.
David Shaev Profit Sharing Account f/b/o Nora Vides on behalf of itself and all others similarly situated v. Waste Industries USA, Inc., Lonnie C. Poole, Jr., Jim W. Perry, Paul F. Hardiman, Glenn E. Futrell, and James A. Walker
On December 21, 2007, we received notice of a complaint filed against us and other defendants on December 19, 2007 in the Superior Court of Wake County, North Carolina. The plaintiff claims to have been a shareholder of ours at all relevant times cited in the complaint. The lawsuit names as defendants us and our five directors, Lonnie C. Poole, Jr., Jim W. Perry, Paul F. Hardiman, Glenn E. Futrell and James A. Walker.
The lawsuit alleges that our directors breached their fiduciary duties to our shareholders by, among other things, engaging in improper, unfair dealing and wrongful and coercive conduct in approving the agreement and plan of merger, dated December 17, 2007, among us, Marlin HoldCo LP, a Delaware limited partnership, and its wholly owned subsidiary, Marlin MergeCo Inc., a North Carolina corporation, that governs the proposed going private transaction discussed in Item 1 – “Business.” Pursuant to the terms of the merger agreement, Marlin MergeCo will merge with and into us, and, as a result, we will continue as the surviving corporation and a wholly owned subsidiary of Marlin HoldCo. Marlin HoldCo is owned by an investor group led by Lonnie C. Poole, Jr., our founder and Chairman, and Jim W. Perry, our President and Chief Executive Officer, and financial partners MIP Waste Holdings, L.P., an affiliate of Macquarie Infrastructure Partners, and GS Direct, LLC, an affiliate of Goldman, Sachs & Co.
The plaintiff seeks class action designation for the lawsuit, certifying the plaintiff as the class representative, enjoining the proposed merger, awarding plaintiff the costs and disbursements related to the lawsuit, including attorneys and financial expert fees, and such other relief as the court deems just and proper.
Although no assurances can be made with respect to any litigation, we believe all of the allegations of wrongdoing in the complaint to be without merit and denies any wrongdoing. In addition, we have been advised that the other defendants named in the complaint believe all of the allegations of wrongdoing in the complaint to be without merit and deny any breach of duty to or other wrongdoing with respect to the plaintiff and any plaintiff class, should one be designated.
On January 31, 2008, the plaintiff filed a voluntary dismissal, without prejudice, of all claims asserted in the complaint. However, because a putative class action may not be dismissed without approval of the court, the voluntary dismissal filed by plaintiff on January 31, 2008 is moot. On February 12, 2008, the parties submitted a proposed stipulation and order of voluntary dismissal to the court for consideration. On February 22, 2008, the court sent a notice of hearing to advise that at 11:00 a.m. on March 11, 2008, it will hear the parties on the proposed stipulation and order of dismissal. The parties attended a hearing in the North Carolina Business Court on March 11, 2008 to answer questions from the Judge relating to the joint stipulation of dismissal tendered by the parties to the court. The Judge asked the parties to submit some additional data to the court and counsel submitted that information on March 12, 2008. The parties are now awaiting a formal ruling from the court regarding whether it will approve dismissal of the putative shareholder action and, if so, on what terms.
24
ITEM 4. SUBMISSION OF MATTERS TO A VOTE OF SECURITY HOLDERS
No matters were submitted to a vote of security holders during the fourth quarter ended December 31, 2007.
EXECUTIVE OFFICERS
As of December 31, 2007, our executive officers were as follows:
| | | | | | |
Name | | Age | | Position(s) | | |
| Jim W. Perry | | 63 | | President, Chief Executive Officer and Director | | |
| Harry M. Habets | | 58 | | Chief Operating Officer | | |
| D. Stephen Grissom | | 55 | | Chief Financial Officer, Secretary and Treasurer | | |
| Harrell J. Auten | | 59 | | Vice President, Sales and Marketing | | |
| Lonnie C. Poole, III | | 46 | | Vice President, Corporate Development | | |
| Michael J. Durham | | 54 | | Vice President, Administration and Support Services | | |
JIM W. PERRY joined our company in 1971 and was named Chief Executive Officer in 2002 and has served as President since 1987 and as a director since 1974. Prior to that, Mr. Perry served as Chief Operating Officer from 1987 until 2002. Mr. Perry holds a B.S. in Agricultural and Biological Engineering from North Carolina State University and an M.S. in Systems Management from the University of Southern California. Mr. Perry has received the Distinguished Service Award from the National Solid Waste Management Association, or NSWMA and currently serves as Chairman of the Board of Governors for the 2007 year term. In addition, Mr. Perry has served in the Carolinas Chapter of NSWMA as Chairman and on the Membership Committee. Mr. Perry was inducted into the Environmental Industry Associations, or EIA, Hall of Fame in 1997. Mr. Perry has more than 36 years experience in the solid waste industry.
HARRY M. HABETS joined our company in 2002 as Vice President and Chief Operating Officer. From 1985 to 1999, Mr. Habets held various management positions with Waste Management, Inc., including Vice President of International Operations and Regional Vice President/Manager for collection, recycling and landfill disposal services in the Southeast. Mr. Habets holds a B.S. in Business Administration from Rochester Institute of Technology. Mr. Habets has 19 years of experience in the solid waste industry.
D. STEPHEN GRISSOM joined our company in 2001 as Chief Financial Officer and Vice President of Finance. Prior to that, Mr. Grissom was Chief Financial Officer for Austin Quality Foods from 1982 to 2000 and has more than 29 years of controllership and CFO experience. He is a Certified Public Accountant and holds a B.A. in Accounting from North Carolina State University.
HARRELL J. AUTEN was named Vice President, Sales and Marketing in 2005. Prior to that, Mr. Auten served as Vice President, South Division of our company since 1998 and served as our South Division Manager since 1993. Prior to that, Mr. Auten owned and operated his own company. Mr. Auten holds a B.S. in Business Administration from the University of North Carolina at Chapel Hill and has more than 36 years experience in the solid waste industry.
LONNIE C. POOLE, III was named Vice President of Corporate Development in 2002. Prior to that, Mr. Poole served as our Vice President, Director of Support Services since 1995. From 1990 to 1995, he served as our Risk Management Director. Mr. Poole holds a B.S. in Aerospace Engineering from North Carolina State University. Mr. Poole is the son of Lonnie C. Poole, Jr., Chairman of the Board. Mr. Poole has more than 17 years experience in the solid waste industry.
MICHAEL J. DURHAM was named Vice President of Administration and Support Services effective January 1, 2006. Prior to that, Mr. Durham held various management and controllership positions with Stantec Consulting Services Inc./DSATLANTIC Corporation and prior to that with Waste Management, Inc. Mr. Durham is a Certified Public Account and holds a B. S. in Accounting from Florida State University. Mr. Durham has more than 19 years experience in the solid waste industry.
25
OTHER KEY EMPLOYEES
The following table sets forth certain information concerning our other key employees as of December 31, 2007:
| | | | | | |
Name | | Age | | Position(s) | | |
| E. Franklin Lorick | | 53 | | Vice President—Central Division | | |
| Thomas A. Winstead | | 52 | | Vice President—East Division | | |
| Michael T. Ingle | | 42 | | Vice President—South Division | | |
| Jerry W. Johnson | | 56 | | Vice President—Landfill Division | | |
E. FRANKLIN LORICK was named Vice President of our company in 2002. Mr. Lorick joined us in 1989 and has held various positions including Operations Manager and Branch Manager. He attended Midlands Community College in Columbia, South Carolina and has over 19 years experience in the solid waste industry.
THOMAS A. WINSTEAD has served as a Vice President of our company since March 1998. He joined us in 1985 as a Branch Manager and has also served as East Regional Operations Manager from 1990 to 1997. He is a graduate of Atlantic Christian College with a B.S. in Health and Physical Education. Mr. Winstead has more than 23 years of experience in the solid waste industry.
MICHAEL T. INGLE was named Vice President of our company in 2005. After joining the Company in 1991, Mr. Ingle served as branch manager in various locations. Mr. Ingle is a graduate of Methodist College in Fayetteville, North Carolina and holds a B.A. in Business Administration. Mr. Ingle has over 17 years experience in the solid waste industry.
JERRY W. JOHNSON joined our company in 1991 and has served in various capacities that included developing our first Recycling Division and managing Field Support Services until his departure in 1995. Mr. Johnson then joined Atlantic Waste Disposal and served in various roles from transportation to General Management of Atlantic Waste of Virginia and New York until 1999. At that time, he rejoined our company as the North Carolina Landfill Division Manager. Mr. Johnson currently serves as Vice President of our Landfill Division and oversees all of our landfill operations. Mr. Johnson attended Wake Community College and has over 29 years in the solid waste industry.
None of our executive officers, directors or other key employees is related to any other executive officer, director or other key employee, except that Lonnie C. Poole, Jr., Chairman of the Board of Directors, and Lonnie C. Poole, III are father and son.
26
PART II
ITEM 5. MARKET FOR REGISTRANT’S COMMON EQUITY, RELATED STOCKHOLDER MATTERS AND ISSUER PURCHASES OF EQUITY SECURITIES
Market information.Our common stock trades on the Nasdaq Global Select Market under the symbol “WWIN”. The following table sets forth the quarterly high and low bid prices for the years indicated as reported by Nasdaq. These prices are based on quotations between dealers, which do not reflect retail mark-up, mark-down or commissions and might not reflect actual transactions.
| | | | | | |
| | | | | High | | Low |
2006 | | | | | | |
| | First quarter | | $21.67 | | $12.80 |
| | Second quarter | | $22.78 | | $17.44 |
| | Third quarter | | $28.67 | | $18.81 |
| | Fourth quarter | | $31.89 | | $26.41 |
| | | |
| | | | | High | | Low |
2007 | | | | | | |
| | First quarter | | $30.80 | | $24.24 |
| | Second quarter | | $35.50 | | $25.66 |
| | Third quarter | | $35.97 | | $26.00 |
| | Fourth quarter | | $37.14 | | $26.43 |
As of March 11, 2008, the number of shareholders of record of our common stock was 131 and we believe that the number of beneficial owners was approximately 2,000.
Dividends.Our Board of Directors declared and paid two dividends in the second quarter of 2007, each of which was approximately $1.7 million. We declared and paid cash dividends of approximately $1.7 million and $2.1 million in the third and fourth quarters of 2007, respectively.
Under our amended revolving bank facility, payment of cash dividends is limited to 50% of our trailing 12 months’ net income. Additionally, we must meet financial covenants contained in the facility, including covenants relating to minimum net worth and maximum levels of capital expenditures and indebtedness. If we are not in compliance with these covenants, or otherwise in default under the facility, we would not be able to pay cash dividends.
Pursuant to the merger agreement for the proposed going private transaction, which we executed on December 17, 2007, we are prohibited from paying cash dividends without the consent of Marlin HoldCo.
Equity Compensation Plan.The following table provides information as of December 31, 2007 for our equity-based compensation plan, which is our 2007 Long Term Incentive Plan. This plan replaces our 1997 Stock Plan which expired on April 21, 2007. All outstanding awards under our 1997 Plan, however, will remain in effect, subject to their respective termination dates.
27
| | | | | | | | |
Plan Category | | Number of
securities to be issued
upon exercise of
outstanding options,
warrants and rights | | Weighted-average
exercise price of
outstanding
options, warrants
and rights | | | Number of
securities remaining
available for
future issuance
under equity
compensation plans |
Equity compensation plans approved by our shareholders: | | | | | | | | |
1997 Stock Plan | | 201,020 | | $ | 18.01 | | | 273,252 |
2007 Long Term Incentive Plan | | 32,486 | | | n/a | * | | 1,265,401 |
Equity compensation plans not approved by our shareholders: | | | | | | | | |
None | | — | | | — | | | — |
| | | | | | | | |
Total | | 233,506 | | $ | 18.01 | | | 1,538,653 |
| | | | | | | | |
| * | In 2007, we granted 34,599 deferred stock awards which have no exercise price, of which 32,486 were outstanding as of December 31, 2007. |
Performance Graph
The following line graph and table illustrate the cumulative total shareholder return on our common stock over the last five fiscal years, beginning on January 1, 2003 and ending on December 31, 2007 and the cumulative total return over the same period of (1) the CRSP Total Market Return Index of the Nasdaq Stock Market and (2) the CRSP Nasdaq Non-Financial Stocks Total Return Index. The CRSP is the Center for Research and Securities Prices at the University of Chicago. The graph assumes an initial investment of $100 and reinvestment of all cash dividends.
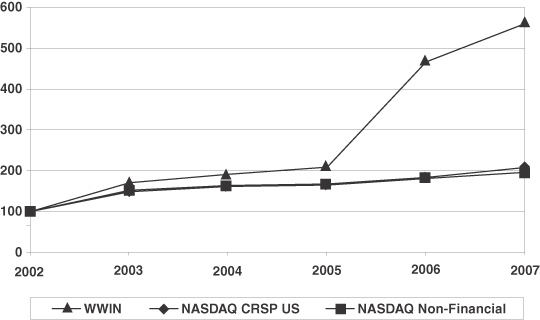
This performance graph shall not be deemed to be filed with the SEC or incorporated by reference into any of our previous or future filings with the SEC, except as otherwise explicitly specified by us in any such filing.
ITEM 6. SELECTED FINANCIAL DATA
The following selected financial data should be read in conjunction with the consolidated financial statements and the notes thereto included elsewhere in this report. The consolidated statement of operations data set forth below with respect to the years ended December 31, 2005, 2006 and 2007 and the consolidated balance sheet data as of December 31, 2006 and 2007 are derived from, and are referenced to, our audited consolidated financial statements included elsewhere in this report. The consolidated statement of operations data set forth below with respect to the years ended December 31, 2003 and 2004 and the consolidated balance sheet data as of December 31, 2003, 2004 and 2005 are derived from audited financial statements not included in this report. Historical results are not necessarily indicative of future results. All periods presented reflect the impact of operations discontinued in 2005 and 2006. There were no operations discontinued in 2007.
28
| | | | | | | | | | | | | | | | | | | | |
| | | YEAR ENDED DECEMBER 31, | |
| | | 2003 | | | 2004 | | | 2005 | | | 2006 | | | 2007 | |
| | | (In thousands, except per share data) | |
Statement of Operations Data: | | | | | | | | | | | | | | | | | | | | |
Service revenues | | $ | 259,631 | | | $ | 280,709 | | | $ | 304,466 | | | $ | 326,447 | | | $ | 339,599 | |
Equipment sales | | | 1,240 | | | | 861 | | | | 641 | | | | 1,098 | | | | 1,069 | |
| | | | | | | | | | | | | | | | | | | | |
Total revenues | | | 260,871 | | | | 281,570 | | | | 305,107 | | | | 327,545 | | | | 340,668 | |
Cost of service operations | | | 168,937 | | | | 189,204 | | | | 204,990 | | | | 212,171 | | | | 215,006 | |
Cost of equipment sales | | | 780 | | | | 470 | | | | 384 | | | | 666 | | | | 629 | |
Selling, general and administrative (1) (6) (7) | | | 37,439 | | | | 39,167 | | | | 42,208 | | | | 43,167 | | | | 47,509 | |
Depreciation and amortization | | | 29,122 | | | | 28,442 | | | | 29,908 | | | | 32,093 | | | | 31,751 | |
Gain (loss) on sale of property, equipment and other assets | | | 335 | | | | (1,274 | ) | | | (1,374 | ) | | | (1,189 | ) | | | (1,624 | ) |
Gain on sale of collection and hauling operations (3) | | | (720 | ) | | | (3,482 | ) | | | — | | | | — | | | | — | |
Impairment of property, equipment and other assets (2) | | | 517 | | | | 1,707 | | | | 143 | | | | 223 | | | | 16 | |
| | | | | | | | | | | | | | | | | | | | |
Operating income | | | 24,461 | | | | 27,336 | | | | 28,848 | | | | 40,414 | | | | 47,381 | |
Interest expense | | | 9,891 | | | | 9,931 | | | | 9,833 | | | | 9,608 | | | | 9,871 | |
Interest income | | | (141 | ) | | | (128 | ) | | | (96 | ) | | | (181 | ) | | | (126 | ) |
Other income | | | (96 | ) | | | (304 | ) | | | (231 | ) | | | (418 | ) | | | (193 | ) |
| | | | | | | | | | | | | | | | | | | | |
Income from continuing operations before income taxes and cumulative effect of change in accounting principle | | | 14,807 | | | | 17,837 | | | | 19,342 | | | | 31,405 | | | | 37,829 | |
Income tax expense | | | 6,077 | | | | 6,588 | | | | 7,792 | | | | 14,416 | | | | 14,301 | |
| | | | | | | | | | | | | | | | | | | | |
Income from continuing operations before cumulative effect of a change in accounting principle | | | 8,730 | | | | 11,249 | | | | 11,550 | | | | 16,989 | | | | 23,528 | |
Discontinued operations: (3) | | | | | | | | | | | | | | | | | | | | |
Income from discontinued operations prior to sale (net of income taxes) | | | 160 | | | | 548 | | | | 454 | | | | 10 | | | | — | |
Gain on sale of operations (net of income taxes) (4) | | | — | | | | — | | | | 185 | | | | 2,282 | | | | 153 | |
| | | | | | | | | | | | | | | | | | | | |
Income from discontinued operations | | | 160 | | | | 548 | | | | 639 | | | | 2,292 | | | | 153 | |
Cumulative effect of a change in accounting principle, net of income tax benefit of $614 (5) | | | (1,067 | ) | | | — | | | | — | | | | — | | | | — | |
| | | | | | | | | | | | | | | | | | | | |
Net Income | | $ | 7,823 | | | $ | 11,797 | | | $ | 12,189 | | | $ | 19,281 | | | $ | 23,681 | |
| | | | | | | | | | | | | | | | | | | | |
Earnings per share | | | | | | | | | | | | | | | | | | | | |
Basic: | | | | | | | | | | | | | | | | | | | | |
Income from continuing operations before cumulative effect of a change in accounting principle | | $ | 0.65 | | | $ | 0.83 | | | $ | 0.85 | | | $ | 1.22 | | | $ | 1.67 | |
Income from discontinued operations | | | 0.01 | | | | 0.04 | | | | 0.04 | | | | 0.17 | | | | 0.01 | |
Cumulative effect of a change in accounting principle (5) | | | (0.08 | ) | | | — | | | | — | | | | — | | | | — | |
| | | | | | | | | | | | | | | | | | | | |
Net Income | | $ | 0.58 | | | $ | 0.87 | | | $ | 0.89 | | | $ | 1.39 | | | $ | 1.68 | |
| | | | | | | | | | | | | | | | | | | | |
Diluted: | | | | | | | | | | | | | | | | | | | | |
Income from continuing operations before cumulative effect of a change in accounting principle | | $ | 0.64 | | | $ | 0.82 | | | $ | 0.84 | | | $ | 1.21 | | | $ | 1.66 | |
Income from discontinued operations | | | 0.02 | | | | 0.04 | | | | 0.04 | | | | 0.16 | | | | 0.01 | |
Cumulative effect of a change in accounting principle (5) | | | (0.08 | ) | | | — | | | | — | | | | — | | | | — | |
| | | | | | | | | | | | | | | | | | | | |
Net Income | | $ | 0.58 | | | $ | 0.86 | | | $ | 0.88 | | | $ | 1.37 | | | $ | 1.67 | |
| | | | | | | | | | | | | | | | | | | | |
| | | | | | | | | | | | | | | | | | | | |
Weighted-average shares outstanding: | | | | | | | | | | | | | | | | | | | | |
Basic | | | 13,439 | | | | 13,497 | | | | 13,661 | | | | 13,871 | | | | 14,088 | |
| | | | | | | | | | | | | | | | | | | | |
Diluted | | | 13,558 | | | | 13,665 | | | | 13,821 | | | | 14,043 | | | | 14,196 | |
| | | | | | | | | | | | | | | | | | | | |
| (1) | 2004 includes a charge of approximately $2.5 million to bad debt expense to write off or reserve for accounts receivable of a major customer. |
29
| (2) | Includes asset impairments. The 2004 results include a $1.4 million charge (or $0.07 per diluted share, net of income tax) Related to our determination that certain landfill permitting efforts had a less than probable chance of success. The 2006 results include a $0.2 million charge (or $.01 per diluted share, net of income tax) related to our determination that certain landfill permitting efforts had a less than probable chance of success. |
| (3) | The 2004 results include a gain of approximately $3.5 million (or $0.16 per diluted share, net of income tax) related to the sale of certain collection and hauling operations. Business dispositions occurring after January 1, 2005 have been reflected as discontinued operations. See Note 1 of our Notes to Consolidated Financial Statements. |
| (4) | The 2006 results include a gain of approximately $2.2 million (or $0.16 per diluted share, net of income tax) related to the sale of a landfill operation in Jacksonville, Florida. See Note 2 of our Notes to Consolidated Financial Statements. |
| (5) | As required, we adopted SFAS No. 143,Accounting for Asset Retirement Obligations, on January 1, 2003. In connection with the adoption of SFAS No. 143, we recorded a charge in 2003 of approximately $1.1 million (net of income taxes of $614,000), or $0.08 per share, for the cumulative effect of a change in accounting principle. |
| (6) | As required, we adopted SFAS No. 123R,Share-Based Payment, on January 1, 2006. In connection with the adoption of SFAS No. 123R, we recorded expense of approximately $0.5 million or $0.04 per share for 2006. |
| (7) | The 2007 results include approximately $1.9 million in professional fees associated with the proposed going private transaction. |
| | | | | | | | | | | | | | | | | | | | |
| | | YEAR ENDED DECEMBER 31, | |
| | | 2003 | | | 2004 | | | 2005 | | | 2006 | | | 2007 | |
| | | (In thousands, except per share data) | |
Other Operating Data: | | | | | | | | | | | | | | | | | | | | |
Net cash provided by operating activities | | $ | 39,076 | | | $ | 46,484 | | | $ | 46,370 | | | $ | 45,066 | | | $ | 64,340 | |
Net cash used in investing activities | | | (48,924 | ) | | | (34,210 | ) | | | (54,980 | ) | | | (29,688 | ) | | | (64,581 | ) |
Net cash provided by (used in) financing activities | | | 12,241 | | | | (13,956 | ) | | | 7,740 | | | | (15,297 | ) | | | 2,946 | |
| | | | | |
Balance Sheet Data: | | | | | | | | | | | | | | | | | | | | |
Cash and cash equivalents | | $ | 4,127 | | | $ | 2,445 | | | $ | 1,575 | | | $ | 1,656 | | | $ | 4,361 | |
Working capital (deficit) | | | (305 | ) | | | (6,855 | ) | | | (14,647 | ) | | | (109 | ) | | | (5,579 | ) |
Property and equipment, net | | | 191,309 | | | | 198,551 | | | | 216,390 | | | | 218,039 | | | | 234,034 | |
Total assets | | | 330,528 | | | | 337,048 | | | | 368,155 | | | | 370,279 | | | | 409,033 | |
Long-term debt and capital lease obligations, net of current maturities | | | 157,657 | | | | 146,136 | | | | 155,530 | | | | 150,249 | | | | 157,941 | |
Shareholders’ equity | | $ | 106,959 | | | $ | 117,711 | | | $ | 129,499 | | | $ | 145,871 | | | $ | 163,389 | |
| | | | | |
Cash dividends declared and paid per share | | $ | 0.08 | | | $ | 0.16 | | | $ | 0.24 | | | $ | 0.38 | | | $ | 0.51 | |
30
ITEM 7. MANAGEMENT’S DISCUSSION AND ANALYSIS OF FINANCIAL CONDITION AND RESULTS OF OPERATIONS
The following discussion should be read in conjunction with our consolidated financial statements for the years ended December 31, 2006 and 2007 and notes thereto included in this report.
Overview
We are a regional, vertically integrated provider of solid waste services. We were founded by our Chairman of the Board of Directors in 1970. We operate in North Carolina, South Carolina, Virginia, Mississippi, Tennessee and Georgia, providing solid waste collection, transfer, recycling, processing and disposal services for commercial, industrial, municipal and residential customers. At December 31, 2007, we operated 34 collection operations, 29 transfer stations, approximately 66 county convenience drop-off centers, 12 recycling facilities and nine landfills in the Southeastern U.S. We had revenues of $327.5 million and operating income of $40.4 million in the year ended December 31, 2006, and revenues of $340.7 million and operating income of $47.4 million in the year ended December 31, 2007.
Total revenues attributable to services provided are as follows (dollars in thousands):
| | | | | | | | | |
| | | Year Ended December 31, |
| | | 2005 | | 2006 | | 2007 |
Collection: | | | | | | | | | |
Residential | | $ | 66,907 | | $ | 74,933 | | $ | 81,218 |
Commercial | | | 83,882 | | | 91,555 | | | 96,221 |
Industrial | | | 86,194 | | | 89,933 | | | 88,241 |
Disposal and transfer | | | 44,297 | | | 46,285 | | | 48,375 |
Recycling service | | | 4,820 | | | 4,719 | | | 4,422 |
Recycled commodity sales | | | 4,997 | | | 3,941 | | | 4,739 |
Other | | | 13,369 | | | 15,081 | | | 16,383 |
| | | | | | | | | |
Total service revenues | | $ | 304,466 | | $ | 326,447 | | $ | 339,599 |
| | | | | | | | | |
From 1990 through December 31, 2007, we acquired, either by merger or asset purchase, 115 solid waste collection or disposal operations, with nine being acquired in 2007, eight being acquired in 2006 and 14 being acquired in 2005. All of these acquisitions were accounted for as business combinations. Accordingly, the results of operations of these acquired businesses have been included in our financial statements only from the respective dates of acquisition and have affected period-to-period comparisons of our operating results. During the year ended December 31, 2007, we did not have any significant acquisitions requiring the presentation of the acquired company’s historical financial statements. We anticipate that a significant part of our future growth will come from acquiring additional solid waste collection, transfer and disposal businesses and, therefore, we expect that additional acquisitions could continue to affect period-to-period comparisons of our operating results. Current levels of population growth and economic development in the Southeastern U.S. and our strong market presence in the region should provide an opportunity to increase our revenues and market share. As we add customers in existing markets, our density should improve, which we expect will increase our collection efficiencies and profitability.
31
Executive Summary
In 2007, we continued to focus on our initiatives for achieving positive results and improving our performance. They are:
| | • | | Strengthening our competitive position in desired markets; |
| | • | | Internalizing more of our waste volume; |
| | • | | Increasing revenues from our landfill operations; and |
| | • | | Employing best practices to deliver exceptional service. |
Our performance for 2007 was impacted by the business climate we operate within, which saw:
| | • | | Increased service delivery costs primarily due to higher fuel prices and costs to transfer waste; and |
| | • | | A downturn in certain sectors of our business due to worsening general economic conditions. |
Despite these challenges, our revenues increased 4.0% to $340.7 million and our revenues per man-hour improved by 3.2%. In 2007, we performed extensive rerouting of collection operations acquired throughout the year. In addition, we have increased employee training and centered our efforts on fleet maintenance, data management, and customer pricing. We believe these efforts will better position our company for growth in 2008.
Service revenue growth of 4.0% was primarily comprised of 1.0% internal growth and 2.8% of net acquisition growth. Approximately 2.2% of the internal growth was due to pricing. We implemented a pricing strategy to adjust pricing on accounts that were not meeting standards, and in some cases, we chose to give up accounts that refused reasonable price increases, resulting in a negative 1.5% volume component of internal growth for 2007. Energy surcharges contributed additional growth of 0.3% in 2007 as we continued to adjust pricing to cover certain inflationary costs, as discussed below.
Acquisition growth was 2.8% during 2007, impacted by 17 business acquisitions and two business dispositions over the two-year period ended December 31, 2007. Revenues from acquisition activity are considered in acquisition growth until the first anniversary date of the acquisition. All acquisitions in 2006 and 2007 were tuck-ins and a continuation of our plan to expand in selected markets in order to achieve better route density and leverage our overhead cost structure.
We have experienced, as have others in our industry sector, increased operating costs which include higher fuel costs, third party disposal fees, and transfer costs. Most significantly, our average fuel cost per gallon increased approximately 6.2% in 2007. We implemented a fuel surcharge program in late 2005 based upon a regional fuel index, which is designed to recover most of the fuel cost increases.
Our 2007 capital expenditures of approximately $36.9 million decreased by $4.3 million over the prior year. These capital expenditures included $14.6 million primarily related to cell construction at our landfills.
In 2007, we paid $7.2 million in cash dividends compared to $5.3 million in 2006.
Despite higher capital spending and increased cash dividend payments, our debt to total capitalization ratio of 50.3% at December 31, 2007 improved over the prior year ratio of 51.9%. We believe our $200 million revolving credit facility, which matures in October 2009, provides sufficient capital in combination with our cash flow from operating activities to fund our near term growth strategy, capital expenditures and dividends. As of December 31, 2007, we had approximately $26.0 million available under this facility.
General
Our branch waste collection operations generate revenues from fees collected from commercial, industrial and residential collection and transfer station customers. We derive a substantial portion of our collection revenues from commercial and industrial services that are performed under one-year to five-year service agreements. Our residential collection services are performed either on a subscription basis with individual households, or under contracts with municipalities, apartment owners, homeowners associations or mobile home park operators. Residential customers on a subscription basis are billed quarterly in advance and provide us with a stable source of revenues. A liability for future service is recorded upon billing and revenues are recognized during the month in which services are actually provided. Municipal contracts in our existing markets are typically awarded, at least initially, on a competitive bid basis and thereafter on a bid or negotiated basis and usually range in duration from one to five years. Municipal contracts provide consistent cash flow during the terms of the contracts.
32
Our prices for our solid waste services are typically determined by the collection frequency and level of service, route density, volume, weight and type of waste collected, type of equipment and containers furnished, the distance to the disposal or processing facility, the cost of disposal or processing, and prices charged in our markets for similar services.
Our ability to pass on cost increases is sometimes limited by the terms of our contracts. Long-term solid waste collection contracts typically contain a formula, generally based on a predetermined published price index, for automatic adjustment of fees to cover increases in some, but not all, operating costs.
At December 31, 2007, we operated approximately 66 convenience sites under contract with nine counties in order to consolidate waste in rural areas. These contracts, which are usually competitively bid, generally have terms of one to five years and provide consistent cash flow during the term of the contract since we are paid regularly by the local government. At December 31, 2007, we also operated 12 recycling processing facilities as part of our collection and transfer operations where we collect, process, sort and recycle paper products, aluminum and steel cans, pallets, plastics, glass and other items. Our recycling facilities generate revenues from the collection, processing and resale of recycled commodities, particularly recycled wastepaper. Through a centralized effort, we resell recycled commodities using commercially reasonable practices and seek to manage commodity-pricing risk by spreading the risk among our customers. We also operate curbside residential recycling programs in connection with our residential collection operations in most of the communities we serve.
Operating expenses for our collection operations include labor, fuel, equipment maintenance and tipping fees paid to landfills. At December 31, 2007, we operated or transferred from 29 transfer stations that reduce our costs by improving our utilization of collection personnel and equipment and by consolidating the waste stream to gain more favorable disposal rates. At December 31, 2007, we owned or operated nine landfills. Operating expenses for these landfill operations include labor, equipment, legal and administrative, ongoing environmental compliance, host community fees, site maintenance and accruals for closure and post-closure maintenance.
Cost of equipment sales primarily consists of our cost to purchase the disposal compactors and containers that we resell.
We capitalize certain expenditures related to pending acquisitions or development projects that meet stringent capitalization criteria. Indirect acquisition and project development costs, such as executive and corporate overhead, public relations and other corporate services, are expensed as incurred. Our policy is to charge against net income any unamortized capitalized expenditures and advances (net of any portion thereof that we estimate to be recoverable, through sale or otherwise) relating to any operation that is permanently shut down, any acquisition that is not consummated and any landfill development project that is not expected to be successfully completed. Engineering, legal, permitting, construction and other costs directly associated with the acquisition or development of a landfill, together with associated interest, are capitalized.
Selling, general and administrative, or SG&A, expenses include management salaries, clerical and administrative overhead, professional services, costs associated with our marketing and sales force and community relations expense.
Property and equipment are depreciated over the estimated useful life of the assets using the straight-line method.
Other income has not historically been material to our results of operations.
To date, inflation has not had a significant impact on our operations.
33
RESULTS OF OPERATIONS
The following table sets forth for the periods indicated the individual line items reflected in our consolidated statements of operations (some items have been condensed for presentation purposes only):
| | | | | | | | | | | | |
| | | YEAR ENDED DECEMBER 31, | |
| | | (In thousands) | |
| | | 2005 | | | 2006 | | | 2007 | |
Service revenues | | $ | 304,466 | | | $ | 326,447 | | | $ | 339,599 | |
Equipment sales | | | 641 | | | | 1,098 | | | | 1,069 | |
| | | | | | | | | | | | |
Total revenues | | | 305,107 | | | | 327,545 | | | | 340,668 | |
| | | |
Operations | | | 204,990 | | | | 212,171 | | | | 215,006 | |
Cost of equipment sales | | | 384 | | | | 666 | | | | 629 | |
Selling, general and administrative | | | 42,208 | | | | 43,167 | | | | 47,509 | |
Depreciation and amortization | | | 29,908 | | | | 32,093 | | | | 31,751 | |
Gain on sale of property, equipment and other assets | | | (1,374 | ) | | | (1,189 | ) | | | (1,624 | ) |
Impairment of property, equipment and other assets | | | 143 | | | | 223 | | | | 16 | |
| | | | | | | | | | | | |
Operating income | | | 28,848 | | | | 40,414 | | | | 47,381 | |
| | | |
Interest expense, net of interest income | | | 9,738 | | | | 9,427 | | | | 9,871 | |
Other income | | | (232 | ) | | | (418 | ) | | | (319 | ) |
| | | | | | | | | | | | |
Income from continuing operations before income tax expense | | | 19,342 | | | | 31,405 | | | | 37,829 | |
Income tax expense | | | 7,792 | | | | 14,416 | | | | 14,301 | |
| | | | | | | | | | | | |
Income from continuing operations | | | 11,550 | | | | 16,989 | | | | 23,528 | |
Income from discontinued operations | | | 639 | | | | 2,292 | | | | 153 | |
| | | | | | | | | | | | |
Net Income | | $ | 12,189 | | | $ | 19,281 | | | $ | 23,681 | |
| | | | | | | | | | | | |
34
The following table sets forth for the periods indicated the percentage of revenues represented by the individual line items reflected in our statements of operations (some items have been condensed for presentation purposes only):
| | | | | | | | | |
| | | YEAR ENDED DECEMBER 31, | |
| | | 2005 | | | 2006 | | | 2007 | |
Service revenues | | 99.8 | % | | 99.7 | % | | 99.7 | % |
Equipment sales | | 0.2 | | | 0.3 | | | 0.3 | |
| | | | | | | | | |
Total revenues | | 100.0 | | | 100.0 | | | 100.0 | |
| | | |
Operations | | 67.2 | | | 64.8 | | | 63.1 | |
Cost of equipment sales | | 0.1 | | | 0.2 | | | 0.2 | |
Selling, general and administrative | | 13.8 | | | 13.2 | | | 13.9 | |
Depreciation and amortization | | 9.8 | | | 9.8 | | | 9.3 | |
Gain on sale of property, equipment and other assets | | (0.4 | ) | | (0.4 | ) | | (0.4 | ) |
Impairment of property, equipment and other assets | | — | | | 0.1 | | | — | |
| | | | | | | | | |
Operating income | | 9.5 | | | 12.3 | | | 13.9 | |
| | | |
Interest expense, net of interest income | | 3.2 | | | 2.9 | | | 2.9 | |
Other income | | — | | | (0.2 | ) | | (0.1 | ) |
| | | | | | | | | |
Income from continuing operations before income tax expense | | 6.3 | | | 9.6 | | | 11.1 | |
| | | |
Income tax expense | | 2.5 | | | 4.4 | | | 4.2 | |
| | | | | | | | | |
Income from continuing operations | | 3.8 | | | 5.2 | | | 6.9 | |
| | | | | | | | | |
Income from discontinued operations | | 0.2 | | | 0.7 | | | — | |
| | | | | | | | | |
Net Income | | 4.0 | % | | 5.9 | % | | 6.9 | % |
| | | | | | | | | |
Year Ended December 31, 2007 Compared To Year Ended December 31, 2006
Revenues.Total revenues increased $13.1 million, or 4.0%, to $340.7 million in 2007 from $327.5 million in 2006. This increase was attributable primarily to increases in residential collection revenue of $6.3 million, commercial collection revenue of $4.7 million, and disposal revenue of $2.2 million.
The following table provides the components of service revenue growth:
| | | |
SERVICE REVENUE GROWTH | | 2007 | |
Price | | 2.2 | % |
Volume | | (1.5 | )% |
Energy surcharge | | 0.3 | % |
| | | |
Total Internal Growth | | 1.0 | % |
Commodities | | 0.2 | % |
Acquisitions | | 2.8 | % |
| | | |
Total Service Revenue Growth | | 4.0 | % |
| | | |
Service revenue growth of 4.0% was comprised of 1.0% internal growth and 2.8% of net acquisition growth. Approximately 2.2% of the internal growth was due to pricing. We implemented a pricing strategy to adjust pricing on accounts that were not meeting standards. In some cases, we chose to give up accounts that refused reasonable price increases, resulting in a negative 1.5% volume component of internal growth for 2007. Energy surcharges contributed additional growth of 0.3% in 2007 as we continued to adjust pricing to cover certain inflationary costs.
35
Cost of Operations. Costs of operations (including equipment sales) increased $2.8 million, or 1.3%, to $215.6 million in 2007 from $212.8 million in 2006. Cost of operations as a percentage of revenue decreased in 2007 to 63.3% from 65.0% in the prior year period.
The following table summarizes the components of cost of operations as a percentage of revenue:
| | | | | | | | | |
| | | 2006 | | | 2007 | | | Change | |
Labor and related benefits | | 18.8 | % | | 18.7 | % | | -0.1 | % |
Landfill fees, transfer and disposal | | 25.4 | % | | 23.7 | % | | -1.7 | % |
Fuel | | 5.8 | % | | 6.0 | % | | 0.2 | % |
Repairs and maintenance - fleet | | 6.4 | % | | 6.6 | % | | 0.2 | % |
Insurance | | 6.0 | % | | 5.8 | % | | -0.2 | % |
Other | | 2.4 | % | | 2.3 | % | | -0.1 | % |
| | | | | | | | | |
Total cost of service operations | | 64.8 | % | | 63.1 | % | | -1.7 | % |
| | | |
Cost of equipment sales | | 0.2 | % | | 0.2 | % | | 0.0 | % |
| | | | | | | | | |
Cost of operations including equipment sales | | 65.0 | % | | 63.3 | % | | -1.7 | % |
| | | | | | | | | |
Disposal costs continue to decrease as a percentage of revenue as more of the waste we collect is disposed into our landfills. Fuel costs increased 6.2% on a per-gallon basis for the year ended December 31, 2007, compared with the same period in 2006.
Selling, General & Administrative Expenses.SG&A expenses increased $4.3 million, or 10.1%, to $47.5 million in 2007 from $43.2 million in 2006. SG&A as a percentage of revenues increased to 13.9% in 2007 from 13.2% in 2006.
The following table summarizes the components of SG&A expenses (amounts in thousands):
| | | | | | | | | | |
| | | 2006 | | 2007 | | Change | |
Labor and related benefits | | $ | 23,378 | | $ | 24,830 | | $ | 1,452 | |
Provision for doubtful accounts | | | 569 | | | 1,678 | | | 1,109 | |
Professional fees | | | 5,246 | | | 6,198 | | | 952 | |
Insurance | | | 2,183 | | | 2,467 | | | 284 | |
Rent | | | 2,122 | | | 2,058 | | | (64 | ) |
Travel and entertainment | | | 1,592 | | | 1,881 | | | 289 | |
Utilities | | | 1,403 | | | 1,187 | | | (129 | ) |
Other | | | 6,674 | | | 7,210 | | | 449 | |
| | | | | | | | | | |
Total SG&A | | $ | 43,167 | | $ | 47,509 | | $ | 4,342 | |
| | | | | | | | | | |
Labor and related benefits increased primarily due to increased administrative headcount and wage increases. The increase in our provision for doubtful accounts was primarily due to the collection in 2006, of an approximately $0.8 million receivable previously included in the allowance for doubtful accounts. The increase in professional fees is primarily attributable to approximately $1.9 million of fees associated with the proposed going private transaction.
36
Depreciation and Amortization.Depreciation and amortization expense includes:
| | • | | depreciation of property and equipment on a straight-line basis from 3 to 30 years; |
| | • | | amortization of landfill costs on a units-of-consumption basis as the landfill airspace is consumed; |
| | • | | amortization of landfill asset retirement costs as the landfill airspace is consumed; and |
| | • | | amortization of intangible assets with a definite life over 5 to 10 years, using either a 200% declining balance approach or straight-line basis, based on the economic benefit we expect to receive. |
Depreciation and amortization expense decreased by $0.3 million, or 1.1%, for the year ended December 31, 2007 compared to the same period in 2006 as a result of decreased landfill amortization, partially offset by increased depreciation on fixed assets.
Gain on Sale of Property and Equipment and Other Assets.The amounts reflected for 2006 and 2007 represent gains on sales of operating assets, typically facilities and collection vehicles.
Asset Impairment. The 2006 amounts primarily represent impairment of capitalized landfill development costs as we determined the likelihood of successful completion was less than probable. The amounts in 2007 represent impairment of fixed assets temporarily taken out of service.
Interest Expense (net of interest income).Interest expense (net of interest income) increased in 2007 primarily due to additional debt to fund acquisitions, timing of debt repayment and interest rates.
Income Tax Expense.The effective income tax rate decreased to 37.8% in 2007 from a rate of 45.9% in 2006 primarily due to released FIN 48 positions as a result of tax statute expirations and deferred tax adjustments in 2007. The 2006 tax rate was affected by the revaluation of our deferred tax liabilities at a higher estimated deferred tax rate resulting from apportionment and re-assessment of state tax planning strategies.
Discontinued Operations.Income from discontinued operations, net of income taxes decreased $2.1 million from 2006. In 2006, we disposed of a landfill operation (effective April 1, 2006) in the Jacksonville, Florida market, resulting in a cumulative after-tax gain of $2.2 million. In 2007, we recognized an additional after-tax gain of approximately $0.2 million on this sale as a result of receipt of additional proceeds.
Net Income.Net income increased $4.4 million, or 22.8%, to $23.7 million in 2007 from $19.3 million in 2006. This increase was primarily due to overall higher gross margin and favorable income tax adjustments, partially offset by higher SG&A expenses and no gain on discontinued operations for 2007.
37
Year Ended December 31, 2006 Compared To Year Ended December 31, 2005
Revenues.Total revenues increased $22.4 million, or 7.4%, to $327.5 million in 2006 from $305.1 million in 2005. This increase was attributable primarily to increases in residential collection revenue of $8.0 million, commercial collection revenue of $7.7 million, and industrial revenue of $3.7 million.
The following table provides the components of service revenue growth:
| | | |
SERVICE REVENUE GROWTH | | 2006 | |
Price | | 4.1 | % |
Volume | | (2.3 | )% |
Energy surcharge | | 1.1 | % |
| | | |
Total Internal Growth | | 2.9 | % |
Commodities | | (0.4 | )% |
Acquisitions, net of dispositions | | 4.7 | % |
| | | |
Total Service Revenue Growth | | 7.2 | % |
| | | |
Service revenue growth of 7.2% was comprised of 2.9% internal growth and 4.7% of net acquisition growth. Of that internal growth, approximately 4.1% was due to pricing. We implemented a pricing strategy to adjust pricing on accounts that were not meeting standards and in some cases, we chose to give up accounts that refused reasonable price increases, resulting in a negative 2.3% volume component of internal growth for 2006. Energy surcharges contributed additional growth of 1.1% in 2006 as we continued to adjust pricing to cover certain inflationary costs.
Cost of Operations. Costs of operations (including equipment sales) increased $7.5 million, or 3.6%, to $212.8 million in 2006 from $205.4 million in 2005. Cost of operations as a percentage of revenue decreased in 2006 to 65.0% from 67.3% in the prior year period.
The following table summarizes the components of cost of operations as a percentage of revenue:
| | | | | | | | | |
| | | 2005 | | | 2006 | | | Change | |
Labor and related benefits | | 16.9 | % | | 18.8 | % | | 1.9 | % |
Landfill fees, transfer and disposal | | 28.2 | % | | 25.4 | % | | -2.8 | % |
Fuel | | 5.5 | % | | 5.8 | % | | 0.3 | % |
Repairs and maintenance - fleet | | 5.8 | % | | 6.4 | % | | 0.6 | % |
Insurance | | 6.9 | % | | 6.0 | % | | -0.9 | % |
Other | | 3.9 | % | | 2.4 | % | | -1.5 | % |
| | | | | | | | | |
Total cost of service operations | | 67.2 | % | | 64.8 | % | | -2.4 | % |
| | | |
Cost of equipment sales | | 0.1 | % | | 0.2 | % | | 0.1 | % |
| | | | | | | | | |
Cost of operations including equipment sales | | 67.3 | % | | 65.0 | % | | -2.3 | % |
| | | | | | | | | |
Disposal costs continue to decrease as a percentage of revenue as more of the waste we collect is disposed into our landfills. Casualty and workers compensation insurance costs were lower due to favorable insurance pricing as well as an improved experience rating. Fuel costs increased 11% on a per-gallon basis for the year ended December 31, 2006, compared with the same period in 2005.
38
Selling, General & Administrative Expenses.SG&A increased $1.0 million, or 2.3%, to $43.2 million in 2006 from $42.2 million in 2005. SG&A as a percentage of revenues decreased to 13.2% in 2006 from 13.8% in 2005.
The following table summarizes the components of SG&A expenses (amounts in thousands):
| | | | | | | | | | |
| | | 2005 | | 2006 | | Change | |
Labor and related benefits | | $ | 20,642 | | $ | 23,378 | | $ | 2,736 | |
Provision for doubtful accounts | | | 2,033 | | | 569 | | | (1,464 | ) |
Professional fees | | | 6,402 | | | 5,246 | | | (1,156 | ) |
Insurance | | | 2,132 | | | 2,183 | | | 51 | |
Rent | | | 1,974 | | | 2,122 | | | 148 | |
Travel and entertainment | | | 1,736 | | | 1,592 | | | (144 | ) |
Utilities | | | 1,667 | | | 1,403 | | | (264 | ) |
Other | | | 5,622 | | | 6,674 | | | 1,052 | |
| | | | | | | | | | |
Total SG&A | | $ | 42,208 | | $ | 43,167 | | $ | 959 | |
| | | | | | | | | | |
Labor and related benefits increased as we increased our administrative headcount, incentive-based compensation, stock option expense and our provision for unvested earned leave benefits. The decrease in our provision for doubtful accounts was primarily due to the collection in 2006 of an approximately $0.8 million receivable previously included in the allowance for doubtful accounts. The decrease in professional fees is primarily attributable to reduced reliance on external resources for Sarbanes-Oxley compliance.
Depreciation and Amortization.Depreciation and amortization expense includes:
| | • | | depreciation of property and equipment on a straight-line basis from 3 to 30 years; |
| | • | | amortization of landfill costs on a units-of-consumption basis as the landfill airspace is consumed; |
| | • | | amortization of landfill asset retirement costs as the landfill airspace is consumed; and |
| | • | | amortization of intangible assets with a definite life over 5 to 10 years, using either a 200% declining balance approach or straight-line basis, based on the economic benefit we expect to receive. |
Depreciation and amortization expense increased by $2.2 million, or 7.3%, for the year ended December 31, 2006 compared to the same period in 2005 as a result of fixed asset and intangible asset additions. Included in depreciation and amortization expense for the year ended December 31, 2006 was a favorable adjustment related to change in estimated lives and salvage values of certain collection vehicles and approximately $0.4 million in additional landfill amortization resulting from our annual SFAS No. 143 landfill review.
Gain on Sale of Property and Equipment and Other Assets.The amounts reflected for 2005 and 2006 represent gains on sale of operating assets, typically facilities and collection vehicles.
Asset Impairment. The amounts represented in 2005 represent impairment of fixed assets temporarily taken out of service. The 2006 amounts primarily represent impairment of capitalized landfill development costs as we determined the likelihood of successful completion was less than probable.
Interest Expense (net of interest income).Interest expense (net of interest income) decreased in 2006 primarily due to repayment of debt with proceeds from the sale of a landfill operation.
Income Tax Expense.The effective income tax rate increased to 45.9% in 2006 from a rate of 40.3% in 2005 primarily due to revaluing our deferred tax liabilities at a higher estimated deferred tax rate of 39.3%, resulting from apportionment and re-assessment of state tax planning strategies.
Discontinued Operations.Income from discontinued operations, net of income taxes increased $1.6 million from 2005. In 2005, we disposed of certain operations in the Atlanta market area. In 2006, we disposed of a landfill operation (effective April 1, 2006) in the Jacksonville, Florida market, resulting in a cumulative after-tax gain of $2.2 million. These dispositions are reflected in the consolidated statements of operations as if they had occurred on January 1, 2004.
39
Net Income.Net income increased $7.1 million, or 58.2%, to $19.3 million in 2006 from $12.2 million in 2005. This increase was primarily due to overall higher gross margin and the gain on the sale of discontinued operations, partially offset by increased depreciation and amortization, SG&A expenses, and income tax expense.
Liquidity and Capital Resources
Our working capital was a negative $5.6 million and a negative $0.1 million at December 31, 2007 and 2006, respectively. The negative amounts were primarily the result of using cash generated from operations for capital expenditures and acquisitions, both long-term assets. Our strategy in managing our working capital has been to apply the cash generated from operations that remains available after satisfying our working capital and capital expenditure requirements to reduce indebtedness under our bank revolving credit facility and to minimize our cash balances. We generally finance our working capital requirements from internally generated funds and bank borrowings. In addition to internally generated funds, we have in place financing arrangements to satisfy our currently anticipated working capital needs in 2008.
We have a revolving credit agreement with a syndicate of lending institutions for which Bank of America acts as agent. This $200 million credit facility provides expansion capacity up to $300 million through October 2009.
Virtually all of our assets and those of our subsidiaries, including our interest in the equity securities of our subsidiaries, secure our obligations under the revolver. Pursuant to an intercreditor agreement with Bank of America, Prudential Insurance shares in the collateral pledged under the revolver. In addition, our subsidiaries have guaranteed our obligations under the Prudential term loan facilities. The revolver bears interest at a rate per annum equal to, at our option, either a Bank of America base rate or at the Eurodollar rate (LIBOR) plus, in each case, a percentage rate that fluctuates, based on our leverage ratio, from 0% to 1.0% for base rate borrowings and 1.25% to 2.5% for LIBOR rate borrowings. The revolver requires us to maintain financial covenants and satisfy other requirements, such as minimum net worth, net income, and limits on our capital expenditures and indebtedness. It also requires the lenders’ approval of acquisitions in some circumstances. We were in compliance with these financial covenants as of December 31, 2006 and December 31, 2007. As of December 31, 2007, an aggregate of approximately $101.0 million was outstanding under the revolver, with an average interest rate on outstanding borrowings of approximately 6.3%. Availability under this facility was approximately $26.0 million as of December 31, 2007 after consideration of outstanding letters of credit.
We have two $25.0 million term facilities with Prudential, of which $10.7 million in the aggregate was outstanding as of December 31, 2007. Principal repayments are due annually on each of the facilities. The Prudential facilities require us to maintain financial covenants, such as minimum net worth, net income, and limit our capital expenditures and indebtedness. We were in compliance with these financial covenants as of December 31, 2006 and December 31, 2007. Interest on the two Prudential facilities is paid quarterly, based on fixed rates for the two facilities of 7.21% and 7.09%, respectively.
On September 10, 2003, we entered into a $9.5 million income tax exempt variable rate bond with Sampson County, North Carolina for the funding of expansion at our landfill in that county. This bond payable was in addition to our existing $30.9 million Sampson facility. In December 2007, we entered into a $13.0 million income tax exempt variable rate bond with Wake County, North Carolina for funding the construction of the Wake County landfill for which we are contracted to construct and operate. All three bonds are backed by letters of credit issued by Wachovia Bank N.A. as a participating lender under our Bank of America syndication. The average interest rate on outstanding borrowings under both Sampson facilities was approximately 5.5% and 4.8% at December 31, 2006 and 2007, respectively. The average interest rate on outstanding borrowings under the Wake facility was approximately 4.8% at December 31, 2007.
40
As of December 31, 2007, we had the following contractual obligations and commercial commitments (in thousands):
PAYMENTS DUE BY PERIOD
| | | | | | | | | | | | | | | | | | |
Contractual Obligations | | Total | | Less Than
1 Year | | 1 to 3 Years | | 4 to 5 Years | | Over 5 Years | | Other |
Long-term debt (1) (2) | | $ | 215,040 | | $ | 16,416 | | $ | 114,443 | | $ | 5,117 | | $ | 79,064 | | $ | — |
Expected landfill liabilities (3) | | | 7,881 | | | 273 | | | 7,608 | | | — | | | — | | | — |
Disposal agreement (4) | | | 826 | | | 803 | | | 23 | | | — | | | — | | | — |
Purchase commitments (5) | | | 8,700 | | | 8,700 | | | — | | | — | | | — | | | — |
Operating leases (6) | | | 6,020 | | | 1,918 | | | 1,575 | | | 469 | | | 2,058 | | | — |
Capital leases (7) | | | 200 | | | 180 | | | 18 | | | 2 | | | — | | | — |
Tax contingency reserves (8) | | | 6,663 | | | 4,300 | | | — | | | — | | | — | | | 2,363 |
| | | | | | | | | | | | | | | | | | |
Total contractual cash obligations | | $ | 245,330 | | $ | 32,590 | | $ | 123,667 | | $ | 5,588 | | $ | 81,122 | | $ | 2,363 |
| | | | | | | | | | | | | | | | | | |
| (1) | Includes recorded principal amounts outstanding at December 31, 2007 of $101.0 million under our revolver, $10.7 million under the Prudential term facilities, and $53.4 million under the bond facilities. Our revolver allows us to borrow up to $200.0 million, with further expansion capacity available upon lenders’ approval, provided we are in compliance with the facility’s loan covenants. Includes projected interest assuming the various debt facilities are held to maturity at current rates. |
| (2) | As disclosed in Note 10 of our consolidated financial statements, we have entered into various interest rate swaps, which fixed the interest rate for a portion of our debt. These agreements expired in 2007. Additionally, we have entered into commodity contracts to hedge our recycling revenue received for old corrugated cardboard. The commodity contracts have a term of three years. The fair values of the cardboard commodity contracts are recorded on our consolidated balance sheets as current and long-term liabilities of approximately $1.1 and $0.3 million as of December 31, 2007, respectively. We also use heating oil option agreements to manage a portion of our exposure to fluctuations in diesel fuel oil prices. The fair value of the fuel commodity contract was recorded on our consolidated balance sheet as an asset of approximately $0.1 million as of December 31, 2007. The above table does not include any obligations for these arrangements. |
| (3) | Liabilities are based on current costs and include capping, closure, post-closure and environmental remediation costs. These costs represent the expected landfill liabilities we will incur for final capping, closure and post-closure for the airspace consumed to date. We will recognize additional liabilities for these types of costs as airspace is consumed in each landfill. These obligations are recorded in our consolidated balance sheets. |
| (4) | Agreements whereby we agree to deliver a minimum amount of waste at a set rate. These obligations are recorded in our consolidated balance sheets based on actual volume. |
| (5) | Represents purchase obligations not yet recorded on our consolidated balance sheets consisting primarily of collection vehicles and landfill equipment. |
| (6) | Represents future minimum lease payments under our existing operating leases. These payments are not recorded as obligations in our consolidated balance sheets with the exception of any deferred rental credits due to lease escalation clauses. Includes operating lease payments of approximately $0.5 million related to the lease of a transfer station in Georgia that we will be obligated to purchase in July 2010 for an additional $1.5 million, pending satisfaction of an environmental contingency by the lessor. |
41
| (7) | Includes recorded principal amounts outstanding as of December 31, 2007 of $0.2 million under capital lease agreements as well as anticipated interest payments. |
| (8) | Includes recorded tax contingency reserves related to adoption of FIN 48 (see Note 8 to our Consolidated Financial Statements) that may not be future cash obligations to us and whose payment timing may not be reasonably estimated. We believe that within the next twelve months, it is reasonably possible that we could pay approximately $2.6 to $4.3 million relating to uncertain tax positions. |
We use financial surety bonds for a variety of corporate guarantees. The two largest uses of financial surety bonds are for municipal contract performance guarantees and landfill closure and post-closure financial assurance required under applicable environmental regulations. Environmental regulations require demonstrated financial assurance to meet closure and post-closure requirements for landfills. In addition to surety bonds, these requirements may also be met through alternative financial assurance instruments, including insurance and letters of credit.
AMOUNT OF COMMITMENT EXPIRATION PER PERIOD
| | | | | | | | | | | | |
Commercial Commitments | | Total Amounts
Committed | | Less Than
1 Year | | 1 to 3 Years | | Over 3 Years |
| | | (in thousands) |
Standby letters of credit | | $ | 17,987 | | $ | 17,987 | | $ | — | | $ | — |
Performance bonds | | | 38,264 | | | 38,264 | | | — | | | — |
| | | | | | | | | | | | |
Total commercial commitments | | $ | 56,251 | | $ | 56,251 | | $ | — | | $ | — |
| | | | | | | | | | | | |
Net cash provided by operating activities totaled $64.3 million for the year ended December 31, 2007 and consisted of net income of $23.7 million plus non-cash adjustments such as depreciation and amortization, of $37.1 million and net changes in assets/liabilities of $3.5 million.
For the year ended December 31, 2007, net cash used in investing activities was $64.6 million. Of this, $24.2 million was used to fund the cash portion of acquisitions, $6.6 million was placed in escrow for future landfill development obligations and $36.9 million was used for capital expenditures, of which $14.6 million was for landfill expansion, with the balance primarily for investments in equipment, consisting primarily of trucks and containers. Cash inflows from investing activities included $2.9 million received from the sale of property and equipment and other assets.
For the year ended December 31, 2007, capital expenditures were $36.9 million, compared to $41.2 million in 2006. As an owner and potential acquirer of additional new landfill disposal facilities, we might be required to make significant expenditures to bring newly acquired disposal facilities into compliance with applicable regulatory requirements, obtain permits for newly acquired disposal facilities or expand the available disposal capacity at any such newly acquired disposal facilities. The amount of these expenditures cannot be currently determined because they will depend on the nature and extent of any acquired landfill disposal facilities, the condition of any facilities acquired and the permitting status of any acquired sites. We expect we would fund any capital expenditures to acquire solid waste collection and disposal businesses, to the extent we could not fund such acquisitions with our common stock and any regulatory expenses for newly acquired disposal facilities through borrowings under our existing credit facilities.
We have financial obligations relating to closure and post-closure costs, or long-term care of disposal facilities that we operate or for which we are or might become responsible. Landfill closure and post-closure costs include estimated costs to be incurred for final closure of landfills and estimated costs for providing required post-closure monitoring and maintenance of landfills. We estimate these future cost requirements based on our interpretation of the technical standards of the EPA’s Subtitle D Regulations.
Our estimate of capping, final closure of our operating facilities, and post-closure monitoring costs considers when the costs would actually be paid and factor in inflation and discount rates. We provide accruals for these future costs (generally for a term of 30 years after final closure of any landfill), and will provide additional accruals for these and other landfills we might acquire or develop in the future, based on engineering estimates of consumption of airspace over the useful lives of such facilities. Due to the inherent uncertainties related to the total costs for capping, final closure of our operating facilities and post-closure monitoring costs, there can be no assurance that our ultimate financial obligations for actual closure or post-closure costs will not exceed the amount accrued and reserved or amounts otherwise receivable pursuant to insurance policies or trust funds. Such a circumstance could have a material adverse effect on our financial condition and results of operations.
42
For the year ended December 31, 2007, net cash provided by financing activities was $2.9 million, which primarily included net borrowings of long-term debt (including capital leases) of $7.6 million, cash dividends paid of $7.2 million and $2.4 million in proceeds from stock option exercises.
Cash flows from operations discontinued in 2006, other than sales proceeds, have not been presented separately in our consolidated statements of cash flows, as they are not significant to operating, investing and financing cash flows. The dispositions of these discontinued operations produced proceeds of approximately $8.0 million, $16.4 million and $0.3 million in the years ended December 31, 2005, 2006 and 2007, respectively.
At December 31, 2007, we had approximately $165.2 million of long-term and short-term borrowings outstanding (including capital leases) and approximately $56.3 million in letters of credit including performance bonds. The ratio of our total debt (including capital leases) to total capitalization was 50.3% at December 31, 2007, compared to 51.9% as of December 31, 2006.
Off-Balance Sheet Arrangements
At December 31, 2007, we had the following off-balance sheet arrangements:
One of our wholly-owned subsidiaries entered into a Franchise Agreement with Camden County, North Carolina, effective November 4, 2002 (see Item 3 – Legal Proceedings). Pursuant to the Franchise Agreement, we have agreed to indemnify the County, its officers, employees and agents, which would include the County Commissioners, against all claims arising out of the Franchise Agreement. As a result, we are liable for the expenses of, and any damages or other awards ultimately determined against, those defendants. This arrangement did not materially affect our financial position, results of operations or liquidity during the year ended December 31, 2007 nor is it expected to have a material impact on our future financial position, results of operations or liquidity.
We are leasing a transfer station in Georgia for approximately $17,100 per month that we will be obligated to purchase at the end of the lease term (July 31, 2010) for an additional $1.5 million provided that the lessor satisfies an environmental remediation contingency.
Newly Adopted Accounting Pronouncements
For discussion of the new accounting standards that affect us, see Note 1 to our consolidated financial statements included in this Form 10-K.
Application of Critical Accounting Policies and Estimates
We have established various accounting policies that govern the application of accounting principles generally accepted in the United States of America in the preparation of our financial statements. Our significant accounting policies are described in Note 1 to the consolidated financial statements. We consider our critical accounting policies to be those accounting policies that require us to make significant estimates and assumptions that have a material impact on the carrying value of our assets and liabilities. The estimates and assumptions we use are based on historical experience and other factors, which we believe to be reasonable under the circumstances. Actual results could differ significantly from these estimates and assumptions that could have a material impact on the carrying value of our assets and liabilities at the balance sheet dates and our results of operations for the reporting periods.
We believe the following are critical accounting policies that require the most significant estimates and assumptions that are particularly susceptible to a significant change in the future:
Allowance for Doubtful Accounts
We maintain allowances for doubtful accounts for estimated losses resulting from the inability of our customers to make required payments. Our estimated allowance for doubtful accounts is based upon historical collection trends, type of customer, such as municipal or non-municipal, the age of the outstanding receivables and existing economic conditions. The allowance for doubtful accounts was $1.7 million and $1.0 million at December 31, 2006 and 2007, respectively.
43
Self-Insurance Reserves
We assume the risks for medical, dental, workers compensation, and casualty insurance exposures up to certain loss thresholds set forth in separate insurance contracts. Our insurance accruals are based on claims filed and estimates of claims incurred but not reported and are developed by our management with assistance from third-party experts. The insurance accruals are influenced by our past claims experience factors, which have a limited history. If we experience insurance claims or costs above or below our historically evaluated levels, our estimates could be materially affected. The frequency and amount of claims or incidents could vary significantly over time, which could materially affect our self-insurance liabilities. Additionally, the actual costs to settle the self-insurance liabilities could materially differ from the original estimates and cause us to incur additional costs in future periods associated with prior year claims.
Landfills
We have material financial commitments for final capping, closure and post-closure obligations with respect to our landfills. We develop our estimates of final capping, closure and post-closure obligations using input from our third-party engineers and internal accounting. Our estimates are based on our interpretation of current requirements and proposed regulatory changes and are intended to approximate fair value. Absent quoted market prices, the estimate of fair value should be based on the best available information, including the results of present value techniques in accordance with Statement of Financial Accounting Concepts, or SFAC, No. 7,Using Cash Flow and Present Value in Accounting Measurements. In general, we rely on third parties to fulfill most of our obligations for final capping, closure and post-closure. Accordingly, the fair market value of these obligations is based upon quoted and actual prices paid for similar work. We intend to perform some of these capping, closure and post-closure obligations using internal resources. Where internal resources are expected to be used to fulfill an asset retirement obligation, we have added a profit margin onto the estimated cost of such services to better reflect their fair market value as required by Statement of Financial Accounting Standards, or SFAS, No. 143,Accounting for Asset Retirement Obligations. When we then perform these services internally, the added profit margin is recognized as a component of operating income in the period earned. SFAC No. 7 further states that an estimate of fair value should include the price that marketplace participants are able to receive for bearing the uncertainties in cash flows. However, when utilizing discounted cash flow techniques, reliable estimates of market premiums may not be obtainable. In this situation, SFAC No. 7 indicates that it is not necessary to consider a market risk premium in the determination of expected cash flows. In the waste industry, there is not an active market that can be utilized to determine the fair value of these activities as there is no market that exists for selling the responsibility for final capping, closure and post-closure obligations independent of selling the landfill in its entirety. Accordingly, we believe that it is not possible to develop a methodology to reliably estimate a market risk premium and have excluded a market risk premium from our determination of expected cash flows for landfill asset retirement obligations in accordance with SFAC No. 7.
Once we have determined the estimates of final capping, closure and post-closure obligations, we then inflate those costs to the expected time of payment and discount those expected future costs back to present value. We are currently inflating these costs in current dollars until the expected time of payment using an inflation rate of 2.6% and are discounting these costs to present value using a credit-adjusted, risk-free discount rate between 7.25% and 8.9%. The credit-adjusted, risk-free rate is based on the risk-free interest rate adjusted for our credit standing. Management reviews these estimates at least once per year. Significant changes in future final capping, closure and post-closure cost estimates and inflation rates typically result in both (1) a current adjustment to the recorded liability (and corresponding adjustment to the landfill asset), based on the landfill’s capacity that has been consumed, and (2) a change in liability and asset amounts to be recorded prospectively over the remaining capacity of the landfill. Any change related to the capitalized and future cost of the landfill asset is then recognized in amortization expense prospectively over the remaining capacity of the landfill. Changes in our credit-adjusted, risk-free rate do not change recorded liabilities, but subsequently recognized obligations are measured using the revised credit-adjusted risk-free rate.
We record the estimated fair value of final capping, closure and post-closure obligations for our landfills based on the landfills’ capacity that has been consumed through the current period. This liability and corresponding asset is accrued on a per-ton basis. The estimated fair value of each final capping event will be fully accrued when the tons associated with such capping event have been disposed in the landfill. Additionally, the estimated fair value of total final capping, closure and post-closure costs will be fully accrued for each landfill at the time the site discontinues accepting waste and is closed. Capping accruals generally consider the installation of flexible membrane and geosynthetic clay liners, drainage and compacted soil layers, and topsoil over portions of the landfill where total airspace has been consumed. Closure and post-closure accruals consider estimates for methane gas control, leachate management and ground-water monitoring and other operational and maintenance costs to be incurred after the site discontinues accepting waste, which is generally expected to be for a period of up to 30 years after final site closure. Daily
44
maintenance activities, which include many of these costs, are incurred during the operating life of the landfill and are expensed as incurred. Daily maintenance activities include leachate disposal; surface water, groundwater, and methane gas monitoring and maintenance; other pollution control activities; mowing and fertilizing the landfill cap; fence and road maintenance; and third party inspection and reporting costs. For purchased disposal sites, we assess and record present value-based final capping, closure and post-closure obligations at the time we assume such responsibilities. Such liabilities are based on the estimated final capping, closure and post-closure costs and the percentage of airspace consumed related to such obligations as of the date we assumed the responsibility. Thereafter, we account for the landfill and related final capping, closure and post-closure obligations consistent with the policy described above.
Interest accretion on final capping, closure and post-closure obligations is recorded using the effective interest method and is recorded as final capping, closure and post-closure expense, which is included in operating costs on the statement of operations.
In the United States, the closure and post-closure obligations are established by the Environmental Protection Agency’s Subtitles C and D Regulations, as implemented and applied on a state-by-state basis. The costs to comply with these obligations could increase in the future as a result of legislation or regulation.
We routinely review our investment in operating landfills to determine whether the costs of these investments are realizable. Judgments regarding the existence of impairment indicators are based on regulatory factors, market conditions and operational performance of our landfills. Future events could cause us to conclude that impairment indicators exist and that our landfill carrying costs are impaired. Any resulting impairment loss could have a material adverse impact on our financial condition and results of operations.
While the precise amounts of these future obligations cannot be determined, at December 31, 2007, we estimate total landfill closure and post-closure costs of approximately $7.9 million for the airspace consumed to date. Our estimate of these costs considers when the costs would actually be paid and factor in inflation and discount rates. We had accrued approximately $7.1 million for such projected costs as of December 31, 2006 and subsequently paid approximately $0.2 million in 2007. We provide accruals for these future costs (generally for a term of 30 years after final closure of any landfill), and will provide additional accruals for these and other landfills we might acquire or develop in the future, based on engineering estimates of consumption of airspace over the useful lives of such facilities. There can be no assurance that our ultimate financial obligations for actual closure or post-closure costs will not exceed the amount accrued and reserved or amounts otherwise receivable pursuant to insurance policies or trust funds. Such a circumstance could have a material adverse effect on our financial condition and results of operations.
Derivative Financial Instruments
We utilize cash flow hedge agreements to manage a portion of our risks related to fluctuation in interest rates and certain commodity prices. The fair values of all derivative instruments are recorded as assets and liabilities in our consolidated balance sheets. We formally document our hedge relationships, including identifying the hedge instruments and hedged items, as well as our risk management objectives and strategies for entering into the hedge transaction. Our interest rate swap derivative instruments qualify for hedge accounting treatment under SFAS No. 133,Accounting for Derivative Instruments and Hedging Activities. In order to qualify for hedge accounting, criteria must be met, including a requirement that both at inception of the hedge, and on an ongoing basis, the hedging relationship is expected to be highly effective in offsetting cash flows attributable to the hedged risk during the term of the hedge. When it is determined that a derivative ceases to be a highly effective hedge, we discontinue hedge accounting, and any gains or losses on the derivative instrument are recognized in earnings.
Acquisitions and Dispositions
Acquisition purchase price is allocated to identified intangible assets and tangible assets acquired and liabilities assumed based on our estimated fair values at the dates of acquisition, with any residual amounts allocated to goodwill. The purchase price allocations are considered preliminary until we are no longer waiting for information that we have arranged to obtain and that is known to be available or obtainable. Although the time required to obtain the necessary information will vary with circumstances specific to an individual acquisition, the “allocation period” for finalizing purchase price allocations generally does not exceed one year from the consummation of a business combination.
We often consummate single acquisitions of multiple solid waste collection or disposal operations. For each separately identified solid waste collection or disposal operation acquired in a single acquisition, we perform an initial allocation of total purchase price to the acquired operation based on our relative fair value. Following this initial allocation of total purchase price to the acquired operation, we further allocate the identified intangible assets and tangible assets acquired and liabilities assumed for each solid waste collection or disposal operation based on our estimated fair value at the dates of acquisition, with any residual amounts allocated to either goodwill or landfill site costs.
45
From time to time, we consummate acquisitions in which we exchange operations we own for operations owned by another solid waste company. These exchange transactions require us to estimate the fair market value of either the operations we receive or the operations we dispose of, whichever is more clearly evident. To the extent that the fair market value of the operations we dispose of differs from the fair market value of the operations we obtain, cash is either remitted or received to offset the difference in fair market values.
From time to time, we dispose of certain operations that no longer fit our strategy. The tangible assets and certain intangible assets sold are removed at book value. Goodwill is removed based on the relative fair value of the business being sold to the fair value of the reporting unit, which is our Company. We accrue additional consideration when it is probable the funds will be received, generally at the time of receipt.
Intangible Assets
On an ongoing basis, we perform an annual impairment test. At least quarterly, we also analyze whether an event has occurred that would more likely than not reduce its enterprise fair value below its carrying amount and, if necessary, will perform a goodwill impairment test between annual dates. Impairment charges are recognized as operating expenses. We adopted July 31 as our annual assessment date. We completed our annual impairment test as of July 31, 2007 and determined that there was no goodwill impairment.
Intangible assets with a definite life are amortized over their expected lives, typically five to ten years (see Note 4 to our Notes to Consolidated Financial Statements) on a straight-line or accelerated basis to match the economic benefit received.
Asset Impairment
We review long-lived assets for impairment on a market-by-market basis whenever events or changes in the circumstances indicate that the carrying amount of an asset might not be recoverable. If an evaluation is required, the projected future net cash flows on an undiscounted basis attributable to each market would be compared to the carrying value of the long-lived assets (including an allocation of goodwill, if appropriate) of that market. If an impairment is indicated, the amount of the impairment is measured based on the fair value of the asset. We also evaluate the remaining useful lives to determine whether events and circumstances warrant revised estimates of such lives. Any resulting impairment loss could have a material adverse impact on our financial condition and results of operations.
Loss Contingencies
We are subject to various legal proceedings, claims and regulatory matters, the outcomes of which are subject to significant uncertainty. We determine whether to disclose or accrue for loss contingencies based on an assessment of whether the risk of loss is remote, reasonably possible or probable and whether it can be reasonably estimated. We analyze our litigation and regulatory matters based on available information to assess the potential liability. Management’s assessment is developed based on an analysis of possible outcomes under various strategies. We accrue for loss contingencies when such amounts are probable and reasonably estimable. If a contingent liability is only reasonably possible, we will disclose the potential range of the loss, if estimable.
We record losses related to contingencies in cost of operations or selling, general and administrative expenses, depending on the nature of the underlying transaction leading to the loss contingency.
Income Taxes
We record our income taxes based on the requirements of SFAS No. 109,Accounting for Income Taxes, which includes an estimate of taxes payable or refundable for the current year and deferred tax liabilities and assets for the future tax consequences of events that have been recognized in our financial statements or tax returns.
Deferred tax assets and liabilities reflect the net tax effects of temporary differences between the carrying amounts of assets and liabilities for financial reporting purposes and the amounts used for income tax purposes. We periodically assess the realizability of deferred tax assets and the adequacy of deferred tax liabilities, including the results of local, state, or federal statutory tax audits or estimates and judgments used.
Realization of deferred tax assets associated with net operating loss and credit carryforwards is dependent upon generating sufficient taxable income prior to their expiration by tax jurisdiction. We believe that it is more likely than not that certain of these net operating loss and credit carryforwards may expire unused and, accordingly, have established a valuation allowance against them. Although realization is not assured for the remaining deferred tax assets, we believe it is more likely than not that the deferred tax assets will be realized through future taxable earnings or alternative tax strategies. However, deferred tax assets could be reduced in the near term if our estimates of taxable income during the carryforward period are significantly reduced or alternative tax strategies are no longer viable.
The amount of income tax that we pay annually is dependent on various factors, including the timing of certain deductions and ongoing audits by federal, and state tax authorities, which may result in proposed adjustments. We perform reviews of our income tax positions on a quarterly basis and accrue for potential contingencies in accordance with FIN 48. Accruals for these contingencies are recorded based on an expectation as to the timing of when the contingency will be resolved. As events change or resolution occurs, these accruals are adjusted, such as in the case of audit settlements with taxing authorities. We believe we have adequately provided for any reasonably foreseeable outcome related to these matters.
Our future results may include favorable or unfavorable adjustments to our estimated tax liabilities due to closure of income tax examinations, new regulatory or judicial pronouncements, changes in tax laws, changes in projected levels of taxable income, future tax planning strategies, or other relevant events. See Note 8 to our consolidated financial statements for additional details regarding our tax contingencies.
ITEM 7A. QUANTITATIVE AND QUALITATIVE DISCLOSURE OF MARKET RISK
Quantitative Disclosures.We entered into interest rate swap agreements in March 2004 to modify the interest characteristics of our outstanding long-term debt and designated the qualifying instrument as a cash flow hedge. Under the terms of the agreements, the interest rate swaps hedged notional debt value of $40.0 million. These swaps were in effect for the period November 2004 through February 9, 2007 with fixed rates of 2.7%.
Our cash flows are impacted by fluctuations in commodity pricing. To reduce our risk to market fluctuations, we enter into commodity swap contracts to hedge our cash flows from the sale of old corrugated cardboard, or OCC. The notional amounts hedged under these agreements represent approximately 52% of our current annual OCC volume.
We have used heating oil option agreements to manage a portion of our exposure to fluctuation in diesel fuel oil prices. To date, such agreements have not been significant to our financial condition and results of operations. On December 28, 2004, we entered into a heating oil hedge contract, effective January 1, 2005, to cap our exposure on 1.2 million gallons of diesel fuel at $1.90 per gallon. The hedge coverage represented approximately 80% of our first quarter 2005 diesel fuel requirements, and expired on March 31, 2005. In November 2005, we entered into a heating oil hedge contract, effective December 1, 2005, to cap our exposure on 2.5 million gallons of diesel fuel at $2.53 per gallon through April 2006. In May 2006, we entered into a heating oil hedge contract, effective June 1, 2006, to cap our exposure on approximately 0.9 million gallons of diesel fuel at $2.93 per gallon through May 2007. In August 2006, we entered into a heating oil contract, effective September 1, 2006, to cap our exposure on approximately 1.0 million gallons of diesel fuel at $3.05 per gallon through June 2007. In November 2007, we entered into a heating oil hedge contract, effective January 1, 2008 to cap our exposure on approximately 0.6 million gallons of diesel fuel at $3.41 per gallon through June 2008.
46
We currently use approximately 7.0 million gallons of fuel per year. At this rate of consumption, a cost change of $0.10 per gallon would have a $700,000 impact on our annual operating income, prior to any recoveries from fuel surcharges.
The following table below presents principal cash flows and related weighted average interest rates of our long-term debt at December 31, 2007 by expected maturity dates. Fair values have been determined based on our incremental borrowing rate of 6.3% as of December 31, 2007:
| | | | | | | | | | | | | | | | | | | | | | | | |
| | | 2008 | | 2009 | | 2010 | | 2011 | | 2012 | | Thereafter | | Total
Carrying
Value | | Total
Fair
Value |
| | | (In thousands) |
Fixed Rate | | | | | | | | | | | | | | | | | | | | | | | | |
7.21% | | $ | 3,571 | | $ | — | | $ | — | | $ | — | | $ | — | | $ | — | | $ | 3,571 | | $ | 3,589 |
7.09% | | | 3,572 | | | 3,571 | | | — | | | — | | | — | | | — | | | 7,143 | | | 7,208 |
| | | | | | | | |
Variable Rate | | | | | | | | | | | | | | | | | | | | | | | | |
6.25% | | | — | | | 101,000 | | | — | | | — | | | — | | | — | | | 101,000 | | | 101,000 |
4.78% | | | — | | | — | | | — | | | — | | | — | | | 13,000 | | | 13,000 | | | 13,000 |
4.80% | | | — | | | — | | | — | | | — | | | — | | | 40,355 | | | 40,355 | | | 40,355 |
| | | | | | | | | | | | | | | | | | | | | | | | |
| | $ | 7,143 | | $ | 104,571 | | $ | — | | $ | — | | $ | — | | $ | 53,355 | | $ | 165,069 | | $ | 165,152 |
| | | | | | | | | | | | | | | | | | | | | | | | |
Qualitative Disclosures.Our primary exposure relates to:
| | • | | interest rate risk on long-term and short-term borrowings; |
| | • | | the impact of interest rate movements on our ability to meet interest expense payments and not exceed financial covenants; and |
| | • | | the impact of interest rate movements on our ability to obtain adequate financing to fund future acquisitions. |
We manage interest rate risk on outstanding long-term and short-term debt through the use of fixed and variable rate debt. While we cannot predict the impact interest rate movements will have on existing debt, we continue to evaluate our financial position on an ongoing basis.
ITEM 8. FINANCIAL STATEMENTS AND SUPPLEMENTARY DATA
See the Consolidated Financial Statements beginning on page F-1 of this report.
ITEM 9. CHANGES IN AND DISAGREEMENTS WITHACCOUNTANTS ON ACCOUNTING AND FINANCIAL DISCLOSURE
None.
ITEM 9A. CONTROLS AND PROCEDURES
Disclosure Controls and Procedures.
We maintain disclosure controls and procedures (as defined in Rule 13a-15(e) under the Securities Exchange Act of 1934, as amended which we refer to as the Exchange Act, that are designed to provide reasonable assurance that the information that we are required to disclose in the reports that we file or submit under the Exchange Act is recorded, processed, summarized and reported within the time periods specified in the SEC’s rules and forms, and that such information is accumulated and communicated to our
47
management, including our Chief Executive Officer and Chief Financial Officer, as appropriate, to allow timely decisions regarding required disclosure. It should be noted that, because of inherent limitations, our disclosure controls and procedures, however well designed and operated, can provide only reasonable, and not absolute, assurance that the objectives of the disclosure controls and procedures are met.
As required by paragraph (b) of Rule 13a-15 under the Exchange Act, our Chief Executive Officer and our Chief Financial Officer have evaluated the effectiveness of our disclosure controls and procedures as of the end of the period covered by this report. Based on such evaluation, our Chief Executive Officer and our Chief Financial Officer have concluded that, as of the end of the period covered by this report, our disclosure controls and procedures were effective.
Changes in Internal Control Over Financial Reporting
Based on an evaluation under the supervision and with the participation of our management, including our Chief Executive Officer and Chief Financial Officer, there has been no change to our internal control over financial reporting that occurred during the three-month period ended December 31, 2007 that has materially affected, or is reasonably likely to materially affect, our internal control over financial reporting.
Management’s Report on Internal Control over Financial Reporting
Our management is responsible for establishing and maintaining adequate internal control over financial reporting (as defined in Rule 13a-15(f) under the Exchange Act). Our internal control over financial reporting is a process that is designed under the supervision of our Chief Executive Officer and Chief Financial Officer, and effected by our board of directors, management and other personnel, to provide reasonable assurance regarding the reliability of financial reporting and the preparation of financial statements for external purposes in accordance with accounting principles generally accepted in the United States of America. Our internal control over financial reporting includes those policies and procedures that:
| | |
| i. | | Pertain to the maintenance of records that, in reasonable detail, accurately and fairly reflect the transactions and dispositions of our assets; |
| |
| ii. | | Provide reasonable assurance that transactions are recorded as necessary to permit preparation of financial statements in accordance with accounting principles generally accepted in the United States of America, and that receipts and expenditures recorded by us are being made only in accordance with authorizations of our management and board of directors; and |
| |
| iii. | | Provide reasonable assurance regarding prevention or timely detection of unauthorized acquisition, use or disposition of our assets that could have a material effect on our financial statements. |
A control system, no matter how well designed and operated, can only provide reasonable, not absolute, assurance that the objectives of the control system are met and must reflect the fact that there are resource constraints that require management to consider the benefits of internal controls relative to their costs. Because of its inherent limitations, internal control over financial reporting may not prevent or detect all errors, fraud or misstatements. Also, projections of any evaluation of effectiveness to future periods are subject to the risk that controls may become inadequate because of changes in conditions, or that the degree of compliance with the policies and procedures may deteriorate.
We carried out an evaluation of the effectiveness of our internal control over financial reporting as of December 31, 2007 based upon the framework set forth in the report titled “Internal Control – Integrated Framework” published by the Committee of Sponsoring Organizations of the Treadway Committee, or COSO. Through this evaluation, we did not identify any material weaknesses in our internal controls and our management has concluded that our internal control over financial reporting was effective as of December 31, 2007.
The effectiveness of our internal control over financial reporting as of December 31, 2007 has been audited by Deloitte & Touche LLP, an independent registered public accounting firm, as stated in their report included in this Form 10-K.
48
REPORT OF INDEPENDENT REGISTERED PUBLIC ACCOUNTING FIRM
To the Board of Directors and Shareholders of
Waste Industries USA, Inc. and Subsidiaries
Raleigh, North Carolina
We have audited the internal control over financial reporting of Waste Industries USA, Inc. and subsidiaries (the “Company”) as of December 31, 2007, based on criteria established inInternal Control — Integrated Framework issued by the Committee of Sponsoring Organizations of the Treadway Commission. The Company’s management is responsible for maintaining effective internal control over financial reporting and for its assessment of the effectiveness of internal control over financial reporting, included in the accompanying Management’s Report on Internal Control over Financial Reporting. Our responsibility is to express an opinion on the Company’s internal control over financial reporting based on our audit.
We conducted our audit in accordance with the standards of the Public Company Accounting Oversight Board (United States). Those standards require that we plan and perform the audit to obtain reasonable assurance about whether effective internal control over financial reporting was maintained in all material respects. Our audit included obtaining an understanding of internal control over financial reporting, assessing the risk that a material weakness exists, testing and evaluating the design and operating effectiveness of internal control based on the assessed risk, and performing such other procedures as we considered necessary in the circumstances. We believe that our audit provides a reasonable basis for our opinion.
A company’s internal control over financial reporting is a process designed by, or under the supervision of, the company’s principal executive and principal financial officers, or persons performing similar functions, and effected by the company’s board of directors, management, and other personnel to provide reasonable assurance regarding the reliability of financial reporting and the preparation of financial statements for external purposes in accordance with generally accepted accounting principles. A company’s internal control over financial reporting includes those policies and procedures that (1) pertain to the maintenance of records that, in reasonable detail, accurately and fairly reflect the transactions and dispositions of the assets of the company; (2) provide reasonable assurance that transactions are recorded as necessary to permit preparation of financial statements in accordance with generally accepted accounting principles, and that receipts and expenditures of the company are being made only in accordance with authorizations of management and directors of the company; and (3) provide reasonable assurance regarding prevention or timely detection of unauthorized acquisition, use, or disposition of the company’s assets that could have a material effect on the financial statements.
Because of the inherent limitations of internal control over financial reporting, including the possibility of collusion or improper management override of controls, material misstatements due to error or fraud may not be prevented or detected on a timely basis. Also, projections of any evaluation of the effectiveness of the internal control over financial reporting to future periods are subject to the risk that the controls may become inadequate because of changes in conditions, or that the degree of compliance with the policies or procedures may deteriorate.
In our opinion, the Company maintained, in all material respects, effective internal control over financial reporting as of December 31, 2007, based on the criteria established inInternal Control — Integrated Frameworkissued by the Committee of Sponsoring Organizations of the Treadway Commission.
We have also audited, in accordance with the standards of the Public Company Accounting Oversight Board (United States), the consolidated financial statements and financial statement schedule as of and for the year ended December 31, 2007 of the Company and our report dated March 17, 2008 expressed an unqualified opinion on those financial statements and financial statement schedule and included an explanatory paragraph relating to the adoption of Statement of Financial Accounting Standards No. 123(R),Share Based Payment,in 2006, and FASB Interpretation No. 48,Accounting for Uncertainty in Income Taxes, an Interpretation of FASB Statement No. 109, in 2007.
|
| /s/ Deloitte & Touche LLP |
|
| Raleigh, North Carolina |
| March 17, 2008 |
49
ITEM 9B. OTHER INFORMATION
Not applicable.
PART III
Some information required by Part III is omitted from this report because we will file, within 120 days after the end of our 2007 fiscal year, either an amendment to this Annual Report on Form 10-K/A or a definitive proxy statement for our 2008 annual meeting of shareholders, portions of which will be incorporated herein by reference.
ITEM 10. DIRECTORS AND EXECUTIVE OFFICERS OF THE REGISTRANT
Some of the information required by Item 10 of Form 10-K concerning our executive officers is set forth under the heading “Executive Officers” located at the end of Part I of this Form 10-K.
Our Board of Directors has adopted a Code of Ethics applicable to our Chief Executive Officer, Chief Financial Officer, Chief Accounting Officer or Controller or other persons performing similar functions. The Code of Ethics is an appendix to our Code of Business Conduct, which is applicable to all of our directors and employees and that has been adopted by our Board of Directors. The Code of Business Conduct, including the Code of Ethics, is posted on our website atwww.wasteindustries.com.
Some information required by Item 10 is omitted from this report because we will file, within 120 days after the end of our 2007 fiscal year, either an amendment to this Annual Report on Form 10-K/A or a definitive proxy statement for our 2008 annual meeting of shareholders, portions of which will be incorporated herein by reference.
ITEM 11. EXECUTIVE COMPENSATION
Some information required by Item 11 is omitted from this report because we will file, within 120 days after the end of our 2007 fiscal year, either an amendment to this Annual Report on Form 10-K/A or a definitive proxy statement for our 2008 annual meeting of shareholders, portions of which will be incorporated herein by reference.
ITEM 12. SECURITY OWNERSHIP OF CERTAIN BENEFICIAL OWNERS AND MANAGEMENT AND RELATED STOCKHOLDER MATTERS
The following table sets forth certain information regarding the ownership of shares of our common stock as of February 28, 2008 by (1) each person known by us to beneficially own more than 5% of the outstanding shares of common stock, (2) each director of our company, (3) each of our executive officers,, and (4) all directors and executive officers of our company as a group.
This table is based upon information supplied by our executive officers, directors and principal shareholders and from Schedules 13D and 13G filed with the SEC. Unless otherwise indicated in the footnotes to this table and subject to community property laws where applicable, each of the shareholders named in this table has sole voting and investment power with respect to the shares indicated as beneficially owned. Share ownership in each case includes shares issuable upon exercise of options that may be exercised within 60 days after March 14, 2008 for purposes of computing the percentage of common stock owned by such person but not for purposes of computing the percentage owned by any other person. Applicable percentages are based on 14,168,559 shares outstanding on February 28, 2007. Except as listed otherwise, the address of each listed stockholder is 3301 Benson Drive, Suite 601, Raleigh, North Carolina 27609.
50
| | | | | |
Name | | Shares
Beneficially
Owned | | Percentage
Owned | |
Poole/Perry Investors(1) | | 7,296,988 | | 51.5 | % |
Barclays Global Fund Advisors(2)
45 Fremont Street
San Francisco, CA 94105 | | 723,590 | | 5.1 | % |
Dimensional Fund Advisors Inc(3)
1299 Ocean Avenue, 11th Floor
Santa Monica, California 90401 | | 751,111 | | 5.3 | % |
Lonnie C. Poole, Jr. Grantor Trust dated May 1, 1995(4) | | 1,741,729 | | 12.3 | % |
Lonnie C. Poole, Jr.(5) (17) | | 3,349,000 | | 23.6 | % |
Lonnie C. Poole, III(6) (17) | | 2,504,767 | | 17.7 | % |
Scott J. Poole(7) (17)
7901 Strickland Road, Suite 155
Raleigh, North Carolina 27615 | | 2,857,955 | | 20.2 | % |
Jim W. Perry(8) | | 1,324,039 | | 9.3 | % |
Glenn E. Futrell(9) | | 14,654 | | * | |
Paul F. Hardiman(10) | | 15,628 | | * | |
James A. Walker(11) | | 9,973 | | * | |
Harry M. Habets(12) | | 29,769 | | * | |
D. Stephen Grissom(13) | | 40,851 | | * | |
Harrell J. Auten, III(14) | | 17,377 | | * | |
Michael J. Durham(15) | | 1,093 | | * | |
All directors and executive officers as a group (10 persons)(16) | | 7,314,251 | | 51.5 | % |
| (1) | As reported in Schedule 13D/A filed by the Poole/Perry Investors on January 24, 2008. The Poole/Perry Investors consist of Lonnie C. Poole, Jr., Lonnie C. (Ven) Poole, III, Scott J. Poole, Jim W. Perry, the Lonnie C. Poole, III Irrevocable Trust (Tailwalker Trust), the Lonnie C. Poole, III Irrevocable Trust (Tailwalker Non-GST Trust), the Lonnie C. Poole, Jr. Grantor Trust dated May 1, 1995, the Perry Irrevocable Trust u/a/d December 13, 2007, and the Damas II Charitable Remainder Unitrust u/a/d 12/13/07/ The address of the Poole trusts is the same as for Scott J. Poole. The address of the Perry Trust is 7215 Manor Oaks Drive, Raleigh, North Carolina 27615. The address of the Damas Trust is 2600 Hilltop Farm Avenue, Apex, North Carolina 27502 |
| (2) | As reported in Schedule 13G filed on January 23, 2007. The Schedule 13G filed by Barclays Global Fund Advisors states that Barclays holds these shares in trust accounts for the economic benefit of the beneficiaries of those accounts. |
| (3) | As reported in Schedule 13G filed on February 9, 2007. According to the Schedule 13G, Dimensional is an investment advisor registered under Section 203 of the Investment Advisors Act of 1940. Dimensional furnishes investment advice or serves as investment manager to funds consisting of four investment companies registered under the Investment Company Act of 1940 and certain other commingled group trusts and separate accounts. In its role as investment advisor or manager, Dimensional possesses investment and/or voting power over the shares, and may be deemed to be the beneficial owner of the shares held by the funds. However, all shares are owned by the funds. Dimensional disclaims beneficial ownership of the shares. |
| (4) | As reported in Schedule 13D/A filed by the Poole/Perry Investors on January 24, 2008. |
51
| (5) | Includes 4,021 shares underlying vested options, 61,320 held by an investment partnership of which Mr. Poole serves as general partner, and 1,741,729 shares held by the Lonnie C. Poole, Jr. Grantor Trust, of which Mr. Poole is the grantor. Excludes 30,168 shares held by Mr. Poole’s wife, 35,263 shares held by Mr. Poole’s mother, 45,000 shares held by the Waste Industries Foundation of which Mr. Poole’s wife is the president, and 700,000 shares held by the Damas II Charitable Remainder Trust u/a/d 12/13/07, of which Mr. Poole disclaims any and all beneficial or pecuniary interest. |
| (6) | Includes 2,912 shares underlying vested options and 1,741,729 shares held by the Lonnie C. Poole, Jr. Grantor Trust of which Mr. Poole and his brother Scott J. Poole are the joint trustees. Excludes 7,830 shares held by Mr. Poole’s mother in a custodial account for his children, of which Mr. Poole disclaims any and all beneficial or pecuniary interest. |
| (7) | Includes 1,741,729 shares held in the Lonnie C. Poole, Jr. Grantor Trust of which Mr. Poole and his brother Lonnie C. Poole, III are the joint trustees, 28,536 shares held by the Tailwalker Trust for the benefit of the children of Lonnie C. Poole, III of which Mr. Poole is the trustee, and 411,410 shares held by the Tailwalker Non-GST Trust for the benefit of the children of Lonnie C. Poole, III of which Mr. Poole is the trustee. Excludes 7,314 shares held by Mr. Poole’s mother in a custodial account for his children, of which Mr. Poole disclaims any and all beneficial or pecuniary interest. |
| (8) | Includes 5,975 shares underlying vested options. Excludes 15,000 shares held by Mr. Perry’s wife and 50,000 shares held by the Perry 2007 Irrevocable Trust of which Mr. Perry’s wife is the trustee, of which Mr. Perry disclaims any and all beneficial or pecuniary interest. |
| (9) | Includes 1,113 shares underlying vested options. |
| (10) | Includes 9,341 shares underlying vested options. |
| (11) | Includes 3,826 shares underlying vested options. |
| (12) | Includes 4,119 shares underlying vested options. |
| (13) | Includes 2,654 shares underlying vested options. |
| (14) | Includes 2,692 shares underlying vested options. |
| (15) | Includes 493 shares underlying vested options. |
| (16) | Includes the shares and shares underlying vested options discussed in footnotes (5), (6) and (8) - (15). |
| (17) | As required by SEC regulation, Lonnie C. Poole, Jr., Lonnie C. Poole, III and Scott J. Poole each must report the shares of Waste Industries common stock that each of them beneficially owns, which results in many of the same shares being reported by each of them. The aggregate number of shares of Waste Industries common stock that Lonnie C. Poole, Jr., Lonnie C. Poole, III and Scott J. Poole, and their affiliates that are reported by each of them in the table, beneficially owned is 5,225,852 shares, or 36.9%, of Waste Industries common stock outstanding on February 28, 2008. |
We do not require our directors to own a minimum number of shares of our stock. At December 31, 2006, none of the shares owned by our directors and executive officers were pledged as security for any loan.
The information required by Item 12 of Form 10-K regarding our one equity compensation plan is found in Item 5 of this report under the heading “Equity Compensation Plan.”
ITEM 13. CERTAIN RELATIONSHIPS AND RELATED TRANSACTIONS AND DIRECTOR INDEPENDENCE
The information required by Item 404 of Regulation S-K is found in “Notes to Consolidated Financial Statements” under Note 11, “Related Party Transactions.”
The information required by Item 407(a) of Regulation S-K is omitted from this report because we will file, within 120 days after the end of our 2007 fiscal year, either an amendment to this Annual Report on Form 10-K/A or a definitive proxy statement for our 2008 annual meeting of shareholders, portions of which will be incorporated herein by reference.
52
ITEM 14. PRINCIPAL ACCOUNTANT FEES AND SERVICES
The Audit Committee of our Board of Directors appointed the firm of Deloitte & Touche LLP, Raleigh, North Carolina, to serve as our independent registered public accounting firm for the fiscal year ended December 31, 2007. Deloitte & Touche has audited our accounts since 1983 and has advised us that it does not have, and has not had, any direct or indirect financial interest in our company or subsidiaries in any capacity other than that of serving as independent auditors.
Audit Fees. Deloitte & Touche billed us aggregate fees of $981,000 and $1,524,000 for professional services rendered and expenses incurred for the integrated audits of our consolidated financial statements for fiscal years 2007 and 2006, respectively, and for reviews of the financial statements included in our quarterly reports on Form 10-Q for the first three quarters of those fiscal years.
Audit-Related Fees. Deloitte & Touche billed us aggregate fees of $56,000 in fiscal year 2007 related to services incurred on acquisitions and FIN 48 implementation. There were no audit-related fees in 2006.
Tax Fees. Deloitte & Touche billed us aggregate fees of approximately $76,000 and $224,000 in fiscal years 2007 and 2006, respectively, for services rendered for general tax consulting activities and the preparation of our tax returns in fiscal year 2006.
All Other Fees. Deloitte & Touche billed us aggregate fees of approximately $63,000 and $1,500 in fiscal years 2007 and 2006, respectively. The fees incurred for fiscal year 2007 were for assistance with Form S-8 registration statements and services associated with our proposed going private transaction. In addition, we were billed for a computer based accounting research subscription in fiscal years 2007 and 2006, respectively.
In considering the nature of the services provided by Deloitte & Touche as discussed above, the Audit Committee determined that such services were compatible with the provision of independent audit services. The Audit Committee discussed these services with Deloitte & Touche and our management to determine that they are permitted under the rules and regulations concerning auditor independence promulgated by the SEC to implement the Sarbanes-Oxley Act of 2002, as well as the Public Company Accounting Oversight Board.
Although the Audit Committee does not have formal pre-approval policies and procedures in place, it pre-approved all of the services performed by Deloitte & Touche as discussed above, as required by SEC regulation.
PART IV
ITEM 15. EXHIBITS AND FINANCIAL STATEMENT SCHEDULES
| | (a) | The following Financial Statements, Financial Statement Schedules and Exhibits are filed as part of this report or incorporated herein by reference: |
1. Financial Statements. See Index to Consolidated Financial Statements on page F-1.
2. Financial Statement Schedule.
Schedule II – Valuation and Qualifying Accounts is found on page S-1.
The financial statement schedule should be read in conjunction with the consolidated financial statements. The financial statement schedules not included in this annual report on Form 10-K have been omitted because they are not applicable or the required information is shown in the financial statements or included in the notes thereto.
53
The exhibits filed as part of this Report are listed.
| | | | | | | | | | |
Exhibit Number | | Description of Document | | Registrant’s
Form | | Filed | | Exhibit
Number | | Filed
Herewith |
| | | | | |
2.1 | | Agreement and Plan of Merger dated December 17, 2007. | | 8-K | | December 20, 2007 | | 2.1 | | |
| | | | | |
2.2 | | Limited Guarantee dated December 17, 2007. | | 8-K | | December 20, 2007 | | 2.2 | | |
| | | | | |
3.1 | | Articles of Incorporation, as currently in effect. | | S-4 | | October 13, 2000 | | 3.1 | | |
| | | | | |
3.2 | | Amended and Restated Bylaws dated April 18, 2007 | | 8-K | | April 24, 2007 | | 3.2 | | |
| | | | | |
10.1 | | 1997 Stock Plan, as amended on August 4, 2003. | | 10-Q | | November 14, 2003 | | 10.1 | | |
| | | | | |
10.2 | | Note Purchase and Private Shelf Agreement with The Prudential Insurance Company of America dated April 3, 1996. | | S-1 | | April 21, 1997 | | 10.3 | | |
| | | | | |
10.3 | | Note Purchase and Private Shelf Agreement with The Prudential Insurance Company of America dated as of June 30, 1998. | | 10-Q | | August 14, 1998 | | 10.4 | | |
| | | | | |
10.4 | | Change in Control Agreement dated October 30, 2001 between the Registrant and D. Stephen Grissom | | 10-K | | March 31, 2003 | | 10.14 | | |
| | | | | |
10.5 | | Amended and Restated Note Purchase Agreement dated March 31, 2001 among the Company and The Prudential Insurance Company of America and Affiliates. | | 10-K | | March 30, 2004 | | 10.15 | | |
| | | | | |
10.6 | | Amended and Restated Note Purchase and Private Shelf Agreement dated March 31, 2001 among the Company and The Prudential Insurance Company of America and Affiliates. | | 10-K | | March 30, 2004 | | 10.16 | | |
| | | | | |
10.7 | | Amendment and Consent dated August 27, 2003 among the Company and Prudential Insurance Company of America and Affiliates, amending the Amended and Restated Purchase Note Agreement and the Amended and Restated Note Purchase and Private Shelf Agreement dated March 31, 2001. | | 10-K | | March 30, 2004 | | 10.17 | | |
| | | | | |
10.8 | | Amendment and Consent effective March 31, 2005 among the Company and Prudential Insurance Company and Affiliates, amending the Amended and Restated Note Agreement and the Amended and Restated Note Purchase and Private Shelf Agreement dated March 31, 2001. | | 10-Q | | May 17, 2005 | | 10.19 | | |
| | | | | |
10.9 | | Amended and Restated Revolving Credit Agreement dated March 24, 2006 among the Company, Bank of America, N.A., Wachovia Bank, N.A., Branch Banking and Trust Company and other lenders. | | 8-K | | March 30, 2006 | | 10.21 | | |
| | | | | |
10.10 | | Amendment and Consent effective March 24, 2006 among the Company and Prudential Insurance Company and Affiliates, amending the Amended and Restated Note Purchase Agreement and the Amended and Restated Note Purchase and Private Shelf Agreement dated March 31, 2001. Bank of America, N.A., Wachovia, N.A., Branch Banking and Trust Company and other lenders. | | 8-K | | March 30, 2006 | | 10.22 | | |
| | | | | |
10.11 | | Form of Amendment to Change in Control Agreement dated January 15, 2007 between the Company and certain officers. | | 8-K | | January 18, 2007 | | 10.23 | | |
| | | | | |
10.12 | | Change in Control Agreement dated January 15, 2007 between the Registrant and Harrell J. Auten, III. | | 8-K | | January 18, 2007 | | 10.24 | | |
| | | | | |
10.13 | | Amendment to Employment Agreement dated April 18, 2007, Lonnie C. Poole, III. | | 8-K | | April 24, 2007 | | 10.25 | | |
| | | | | |
10.14 | | 2007 Long Term Incentive Plan. | | 10-Q | | August 3, 2007 | | 10.26 | | |
54
| | | | | | | | | | |
Exhibit Number | | Description of Document | | Registrant’s
Form | | Filed | | Exhibit
Number | | Filed
Herewith |
| | | | | |
10.15 | | 1998 Board of Directors Compensation Plan. | | S-8 | | August 3, 2007 | | 10.26 | | |
| | | | | |
10.16 | | 2007 Board of Directors Compensation Plan. | | S-8 | | August 3, 2007 | | 10.27 | | |
| | | | | |
10.17 | | Amendment to the Company 1997 Stock Plan. | | 8-K | | December 20, 2007 | | 10.27 | | |
| | | | | |
10.18 | | Commitment Increase Agreement dated September 16, 2005 among the Company, Bank of America N.A. (the “Increasing Bank”) and Bank of America, N.A. (the successor by merger to Fleet National Bank). | | 8-K | | September 22, 2005 | | 10.24 | | |
| | | | | |
21 | | List of Subsidiaries. | | 10-K | | March 17, 2008 | | 21 | | X |
| | | | | |
23.1 | | Consent of Independent Registered Public Accounting Firm. | | 10-K | | March 17, 2008 | | 23.1 | | X |
| | | | | |
31.1 | | Certification of the Chief Executive Officer pursuant to rule 15d-14 (a) under the Securities Exchange Act of 1934. | | 10-K | | March 17, 2008 | | 31.1 | | X |
| | | | | |
31.2 | | Certification of the Chief Financial Officer pursuant to rule 15d-14 (a) under the Securities Exchange Act of 1934. | | 10-K | | March 17, 2008 | | 31.2 | | X |
| | | | | |
32.1 | | Certification by the Chief Executive Officer pursuant to 18 U.S.C. 1350 as adopted pursuant to Section 906 of the Sarbanes-Oxley Act of 2002. | | 10-K | | March 17, 2008 | | 32.1 | | X |
| | | | | |
32.2 | | Certification by the Chief Financial Officer pursuant to 18 U.S.C. 1350 as adopted pursuant to Section 906 of the Sarbanes-Oxley Act of 2002. | | 10-K | | March 17, 2008 | | 32.2 | | X |
| | | | | |
99.01 | | Support Agreement, dated October 22, 2007. | | 13E-3 | | January 24, 2008 | | (d)(2) | | |
| | | | | |
99.02 | | Debt Commitment Letter, dated October 22, 2007. | | 13E-3 | | January 24, 2008 | | (b)(1) | | |
| | | | | |
99.03 | | GS Equity Commitment Letter, dated December 17, 2007. | | 13E-3 | | January 24, 2008 | | (d)(3) | | |
| | | | | |
99.04 | | MIP Equity Commitment Letter, dated December 17, 2007. | | 13E-3 | | January 24, 2008 | | (d)(4) | | |
| | | | | |
99.05 | | Lonnie C. Poole Jr. Rollover Commitment Letter, dated December 17, 2007. | | 13E-3 | | January 24, 2008 | | (d)(5) | | |
| | | | | |
99.06 | | Lonnie C. Poole, III Rollover Commitment Letter dated December 17, 2007. | | 13E-3 | | January 24, 2008 | | (d)(6) | | |
| | | | | |
99.07 | | Scott J. Poole Rollover Commitment Letter, dated December 17, 2007. | | 13E-3 | | January 24, 2008 | | (d)(7) | | |
| | | | | |
99.08 | | Jim W. Perry Rollover Commitment Letter, dated December 17, 2007. | | 13E-3 | | January 24, 2008 | | (d)(8) | | |
| | | | | |
99.08 | | Lonnie C. Poole, Jr. Grantor Trust Rollover, dated December 17, 2007. | | 13E-3 | | January 24, 2008 | | (d)(9) | | |
| | | | | |
99.10 | | Tailwalker Rollover Equity Commitment Letter, dated December 17, 2007. | | 13E-3 | | January 24, 2008 | | (d)(10) | | |
| | | | | |
99.11 | | Tailwalker Trust Rollover Equity Commitment Letter, dated December 17, 2007. | | 13E-3 | | January 24, 2008 | | (d)(11) | | |
| | | | | |
99.12 | | Amendment to Debt Commitment Letter, dated December 17, 2007. | | 13E-3 | | January 24, 2008 | | (d)(12) | | |
| | | | | |
99.13 | | Joinder Agreement, dated December 13, 2007. | | 13E-3 | | January 24, 2008 | | (d)(13) | | |
| | | | | |
99.14 | | Interim Investors Agreement, dated December 17, 2007. | | 13D/A | | December 20, 2007 | | (d)(14) | | |
55
SIGNATURES
Pursuant to the requirements of Section 13 or 15(d) of the Securities and Exchange Act of 1934, the registrant has duly caused this report to be signed on its behalf by the undersigned, thereunto duly authorized.
| | | | |
| | WASTE INDUSTRIES USA, INC. |
| | |
Date: March 17, 2008 | | By: | | /s/ Jim W. Perry |
| | | | JIM W. PERRY |
| | | | PRESIDENT AND CHIEF EXECUTIVE OFFICER |
Pursuant to the requirements of the Securities Exchange Act of 1934, this report has been signed below by the following persons on behalf of the registrant and in the capacities and on the dates indicated.
| | | | |
SIGNATURE | | CAPACITY | | DATE |
| | |
/s/ Jim W. Perry | | Director, President and Chief Executive | | March 17, 2008 |
| JIM W. PERRY | | Officer (Principal Executive Officer) | | |
| | |
/s/ D. Stephen Grissom | | Chief Financial Officer (Principal | | March 17, 2008 |
| D. STEPHEN GRISSOM | | Financial and Accounting Officer) | | |
| | |
/s/ Lonnie C. Poole, Jr. | | Chairman | | March 17, 2008 |
| LONNIE C. POOLE, JR. | | | | |
| | |
/s/ Paul F. Hardiman | | Director | | March 17, 2008 |
| PAUL F. HARDIMAN | | | | |
| | |
/s/ Glenn E. Futrell | | Director | | March 17, 2008 |
| GLENN E. FUTRELL | | | | |
| | |
/s/ James A. Walker | | Director | | March 17, 2008 |
| JAMES A. WALKER | | | | |
56
WASTE INDUSTRIES USA, INC. AND SUBSIDIARIES
INDEX TO FINANCIAL STATEMENTS
F-1
REPORT OF INDEPENDENT REGISTERED PUBLIC ACCOUNTING FIRM
To the Board of Directors and Shareholders of
Waste Industries USA, Inc. and Subsidiaries
Raleigh, North Carolina
We have audited the accompanying consolidated balance sheets of Waste Industries USA, Inc. and subsidiaries (the “Company”) as of December 31, 2006 and 2007, and the related consolidated statements of operations, shareholders’ equity and comprehensive income, and cash flows for each of the three years in the period ended December 31, 2007. Our audits also included the financial statement schedule listed in the Index at Item 15. These financial statements and financial statement schedule are the responsibility of the Company’s management. Our responsibility is to express an opinion on the financial statements and financial statement schedule based on our audits.
We conducted our audits in accordance with the standards of the Public Company Accounting Oversight Board (United States). Those standards require that we plan and perform the audit to obtain reasonable assurance about whether the financial statements are free of material misstatement. An audit includes examining, on a test basis, evidence supporting the amounts and disclosures in the financial statements. An audit also includes assessing the accounting principles used and significant estimates made by management, as well as evaluating the overall financial statement presentation. We believe that our audits provide a reasonable basis for our opinion.
In our opinion, such consolidated financial statements present fairly, in all material respects, the financial position of Waste Industries USA, Inc. and subsidiaries at December 31, 2006 and 2007, and the results of their operations and their cash flows for each of the three years in the period ended December 31, 2007, in conformity with accounting principles generally accepted in the United States of America. Also, in our opinion, such financial statement schedule, when considered in relation to the basic consolidated financial statements taken as a whole, presents fairly, in all material respects, the information set forth therein.
As discussed in Note 1 to the consolidated financial statements, in 2006, the Company adopted Statement of Financial Accounting Standards No. 123R,Share- Based Payment. In addition, as discussed in Notes 1 and 8, in 2007, the Company adopted the provisions of FASB Interpretation No. 48,Accounting for Uncertainty in Income Taxes, an interpretation of FASB Statement No. 109.
We have also audited, in accordance with the standards of the Public Company Accounting Oversight Board (United States), the Company’s internal control over financial reporting as of December 31, 2007, based on the criteria established inInternal Control—Integrated Framework issued by the Committee of Sponsoring Organizations of the Treadway Commission and our report dated March 17, 2008 expressed an unqualified opinion on the Company’s internal control over financial reporting.
|
| /s/ Deloitte & Touche LLP |
| Raleigh, North Carolina |
| March 17, 2008 |
F-2
WASTE INDUSTRIES USA, INC. AND SUBSIDIARIES
CONSOLIDATED BALANCE SHEETS
(In Thousands, Except Share Data)
| | | | | | | |
| | | December 31,
2006 | | December 31,
2007 | |
ASSETS | | | | | | | |
CURRENT ASSETS: | | | | | | | |
Cash and cash equivalents | | $ | 1,656 | | $ | 4,361 | |
Accounts receivable - trade, net | | | 35,573 | | | 33,227 | |
Accounts receivable - other | | | 835 | | | 1,902 | |
Spare parts, supplies, and fuel inventories | | | 1,083 | | | 917 | |
Deferred income taxes | | | 1,787 | | | 1,336 | |
Prepaid insurance | | | 401 | | | 206 | |
Other current assets | | | 1,742 | | | 3,483 | |
| | | | | | | |
Total current assets | | | 43,077 | | | 45,432 | |
| | | | | | | |
PROPERTY AND EQUIPMENT, net | | | 218,039 | | | 234,034 | |
GOODWILL | | | 97,562 | | | 111,771 | |
OTHER INTANGIBLE ASSETS, net | | | 7,388 | | | 6,995 | |
RESTRICTED CASH | | | 731 | | | 7,352 | |
OTHER NONCURRENT ASSETS | | | 3,482 | | | 3,449 | |
| | | | | | | |
TOTAL ASSETS | | $ | 370,279 | | $ | 409,033 | |
| | | | | | | |
LIABILITIES AND SHAREHOLDERS’ EQUITY | | | | | | | |
CURRENT LIABILITIES: | | | | | | | |
Accounts payable - trade | | $ | 13,318 | | $ | 15,703 | |
Acquisition related liabilities | | | 273 | | | 1,042 | |
Accrued liabilities and other payables | | | 3,626 | | | 5,913 | |
Current maturities of long-term debt | | | 7,143 | | | 7,143 | |
Accrued wages and benefits | | | 5,317 | | | 5,965 | |
Closure/post-closure liabilities | | | 755 | | | 273 | |
Income taxes payable | | | 268 | | | — | |
Reserve for self-insurance | | | 5,490 | | | 6,463 | |
Deferred revenue | | | 6,996 | | | 8,509 | |
| | | | | | | |
Total current liabilities | | | 43,186 | | | 51,011 | |
| | | | | | | |
LONG-TERM DEBT, NET OF CURRENT MATURITIES | | | 150,069 | | | 157,926 | |
NONCURRENT DEFERRED INCOME TAXES | | | 23,513 | | | 20,458 | |
TAX CONTINGENCY RESERVES | | | — | | | 6,663 | |
CLOSURE/POST-CLOSURE LIABILITIES | | | 6,347 | | | 7,608 | |
OTHER LONG-TERM LIABILITIES | | | 1,293 | | | 1,978 | |
COMMITMENTS AND CONTINGENCIES (Note 13) | | | — | | | — | |
SHAREHOLDERS’ EQUITY: | | | | | | | |
Common stock, no par value, shares authorized 80,000,000 shares issued and outstanding: 2006 - 13,962,609; 2007 - 14,168,559 | | | 43,179 | | | 45,808 | |
Paid-in capital | | | 8,624 | | | 9,554 | |
Retained earnings | | | 93,903 | | | 108,093 | |
Accumulated other comprehensive income (loss), net of income taxes | | | 165 | | | (66 | ) |
| | | | | | | |
Total shareholders’ equity | | | 145,871 | | | 163,389 | |
| | | | | | | |
TOTAL LIABILITIES AND SHAREHOLDERS’ EQUITY | | $ | 370,279 | | $ | 409,033 | |
| | | | | | | |
See Notes to Consolidated Financial Statements.
F-3
WASTE INDUSTRIES USA, INC. AND SUBSIDIARIES
CONSOLIDATED STATEMENTS OF OPERATIONS
Years Ended December 31, 2005, 2006 and 2007
(In Thousands, Except Per Share Data)
| | | | | | | | | | | | |
| | | 2005 | | | 2006 | | | 2007 | |
REVENUES: | | | | | | | | | | | | |
Service revenues | | $ | 304,466 | | | $ | 326,447 | | | $ | 339,599 | |
Equipment sales | | | 641 | | | | 1,098 | | | | 1,069 | |
| | | | | | | | | | | | |
Total revenues | | | 305,107 | | | | 327,545 | | | | 340,668 | |
| | | | | | | | | | | | |
OPERATING COSTS AND EXPENSES: | | | | | | | | | | | | |
Operating (exclusive of depreciation and amortization shown below) | | | 204,990 | | | | 212,171 | | | | 215,006 | |
Cost of equipment sales | | | 384 | | | | 666 | | | | 629 | |
Selling, general and administrative | | | 42,208 | | | | 43,167 | | | | 47,509 | |
Depreciation and amortization | | | 29,908 | | | | 32,093 | | | | 31,751 | |
Gain on sale of property, equipment and other assets | | | (1,374 | ) | | | (1,189 | ) | | | (1,624 | ) |
Impairment of property, equipment and other assets | | | 143 | | | | 223 | | | | 16 | |
| | | | | | | | | | | | |
Total operating costs and expenses | | | 276,259 | | | | 287,131 | | | | 293,287 | |
| | | | | | | | | | | | |
OPERATING INCOME | | | 28,848 | | | | 40,414 | | | | 47,381 | |
| | | | | | | | | | | | |
Interest expense | | | 9,833 | | | | 9,608 | | | | 9,871 | |
Interest income | | | (96 | ) | | | (181 | ) | | | (126 | ) |
Other | | | (231 | ) | | | (418 | ) | | | (193 | ) |
| | | | | | | | | | | | |
Total other expense, net | | | 9,506 | | | | 9,009 | | | | 9,552 | |
| | | | | | | | | | | | |
INCOME FROM CONTINUING OPERATIONS BEFORE INCOME TAXES | | | 19,342 | | | | 31,405 | | | | 37,829 | |
INCOME TAX EXPENSE ATTRIBUTABLE TO CONTINUING OPERATIONS | | | 7,792 | | | | 14,416 | | | | 14,301 | |
| | | | | | | | | | | | |
INCOME FROM CONTINUING OPERATIONS | | | 11,550 | | | | 16,989 | | | | 23,528 | |
| | | |
DISCONTINUED OPERATIONS: | | | | | | | | | | | | |
Income from discontinued operations prior to sale (net of income taxes) | | | 454 | | | | 10 | | | | — | |
Gain on sale of operations (net of income taxes) | | | 185 | | | | 2,282 | | | | 153 | |
| | | | | | | | | | | | |
INCOME FROM DISCONTINUED OPERATIONS | | | 639 | | | | 2,292 | | | | 153 | |
| | | | | | | | | | | | |
NET INCOME | | $ | 12,189 | | | $ | 19,281 | | | $ | 23,681 | |
| | | | | | | | | | | | |
See Notes to Consolidated Financial Statements
F-4
WASTE INDUSTRIES USA, INC. AND SUBSIDIARIES
CONSOLIDATED STATEMENTS OF OPERATIONS - continued
Years Ended December 31, 2005, 2006 and 2007
(In Thousands, Except Per Share Data)
| | | | | | | | | |
| | | 2005 | | 2006 | | 2007 |
EARNINGS PER SHARE | | | | | | | | | |
Basic: | | | | | | | | | |
| | | |
Income from continuing operations | | $ | 0.85 | | $ | 1.22 | | $ | 1.67 |
Income from discontinued operations | | | 0.04 | | | 0.17 | | | 0.01 |
| | | | | | | | | |
NET INCOME | | $ | 0.89 | | $ | 1.39 | | $ | 1.68 |
| | | | | | | | | |
Diluted: | | | | | | | | | |
| | | |
Income from continuing operations | | $ | 0.84 | | $ | 1.21 | | $ | 1.66 |
Income from discontinued operations | | | 0.04 | | | 0.16 | | | 0.01 |
| | | | | | | | | |
NET INCOME | | $ | 0.88 | | $ | 1.37 | | $ | 1.67 |
| | | | | | | | | |
WEIGHTED-AVERAGE NUMBER OF SHARES | | | | | | | | | |
OUTSTANDING | | | | | | | | | |
Basic | | | 13,661 | | | 13,871 | | | 14,088 |
| | | | | | | | | |
Diluted | | | 13,821 | | | 14,043 | | | 14,196 |
| | | | | | | | | |
CASH DIVIDENDS PAID | | $ | 3,289 | | $ | 5,283 | | $ | 7,198 |
| | | | | | | | | |
CASH DIVIDENDS DECLARED AND PAID PER SHARE OF COMMON STOCK | | $ | 0.24 | | $ | 0.38 | | $ | 0.51 |
| | | | | | | | | |
See Notes to Consolidated Financial Statements
F-5
WASTE INDUSTRIES USA, INC. AND SUBSIDIARIES
CONSOLIDATED STATEMENTS OF SHAREHOLDERS’ EQUITY AND COMPREHENSIVE INCOME
Years Ended December 31, 2005, 2006 and 2007
(In Thousands)
| | | | | | | | | | | | | | | | | | | | | | | | |
| | | SHARES | | | COMMON
STOCK | | | PAID-IN
CAPITAL | | RETAINED
EARNINGS | | | ACCUMULATED
OTHER
COMPREHENSIVE
INCOME (LOSS) | | | TOTAL
SHAREHOLDERS’
EQUITY | |
| | | AUTHORIZED | | OUTSTANDING | | | | | | |
Balance, January 1, 2004 | | 80,000 | | 13,495 | | | $ | 39,308 | | | $ | 7,342 | | $ | 71,005 | | | $ | 56 | | | $ | 117,711 | |
Net income | | — | | — | | | | — | | | | — | | | 12,189 | | | | — | | | | 12,189 | |
| | | | | | | | | | | | | | | | | | | | | | | | |
Other comprehensive income, net of income taxes of ($309) | | | | | | | | | | | | | | | | | | | | | | | | |
Unrealized gain on cash flow hedges, net of reclassification adjustment | | — | | — | | | | — | | | | — | | | — | | | | 598 | | | | 598 | |
| | | | | | | | | | | | | | | | | | | | | | | | |
Other comprehensive income | | | | | | | | | | | | | | | | | | | | | | | 598 | |
| | | | | | | | | | | | | | | | | | | | | | | | |
Comprehensive income | | | | | | | | | | | | | | | | | | | | | | | 12,787 | |
Income tax benefit from stock options | | — | | — | | | | — | | | | 402 | | | — | | | | — | | | | 402 | |
Issuances of stock | | — | | 6 | | | | 79 | | | | — | | | — | | | | — | | | | 79 | |
Exercise of stock options | | — | | 253 | | | | 2,028 | | | | — | | | — | | | | — | | | | 2,028 | |
Cancellation of shares | | — | | (18 | ) | | | (219 | ) | | | — | | | — | | | | — | | | | (219 | ) |
Cash dividends paid | | — | | — | | | | — | | | | — | | | (3,289 | ) | | | — | | | | (3,289 | ) |
| | | | | | | | | | | | | | | | | | | | | | | | |
Balance, December 31, 2005 | | 80,000 | | 13,736 | | | | 41,196 | | | | 7,744 | | | 79,905 | | | | 654 | | | | 129,499 | |
Net income | | — | | — | | | | — | | | | — | | | 19,281 | | | | — | | | | 19,281 | |
| | | | | | | | | | | | | | | | | | | | | | | | |
Other comprehensive income, net of income taxes of ($343) | | | | | | | | | | | | | | | | | | | | | | | | |
Unrealized gain on cash flow hedges, net of reclassification adjustment | | — | | — | | | | — | | | | — | | | — | | | | (489 | ) | | | (489 | ) |
| | | | | | | | | | | | | | | | | | | | | | | | |
Other comprehensive income | | | | | | | | | | | | | | | | | | | | | | | (489 | ) |
| | | | | | | | | | | | | | | | | | | | | | | | |
Comprehensive income | | | | | | | | | | | | | | | | | | | | | | | 18,792 | |
Income tax benefit from stock options | | — | | — | | | | — | | | | 346 | | | — | | | | — | | | | 346 | |
Issuances of stock | | — | | 4 | | | | 78 | | | | — | | | — | | | | — | | | | 78 | |
Exercise of stock options | | — | | 223 | | | | 1,905 | | | | — | | | — | | | | — | | | | 1,905 | |
Cancellation of shares | | — | | — | | | | — | | | | 534 | | | — | | | | — | | | | 534 | |
Cash dividends paid | | — | | — | | | | — | | | | — | | | (5,283 | ) | | | — | | | | (5,283 | ) |
| | | | | | | | | | | | | | | | | | | | | | | | |
Balance, December 31, 2006 | | 80,000 | | 13,963 | | | | 43,179 | | | | 8,624 | | | 93,903 | | | | 165 | | | | 145,871 | |
Net income | | — | | — | | | | — | | | | — | | | 23,681 | | | | — | | | | 23,681 | |
| | | | | | | | | | | | | | | | | | | | | | | | |
Other comprehensive loss: | | | | | | | | | | | | | | | | | | | | | | | | |
Unrealized loss on cash flow hedges, net of income taxes of $110 | | — | | — | | | | — | | | | — | | | — | | | | (165 | ) | | | (165 | ) |
Postretirement expense, net of income taxes of $64 | | — | | — | | | | — | | | | — | | | — | | | | (66 | ) | | | (66 | ) |
| | | | | | | | | | | | | | | | | | | | | | | | |
Other comprehensive loss | | | | | | | | | | | | | | | | | | | | | | | (231 | ) |
| | | | | | | | | | | | | | | | | | | | | | | | |
Comprehensive income | | | | | | | | | | | | | | | | | | | | | | | 23,450 | |
Income tax benefit from stock options | | — | | — | | | | — | | | | 302 | | | — | | | | — | | | | 302 | |
Issuances of stock | | — | | 8 | | | | 240 | | | | — | | | — | | | | — | | | | 240 | |
Exercise of stock options | | — | | 198 | | | | 2,389 | | | | — | | | — | | | | — | | | | 2,389 | |
Stock option expense | | — | | — | | | | — | | | | 628 | | | — | | | | — | | | | 628 | |
Tax contingency cumulative effect adjustment | | — | | — | | | | — | | | | — | | | (2,293 | ) | | | — | | | | (2,293 | ) |
Cash dividends paid | | — | | — | | | | — | | | | — | | | (7,198 | ) | | | — | | | | (7,198 | ) |
| | | | | | | | | | | | | | | | | | | | | | | | |
Balance, December 31, 2007 | | 80,000 | | 14,169 | | | $ | 45,808 | | | $ | 9,554 | | $ | 108,093 | | | $ | (66 | ) | | $ | 163,389 | |
| | | | | | | | | | | | | | | | | | | | | | | | |
See Notes to Consolidated Financial Statements.
F-6
WASTE INDUSTRIES USA, INC. AND SUBSIDIARIES
CONSOLIDATED STATEMENTS OF CASH FLOWS
Years Ended December 31, 2005, 2006 and 2007
(In Thousands)
| | | | | | | | | | | | |
| | | 2005 | | | 2006 | | | 2007 | |
OPERATING ACTIVITIES: | | | | | | | | | | | | |
Net income | | $ | 12,189 | | | $ | 19,281 | | | $ | 23,681 | |
Adjustments to reconcile net income to net cash provided by operating activities: | | | | | | | | | | | | |
Depreciation and amortization | | | 30,720 | | | | 32,220 | | | | 31,751 | |
Landfill accretion expense | | | 414 | | | | 824 | | | | 727 | |
Amortization of debt issuance costs | | | 967 | | | | 513 | | | | 409 | |
Impairment of property, equipment and other assets | | | 143 | | | | 223 | | | | 16 | |
Gain on sale of property and equipment and other assets | | | (1,374 | ) | | | (1,189 | ) | | | (1,624 | ) |
Gain on sale of discontinued collection and disposal operations | | | (184 | ) | | | (2,282 | ) | | | (153 | ) |
Stock compensation expense | | | 79 | | | | 612 | | | | 867 | |
Deferred income taxes | | | 332 | | | | 2,381 | | | | 1,963 | |
Change in fair value of commodity hedges | | | (397 | ) | | | 644 | | | | 1,224 | |
Provision for doubtful accounts | | | 2,091 | | | | 1,557 | | | | 2,022 | |
Changes in operating assets and liabilities, net of effects from acquisition and disposition of related businesses: | | | | | | | | | | | | |
Receivables | | | (7,452 | ) | | | (2,326 | ) | | | (744 | ) |
Prepaid expenses and other current assets | | | 1,317 | | | | 2,074 | | | | 269 | |
Other assets | | | 1,151 | | | | (305 | ) | | | 579 | |
Accounts payable and accrued liabilities | | | 4,530 | | | | (6,245 | ) | | | 4,635 | |
Deferred revenue and other liabilities | | | 1,844 | | | | (2,916 | ) | | | (1,282 | ) |
| | | | | | | | | | | | |
Net cash provided by operating activities | | | 46,370 | | | | 45,066 | | | | 64,340 | |
| | | | | | | | | | | | |
INVESTING ACTIVITIES: | | | | | | | | | | | | |
Acquisitions of operations | | | (31,937 | ) | | | (6,190 | ) | | | (24,171 | ) |
Purchases of property and equipment | | | (34,264 | ) | | | (41,154 | ) | | | (36,886 | ) |
Proceeds from sale of property and equipment and other assets | | | 3,415 | | | | 2,209 | | | | 2,936 | |
Proceeds from sale of discontinued collection and disposal operations | | | 7,988 | | | | 16,354 | | | | 270 | |
Increase in restricted cash | | | (175 | ) | | | (728 | ) | | | (6,621 | ) |
Other | | | (7 | ) | | | (179 | ) | | | (109 | ) |
| | | | | | | | | | | | |
Net cash used in investing activities | | | (54,980 | ) | | | (29,688 | ) | | | (64,581 | ) |
| | | | | | | | | | | | |
FINANCING ACTIVITIES: | | | | | | | | | | | | |
Proceeds from issuance of long-term debt | | | 47,697 | | | | 44,000 | | | | 72,000 | |
Principal payments of long-term debt | | | (38,416 | ) | | | (55,245 | ) | | | (64,143 | ) |
Payment of dividends | | | (3,289 | ) | | | (5,283 | ) | | | (7,198 | ) |
Principal payments of capital lease obligations | | | (212 | ) | | | (441 | ) | | | (213 | ) |
Financing costs | | | (68 | ) | | | (579 | ) | | | (191 | ) |
Excess tax benefit from stock option exercises | | | — | | | | 346 | | | | 302 | |
Net proceeds from exercise of stock options | | | 2,028 | | | | 1,905 | | | | 2,389 | |
| | | | | | | | | | | | |
Net cash (used in) provided by financing activities | | | 7,740 | | | | (15,297 | ) | | | 2,946 | |
| | | | | | | | | | | | |
(DECREASE) INCREASE IN CASH AND CASH EQUIVALENTS | | | (870 | ) | | | 81 | | | | 2,705 | |
CASH AND CASH EQUIVALENTS, BEGINNING OF YEAR | | | 2,445 | | | | 1,575 | | | | 1,656 | |
| | | | | | | | | | | | |
CASH AND CASH EQUIVALENTS, END OF YEAR | | $ | 1,575 | | | $ | 1,656 | | | $ | 4,361 | |
| | | | | | | | | | | | |
See Notes to Consolidated Financial Statements.
F-7
WASTE INDUSTRIES USA, INC. AND SUBSIDIARIES
CONSOLIDATED STATEMENTS OF CASH FLOWS
Years Ended December 31, 2005, 2005 and 2007
(Dollars In Thousands)
| | | | | | | | | |
| | | 2005 | | 2006 | | 2007 |
| SUPPLEMENTAL DISCLOSURES OF CASH FLOW INFORMATION: | | | | | | | | | |
Cash paid for interest, net of capitalized interest | | $ | 9,517 | | $ | 9,042 | | $ | 10,699 |
| | | | | | | | | |
Cash paid for income taxes | | $ | 3,863 | | $ | 18,383 | | $ | 13,209 |
| | | | | | | | | |
Supplemental Schedule of Noncash Investing and Financing Transactions—
During 2005, 2006 and 2007, the Company acquired approximately $561, $55 and $45, respectively, of fixed assets by entering into capital lease arrangements.
As of December 31, 2006 and 2007, approximately $1,011 and $2,934 of fixed asset additions were included in accounts payable, respectively.
During 2005, the Company sold an insurance policy in exchange for 17,617 shares of the Company’s common stock with a fair value of approximately $219 (See Note 11).
During 2006 and 2007, the Company financed insurance premiums of approximately $3,915 and $3,930, respectively and recorded prepaid insurance with an offsetting note payable for that amount.
F-8
WASTE INDUSTRIES USA. INC
NOTES TO CONSOLIDATED FINANCIAL STATEMENTS
| 1. | BASISOF PRESENTATIONAND ACCOUNTING POLICIES |
Business Operations—Waste Industries USA, Inc. (the “Company”) is a regional solid waste services company providing solid waste collection, transfer, recycling, processing and disposal services to customers in North Carolina, South Carolina, Georgia, Mississippi, Tennessee, and Virginia.
Proposed Going Private Transaction -On December 17, 2007, the Company entered into an agreement and plan of merger with Marlin HoldCo LP, a Delaware limited partnership (“HoldCo”), and the Company’s wholly owned subsidiary, Marlin MergeCo Inc., a North Carolina corporation (“MergeCo”). Pursuant to the terms of the merger agreement, MergeCo will merge with and into the Company, and, as a result, the Company will continue as the surviving corporation and a wholly owned subsidiary of HoldCo. HoldCo is owned by an investor group (the “Investor Group”) led by Lonnie C. Poole, Jr., the Company’s founder and Chairman, and Jim W. Perry, the Company’s President and Chief Executive Officer, and financial partners MIP Waste Holdings, L.P., an affiliate of Macquarie Infrastructure Partners, and GS Direct, LLC, an affiliate of Goldman, Sachs & Co.
Upon the completion of the merger, the Company would cease to be a publicly reporting company and would cease all filings under the Securities Exchange Act of 1934, as amended.
The merger agreement was unanimously approved by the Special Committee of the Company’s Board of Directors that was appointed by the Board of Directors to consider this matter. The merger agreement was also approved by the Company’s Board of Directors, with Lonnie C. Poole, Jr. and Jim W. Perry abstaining.
At the effective time of the merger, each outstanding share of the Company’s common stock, other than a portion of the shares owned by the Investor Group (as discussed in the next paragraph) and by any shareholders who properly exercise dissenters’ rights under North Carolina law, will be cancelled and converted into the right to receive $38.00 in cash, without interest.
A portion of the shares of common stock owned by Lonnie C. Poole, Jr., Jim W. Perry and certain of their family members and affiliates will not receive the cash merger consideration, but will instead be exchanged for equity ownership in HoldCo.
The merger agreement and the transactions contemplated thereby will be submitted to a vote of the Company’s shareholders at a special meeting of the Company’s shareholders. The members of the Investor Group who hold shares of the Company’s common stock, including Mr. Poole and Mr. Perry and their family members and affiliates, have entered into a support agreement with the other members of the Investor Group in which they have agreed to vote their shares in favor of the merger. The vote of the shares subject to the support agreement is sufficient to approve the merger.
The closing of the merger is conditioned upon the approval of the Company’s shareholders, certain regulatory approvals, including the expiration of the waiting period under the Hart-Scott-Rodino Antitrust Improvements Act of 1976, which period expired on February 6, 2008, the exercise of dissenters’ rights by holders of not more than 10% of the Company’s common stock and other customary closing conditions. The closing of the merger is not conditioned on the receipt of any financing by the Investor Group. The Investor Group has received a commitment from Wachovia Bank, HSBC Securities (USA) and HSBC Bank for up to $455 million in debt financing to finance the transaction.
The Company may not solicit other proposals or, subject to exceptions that permit the Company’s Board of Directors (or the Special Committee) to take actions as required by their fiduciary duties to participate in any discussions or negotiations regarding unsolicited alternative business combination transactions.
The Company has made customary representations, warranties and covenants in the merger agreement, which generally expire at the effective time of the merger. Some of these covenants relate to, and limit the Company’s discretion to, take certain actions or business decisions without the prior consent of HoldCo, including, but not limited to declaring or paying any dividend on shares of the Company’s common stock; purchasing, selling, mortgaging or otherwise disposing of any properties or assets having a value in excess of $5 million in the aggregate; making any investment or material acquisition of another person or business having a value in excess of $5 million in the aggregate; making any capital expenditures not contemplated by the capital expenditure budget having an aggregate value in excess of $5 million for any 12 consecutive month period; incurring, assuming, guaranteeing, or becoming obligated with respect to, any debt, which, when taken together with all our other debt would result in indebtedness greater than $180 million in the aggregate outstanding at any given time (excluding intercompany debt); entering into, renewing, extending, amending or terminating any contract which if entered into prior to the date of the merger would be a material contract, other than any contract relating to indebtedness that would not be prohibited in the merger agreement, or any contracts not in the ordinary course, involving the commitment or transfer of value in excess of $5 million in the aggregate in any year; or waiving, releasing, assigning, settling or compromising any claim, action or proceeding, other than waivers, releases, assignments, settlements or compromises that involve only the payment of monetary damages not in excess of $1 million in the aggregate, or otherwise paying, discharging or satisfying any claims, liabilities or obligations in excess of such amount, in each case, other than in the ordinary course consistent with past practice.
The merger agreement contains certain termination rights for HoldCo, including if the Company’s Board of Directors (or
the Special Committee) changes its recommendation to the shareholders in response to a superior proposal as required by its fiduciary duties under applicable law. The merger agreement also provides that, upon the termination of the merger agreement, under specified circumstances, the Company will be required to reimburse HoldCo for its reasonable merger expenses up to $8.75 million and that, under specified circumstances, the Company will be required to pay HoldCo a termination fee of approximately $19.0 million. Additionally, under specified circumstances, HoldCo will be required to pay the Company a termination fee of approximately $29.9 million. The members of the Investor Group have severally, but not jointly, agreed to guarantee their proportionate liability of any such amounts payable by HoldCo to the Company pursuant to a limited guarantee. As of December 31, 2007, the Company had incurred approximately $1.9 million in professional fees associated with this proposed transaction.
F-9
WASTE INDUSTRIES USA. INC
NOTES TO CONSOLIDATED FINANCIAL STATEMENTS
Basis of Presentation—The Company’s consolidated financial statements include its wholly owned subsidiaries. All intercompany balances and transactions have been eliminated.
Significant Accounting Policies—The significant accounting policies are summarized below:
a.Use of Estimates— The preparation of financial statements in conformity with accounting principles generally accepted in the United States of America requires management to make estimates and assumptions that affect the reported amounts of assets and liabilities and disclosure of contingent liabilities at the date of the consolidated financial statements and the reported amounts of revenues and expenses during the reporting period. Material estimates that are particularly susceptible to significant change in the near term relate to the determination of the allowance for uncollectible accounts, self-insurance reserves, fair value of derivative financial instruments, closure/post closure liabilities and assumptions used in testing the recoverability of goodwill, intangible assets and fixed assets. Actual results could differ from these estimates.
b.Cash and Cash Equivalents—For the purposes of presentation in the financial statements, cash equivalents include highly liquid investments with original maturities of three months or less.
c. Allowance for Doubtful Accounts—The Company maintains allowances for doubtful accounts for estimated losses resulting from the inability of its customers to make required payments. The estimated allowance for doubtful accounts is based upon historical collection trends, type of customer, such as municipal or non-municipal, the age of the outstanding receivables and existing economic conditions. The allowance for doubtful accounts was $2.2 million and $1.5 million at December 31, 2006 and 2007, respectively.
If the financial condition of the Company’s customers was to deteriorate, resulting in an impairment of their ability to make payments, additional allowances might be required.
d. Concentrations of Credit Risk—Financial instruments that potentially subject the Company to concentrations of credit risks consist primarily of accounts receivable. Credit risk on accounts receivable is minimized as a result of the large and diverse nature of the Company’s customer base. No single customer accounted for more than 5% of revenues in 2005, 2006 or 2007. One customer accounted for approximately 6% and 5% of the net accounts receivable balance as of December 31, 2006 and 2007, respectively. The Company does not believe that the loss of any single customer would have a material adverse effect on its results of operations or financial position.
e.Spare parts, supplies, and fuel inventories—Inventories consist of operating materials and supplies held for use and are stated at the lower of cost or market on a first-in first-out basis.
f. Property and Equipment—Property and equipment are stated at cost. Depreciation and amortization expense are calculated on the straight-line method. Estimated useful lives are as follows:
| | |
| Land improvements | | 7 years |
| Machinery and equipment | | 5 to 10 years |
| Rolling stock | | 5 to 12 years |
| Containers | | 10 years |
| Furniture and fixtures | | 5 to 7 years |
| Computers and software | | 3 to 5 years |
| Buildings | | 30 years |
Landfill permitting, acquisition and preparation costs are amortized using a units-of-consumption method as permitted airspace of the landfill is consumed. In some circumstances, the Company includes airspace that is not currently permitted but is part of an expansion effort in its estimate of available airspace. To do so, the following criteria must be met:
| | • | | the land where the expansion is being sought is contiguous to the current disposal site, and is either owned by the Company or the property is under an option, purchase, operating or other agreement; |
| | • | | total development costs, final capping costs, and closure/post-closure costs have been determined; |
| | • | | internal personnel have performed a financial analysis of the proposed expansion site and have determined that it has a positive financial operational impact; |
F-10
WASTE INDUSTRIES USA. INC
NOTES TO CONSOLIDATED FINANCIAL STATEMENTS
| | • | | internal or external personnel are actively working to obtain the necessary approvals to obtain the landfill expansion permit; |
| | • | | obtaining the expansion is considered probable. For a pursued expansion to be considered probable, there must be no significant, known technical, legal, community, business, or political restrictions or similar issues existing that could impair the success of the expansion; and, |
| | • | | the land where the expansion is being sought has the proper zoning or proper zoning can readily be obtained. |
Landfill permitting and preparation costs represent only direct costs related to these activities, including legal, engineering and construction. Landfill preparation costs include the costs of construction associated with excavation, liners, site berms and the installation of leak detection and leachate collection systems. Interest is capitalized on landfill permitting and construction projects and other projects under development while the assets are undergoing activities to ready them for their intended use. The interest capitalization rate is based on the Company’s weighted average cost of indebtedness. Interest capitalized for the years ended December 31, 2005, 2006 and 2007 was $759,000, $968,000, and $948,000, respectively. In determining the amortization rate for a landfill, preparation costs include the total estimated costs to complete construction of the landfills permitted and probable to be permitted capacity. Units-of-consumption amortization rates are determined annually. The rates are determined by management based on estimates provided by the Company’s internal and third party engineers, and consider the information provided by surveys which are performed at least annually.
Direct costs related to the development of specific landfill sites are capitalized if the land on which the site is being developed is either owned by the Company or is under an option, purchase, operating or other agreement and it is probable that the Company will obtain the required permits to operate the landfill. Indirect costs are expensed as incurred.
Management routinely reviews its investment in operating landfills to determine whether the costs of these investments are realizable. Judgments regarding the existence of impairment indicators are based on regulatory factors, market conditions and operational performance of the Company’s landfills.
The costs of maintenance and repairs are expensed as incurred. Improvements and betterments that add new functionality or extend the useful life of the asset are capitalized.
g.Intangible Assets—Intangible assets primarily consist of goodwill (indefinite life), customer lists (definite life) and noncompete agreements (definite life) acquired in business combinations.
The Company operates as one reporting unit based on its current reporting structure. The Company performs an annual goodwill impairment test. At least quarterly, the Company analyzes whether events have occurred that would more likely than not reduce its enterprise fair value below its carrying amount and, if necessary, will perform a goodwill impairment test between annual dates. Impairment charges are recognized as operating expenses. The Company’s annual assessment date is July 31. The Company completed its annual impairment test as of July 31, 2007 and determined that there was no goodwill impairment.
Intangible assets with a definite life are amortized over their expected lives, typically five to ten years (see Note 4) on a straight-line or accelerated basis to match the economic benefit received.
h.Restricted Cash— Restricted cash consists primarily of funds held in trust for the construction of the Wake County landfill which are expected to be utilized in 2008 and for the payments of closure and post-closure obligations related to the Grady Road landfill.
i.Deferred Financing Costs—Included in other noncurrent assets are debt issue costs relating to borrowings (see Note 5). Debt issue costs are amortized to interest expense over the life of the related debt in a manner that approximates the effective interest rate method.
j.Derivative Financial Instruments and Other Comprehensive Income (Loss)— The Company utilizes cash flow hedge agreements to manage a portion of its risks related to fluctuations in interest rates. The Company measures effectiveness of the interest rate swaps by its ability to offset cash flows associated with changes in the variable LIBOR rate associated with the Company’s credit facility using the change in variable cash flow method. To the extent the interest rate swap is considered to be effective, changes in fair value are recorded, net of income tax, in shareholders’ equity as a component of accumulated other comprehensive income (loss). To the extent the instrument is considered ineffective, any changes in fair value relating to the ineffective portion are immediately recognized in the consolidated statements of operations as interest expense.
F-11
WASTE INDUSTRIES USA. INC
NOTES TO CONSOLIDATED FINANCIAL STATEMENTS
The Company enters into commodity contracts to hedge its cash received from the sale of old corrugated cardboard (“OCC”). The OCC contracts are not currently designated as accounting hedges so the Company is required to recognize changes in the fair value of the commodity contracts within its consolidated statements of operations.
The Company has used heating oil option agreements to manage a portion of its exposure to fluctuations in diesel fuel oil prices. The fuel contracts are not currently designated as accounting hedges so the Company is required to recognize changes in the fair value of the commodity contracts within its consolidated statements of operations.
k. Asset Impairment—The Company reviews long-lived assets for impairment on a market-by-market basis whenever events or changes in the circumstances indicate that the carrying amount of an asset might not be recoverable. If an evaluation is required, the projected future net cash flows on an undiscounted basis attributable to each market would be compared to the carrying value of the long-lived assets (including an allocation of goodwill, if appropriate) of that market. If an impairment is indicated, the amount of the impairment is measured based on the fair value of the asset. The remaining useful lives are also evaluated to determine whether events and circumstances warrant revised estimates of such lives. Any resulting impairment loss could have a material adverse impact on the Company’s financial condition and results of operations. Impairment of certain intangible assets and operating equipment resulted in charges of approximately $143,000, $31,000 and $16,000 for the years ended December 31, 2005, 2006, and 2007, respectively. The 2006 results also include asset impairment charges of approximately $192,000 related to the Company’s determination that certain landfill permitting efforts had a less than probable chance of success.
l.Self –Insurance Reserves—The Company assumes the risks for medical, dental, workers compensation and casualty insurance exposures up to certain loss thresholds set forth in separate insurance contracts. The Company’s insurance accruals are based on claims filed and estimates of claims incurred but not reported. The insurance accruals are influenced by the Company’s actuarially determined past claims experience factors.
m.Earnings Per Share—Basic earnings per share computations are based on the weighted-average number of shares of common stock outstanding. Diluted earnings per share include the dilutive effect of stock options using the treasury stock method. Basic earnings per share is computed by dividing net income by the weighted average number of common shares outstanding during the period. Diluted earnings per share is based on the combined weighted average number of common shares and common share equivalents outstanding that include, where appropriate, the assumed exercise of stock options.
Earnings per share for the years ended December 31, 2005, 2006 and 2007 is calculated as follows (in thousands, except per share amounts):
| | | | | | | | | |
| | | 2005 | | 2006 | | 2007 |
Numerator: | | | | | | | | | |
Net income | | $ | 12,189 | | $ | 19,281 | | $ | 23,681 |
| | | | | | | | | |
Denominator: | | | | | | | | | |
Denominator for basic earnings per share | | | 13,661 | | | 13,871 | | | 14,088 |
Effect of dilutive securities - options to purchase common stock | | | 160 | | | 172 | | | 108 |
| | | | | | | | | |
Denominator for diluted earnings per share | | | 13,821 | | | 14,043 | | | 14,196 |
| | | | | | | | | |
Basic earnings per share | | $ | 0.89 | | $ | 1.39 | | $ | 1.68 |
| | | | | | | | | |
Diluted earnings per share | | $ | 0.88 | | $ | 1.37 | | $ | 1.67 |
| | | | | | | | | |
Antidilutive options to purchase common stock not included in the earnings per share calculation | | | 192 | | | 34 | | | — |
| | | | | | | | | |
n.Dividends—The Company paid three cash dividends in 2005 and quarterly cash dividends in 2006 and 2007. The Company intends to pay dividends when sufficient cash is available to effect the dividend without impeding the Company’s ability to pay its debts as they become due in the usual course of business. See Note 9 for restrictions on payment of dividends.
F-12
WASTE INDUSTRIES USA. INC
NOTES TO CONSOLIDATED FINANCIAL STATEMENTS
o. Stock-Based Compensation— Effective January 1, 2006, the Company adopted SFAS No. 123 (revised 2004),Share-Based Payment(“SFAS No. 123R”) requiring that compensation costs relating to share-based payment awards made to employees and directors be recognized in the financial statements. The principal awards issued under the Company’s stock-based compensation plans, which are described in Note 14, “Stock-Based Compensation Plans”, include incentive stock options, non-qualified stock options and common stock. The cost for such awards is measured at the grant date based on the calculated fair value of the award. The value of the portion of the award that is ultimately expected to vest is recognized as expense over the requisite service periods (generally the vesting period of the equity award) in the Company’s consolidated statements of operations.
The Company adopted this standard as of the beginning of the first quarter of fiscal 2006 using the modified prospective method. Under this transition method, compensation cost recognized includes compensation costs for all share-based payments granted prior to, but not yet vested as of December 31, 2005, based on the grant-date fair value estimated in accordance with the original provisions of SFAS No. 123, and compensation cost for share-based payments granted subsequent to December 31, 2005, based on the grant-date fair value estimated in accordance with the provisions of SFAS No. 123R. Results for prior periods have not been restated.
Prior to January 1, 2006, the Company accounted for its stock options under the recognition and measurement provision of APB Opinion No. 25,Accounting for Stock Issued to Employees, and related interpretations, as permitted by SFAS No. 123,Accounting for Stock-Based Compensation. The Company did not generally recognize stock option expense in its consolidated statements of operations.
As a result of the adoption of SFAS No. 123R on January 1, 2006, the Company’s results for the year ended December 31, 2006 and 2007 include stock-based compensation expense relating to stock options of approximately $0.5 million and $0.6 million, respectively. This expense is included within selling, general, and administrative expenses on the consolidated statements of operations and relates primarily to unvested options granted prior to the January 1, 2006 date of adoption of SFAS No. 123R. These pre-adoption stock options are primarily incentive stock options and typically vest over a period of four years with a five-year contractual life. Cash dividends are not paid on unexercised options.
The following table illustrates the effect on net income per share if the Company had adopted the fair value recognition provisions of SFAS No. 123 in the year prior to the adoption of SFAS No. 123R (in thousands, except per share data):
| | | |
| | | 2005 |
Net Income: | | | |
As reported | | $ | 12,189 |
Deduct - total stock-based compensation determined under fair value based method for all awards | | | 555 |
| | | |
Pro forma | | $ | 11,634 |
| | | |
Earnings Per Share: | | | |
Basic: | | | |
As reported | | $ | 0.89 |
Pro forma | | $ | 0.85 |
| |
Diluted: | | | |
As reported | | $ | 0.88 |
Pro forma | | $ | 0.84 |
F-13
WASTE INDUSTRIES USA. INC
NOTES TO CONSOLIDATED FINANCIAL STATEMENTS
The per share fair value of options granted under the 1997 Stock Option Plan during 2005, 2006 and 2007 was estimated using the Black-Scholes option-pricing model and the following assumptions:
| | | | | | | | | | | | |
| | | 2005 | | | 2006 | | | 2007 | |
Weighted-average grant date fair value of options granted | | $ | 4.50 | | | $ | 5.78 | | | $ | 7.18 | |
Weighted-average expected lives (years) | | | 5.00 | | | | 3.50 | | | | 3.47 | |
Risk-free interest rate | | | 3.91 | % | | | 4.84 | % | | | 4.50 | % |
Expected dividend yield | | | 2.30 | % | | | 2.00 | % | | | 2.00 | % |
Volatility | | | 39.78 | % | | | 37.00 | % | | | 34.60 | % |
Expected volatility is based on the historical volatility of the Company’s common stock price. For grants prior to adoption of SFAS 123R, the expected term was based on the contractual life of the option. For the 2006 grant, the expected term was derived using the simplified method as allowed by the Securities and Exchange Commission’s Staff Accounting Bulletin No. 107. The risk-free interest rate for periods within the expected life of the option is based on the U.S. Treasury yield curve in effect at the time of the grant. The expected dividend yield is based upon the current annual dividend rate as computed using the stock price at the option grant date (for grants prior to 2006), adjusted for future expected dividend increases (for 2006 and 2007 grants).
Historically, the Company primarily grants incentive stock options, which do not result in an income tax deduction to the Company unless a disqualifying disposition takes place. Consequently, no income tax benefit is recorded on incentive stock options as the options vest or are exercised unless the exercise is a disqualifying disposition. Prior to the adoption of SFAS No. 123R, the Company presented all income tax benefits resulting from the exercise of stock options as operating cash flows in its consolidated statements of cash flows. SFAS No. 123R requires cash flows resulting from excess income tax benefits to be shown as part of cash flows from financing activities and cash outflows from operating activities. The Company has elected to calculate its initial pool of excess tax benefits pursuant to the method described in FASB Staff Position No. SFAS 123R-3,Transition Election Related to Accounting for the Tax Effects of Share-Based Payment Awards.
p. Revenue Recognition and Deferred Revenue—The Company recognizes collection, transfer, recycling and disposal revenues when persuasive evidence of an arrangement exists, the service has been provided, the price is fixed or determinable and collection is reasonably assured. Certain customers are billed in advance and, accordingly, recognition of the related revenues is deferred until the services are provided. Commercial and industrial services and certain residential services are provided under 1 to 5 year contracts. Revenue under these contracts is recognized when services are provided, as the Company believes this is the best indicator of performance of the contractual obligation. The Company recognizes revenue related to contractual price increases based on fluctuations in CPI or other indices when the price increases become effective. Certain contracts limit the Company’s ability to pass on price increases to its customers. If circumstances arise that may impact the profitability of a contract, the contract is examined at that time. If the Company determines that a loss will result from the performance of such a contract, the entire amount of the estimated loss is charged against income in the period in which such determination is made. Revenues from the sale of recycled materials and equipment are recognized upon delivery.
Components of revenue are as follows (in millions):
| | | | | | | | | |
| | | Year Ended December 31, |
| | | 2005 | | 2006 | | 2007 |
Collection: | | | | | | | | | |
Residential | | $ | 66.9 | | $ | 74.9 | | $ | 81.2 |
Commercial | | | 83.9 | | | 91.6 | | | 96.2 |
Industrial | | | 86.2 | | | 89.9 | | | 88.2 |
Disposal and transfer | | | 44.3 | | | 46.3 | | | 48.4 |
Other | | | 23.8 | | | 24.8 | | | 26.7 |
| | | | | | | | | |
Total revenue | | $ | 305.1 | | $ | 327.5 | | $ | 340.7 |
| | | | | | | | | |
q. Segment Information—The Company has determined that it operates in one reportable segment representing the collection, transfer, recycling, and disposal of non-hazardous solid waste in the Southeastern United States because the Company’s chief operating decision maker regularly reviews operating results on a consolidated basis in deciding how to allocate resources and in assessing operating performance.
F-14
WASTE INDUSTRIES USA. INC
NOTES TO CONSOLIDATED FINANCIAL STATEMENTS
r.Income Taxes—Income taxes are accounted for under the asset and liability method. Under the asset and liability method, deferred income tax assets and liabilities are recognized for the estimated future income tax consequences attributable to temporary differences between financial statement carrying values and the income tax basis of assets and liabilities. Deferred income tax assets and liabilities are measured using enacted income tax rates expected to apply to taxable income in the years in which those temporary differences are expected to be recovered or settled. The effect on deferred income tax assets and liabilities of a change in income tax rates is recognized in the accompanying consolidated statements of operations in the period that includes the enactment date.
s. New Accounting Pronouncements— In June 2006, the Financial Accounting Standards Board (“FASB”) issued FASB Interpretation No. 48,Accounting for Uncertainty in Income Taxes – an interpretation of FASB Statement No. 109 (“FIN 48”). FIN 48 prescribes a recognition threshold and measurement attribute for financial statement recognition and measurement of a tax position taken or expected to be taken in a tax return, and also provides guidance on derecognition, classification, interest and penalties, accounting in interim periods and disclosure requirements for uncertain tax positions. The Company adopted the provisions of FIN 48 at the beginning of fiscal year 2007. The disclosure requirements and cumulative effect of adoption of FIN 48 are presented in Note 8.
In June 2006, the FASB ratified the consensus on Emerging Issues Task Force (“EITF”) No. 06-3,How Taxes Collected from Customers and Remitted to Governmental Authorities Should be Presented in the Income Statement. The scope of EITF 06-3 includes any tax assessed by a governmental authority that is directly imposed on a revenue-producing transaction between a seller and a customer and may include, but is not limited to, sales, use, value added and excise taxes. The Task Force affirmed its conclusion that entities should present these taxes in the income statement on either a gross or a net basis, based on their accounting policy, which should be disclosed pursuant to Accounting Principles Board (“APB “) No. 22,Disclosure of Accounting Policies. If such taxes are significant, and are presented on a gross basis, the amounts of those taxes should be disclosed. The consensus on EITF 06-3 was effective for the Company as of January 1, 2007. The Company adopted EITF 06-3 as of January 1, 2007 and it did not have a material impact on its financial statements. The Company shows sales taxes on a net basis.
In September 2006, the FASB issued Statement of Financial Accounting Standards (“SFAS”) No. 158,Employers’ Accounting for Defined Benefit Pension and Other Postretirement Plans—an amendment of FASB Statements No. 87, 88, 106 and 132(R). SFAS 158 requires recognition of the overfunded or underfunded status of pension and other postretirement benefit plans on the balance sheet. Under SFAS 158, gains and losses, prior service costs and credits and any remaining transition amounts under SFAS 87 and SFAS 106 that have not yet been recognized through net periodic benefit cost are recognized in accumulated other comprehensive income, net of tax effects, until they are amortized as a component of net periodic cost. Also, the measurement date—the date at which the benefit obligation and plan assets are measured—is required to be the Company’s fiscal year-end. SFAS 158 was effective for the Company as of December 31, 2006, at which time the Company had no postretirement or pension plans. Effective January 1, 2007, the Company extended a postretirement benefit to employees whereby an eligible employee could continue medical coverage for a limited period of time at a higher rate than active employees. The Company determined the accumulated projected benefit obligation and recorded approximately $0.1 million, net of income taxes, as an adjustment to other comprehensive income for the twelve-month period ended December 31, 2007. An unfunded postretirement obligation of approximately $0.2 million is included in other long-term liabilities as of December 31, 2007.
In September 2006, the SEC issued Staff Accounting Bulletin No. 108,Considering the Effects of Prior Year Misstatements when Quantifying Misstatements in Current Year Financial Statements (SAB 108). In practice, some companies currently use the “rollover” method, which focuses on the impact of a misstatement on the income statement. Other companies use the “iron curtain” method, which focuses on the impact of a misstatement on the balance sheet. SAB 108 requires companies to use a “dual approach” in quantifying financial statement misstatements. If an error is determined to be material under either approach, the financial statements must be adjusted. SAB 108 also provides transition guidance for correcting errors existing in prior years. SAB 108 was effective for the Company at December 31, 2006. The implementation of SAB 108 did not have an effect on the Company’s financial position or results of operations, and did not require an adjustment to beginning retained earnings as permitted by SAB 108.
t. New Accounting Pronouncements Not Yet Adopted — In December 2007, the FASB issued SFAS No. 141(R),Business Combinations,which establishes principles and requirements for how the acquirer recognizes and measures in its financial statements the identifiable assets acquired, the liabilities assumed, and any noncontrolling interests in the acquiree at the acquisition date. In addition, this statement provides guidance for recognizing and measuring the goodwill acquired in the
F-15
WASTE INDUSTRIES USA. INC
NOTES TO CONSOLIDATED FINANCIAL STATEMENTS
business combination and determines what information to disclose to enable users of the financial statement to evaluate the nature and financial effects of the business combination. SFAS 141(R) requires contingent consideration to be recognized at its fair value on the acquisition date and for certain arrangements, changes in fair value to be recognized in earnings until settled. SFAS 141(R) also requires acquisition costs to be expensed as incurred and restructuring costs to be expensed in periods after the acquisition date. SFAS 141(R) applies prospectively to business combinations for which the acquisition date is on or after the beginning of the first annual reporting period beginning on or after December 15, 2008. The Company is currently evaluating the impact that SFAS 141(R) will have on its financial position and results of operations.
In September 2006, the FASB issued SFAS No. 157,Fair Value Measurements. SFAS 157 defines fair value, establishes a framework for measuring fair value in generally accepted accounting principles and expands disclosures about fair value measurements. The statement does not require new fair value measurements, but is applied to the extent that other accounting pronouncements require or permit fair value measurements. The statement emphasizes that fair value is a market-based measurement that should be determined based on the assumptions that market participants would use in pricing an asset or liability. Companies will be required to disclose the extent to which fair value is used to measure assets and liabilities, the inputs used to develop the measurements, and the effect of certain of the measurements on earnings (or changes in net assets) for the period. SFAS 157 is effective for fiscal years beginning after November 15, 2007. In February 2008, the FASB issued FASB Staff Position FAS 157-2 to defer the effective date of SFAS No. 157 for all non-financial assets and liabilities, except those items recognized or disclosed at fair value on an annual or more frequently recurring basis, until years beginning after November 15, 2008. The Company is assessing SFAS 157 and has not determined the impact that the adoption of SFAS 157 will have on its financial position and results of operations.
In February 2007, the FASB issued SFAS No. 159,The Fair Value Option for Financial Assets & Financial Liabilities—Including an Amendment of SFAS No. 115. SFAS 159 will create a fair value option under which an entity may irrevocably elect fair value as the initial and subsequent measurement attribute for certain financial assets and liabilities on a contract by contract basis, with changes in fair values recognized in earnings as those changes occur. SFAS 159 will become effective for fiscal years beginning after November 15, 2007. The Company is currently reviewing the impact of SFAS 159 on its financial position and results of operations if it were to elect the fair value option.
In December 2007, the FASB issued SFAS No. 160,Noncontrolling Interests in Consolidated Financial Statements – an amendment of ARB No. 5,which establishes accounting and reporting standards for the noncontrolling interest in a subsidiary and for the deconsolidation of a subsidiary. It clarifies that a controlling interest in a subsidiary is an ownership interest in the consolidated entity that should be reported as equity in the consolidated financial statements. It requires consolidated net income to be reported at amounts that include the amounts attributable to both the parent and the noncontrolling interest. It also requires disclosure on the face of the consolidated statement of income, of amounts of the consolidated net income attributable to the parent and to the noncontrolling interest. SFAS 160 provides guidance when a subsidiary is deconsolidated and requires expanded disclosures in the consolidated financial statements that clearly identify and distinguish between the interests of the parent’s owners and the interests of the noncontrolling owners of a subsidiary. SFAS 160 will become effective for fiscal years beginning after December 15, 2008. The Company is currently reviewing the impact of SFAS 160 on its financial position and results of operations.
u. Fair Value of Financial Instruments—The carrying amounts of cash and cash equivalents, receivables, accounts payable and accrued liabilities approximate fair value due to the short maturity of these instruments. The fair value of the Company’s two fixed rate term facilities with Prudential Insurance Company of America, using an estimate of interest rates currently available to the Company, was $10.8 million at December 31, 2007. The carrying value of these two term facilities was $10.7 million at December 31, 2007. Carrying amounts of the Company’s revolving credit facility, bonds and other installment notes payable approximate fair value because interest rates are primarily variable and, accordingly, approximate current market rates.
v. Allocation of Acquisition Purchase Price – Acquisition purchase price is allocated to identified intangible assets and tangible assets acquired and liabilities assumed based on their estimated fair values at the dates of acquisition, with any residual amounts allocated to goodwill. The purchase price allocations are considered preliminary until the Company is no longer waiting for information that it has arranged to obtain and that is known to be available or obtainable. Although the time required to obtain the necessary information will vary with circumstances specific to an individual acquisition, the “allocation period” for finalizing purchase price allocations generally does not exceed one year from the consummation of a business combination.
The Company often consummates acquisitions of multiple solid waste collection or disposal operations in a single transaction. For each separately identified solid waste collection or disposal operation acquired in a single acquisition, the Company performs an initial allocation of total purchase price to the acquired operation based on its relative fair value. Following this initial allocation of total purchase price to the acquired operation, the Company further allocates the identified intangible assets and tangible assets acquired and liabilities assumed for each solid waste collection or disposal operation based on its estimated fair value at the dates of acquisition, with any residual amounts allocated to either goodwill or landfill site costs, as discussed above.
F-16
WASTE INDUSTRIES USA. INC
NOTES TO CONSOLIDATED FINANCIAL STATEMENTS
From time to time, the Company consummates acquisitions in which it exchanges operations it owns for operations owned by another solid waste company. These exchange transactions require the Company to estimate the fair market value of either the operations it receives or the operations it disposes of, whichever is more clearly evident. To the extent that the fair market value of the operations it disposes of differs from the fair market value of the operations it obtains, cash is either remitted or received to offset the difference in fair market values. In 2005, the Company completed a simultaneous purchase and sale transaction in which the Company acquired operations of another solid waste company in Georgia and sold some of its operations in Georgia, resulting in a pre-tax gain of approximately $0.6 million. In 2006 and 2007, the Company did not execute any simultaneous purchase and sale transactions.
| 2. | BUSINESS ACQUISITIONS AND DISPOSITIONS |
Acquisitions
The Company’s growth strategy is to seek out accretive acquisitions of solid waste collection and disposal companies and customers in existing and adjacent markets to “tuck in” and integrate into already established branch facilities. In addition, the Company continues to pursue solid waste collection companies and customers in new markets and landfill opportunities in appropriate circumstances.
During 2006, the Company completed eight acquisitions for a total of $6.2 million, net of cash acquired, funded primarily with cash received from the sale of discontinued operations. Of the 2006 acquisitions, the Company completed three acquisitions in the Atlanta, Georgia market for approximately $3.2 million, four acquisitions in the North Carolina market for approximately $1.5 million and one acquisition in its South Carolina market.
During 2007, the Company completed nine acquisitions for a total of $24.2 million in cash. Of the 2007 acquisitions, four acquisitions totaling $15.3 million were made to increase the Company’s presence in the Atlanta, Georgia market. The Company made two acquisitions for approximately $4.4 million for hauling operations in its South Carolina market. The Company made three acquisitions for approximately $4.5 million for hauling operations in its North Carolina market.
The results of these operations have been included in the consolidated financial statements since the acquisition date and are consistent with the Company’s strategy to improve internalization of waste into existing landfills and expand its presence in certain markets.
In accordance with SFAS No. 141,Business Combinations, the purchase price of each acquisition has been allocated to the underlying assets and liabilities based on their respective fair values at the date of acquisition. Certain of these purchase price allocations pertaining to 2007 acquisitions are preliminary estimates, based on available information and certain assumptions that management believes are reasonable. Accordingly, these purchase price allocations are subject to finalization. In determining the purchase price allocation, the Company considered, among other factors, its intention to use the acquired assets, historical demand and estimates of future demand for its services.
F-17
WASTE INDUSTRIES USA. INC
NOTES TO CONSOLIDATED FINANCIAL STATEMENTS
As of December 31, 2007, the recorded purchase price allocation for these acquisitions was as follows (in thousands):
| | | | | | | | |
| | | 2006 | | | 2007 | |
Tangible assets (liabilities) acquired at fair value: | | | | | | | | |
Accounts receivable | | $ | 318 | | | $ | 1,137 | |
Property and equipment | | | 1,581 | | | | 8,709 | |
Deferred revenue and other liabilities | | | (469 | ) | | | (758 | ) |
| | | | | | | | |
Total net tangible assets acquired | | | 1,430 | | | | 9,088 | |
Intangible assets acquired at fair value: | | | | | | | | |
Customer lists | | | 919 | | | | 1,848 | |
Noncompete agreements and other | | | 42 | | | | 63 | |
Goodwill | | | 4,071 | | | | 14,209 | |
| | | | | | | | |
Total net assets, acquired at fair value | | | 6,462 | | | | 25,208 | |
| | | | | | | | |
Amount of purchase price withheld | | | (272 | ) | | | (1,037 | ) |
| | | | | | | | |
Cash paid for acquisitions | | $ | 6,190 | | | $ | 24,171 | |
| | | | | | | | |
Goodwill related to these acquisitions will be deductible for tax purposes.
The following unaudited pro forma results of operations assume the transactions described above occurred as of the beginning of the period presented (in thousands except per share data):
| | | | | | | | | |
| | | 2005 | | 2006 | | 2007 |
Total revenues | | $ | 325,532 | | $ | 344,457 | | $ | 346,685 |
Operating income | | | 31,545 | | | 42,214 | | | 48,691 |
| | | |
Income from continuing operations | | | 11,991 | | | 17,078 | | | 23,859 |
Income from discontinued operations | | | 639 | | | 2,292 | | | 153 |
| | | | | | | | | |
Net income | | $ | 12,630 | | $ | 19,370 | | $ | 24,012 |
| | | | | | | | | |
Earnings per common share: | | | | | | | | | |
Basic: | | | | | | | | | |
Income from continuing operations | | $ | 0.88 | | $ | 1.23 | | $ | 1.69 |
Income from discontinued operations | | | 0.04 | | | 0.17 | | | 0.01 |
| | | | | | | | | |
Net income | | $ | 0.92 | | $ | 1.40 | | $ | 1.70 |
| | | | | | | | | |
Diluted: | | | | | | | | | |
Income from continuing operations | | $ | 0.87 | | $ | 1.22 | | $ | 1.68 |
Income from discontinued operations | | | 0.04 | | | 0.16 | | | 0.01 |
| | | | | | | | | |
Net income | | $ | 0.91 | | $ | 1.38 | | $ | 1.69 |
| | | | | | | | | |
The pro forma financial information does not purport to be indicative of the results of operations that would have occurred had the transactions taken place at the beginning of the periods presented or of future operating results.
As of December 31, 2007, the Company had three acquisitions for which purchase price allocations were not yet finalized. The Company believes that the potential changes to the purchase price allocations would not have a material impact on its financial condition, results of operations, or cash flows.
F-18
WASTE INDUSTRIES USA. INC
NOTES TO CONSOLIDATED FINANCIAL STATEMENTS
Dispositions
In the second quarter of 2006, the Company sold a landfill operation in Jacksonville, Florida for approximately $16.2 million. In the second quarter of 2006, the Company disposed of certain hauling operations in the Atlanta, Georgia market for approximately $0.2 million. The operations were disposed of to allow the Company to purchase operations in its existing markets that are more consistent with its overall strategy to internalize waste, reduce administrative costs, and gain route efficiencies where available.
The Company did not dispose of any operations in 2007, although it did receive $270,000 in 2007 related to the settlement of a 2006 disposition.
In the year ended December 31, 2006, the net assets and liabilities disposed of were as follows (in thousands):
| | | | |
| | | 2006 | |
Disposed assets: | | | | |
Accounts receivable | | $ | 561 | |
Property and equipment | | | 8,653 | |
Inventories and other assets | | | 41 | |
Goodwill, net | | | 3,762 | |
| | | | |
Total net assets disposed of | | | 13,017 | |
| |
Disposed liabilities: | | | | |
Deferred revenue | | | (50 | ) |
Other liabilities | | | (523 | ) |
| | | | |
Total net assets and liabilities disposed of | | $ | 12,444 | |
| | | | |
Portions of these disposed operations were in operation during the years ended December 31, 2005 and 2006, and, consequently, the results of those operations less applicable income taxes were reported as a separate component of income from discontinued operations (in thousands):
| | | | | | |
| | | 2005 | | 2006 |
Revenues | | $ | 10,144 | | $ | 1,520 |
Operating expenses: | | | | | | |
Cost of operations | | | 7,787 | | | 1,277 |
Selling, general and administrative | | | 772 | | | 100 |
Depreciation and amortization | | | 813 | | | 127 |
| | | | | | |
Income before income taxes | | | 772 | | | 16 |
Income tax provision | | | 318 | | | 6 |
| | | | | | |
Income from discontinued operations prior to sale (net of income taxes) | | $ | 454 | | $ | 10 |
| | | | | | |
In conjunction with its 2005 dispositions, the Company recognized gains on disposal of the assets and operations totaling approximately $0.2 million, net of income taxes of $0.3 million. In conjunction with its 2006 dispositions, the Company recognized gains on disposal of the assets and operations totaling approximately $2.3 million, net of income taxes of $1.6 million. In the first quarter of 2007, the Company received additional consideration for a 2006 sale and recognized additional gain of approximately $0.2 million, net of taxes of approximately $0.1 million, in its income from discontinued operation. These gains are shown as a separate component of income from discontinued operations.
F-19
WASTE INDUSTRIES USA. INC
NOTES TO CONSOLIDATED FINANCIAL STATEMENTS
Property and equipment consisted of the following at December 31, 2006 and 2007 (in thousands):
| | | | | | | | |
| | | 2006 | | | 2007 | |
Land, land improvements and buildings | | $ | 44,613 | | | $ | 46,558 | |
Landfills and associated land | | | 129,928 | | | | 143,687 | |
Machinery and equipment | | | 15,838 | | | | 19,482 | |
Containers | | | 106,994 | | | | 116,220 | |
Collection vehicles | | | 111,520 | | | | 113,058 | |
Furniture, fixtures, and office equipment | | | 6,100 | | | | 4,270 | |
Construction in progress | | | 421 | | | | 526 | |
| | | | | | | | |
Total property and equipment | | | 415,414 | | | | 443,801 | |
Less accumulated depreciation | | | (197,375 | ) | | | (209,767 | ) |
| | | | | | | | |
Property and equipment, net | | $ | 218,039 | | | $ | 234,034 | |
| | | | | | | | |
Construction in progress includes equipment not placed in service at year-end. Landfills and associated land includes land held for development, representing various landfill properties under development with an aggregate cost of approximately $14.9 million and $25.7 million for the periods ended December 31, 2006 and 2007, respectively, which will not be amortized until placed in service.
Depreciation expense (including software amortization) for the years ended December 31, 2005, 2006 and 2007 was approximately $23.8 million, $22.9 million and $24.3 million, respectively. Depreciation expense includes depreciation on assets under capital leases. Landfill amortization expense was approximately $5.0 million, $7.0 million, and $5.1 million for the years ended December 31, 2005, 2006 and 2007, respectively. Included in depreciation and amortization expense for the year ended December 31, 2006 were favorable adjustments of approximately $0.9 million related to a change in estimated lives and salvage values of certain collection vehicles, and approximately $0.4 million in additional landfill amortization resulting from the Company’s periodic evaluation of asset retirement obligations.
The Company has included in other current assets approximately $0 and $0.9 million of assets held for sale as of December 31, 2006 and 2007, respectively. The assets held for sale are primarily collection vehicles and other property and equipment.
Intangible assets consist of goodwill, customer lists, transfer station permits and noncompete agreements acquired in business combinations. Intangible assets are presented net of accumulated amortization, if applicable.
F-20
WASTE INDUSTRIES USA. INC
NOTES TO CONSOLIDATED FINANCIAL STATEMENTS
The following table summarizes the activity related to goodwill as of December 31, 2006 and 2007 (in thousands):
| | | | | | | |
| | | 2006 | | | 2007 |
Beginning balance as of January 1, | | $ | 97,115 | | | $ | 97,562 |
Acquisitions | | | 4,071 | | | | 14,209 |
Adjustments to prior purchase price allocations | | | 138 | | | | — |
Dispositions | | | (3,762 | ) | | | — |
| | | | | | | |
Ending balance as of December 31, | | $ | 97,562 | | | $ | 111,771 |
| | | | | | | |
The Company performs an annual impairment test. At least quarterly, the Company also analyzes whether events have occurred that would more likely than not reduce its enterprise fair value below its carrying amount and, if necessary, performs a goodwill impairment test between annual dates. Impairment adjustments are recognized as an operating expense. The Company’s annual assessment date is July 31. The Company completed its annual impairment test as of July 31, 2007 and determined that there was no goodwill impairment.
Other intangible assets consisted of the following as of December 31, 2006 and 2007 (in thousands):
| | | | | | | | | |
| | | 2006 |
| | | Gross Carrying
Value | | Accumulated
Amortization | | Net Carrying
Value |
Customer relationships | | $ | 11,933 | | $ | 4,931 | | $ | 7,002 |
Noncompete agreements | | | 582 | | | 253 | | | 329 |
Transfer station permits | | | 78 | | | 21 | | | 57 |
| | | | | | | | | |
Total amortizable intangibles | | $ | 12,593 | | $ | 5,205 | | $ | 7,388 |
| | | | | | | | | |
Non-amortizable intangibles | | | — | | | — | | | — |
| | | | | | | | | |
Total other intangible assets | | $ | 12,593 | | $ | 5,205 | | $ | 7,388 |
| | | | | | | | | |
| |
| | | 2007 |
| | | Gross Carrying
Value | | Accumulated
Amortization | | Net Carrying
Value |
Customer relationships | | $ | 13,781 | | $ | 7,118 | | $ | 6,663 |
| Noncompete agreements | | | 614 | | | 369 | | | 245 |
| Transfer station permits | | | 109 | | | 36 | | | 73 |
| | | | | | | | | |
| Total amortizable intangibles | | $ | 14,504 | | $ | 7,523 | | $ | 6,981 |
| | | | | | | | | |
| Non-amortizable intangibles | | | 14 | | | — | | | 14 |
| | | | | | | | | |
| Total other intangible assets | | $ | 14,518 | | $ | 7,523 | | $ | 6,995 |
| | | | | | | | | |
Amortization expense for other intangible assets was $1.8 million, $2.3 million and $2.3 million for 2005, 2006 and 2007, respectively. The amortization period for customer lists and noncompete agreements is 5 to 10 years. The weighted average amortization period for customer lists and noncompete agreements is 7.6 years and 5.0 years, respectively.
F-21
WASTE INDUSTRIES USA. INC
NOTES TO CONSOLIDATED FINANCIAL STATEMENTS
Estimated future amortization expense associated with other intangible assets at December 31, 2007 is as follows (in thousands):
| | | |
Year | | Amortization Expense |
2008 | | $ | 2,056 |
2009 | | | 1,663 |
2010 | | | 1,238 |
2011 | | | 879 |
2012 | | | 456 |
Thereafter | | | 689 |
| | | |
Total | | $ | 6,981 |
| | | |
Long-term debt consisted of the following at December 31, 2006 and 2007 (in thousands):
| | | | | | | | |
| | | 2006 | | | 2007 | |
Credit Facilities: | | | | | | | | |
Term facilities | | $ | 17,857 | | | $ | 10,714 | |
Revolving credit facility | | | 99,000 | | | | 101,000 | |
Bonds | | | 40,355 | | | | 53,355 | |
| | | | | | | | |
Total long-term debt | | | 157,212 | | | | 165,069 | |
Less current maturities | | | (7,143 | ) | | | (7,143 | ) |
| | | | | | | | |
Long-term debt, net of current maturities | | $ | 150,069 | | | $ | 157,926 | |
| | | | | | | | |
Revolving Credit Facility
The Company and all of its subsidiaries are co-borrowers on a $200 million revolving credit agreement with a syndicate of lending institutions for which Bank of America, N.A. (“Bank of America”) acts as agent. On March 24, 2006, the Company completed the amendment and restatement of this credit facility to extend the maturity to October 2009 and to allow the Company to increase the facility up to $300 million at any time prior to the maturity date. In addition, the borrowing rates and some of the financial covenants were amended on March 24, 2006.
Virtually all of the assets of the Company and its subsidiaries, including the Company’s ownership interest in the equity securities of its subsidiaries, secure the Company’s obligations under the revolver. Pursuant to an intercreditor agreement with Bank of America, Prudential Insurance Company of America (“Prudential”) shares in the collateral pledged under the revolver. The amended revolver bears interest at a rate per annum equal to, at the Company’s option, either a Bank of America base rate or at the Eurodollar rate (based on Eurodollar interbank market rates) plus, in each case, a percentage rate that fluctuates, based on the ratio of the Company’s funded debt to EBITDA (income before income taxes plus interest expense, depreciation and amortization), from 0% to 1.0% for base rate borrowings and 1.25% to 2.5% for Eurodollar rate borrowings. The revolver, before and after amendment, requires the Company to maintain certain financial ratios and satisfy other predetermined requirements, such as minimum net worth, and limits on capital expenditures and indebtedness. The Company was in compliance with these financial covenants as of December 31, 2007. The revolver also requires the lenders’ approval of acquisitions in some circumstances.
The average interest rate on outstanding borrowings under the revolver was approximately 6.9% and 6.3% at December 31, 2006 and 2007, respectively. Availability was approximately $26.0 million under the revolver as of December 31, 2007 after consideration of outstanding letters of credit.
The Company utilizes cash flow hedge agreements to manage a portion of its risks related to fluctuations in interest rates for the revolving credit facility. In March 2004, the Company entered into interest rate swaps to hedge notional debt value of $40.0 million. These swaps were in effect for the period November 2004 through February 9, 2007 with fixed interest rates of 2.7%.
F-22
WASTE INDUSTRIES USA. INC
NOTES TO CONSOLIDATED FINANCIAL STATEMENTS
Term Facility
The Company has two $25.0 million term facilities with Prudential, of which $10.7 million in the aggregate was outstanding as of December 31, 2007. Principal repayments are due annually on each of the facilities. The Prudential facilities require the Company to maintain financial covenants, such as minimum net worth, and limit its capital expenditures and indebtedness. The Company was in compliance with these financial covenants as of December 31, 2007. Interest on the two Prudential facilities is paid quarterly, based on fixed rates for the two facilities of 7.21% and 7.09%, respectively. Prior to the final scheduled payment in April 2006, the Company had a third $25 million term facility at 7.53% with Prudential.
Bonds
The Company entered into a $9.5 million variable rate bond with Sampson County, North Carolina on September 10, 2003 for the funding of expansion at its landfill in that county. This bond expires in 2023 and is in addition to the Company’s pre-existing $30.9 million Sampson facility, which expires in 2020. Both facilities are backed by a letter of credit issued by Wachovia Bank N.A. as a participating lender under the revolver. The average interest rate on outstanding borrowings under both Sampson facilities was approximately 5.5% and 4.8% at December 31, 2006 and 2007, respectively.
The Company entered into a $13.0 million variable rate bond with Wake County, North Carolina on December 13, 2007 for the funding of the construction of a landfill located in Holly Springs, North Carolina. The Company was selected by Wake County, North Carolina to build and operate a landfill, owned by Wake County, under a 25 year contract. The landfill opened in February 2008. The bond expires in 2027. The interest rate on outstanding borrowings under the Wake County facility was 4.8% at December 31, 2007.
Annual aggregate principal maturities at December 31, 2007 were as follows (in thousands):
| | | |
2008 | | $ | 7,143 |
2009 | | | 104,571 |
2010 | | | — |
2011 | | | — |
2012 | | | — |
Thereafter | | | 53,355 |
| | | |
Total | | $ | 165,069 |
| | | |
Based on the borrowing rates currently available to the Company for bank loans with similar terms and average maturities, the fair value of long-term debt was $157.3 million and $165.2 million at December 31, 2006 and 2007, respectively.
The Company leases certain property and equipment under both capital and operating leases. Gross property and equipment recorded under capital leases was approximately $1.0 million and $0.5 million at December 31, 2006 and 2007, respectively. The related accumulated amortization was approximately $155,000 and $313,000 at December 31, 2006 and 2007, respectively. Depreciation expense of capital leases was $102,000 and $158,000 at December 31, 2006 and 2007, respectively.
F-23
WASTE INDUSTRIES USA. INC
NOTES TO CONSOLIDATED FINANCIAL STATEMENTS
Future minimum lease payments as of December 31, 2007 for capital and operating leases that have initial or remaining terms in excess of one year were as follows (in thousands):
| | | | | | | | | | |
| | | Capital
Leases | | | Operating
Leases | | Total |
2008 | | $ | 180 | | | $ | 1,918 | | $ | 2,098 |
2009 | | | 10 | | | | 1,155 | | | 1,165 |
2010 | | | 8 | | | | 420 | | | 428 |
2011 | | | 2 | | | | 245 | | | 247 |
2012 | | | — | | | | 224 | | | 224 |
Thereafter | | | — | | | | 2,058 | | | 2,058 |
| | | | | | | | | | |
Total minimum lease payments | | $ | 200 | | | $ | 6,020 | | $ | 6,220 |
| | | | | | | | | | |
Less amount representing interest | | | (20 | ) | | | | | | |
| | | | | | | | | | |
Less current portion | | | (165 | ) | | | | | | |
| | | | | | | | | | |
Long term capital lease obligation | | $ | 15 | | | | | | | |
| | | | | | | | | | |
The total rental expense for all operating leases and short-term rental agreements for the years ended December 31, 2005, 2006 and 2007 is as follows (in thousands):
| | | | | | | | | |
| | | 2005 | | 2006 | | 2007 |
Buildings and sites | | $ | 2,037 | | $ | 1,583 | | $ | 1,584 |
Trucks and equipment | | | 1,724 | | | 1,820 | | | 1,370 |
| | | | | | | | | |
Total | | $ | 3,761 | | $ | 3,403 | | $ | 2,954 |
| | | | | | | | | |
As of December 31, 2007, the Company owned or operated under life-of-site operating agreements nine landfills with total available disposal capacity of approximately 120.1 million cubic yards. Total available disposal capacity includes estimated permitted airspace plus an estimate of the expansion airspace that the Company believes has a probable likelihood of being permitted.
The Company has material financial commitments for final capping, closure and post-closure obligations with respect to its landfills. The Company developed its estimates of final capping, closure and post-closure obligations using input from its third party engineers and internal accounting staff. The Company’s estimates are based on its interpretation of current requirements and proposed regulatory changes and are intended to approximate fair value. Absent quoted market prices, the estimate of fair value should be based on the best available information, including the results of present value techniques in accordance with Statement of Financial Accounting Concepts, or SFAC, No. 7,Using Cash Flow and Present Value in Accounting Measurements. In general, the Company relies on third parties to fulfill most of its obligations for final capping, closure and post-closure. Accordingly, the fair market value of these obligations is based upon quoted and actual prices paid for similar work. The Company intends to perform some of these capping, closure and post-closure obligations using internal resources. Where internal resources are expected to be used to fulfill an asset retirement obligation, the Company has added a profit margin onto the estimated cost of such services to better reflect its fair market value as required by SFAS No. 143. When the Company then performs these services internally, the added profit margin is recognized as a component of operating income in the period earned. SFAC No. 7 further states that an estimate of fair value should include the price that marketplace participants are able to receive for bearing the uncertainties in cash flows. However, when utilizing discounted cash flow techniques, reliable estimates of market premiums may not be obtainable. In this situation, SFAC No. 7 indicates that it is not necessary to consider a market risk premium in the determination of expected cash flows. In the waste industry, there is not an active market that can be utilized to determine the fair value of these activities, as there is no market that exists for selling the responsibility for final capping, closure and post-closure obligations independent of selling the landfill in its entirety. Accordingly, the Company believes that it is not possible to develop a methodology to reliably estimate a market risk premium and has excluded a market risk premium from the Company’s determination of expected cash flows for landfill asset retirement obligations in accordance with SFAC No. 7.
F-24
WASTE INDUSTRIES USA. INC
NOTES TO CONSOLIDATED FINANCIAL STATEMENTS
Once the Company has determined the estimates of final capping, closure and post-closure obligations, the Company then inflates those costs to the expected time of payment and discounts those expected future costs back to present value. The Company is currently inflating these costs in current dollars until expected time of payment using an inflation rate of 2.6% and is discounting these costs to present value using a credit-adjusted, risk-free discount rate between 7.25% and 8.9%. The credit-adjusted, risk-free rate is based on the risk-free interest rate adjusted for the Company’s credit standing. Management reviews these estimates at least once a year. Significant changes in future final capping, closure and post-closure cost estimates and inflation rates typically result in both (1) a current adjustment to the recorded liability (and corresponding adjustment to the landfill asset), based on the landfill’s capacity that has been consumed, and (2) a change in liability and asset amounts to be recorded prospectively over the remaining capacity of the landfill. Any change related to the capitalized and future cost of the landfill asset is then recognized in amortization expense prospectively over the remaining capacity of the landfill. Changes in the Company’s credit-adjusted, risk-free rate do not change recorded liabilities, but subsequently recognized obligations are measured using the revised credit-adjusted risk-free rate.
The Company records the estimated fair value of final capping, closure and post-closure obligations for its landfills based on each landfill’s capacity that has been consumed through the current period. This liability and corresponding asset is accrued on a per-ton basis. Capping obligations generally involve the installation of flexible membrane and geosynthetic clay liners, drainage and compacted soil layers, and topsoil over portions of the landfill where total airspace has been consumed. The estimated fair value of each final capping event will be fully accrued when the tons associated with such capping event have been disposed in the landfill. Additionally, the estimated fair value of total final capping, closure and post-closure costs will be fully accrued for each landfill at the time the site discontinues accepting waste and is closed. Closure and post-closure accruals consider estimates for methane gas control, leachate management and ground-water monitoring and other operational and maintenance costs to be incurred after the site discontinues accepting waste, which is generally expected to be for a period of up to 30 years after final site closure. Daily maintenance activities, which include many of these costs, are incurred during the operating life of the landfill and are expensed as incurred. Daily maintenance activities include leachate disposal; surface water, groundwater, and methane gas monitoring and maintenance; other pollution control activities; mowing and fertilizing the landfill cap; fence and road maintenance; and third party inspection and reporting costs. For purchased disposal sites, the Company assesses and records present value-based final capping, closure and post-closure obligations at the time the Company assumes such responsibilities. Such liabilities are based on the estimated final capping, closure and post-closure costs and the percentage of airspace consumed related to such obligations as of the date the Company assumed the responsibility. Thereafter, the Company accounts for the landfill and related final capping, closure and post-closure obligations consistent with the policy described above.
Interest accretion on final capping, closure and post-closure obligations is recorded using the effective interest method and is recorded as final capping, closure and post-closure expense, which is included as a component of operating costs in the accompanying consolidated statements of operations.
In the United States, the closure and post-closure obligations are established by the Environmental Protection Agency’s Subtitles C and D regulations, as implemented and applied on a state-by-state basis. The costs to comply with these obligations could increase in the future as a result of legislation or regulation.
Assets and liabilities associated with final capping, closure and post-closure costs consisted of the following at December 31, 2006 and 2007 (in thousands):
| | | | | | | | |
| | | 2006 | | | 2007 | |
Landfill assets | | $ | 129,928 | | | $ | 143,687 | |
Accumulated landfill airspace amortization | | | (30,146 | ) | | | (35,198 | ) |
| | | | | | | | |
Net landfill assets | | $ | 99,782 | | | $ | 108,489 | |
| | | | | | | | |
F-25
WASTE INDUSTRIES USA. INC
NOTES TO CONSOLIDATED FINANCIAL STATEMENTS
| | | | | | |
| | | 2006 | | 2007 |
Final capping | | $ | 6,556 | | $ | 7,512 |
Closure/post-closure | | | 546 | | | 369 |
| | | | | | |
Total liabilities | | $ | 7,102 | | $ | 7,881 |
| | | | | | |
| | |
Current portion | | $ | 755 | | $ | 273 |
Long term | | | 6,347 | | | 7,608 |
| | | | | | |
Total liabilities | | $ | 7,102 | | $ | 7,881 |
| | | | | | |
The changes to landfill liabilities were as follows for the years ended December 31, 2006 and 2007 (in thousands):
| | | | | | | | |
| | | 2006 | | | 2007 | |
Beginning balance | | $ | 6,780 | | | $ | 7,102 | |
Obligations incurred | | | 983 | | | | 1,431 | |
Obligations settled | | | (1,491 | ) | | | (166 | ) |
Interest accretion | | | 824 | | | | 727 | |
Change in estimate | | | 529 | | | | (1,213 | ) |
Discontinued operations (see Note 2) | | | (523 | ) | | | — | |
| | | | | | | | |
Ending balance | | $ | 7,102 | | | $ | 7,881 | |
| | | | | | | | |
The 2007 change in estimate related to revised capping cost and tonnage estimates.
F-26
WASTE INDUSTRIES USA. INC
NOTES TO CONSOLIDATED FINANCIAL STATEMENTS
The balances of deferred income tax assets and liabilities at December 31, 2006 and 2007 were as follows (in thousands):
| | | | | | | | |
| | | 2006 | | | 2007 | |
Current deferred income tax assets (liabilities) relate to: | | | | | | | | |
Allowance for bad debts | | $ | 1,057 | | | $ | 784 | |
Accrued vacation | | | 441 | | | | 252 | |
Interest rate swap agreements | | | (32 | ) | | | — | |
Other swaps | | | — | | | | 438 | |
Other accruals not currently deductible | | | 739 | | | | — | |
Prepaid expenses | | | (418 | ) | | | (276 | ) |
State operating loss carryforwards | | | — | | | | 138 | |
| | | | | | | | |
Net current deferred income tax assets | | $ | 1,787 | | | $ | 1,336 | |
| | | | | | | | |
Noncurrent deferred income tax assets (liabilities) relate to: | | | | | | | | |
Basis and depreciation differences - fixed assets | | $ | (18,650 | ) | | $ | (15,704 | ) |
Basis and depreciation differences - intangibles | | | (5,271 | ) | | | (7,097 | ) |
State operating loss carryforwards | | | 278 | | | | — | |
Other accruals not currently deductible | | | — | | | | 1,253 | |
Deferred compensation and other | | | 130 | | | | 1,125 | |
Valuation allowance | | | — | | | | (35 | ) |
| | | | | | | | |
Net noncurrent deferred tax liabilities | | $ | (23,513 | ) | | $ | (20,458 | ) |
| | | | | | | | |
At December 31, 2007, the Company had unused state NOL carryforwards of approximately $3.5 million for which $0 will expire in 2008, $0 will expire in 2009, and $3.5 million will expire in 2010 and beyond. The Company has established a valuation allowance in the amount $35,000 for certain state NOL carryforwards that are expected to expire unrecognized.
The components of income tax expense for the years ended December 31, 2005, 2006 and 2007 were as follows (in thousands):
| | | | | | | | | |
| | | 2005 | | 2006 | | 2007 |
Income tax expense attributable to continuing operations: | | | | | | | | | |
Federal | | $ | 6,883 | | $ | 10,311 | | $ | 10,902 |
State | | | 410 | | | 1,724 | | | 1,436 |
| | | | | | | | | |
Total current income taxes | | | 7,293 | | | 12,035 | | | 12,338 |
Provision for deferred income taxes | | | 499 | | | 2,381 | | | 1,963 |
| | | | | | | | | |
Total | | $ | 7,792 | | $ | 14,416 | | $ | 14,301 |
| | | | | | | | | |
F-27
WASTE INDUSTRIES USA. INC
NOTES TO CONSOLIDATED FINANCIAL STATEMENTS
The following is a reconciliation of income taxes at the Federal statutory rate (35%) to actual income tax expense attributable to continuing operations recorded for each of the three years in the period ended December 31, 2007 (in thousands):
| | | | | | | | | | | |
| | | 2005 | | | 2006 | | 2007 | |
Federal tax at the statutory rate | | $ | 6,749 | | | $ | 10,992 | | $ | 13,246 | |
State income taxes, net of federal tax benefit | | | 537 | | | | 3,114 | | | 1,339 | |
Change in valuation allowance | | | — | | | | 1 | | | 35 | |
Other | | | 660 | | | | 106 | | | (461 | ) |
FIN 48 | | | — | | | | — | | | (203 | ) |
Other permanent items, net | | | (154 | ) | | | 203 | | | 345 | |
| | | | | | | | | | | |
Total | | $ | 7,792 | | | $ | 14,416 | | $ | 14,301 | |
| | | | | | | | | | | |
In 2005 and 2006, the Company increased its current state tax liability by approximately $0.3 million and $0.1 million, respectively, related to uncertain tax positions.
The Company adopted the provisions of FIN 48 –Accounting for Uncertainty in Income Taxes – an interpretation of FASB Statement No. 109,on January 1, 2007. As a result of the implementation of FIN 48, the Company performed a review of its portfolio of uncertain tax positions in accordance with recognition standards established by FIN 48. In this regard, an uncertain tax position represents the Company’s expected treatment of a tax position taken in a filed tax return, or planned to be taken in a future tax return, that has not been reflected in measuring income tax expense for financial reporting purposes. Under FIN 48, a company can recognize the benefit of an income tax position only if it is more likely than not (greater than 50%) that the tax position will be sustained upon tax examination, based solely on the technical merits of the tax position. Otherwise, no benefit can be recognized. The tax benefits recognized are measured based on the largest benefit that has a greater than 50% likelihood of being realized upon ultimate settlement. Additionally, companies are required to accrue interest and related penalties, if applicable, on all tax exposures for which reserves have been established consistent with jurisdictional tax laws.
Upon the adoption of FIN 48, the estimated value of the Company’s uncertain tax positions was a liability of $8.4 million resulting from unrecognized tax benefits. As a result of this review, the Company adjusted the estimated value of its uncertain tax positions by recognizing additional liabilities totaling $2.3 million through a non-cash charge to retained earnings. The liability for uncertain tax positions is reported as long-term as of December 31, 2007 in the Company’s consolidated balance sheets.
The following table summarizes the Company’s FIN 48 unrecognized tax benefits, excluding interest and penalties, for the year ended December 31, 2007 (in thousands):
| | | | |
| | | 2007 | |
Unrecognized tax benefits at January 1, 2007 | | $ | 8,357 | |
Gross increases - tax positions in prior years | | | 346 | |
Gross decreases - tax positions in prior years | | | (3,705 | ) |
Gross increases - tax positions in current year | | | 1,279 | |
Gross decreases - tax positions in current year | | | (42 | ) |
Settlements with taxing authorities | | | (336 | ) |
Lapse of statute of limitations | | | (460 | ) |
| | | | |
Unrecognized tax benefits at December 31, 2007 | | $ | 5,439 | |
| | | | |
In addition to these gross unrecognized tax benefits, the Company’s FIN 48 liability also includes approximately $0.6 million of net federal and other indirect benefits at December 31, 2007. Unrecognized tax benefits of approximately $2.3 million, net of federal tax benefits and related to interest and penalty accruals and permanent income tax differences, would favorably affect the Company’s effective tax rate if recognized.
The Company’s open tax years that are subject to examination are 2004 through 2007. Due to the potential for resolution and filing of administrative filings with the Internal Revenue Services and the expiration of various statutes of limitation, it is reasonably possible that the gross unrecognized tax benefit balance may change within the next twelve months by a decrease of $2.6 to $4.3 million.
The Company recognizes interest accrued related to unrecognized tax benefits and penalties as income tax expense. Related to the uncertain tax benefits noted above, at adoption the Company accrued penalties of $1.0 million and interest of $0.7 million
F-28
WASTE INDUSTRIES USA. INC
NOTES TO CONSOLIDATED FINANCIAL STATEMENTS
through its cumulative effect adjustment. During 2007, approximately $0.4 million of penalties were reversed through income tax expense in conjunction with the settlement of an uncertain tax position. During 2007, approximately $0.1 million of net interest was accrued through income tax expense. As of December 31, 2007, the Company has recognized a liability for penalties of $0.6 million and interest of $0.8 million in addition to the unrecognized tax benefits shown above.
During 2005, 2006 and 2007, the Company issued 5,649 shares, 3,698 shares and 7,914 shares, respectively, of Company common stock with a fair value of approximately $79,000, $78,000 and $240,000, respectively, as partial compensation paid to directors.
During 2005, 2006 and 2007, stock options totaling 253,277, 222,733 and 198,036 shares were exercised with net proceeds of approximately $2.0 million, $1.9 million, and $2.4 million, respectively. In connection with the exercise of the options in 2005, 2006 and 2007, the Company recorded an income tax benefit of approximately $0.4 million, $0.3 million and $0.3 million, respectively, as an increase to paid in capital.
In 2005, the Company’s Chairman, Lonnie C. Poole, Jr., purchased two life insurance policies which were previously assigned to the Company in connection with the settlement of prior loans. To purchase one of the policies, Mr. Poole transferred to the Company 17,617 shares of the Company’s common stock with an approximate value of $0.2 million and the Company subsequently cancelled such shares.
The Company paid dividends of $0.08 per share in June 2005, August 2005 and December 2005. The Company paid dividends of $0.09 per share in April 2006 and May 2006. The Company paid dividends of $0.10 per share in August 2006 and December 2006. The Company paid dividends of $0.12 per share in April 2007, June 2007 and August 2007. The Company paid a dividend of $0.15 per share in December 2007. Total cash dividends paid by the Company were approximately $3.3 million, $5.3 million, and $7.2 million for the years ended December 31, 2005, 2006, and 2007, respectively.
Under the Company’s amended revolving bank facility, the payment of cash dividends is limited to 50% of the trailing 12 months’ net income. Additionally, the Company must meet financial covenants contained in the facility, including covenants relating to minimum net worth and maximum levels of capital expenditures and indebtedness. If the Company is not in compliance with these covenants, or otherwise is in default under the facility, it would not be able to pay cash dividends.
| 10. | DERIVATIVE FINANCIAL INSTRUMENTS AND OTHER COMPREHENSIVE INCOME (LOSS) |
Interest Rate Swaps
The Company utilized cash flow hedge agreements to manage a portion of its risks related to fluctuations in interest rates. In March 2004, the Company entered into interest rate swaps to hedge notional debt values of $30.0 million and $10.0 million, respectively. These swaps were in effect for the period November 2004 through February 9, 2007 with fixed interest rates of 2.7%.
The Company measures effectiveness of the interest rate swaps by its ability to offset cash flows associated with changes in the variable LIBOR rate associated with the Company’s credit facility using the change in variable cash flow method. To the extent the interest rate swap is considered to be effective, changes in fair value are recorded, net of income tax, in shareholders’ equity as a component of accumulated other comprehensive income (loss). To the extent the instrument is considered ineffective, any changes in fair value relating to the ineffective portion are immediately recognized in the consolidated statements of operations as interest expense. The interest rate swaps were fully effective during the years ended December 31, 2005 and 2006 and until their expiration in February 2007.
The fair value of the Company’s interest rate swap agreements represents the estimated amount the Company would receive or pay to terminate the interest rate swap agreements taking into consideration the difference between the contract rate of interest and rates currently quoted for an agreement of similar term and maturity. The fair value of the interest rate swap agreements represented an asset of approximately $0.3 million at December 31, 2006 and had no value as of December 31, 2007, as they had expired in February 2007. In 2005, 2006, and 2007, the Company had no reclassification adjustments for net charges included in net income, because all changes in the fair value of the contracts were reflected as adjustments to other comprehensive income, net of taxes.
F-29
WASTE INDUSTRIES USA. INC
NOTES TO CONSOLIDATED FINANCIAL STATEMENTS
The Company recognized approximately $0.1 million, $0.9 million, and $0.3 million respectively, in reduced interest expense related to the interest rate swap agreements within its consolidated statements of income in 2005, 2006, and 2007, respectively.
Commodity Contracts
The Company enters into commodity contracts to hedge its cash received from the sale of old corrugated cardboard (“OCC”). The notional amounts hedged under these agreements represent approximately 52% of the Company’s expected volume for 2008. The fair value of the Company’s commodity contracts was obtained from a dealer quote. This value represents the estimated amount the Company would receive or pay to terminate the commodity contracts, taking into consideration the difference between the contract value of the OCC volume and values currently quoted for agreements of similar term and maturity. The fair value of the commodity agreements represented a liability of approximately $0.2 million and a liability of $1.4 million at December 31, 2006 and December 31, 2007, respectively. In 2006 and 2007, the OCC contracts were not designated as accounting hedges. The Company recognized $0.6 million and $1.2 million of loss as service revenue for changes in the fair value of the OCC contracts within its consolidated statements of operations for the years ended December 31, 2006 and 2007, respectively.
The Company has used heating oil option agreements to manage a portion of its exposure to fluctuations in diesel fuel oil prices. To date, such agreements have not been significant to the Company’s financial condition and results of operations. The fair value of the Company’s fuel commodity contract was obtained from a dealer quote. This value represents the estimated amount the Company would receive or pay to terminate the commodity contracts, taking into consideration the difference between the contract value of the fuel volume and values currently quoted for agreements of similar term and maturity. The fair value of the agreement represented an asset of approximately $2,000 and $85,000 at December 31, 2006 and 2007, respectively. The Company recognized $0.2 million, $0.3 million and $20,000 in income for changes in the fair value of the fuel contract within its consolidated statements of operations for the years ended December 31, 2005, 2006, and 2007 respectively.
| 11. | RELATED PARTY TRANSACTIONS |
Lonnie C. Poole, III, the Company’s Vice President, Corporate Development, is a member of a limited liability company that owns the building in Raleigh, North Carolina in which the Company leases its headquarters office space. The lease was entered into in June 1999 with a term of 10 years. Rental expense related to this lease was approximately $587,000, $675,000, and $723,000 for the years ended 2005, 2006 and 2007, respectively, and is included in selling, general and administrative expenses. Management believes that the lease is on terms comparable to those with unrelated third parties.
Prior to June 2005, the Company provided office space and administrative services to a company owned by Lonnie C. Poole, Jr., the Company’s founder and Chairman of the Board of Directors. The amount billed for such services was $2,000 for the year ended 2005. As of June 1, 2005, the Company no longer provided office space and administrative services to Mr. Poole’s company.
The Company leases aircraft from time to time from two companies, one owned by Lonnie C. Poole, Jr., the Company’s Chairman, and one owned in part by Lonnie C. Poole, III, the Company’s Vice President, Corporate Development. The amounts paid to these companies for rental of such aircraft for the years ended December 31, 2005, 2006 and 2007 were approximately $1,400, $5,300 and $900, respectively, to the company owned by Lonnie C. Poole, Jr., and $50,000, $16,000 and $43,000, respectively, to the company partly owned by Lonnie C. Poole, III. Management believes that the lease terms are comparable to those with unrelated third parties.
In September 2007, the Company purchased three pick-up trucks for approximately $16,000 from a limited liability company in which Mr. Lonnie C. Poole, III, the Company’s Vice President, Corporate Development, is a manager. The trucks will be added to the Company’s support service fleet. Management believes the transaction was executed on terms comparable to those with unrelated third parties.
Lonnie C. Poole, III, the Company’s Vice President, Corporate Development, Carole Poole, the wife of the Company’s Chairman, Lonnie C. Poole Jr., and Scott J. Poole, the son of Lonnie C. Poole, Jr., are members of a limited liability company that operates a fuel and convenience retail operation from which the Company from time to time has purchased fuel. The amount paid
F-30
WASTE INDUSTRIES USA. INC
NOTES TO CONSOLIDATED FINANCIAL STATEMENTS
to this company for fuel for the years ended December 31, 2005 and 2006 was approximately $600 and $0, respectively. Management believes the Company paid the same prices for the fuel as was paid to third parties. In 2006, the fuel and convenience retail operations were sold to various unrelated third parties.
In January 2005, the Company purchased approximately 3.8 acres of property adjacent to its Newport, North Carolina operation from Property Management Group Partnership (“PMG Partnership”) for approximately $140,000 for the purpose of expansion. PMG Partnership is comprised of three partners, two of whom are Lonnie C. Poole, Jr., Chairman of the Board of the Company, and Jim W. Perry, President and Chief Executive Officer of the Company. The Company obtained a third party appraisal prior to the purchase. Management believes that the transaction was executed on terms comparable to those with unrelated third parties.
In January 2005, the Company’s Chairman, Lonnie C. Poole, Jr., purchased from the Company two life insurance policies which he previously assigned to the Company in connection with the settlement of prior loans. To purchase one of the policies, Mr. Poole transferred to the Company 17,617 shares of the Company’s common stock with an approximate value of $219,500 and the Company subsequently cancelled such shares. The purchase of the other policy was settled in cash for $166,405. The aggregate consideration value of $385,905 was the cash value of the policies on September 30, 2004, the valuation date determined in accordance with the Board’s approval of the transaction. The Company recognized a loss of approximately $40,400 related to the sale of these policies.
In 1998, the Company was offered the opportunity to purchase two tracts of land that had potential as a regional solid waste disposal facility. The Company had been looking for a landfill site and this land was one of several sites the Company was considering. The owners of the land were unwilling to extend a purchase option for a period long enough to enable the Company to determine the feasibility of the site as a regional solid waste disposal facility and to obtain the necessary franchise from the county in which the landfill would be located and permits from the state in which the landfill would be located. The Company’s general practice is not to acquire property for which it does not have a plan for development in the short-term and for which it has not obtained, to the extent practicable, a site suitability determination and the necessary franchise and permits. Rather than forego this potential opportunity, management determined that it was in the Company’s best interest for an unrelated third party to purchase and hold the land until such time as the Company was able to develop a plan and obtain a site suitability determination and a franchise and permits for the landfill. After management was unable to identify a third party willing to undertake this endeavor in the very little time available, a limited liability company (“LLC”) owned by a trust controlled by Lonnie C. Poole, III, the Company’s Vice President, Corporate Development, and Scott J. Poole, sons of Lonnie C. Poole, Jr., the Company’s Chairman of the Board of Directors, purchased the land in December 1998. This LLC was purchased by Lonnie C. Poole, Jr. in 2005. As is customary for the Company when evaluating disposal sites, the Company incurred normal engineering, legal, marketing, consulting and other due diligence expenses to determine site feasibility, but the Company had no obligation to purchase the site. These costs of acquiring and carrying the site were borne entirely by the LLC. The Company incurred no costs in 2005 or 2006. In June 2006, the Company entered into a 25-year contract with Wake County to build and operate a regional landfill in Holly Springs, North Carolina that is scheduled to open in early 2008. As a result, the Company does not need another location for a landfill in the greater Raleigh, North Carolina area for the foreseeable future and informed the LLC that it is not interested in purchasing the property. The LLC sold the land in 2007 to an unrelated third party.
From 2000 through 2005, the Company sponsored a split dollar life insurance plan that was available to key employees, which plan is discussed in Note 12, Benefit Plans. Lonnie C. Poole, III, the Company’s Vice President, Corporate Development, and Harrell J. Auten, the Company’s Vice President, Sales and Marketing, participated in the plan. Under the plan, the Company paid all of the premiums on life insurance policies owned by Mr. Poole and Mr. Auten. Because each executive was taxed on a portion of each year’s premium, the executive was required to repay only the premium amount that was not taxed. Each executive officer collaterally assigned his policy to the Company to secure the repayment of this portion of the premium payments. The Company’s payment of the premiums on the split dollar life insurance policies could be viewed as loans to the executives. Beginning in July 2002, the Sarbanes-Oxley Act prohibits loans to directors and executive officers of the Company, but the premium payments on the policies owned by Mr. Poole and Mr. Auten were inadvertently continued by the Company after July 2002. Mr. Poole has been an executive officer of the Company since the arrangement began, and Mr. Auten has been an executive officer since 2005. Upon identification of the loan issue in December 2005, the Company discontinued the premium payments effective December 31, 2005 and requested repayment of the portion of the premiums due the Company. The Company also discontinued the split dollar life insurance plan effective December 31, 2005. At December 31, 2005, the sum of the premium payments owed by Mr. Poole to the Company was approximately $121,000 and the sum of the premium payments owed by Mr. Auten to the Company was approximately $52,000. In exchange for rights and benefits surrendered by the executives under the discontinued split dollar life insurance plan, the Company paid Mr. Poole approximately $130,000 and Mr. Auten approximately $44,000 in June 2006. As of June 30, 2006, Mr. Poole and Mr. Auten had repaid the Company all amounts due the Company for the life insurance policies. After receiving these payments, the Company released its collateral assignment rights under the policies to Mr. Poole and Mr. Auten.
F-31
WASTE INDUSTRIES USA. INC
NOTES TO CONSOLIDATED FINANCIAL STATEMENTS
401(k) Profit Sharing And Retirement Plan—The Company has a 401(k) Savings and Retirement Plan and Trust for the benefit of its full-time employees who have more than one year of service and are over 21 years of age. Employee contributions made under this 401(k) pre-tax contribution plan are matched by the Company with certain restrictions. The Company’s matching contributions to the 401(k) plan were approximately $0.9 million, $0.9 million, and $1.1 million for the years ended December 31, 2005, 2006 and 2007, respectively. Contributions by the Company are included in operating costs and expenses in the accompanying consolidated statements of operations.
Self-insured Medical and Dental Plan—The Company has a self-insured plan for employee medical and dental benefits. The plan covers all full-time employees of the Company beginning on the 91st day of employment. The Company pays a portion of the expenses for its employees and their dependents and withholds from employees’ wages additional amounts to offset a portion of the cost of these benefits. As claims are processed, the third-party plan administrator requests reimbursement funds from the Company. The Company maintains stop loss coverage for the plan at $150,000 per claim, per year. The Company’s total costs, net of employee contributions, relating to the plan (including premiums paid, claims paid, and fees) for the years ended December 31, 2005, 2006 and 2007 was approximately $5.5 million, $5.2 million and $4.9 million, respectively.
Deferred Compensation Plan –The Company has a deferred compensation plan available to key employees. For the period from 2000 to 2005, a participant could elect to defer up to $20,000 of annual cash compensation under the plan. Beginning in 2006, a participant may elect to defer up to 100% of annual cash compensation. The Company may increase the amount of the deferral credited under the plan by an amount that is based upon the deferral amount (the “matching amount”) and by an amount that is a percentage of compensation established by the Company (the “nonelective amount”). The combined Company match of 65% for compensation deferred into the deferred compensation plan and 401K plan may not exceed 6% of the participants’ compensation. The Company has not awarded a nonelective amount. Amounts deferred prior to 2006 are credited with a fixed rate of increase of 6% per year. Amounts deferred in 2006 and thereafter will be credited with a rate of increase at the same rate as the rate of earnings credited under a “rabbi trust” established by the Company. The amounts deferred by the participants are fully vested. The Company’s matching and nonelective amounts are vested at 20% after two years of service, with vesting of 20% each year thereafter. Payments will be made in an amount equal to the participant’s deferrals, matching amounts, and increases at a time elected by the participant in accordance with rules set by Section 409A of the Internal Revenue Code of 1986.
The Company recorded a deferred compensation liability of approximately $0.8 million and $1.4 million at December 31, 2006 and December 31, 2007, respectively.
Split Dollar Life Insurance Plan – From 2000 through 2005, the Company sponsored a split dollar life insurance plan available to key employees. The split dollar life insurance plan was discontinued effective December 31, 2005. Under the plan, the Company paid the premiums on the life insurance policies of the participating employees. The untaxed portions of the premium payments made by the Company were subject to repayment by the employees, which repayment was secured by a collateral assignment of the life insurance policies to the Company. No premiums were paid by the Company after 2005. At December 31, 2005, approximately $276,000 of untaxed advanced premiums relating to key employees were reflected on the Company’s consolidated balance sheets as current receivables. The $276,000 was repaid in 2006.
| 13. | COMMITMENTS AND CONTINGENCIES |
Certain claims and lawsuits arising in the ordinary course of business have been filed or are pending against the Company. In the opinion of management, all such matters have been adequately provided for, are adequately covered by insurance, or are of a nature that if disposed of unfavorably, would not have a material adverse effect on the Company’s financial position or results of operations.
In addition, the Company has identified the following matters which could have a material impact on the Company’s financial position or results of operations:
F-32
WASTE INDUSTRIES USA. INC
NOTES TO CONSOLIDATED FINANCIAL STATEMENTS
The City of Chesapeake, et al v. Camden County, et al, Superior Court of Camden County, Docket No. 05 CVS 95
Black Bear Disposal, LLC (“Black Bear”), one of the Company’s wholly owned subsidiaries, entered into a Franchise Agreement with Camden County, North Carolina, effective November 4, 2002. The Franchise Agreement gives Black Bear the exclusive right to build and operate a municipal solid waste landfill in the County, on a tract of approximately 1,000 acres. On November 3, 2005, the City of Chesapeake, Virginia, 13 individuals and a limited partnership alleging to own property in the vicinity of the proposed landfill, and the Camden Citizens Action League, Inc. filed suit in Camden County Superior Court against Camden County, the Board of Commissioners of Camden County, the five Camden County Commissioners and the County Manager in both their official and individual capacities, and Black Bear. In their complaint, the plaintiffs seek a number of judicial determinations, including a declaration that the Franchise Agreement and underlying Franchise Ordinance are void, that certain prerequisites to the approval of the Franchise Ordinance and execution of the Franchise Agreement were not met, and that certain prerequisites to Black Bear’s permit application to the North Carolina Department of Environment and Natural Resources (“DENR”) were not met. The defendants, including Black Bear, filed Motions to Dismiss, Answer, Affirmative Defenses and Counterclaims on January 19, 2007, moving to dismiss the plaintiffs’ complaint on the basis of the applicable statutes of limitation, the failure to join a necessary party, lack of subject matter and personal jurisdiction, sovereign and governmental immunity, lack of standing, and the failure to exhaust administrative remedies, denying many of the factual allegations of the plaintiffs’ complaint, and raising as affirmative defenses the applicable statutes of limitation, the terms of a November 22, 2004 Nondisclosure Agreement between the Company and the Southeastern Public Service Authority of Virginia (“SPSA”), in which SPSA, for itself and its members (Chesapeake is a member of SPSA), had agreed not to interfere with or oppose the Company’s plans for a landfill in Camden County, and the doctrines of estoppel, waiver, release, sovereign, governmental and legislative immunities, laches, and the failure to exhaust administrative remedies. The defendants’ counterclaims included claims that the plaintiffs had tortiously interfered with Black Bear’s Franchise Agreement, that Chesapeake had breached the Nondisclosure Agreement, and that Chesapeake had misused Black Bear’s confidential information in violation of the Nondisclosure Agreement and the North Carolina Trade Secrets Protection Act. In the counterclaims, the defendants, including Black Bear, sought the damages suffered as a result of plaintiffs’ tortious interference, and Chesapeake’s breach of the Nondisclosure Agreement and misuse of confidential information, including damages in excess of $3,000,000 per year for any delay in the opening of the proposed landfill. The plaintiffs filed Motions to Dismiss, Strike, Separate Claims, Answer, Affirmative Defenses and Motion to Amend Complaint in response to defendants’ counterclaims, arguing that the counterclaims should be dismissed or stricken, or, in the alternative, separated for trial, and that plaintiffs should be given leave to amend their complaint to add the Company as a party, given the Company’s agreement to be considered a co-permittee on the landfill, with Black Bear.
Black Bear’s and the County defendants’ Motion to Dismiss the plaintiffs’ claims came on for hearing on April 24, 2006, as did Chesapeake’s and the other plaintiffs’ Motions to Dismiss the defendants’ counterclaims. The Court denied Black Bear’s, the County defendants’ and Chesapeake’s Motions to Dismiss, while granting the remaining plaintiffs’ Motion to Dismiss Black Bear’s and the County defendants’ counterclaims. As a result, the plaintiffs’ challenges to the Franchise Ordinance and Franchise Agreement remain pending, as do Black Bear’s and the County defendants’ counterclaims against Chesapeake. Plaintiff’s Motions to Strike, Separate and Amend were not reached by the Court and remain pending.
The matter is now in discovery on the plaintiffs’ claims and the defendants’ counterclaims, including written discovery and the depositions of the various party and third-party witnesses. The defendants anticipate renewing the arguments underlying their Motion to Dismiss in a Motion for Summary Judgment at the close of discovery.
If the plaintiffs succeed in this matter, Black Bear would have to re-negotiate the Franchise Agreement or re-apply for a franchise with the County and/or re-submit and/or amend its request for a site suitability determination to DENR in order to develop the landfill. The Company intends to vigorously defend this matter and pursue these and any other potential counterclaims against the plaintiffs.
Pursuant to the Franchise Agreement, Black Bear has agreed to indemnify the County, its officers, employees and agents, which would include the County Commissioners, against all claims arising out of the Franchise Agreement. As a result, Black Bear is liable for the expenses of, and any damages or other awards ultimately determined against, those defendants.
The Franchise Agreement gave Black Bear until November 4, 2007 to open the landfill. Given the litigation brought by Chesapeake and passage of the moratorium (discussed below), the County on April 16, 2007 adopted an Ordinance authorizing a five-year extension on the November 4, 2007 date in return for consideration to the County totaling $450,000, which was paid through a transfer of property. In accordance with the Ordinance, the County, the Company and Black Bear entered into an Amended and Restated Franchise Agreement, effective April 16, 2007, pursuant to which they also agreed that the service area will be decreased to include only the states of North Carolina, Virginia, Maryland, New Jersey, New York, Connecticut and Massachusetts, and the estimated life of the landfill is 27 years (based on an assumed volume of waste of 10,000 tons a day). The Amended and Restated Franchise Agreement may need to be modified to address issues raised in the Chesapeake litigation.
F-33
WASTE INDUSTRIES USA. INC
NOTES TO CONSOLIDATED FINANCIAL STATEMENTS
In July 2006, the North Carolina legislature enacted a one-year moratorium on permits for new landfills. The moratorium ran from August 1, 2006 to August 1, 2007. The legislation that imposed the moratorium also required the Environmental Review Commission, with the assistance of the Division of Waste Management of the DENR, to study ways to reduce the amount of solid waste disposed of in North Carolina and measures concerning, among other things, financial responsibility requirements, franchise and local government requirements, and siting, design and operational requirements for solid waste landfills in the state.
As a result of those studies, on August 2, 2007, the North Carolina legislature approved legislation that regulates new landfills. The law prohibits a new landfill from being constructed within five miles of a national wildlife refuge, two miles of a state park or one mile of a state game land. The new legislation also requires any landfill to be set back at least 200 feet from streams, as opposed to the prior 50 foot requirement. The Black Bear landfill site is within approximately 3,500 feet of a national wildlife refuge. As part of the Company’s continuing analysis of the impact of the new legislation on the Black Bear project, the Company filed a legal challenge to the new legislation as applied to the Black Bear project (discussed below).
If, as a result of the legislation, the landfill cannot be constructed as planned, the Company would have to charge off that portion of the project’s book value that exceeded its fair value. Fair value would include any reimbursement that the Company expects to receive from the state, as discussed below. At December 31, 2007, the book value of the project was approximately $14.0 million, including approximately $9.1 million in land purchase costs. While such an impairment charge would not have a material adverse effect on the Company’s cash flows, it could have a material adverse impact on its earnings for the period in which the charge is taken. Due to the passage of the legislation, the Company performed an impairment test as required by SFAS No. 144 by comparing the probability-weighted cash flows from alternative courses of action to the carrying value of the Black Bear project and determined that no impairment was indicated.
The new legislation provides that companies that had pending landfill applications as of August 1, 2007 and whose landfills are impacted by the setback provisions in the new legislation can apply for a reimbursement of the reasonable costs of the preparation of the application incurred prior to August 2006, including site plans, engineering and construction plans, geologic and hydrologic investigations and closure and post-closure plans. The reimbursement funds would come from a tax imposed by the legislation of $2.00 per ton on all solid waste disposed of in North Carolina landfills, beginning on July 1, 2008. On December 18, 2007, the Company applied to DENR for the reimbursement of $13,612,554 in costs related to the Black Bear project pursuant to the terms of the legislation. By letter dated February 22, 2008, DENR contacted the Company seeking additional information and documentation for certain of the expenses for which reimbursement is sought, and the Company is working to provide the requested information and documentation. DENR has not yet provided an estimated timeframe for a decision on the Company’s requested reimbursement.
On December 3, 2007, the Company filed a Complaint against the State of North Carolina and DENR in the Superior Court of Wake County, North Carolina, challenging application of the legislation to the Black Bear project. The Company believes that applying the legislation to the Black Bear project violates the contract, interstate commerce, equal protection and due process clauses of the United States Constitution, the corresponding clauses of the North Carolina Constitution and the Company’s common law vested rights. The defendants filed an Answer to the Complaint on February 1, 2008, denying all of the Company’s claims. The Company served discovery requests on the defendants, to which the defendants have responded. On February 8, 2008, the defendants filed a Motion to Dismiss and Motion for Judgment on the Pleadings on the following grounds: lack of standing; the session laws at issue do not violate any provision of the North Carolina or United States Constitutions; the doctrines of waiver and estoppel; lack of arbitrary and capricious conduct; lack of interference with a vested right; and lack of entitlement to a writ of mandamus. The Company’s motion to dismiss the hearing (which had been scheduled for March 24, 2008) on the defendants’ motions to dismiss was granted and the defendants’ motions have been re-scheduled for hearing during the week of May 5, 2008. The Company will vigorously oppose the defendants’ motions to dismiss. If the motions are denied, the Company plans to proceed with depositions and additional discovery to support its claims in the case.
The Company is reviewing all other options and remedies available to it to either continue developing the Black Bear landfill or recover its investment in the project.
David Shaev Profit Sharing Account f/b/o Nora Vides on behalf of itself and all others similarly situated v. Waste Industries USA, Inc., Lonnie C. Poole, Jr., Jim W. Perry, Paul F. Hardiman, Glenn E. Futrell, and James A. Walker
On December 21, 2007, the Company received notice of a complaint filed against it and other defendants on December 19, 2007 in the Superior Court of Wake County, North Carolina. The plaintiff claims to have been a shareholder of the Company at all relevant times cited in the complaint. The lawsuit names as defendants the Company and its five directors, Lonnie C. Poole, Jr., Jim W. Perry, Paul F. Hardiman, Glenn E. Futrell and James A. Walker.
The lawsuit alleges that the Company’s directors breached their fiduciary duties to the Company’s shareholders by, among other things, engaging in improper, unfair dealing and wrongful and coercive conduct in approving the agreement and plan of merger, dated December 17, 2007, among the Company, Marlin HoldCo LP, a Delaware limited partnership (“HoldCo”), and its
wholly owned subsidiary, Marlin MergeCo Inc., a North Carolina corporation (“MergeCo”) that governs the proposed going private transaction discussed in Footnote 1. Pursuant to the terms of the merger agreement, MergeCo will merge with and into the Company, and, as a result, the Company will continue as the surviving corporation and a wholly owned subsidiary of HoldCo. HoldCo is owned by an investor group led by Lonnie C. Poole, Jr., the Company’s founder and Chairman, and Jim W. Perry, the Company’s President and Chief Executive Officer, and financial partners MIP Waste Holdings, L.P., an affiliate of Macquarie Infrastructure Partners, and GS Direct, LLC, an affiliate of Goldman, Sachs & Co.
F-34
WASTE INDUSTRIES USA. INC
NOTES TO CONSOLIDATED FINANCIAL STATEMENTS
The plaintiff seeks class action designation for the lawsuit, certifying the plaintiff as the class representative, enjoining the proposed merger, awarding plaintiff the costs and disbursements related to the lawsuit, including attorneys and financial expert fees, and such other relief as the Court deems just and proper.
Although no assurances can be made with respect to any litigation, the Company believes all of the allegations of wrongdoing in the complaint to be without merit and denies any wrongdoing. In addition, the Company has been advised that the other defendants named in the complaint believe all of the allegations of wrongdoing in the complaint to be without merit and deny any breach of duty to or other wrongdoing with respect to the plaintiff and any plaintiff class, should one be designated.
On January 31, 2008, the plaintiff filed a voluntary dismissal, without prejudice, of all claims asserted in the complaint. However, because a putative class action may not be dismissed without approval of the court, the voluntary dismissal filed by plaintiff on January 31, 2008 is moot. On February 12, 2008, the parties submitted a proposed stipulation and order of voluntary dismissal to the Court for consideration. On February 22, 2008, the Court sent a notice of hearing to advise that at 11:00 a.m. on March 11, 2008, it will hear the parties on the proposed stipulation and order of dismissal.
The parties attended a hearing in the North Carolina Business Court on March 11, 2008 to answer questions from the Judge relating to the joint stipulation of dismissal tendered by the parties to the court. The Judge asked the parties to submit some additional data to the court and counsel submitted that information on March 12, 2008. The parties are now awaiting a formal ruling from the court regarding whether it will approve dismissal of the putative shareholder action and, if so, on what terms.
Other
The Company has unconditional purchase obligations for 2007 of approximately $8.7 million primarily related to collection vehicles and landfill equipment.
At December 31, 2006 and 2007, the Company had irrevocable letters of credit totaling approximately $59.9 million and $56.3 million, respectively. According to the terms of the $200 million Bank of America facility, the availability of funds on that facility is reduced by the outstanding borrowings and letters of credit. At December 31, 2006 and 2007, no amounts were drawn under the outstanding letters of credit.
The Company is leasing a transfer station in Georgia for approximately $17,100 per month that it will be obligated to purchase at the end of the lease term (July 31, 2010) for an additional $1.5 million, provided that the lessor satisfies an environmental remediation contingency.
| 14. | STOCK-BASED COMPENSATION PLANS |
1997 Stock Option Plan
Prior to May 30, 2007, the Company had a stock option plan (the “1997 Stock Option Plan”) whereby a total of 1,800,000 shares of common stock were reserved for issuance. The 1997 Stock Option Plan provided for grants of “incentive stock options,” within the meaning of Section 422 of the Internal Revenue Code of 1986, as amended (the “Code”), to employees (including officers and employee directors), and the 1997 Stock Option Plan also provided for grants of non-statutory stock options to employees, non-employee directors and consultants. The 1997 Stock Option Plan also allowed for the grant of stock purchase rights. The 1997 Stock Option Plan was administered by the Compensation Committee of the Board of Directors. Stock options granted under the 1997 Stock Option Plan generally had a term of five years from the date of grant and vested over periods determined at the date of grant, typically straight-line over four years. The exercise prices of the options were determined by the Company’s Board of Directors and were at least 100% of the fair market value of the Company’s common stock on the date of grant. The 1997 Stock Option Plan terminated in April 2007 in accordance with its terms.
F-35
WASTE INDUSTRIES USA. INC
NOTES TO CONSOLIDATED FINANCIAL STATEMENTS
2007 Long Term Incentive Plan
On March 20, 2007, the Company’s Board of Directors adopted the Waste Industries USA, Inc. 2007 Long Term Incentive Plan (the “2007 Plan”) which was approved by the Company’s shareholders on May 30, 2007. The 2007 Plan replaces the 1997 Stock Option Plan. All outstanding awards under the 1997 Stock Option Plan, however, will remain in effect, subject to their respective termination dates. The 2007 Plan reserves 1,300,000 shares of common stock for issuance. The 2007 Plan is administered by the Compensation Committee of the Company’s Board of Directors or such other committee as the Company’s Board of Directors may designate in the future.
The 2007 Plan provides for the grant of the following types of awards, which may be granted either alone or in tandem with, or in addition to, any other award permitted to be granted under the 2007 Plan:
| | • | | Options intended to qualify as incentive stock options under Section 422 of the Code: |
| | • | | Nonqualified stock options; |
| | • | | Stock appreciation rights; |
| | • | | Deferred stock awards; and |
Stock Options
SFAS No. 123R
Prior to January 1, 2006, the Company accounted for options issued under the 1997 Stock Option Plan under the recognition and measurement provision of APB Opinion No. 25,Accounting for Stock Issued to Employees, and related interpretations, as permitted by SFAS. 123,Accounting for Stock-Based Compensation. The Company did not generally recognize stock option expense in its condensed consolidated statements of operations.
As a result of the adoption of SFAS No. 123R,Accounting for Stock-Based Compensation (as revised in 2004), on January 1, 2006, the Company’s results for the year ended December 31, 2007 include stock-based compensation expense relating to stock options and deferred stock awards of approximately $0.6 million. The Company’s results for the year ended December 31, 2006 include stock-based compensation expense relating to stock options of approximately $0.5 million. These amounts are included within selling, general, and administrative expenses on the condensed consolidated statements of operations. Options are primarily incentive stock options and typically vest over a period of four years with a five-year contractual life. Dividends are not paid on unexercised options.
As of December 31, 2007, there existed approximately $0.7 million of unrecognized compensation costs related to stock options, which are expected to be recognized over a weighted average period of 2.0 years.
As of December 31, 2007, no stock options had been granted under the 2007 Plan.
F-36
WASTE INDUSTRIES USA. INC
NOTES TO CONSOLIDATED FINANCIAL STATEMENTS
A summary of the status of options granted under the 1997 Stock Option Plan as of December 31, 2005, 2006 and 2007 and changes during the years ending on those dates is as follows:
| | | | | | | | | | | |
| | | Shares | | | Weighted Average
Exercise
Price | | Weighted
Average
Remaining
Contractual
Life(in years) | | Aggregate
Intrinsic Value
(in thousands) |
Outstanding as of January 1, 2005 | | 728,625 | | | $ | 0.09 | | | | | |
Granted | | 136,380 | | | | 14.19 | | | | | |
Forfeitures | | (27,330 | ) | | | 9.22 | | | | | |
Exercised | | (253,277 | ) | | | 8.01 | | | | | |
| | | | | | | | | | | |
Outstanding as of December 31 2005 | | 584,398 | | | | 10.74 | | | | | |
Granted | | 90,468 | | | | 21.82 | | | | | |
Forfeitures | | (26,939 | ) | | | 11.65 | | | | | |
Expired | | (6,285 | ) | | | 10.22 | | | | | |
Exercised | | (222,733 | ) | | | 8.55 | | | | | |
| | | | | | | | | | | |
Outstanding as of December 31, 2006 | | 418,909 | | | | 14.24 | | | | | |
Granted | | 35,462 | | | | 27.98 | | | | | |
Forfeitures | | (5,315 | ) | | | 10.09 | | | | | |
Expired | | (50,000 | ) | | | 17.88 | | | | | |
Exercised | | (198,036 | ) | | | 12.06 | | | | | |
| | | | | | | | | | | |
Outstanding as of December 31, 2007 | | 201,020 | | | $ | 18.01 | | 2.70 | | $ | 3,677 |
| | | | | | | | | | | |
Vested and unvested expected to vest as of December 31, 2007 | | 195,525 | | | $ | 18.08 | | 2.71 | | $ | 3,562 |
| | | | | | | | | | | |
Exerciseable as of December 31, 2007 | | 57,735 | | | $ | 13.93 | | 2.04 | | $ | 1,291 |
| | | | | | | | | | | |
The total intrinsic value of options exercised during the years ended December 31, 2005, 2006 and 2007 was approximately $1.5 million, $2.6 million and $3.3 million, respectively.
F-37
WASTE INDUSTRIES USA. INC
NOTES TO CONSOLIDATED FINANCIAL STATEMENTS
The following table summarizes certain information about stock options outstanding under the 1997 Stock Option Plan and exercisable at December 31, 2007:
| | | | | | | | | | |
| | | Options Outstanding |
Range of Exercise Prices | | Number of
Options
Outstanding | | Weighted
Average
Life (1) | | Weighted
Average
Exercise
Price | | Aggregate
Intrinsic
Value |
$6.30-$10.72 | | 39,441 | | 0.2 | | $ | 10.22 | | $ | 1,029 |
$11.79-$17.88 | | 65,669 | | 0.7 | | | 13.95 | | | 1,468 |
$21.02-$30.16 | | 95,910 | | 1.7 | | | 27.74 | | | 1,180 |
| | | | | | | | | | |
| | 201,020 | | 2.7 | | | 18.01 | | $ | 3,677 |
| | | | | | | | | | |
| |
| | | Options Exercisable |
Range of Exercise Prices | | Number of
Options
Outstanding | | Weighted
Average
Life (1) | | Weighted
Average
Exercise
Price | | Aggregate
Intrinsic
Value |
$6.30-$10.72 | | 26,536 | | 1.6 | | $ | 13.17 | | $ | 698 |
$11.79-$16.78 | | 19,422 | | 4.6 | | | 13.88 | | | 435 |
$17.88-$23.12 | | 11,777 | | 3.5 | | | 22.93 | | | 158 |
| | | | | | | | | | |
| | 57,735 | | 2.0 | | | 13.93 | | $ | 1,291 |
| | | | | | | | | | |
(1) In years | | | | | | | | | | |
Cash received from option exercises for the years ended December 31, 2005, 2006 and 2007 was approximately $2.0 million, $1.9 million and $2.4 million, respectively, and is shown as financing cash inflows in the Company’s consolidated statements of cash flows.
Deferred Stock Awards
As of December 31, 2007, only deferred stock awards had been granted under the 2007 Plan. Deferred stock awards issued under the Company’s 2007 Plan require the Company to deliver shares of Company stock as directed by a vesting schedule, typically one-third after three years from the grant date, one-third after year four, and the remaining one-third after year five. Dividends do not accrue on the nonvested shares and settlement in cash is not currently allowed.
A summary of the Company’s nonvested shares issued under the 2007 Plan as of December 31, 2007, and changes during the year ended December 31, 2007 is as follows:
| | | | | | |
Nonvested Shares | | Shares | | | Weighted
Average
Grant-Date
Fair Value |
Nonvested as of January, 2007 | | — | | | $ | — |
Granted | | 34,599 | | | | 31.78 |
Vested | | — | | | | — |
Forfeited | | (2,113 | ) | | | 31.78 |
| | | | | | |
Nonvested as of December 31, 2007 | | 32,486 | | | $ | 31.78 |
| | | | | | |
F-38
WASTE INDUSTRIES USA. INC
NOTES TO CONSOLIDATED FINANCIAL STATEMENTS
As of December 31, 2007, there was approximately $0.9 million of total unrecognized compensation cost related to nonvested share-based compensation arrangements granted under the 2007 Plan. That cost is expected to be recognized over a weighted-average period of 4.9 years. No deferred stock awards were vested at December 31, 2007.
As of December 31, 2007, the Company had approximately 1.6 million options available for future issuance under the 2007 Plan, including the shares issuable under outstanding options granted pursuant to the 1997 Stock Option Plan.
Stock
The Company pays a portion of its directors’ fees with stock. Directors’ fees settled with stock are expensed as the service is performed. The number of shares available for settlement is based upon the closing price of the stock on the date of payment and the cash price of the services. For the years ended December 31, 2005, 2006 and 2007, the Company recognized approximately $79,000, $78,000 and $240,000, respectively, for the portion of directors’ fees settled in stock.
Beginning in 2006, the Company purchased marketable securities and placed them in a “rabbi trust” for its deferred compensation plan (see Note 12). The marketable securities are classified as trading securities and their fair value is included in “Other noncurrent assets” in the Company’s consolidated balance sheet at December 31, 2007. Changes in the fair value of the assets are recorded as investment income or loss. Cash flows from purchases, sales and maturities of trading securities are reported within cash flows from operating activities. The Company recognized approximately $58,000 and $112,000 in unrealized gains within its consolidated statement of operations for 2006 and 2007, respectively, for changes in fair value of these securities.
In February 2008, the Company acquired a hauling company in Tennessee for approximately $4.0 million in cash to expand its presence in the Nashville, Tennessee market. The Company is in the process of allocating the purchase price to the assets acquired.
F-39
WASTE INDUSTRIES USA. INC
NOTES TO CONSOLIDATED FINANCIAL STATEMENTS
| 17. | QUARTERLY FINANCIAL INFORMATION (UNAUDITED) |
The following table summarizes the unaudited consolidated quarterly results of operations for 2006:
| | | | | | | | | | | | |
| | | FIRST
QUARTER | | SECOND
QUARTER | | THIRD
QUARTER | | FOURTH
QUARTER |
| | | (In thousands, except share and per share data) |
Total revenues: | | $ | 79,146 | | $ | 82,599 | | $ | 84,681 | | $ | 81,119 |
| | | | |
Gross profit: | | $ | 27,418 | | $ | 28,127 | | $ | 29,161 | | $ | 31,124 |
| | | | |
Income from continuing operations: | | $ | 3,361 | | $ | 4,512 | | $ | 3,887 | | $ | 5,229 |
| | | | |
Earnings from continuing operations per share: | | | | | | | | | | | | |
Basic: | | $ | 0.24 | | $ | 0.33 | | $ | 0.28 | | $ | 0.37 |
Diluted: | | $ | 0.24 | | $ | 0.32 | | $ | 0.28 | | $ | 0.37 |
| | | | |
Net income: | | $ | 3,390 | | $ | 6,762 | | $ | 3,753 | | $ | 5,376 |
| | | | |
Earnings per share: | | | | | | | | | | | | |
Basic: | | $ | 0.25 | | $ | 0.49 | | $ | 0.27 | | $ | 0.39 |
Diluted: | | $ | 0.24 | | $ | 0.48 | | $ | 0.27 | | $ | 0.38 |
| | | | |
Weighted average number of shares outstanding: | | | | | | | | | | | | |
Basic | | | 13,761 | | | 13,857 | | | 13,910 | | | 13,951 |
Diluted | | | 13,911 | | | 14,029 | | | 14,072 | | | 14,145 |
F-40
WASTE INDUSTRIES USA. INC
NOTES TO CONSOLIDATED FINANCIAL STATEMENTS
The following table summarizes the unaudited consolidated quarterly results of operations in 2007:
| | | | | | | | | | | | |
| | | FIRST
QUARTER | | SECOND
QUARTER | | THIRD
QUARTER | | FOURTH
QUARTER |
| | | (In thousands, except share and per share data) |
Total revenues: | | $ | 81,286 | | $ | 86,138 | | $ | 88,586 | | $ | 84,658 |
| | | | |
Gross profit: | | $ | 31,354 | | $ | 31,624 | | $ | 31,625 | | $ | 30,430 |
| | | | |
Income from continuing operations: | | $ | 5,434 | | $ | 6,080 | | $ | 6,914 | | $ | 5,100 |
| | | | |
Earnings from continuing operations per share: | | | | | | | | | | | | |
Basic: | | $ | 0.39 | | $ | 0.43 | | $ | 0.49 | | $ | 0.36 |
Diluted: | | $ | 0.38 | | $ | 0.43 | | $ | 0.49 | | $ | 0.36 |
| | | | |
Net income: | | $ | 5,581 | | $ | 6,080 | | $ | 6,914 | | $ | 5,106 |
| | | | |
Earnings per share: | | | | | | | | | | | | |
Basic: | | $ | 0.40 | | $ | 0.43 | | $ | 0.49 | | $ | 0.36 |
Diluted: | | $ | 0.40 | | $ | 0.43 | | $ | 0.49 | | $ | 0.36 |
| | | | |
Weighted average number of shares outstanding: | | | | | | | | | | | | |
Basic | | | 13,999 | | | 14,073 | | | 14,121 | | | 14,158 |
Diluted | | | 14,123 | | | 14,182 | | | 14,216 | | | 14,244 |
F-41
SCHEDULE II – VALUATION AND QUALIFYING ACCOUNTS
(In Thousands)
| | | | | | | | | | | | | |
| | | Balance
12/31/2004 | | Charges to
Expense | | Write-offs/
Payments | | | Balance
12/31/2005 |
Allowance for doubtful accounts | | $ | 2,259 | | $ | 2,091 | | $ | (1,579 | ) | | $ | 2,771 |
Reserve for note receivable from customer | | | 960 | | | — | | | — | | | | 960 |
Reserve for self-insurance | | | 3,406 | | | 11,482 | | | (10,227 | ) | | | 4,661 |
| | | | |
| | | Balance
12/31/2005 | | Charges to
Expense | | Write-offs/
Payments | | | Balance
12/31/2006 |
Allowance for doubtful accounts | | $ | 2,771 | | $ | 1,557 | | $ | (2,147 | ) | | $ | 2,181 |
Reserve for note receivable from customer | | | 960 | | | — | | | — | | | | 960 |
Reserve for self-insurance | | | 4,661 | | | 12,052 | | | (11,223 | ) | | | 5,490 |
| | | | |
| | | Balance
12/31/2006 | | Charges to
Expense | | Write-offs/
Payments | | | Balance
12/31/2007 |
Allowance for doubtful accounts | | $ | 2,181 | | $ | 2,022 | | $ | (2,707 | ) | | $ | 1,496 |
Reserve for note receivable from customer | | | 960 | | | — | | | — | | | | 960 |
Reserve for self-insurance | | | 5,490 | | | 10,956 | | | (9,983 | ) | | | 6,463 |
S-1