PROJECT WOLFPACK
Discussion Materials
November 14, 2006
![]()
Banc of America Securities LLC Disclaimer
These materials have been prepared by Banc of America Securities LLC (“BAS”) for the BAS client or potential client to whom such materials are directly addressed and delivered (the “Company”) in connection with an actual or potential mandate or engagement and may not be used or relied upon for any purpose other than as specifically contemplated by a written agreement with BAS. These materials are based on information provided by or on behalf of the Company and/or other potential transaction participants, from public sources or otherwise reviewed by BAS. BAS assumes no responsibility for independent investigation or verification of such information and has relied on such information being complete and accurate in all material respects. To the extent such information includes estimates and forecasts of future financial performance prepared by or reviewed with the managements of the Company and/or other potential transaction participants or obtained from public sources, BAS has assumed that such estimates and forecasts have been reasonably prepared on bases reflecting the best currently available estimates and judgments of such managements (or, with respect to estimates and forecasts obtained from public sources, represent reasonable estimates). No representation or warranty, express or implied, is made as to the accuracy or completeness of such information and nothing contained herein is, or shall be relied upon as, a representation, whether as to the past, the present or the future. These materials were designed for use by specific persons familiar with the business and affairs of the Company and are being furnished and should be considered only in connection with other information, oral or written, being provided by BAS in connection herewith. These materials are not intended to provide the sole basis for evaluating, and should not be considered a recommendation with respect to, any transaction or other matter. These materials do not constitute an offer or solicitation to sell or purchase any securities and are not a commitment by BAS (or any affiliate) to provide or arrange any financing for any transaction or to purchase any security in connection therewith. BAS assumes no obligation to update or otherwise revise these materials. These materials have not been prepared with a view toward public disclosure under state or federal securities laws or otherwise, are intended for the benefit and use the Company, and may not be reproduced, disseminated, quoted or referred to, in whole or in part, without the prior written consent of BAS. These materials may not reflect information known to other professionals in other business areas of BAS and its affiliates.
BAS has adopted policies and guidelines designed to preserve the independence of its research analysts. BAS’ policies prohibit employees from offering research coverage, a favorable research rating or a specific price target or offering to change a research rating or price target as consideration for or an inducement to obtain business or other compensation.
BAS and its affiliates comprise a full service securities firm and commercial bank engaged in securities trading and brokerage activities as well as providing investment banking, asset and investment management, financing and financial advisory services and other commercial and investment banking services and products to a wide range of corporations and individuals, domestically and offshore, from which conflicting interests or duties may arise. In the ordinary course of these activities, BAS or its affiliates may at any time hold long or short positions, and may trade or otherwise effect transactions, for their own account or the accounts of customers, in debt or equity securities or loans of the Company, potential counterparties, or any other company that may be involved in a transaction. Products and services that may be referenced in the accompanying materials may be provided through affiliates of BAS. BAS is a subsidiary of Bank of America Corporation, the parent company of Bank of America, N.A. and other banks. BAS is a broker-dealer registered with the Securities and Exchange Commission and is a member of the New York Stock Exchange, Inc., the National Association of Securities Dealers, Inc. and the Securities Investor Protection Corporation.
BAS is required to obtain, verify and record certain information that identifies the Company, which information includes the name and address of the Company and other information that will allow BAS to identify the Company in accordance with the USA Patriot Act (Title III of Pub. L. 107-56 (signed into law October 26, 2001)) and such other laws, rules and regulations.
BAS and its affiliates do not provide tax advice. Accordingly, any statements contained herein as to tax matters were neither written nor intended by BAS or its affiliates to be used and cannot be used by any taxpayer for the purpose of avoiding tax penalties that may be imposed on such taxpayer. If any person uses or refers to any such tax statement in promoting, marketing or recommending a partnership or other entity, investment plan or arrangement to any taxpayer, then the statement expressed herein is being delivered to support the promotion or marketing of the transaction or matter addressed and the recipient should seek advice based on its particular circumstances from an independent tax advisor. Notwithstanding anything that may appear herein or in other materials to the contrary, the Company shall be permitted to disclose the tax treatment and tax structure of a transaction (including any materials, opinions or analyses relating to such tax treatment or tax structure, but without disclosure of identifying information or, except to the extent relating to such tax structure or tax treatment, any nonpublic commercial or financial information) on and after the earliest to occur of the date of (i) public announcement of discussions relating to such transaction, (ii) public announcement of such transaction or (iii) execution of a definitive agreement (with or without conditions) to enter into such transaction; provided, however, that if such transaction is not consummated for any reason, the provisions of this sentence shall cease to apply.
| 2 | |
Table of Contents
| I. | Introduction | 4 | ||||||
| II. | Situation Overview | 7 | ||||||
| III. | Analysis of Strategic Alternatives | 21 | ||||||
| A. | Execute Strategic Plan and Return Capital to Shareholders | 22 | ||||||
| 1. | Increase Regular Dividend | 23 | ||||||
| 2. | Share Repurchase | 26 | ||||||
| 3. | Special Dividend | 29 | ||||||
| B. | Follow-On Offering | 32 | ||||||
| C. | Potential Sale | 38 | ||||||
| Appendices | ||||||||
| A. | Summary Ownership and Trading Information | 48 | ||||||
| B. | Summary Pro Forma Financials | 52 | ||||||
| C. | Detailed Comparable Company Analysis | 57 | ||||||
| 3 | |
I. Introduction
| 4 | |
Introduction
| Introduction | • Bank of America is pleased to have the opportunity to provide an update to the Board of Directors of WOLFPACK regarding strategic alternatives | |
| Improved Company Performance | • Since we originally provided our thoughts to the Board two years ago, the Company’s performance has improved significantly | |
• Management has executed on its strategic plan | ||
• Rationalized underperforming and / or non-core assets | ||
• Strengthened core operations | ||
• Focused on organic growth program | ||
• Continued to source, complete and integrate acquisitions | ||
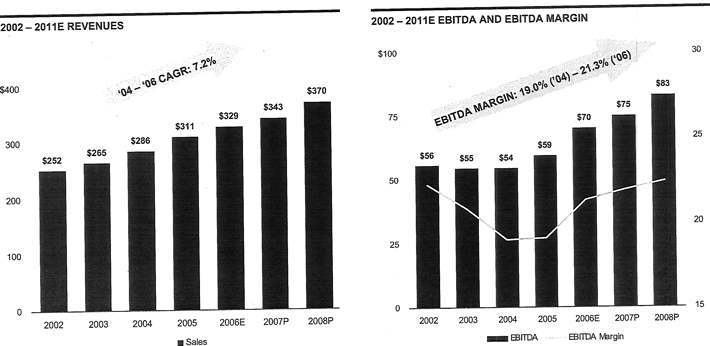
• The result has been strong revenue growth (CAGR of 7.2% from 2004 - 2006E) and significant margin improvement (2006E EBITDA margin of 21.3% versus 2004 EBITDA Margin of 19.0%) | ||
• Company performance has been recognized by the marketplace and has resulted in significant share price appreciation - more than 160% for WOLFPACK compared to approximately 28% for the Russell 2000 over the past two years | ||
| Favorable Industry Dynamics | • At the same time, the Company has benefited from favorable industry trends | |
• Increased focus on pricing discipline and return metrics across the industry | ||
• Companies are posting strong results, driving share price appreciation across the industry | ||
• The overall sector has seen EBITDA multiple expansion | ||
• Substantial public and private equity investor interest |
| 5 | |
Introduction (cont.)
Positive Market Conditions | • Broad market conditions are highly favorable | |
• Equity markets are strong and liquid | ||
• M&A activity at historically high levels | ||
• Significant capital available for investment from both corporate acquirors and financial sponsors | ||
• Highly favorable debt markets | ||
Strategic Alternatives | • Now is an appropriate time to review strategic alternatives to ensure WOLFPACK is maximizing shareholder value and optimizing the objectives of its stakeholders | |
• BAS has evaluated the following strategic alternatives available to WOLFPACK: | ||
• Continue to execute its strategic plan and opportunistically return capital to shareholders | ||
• Regular dividend increase | ||
• Share repurchase | ||
• Special dividend | ||
• Execute a follow on equity offering | ||
• Proceeds from any primary shares issued to be used for debt paydown or growth initiatives | ||
• Secondary share selling would increase float and provide insiders some liquidity | ||
• Pursue a sale transaction with either a strategic partner or a financial sponsor |
| 6 | |
II. Situation Overview
| 7 | |
Strong Projected Financial Performance
| • | WOLFPACK’s execution on its strategic plan has positioned the Company for future growth |
| • | Continued profitable organic growth |
| • | The financial flexibility to make strategic acquisitions |
| • | Further margin improvement through continued focus on best practices and internalization opportunities |
| 8 | |
Share Price History
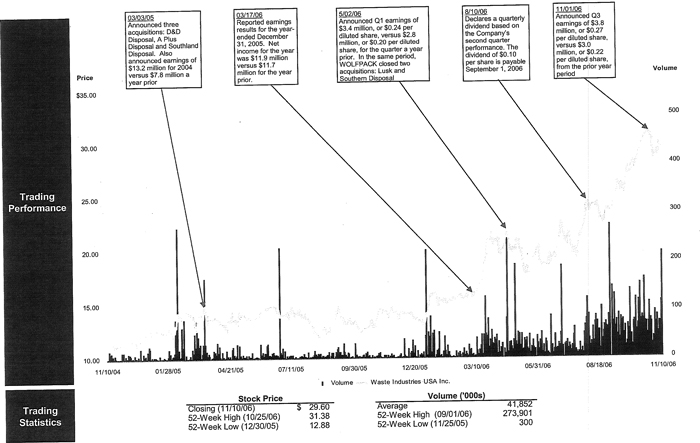
Source: FactSet Research Systems, Inc. as of Nov 10, 2006.
| 9 | |
WOLFPACK Has Significantly Outperformed The Broader Solid Waste Sector
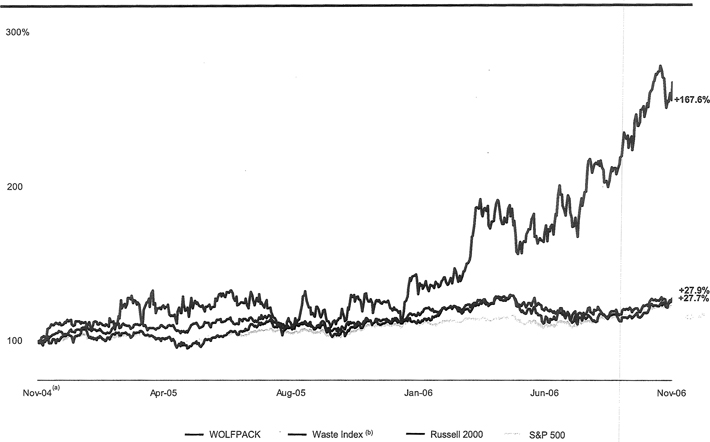
Source: FactSet Research System, Inc. as of November 10, 2006.
| (a) | Index begins as of November 10, 2004. |
| (b) | Peer Index is equal-weighted and consists of Allied Waste Industries, Casella Waste Systems, Republic Services, Waste Connections, Waste Management and Waste Services. |
| 10 | |
Improving Performance Has Resulted in Multiple Expansion
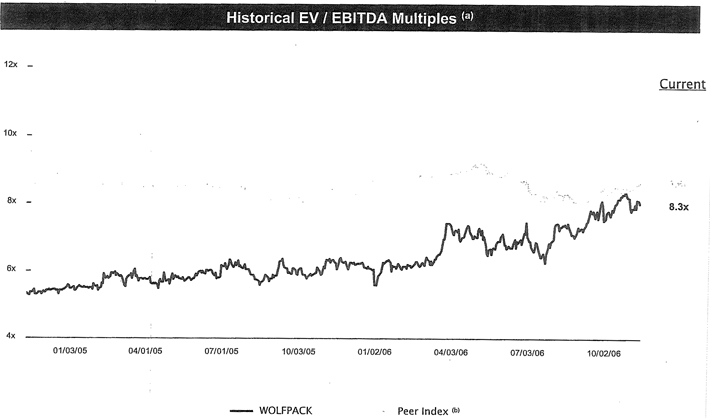
Source: FactSet Research Systems Inc.
| (a) | Multiples based on publicly available information. Based on closing stock prices through November 10, 2006. |
| (b) | Peer Index is equal-weighted and consists of Allied Waste Industries, Casella Waste, Republic Services, Waste Connections and Waste Management. |
| 11 | |
Comparable Company Analysis – Growth Metrics
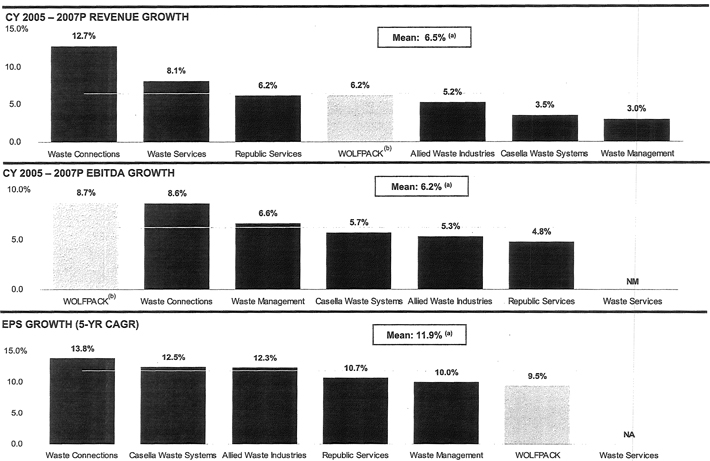
Source: Publicly available information, company information and BAS estimates as of November 10, 2006.
| (a) | Averages exclude WOLFPACK. |
| (b) | 2 YR CAGR growth rates for WOLFPACK are from FY2006E to FY2008P. |
| 12 | |
Comparable Company Analysis – Margin Metrics
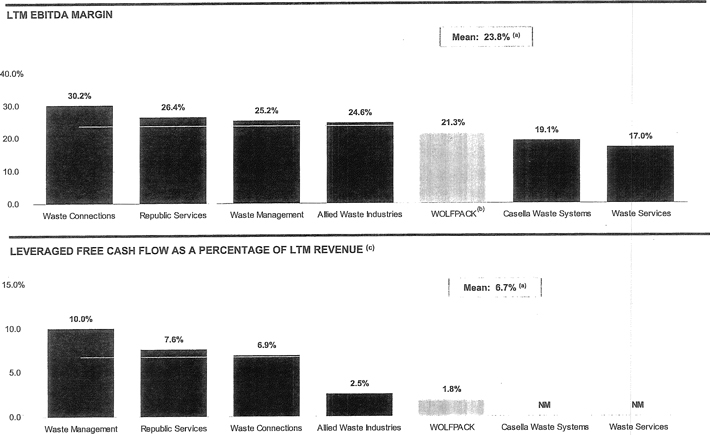
Source: Publicly available information, company information and BAS estimates as of November 10, 2006.
| (a) | Averages exclude WOLFPACK. |
| (b) | WOLFPACK EBITDA margin for FY2006E |
| (c) | Leveraged Free Cash Flow is calculated as EBITDA – Capex – Cash Taxes – Interest Expense. |
| 13 | |
Comparable Company Analysis – Leverage Metrics
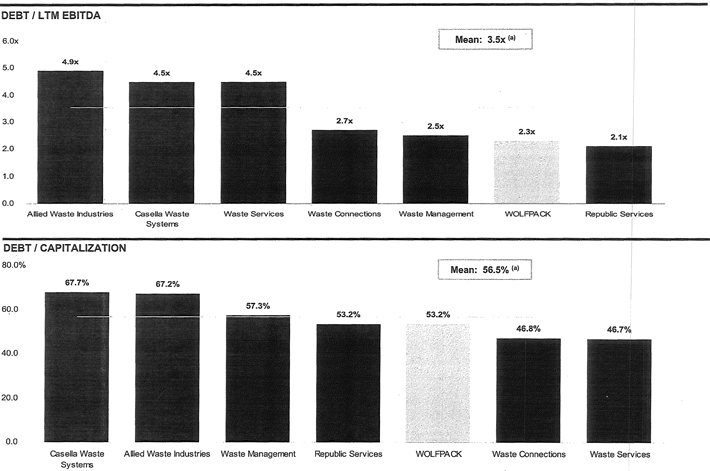
Source: Publicly available information, company information and BAS estimates as of November 10, 2006.
| (a) | Averages exclude WOLFPACK. |
| 14 | |
Comparable Company Analysis – Valuation and Liquidity Metrics
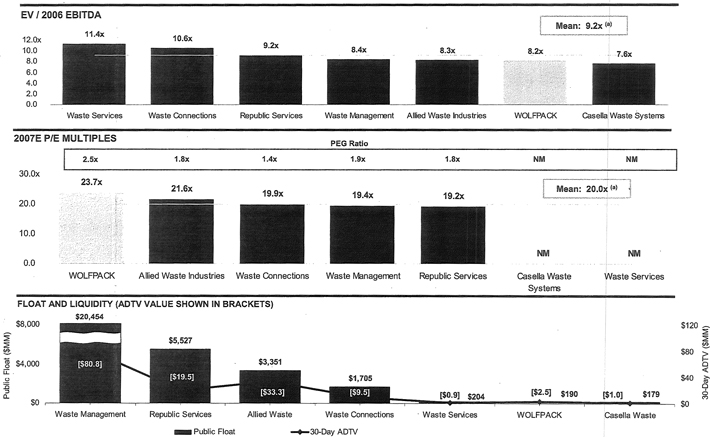
Source: Publicly available information, company information and BAS estimates as of November 10, 2006.
| (a) | Averages exclude WOLFPACK. |
| 15 | |
Summary of Historical and Projected Financial Results
($ in millions)
Fiscal Year Ended December 31, | Historical(a) | Projected(b) | CAGR | ||||||||||||||||||||||||||||||||||||
| 2004 | 2005 | LTM | 2006(d) | 2007 | 2008(e) | 2009 | 2010 | 2011 | 2006-2011 | ||||||||||||||||||||||||||||||
Revenue(c) | $ | 285.9 | $ | 310.6 | $ | 331.6 | $ | 328.5 | $ | 343.0 | $ | 370.2 | $ | 392.1 | $ | 414.6 | $ | 437.6 | 5.9 | % | |||||||||||||||||||
% Growth | — | 8.7 | % | — | 5.8 | % | 4.4 | % | 7.9 | % | 5.9 | % | 5.7 | % | 5.6 | % | |||||||||||||||||||||||
EBITDA | 54.4 | 59.4 | 69.4 | 70.1 | 75.3 | 82.8 | 88.0 | 93.3 | 98.8 | 7.7 | % | ||||||||||||||||||||||||||||
% of Revenue | 19.0 | % | 19.1 | % | 20.9 | % | 21.3 | % | 21.9 | % | 22.4 | % | 22.4 | % | 22.5 | % | 22.6 | % | |||||||||||||||||||||
EBIT | 25.1 | 28.9 | 37.1 | 37.8 | 41.7 | 45.9 | 49.1 | 52.5 | 55.9 | 8.2 | % | ||||||||||||||||||||||||||||
% of Revenue | 8.8 | % | 9.3 | % | 11.2 | % | 11.5 | % | 12.2 | % | 12.4 | % | 12.5 | % | 12.7 | % | 12.8 | % | |||||||||||||||||||||
Net Income | 9.9 | 11.6 | 15.8 | 17.0 | 17.7 | 20.0 | 22.1 | 24.4 | 26.8 | 9.5 | % | ||||||||||||||||||||||||||||
% Growth | — | 16.7 | % | — | 47.1 | % | 4.0 | % | 13.2 | % | 10.5 | % | 10.1 | % | 10.0 | % | |||||||||||||||||||||||
EPS | $ | 0.72 | $ | 0.84 | $ | 1.13 | $ | 1.20 | $ | 1.25 | $ | 1.42 | $ | 1.57 | $ | 1.72 | $ | 1.90 | 9.5 | % | |||||||||||||||||||
% Growth | — | 15.4 | % | — | 43.9 | % | 4.0 | % | 13.2 | % | 10.5 | % | 10.1 | % | 10.0 | % | |||||||||||||||||||||||
Selected Balance Sheet Items: | |||||||||||||||||||||||||||||||||||||||
Cash & Cash Equivalents | $ | 2.4 | $ | 1.6 | $ | 1.8 | $ | 3.5 | $ | 3.5 | $ | 3.5 | $ | 3.5 | $ | 3.5 | $ | 3.5 | |||||||||||||||||||||
Total Debt | 156.7 | 165.9 | 160.9 | 159.2 | 169.8 | 168.4 | 165.8 | 161.9 | 154.7 | ||||||||||||||||||||||||||||||
Shareholders’ Equity | 117.7 | 129.5 | 141.6 | 144.0 | 156.1 | 170.5 | 187.1 | 205.8 | 227.1 | ||||||||||||||||||||||||||||||
Total Capital | 274.4 | 295.4 | 302.6 | 303.2 | 325.8 | 338.9 | 352.8 | 367.8 | 381.7 | ||||||||||||||||||||||||||||||
Selected Financial Metrics: | |||||||||||||||||||||||||||||||||||||||
Total Debt / EBITDA | 2.9 | x | 2.8 | x | 2.3 | x | 2.3 | x | 2.3 | x | 2.0 | x | 1.9 | x | 1.7 | x | 1.6 | x | |||||||||||||||||||||
Total Debt / Capitalization | 57.1 | % | 56.2 | % | 53.2 | % | 52.5 | % | 52.1 | % | 49.7 | % | 47.0 | % | 44.0 | % | 40.5 | % | |||||||||||||||||||||
EBITDA / Interest Expense | 5.5 | x | 6.0 | x | 7.2 | x | 7.2 | x | 5.6 | x | 6.0 | x | 6.5 | x | 7.0 | x | 7.7 | x | |||||||||||||||||||||
Dividend Payout Ratio | 21.8 | % | 28.5 | % | 31.6 | % | 31.2 | % | 31.5 | % | 27.9 | % | 25.2 | % | 22.9 | % | 20.8 | % | |||||||||||||||||||||
| (a) | As per Company Form 10-K dated December 31, 2005 and 10-Q dated 6/30/06. Normalized to exclude non-recurring items. |
| (b) | Projections as per WOLFPACK Management and BAS estimates. |
| (c) | 2007 – 2011 include incremental revenue from acquisitions. |
| (d) | Excludes the gain from sale of Old Kings Road. |
| (e) | Assumes $6 million of incremental revenue and $2.5 million of incremental EBITDA in 2008 due to Wake County Landfill. |
| 16 | |
Preliminary Discounted Cash Flow Analysis
($ in millions)
Key | Fiscal Year Ending December 31, | Projected(a) | CAGR | ||||||||||||||||||||||
| 2007 | 2008 | 2009 | 2010 | 2011 | 2006-2011 | ||||||||||||||||||||
Net Sales | $ | 343.0 | $ | 370.2 | $ | 392.1 | $ | 414.6 | $ | 437.6 | 5.9 | % | |||||||||||||
% Growth | ? | 7.9 | % | 5.9 | % | 5.7 | % | 5.6 | % | ||||||||||||||||
EBITDA | 75.3 | 82.8 | 88.0 | 93.3 | 98.8 | 7.1 | % | ||||||||||||||||||
% Net Sales | 21.9 | % | 22.4 | % | 22.4 | % | 22.5 | % | 22.6 | % | |||||||||||||||
EBIT | 41.7 | 45.9 | 49.1 | 52.5 | 55.9 | 8.2 | % | ||||||||||||||||||
% Net Sales | 12.2 | % | 12.4 | % | 12.5 | % | 12.7 | % | 12.8 | % | |||||||||||||||
Less Cash Taxes @ 38.0% | (15.9 | ) | (17.4 | ) | (18.7 | ) | (19.9 | ) | (21.3 | ) | |||||||||||||||
Tax-adjusted EBIT | 25.9 | 28.4 | 30.5 | 32.5 | 34.7 | 8.2 | % | ||||||||||||||||||
Plus: Depreciation & Amortization | 33.5 | 36.9 | 38.9 | 40.9 | 42.8 | ||||||||||||||||||||
Less: Capital Expenditures / Acquisitions | (56.0 | ) | (50.0 | ) | (53.0 | ) | (56.0 | ) | (57.0 | ) | |||||||||||||||
Less: Change in Net Working Capital | (0.2 | ) | (0.0 | ) | 0.2 | 0.2 | 0.2 | ||||||||||||||||||
Unlevered Free Cash Flow | $ | 3.2 | $ | 15.4 | $ | 16.6 | $ | 17.6 | $ | 20.7 | |||||||||||||||
| Discount Rate | 8.5% | 9.5% | 10.5% | |||||||||||||||||||||||||||||||||||
DCF Summary | Terminal EBITDA Multiple | 8.00x | 8.75x | 9.50x | 8.00x | 8.75x | 9.50x | 8.00x | 8.75X | 9.50x | ||||||||||||||||||||||||||||
2011 EBITDA | $ | 98.8 | $ | 98.8 | $ | 98.8 | $ | 98.8 | $ | 98.8 | $ | 98.8 | $ | 98.8 | $ | 98.8 | $ | 98.8 | ||||||||||||||||||||
2011 UFCF | 20.7 | 20.7 | 20.7 | 20.7 | 20.7 | 20.7 | 20.7 | 20.7 | 20.7 | |||||||||||||||||||||||||||||
Terminal Value | 790.2 | 864.3 | 938.4 | 790.2 | 864.3 | 938.4 | 790.2 | 864.3 | 938.4 | |||||||||||||||||||||||||||||
PV of Terminal Value | 525.5 | 574.8 | 624.0 | 502.0 | 549.0 | 596.1 | 479.6 | 524.6 | 569.6 | |||||||||||||||||||||||||||||
PV of Free Cash Flows | 55.5 | 55.5 | 55.5 | 53.8 | 53.8 | 53.8 | 52.2 | 52.2 | 52.2 | |||||||||||||||||||||||||||||
Enterprise Value | $ | 581.0 | $ | 630.3 | $ | 679.5 | $ | 555.7 | $ | 602.8 | $ | 649.8 | $ | 531.8 | $ | 576.8 | $ | 621.7 | ||||||||||||||||||||
Less: Net Debt | (155.7 | ) | (155.7 | ) | (155.7 | ) | (155.7 | ) | (155.7 | ) | (155.7 | ) | (155.7 | ) | (155.7 | ) | (155.7 | ) | ||||||||||||||||||||
Equity Value | 425.2 | 474.5 | 523.8 | 400.0 | 447.0 | 494.1 | 376.1 | 421.0 | 466.0 | |||||||||||||||||||||||||||||
Shares Outstanding | 14.132 | 14.132 | 14.132 | 14.132 | 14.132 | 14.132 | 14.132 | 14.132 | 14.132 | |||||||||||||||||||||||||||||
Price per Share | $ | 30.09 | $ | 33.58 | $ | 37.06 | $ | 28.30 | $ | 31.63 | $ | 34.96 | $ | 26.61 | $ | 29.79 | $ | 32.97 | ||||||||||||||||||||
Premium / (Discount) to Current | 1.7 | % | 13.4 | % | 25.2 | % | (4.4 | %) | 6.9 | % | 18.1 | % | (10.1 | )% | 0.7 | % | 11.4 | % | ||||||||||||||||||||
Implied 2006E EBITDA Multiple | 8.3x | 9.0x | 9.7x | 7.9x | 8.6x | 9.3x | 7.6x | 8.2x | 8.9x | |||||||||||||||||||||||||||||
| (a) | Projections as per WOLFPACK’s Management and BAS estimates. |
| 17 | |
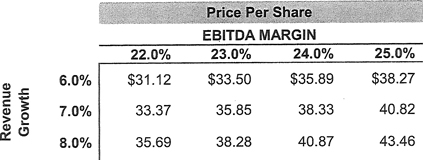
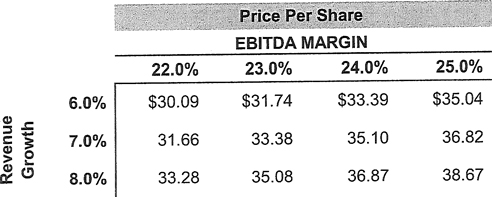
Growth and Margin Sensitivity – Discounted Cash Flow Analysis
| • | Assumes a WACC of 9.5% for WOLFPACK |
| • | Assumes a Terminal Value Multiple of 8.75x FY 2011E EBITDA |
| 18 | |
Standalone Debt Capacity Analysis
($ in millions)
| Pro Forma Total Debt / EBITDA Multiple | ||||||||||||||||
| 2.50x | 3.00x | 3.50x | 4.00x | |||||||||||||
Incremental Debt | $ | 15.9 | $ | 51.0 | $ | 86.0 | $ | 121.0 | ||||||||
2006 PF Total Debt | 175.2 | 210.2 | 245.2 | 280.3 | ||||||||||||
2006 PF Total Debt / Capitalization | 54.9 | % | 59.3 | % | 63.0 | % | 66.1 | % | ||||||||
| Pro Forma Total Debt / Capitalization Multiple | ||||||||||||||||
| 55.0% | 60.0% | 65.0% | 70.0% | |||||||||||||
Incremental Debt | $ | 16.7 | $ | 56.7 | $ | 108.1 | $ | 176.7 | ||||||||
2006 PF Total Debt | 176.0 | 216.0 | 267.4 | 335.9 | ||||||||||||
2006 PF Total Debt / EBITDA | 2.5 | x | 3.1 | x | 3.8 | x | 4.8 | x | ||||||||
| (a) | As of 12/31/06 – assumes FY2006E EBITDA of $70.1 million. |
| 19 | |
Acquisition Capacity Analysis(a)
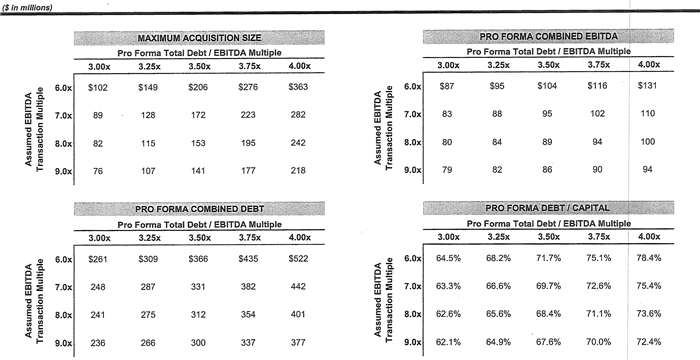
| (a) | Figures represent maximum transaction size for given multiple and resulting Total Debt / EBITDA ratio assumes an all-cash transaction financed solely by debt. Total leverage based on FY2006E EBITDA of $70.1 million. |
| 20 | |
III. Analysis of Strategic Alternatives
| 21 | |
A. Execute Strategic Plan and Return Capital to Shareholders
| 22 | |
1. Execute Strategic Plan - Increase Regular Dividend
| 23 | |
Overview of Regular Dividend Increase
| Overview | • The Company has the financial capacity to increase its regular dividend and continue to execute its strategic plan, including the ability to make significant acquisitions | |
• Dividends have historically been an important part of the overall return of the stock market | ||
• Current dividend yield for the Russell 2000: 1.1% | ||
• Current dividend yield for the S&P 500: 1.9% | ||
| Key Positives | • Provides increased current income to investors | |
• Signals to the market that management is disciplined in the use of its capital and is focused on optimizing its capital structure | ||
| Considerations | • Increases to regular dividends are relatively permanent | |
• Negative implications if reduced or eliminated | ||
• May reduce financial flexibility in a difficult operating environment | ||
• Assuming a $0.50 per share annual dividend, the Company would pay approximately $7.0 million per year in dividends | ||
| Financial Impact | • Payout ratio of 39.5% in 2007, decreasing to 31.8% in 2009 |
| 24 | |
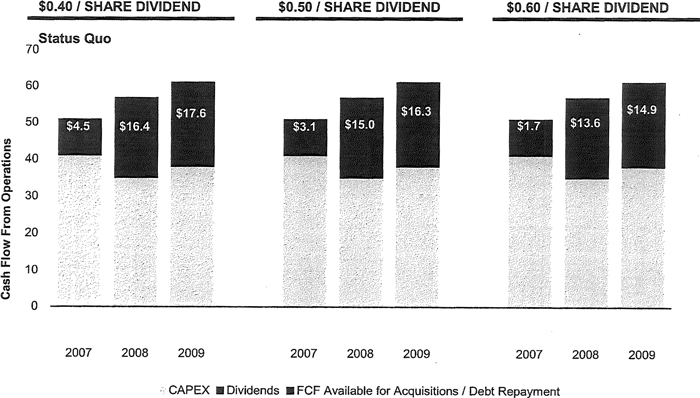
Given WOLFPACK’s Strong Cash Flow, a Dividend Increase is Feasible
Free Cash Flow Available for Acquisition / Debt Repayment Sensitivity Analysis
($ in millions except per share data)
Dividend / Share | $ | 0.40 | $ | 0.40 | $ | 0.40 | $ | 0.50 | $ | 0.50 | $ | 0.50 | $ | 0.60 | $ | 0.60 | $ | 0.60 | ||||||||||||||||||||||
Wtd. Avg. Shares | 13.943 | 13.943 | 13.943 | 13.943 | 13.943 | 13.943 | 13.943 | 13.943 | 13.943 | |||||||||||||||||||||||||||||||
Total Dividend | $ | 5.58 | $ | 5.58 | $ | 5.58 | $ | 6.97 | $ | 6.97 | $ | 6.97 | $ | 8.37 | $ | 8.37 | $ | 8.37 | ||||||||||||||||||||||
Earnings Per Share | $ | 1.25 | $ | 1.42 | $ | 1.57 | $ | 1.25 | $ | 1.42 | $ | 1.57 | $ | 1.25 | $ | 1.42 | $ | 1.57 | ||||||||||||||||||||||
Dividend Yield(a) | 1.4 | % | 1.4 | % | 1.4 | % | 1.7 | % | 1.7 | % | 1 .7 | % | 2.0 | % | 2.0 | % | 2.0 | % | ||||||||||||||||||||||
Payout Ratio(b) | 31.5 | % | 27.9 | % | 25.2 | % | 39.5 | % | 35.0 | % | 31.8 | % | 47.5 | % | 42.3 | % | 38.5 | % |
Source: As per publicly available information and estimates provided by the Company.
| (a) | Stock price of $29.60 as of November 10, 2006. |
| (b) | Payout Ratio equals to the Dividend / Share divided by Earnings Per Share. |
| 25 | |
2. Execute Strategic Plan – Share Repurchase
| 26 | |
Overview of Share Repurchase
| Overview | • Share repurchases have become an increasingly popular means of returning capital to shareholders as many companies have excess cash and / or significant debt capacity | |
| Key Positives | • Provides immediate value realization to shareholders | |
• Demonstrates to the market that management is disciplined in its use of capital | ||
• Increased leverage would lower the Company’s WACC | ||
• Provides monetization opportunity for significant shareholders | ||
• Shareholders can participate at their discretion | ||
| Considerations | • Decreases the Company’s total shares outstanding and public float | |
• Potential signal to the market that the Company does not have more attractive uses for the capital | ||
• Increased leverage may reduce financial flexibility | ||
• A significant one-time share repurchase would likely have to be executed at a premium to market | ||
• On average, repurchases involving between 10 - 25% of shares outstanding have historically been executed at an approximate 10% premium to market | ||
• Modest EPS dilution | ||
| Financial Impact | • A share repurchase of 1.25 million shares at $33.00 per share: | |
• Could be accomplished while maintaining the current dividend policy and executing the Company’s strategic plan | ||
• PF Debt / 2006E EBITDA would increase to 2.9x, declining to 2.6x by 2008 | ||
• PF Debt / Capitalization would increase to 66.2%, declining to 62.9% by 2008 |
| 27 | |
Illustrative Share Repurchase at $33.00 per share
| 1.00 million Share Repurchase | 1.25 million Share Repurchase | 1.50 million Share Repurchase | ||||||||||
| Net Income Impact | ||||||||||||
WOLFPACK Status Quo FY2007P Net Income | $ | 17.7 | $ | 17.7 | $ | 17.7 | ||||||
Less: After-tax Interest Expense on New Debt | (1.5 | ) | (1.9 | ) | (2.2 | ) | ||||||
Post-Transaction FY2007P Net income | $ | 16.2 | $ | 15.8 | $ | 15.5 | ||||||
| Shares Outstanding Adjustments | ||||||||||||
WOLFPACK Pre -Transaction Fully Dilluted Shares Outstanding | 14.132 | 14.132 | 14.132 | |||||||||
Share Issue (Repurchase) | (1.000 | ) | (1.250 | ) | (1.500 | ) | ||||||
Post - Transaction Shares Outstanding | 13.132 | 12.882 | 12.632 | |||||||||
| WOLFPACK Post-Transaction FY2007P EPS | $ | 1.23 | $ | 1.23 | $ | 1.22 | ||||||
Status Quo WOLFPACK FY2007P EPS | $ | 1.25 | $ | 1.25 | $ | 1.25 | ||||||
Accretion / (Dilution) - $ | $ | (0.02 | ) | $ | (0.02 | ) | $ | (0.03 | ) | |||
Accretion / (Dilution) - % | (1.6 | )% | (1.9 | )% | (2.1 | )% | ||||||
| Pro Forma Leverage | ||||||||||||
2006E Debt | $ | 159.2 | $ | 159.2 | $ | 159.2 | ||||||
New Debt | 34.0 | 42.3 | 50.5 | |||||||||
Debt Repayment | 0.0 | 0.0 | 0.0 | |||||||||
Total Debt | $ | 193.2 | $ | 201.5 | $ | 209.7 | ||||||
PF Debt / FY2006E EBITDA | 2.8 | x | 2.9 | x | 3.0 | x | ||||||
PF Debt / FY2006E Capitalization | 63.5 | % | 66.2 | % | 68.9 | % | ||||||
| Analysis of Pro Forma Public Float | ||||||||||||
PF Public Float(a) | 5.470 | 5.220 | 4.970 | |||||||||
Post - Transaction Shares Outstanding | 13.132 | 12.882 | 12.632 | |||||||||
% Change in Public Float | (15.5 | )% | (19.30 | )% | (23.2 | )% | ||||||
| (a) | Assumes public float of 6.470 million shares as of November 10, 2006. |
| 28 | |
3. Execute Strategic Plan - Special Dividend
| 29 | |
Overview of Special Dividend
Overview | • A special dividend would utilize the Company’s debt capacity to provide meaningful income to all shareholders | |
• Special dividends have historically been utilized by mature companies that have significant excess debt capacity and limited need for growth capital | ||
| Key Positives | • Provides immediate value realization all to shareholders | |
• Demonstrates to the market that management is disciplined in its use of capital | ||
• Increased leverage would lower the Company’s WACC | ||
• Does not result in a reduction of shares outstanding | ||
Considerations | • Potential signal to the market that the Company does not have more attractive uses for the capital | |
• Increased leverage may reduce financial flexibility | ||
• Transaction would be dilutive to EPS | ||
| Financial Impact | • A one-time dividend of $3.00: | |
• Could be accomplished while maintaining the current dividend policy and executing the Company’s strategic plan | ||
• PF Debt / 2006E EBITDA increases to 2.9x, declining to 2.6x by 2008 | ||
• PF Debt / Capitalization increases to 66.5%, declining to 63.4% by 2008 | ||
| 30 | |
Illustrative One-Time Dividend
| Dividend of $2.00 per share | Dividend of $3.00 per share | Dividend of $4.00 per share | ||||||||||
| Net Income Impact | ||||||||||||
WOLFPACK Status Quo FY2007P Net Income | $ | 17.7 | $ | 17.7 | $ | 17.7 | ||||||
Less: After-tax Interest Expense on New Debt | (1.3 | ) | (1.9 | ) | (2.5 | ) | ||||||
Post-Transaction FY2007P Net Income | $ | 16.4 | $ | 15.8 | $ | 15.2 | ||||||
| Shares Outstanding Adjustments | — | |||||||||||
WOLFPACK Pre-Transaction Fully Dilluted Shares Outstanding | 14.132 | 14.132 | 14.132 | |||||||||
Share Issue (Repurchase) | 0.000 | 0.000 | 0.000 | |||||||||
Post - Transaction Shares Outstanding | 14.132 | 14.132 | 14.132 | |||||||||
| WOLFPACK Post-Transaction FY2007P EPS | $ | 1.16 | $ | 1.12 | $ | 1.08 | ||||||
| Status Quo WOLFPACK FY2007P EPS | $ | 1.25 | $ | 1.25 | $ | 1.25 | ||||||
Accretion / (Dilution) - $ | $ | (0.09 | ) | $ | (0.13 | ) | $ | (0.18 | ) | |||
Accretion / (Dilution) - % | (7.2 | )% | (10.6 | )% | (14.0 | )% | ||||||
| Pro Forma Leverage | ||||||||||||
2006E Debt | $ | 159.2 | $ | 159.2 | $ | 159.2 | ||||||
New Debt | 28.3 | 42.4 | 56.5 | |||||||||
Debt Repayment | 0.0 | 0.0 | 0.0 | |||||||||
Total Debt | $ | 187.5 | $ | 201.6 | $ | 215.7 | ||||||
PF Debt/ FY2006E EBITDA | 2.7 | x | 2.9 | x | 3.1 | x | ||||||
PF Debt / FY2006E Capitalization | 61.8 | % | 66.5 | % | 71.2 | % | ||||||
| Analysis of Pro Forma Public Float | ||||||||||||
PF Public Float(a) | 6.470 | 6.470 | 6.470 | |||||||||
Post - Transaction Shares Outstanding | 14.132 | 14.132 | 14.132 | |||||||||
% Change in Public Float | 0.0 | % | 0.0 | % | 0.0 | % | ||||||
| (a) | Assumes public float of 6.470 million shares as of November 10, 2006. |
| 31 | |
B. Follow-On Offering
| 32 | |
Overview of Follow-On Offering
| Overview | • The Company could take advantage of the strong equity markets to execute a follow on offering | |
| Key Positives | • Increases the Company’s float | |
• Opportunity to market WOLFPACK directly to institutional investors | ||
• Broadens the institutional ownership of the Company | ||
• Provides additional capital for growth | ||
• Presents a monetization opportunity for insiders | ||
• Reduces insider overhang | ||
| Considerations | • Modest dilution of existing shareholders | |
• Offering should be of sufficient size to ensure investor interest, likely requiring some secondary selling | ||
• Target $75 million offering for best execution | ||
• Would result in insiders owning less than 50% of the outstanding stock of the Company | ||
• Offering would be most successful with identified growth opportunities | ||
| Financial Impact | • A $75 million offering with 50% primary shares: | |
• Would provide the Company with additional financial flexibility to make significant growth investments, while maintaining the current dividend policy and executing its strategic plan | ||
• Results in PF Debt / 2006E EBITDA of 1.8x | ||
• Results in 2006 PF Debt / Capitalization of 42.1 % |
| 33 | |
Follow-on Offering Indicative Terms
ISSUE | TERMS | CONSIDERATIONS | ||
| Offering Size | Approximately $75 million | • Use of proceeds | ||
• Materiality of offering size to attract quality fundamental interest | ||||
• Dilution | ||||
Primary / Secondary Split | 50% / 50% | • Primary used for delevering | ||
• Secondary allows for modest monetization by insiders | ||||
• Transactions with secondary selling perform as well as 100% primary transactions | ||||
| Over-allotment Option | 15% / 30 days | • Standard provision | ||
• Primary / secondary mix flexible | ||||
| Timing | Late Q4 06 or Q1 07 pricing possible | • Recommend filing “discrete” S-3 registration statement | ||
• Short process assuming “No Review” from SEC | ||||
| Marketing | Targeted US Roadshow | • 3-5 day US roadshow | ||
• Conference calls to European investors as appropriate | ||||
| Lock-up Provision | 90 Days | • Standard provision for follow-on offerings | ||
Institutional / Retail
Domestic / International | 80% / 20%
95% / 5% |
• Focus on fundamental, domestic institutional buyers | ||
• Utilize retail and middle market demand to minimize institutional price sensitivity | ||||
| Syndicate Structure | Banc of America Securities as Sole Bookrunner | • Execution track record | ||
| 2-3 Other Co-Managers |
• Distribution platform | |||
• Reward relationships | ||||
| 34 | |
Sizing Analysis For a Marketed WOLFPACK Follow-on
| Equity Offering | |||||||||||||||||
| WOLFPACK | Total Deal Size ($MM) | Shares Offered (MM) | Public Float (%) | Total Shares Outstanding (%) | Total Size Relative to 30 Day ADTV (Days) | ||||||||||||
Closing Price | $ | 29.60 | $ | 55 | 1.9 | 26.9 | % | 13.3 | % | 21.0 | x | ||||||
30 Day ADTV (shares) | 88,505 | $ | 65 | 2.2 | 31.8 | % | 15.7 | % | 24.8 | x | |||||||
Shares Outstanding | 13,942,665 | $ | 75 | 2.5 | 36.7 | % | 18.2 | % | 28.6 | x | |||||||
Insider Held Shares | 7,035,000 | $ | 85 | 2.9 | 41.6 | % | 20.6 | % | 32.4 | x | |||||||
Public Float | 6,907,665 | $ | 95 | 3.2 | 46.5 | % | 23.0 | % | 36.3 | x | |||||||
Selected Comparably Sized(a) 2005-6 Follow-on Offerings | % Sec. Shares | Pre-Deal Market Cap | Offer Date | File/Offer | |||||||||||||||||||||
Eagle Test Systems Inc | 64 | % | $ | 341 | 09/27/06 | $ | 91 | 5.5 | 56.0 | % | 26.6 | % | 46.3 | x | (9.3 | )% | |||||||||
Knot Inc | 69 | % | $ | 422 | 08/10/06 | $ | 102 | 6.4 | 26.8 | % | 24.1 | % | 23.5 | x | (22.3 | )% | |||||||||
Cogent Communications Group Inc | 56 | % | $ | 397 | 06/01/06 | $ | 81 | 9.0 | 48.1 | % | 20.4 | % | 39.2 | x | (21.3 | )% | |||||||||
Thomas Weisel Partners LLC | 48 | % | $ | 490 | 05/17/06 | $ | 118 | 5.4 | 31.6 | % | 24.0 | % | 19.4 | x | (0.4 | )% | |||||||||
Synagro Technologies Inc | 88 | % | $ | 304 | 05/10/06 | $ | 71 | 17.1 | 29.6 | % | 23.4 | % | 60.6 | x | (16.5 | )% | |||||||||
ICT Group Inc | 35 | % | $ | 307 | 04/05/06 | $ | 76 | 3.2 | 70.3 | % | 24.6 | % | N/M | (10.1 | )% | ||||||||||
IKANOS Communications Inc | 57 | % | $ | 494 | 03/16/06 | $ | 119 | 5.8 | 32.3 | % | 24.2 | % | 46.9 | x | (6.3 | )% | |||||||||
McCormick & Schmick’s Seafood Restaurants Inc | 93 | % | $ | 314 | 12/13/05 | $ | 116 | 5.1 | 70.0 | % | 36.9 | % | 57.3 | x | (6.7 | )% | |||||||||
Rackable Systems Inc | 68 | % | $ | 381 | 12/01/05 | $ | 152 | 8.0 | 92.3 | % | 39.9 | % | 56.7 | x | 18.2 | % | |||||||||
Commercial Vehicle Group Inc | 81 | % | $ | 323 | 06/29/05 | $ | 139 | 7.8 | 69.4 | % | 42.9 | % | N/M | (1.7 | )% | ||||||||||
NutriSystem Inc | 67 | % | $ | 333 | 06/01/05 | $ | 57 | 5.2 | 24.5 | % | 17.1 | % | 14.9 | x | 3.8 | % | |||||||||
James River Coal Co | 57 | % | $ | 479 | 05/24/05 | $ | 114 | 3.5 | 29.4 | % | 23.7 | % | 45.5 | x | (13.1 | )% | |||||||||
NuCo2 Inc | 65 | % | $ | 308 | 03/23/05 | $ | 108 | 4.5 | 48.5 | % | 35.1 | % | N/M | 3.6 | % | ||||||||||
Pioneer Drilling Co | 52 | % | $ | 477 | 03/22/05 | $ | 154 | 12.6 | 55.9 | % | 32.4 | % | N/M | 15.4 | % | ||||||||||
Turbochef Technologies Inc | 50 | % | $ | 498 | 02/02/05 | $ | 103 | 5.0 | 30.2 | % | 20.6 | % | 28.5 | x | (4.6 | )% | |||||||||
Average | 63 | % | $ | 107 | 6.9 | 47.7 | % | 27.7 | % | 39.9 | x | (4.8 | )% | ||||||||||||
Median | 64 | % | $ | 108 | 5.5 | 48.1 | % | 24.2 | % | 45.5 | x | (6.3 | )% | ||||||||||||
Count | 15 | ||||||||||||||||||||||||
Sizing Source: Equidesk, Bloomberg; As of 11/12/06.
(a) 2006 marketed follow-ons with pre-deal market cap of $300MM-$500MM with a mix of primary and secondary shares in the offering (at least 25% secondary selling) excludes healthcare companies finance companies and REITs (abnormal file/offer).
| 35 | |
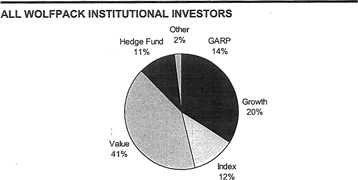
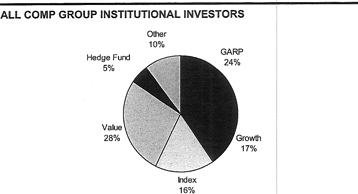
Distribution Analysis
Only 3 accounts are top 25 holders of both WOLFPACK and the comp group, indicating extensive ownership expansion opportunity
| TOP WOLFPACK INSTITUTIONAL INVESTORS | |||||||||||||||||||
Rank | Institution | Style | Equity Assets ($MM) | WOLF Holdings ($MM) | Count of Comps Held | Comp Holdings ($MM) | |||||||||||||
1 | Dimensional Fund Advisors, Inc. | Deep Value | $ | 82,904 | $ | 26.7 | 6 | $ | 79.7 | ||||||||||
2 | Farley Capital, LP. | Hedge Fund | 495 | 12.9 | — | — | |||||||||||||
3 | Cadence Capital Management, LLC | Core Growth | 7,502 | 12.8 | 2 | 72.6 | |||||||||||||
4 | Fairview Capital Investment Mgmt., L.L.C. | GARP | 411 | 11.1 | — | — | |||||||||||||
5 | AXA Rosenberg Investment Management LLC | Core Value | 31,668 | 7.1 | 4 | 9.4 | |||||||||||||
6 | River Road Asset Management, LLC | Yield | 1,789 | 5.8 | 1 | 28.5 | |||||||||||||
7 | Corbyn Investment Management, Inc. | Core Value | 191 | 4.7 | 1 | 9.4 | |||||||||||||
8 | Reich & Tang Asset Management, L.L.C. | GARP | 1,002 | 3.3 | 1 | 10.1 | |||||||||||||
9 | Bridgeway Capital Management, Inc. | Aggres. Gr. | 4,440 | 3.0 | 2 | 1.3 | |||||||||||||
10 | RiverSource Investments, LLC | Core Growth | 62,275 | 2.6 | 4 | 102.8 | |||||||||||||
11 | Duncan-Hurst Capital Management, L.P. | Momentum | 715 | 1.9 | 2 | 1.2 | |||||||||||||
12 | LSV Asset Management | Deep Value | 39,076 | 1.8 | — | — | |||||||||||||
13 | New Jersey Division of Investment | Core Growth | 36,072 | 1.5 | 4 | 49.9 | |||||||||||||
14 | BB&T Asset Management, Inc. | Income Value | 5,646 | 1.4 | 1 | 1.0 | |||||||||||||
15 | Lord, Abbett & Co. LLC | Income Value | 76,734 | 1.2 | 3 | 870.8 | |||||||||||||
16 | Bard Associates Inc. | Core Growth | 99 | 1.2 | — | — | |||||||||||||
17 | Wellington Management Company, LLP | Core Value | 313,549 | 1.1 | 2 | 747.3 | |||||||||||||
18 | Martingale Asset Management, L.P. | Deep Value | 4,402 | 0.8 | 2 | 12.4 | |||||||||||||
19 | College Retirement Equities Fund | GARP | 155,379 | 0.8 | 5 | 256.3 | |||||||||||||
20 | Voyageur Asset Management Inc. | Core Growth | 8,304 | 0.8 | 1 | 5.6 | |||||||||||||
21 | Mesirow Financial Investment Management, Inc. | GARP | 772 | 0.8 | — | — | |||||||||||||
22 | Northern Trust Global Investments | Core Growth | 71,528 | 0.7 | 6 | 59.1 | |||||||||||||
23 | PowerShares Capital Management LLC | Core Growth | 5,764 | 0.5 | 4 | 0.2 | |||||||||||||
24 | C. M. Bidwell & Associates, Ltd. | GARP | 305 | 0.5 | 1 | 0.1 | |||||||||||||
25 | Turner Investment Partners, Inc. | Aggres. Gr. | 16,182 | 0.4 | 1 | 6.4 | |||||||||||||
| Top 25 Total: | $ | 105.2 | $ | 2,324.2 | |||||||||||||||
| Shading refers to top holders or Company and comp group. | |||||||||||||||||||
 | |||||||||||||||||||
| TOP COMP GROUP INSTITUTIONAL INVESTORS | |||||||||||||||||
Rank | Institution | Style | Equity Assets ($MM) | WOLF Holdings ($MM) | Count of Comps Held | Comp Holdings ($MM) | |||||||||||
1 | Fidelity Management & Research. | GARP | $ | 716,216 | — | 4 | $ | 1,363.3 | |||||||||
2 | Capital Research & Management Company | Core Value | 756,617 | — | 2 | 1,195.6 | |||||||||||
3 | Cascade Investment, L.L.C. | Specialty | 9,340 | — | 2 | 989.8 | |||||||||||
4 | Legg Mason Capital Management, Inc. | GARP | 63,634 | — | 3 | 905.9 | |||||||||||
5 | Lord, Abbett & Co. LLC | Income Value | 76,734 | $ | 1.2 | 3 | 870.8 | ||||||||||
6 | T. Rowe Price Associates, Inc. | GARP | 196,503 | — | 5 | 779.0 | |||||||||||
7 | Wellington Management Company, LLP | Core Value | 313,549 | 1.1 | 2 | 747.3 | |||||||||||
8 | Apollo Investment Management, L.P. | Hedge Fund | 3,813 | — | 1 | 746.8 | |||||||||||
9 | AIM Management Group, Inc. | Momentum | 68,997 | — | 4 | 671.4 | |||||||||||
10 | Goldman Sachs Asset Management (US) | Core Growth | 133,180 | — | 5 | 396.7 | |||||||||||
11 | ClearBridge Advisors (SBAM) | GARP | 142,081 | — | 6 | 393.7 | |||||||||||
12 | BlackRock Financial Management, Inc. (ML) | Deep Value | 126,165 | 0.0 | 5 | 361.9 | |||||||||||
13 | EARNEST Partners, LLC | Core Value | 18,915 | — | 2 | 346.1 | |||||||||||
14 | Hotchkis and Wiley Capital Management, LLC | Yield | 28,964 | — | 1 | 336.9 | |||||||||||
15 | Columbia Management Advisors, Inc. | GARP | 113,565 | 0.2 | 6 | 332.0 | |||||||||||
16 | Eagle Capital Management L.L.C. (New York) | Growth | 6,060 | — | 1 | 290.7 | |||||||||||
17 | Jennison Associates LLC | Growth | 55,339 | — | 3 | 288.1 | |||||||||||
18 | College Retirement Equities Fund | GARP | 155,379 | 0.8 | 5 | 256.3 | |||||||||||
19 | American Century Investment Mgmt. | Momentum | 63,569 | — | 3 | 244.0 | |||||||||||
20 | Putnam Investment Management, L.L.C. | Core Growth | 98,889 | 0.2 | 4 | 231.5 | |||||||||||
21 | Sasco Capital, Inc. | Deep Value | 3,209 | — | 2 | 222.4 | |||||||||||
22 | Delaware Investments | Yield | 45,987 | — | 4 | 214.6 | |||||||||||
23 | GAMCO Investors, Inc. | GARP | 23,433 | — | 3 | 197.7 | |||||||||||
24 | TCW Asset Management Company | Core Growth | 52,814 | — | 2 | 195.8 | |||||||||||
25 | Aster Investment Management Co., Inc. | Growth | 3,420 | — | 3 | 172.7 | |||||||||||
| Top 25 Total: | $ | 3.6 | $ | 12,750.8 | |||||||||||||
| Shading refers to top holders of Company ana comp group. | |||||||||||||||||
 | |||||||||||||||||
Source: Thomson; As of 11/12/06. Tables exclude index funds and broker-dealers. Comp group includes WCN, RSG, WMI, AW, WSII, CWST.
| 36 | |
Fund-level Analysis
TOP WOLFPACK FUND-LEVEL INVESTORS | TOP COMP GROUP FUND-LEVEL INVESTORS | |||||||||||||||||||||||||||
Rank | Fund Name | Style | WOLF Holdings ($MM) | Count of Comps Held | BAS Salesperson | Fund Manager | Rank | Fund Name | Style | Count of Comps Held | Comps Holdings ($MM)s | BAS Salesperson | Fund Manager | |||||||||||||||
1 | Allianz CCM Emerging Companies Fund | Growth | $ | 9.05 | 1 | Patrick Fischoeder | William Bannick | 1 | American Funds Income Fund of America | Yield | 1 | $ | 425.98 | Greg Allcroft | Andrew Suzman | |||||||||||||
2 | DFA Tax-Managed U.S. Small Cap Value Portfolio | Core Value | 2.93 | 2 | Tom Fee | Robert Deere | 2 | Legg Mason Value Trust, Inc. | Core Value | 1 | 337.86 | Nancy Landau | William Miller | |||||||||||||||
3 | Greenspring Fund | Deep Value | 2.93 | 1 | Nancy Landau | Charles Carlson | 3 | Vanguard Wellington Fund, Inc. | Yield | 1 | 297.81 | Nancy Landau | Edward Bousa | |||||||||||||||
4 | RiverSource Variable Portfolio - Small Cap Value F | Core Value | 2.49 | — | Chris Mooney | John Harloe | 4 | Lord Abbett Affiliated Fund | Income Value | 1 | 281.57 | Richard Shields | Eli Salzmann | |||||||||||||||
5 | Aston/River Road Small Cap Value Fund | Growth | 1.94 | — | Bill Thompson | James Shircliff | 5 | American Funds Investment Company of America | Core Value | 1 | 179.40 | Greg Allcroft | James Rothenberg | |||||||||||||||
6 | Tamarack MicroCap Value Fund | GARP | 0.77 | — | Michael Molnar | Michael Lee | 6 | T. Rowe Price Equity Income Fund | Income Value | 1 | 173.61 | Nancy Landau | Brian Rogers | |||||||||||||||
7 | Laudus Rosenberg U.S. Small Capitalization Fund | GARP | 0.57 | 1 | Brent Regaldi | William Ricks | 7 | Fidelity Mid-Cap Stock Fund | Core Growth | 2 | 164.55 | Michael Chamberlain | Shep Perkins | |||||||||||||||
8 | Laudus Rosenberg U.S. Discovery Fund | GARP | 0.44 | 1 | Brent Regaldi | William Ricks | 8 | American Funds Growth Fund of America | Growth | 1 | 159.04 | Greg Allcroft | James Rothenberg | |||||||||||||||
9 | DFA Tax-Managed U.S. Marketwide Value Portfolio | Core Value | 0.38 | 3 | Tom Fee | Robert Deere | 9 | AIM Basic Value Fund | Core Value | 1 | 150.59 | Stuart Maeder | Bret Stanley | |||||||||||||||
10 | Northern Small Cap Value Fund | GARP | 0.38 | — | Jim Taich | Robert Bergson | 10 | AIM Charter Fund | Core Growth | 1 | 147.05 | Stuart Maeder | Ronald Sloan | |||||||||||||||
11 | Principal Investors Partners SmallCap Value Fund I | Core Value | 0.35 | 1 | Stuart Maeder | Chris Wallis | 11 | Fidelity Capital Appreciation Fund | Core Growth | 2 | 146.14 | Michael Chamberlain | J. Fergus Shiel | |||||||||||||||
12 | Van Wagoner Emerging Growth Fund | Momentum | 0.31 | — | Nate Hastings | Garrett Van Wagoner | 12 | Pictet Fund Water | Sector Specific | 4 | 130.37 | Jonathan Dho | Hans-Peter Portner | |||||||||||||||
13 | AXA Premier VIP Mid Cap Value Portfolio | GARP | 0.30 | 2 | Brent Regaldi | William Ricks | 13 | American Funds Insurance Series Growth | Core Value | 2 | 115.80 | Greg Allcroft | Claudia Huntington | |||||||||||||||
14 | DFA Tax-Managed U.S. Small Cap Portfolio | GARP | 0.29 | 2 | Tom Fee | Robert Deere | 14 | Putnam Fund for Growth and Income Fund | Yield | 1 | 111.83 | Brian Smith | Joshua Brooks | |||||||||||||||
15 | Vanguard Explorer Fund | Growth | 0.23 | 1 | Aaron Albright | Sam Wilderman | 15 | Goldman Sachs Mid Cap Value Fund | Core Value | 2 | 105.47 | Bill Thompson | Eileen Rominger | |||||||||||||||
16 | Espa Stock Umweit | International | 0.23 | 5 | Diana Robinson | Hans Leitner | 16 | Hotchkis and Wiley Large Cap Value Fund | Yield | 1 | 96.15 | Melissa Dubasik | George Davis | |||||||||||||||
17 | Lord Abbett Securities Trust - Micro-Cap Value | Core Value | 0.18 | _ | Richard Shields | Gerard Heffeman | 17 | Lord Abbett Mid Cap Value Fund | Core Value | 1 | 95.76 | Richard Shields | Edward von der Linde | |||||||||||||||
18 | Hirtle Callaghan Trust Small Capitalization Equity | Core Growth | 0.13 | 1 | Patrick Fischoeder | Michael Cavarretta | 18 | American Funds Fundamental Investors Fund, Inc. | Deep Value | 2 | 92.98 | Greg Allcroft | James Drasdo | |||||||||||||||
19 | New Covenant Growth Fund | GARP | 0.12 | 1 | Thomas Wyszynski | Harry Bum | 19 | First Eagle Global Fund | International | 1 | 91.97 | John Guster | Charies de Vaulx | |||||||||||||||
20 | Laudus Rosenberg Value Long/Short Equity Fund | GARP | 0.11 | 1 | Brent Regaldi | William Ricks | 20 | Janus Mid Cap Value Fund | Core Value | 2 | 91.42 | David Swift | Thomas Perkins | |||||||||||||||
21 | Activest Ally 1 | GARP | 0.11 | 1 | Diana Robinson | Dominik Kremer | 21 | Fidelity Equity-Income Fund | Core Value | 1 | 90.52 | Michael Chamberlain | Stephen Petersen | |||||||||||||||
22 | AXA Rsnbrg Equity Alpha Tst Global Small Cap | International | 0.10 | — | Diana Robinson | Rafael Sevilla Ramos | 22 | Meridian Value Fund | Growth | 2 | 90.34 | Van Wilshire | Richard Aster | |||||||||||||||
23 | Axa Equity L Fonds | Growth | 0.06 | — | Diana Robinson | Achim Stranz | 23 | American Funds Capital Income Builder | Yield | 1 | 89.39 | Greg Allcroft | Michael Cohen | |||||||||||||||
24 | DFA U.S. Vector Equity Portfolio | Growth | 0.05 | 6 | Tom Fee | Robert Deere | 24 | Meridian Growth Fund | Growth | 2 | 79.66 | Van Wilshire | Richard Aster | |||||||||||||||
25 | Laudus Rosenberg VIT Value Long/Short Equity | Core Value | 0.04 | 1 | Brent Regaldi | William Ricks | 25 | Legg Mason Partners Appreciation Fund Inc. | Core Value | 1 | 78.94 | Netanel Ginor | Harry Cohen | |||||||||||||||
26 | SEI Institutional Managed - Tax-Managed Small Cap | GARP | 0.04 | 2 | Lisa Puleo | Wayne Archambo | 26 | Legg Mason Special Investment Trust, Inc. | GARP | 1 | 76.65 | Nancy Landau | Samuel Peters | |||||||||||||||
27 | SA U.S. Small Company Fund | GARP | 0.04 | 2 | Tom Fee | Robert Deere | 27 | Fidelity Leveraged Company Stock Fund | GARP | 3 | 75.47 | Michael Chamberlain | Thomas Soviero | |||||||||||||||
28 | DFA U.S. Core Equity 2 Portfolio | Growth | 0.04 | 5 | Tom Fee | Robert Deere | 28 | American Century Equity Income Fund | Yield | 2 | 75.43 | Stuart Maeder | Phillip Davidson | |||||||||||||||
29 | DFA Tax-Managed U.S. Equity Portfolio | GARP | 0.03 | 5 | Tom Fee | David Booth | 29 | Master Value Opportunities Trust | Core Value | 2 | 71.41 | Lisa Puleo | Elise Baum | |||||||||||||||
30 | Old Westbury Global Small Cap Fund | Growth | 0.03 | 2 | Matthew Ellis | Marc Stem | 30 | Neuberger Herman Guardian Fund | GARP | 2 | 69.58 | Tom Wyszynski | Arthur Moretti | |||||||||||||||
31 | Vantagepoint Mid/Small Company Index Fund | Growth | 0.03 | 3 | Nancy Landau | Susan Ellison | 31 | Statens Pensjonsfond Utland | Core Value | 3 | 65.37 | Jim Adkin | Knut Kjaer | |||||||||||||||
32 | John Hancock Trust-Tot. Stock Mrkt. Ind | Core Growth | 0.02 | 5 | Diana Robinson | Carson Jen | 32 | JPMorgan Mid Cap Value Fund | Core Value | 1 | 63.99 | Jeff Cohen | Jonathan Simon | |||||||||||||||
33 | TIAA-CREF Institutional Small Cap Value Index Func | Core Value | 0.02 | 3 | Karen Blando | Anne Sapp | 33 | Hartford Dividend and Growth HLS Fund, Inc. | Yield | 1 | 63.60 | Nancy Landau | Edward Bousa | |||||||||||||||
34 | Gartmore Small Cap Index Fund | GARP | 0.02 | 3 | Lisa Puleo | Debbie Jelilian | 34 | Mutual Shares Fund | Deep Value | 1 | 62.53 | Tom Fee | Peter Langerman | |||||||||||||||
35 | Small Cap Premium & Dividend Income Fund, Inc. | Yield | 0.02 | 3 | Lisa Puleo | Debbie Jelilian | 35 | Columbia Acom Fund | Growth | 1 | 62.51 | Jim Taich | Charles McQuaid | |||||||||||||||
36 | DFA U.S. Core Equity 1 Portfolio | GARP | 0.02 | 5 | Tom Fee | Robert Deere | 36 | Sound Shore Fund, Inc. | Deep Value | 1 | 62.18 | Thomas Wyszynski | Harry Burn | |||||||||||||||
37 | Seasons Series Trust Small Cap Portfolio | Core Growth | 0.01 | 3 | David Richardson | Peter Hable | 37 | American Funds American Mutual Fund | Income Value | 1 | 61.88 | Greg Allcroft | R. Michael Shanahan | |||||||||||||||
38 | DFA U.S. Value Fund | Core Value | 0.01 | 1 | Tom Fee | Robert Deere | 38 | ING Global Equity Basis Fonds | Growth | 1 | 57.10 | Diana Robinson | Marco van Rijn | |||||||||||||||
39 | AXA Enterprise Multimanager Mid Cap Value | Core Value | 0.01 | 1 | Brent Regaldi | William Ricks | 39 | T. Rowe Price New Horizons Fund | Aggres. Gr. | 1 | 56.87 | Nancy Landau | John Laporte | |||||||||||||||
40 | CitiStreet Small Company Stock Fund | Growth | 0.01 | 4 | Tom Fee | Diane Jaffee | 40 | AIM V.I. Core Equity Fund | GARP | 1 | 56.52 | Stuart Maeder | Ronald Sloan | |||||||||||||||
Top 40 Total: | $ | 24.8 | Top 40 Total: | $ | 4,805.3 | |||||||||||||||||||||||
Source: Thomson; As of 11/13/06. Tables exclude index funds and broker-dealers. Comp group includes WCN, RSG, WMI, AW, WSII, CWST.
| 37 | |
C. Potential Sale
| 38 | |
Overview of Potential Sale
Sale to a Strategic Partner | Sale to a Private Equity Firm | |||
| Positives | • Immediate value realization at a historically high share price
• Assuming a cash transaction, complete monetization of shares
• Continued opportunity for upside if consideration includes an equity component
• Potential to realize incremental value through synergies
• Potential acquirors are trading at strong multiples and have the debt capacity to complete an acquisition | • Immediate value realization at a historically high share price • Eliminate public company costs and market pressures
• Ability to operate and execute strategic plan with long-term focus
• Increased interest in the Solid Waste sector on the part of private equity funds
• Debt markets are liquid and aggressive
• Potential for insiders to take the Company private | ||
| Considerations | • Eliminates the possibility of additional value creation for existing shareholders, assuming a cash transaction
• Cultural fit
• Impact on other stakeholders, including employees | • Other potential strategic and financial buyers could emerge
• Probable leverage may limit future ability to invest in the business / make acquisitions
• Philosophical and cultural compatibility
• Governance issues |
| 39 | |
Summary Preliminary Valuation Reference Range
| ($ in millions) | Current Stock Price $29.60 | |||||||
Selected Publicly Traded Companies(a) | • 8.0x – 9.5 x 2006E EBITDA of $70.1 million(b) |
| ||||||
Selected Precedent Transactions | • 8.5x – 10.0 x 2006E EBlTDA of $70.1 million(b) | 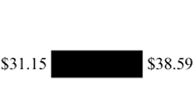 | ||||||
Discounted Cash Flow(c) | • 8.5% – 10.5% WACC | 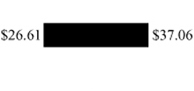 | ||||||
• 8.0x – 9.5x EBITDA Terminal Multiple Range | ||||||||
• 2011P EBITDA: $98.8 million(b) | ||||||||
Leveraged Buyout Analysis | • 6.0x leverage on 2006PF EBITDA of $72.1 million(d) | 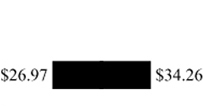 | ||||||
• 15% – 20% Required Return | ||||||||
• 8.0x– 9.5x EBITDA Terminal Multiple Range | ||||||||
| Implied Price per Share | $ | 10.00 | $ | 20.00 | $ | 30.00 | $ | 40.00 | $ | 50.00 | |||||
| Implied Transaction Value | $ | 297 | $ | 438 | $ | 580 | $ | 721 | $ | 862 |
| (a) | Per publicly available information as of November 10, 2006. |
| (b) | Per Management projections. |
| (c) | Present values as of December 31, 2006. |
| (d) | 2006E PF EBITDA excludes $2.0 million of public company expenses. |
| 40 | |
Summary of Strategic Buyers
Potential buyer | Market Data(a) | Rationale | ||||||||||||
| ($ in millions) | EV | LTM Revenue | LTM EBITDA | Debt / LTM EBITDA | ||||||||||
| $ | 1,845 | $ | 647 | $ | 192 | 3.5 | x | • Committed to building U.S. presence through acquisitions • Expand geographic footprint • Synergy opportunities | |||||
| 7,448 | 2,986 | 788 | 2.1 | x | • Excellent strategic fit • Cultural compatibility • Synergy opportunities | ||||||||
| 2,587 | 802 | 242 | 2.7 | x | • Similar business model • Expand geographic footprint • Synergy opportunities | ||||||||
| 45,253 | 35,237 | 4,751 | 4.3 | x | • Committed to expanding U.S. presence • Synergy opportunities | ||||||||


Source: Based upon publicly available information and BAS estimates.
| (a) | Market data as of November 10, 2006. |
| 41 | |
Illustrative Break Even EPS Analysis
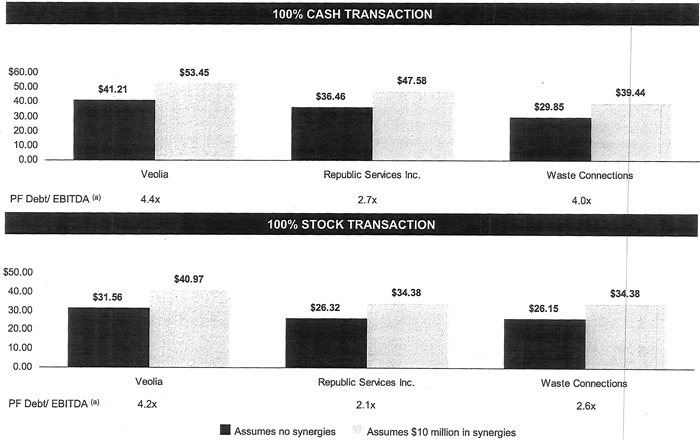
| (a) | Assumes no synergies. |
| 42 | |
Potential Financial Buyers
Financial Sponsor | Size of Fund | Selected Investments(a) | |||
| $ | 0.8 billion | • Advanced Disposal Services
• North East Waste Services
• Utilities, Inc. | ||
| $ | 2.0 billion | • Casella Waste Systems
• Clean Harbors Inc. | ||
| $ | 1.0 billion | • NA | ||
| $ | 8.0 billion | • Synagro Technologies | ||
| $ | 3.5 billion | • NA | ||
| $ | 3.0 billion | • EnviroSolutions Holdings Inc. | ||
| $ | 3.1 billion | • EnergySolutions
• Brock Services | ||
| $ | 6.5 billion | • Great Lakes Dredge & Dock | ||
| $ | 2.5 billion | • Clean Harbors Inc. | ||
 | $ | 3.5 billion | • Environmental Management Solutions | ||
| $ | 3.1 billion | • American Recovery Technology
• Clean Harbors Inc.
• Onyx Waste Services
• Organic Waste Technologies | ||
| $ | 3.7 billion | • N/A | ||


| (a) | Comprised of prior and current investments. |
| 43 | |
Illustrative LBO Analysis
Transaction close of December 31, 2006
Assumes 10% premium to the Company’s current share price
Total leverage of 6.0x 2006E PF EBITDA of $72.1 million(a)
| • | Senior debt of $290 million |
| • | Subordinated notes of $145 million |
Equity would come from insiders, private equity firm(s) or a combination of the two
($ in millions)
Sources & Uses of Funds
Sources of Funds | % of New Capital | |||||
Cash on Balance Sheet | $ | 3.5 | 0.6 | % | ||
Senior Debt | 290.0 | 46.8 | % | |||
Senior Sub Notes | 145.0 | 23.4 | % | |||
Equity | 180.9 | 29.2 | % | |||
Total Sources | $ | 619.4 | 100.0 | % | ||
Uses of Funds | % of Total | |||||
Purchase of Equity | $ | 444.5 | 71.8 | % | ||
Refinance Existing Debt | 159.2 | 25.7 | % | |||
Fees & Expenses | 15.6 | 2.5 | % | |||
Total Uses | $ | 619.4 | 100.0 | % | ||
Pro Forma Capitalization as of December 31, 2006
| Rate | Amount | % of Total | EBITDA Multiple (a) | ||||||||
Revolver | L + 275 | $ | 0.0 | 0.0 | % | 0.0x | |||||
Senior Debt | L + 275 | 290.0 | 47.1 | % | 4.0x | ||||||
Total Senior Secured Debt | $ | 290.0 | 47.1 | % | 4.0x | ||||||
Senior Sub Notes | 10.50 | % | 145.0 | 23.5 | % | 2.0x | |||||
Total Debt | $ | 435.0 | 76.0 | % | 6.0x | ||||||
Sponsor Equity | 180.9 | 29.4 | % | ||||||||
Total Capitalization | $ | 615.9 | 100.0 | % | |||||||
| (a) | 2006E PF EBITDA excludes $2 million in public company expenses. |
| 44 | |
LBO Analysis
($ in millions, except per share data)
Exit Multiple | 8.00 | x | 8.75 | x | 9.50 | x | ||||||||||||||||||||||||||||||
2011 Exit Year EBITDA(a) | $ | 100.8 | $ | 100.8 | $ | 100.8 | ||||||||||||||||||||||||||||||
Implied Enterprise Value | $ | 806.2 | $ | 881.8 | $ | 957.4 | ||||||||||||||||||||||||||||||
Less: 2011 Total Net Debt | (513.9 | ) | (513.9 | ) | (513.9 | ) | ||||||||||||||||||||||||||||||
Implied Equity Value | $ | 292.3 | $ | 367.9 | $ | 443.5 | ||||||||||||||||||||||||||||||
Illustrative Required Return | 15.0 | % | 17.5 | % | 20.0 | % | 15.0 | % | 17.5 | % | 20.0 | % | 15.0 | % | 17.5 | % | 20.0 | % | ||||||||||||||||||
Implied Maximum Equity Contribution | $ | 145.3 | $ | 130.5 | $ | 117.5 | $ | 182.9 | $ | 164.3 | $ | 147.8 | $ | 220.5 | $ | 198.0 | $ | 178.2 | ||||||||||||||||||
Plus: New Senior Debt | 290.0 | 290.0 | 290.0 | 290.0 | 290.0 | 290.0 | 290.0 | 290.0 | 290.0 | |||||||||||||||||||||||||||
Plus: Senior Sub Debt | 145.0 | 145.0 | 145.0 | 145.0 | 145.0 | 145.0 | 145.0 | 145.0 | 145.0 | |||||||||||||||||||||||||||
Less: Transaction Fees and Expenses | (15.6 | ) | (15.6 | ) | (15.6 | ) | (15.6 | ) | (15.6 | ) | (15.6 | ) | (15.6 | ) | (15.6 | ) | (15.6 | ) | ||||||||||||||||||
Implied Enterprise Value | $ | 564.7 | $ | 549.9 | $ | 536.9 | $ | 602.3 | $ | 583.7 | $ | 567.2 | $ | 639.9 | $ | 617.4 | $ | 597.6 | ||||||||||||||||||
Less: Refinanced Debt(b) | (159.2 | ) | (159.2 | ) | (159.2 | ) | (159.2 | ) | (159.2 | ) | (159.2 | ) | (159.2 | ) | (159.2 | ) | (159.2 | ) | ||||||||||||||||||
Plus: Cash on Balance Sheet | 3.5 | 3.5 | 3.5 | 3.5 | 3.5 | 3.5 | 3.5 | 3.5 | 3.5 | |||||||||||||||||||||||||||
Implied Equity Value | $ | 409.0 | $ | 394.2 | $ | 381.1 | $ | 446.6 | $ | 427.9 | $ | 411.5 | $ | 484.1 | $ | 461.7 | $ | 441.9 | ||||||||||||||||||
Shares Outstanding | 14.132 | 14.132 | 14.132 | 14.132 | 14.132 | 14.132 | 14.132 | 14.132 | 14.132 | |||||||||||||||||||||||||||
Implied Value per share(c) | $ | 28.94 | $ | 27.89 | $ | 26.97 | $ | 31.60 | $ | 30.28 | $ | 29.12 | $ | 34.26 | $ | 32.67 | $ | 31.27 | ||||||||||||||||||
Premium / (Discount) to Current Share Price | (2.2 | )% | (5.8 | )% | (8.9 | )% | 6.8 | % | 2.3 | % | (1.6 | )% | 15.7 | % | 10.4 | % | 5.6 | % | ||||||||||||||||||
Implied 2006E EBITDA Multiple | 8.1 | x | 7.8 | x | 7.7 | x | 8.6 | x | 8.3 | x | 8.1 | x | 9.1 | x | 8.8 | x | 8.5 | x |
| (a) | Assumes the elimination of $2 million in annual public company expenses. |
| (b) | Estimated as of December 31, 2006 as per WOLFPACK management. |
| (c) | Assumes WOLFPACK closing stock price of $29.60 on November 10, 2006. |
| 45 | |
Growth and Margin Sensitivity – LBO Analysis
| • | Assumes an Internal Rate of Return of 17.5% |
| • | Assumes an Exit Multiple of 8.75x FY 2011E EBITDA |
| 46 | |
Appendices
| 47 | |
A. Summary Ownership and Trading Information
| 48 | |
| 49 | ||
Ownership Profile
| Ownership by Major Classification | |||||||
| Shares (‘000) | % Ownership |
| |||||
Insiders: | |||||||
Lonnie C. Poole, Jr. | 3,641 | 26.0 | % | ||||
Jim W. Perry | 1,408 | 10.0 | % | ||||
Lonnie C. Poole, III | 1,179 | 8.4 | % | ||||
J. Scott Poole | 699 | 5.0 | % | ||||
D. Stephen Grissom | 30 | 0.2 | % | ||||
Harry M. Habets | 29 | 0.2 | % | ||||
Other Insiders | 49 | 0.3 | % | ||||
Total Insiders | 7,035 | 50.2 | % | ||||
Institutional Ownership: | |||||||
Dimensional Fund Advisors, Inc. | 989 | 7.0 | % | ||||
Farley Capital L.P. | 570 | 4.1 | % | ||||
Cadence Capital Management LLC. | 564 | 4.0 | % | ||||
Fairview Capital Investment Management LLC | 488 | 3.5 | % | ||||
Barclays Global Investors | 334 | 2.4 | % | ||||
Axa Rosenberg Investment Management LLC | 315 | 2.2 | % | ||||
Corbyn Investment Management Inc. | 175 | 1.2 | % | ||||
River Road Asset Management | 213 | 1.5 | % | ||||
Reich & Tang Asset Management LLC | 144 | 1.0 | % | ||||
Bridgeway Cpaital Management | 131 | 0.9 | % | ||||
Other Institutional Owners | 1,092 | 7.8 | % | ||||
Total Institutional | 5,015 | 35.8 | % | ||||
Other Ownership | 1,975 | 14.1 | % | ||||
Total Fully Diluted Shares | 14,025 | 100.0 | % |
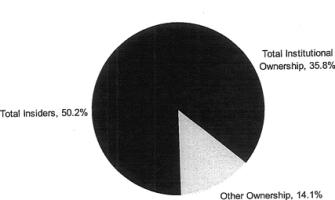
Source: Company filings as of May 27, 2006.
| 50 | |
Ownership Basis Analysis(a)
| For the Quarter Ended | For the Last Seven Quarters | ||||||||||||||||||||||||||||||||||||||
| 12/31/04 | 3/31/05 | 6/30/05 | 9/30/05 | 12/31/05 | 3/31/06 | 6/30/06 | Shares Purchase | Average Purchase Price | Net Change in Position | Total Holdings (c) | |||||||||||||||||||||||||||||
Estimated Purchase Price (b) | $ | 11.40 | $ | 13.36 | $ | 13.99 | $ | 13.47 | $ | 13.71 | $ | 16.29 | $ | 19.69 | |||||||||||||||||||||||||
Dimensional Fund Advisors, Inc. | |||||||||||||||||||||||||||||||||||||||
Shares Purchased | 0 | 16,802 | 500 | 29,595 | 77,978 | 76,513 | (63,939 | ) | 201,388 | $ | 14.62 | 137,449 | 988,549 | ||||||||||||||||||||||||||
% of Current Total Holdings | 0.0 | % | 1.7 | % | 0.1 | % | 3.0 | % | 7.9 | % | 7.7 | % | (6.5 | )% | 20.4 | % | 13.9 | % | |||||||||||||||||||||
Farley Capital, L.P. | |||||||||||||||||||||||||||||||||||||||
Shares Purchased | 675,300 | 0 | 0 | 0 | 369,081 | (473,900 | ) | 0 | 1,044,381 | 12.21 | 570,481 | 570,481 | |||||||||||||||||||||||||||
% of Current Total Holdings | 118.4 | % | 0.0 | % | 0.0 | % | 0.0 | % | 64.7 | % | (83.1 | )% | 0.0 | % | 183.1 | % | 100.0 | % | |||||||||||||||||||||
Cadence Capital Management, LLC | |||||||||||||||||||||||||||||||||||||||
Shares Purchased | 0 | 0 | 0 | 0 | 286,685 | 276,860 | 0 | 563,545 | 14.97 | 563,545 | 563,545 | ||||||||||||||||||||||||||||
% of Current Total Holdings | 0.0 | % | 0.0 | % | 0.0 | % | 0.0 | % | 50.9 | % | 49.1 | % | 0.0 | % | 100.0 | % | 100.0 | % | |||||||||||||||||||||
Fairview Capital Investment Mgmt., L.L.C. | |||||||||||||||||||||||||||||||||||||||
Shares Purchased | 52,610 | (5,497 | ) | 103,787 | 39,193 | 19,383 | 29,218 | 0 | 244,191 | 13.60 | 238,694 | 488,289 | |||||||||||||||||||||||||||
% of Current Total Holdings | 10.8 | % | (1.1 | )% | 21.3 | % | 8.0 | % | 4.0 | % | 6.0 | % | 0.0 | % | 50.0 | % | 48.9 | % | |||||||||||||||||||||
Barclays Global Investors, N.A. | |||||||||||||||||||||||||||||||||||||||
Shares Purchased | 10,861 | 84,583 | (1,827 | ) | 973 | 23,857 | 160,637 | 0 | 280,911 | 14.99 | 279,084 | 334,274 | |||||||||||||||||||||||||||
% of Current Total Holdings | 3.2 | % | 25.3 | % | (0.5 | )% | 0.3 | % | 7.1 | % | 48.1 | % | 0.0 | % | 84.0 | % | 83.5 | % | |||||||||||||||||||||
AXA Rosenberg Investment Management LLC | |||||||||||||||||||||||||||||||||||||||
Shares Purchased | 16,645 | 17,600 | 3,280 | 27,343 | 39,129 | 39,189 | 0 | 143,186 | 14.06 | 143,186 | 314,890 | ||||||||||||||||||||||||||||
% of Current Total Holdings | 5.3 | % | 5.6 | % | 1.0 | % | 8.7 | % | 12.4 | % | 12.4 | % | 0.0 | % | 45.5 | % | 45.5 | % | |||||||||||||||||||||
River Road Asset Management, LLC | |||||||||||||||||||||||||||||||||||||||
Shares Purchased | 0 | 0 | 0 | 25,910 | 1,800 | 137,536 | 47,930 | 213,176 | 16.69 | 213,186 | 213,176 | ||||||||||||||||||||||||||||
% of Current Total Holdings | 0.0 | % | 0.0 | % | 0.0 | % | 12.2 | % | 0.8 | % | 64.5 | % | 22.5 | % | 100.0 | % | 100.0 | % | |||||||||||||||||||||
Corbyn Investment Management, Inc. | |||||||||||||||||||||||||||||||||||||||
Shares Purchased | (59,550 | ) | (44,259 | ) | 0 | 0 | (475 | ) | (8,575 | ) | (925 | ) | 0 | NA | (113,784 | ) | 175,016 | ||||||||||||||||||||||
% of Current Total Holdings | (34.0 | )% | (25.3 | )% | 0.0 | % | 0.0 | % | (0.3 | )% | (4.9 | )% | (0.5 | )% | 0.0 | % | (65.0 | )% | |||||||||||||||||||||
Reich & Tang Asset Management, L.L.C. | |||||||||||||||||||||||||||||||||||||||
Shares Purchased | 13,100 | 30,400 | (145,800 | ) | (600 | ) | 6,000 | (48,500 | ) | 0 | 49,500 | 13 | (145,400 | ) | 143,500 | ||||||||||||||||||||||||
% of Current Total Holdings | 9.1 | % | 21.2 | % | (101.6 | )% | (0.4 | )% | 4.2 | % | (33.8 | )% | 0.0 | % | 34 5 | % | (101.3 | )% | |||||||||||||||||||||
Bridgeway Capital Management, Inc. | |||||||||||||||||||||||||||||||||||||||
Shares Purchased | 0 | 0 | 0 | 0 | 0 | 0 | 0 | 0 | NA | 0 | 130,900 | ||||||||||||||||||||||||||||
% of Current Total Holdings | 0.0 | % | 0.0 | % | 0.0 | % | 0.0 | % | 0.0 | % | 0.0 | % | 0.0 | % | 0.0 | % | 0.0 | % | |||||||||||||||||||||
Top 10 Institutional Holders | |||||||||||||||||||||||||||||||||||||||
Shares Purchased | 708,966 | 99,629 | (40,060 | ) | 122,414 | 823,438 | 188,978 | (16,934 | ) | 1,943,425 | $ | 13.08 | 1,886,431 | 3,922,620 | |||||||||||||||||||||||||
% of Current Total Holdings | 18.1 | % | 2.5 | % | (1.0 | )% | 3.1 | % | 21.0 | % | 4.8 | % | (0.4 | )% | 49.5 | % | 48.1 | % | |||||||||||||||||||||
| Total Shares Outstanding |
| 14,025,000 | ||||||||||||||||||||||||||||||||||||
| (a) | Historical data per Thomson One dated November 1, 2006. |
| (b) | Based on quarterly average of closing stock prices. |
| (c) | As of November 1, 2006. |
| 51 | |
B. Summary Pro Forma Financials
| 52 | |
Illustrative Financial Statements
Dividend Increase - Assumes an increase of annual dividends paid to $0.50 / share
($ in millions)
Fiscal Year Ended December 31, | Historical(a) | Projected(b) | CAGR | ||||||||||||||||||||||||||||||||||||
| 2004 | 2005 | LTM | 2006(d) | 2007 | 2008(e) | 2009 | 2010 | 2011 | 2006-2011 | ||||||||||||||||||||||||||||||
Revenue(c) | $ | 285.9 | $ | 310.6 | $ | 331.6 | $ | 328.5 | $ | 343.0 | $ | 370.2 | $ | 392.1 | $ | 414.6 | $ | 437.6 | 5.9 | % | |||||||||||||||||||
% Growth | — | 8.7 | % | — | 5.8 | % | 4.4 | % | 7.9 | % | 5.9 | % | 5.7 | % | 5.6 | % | |||||||||||||||||||||||
EBITDA | 54.4 | 59.4 | 69.4 | 70.1 | 75.3 | 82.8 | 88.0 | 93.3 | 98.8 | 7.1 | % | ||||||||||||||||||||||||||||
% of Revenue | 19.0 | % | 19.1 | % | 20.9 | % | 21.3 | % | 21.9 | % | 22.4 | % | 22.4 | % | 22.5 | % | 22.6 | % | |||||||||||||||||||||
EBIT | 25.1 | 28.9 | 37.1 | 37.8 | 41.7 | 45.9 | 49.1 | 52.5 | 55.9 | 8.2 | % | ||||||||||||||||||||||||||||
% of Revenue | 8.8 | % | 9.3 | % | 11.2 | % | 11.5 | % | 12.2 | % | 12.4 | % | 12.5 | % | 12.7 | % | 12.8 | % | |||||||||||||||||||||
Net Income | 9.9 | 11.6 | 15.8 | 17.0 | 17.6 | 19.9 | 21.9 | 24.1 | 26.4 | 9.2 | % | ||||||||||||||||||||||||||||
% Growth | — | 16.7 | % | — | 47.1 | % | 3.8 | % | 12.8 | % | 10.2 | % | 9.9 | % | 9.7 | % | |||||||||||||||||||||||
EPS | $ | 0.72 | $ | 0.84 | $ | 1.13 | $ | 1.20 | $ | 1.25 | $ | 1.41 | $ | 1.55 | $ | 1.71 | $ | 1.87 | 9.2 | % | |||||||||||||||||||
% Growth | — | 15.4 | % | — | 43.9 | % | 3.8 | % | 12.8 | % | 10.2 | % | 9.9 | % | 9.7 | % | |||||||||||||||||||||||
Selected Balance Sheet Items: | |||||||||||||||||||||||||||||||||||||||
Cash & Cash Equivalents | $ | 2.4 | $ | 1.6 | $ | 1.8 | $ | 3.5 | $ | 3.5 | $ | 3.5 | $ | 3.5 | $ | 3.5 | $ | 3.5 | |||||||||||||||||||||
Total Debt | 156.7 | 165.9 | 160.9 | 159.2 | 171.2 | 171.4 | 170.3 | 168.1 | 162.6 | ||||||||||||||||||||||||||||||
Shareholders’ Equity | 117.7 | 129.5 | 141.6 | 144.0 | 154.6 | 167.6 | 182.5 | 199.7 | 219.1 | ||||||||||||||||||||||||||||||
Total Capital | 274.4 | 295.4 | 302.6 | 303.2 | 325.8 | 338.9 | 352.8 | 367.8 | 381.7 | ||||||||||||||||||||||||||||||
Selected Financial Metrics: | |||||||||||||||||||||||||||||||||||||||
Total Debt / EBITDA | 2.9 | x | 2.8 | x | 2.3 | x | 2.3 | x | 2.3 | x | 2.1 | x | 1.9 | x | 1.8 | x | 1.6 | x | |||||||||||||||||||||
Total Debt / Capitalization | 57.1 | % | 56.2 | % | 53.2 | % | 52.5 | % | 52.5 | % | 50.6 | % | 48.3 | % | 45.7 | % | 42.6 | % | |||||||||||||||||||||
EBITDA / Interest Expense | 5.5 | x | 6.0 | x | 7.2 | x | 7.2 | x | 5.6 | x | 5.9 | x | 6.3 | x | 6.8 | x | 7.3 | x | |||||||||||||||||||||
Dividend Payout Ratio | 21.8 | % | 28.5 | % | 31.6 | % | 31.2 | % | 39.5 | % | 35.0 | % | 31.8 | % | 28.9 | % | 26.4 | % | |||||||||||||||||||||
| (a) | As per Company Form 10-K dated December 31, 2005 and 10-Q dated 6/30/06. Normalized to exclude non-recurring items. |
| (b) | Projections as per WOLFPACK Management and BAS estimates. |
| (c) | 2007 - 2011 include incremental revenue from acquisitions. |
| (d) | Excludes the gain from sale of Old Kings Road. |
| (e) | Assumes $6 million of incremental revenue and $2.5 million of incremental EBITDA in 2008 due to Wake County Landfill. |
| 53 | |
Illustrative Financial Statements
Share Repurchase- Assumes repurchase of 1.25 million shares at $33.00 per share and $1.0 million of Fees & Expenses
($ in millions)
Fiscal Year Ended December 31, | Historical(a) | Projected (b) | CAGR | ||||||||||||||||||||||||||||||||||||
| 2004 | 2005 | LTM | 2006(d) | 2007 | 2008(e) | 2009 | 2010 | 2011 | 2006-2011 | ||||||||||||||||||||||||||||||
Revenue(c) | $ | 285.9 | $ | 310.6 | $ | 331.6 | $ | 328.5 | $ | 343.0 | $ | 370.2 | $ | 392.1 | $ | 414.6 | $ | 437.6 | 5.9 | % | |||||||||||||||||||
% Growth | — | 8.7 | % | — | 5.8 | % | 4.4 | % | 7.9 | % | 5.9 | % | 5.7 | % | 5.6 | % | |||||||||||||||||||||||
EBITDA | 54.4 | 59.4 | 69.4 | 70.1 | 75.3 | 82.8 | 88.0 | 93.3 | 98.8 | 7.1 | % | ||||||||||||||||||||||||||||
% of Revenue | 19.0 | % | 19.1 | % | 20.9 | % | 21.3 | % | 21.9 | % | 22.4 | % | 22.4 | % | 22.5 | % | 22.6 | % | |||||||||||||||||||||
EBIT | 25.1 | 28.9 | 37.1 | 37.8 | 41.7 | 45.9 | 49.1 | 52.5 | 55.9 | 8.2 | % | ||||||||||||||||||||||||||||
% of Revenue | 8.8 | % | 9.3 | % | 11.2 | % | 11.5 | % | 12.2 | % | 12.4 | % | 12.5 | % | 12.7 | % | 12.8 | % | |||||||||||||||||||||
Net Income | 9.9 | 11.6 | 15.8 | 17.0 | 15.5 | 17.7 | 19.8 | 21.9 | 24.2 | 7.4 | % | ||||||||||||||||||||||||||||
% Growth | — | 16.7 | % | — | 47.1 | % | (9.0 | )% | 14.6 | % | 11.4 | % | 10.9 | % | 10.7 | % | |||||||||||||||||||||||
EPS | $ | 0.72 | $ | 0.84 | $ | 1.13 | $ | 1.20 | $ | 1.22 | $ | 1.40 | $ | 1.56 | $ | 1.73 | $ | 1.92 | 9.8 | % | |||||||||||||||||||
% Growth | — | 15.4 | % | — | 43.9 | % | 1.8 | % | 14.6 | % | 11.4 | % | 10.9 | % | 10.7 | % | |||||||||||||||||||||||
Selected Balance Sheet Items: | |||||||||||||||||||||||||||||||||||||||
Cash & Cash Equivalents | $ | 2.4 | $ | 1.6 | $ | 1.8 | $ | 3.5 | $ | 3.5 | $ | 3.5 | $ | 3.5 | $ | 3.5 | $ | 3.5 | |||||||||||||||||||||
Total Debt | 156.7 | 165.9 | 160.9 | 201.5 | 213.6 | 213.8 | 212.9 | 210.8 | 205.5 | ||||||||||||||||||||||||||||||
Shareholders’ Equity | 117.7 | 129.5 | 141.6 | 102.7 | 113.2 | 126.0 | 140.7 | 157.7 | 176.9 | ||||||||||||||||||||||||||||||
Total Capital | 274.4 | 295.4 | 302.6 | 304.2 | 326.8 | 339.8 | 353.6 | 368.5 | 382.4 | ||||||||||||||||||||||||||||||
Selected Financial Metrics: | |||||||||||||||||||||||||||||||||||||||
Total Debt / EBITDA | 2.9 | x | 2.8 | x | 2.3 | x | 2.9 | x | 2.8 | x | 2.6 | x | 2.4 | x | 2.3 | x | 2.1 | x | |||||||||||||||||||||
Total Debt / Capitalization | 57.1 | % | 56.2 | % | 53.2 | % | 66.2 | % | 65.4 | % | 62.9 | % | 60.2 | % | 57.2 | % | 53.7 | % | |||||||||||||||||||||
EBITDA / Interest Expense | 5.5 | x | 6.0 | x | 7.2 | x | 7.2 | x | 4.5 | x | 4.8 | x | 5.1 | x | 5.4 | x | 5.8 | x | |||||||||||||||||||||
Dividend Payout Ratio | 21.8 | % | 28.5 | % | 31.6 | % | 31.2 | % | 32.2 | % | 28.1 | % | 25.2 | % | 22.7 | % | 20.5 | % | |||||||||||||||||||||
| (a) | As per Company Form 10-K dated December 31, 2005 and 10-Q dated 6/30/06. Normalized to exclude non-recurring items. |
| (b) | Projections as per WOLFPACK Management and BAS estimates. |
| (c) | 2007 – 2011 include incremental revenue from acquisitions. |
| (d) | Excludes the gain from sale of Old Kings Road. |
| (e) | Assumes $6 million of incremental revenue and $2.5 million of incremental EBITDA in 2008 due to Wake County Landfill. |
| 54 | |
Illustrative Financial Statements
One Time Dividend - Assumes One-Time Dividend of $3.00 per share and $1.0 million of Fees & Expenses
($ in millions)
| Fiscal Year Ended December 31, | Historical(a) | Projected 3(b) | CAGR | ||||||||||||||||||||||||||||||||||||
| 2004 | 2005 | LTM | 2006(d) | 2007 | 2008(e) | 2009 | 2010 | 2011 | 2006-2011 | ||||||||||||||||||||||||||||||
Revenue(c) | $ | 285.9 | $ | 310.6 | $ | 331.6 | $ | 328.5 | $ | 343.0 | $ | 370.2 | $ | 392.1 | $ | 414.6 | $ | 437.6 | 5.9 | % | |||||||||||||||||||
% Growth | — | 8.7 | % | — | 5.8 | % | 4.4 | % | 7.9 | % | 5.9 | % | 5.7 | % | 5.6 | % | |||||||||||||||||||||||
EBITDA | 54.4 | 59.4 | 69.4 | 70.1 | 75.3 | 82.8 | 88.0 | 93.3 | 98.8 | 7.1 | % | ||||||||||||||||||||||||||||
% of Revenue | 19.0 | % | 19.1 | % | 20.9 | % | 21.3 | % | 21.9 | % | 22.4 | % | 22.4 | % | 22.5 | % | 22.6 | % | |||||||||||||||||||||
EBIT | 25.1 | 28.9 | 37.1 | 37.8 | 41.7 | 45.9 | 49.1 | 52.5 | 55.9 | 8.2 | % | ||||||||||||||||||||||||||||
% of Revenue | 8.8 | % | 9.3 | % | 11.2 | % | 11.5 | % | 12.2 | % | 12.4 | % | 12.5 | % | 12.7 | % | 12.8 | % | |||||||||||||||||||||
Net Income | 9.9 | 11.6 | 15.8 | 17.0 | 15.4 | 17.7 | 19.7 | 21.8 | 24.1 | 7.2 | % | ||||||||||||||||||||||||||||
% Growth | — | 16.7 | % | — | 47.1 | % | (9.1 | )% | 14.4 | % | 11.3 | % | 10.8 | % | 10.6 | % | |||||||||||||||||||||||
EPS | $ | 0.72 | $ | 0.84 | $ | 1.13 | $ | 1.20 | $ | 1.09 | $ | 1.25 | $ | 1.39 | $ | 1.54 | $ | 1 .70 | 7.2 | % | |||||||||||||||||||
% Growth | — | 15.4 | % | — | 43.9 | % | (9.1 | )% | 14.4 | % | 11.3 | % | 10.8 | % | 10.6 | % | |||||||||||||||||||||||
Selected Balance Sheet Items: | |||||||||||||||||||||||||||||||||||||||
Cash & Cash Equivalents | $ | 2.4 | $ | 1.6 | $ | 1.8 | $ | 3.5 | $ | 3.5 | $ | 3.5 | $ | 3.5 | $ | 3.5 | $ | 3.5 | |||||||||||||||||||||
Total Debt | 156.7 | 165.9 | 160.9 | 201.6 | 214.3 | 215.3 | 215.0 | 213.7 | 209.1 | ||||||||||||||||||||||||||||||
Shareholders’ Equity | 117.7 | 129.5 | 141.6 | 102.6 | 112.4 | 124.5 | 138.6 | 154.8 | 173.3 | ||||||||||||||||||||||||||||||
Total Capital | 274.4 | 295.4 | 302.6 | 304.2 | 326.8 | 339.8 | 353.6 | 368.5 | 382.4 | ||||||||||||||||||||||||||||||
Selected Financial Metrics: | |||||||||||||||||||||||||||||||||||||||
Total Debt / EBITDA | 2.9 | x | 2.8 | x | 2.3 | x | 2.9 | x | 2.8 | x | 2.6 | x | 2.4 | x | 2.3 | x | 2.1 | x | |||||||||||||||||||||
Total Debt / Capitalization | 57.1 | % | 56.2 | % | 53.2 | % | 66.3 | % | 65.6 | % | 63.4 | % | 60.8 | % | 58.0 | % | 54.7 | % | |||||||||||||||||||||
EBITDA / Interest Expense | 5.5 | x | 6.0 | x | 7.2 | x | 7.2 | x | 4.5 | x | 4.7 | x | 5.0 | x | 5.4 | x | 5.7 | x | |||||||||||||||||||||
Dividend Payout Ratio | 21.8 | % | 28.5 | % | 31.6 | % | 31.2 | % | 36.1 | % | 31.6 | % | 28.4 | % | 25.6 | % | 23.2 | % | |||||||||||||||||||||
| (a) | As per Company Form 10-K dated December 31, 2005 and 10-Q dated 6/30/06. Normalized to exclude non-recurring items. |
| (b) | Projections as per WOLFPACK Management and BAS estimates. |
| (c) | 2007 - 2011 include incremental revenue from acquisitions. |
| (d) | Excludes the gain from sale of Old Kings Road. |
| (e) | Assumes $6 million of incremental revenue and $2.5 million of incremental EBITDA in 2008 due to Wake County Landfill. |
| 55 | |
Illustrative Financial Statements
Follow On Offering – Assumes a $75 million Follow On Offering ($37.5 million of Primary and $37.5 Million of Secondary)
($ in millions)
| Fiscal Year Ended December 31, | Historical(a) | Projected(b) | CAGR | ||||||||||||||||||||||||||||||||||||
| 2004 | 2005 | LTM | 2006(d) | 2007 | 2008(e) | 2009 | 2010 | 2011 | 2006-2011 | ||||||||||||||||||||||||||||||
Revenue(c) | $ | 285.9 | $ | 310.6 | $ | 331.6 | $ | 328.5 | $ | 343.0 | $ | 370.2 | $ | 392.1 | $ | 414.6 | $ | 437.6 | 5.9 | % | |||||||||||||||||||
% Growth | — | 8.7 | % | — | 5.8 | % | 4.4 | % | 7.9 | % | 5.9 | % | 5.7 | % | 5.6 | % | |||||||||||||||||||||||
EBITDA | 54.4 | 59.4 | 69.4 | 70.1 | 75.3 | 82.8 | 88.0 | 93.3 | 98.8 | 7.1 | % | ||||||||||||||||||||||||||||
% of Revenue | 19.0 | % | 19.1 | % | 20.9 | % | 21.3 | % | 21.9 | % | 22.4 | % | 22.4 | % | 22.5 | % | 22.6 | % | |||||||||||||||||||||
EBIT | 25.1 | 28.9 | 37.1 | 37.8 | 41.7 | 45.9 | 49.1 | 52.5 | 55.9 | 8.2 | % | ||||||||||||||||||||||||||||
% of Revenue | 8.8 | % | 9.3 | % | 11.2 | % | 11.5 | % | 12.2 | % | 12.4 | % | 12.5 | % | 12.7 | % | 12.8 | % | |||||||||||||||||||||
Net Income | 9.9 | 11.6 | 15.8 | 17.0 | 19.3 | 21.7 | 23.9 | 26.2 | 28.7 | 11.0 | % | ||||||||||||||||||||||||||||
% Growth | — | 16.7 | % | — | 47.1 | % | 13.5 | % | 12.4 | % | 10.0 | % | 9.7 | % | 9.5 | % | |||||||||||||||||||||||
EPS | $ | 0.72 | $ | 0.84 | $ | 1.13 | $ | 1.20 | $ | 1.25 | $ | 1.40 | $ | 1.54 | $ | 1.69 | $ | 1.86 | 9.1 | % | |||||||||||||||||||
% Growth | — | 15.4 | % | — | 43.9 | % | 3.9 | % | 12.4 | % | 10.0 | % | 9.7 | % | 9.5 | % | |||||||||||||||||||||||
Selected Balance Sheet Items: | |||||||||||||||||||||||||||||||||||||||
Cash & Cash Equivalents | $ | 2.4 | $ | 1.6 | $ | 1.8 | $ | 3.5 | $ | 3.5 | $ | 3.5 | $ | 3.5 | $ | 3.5 | $ | 3.5 | |||||||||||||||||||||
Total Debt | 156.7 | 165.9 | 160.9 | 127.7 | 137.2 | 134.7 | 130.8 | 125.7 | 117.1 | ||||||||||||||||||||||||||||||
Shareholders’ Equity | 117.7 | 129.5 | 141.6 | 175.5 | 188.7 | 204.2 | 222.0 | 242.1 | 264.6 | ||||||||||||||||||||||||||||||
Total Capital | 274.4 | 295.4 | 302.6 | 303.2 | 325.8 | 338.9 | 352.8 | 367.8 | 381.7 | ||||||||||||||||||||||||||||||
Selected Financial Metrics: | |||||||||||||||||||||||||||||||||||||||
Total Debt / EBITDA | 2.9 | x | 2.8 | x | 2.3 | x | 1.8 | x | 1.8 | x | 1.6 | x | 1.5 | x | 1.3 | x | 1.2 | x | |||||||||||||||||||||
Total Debt / Capitalization | 57.1 | % | 56.2 | % | 53.2 | % | 42.1 | % | 42.1 | % | 39.7 | % | 37.1 | % | 34.2 | % | 30.7 | % | |||||||||||||||||||||
EBITDA / Interest Expense | 5.5 | x | 6.0 | x | 7.2 | x | 7.2 | x | 7.0 | x | 7.5 | x | 8.2 | x | 8.9 | x | 10.0 | x | |||||||||||||||||||||
Dividend Payout Ratio | 21.8 | % | 28.5 | % | 31.6 | % | 31.2 | % | 31.6 | % | 28.1 | % | 25.6 | % | 23.3 | % | 21.3 | % | |||||||||||||||||||||
Note: Analysis assumes a file to offer discount of 5%
| (a) | As per Company Form 10-K dated December 31, 2005 and 10-Q dated 6/30/06. Normalized to exclude non-recurring items. |
| (b) | Projections as per WOLFPACK Management and BAS estimates. |
| (c) | 2007 – 2011 include incremental revenue from acquisitions. |
| (d) | Excludes the gain from sale of Old Kings Road. |
| (e) | Assumes $6 million of incremental revenue and $2.5 million of incremental EBITDA in 2008 due to Wake County Landfill. |
| 56 | |
C. Detailed Comparable Company Analysis
| 57 | |
Detailed Comparable Company Analysis
Trading Multiples and Statistics
($ in millions)
| Enterprise Value as a Multiple of: | Equity Book Value | Stock Price(a)as a Multiple of EPS | |||||||||||||||||||||||||||||||||||||||||||||||||
| Equity | Enterprise | Revenues | EBITDA | EBIT | PEG | Dividend | |||||||||||||||||||||||||||||||||||||||||||||
Company | Value(a)(b) | Value(c) | LTM | 2006E | 2007P | LTM | 2006E | 2007P | LTM | 2006E | 2007P | LTM | 2006E | 2007P | Ratio | Yield(a) | |||||||||||||||||||||||||||||||||||
Solid Waste Management Companies | |||||||||||||||||||||||||||||||||||||||||||||||||||
Allied Waste Industries, Inc | $ | 4,942.7 | $ | 12,658.0 | 2.14 | x | 2.08 | x | 2.00 | x | 8.7 | x | 8.3 | x | 7.9 | x | 14.3 | x | 13.4 | x | 12.7 | x | 1.69 | x | 35.7 | x | 25.3 | x | 21.6 | x | 1.8 | x | 0.0 | % | |||||||||||||||||
Casella Waste Systems | 298.7 | 826.3 | 1.54 | 1.54 | 1.49 | 8.0 | 7.6 | 7.2 | 22.6 | 21.8 | 21.9 | 1.99 | 82.3 | 101.4 | 69.9 | 5.6 | 0.0 | % | |||||||||||||||||||||||||||||||||
Republic Services Inc | 5,816.4 | 7,447.7 | 2.49 | 2.42 | 2.31 | 9.5 | 9.2 | 8.9 | 15.1 | 14.7 | 14.8 | 3.98 | 22.8 | 20.9 | 19.2 | 1.8 | 1.5 | % | |||||||||||||||||||||||||||||||||
Waste Connections | 1 ,921.3 | 2,586.9 | 3.23 | 3.13 | 2.82 | 10.7 | 10.6 | 9.4 | 15.4 | 15.3 | 13.5 | 2.72 | 23.2 | 23.5 | 19.9 | 1.4 | 0.0 | % | |||||||||||||||||||||||||||||||||
Waste Management Inc. | 21,004.5 | 29,188.5 | 2.17 | 2.16 | 2.10 | 8.6 | 8.4 | 8.1 | 14.2 | 13.9 | 13.2 | 3.41 | 20.3 | 21.3 | 19.4 | 1.9 | 2.3 | % | |||||||||||||||||||||||||||||||||
Waste Services, Inc. | 374.0 | 788.2 | 1.92 | 1.90 | 1.76 | 11.3 | 11.4 | 8.3 | NM | NM | 16.6 | 1.43 | NM | NM | NM | NM | 0.0 | % | |||||||||||||||||||||||||||||||||
Average | $ | 5,726.3 | $ | 8,915.9 | 2.25 | x | 2.21 | x | 2.08 | x | 9.5 | x | 9.2 | x | 8.3 | x | 16.3 | x | 15.8 | x | 15.5 | x | 2.53 | x | 36.9 | x | 38.5 | x | 30.0 | x | 2.5 | x | 0.6 | % | |||||||||||||||||
Median | 3,432.0 | 5,017.3 | 2.15 | 2.12 | 2.05 | 9.1 | 8.8 | 8.2 | 15.1 | 14.7 | 14.1 | 2.35 | 23.2 | 23.5 | 19.9 | 1.8 | 0.0 | % | |||||||||||||||||||||||||||||||||
WOLFPACK | $ | 418.3 | $ | 577.5 | 1.74 | x | 1.76 | x | 1.68 | x | 8.3 | x | 8.2 | x | 7.7 | x | 15.6 | x | 15.3 | x | 13.8 | x | 2.95 | x | 26.1 | x | 24.6 | x | 23.7 | x | NM | 1.4 | % | ||||||||||||||||||
Notes
| * | Outliers excluded from Summary Multiples and Statistics. |
Note: Fiscal years ending between October 31 and February 28 not calendarized. All other data calendarized to conform to December 31 fiscal year end.
| (a) | Based on closing stock prices on November 10, 2006. |
| (b) | Assumes in-the-money exercisable options are exercised and proceeds from such exercise are used to repurchase common stock at the market price (treasury method). |
In certain cases, also assumes the conversion of significantly in-the-money convertible debt and preferred issues.
| (c) | Calculated as Equity Value plus total debt, minority interest (at book value unless otherwise noted) and preferred stock, less cash & equivalents. |
| 58 | |
Detailed Comparable Company Analysis
Financial Margins and Growth Rates
| Gross Profit Margin | EBITDA Margin | EBIT Margin | Net Income Margin | Projected CAGR(a) 2005 - 2007P | Historical EPS Growth(b) | Projected EPS Growth(a) | ||||||||||||||||||||||||||||||||||||||||||||||||
Company | LTM | 2006E | 2007P | LTM | 2006E | 2007P | LTM | 2006E | 2007P | LTM | 2006E | 2007P | Revenues | EBITDA | EBIT | Net Inc. | ||||||||||||||||||||||||||||||||||||||
Solid Waste Management Companies | ||||||||||||||||||||||||||||||||||||||||||||||||||||||
Allied Waste Industries, Inc | 34.8 | % | 34.8 | % | 34.9 | % | 24.6 | % | 25.2 | % | 25.3 | % | 15.0 | % | 15.5 | % | 15.7 | % | 2.2 | % | 3.1 | % | 4.0 | % | 5.2 | % | 5.3 | % | 5.5 | % | 35.3 | % | (10.8 | )% | 12.3 | % | ||||||||||||||||||
Casella Waste Systems | 33.3 | % | 33.4 | % | 33.3 | % | 19.1 | % | 20.2 | % | 20.6 | % | 6.8 | % | 7.1 | % | 6.8 | % | 0.7 | % | 0.5 | % | 0.8 | % | 3.5 | % | 5.7 | % | (2.5 | )% | (2.7 | )% | (1.0 | )% | 12.5 | % | ||||||||||||||||||
Republic Services Inc | 36.9 | % | 37.0 | % | 36.5 | % | 26.4 | % | 26.4 | % | 25.8 | % | 16.5 | % | 16.5 | % | 15.6 | % | 8.8 | % | 8.9 | % | 8.4 | % | 6.2 | % | 4.8 | % | 2.5 | % | 3.0 | % | 8.8 | % | 10.7 | % | ||||||||||||||||||
Waste Connections | 40.2 | % | 39.7 | % | 40.0 | % | 30.2 | % | 29.7 | % | 30.2 | % | 21.0 | % | 20.4 | % | 20.9 | % | 10.2 | % | 9.8 | % | 10.2 | % | 12.7 | % | 8.6 | % | 6.4 | % | 3.4 | % | 11.6 | % | 13.8 | % | ||||||||||||||||||
Waste Management Inc. | 35.4 | % | 35.7 | % | 36.0 | % | 25.2 | % | 25.6 | % | 25.9 | % | 15.3 | % | 15.5 | % | 15.9 | % | 7.8 | % | 7.3 | % | 7.6 | % | 3.0 | % | 6.6 | % | 9.9 | % | 10.6 | % | 6.7 | % | 10.0 | % | ||||||||||||||||||
Waste Services, Inc. | 30.2 | % | 27.7 | % | 27.7 | % | 17.0 | % | 16.7 | % | 21.1 | % | 6.3 | % | 6.2 | % | 10.6 | % | (10.0 | )% | (6.4 | )% | NA | 8.1 | % | 29.9 | % | 91.2 | % | NA | (43.1 | )% | NA | |||||||||||||||||||||
Average | 35.1 | % | 34.7 | % | 34.7 | % | 23.8 | % | 23.9 | % | 24.8 | % | 13.5 | % | 13.5 | % | 14.3 | % | 3.3 | % | 3.9 | % | 6.2 | % | 6.5 | % | 10.1 | % | 18.9 | % | 9.9 | % | (4.6 | )% | 11.8 | % | ||||||||||||||||||
Median | 35.1 | % | 35.3 | % | 35.5 | % | 24.9 | % | 25.4 | % | 25.5 | % | 15.1 | % | 15.5 | % | 15.6 | % | 5.0 | % | 5.2 | % | 7.6 | % | 5.7 | % | 6.1 | % | 6.0 | % | 3.4 | % | 2.9 | % | 12.3 | % | ||||||||||||||||||
WOLFPACK | 34.3 | % | 34.6 | % | 35.2 | % | 20.9 | % | 21.3 | % | 21.9 | % | 11.2 | % | 11.5 | % | 12.2 | % | 4.8 | % | 5.2 | % | 5.2 | % | 5.1 | % | 12.6 | % | 20.2 | % | 23.7 | % | NA | NA | ||||||||||||||||||||
Notes
| * | Outliers excluded from Summary Margins & Growth Rates. |
Note: Fiscal years ending between October 31 and February 28 not calendarized ? all other data calendarized to conform to December 31 fiscal year end.
| (a) | Cumulative Average Growth Rate calculated based on growth from the company’s latest fiscal year results to the company’s projected fiscal results. |
| (b) | As per Bloomberg as of November 10, 2006. Growth rate of actual historical five year fiscal EPS growth. |
| (c) | As per First Call consensus estimates on November 10, 2006. Growth rate of projected five year fiscal year EPS growth. I/B/E/S consensus utilized if no First Call data available. |
| 59 | |
Detailed Comparable Company Analysis
Financial Results and Book Capitalization
($ In millions, except per share data)
| Revenue | EBITDA | EBIT | Net Income | Earnings Per Share | Cash & Equiv.(a) | Total Debt(b) | Book Value(c) | |||||||||||||||||||||||||||||||||||||||||||||||||
Company | LTM | 2006E | 2007P | LTM | 2006E | 2007P | LTM | 2006E | 2007P | LTM | 2006E | 2007P | LTM | 2006E | 2007P | |||||||||||||||||||||||||||||||||||||||||
Solid Waste Management Companies | ||||||||||||||||||||||||||||||||||||||||||||||||||||||||
Allied Waste Industries, Inc | $ | 5,924.2 | $ | 6,079.0 | $ | 6,342.0 | $ | 1,456.4 | $ | 1,529.0 | $ | 1,604.0 | $ | 887.4 | $ | 945.0 | $ | 995.0 | $ | 127.9 | $ | 189.9 | $ | 252.3 | $ | 0.37 | $ | 0.53 | $ | 0.62 | $ | 47.6 | $ | 7,182.1 | $ | 2,927.5 | ||||||||||||||||||||
Casella Waste Systems | 537.4 | 536.0 | 555.7 | 102.9 | 108.3 | 114.7 | 36.5 | 37.9 | 37.7 | 3.6 | 2.9 | 4.3 | 0.14 | 0.12 | 0.17 | 6.7 | 464.5 | 150.0 | ||||||||||||||||||||||||||||||||||||||
Republic Services Inc | 2,985.4 | 3,081.4 | 3,229.8 | 787.8 | 813.4 | 833.1 | 493.3 | 507.7 | 503.9 | 262.4 | 275.7 | 272.5 | 1.87 | 2.05 | 2.23 | 30.7 | 1,662.0 | 1,463.0 | ||||||||||||||||||||||||||||||||||||||
Waste Connections | 802.1 | 825.8 | 917.1 | 242.0 | 245.1 | 276.6 | 168.5 | 168.7 | 191.8 | 81.9 | 80.7 | 93.3 | 1.74 | 1.72 | 2.03 | 10.5 | 647.8 | 707.3 | ||||||||||||||||||||||||||||||||||||||
Waste Management Inc. | 13,452.0 | 13,536.0 | 13,876.0 | 3,396.0 | 3,459.0 | 3,598.0 | 2,058.0 | 2,103.0 | 2,209.0 | 1,043.3 | 985.4 | 1,056.4 | 1.90 | 1.81 | 1.98 | 746.0 | 8,642.0 | 6,160.0 | ||||||||||||||||||||||||||||||||||||||
Waste Services, Inc. | 411.2 | 414.1 | 447.3 | 70.0 | 69.1 | 94.4 | 26.0 | 25.7 | 47.4 | (41.1 | ) | (26.4 | ) | NA | -1.20 | -0.77 | 0.04 | 1.7 | 316.5 | 261.9 | ||||||||||||||||||||||||||||||||||||
Average | $ | 4,018.7 | $ | 4,078.7 | $ | 4,228.0 | $ | 1,009.2 | $ | 1,037.3 | $ | 1,086.8 | $ | 611.6 | $ | 631.3 | $ | 664.1 | $ | 246.3 | $ | 251.4 | $ | 335.8 | $ | 0.80 | $ | 0.91 | $ | 1.18 | $ | 140.5 | $ | 3,152.5 | $ | 1,945.0 | ||||||||||||||||||||
Median | 1,893.8 | 1,953.6 | 2,073.4 | 514.9 | 529.3 | 554.9 | 330.9 | 338.2 | 347.9 | 104.9 | 135.3 | 252.3 | 1.06 | 1.12 | 1.30 | 20.6 | 1,154.9 | 1,085.2 | ||||||||||||||||||||||||||||||||||||||
WOLFPACK | $ | 331.6 | $ | 328.5 | $ | 343.0 | $ | 69.4 | $ | 70.1 | $ | 75.3 | $ | 37.1 | $ | 37.8 | $ | 41.7 | $ | 15.8 | $ | 17.0 | $ | 17.7 | $ | 1.13 | $ | 1.20 | $ | 1.25 | $ | 1.8 | $ | 160.9 | $ | 141.6 | ||||||||||||||||||||
Notes
Note: Fiscal years ending between October 31 and February 28 not calendarized ? all other data calendarized to conform to December 31 fiscal year end.
Note: All financial results exclude extraordinary items, one time charges, accounting changes and discontinued operations. Please consult the Company’s public documents for more information.
| (a) | Includes cash, cash equivalents, short-term investments and investments in affiliates as noted on individual Company footnotes. |
| (b) | Includes debt, minority interest (at book value unless otherwise noted) and preferred stock. Convertible securities that are not significantly in-the-money are included. |
| (c) | Book value less intangible assets including goodwill. |
| 60 | |
Detailed Comparable Company Analysis
Trading Performance and Other Statistics
($ in millions, except per share data)
| Credit Statistics | Returns | Sources | |||||||||||||||||||||||||||||||||||||||||||||
| Ticker | Stock Price 11/10/06 | Basic Shares(a) | Diluted Shares(b) | Equity Value | Enterprise Value | 52 Week Stats. | Projected Equity Beta (c) | Total Debt/ LTM EBITDA | Total Debt/ Total Book Cap. | Return on Assets | Return on Equity | Return on Invested Capital | Return on Tang. Invested Capital | Fiscal Year Ended | Latest 12 Months Ended | Projected Data as of: | |||||||||||||||||||||||||||||||
Company | High | — | Low | ||||||||||||||||||||||||||||||||||||||||||||
Solid Waste Management Companies | |||||||||||||||||||||||||||||||||||||||||||||||
Allied Waste Industries, Inc | AW | $ | 13.38 | 367.583 | 369.412 | 4,942.7 | 12,658.0 | $ | 14.38 | — | $ | 8.29 | 1.19 | 4.9 | x | 67.2 | % | 0.9 | % | 4.8 | % | 4.4 | % | 21.0 | % | 12/31/2005 | 6/30/2006 | 8/2/2006 | |||||||||||||||||||
Casella Waste Systems | CWST | 11.72 | 25.262 | 25.489 | 298.7 | 826.3 | 16.48 | — | 10.01 | 1.01 | 4.5 | 67.7 | % | 0.5 | % | 2.5 | % | 3.7 | % | 5.2 | % | 4/30/2006 | 7/31/2006 | 8/17/2006 | |||||||||||||||||||||||
Republic Services Inc | RSG | 42.82 | 131.850 | 135.834 | 5,816.4 | 7,447.7 | 44.21 | — | 34.90 | 0.58 | 2.1 | 53.2 | % | 5.9 | % | 16.7 | % | 8.8 | % | 16.2 | % | 12/31/2005 | 6/30/2006 | 7/27/2006 | |||||||||||||||||||||||
Waste Connections | WCN | 40.43 | 45.491 | 47.522 | 1,921.3 | 2,586.9 | 41.92 | — | 33.32 | 0.59 | 2.7 | 46.8 | % | 4.8 | % | 11.5 | % | 7.0 | % | 15.4 | % | 12/31/2005 | 9/30/2006 | 8/29/2006 | |||||||||||||||||||||||
Waste Management Inc. | WMI | 38.52 | 535.013 | 545.288 | 21,004.5 | 29,188.5 | 38.64 | — | 29.67 | 0.66 | 2.5 | 57.3 | % | 5.0 | % | 17.0 | % | 9.1 | % | 14.1 | % | 12/31/2005 | 9/30/2006 | 10/26/2006 | |||||||||||||||||||||||
Waste Services, Inc. | WSII | 10.24 | 36.066 | 36.527 | 374.0 | 788.2 | 11.00 | — | 7.98 | 0.93 | 4.5 | 46.7 | % | NM | NM | 2.7 | % | 6.3 | % | 12/31/2005 | 9/30/2006 | NA | |||||||||||||||||||||||||
Average | $ | 26.19 | 190.211 | 193.345 | 5,726.3 | 8,915.9 | $ | 27.77 | — | $ | 20.70 | 0.83 | 3.5 | x | 56.5 | % | 3.4 | % | 10.5 | % | 5.9 | % | 13.0 | % | |||||||||||||||||||||||
Median | 25.95 | 88.670 | 91.678 | 3,432.0 | 5,017.3 | 27.56 | — | 19.84 | 0.80 | 3.6 | 55.2 | % | 4.8 | % | 11.5 | % | 5.7 | % | 14.8 | % | |||||||||||||||||||||||||||
WOLFPACK | $ | 29.60 | 13.943 | 14.132 | 418.3 | 577.5 | $ | 31.87 | — | $ | 12.80 | 0.73 | 2.3 | x | 53.2 | % | 4.3 | % | 6.2 | % | 5.5 | % | 8.4 | % | 12/31/2005 | 6/30/2006 | 3/2/2006 | ||||||||||||||||||||
Notes
Outliers excluded from Summary Trading Performance & Other Statistics.
| (a) | Primary shares as stated on the front cover of the Company’s latest financial statements, adjusted for any share splits or share dividends. |
| (b) | Calculated as primary shares adjusted assuming in-the-money exercisable options are exercised and proceeds from such exercise are used to repurchase common stock at the market price (treasury method). |
| (c) | Based on Barra’s projected beta as of November 10, 2006. |
| 61 | |