SECURITIES AND EXCHANGE COMMISSION
Washington, D.C. 20549
SCHEDULE 13E-3
RULE 13E-3 TRANSACTION STATEMENT UNDER SECTION 13(E) OF
THE SECURITIES EXCHANGE ACT OF 1934
NTS, INC.
(Name of the Issuer)
NTS, INC.
TOWER THREE PARTNERS LLC
TOWER THREE PARTNERS FUND II LP
TOWER THREE PARTNERS FUND II GP LP
TOWER THREE PARTNERS FUND II GP LLC
T3 NORTH HOLDINGS, LLC
T3 NORTH INTERMEDIATE HOLDINGS, LLC
NORTH MERGER SUB, INC.
GUY NISSENSON
(Name of Persons Filing Statement)
Common Stock, Par Value $0.001 Per Share
(Title of Class of Securities)
62943B105
(CUSIP Number of Class of Securities)
Niv Krikov
Chief Financial Officer
NTS, Inc.
1220 Broadway
Lubbock, Texas 79401
(806) 771-5212
with copies to:
Kevin J. Sullivan Weil, Gotshal & Manges LLP 100 Federal Street, Floor 34 Boston, MA 02110 (617) 772-8333 | Arthur S. Marcus Sichenzia Ross Friedman Ference LLP 61 Broadway, 32nd Floor New York, NY 10006 | Mark W. Jeanfreau Phelps Dunbar LLP Canal Place 365 Canal Street, Suite 2000 New Orleans, LA 70130 (504) 584-9236 |
(Name, Address, and Telephone Number of Person Authorized to Receive Notices and Communications on Behalf of the Persons Filing Statement)
NEITHER THE SECURITIES AND EXCHANGE COMMISSION NOR ANY STATE SECURITIES COMMISSION HAS APPROVED OR DISAPPROVED OF THIS TRANSACTION, PASSED UPON THE MERITS OR THE FAIRNESS OF THE TRANSACTION, OR PASSED UPON THE ADEQUACY OR ACCURACY OF THE INFORMATION CONTAINED IN THIS DOCUMENT. ANY REPRESENTATION TO THE CONTRARY IS A CRIMINAL OFFENSE.
This statement is filed in connection with (check the appropriate box):
| a. | þ The filing of solicitation materials or an information statement subject to Regulation 14A, Regulation 14C or Rule 13e-3(c) under the Securities Exchange Act of 1934. |
| b. | o The filing of a registration statement under the Securities Act of 1933. |
| c. | o A tender offer. |
| d. | o None of the above. |
Check the following box if the soliciting materials or information statement referred to in checking box (a) are preliminary copies: þ
Check the following box if this is a final amendment reporting the results of the transaction: o
CALCULATION OF FILING FEE
| Transaction Valuation(*) | Amount of Filing Fee(**) |
| $91,473,619 | $11,781.80 |
| * | For purposes of calculating the fee only, the maximum aggregate value was determined based on the sum of: (A) 42,068,055 shares of Common Stock multiplied by $2.00 per share; (B) options to purchase 7,141,677 shares of Common Stock with exercise prices less than $2.00 per share multiplied by $0.90 (which is the difference between $2.00 and the weighted average exercise price of $1.10 per share); and (C) warrants to purchase 1,400,000 shares of Common Stock with exercise prices less than $2.00 per share multiplied by $0.65 (which is the difference between $2.00 and the weighted average exercise price of $1.35 per share). |
| ** | In accordance with Section 14(g) of the Securities Exchange Act of 1934, as amended, the filing fee was determined by multiplying 0.0001288 by the sum of the preceding sentence. |
| o | Check the box if any part of the fee is offset as provided by Exchange Act Rule 0-11(a) (2) and identify the filing with which the offsetting fee was previously paid. Identify the previous filing by registration statement number, or the Form or Schedule and the date of its filing. |
| Amount Previously Paid: | $11,781.80 |
| Form or Registration No.: | Proxy Statement on Schedule 14A |
| Filing Party: | NTS, Inc. |
| Date Filed: | November 22, 2013 |
TABLE OF CONTENTS
| Page | ||
| Item 1. | Summary Term Sheet. | 1 |
| Item 2. | Subject Company Information. | 2 |
| Item 3. | Identity and Background of Filing Persons. | 2 |
| Item 4. | Terms of the Transaction. | 2 |
| Item 5. | Past Contacts, Transactions, Negotiations and Agreements | 3 |
| Item 6. | Purposes of the Transaction and Plans or Proposals | 3 |
| Item 7. | Purposes, Alternatives, Reasons and Effects of the Merger | 4 |
| Item 8. | Fairness of the Transaction | 4 |
| Item 9. | Reports, Opinions, Appraisals, and Negotiations | 5 |
| Item 10. | Source and Amount of Funds or Other Consideration | 5 |
| Item 11. | Interest in Securities of the Subject Company | 6 |
| Item 12. | The Solicitation or Recommendation | 6 |
| Item 13. | Financial Information | 6 |
| Item 14. | Persons/Assets, Retained, Employed, Compensated or Used | 6 |
| Item 15. | Additional Information | 7 |
| Item 16. | Exhibits | 7 |
INTRODUCTION
This Rule 13E-3 transaction statement on Schedule 13E-3 (together with the exhibits hereto, the “Transaction Statement”) is being filed with the Securities and Exchange Commission (the “SEC”) jointly by the following persons (collectively, the “filing persons”): Tower Three Partners LLC, a Delaware limited liability company, Tower Three Partners Fund II LP, a Delaware limited partnership, Tower Three Partners Fund II GP LP, a Delaware limited partnership, Tower Three Partners Fund II GP LLC, a Delaware limited liability company, T3 North Holdings, LLC, a Delaware limited liability company, T3 Intermediate Holdings, LLC, a Nevada limited liability company, North Merger Sub, Inc., a Nevada corporation, and Guy Nissenson (collectively referred to in this Transaction Statement as the “Purchaser Group”) and NTS, Inc., a Nevada corporation.
On October 20, 2013, NTS, Inc. (“NTS”) agreed to be acquired by T3 North Intermediate Holdings, LLC, which is referred to herein as Holdings, under the terms of the Agreement and Plan of Merger (the “Merger Agreement”), between NTS, Holdings and North Merger Sub, Inc., a wholly owned subsidiary of Holdings, which is referred to herein as Merger Sub. Holdings and Merger Sub are affiliates of Tower Three Partners LLC, which is referred to herein as Tower Three. Upon completion of the merger of Merger Sub with and into NTS, pursuant to the Merger Agreement, NTS will become a wholly owned subsidiary of Holdings. If the merger is completed, each outstanding share of common stock of NTS (other than certain shares owned by Guy Nissenson, a member of the Purchaser Group) will be cancelled and, in lieu thereof, the holders of shares of Company common stock shall be entitled to receive $2.00 in cash, without interest and less any applicable tax withholding.
Consummation of the merger is subject to the approval of the Merger Agreement by NTS’ shareholders. In addition, the merger is subject to other customary closing conditions, including the accuracy of representations and warranties of, and compliance with covenants by, the other party, in each case as set forth in the Merger Agreement.
Concurrently with the filing of this Transaction Statement, NTS is filing with the SEC a preliminary proxy statement on Schedule 14A (the “Proxy Statement”) pursuant to Section 14(a) of the Securities Exchange Act of 1934, as amended (the “Exchange Act”), relating to a special meeting of shareholders of NTS. At the meeting, NTS’ shareholders will (1) consider and vote upon a proposal to approve the Merger Agreement and (2) transact such other business as may properly come before the special meeting or any adjournment or postponement thereof. A copy of the Proxy Statement is attached hereto as Exhibit (a)(1). A copy of the Merger Agreement is attached as Annex A to the Proxy Statement.
The cross-references below are being supplied pursuant to General Instruction G to Schedule 13E-3 and show the location in the Proxy Statement of the information required to be included in response to the items of Schedule 13E-3. Pursuant to General Instruction F to Schedule 13E-3, the information contained in the Proxy Statement, including all appendices and annexes thereto, is incorporated in its entirety herein by reference, and the responses to each Item in this Transaction Statement are qualified in their entirety by the information contained in the Proxy Statement and the annexes thereto. As of the date hereof, the Proxy Statement is in preliminary form and is subject to completion and amendment.
While each of the filing persons acknowledges that the merger is a going private transaction for purposes of Rule 13E-3 under the Exchange Act, the filing of this Transaction Statement shall not be construed as an admission by any filing person, or by any affiliate of a filing person, that NTS is “controlled” by any other filing person.
All information contained in, or incorporated by reference into, this Transaction Statement concerning each filing person has been supplied by such filing person.
Item 1. Summary Term Sheet.
Item 1001 of Regulation M-A:
The information set forth in the Proxy Statement under the following captions is incorporated herein by reference: “SUMMARY TERM SHEET” and “QUESTIONS AND ANSWERS ABOUT THE NTS SPECIAL MEETING.”
1
Item 2. Subject Company Information.
Item 1002 of Regulation M-A:
(a) Name and Address. The information set forth in the Proxy Statement under the caption “SUMMARY TERM SHEET—The Parties to the Merger” is incorporated herein by reference.
(b) Securities. The exact title of the class of the subject equity securities is “Common Stock, par value $0.001 per share.” There were 42,068,055 outstanding shares of NTS common stock as of November 13, 2013.
(c)-(d) Trading Market and Price; Dividends. The information set forth in the Proxy Statement under the caption “IMPORTANT INFORMATION REGARDING THE COMPANY—Market for NTS’ Common Equity and Related Shareholder Matters” is incorporated herein by reference.
(e) Prior Public Offerings. None.
(f) Prior Stock Purchases. The information set forth in the Proxy Statement under the following captions is incorporated herein by reference: “IMPORTANT INFORMATION REGARDING THE COMPANY—Transactions in Common Stock During the Past 60 Days,” and “IMPORTANT INFORMATION REGARDING THE COMPANY—Transactions in Common Stock During the Past Two Years.”
Item 3. Identity and Background of Filing Persons.
Item 1003 of Regulation M-A:
(a)-(c) Name and Address; Business and Background of Entities; Business and Background of Natural Persons. The information set forth in the Proxy Statement under the captions “SUMMARY TERM SHEET—The Parties to the Merger,” “THE PARTIES TO THE MERGER,” “IMPORTANT IFORMATION REGARDING THE COMPANY,” and “IMPORTANT INFORMATION REGARDING THE HOLDINGS PARTIES, THE T3 PARTIES AND THE ROLLOVER HOLDER” is incorporated herein by reference. NTS is the subject company.
Item 4. Terms of the Transaction.
Item 1004 of Regulation M-A:
(a)(1) Material Terms. Tender Offers. Not Applicable.
(a)(2) Material Terms. Mergers or Similar Transactions. The information set forth in the Proxy Statement under the following captions is incorporated herein by reference: “SUMMARY TERM SHEET,” “QUESTIONS AND ANSWERS ABOUT THE NTS SPECIAL MEETING,” “SPECIAL FACTORS—The Company’s Reasons for the Merger and Recommendation of the Special Committee and the Board of Directors,” “SPECIAL FACTORS—Purposes and Reasons of the Holdings Parties, the T3 Parties and the Rollover Holder for the Merger,” “SPECIAL FACTORS—Interests of NTS Directors and Executive Officers in the Merger,” “SPECIAL FACTORS—Differing Interests of NTS Shareholders and the Rollover Holder in the Merger,” “SPECIAL FACTORS—Accounting Treatment,” “SPECIAL FACTORS—Material U.S. Federal Income Tax Consequences of the Merger,” “THE NTS SPECIAL MEETING,” “THE MERGER AGREEMENT” and “Annex A—Agreement and Plan of Merger.”
(c) Different Terms. The information set forth in the Proxy Statement under the following captions is incorporated herein by reference: “SUMMARY TERM SHEET,” “QUESTIONS AND ANSWERS ABOUT THE NTS SPECIAL MEETING,” “SPECIAL FACTORS—Interests of NTS Directors and Executive Officers in the Merger,” “SPECIAL FACTORS—Differing Interests of NTS Shareholders and the Rollover Holder in the Merger,” and “THE MERGER AGREEMENT.”
2
(d) Appraisal Rights. The information set forth in the Proxy Statement under the following captions is incorporated herein by reference: “QUESTIONS AND ANSWERS ABOUT THE NTS SPECIAL MEETING,” and “SPECIAL FACTORS—Rights of Dissenting Shareholders.”
(e) Provisions For Unaffiliated Security Holders. The information set forth in the Proxy Statement under the caption “PROVISIONS FOR UNAFFILIATED SHAREHOLDERS” is incorporated herein by reference.
(f) Eligibility for Listing or Trading. Not applicable.
Item 5. Past Contacts, Transactions, Negotiations and Agreements
Item 1005 of Regulation M-A:
(a) Transactions. The information set forth in the Proxy Statement under the following captions is incorporated herein by reference: “SUMMARY TERM SHEET,” “SPECIAL FACTORS—Interests of NTS Directors and Executive Officers in the Merger,” “SPECIAL FACTORS—Certain Effects of the Merger and Plans for the Company After the Merger,” “THE MERGER AGREEMENT,” “RELATED PARTY TRANSACTIONS,” and “IMPORTANT INFORMATION REGARDING THE COMPANY.”
(b) Significant Corporate Events. None.
(c) Negotiations or Contracts. None.
(e) Agreements involving the Subject Company’s Securities. The information set forth in the Proxy Statement under the following captions is incorporated herein by reference: “SUMMARY TERM SHEET,” “SPECIAL FACTORS—General Description and Effects of the Merger,” “SPECIAL FACTORS—The Company’s Reasons for the Merger and Recommendation of the Special Committee and the Board of Directors,” “SPECIAL FACTORS—Interests of NTS Directors and Executive Officers in the Merger,” “SPECIAL FACTORS—Treatment of Options and Warrants,” “THE MERGER AGREEMENT,” “THE VOTING AGREEMENT,” “RELATED PARTY TRANSACTIONS,” “IMPORTANT INFORMATION REGARDING THE COMPANY,” “Annex A—Agreement and Plan of Merger,” and “Annex B—Voting Agreement.”
Item 6. Purposes of the Transaction and Plans or Proposals
Item 1006 of Regulation M-A:
(b) Use of Securities Acquired. The information set forth in the Proxy Statement under the following captions is incorporated herein by reference: “SUMMARY TERM SHEET,” “SPECIAL FACTORS—Certain Effects of the Merger and Plans for the Company After the Merger,” “SPECIAL FACTORS—Purposes and Reasons of the Holding Parties, the T3 Parties and the Rollover Holder for the Merger,” “SPECIAL FACTORS—Delisting and Deregistration of NTS Common Stock,” and “THE MERGER AGREEMENT—Other Covenants.”
(c)(1)-(8) Plans. The information set forth in the Proxy Statement under the following captions is incorporated herein by reference: “SUMMARY TERM SHEET,” “SPECIAL FACTORS—Certain Effects of the Merger and Plans for the Company After the Merger,” “SPECIAL FACTORS—Certain Effects of the Merger and Plans for the Company After the Merger,” “SPECIAL FACTORS—Purposes and Reasons of the Holding Parties, the T3 Parties and the Rollover Holder for the Merger,” “SPECIAL FACTORS—Delisting and Deregistration of NTS Common Stock,” and “THE MERGER AGREEMENT—Other Covenants.”
3
Item 7. Purposes, Alternatives, Reasons and Effects of the Merger
Item 1013 of Regulation M-A:
(a) Purposes. The information set forth in the Proxy Statement under the following captions is incorporated herein by reference: “SUMMARY TERM SHEET,” “QUESTIONS AND ANSWERS ABOUT THE NTS SPECIAL MEETING,” “SPECIAL FACTORS—The Company’s Reasons for the Merger and Recommendation of the Special Committee and the Board of Directors,” “SPECIAL FACTORS—Purposes and Reasons of the Holdings Parties, the T3 Parties and the Rollover Holder for the Merger,” and “SPECIAL FACTORS—Background of the Merger.”
(b) Alternatives. The information set forth in the Proxy Statement under the following captions is incorporated herein by reference: “SPECIAL FACTORS—Background of the Merger,” and “SPECIAL FACTORS—The Company’s Reasons for the Merger and Recommendation of the Special Committee and the Board of Directors.”
(c) Reasons. The information set forth in the Proxy Statement under the following captions is incorporated herein by reference: “SUMMARY TERM SHEET,” “QUESTIONS AND ANSWERS ABOUT THE NTS SPECIAL MEETING,” “SPECIAL FACTORS—Background of the Merger,” “SPECIAL FACTORS—The Company’s Reasons for the Merger and Recommendation of the Special Committee and the Board of Directors,” “SPECIAL FACTORS—Purposes and Reasons of the Holdings Parties, the T3 Parties and the Rollover Holder for the Merger,” and “SPECIAL FACTORS—Opinions of Oberon Securities and B. Riley & Co. to the NTS Board of Directors.”
(d) Effects. The information set forth in the Proxy Statement under the following captions is incorporated herein by reference: “SUMMARY TERM SHEET,” “QUESTIONS AND ANSWERS ABOUT THE NTS SPECIAL MEETING,” “SPECIAL FACTORS—General Description and Effects of the Merger,” “SPECIAL FACTORS—Differing Interests of NTS Shareholders and the Rollover Holder in the Merger,” “SPECIAL FACTORS—Interests of NTS Directors and Executive Officers in the Merger,” “SPECIAL FACTORS—Certain Effects of the Merger and Plans for the Company After the Merger,” “SPECIAL FACTORS—Material U.S. Federal Income Tax Consequences of the Merger,” “SPECIAL FACTORS—Treatment of Options and Warrants,” “THE MERGER AGREEMENT,” and “Annex A—Agreement and Plan of Merger.”
Item 8. Fairness of the Transaction
Item 1014 of Regulation M-A:
(a)-(b) Fairness; Factors Considered in Determining Fairness. The information set forth in the Proxy Statement under the following captions is incorporated herein by reference: “SUMMARY TERM SHEET,” “QUESTIONS AND ANSWERS ABOUT THE NTS SPECIAL MEETING,” “SPECIAL FACTORS—Background of the Merger,” “SPECIAL FACTORS—The Company’s Reasons for the Merger and Recommendation of the Special Committee and the Board of Directors,” “SPECIAL FACTORS—Purposes and Reasons of the Holdings Parties, the T3 Parties and the Rollover Holder for the Merger,” “SPECIAL FACTORS—Opinions of Oberon Securities and B. Riley & Co. to the NTS Board of Directors,” “SPECIAL FACTORS—Position of the Holdings Parties and T3 Parties as to the Fairness of the Merger,” “SPECIAL FACTORS—Position of the Rollover Holder as to the Fairness of the Merger,” “Annex C—Opinion of Oberon Securities, LLC,” and “Annex D—Opinion of B. Riley & Co., LLC.”
The discussion materials prepared by Oberon Securities, LLC and B. Riley & Co., LLC, and reviewed with the board of directors of NTS on October 20, 2013, are attached hereto as Exhibits (c)(3) and (c)(4), respectively, and are incorporated by reference herein.
The opinions of Oberon Securities, LLC and B. Riley & Co., LLC, dated October 20, 2013 and rendered to the board of directors of NTS on the same date, are attached as Annexes C and D to the Proxy Statement, respectively, are incorporated by reference as Exhibits (c)(1) and (c)(2) hereto, respectively, and are incorporated by reference herein.
(c) Approval of Security Holders. The information set forth in the Proxy Statement under the following captions is incorporated herein by reference: “SUMMARY TERM SHEET,” “QUESTIONS AND ANSWERS ABOUT THE NTS SPECIAL MEETING,” “THE MERGER AGREEMENT—Conditions to the Completion of the Merger,” “THE MERGER AGREEMENT—NTS Shareholder Approval,” “THE NTS SPECIAL MEETING—Required Vote” “PROPOSALS TO BE CONSIDERED AT THE NTS SPECIAL MEETING—The Merger Proposal (Item 1 on the Proxy Card),” and “Annex A—Agreement and Plan of Merger.”
4
(d) Unaffiliated Representative. An unaffiliated representative was not retained to act solely on behalf of unaffiliated shareholders for purposes of negotiating the terms of the merger or preparing a report concerning the fairness of the transaction.
(e) Approval of Directors. The information set forth in the Proxy Statement under the following captions is incorporated herein by reference: “SUMMARY TERM SHEET,” “SPECIAL FACTORS—Background of the Merger,” “SPECIAL FACTORS—The Company’s Reasons for the Merger and Recommendation of the Special Committee and the Board of Directors,” “SPECIAL FACTORS—Interests of NTS Directors and Executive Officers in the Merger,” and “PROPOSALS TO BE CONSIDERED AT THE NTS SPECIAL MEETING—The Merger Proposal (Item 1 on the Proxy Card).”
(f) Other Offers. Not applicable.
Item 9. Reports, Opinions, Appraisals and Negotiations
Item 1015 of Regulation M-A
(a)-(b) Report, Opinion, or Appraisal; Preparer and Summary of the Report, Opinion or Appraisal. The information set forth in the Proxy Statement under the following captions is incorporated herein by reference: “SUMMARY TERM SHEET,” “SPECIAL FACTORS—Background of the Merger,” “SPECIAL FACTORS—The Company’s Reasons for the Merger and Recommendation of the Special Committee and the Board of Directors,” “SPECIAL FACTORS—Opinions of Oberon Securities and B. Riley & Co. to the NTS Board of Directors,” “Annex C—Opinion of Oberon Securities, LLC,” and “Annex D—Opinion of B. Riley & Co., LLC.”
The opinions of Oberon Securities, LLC and B. Riley & Co., LLC, dated October 20, 2013 and rendered to the board of directors of NTS on the same date, are attached as Annexes C and D to the Proxy Statement, respectively, are incorporated by reference as Exhibits (c)(1) and (c)(2) hereto, respectively, and are incorporated by reference herein.
(c) Availability of Documents. The reports, opinions or appraisal in this Item 9 will be made available for inspection and copying at the principal executive offices of NTS during its regular business hours by any interested holder of NTS common stock, or any representative designated in writing by any such holder.
Item 10. Source and Amount of Funds or Other Consideration
Item 1007 of Regulation M-A:
(a) Sources of Funds or Other Consideration. The information set forth in the Proxy Statement under the following captions is incorporated herein by reference: “SPECIAL FACTORS—Description of Financing,” “SPECIAL FACTORS—The Company’s Reasons for the Merger and Recommendation of the Special Committee and the Board of Directors,” “SPECIAL FACTORS—Position of the Holdings Parties and T3 Parties as to the Fairness of the Merger,” “THE MERGER AGREEMENT—Termination Fees and Reimbursement of Expenses,” and “THE MERGER AGREEMENT—Other Agreements Entered Into in Connection with the Merger Agreement.”
(b) Conditions. The information set forth in the Proxy Statement under the following captions is incorporated herein by reference: “SPECIAL FACTORS—Description of Financing,” and “THE MERGER AGREEMENT—Financing Cooperation” is incorporated herein by reference.
(c) Expenses. The information set forth in the Proxy Statement under the following captions is incorporated herein by reference: “SUMMARY TERM SHEET,” “SPECIAL FACTORS—Background of the Merger,” “SPECIAL FACTORS—Opinions of Oberon Securities and B. Riley & Co. to the NTS Board of Directors,” “THE MERGER AGREEMENT—Financing Cooperation,” “THE MERGER AGREEMENT—Termination Fees and Reimbursement of Expenses,” “THE MERGER AGREEMENT—Fees and Expenses,” “THE MERGER AGREEMENT—Remedies,” “MERGER FEES AND EXPENSES,” and “Annex A—Agreement and Plan of Merger.”
(d) Borrowed Funds. The information set forth in the Proxy Statement under the following captions is incorporated herein by reference: “SPECIAL FACTORS—Description of Financing,” and “THE MERGER AGREEMENT—Financing Cooperation.”
5
Item 11. Interest in Securities of the Subject Company
Item 1008 of Regulation M-A:
(a) Securities Ownership. The information set forth in the Proxy Statement under the following captions is incorporated herein by reference: “SUMMARY TERM SHEET,” “SPECIAL FACTORS—Certain Effects of the Merger and Plans for the Company After the Merger,” “SPECIAL FACTORS—Interests of NTS Directors and Executive Officers in the Merger,” “THE VOTING AGREEMENT,” “IMPORTANT INFORMATION REGARDING THE COMPANY—Security Ownership of Certain Beneficial Owners and Management.”
(b) Securities Transactions. The information set forth in the Proxy Statement under the following captions is incorporated herein by reference: “SUMMARY TERM SHEET,” “SPECIAL FACTORS—Interests of NTS Directors and Executive Officers in the Merger,” “THE MERGER AGREEMENT—Other Agreements Entered Into in Connection with the Merger Agreement,” “THE VOTING AGREEMENT,” “RELATED PARTY TRANSACTIONS,” “IMPORTANT INFORMATION REGARDING THE COMPANY—Security Ownership of Certain Beneficial Owners and Management,” and “IMPORTANT INFORMATION REGARDING THE COMPANY—Transactions in Common Stock During the Past 60 Days.”
Item 12. The Solicitation or Recommendation
Item 1012 of Regulation M-A:
(d) Intent to Tender or Vote in a Going-Private Transaction. The information set forth in the Proxy Statement under the following captions is incorporated herein by reference: “SUMMARY TERM SHEET,” “QUESTIONS AND ANSWERS ABOUT THE NTS SPECIAL MEETING,” “THE MERGER AGREEMENT—Other Agreements Entered Into in Connection with the Merger Agreement,” “THE VOTING AGREEMENT,” “RELATED PARTY TRANSACTIONS—The Voting Agreement,” “THE NTS SPECIAL MEETING—Recommendations of the Board of Directors of NTS,” and “THE NTS SPECIAL MEETING—Record Date; Stock Entitled to Vote.”
(e) Recommendations of Others. The information set forth in the Proxy Statement under the following captions is incorporated herein by reference: “SUMMARY TERM SHEET,” “QUESTIONS AND ANSWERS ABOUT THE NTS SPECIAL MEETING,” “SPECIAL FACTORS—Background of the Merger,” “SPECIAL FACTORS—The Company’s Reasons for the Merger and Recommendation of the Special Committee and the Board of Directors,” “THE NTS SPECIAL MEETING—Recommendations of the Board of Directors of NTS,” and “PROPOSALS TO BE CONSIDERED AT THE NTS SPECIAL MEETING—The Merger Proposal (Item 1 on the Proxy Card).”
Item 13. Financial Information
Item 1010 of Regulation M-A:
(a) Financial Information. The information set forth in the Proxy Statement under the following captions is incorporated herein by reference: “IMPORTANT INFORMATION REGARDING THE COMPANY.” The information contained in the Consolidated Financial Statements included in NTS’s annual report on Form 10-K for the fiscal year ended December 31, 2012 and in its quarterly report on Form 10-Q for its quarter ended September 30, 2013 is incorporated herein by reference. The book value per share of NTS common stock, as of September 30, 2013, was $0.62.
The Form 10-K and the Form 10-Q are available for inspection and copying at the SEC’s public reference room located at 100 F Street, N.E., Room 1580, Washington, D.C. 20549. The Form 10-K and Form 10-Q are also available to the public from the SEC’s website at www.sec.gov.
(b) Pro Forma Information. Not Applicable.
Item 14. Persons/Assets, Retained, Employed, Compensated or Used
Item 1009 of Regulation M-A:
(a)-(b) Solicitations or Recommendations; Employees and Corporate Assets. The information set forth in the Proxy Statement under the following captions is incorporated herein by reference: “THE NTS SPECIAL MEETING—Solicitation of Proxies,” and “SPECIAL FACTORS— Interests of NTS Directors and Executive Officers in the Merger.”
6
Item 15. Additional Information
Item 1011 of Regulation M-A:
(b) Golden Parachute Compensation. The information set forth in the Proxy Statement under the caption “SPECIAL FACTORS—Interests of NTS Directors and Executive Officers in the Merger” is incorporated herein by reference.
(c) Other Material Information. The information contained in the Proxy Statement, including all annexes thereto, is incorporated herein by reference.
Item 16. Exhibits
Item 1016 of Regulation M-A:
Exhibit | Description | |
| (a)(1) | Preliminary Proxy Statement of NTS, Inc., incorporated herein by reference to the Schedule 14A filed with the Securities and Exchange Commission on November 20, 2013 (the “Proxy Statement”). | |
| (a)(2) | Letter to Shareholders of NTS, Inc., incorporated herein by reference to the Proxy Statement. | |
| (a)(3) | Notice of Special Meeting of Shareholders of NTS, Inc., incorporated herein by reference to the Proxy Statement. | |
| (a)(4) | Form of Preliminary Proxy Card, incorporated herein by reference to the Proxy Statement. | |
| (a)(5) | Form 8-K of NTS, Inc., incorporated by reference to the Form 8-K filed with the Securities and Exchange Commission on October 21, 2013. | |
| (b) | None. | |
| (c)(1) | Opinion of Oberon Securities, LLC, dated as of October 20, 2013, rendered to the Board of Directors of NTS, Inc., which is attached as Annex C to the Proxy Statement and incorporated herein by reference. | |
| (c)(2) | Opinion of B. Riley & Co., LLC, dated as of October 20, 2013, rendered to the Board of Directors of NTS, Inc., which is attached as Annex D to the Proxy Statement and incorporated herein by reference. | |
| (c)(3) | Financial analysis presentation materials prepared by Oberon Securities, LLC. and reviewed with the Board of Directors of NTS, Inc. on October 20, 2013. | |
| (c)(4) | Financial analysis presentation materials prepared by B. Riley & Co., LLC. and reviewed with the Board of Directors of NTS, Inc. on October 20, 2013. | |
| (c)(5) | Presentation Materials prepared by Company management and provided to Tower Three on April 24, 2013. | |
| (c)(6) | Presentation Materials prepared by Company management and provided to Oberon Securities and B. Riley & Co. on October 11, 2013. | |
| (d)(1) | Agreement and Plan of Merger, dated as of October 20, 2013, by and among NTS, Inc., T3 North Intermediate Holdings, LLC and North Merger Sub, Inc., which is attached as Annex A to the Proxy Statement and incorporated herein by reference. | |
| (d)(2) | Voting Agreement, dated as of October 20, 2013, by and among NTS, Inc., T3 North Intermediate Holdings, LLC and Guy Nissenson, which is attached as Annex B to the Proxy Statement and incorporated herein by reference. | |
| (d)(3) | Rollover Agreement, dated as of October 20, 2013, by and between T3 North Holdings, LLC and Guy Nissenson. | |
| (f) | None. | |
| (g) | None. |
7
SIGNATURES
After due inquiry and to the best of its knowledge and belief, each of the undersigned certifies that the information set forth in this Statement is true, complete and correct.
| NTS, INC. | |||
| November 22, 2013 | By: | /s/ Niv Krikov | |
| Name: Niv Krikov | |||
| Title: Chief Financial Officer | |||
TOWER THREE PARTNERS LLC | |||
| By: | /s/ William D. Forrest | ||
| William D. Forrest | |||
| Managing Member | |||
TOWER THREE PARTNERS FUND II LP | |||
| By: | Tower Three Partners Fund II GP LP, its general partner | ||
| By: | Tower Three Partners Fund II GP LLC | ||
| By: | /s/ William D. Forrest | ||
| Name: William D. Forrest | |||
| Title: Managing Member | |||
TOWER THREE PARTNERS FUND II GP LP | |||
| By: | Tower Three Partners Fund II GP LLC, its general partner | ||
| By: | /s/ William D. Forrest | ||
| Name: William D. Forrest | |||
| Title: Managing Member | |||
TOWER THREE PARTNERS FUND II GP LLC | |||
| By: | /s/ William D. Forrest | ||
| Name: William D. Forrest | |||
| Title: Managing Member | |||
T3 NORTH HOLDINGS LLC | |||
| By: | /s/ Christopher Jacobs | ||
| Name: Christopher Jacobs | |||
| Title: Secretary | |||
T3 NORTH INTERMEDIATE HOLDINGS LLC | |||
| By: | /s/ Christopher Jacobs | ||
| Name: Christopher Jacobs | |||
| Title: Secretary | |||
NORTH MERGER SUB, INC. | |||
| By: | /s/ Christopher Jacobs | ||
| Name: Christopher Jacobs | |||
| Title: Secretary | |||
GUY NISSENSON | |||
| By: | /s/ Guy Nissenson | ||
| Name: Guy Nissenson | |||
SIGNATURE PAGE TO SCHEDULE 13E-3
EXHIBIT (c)(3)
Project Premise
Presentation to the Board of Directors
October 20, 2013
1

Project Premise - CONFIDENTIAL
Disclaimer
2
The following pages contain material provided to the Board of Directors (the “Board”) of Premise (“the “Company”) by
Oberon Securities, LLC (“Oberon”) in connection with a proposed transaction involving Premise.
Oberon Securities, LLC (“Oberon”) in connection with a proposed transaction involving Premise.
These materials were prepared on a confidential basis in connection with an oral presentation to the Board and not with
a view toward complying with the disclosure standards under state or federal securities laws. These materials are solely
for use of the Board and may not be used for any other purpose without Oberon’s written consent
a view toward complying with the disclosure standards under state or federal securities laws. These materials are solely
for use of the Board and may not be used for any other purpose without Oberon’s written consent
The information contained in this presentation was based solely on publicly available information or information
furnished to Oberon. Oberon has relied, without independent investigation or verification, on the accuracy,
completeness and fair presentation of all such information and the conclusions contained herein are conditioned upon
such information (whether written or oral) being accurate, complete and fairly presented in all respects, and Oberon
makes no representation or warranty in respect of the accuracy, completeness or fair presentation of such information.
Oberon does not undertake any obligation to update or otherwise revise the following materials. These materials may
not be disclosed to any third party, except as required in any filing with the Securities and Exchange Commission;
provided that such disclosure must meet with Oberon's reasonable approval. Oberon does not provide accounting, tax,
legal or regulatory advice. In addition, Oberon and the Company mutually agree that, subject to applicable law, the
Company (and its employees, representatives and other agents) may disclose any and all aspects of any potential
transaction or structure described herein that are necessary to support any U.S. federal income tax benefits, and all
materials of any kind (including tax opinions an other tax analyses) related thereto, without Oberon imposing any
limitation of any kind.

Project Premise - CONFIDENTIAL
Table of Contents
3
I. Transaction Overview
II. Valuation Analysis
III. Appendix

Project Premise - CONFIDENTIAL
Transaction Overview
4

Project Premise - CONFIDENTIAL
Summary of Proposed Transaction
5
Transaction Structure | § Tower Three Partners (“T3”) merger sub will be merged with and into Premise, with Premise surviving as a wholly- owned corporate subsidiary of T3 under the laws of the State of Nevada |
Purchase Price | § $2.00 per share, which implies an equity value of approximately $90 million and enterprise value of approximately $156 million |
Assumption of Debt | § Purchaser to assume or repay all outstanding debt of Premise |
Consideration | § 100% Cash (with the exception of the Rollover Shareholder) |
Rollover Shareholder | § Mr. Nissenson to exchange approximately 1.4 million of his Premise shares (30% of the value of his shares and options in Premise) for shares in Purchaser and receive cash for the remaining 70% value of his shares & options |
Voting Agreement | § Mr. Nissenson agrees to vote in favor of the transaction (approximately 4.1 million shares) |
Closing Conditions | § Shareholder approval of Premise § Accuracy of the other party’s representations and warranties § Compliance by the other party of all covenants and agreements under the agreement § FCC & state regulatory consents, HSR clearance and other regulatory approvals § No material adverse change § Outside date: 6 months after signing the merger agreement |
Solicitation | § For a period of 30 days from signing of the merger agreement (the “Go-Shop Period”), Premise may solicit alternative proposals for a takeover (thereafter, the company may not solicit alternative proposals however the board of Premise may exercise its fiduciary duty by considering any alternative proposals it may receive). Any indications of interest received during the Go-Shop Period shall be referred to as Go-Shop Parties |
Termination Fee | § 4.5% of aggregate merger consideration if (i) the Company withdraws its recommendation in favor of the transaction or enters into an acquisition agreement with a third party (provided that the fee shall be 2.5% of aggregate merger consideration if the reason for the change in the Company's recommendation is a proposal by a Go-Shop Party or the party with whom the Company enters into an acquisition agreement is a Go-Shop Party), (ii) the Company breaches its obligations under the go-shop provisions or (iii) following certain termination events the Company enters into an acquisition agreement within 12 months. A reverse termination fee of 6.75% of aggregate merger consideration is payable if T3 breaches the merger agreement or fails to close the merger |

Project Premise - CONFIDENTIAL
Background of Proposed Transaction
6
Tower Three (“T3”) is an operationally oriented private equity firm based in Greenwich, CT, investing in
U.S. - based middle market companies.
March 7 | § Mike Nold, newly appointed Managing Director at T3, comes to NYC to introduce T3 to Adam Breslawsky at Oberon (Mr. Nold previously worked at the Gores Group, which through Oberon had previous discussions with Premise in 2010 regarding their portfolio company First Communications) |
March 14 | § Introductory call with Oberon, T3 and Guy Nissenson, Chairman & CEO of Premise |
April 23 | § NDA between Premise and T3 executed |
April 24 | § Nold, Nissenson & Breslawsky meet in Dallas for two days of initial face to face meetings § Upon conclusion of trip, Nold expresses interest to Breslawsky but suggests that valuation is challenging without additional growth initiatives § Diligence materials including financial forecast are forwarded to T3 |
May 29 | § Nissenson, Tal Sheynfeld (VP of Strategic Development at Premise) and Breslawsky meet with Nold and colleagues at T3 offices in Greenwich, CT § Interest renewed due to potential actionable consolidation opportunities |
August 2 | § Letter of Intent sent from Nold to Breslawsky § $2.00 per share purchase price § Requested 30 day exclusivity § Retained Weil, Gotshal & Manges as their legal counsel § Cover note to email asks to “schedule an M&A pipeline discussion very soon as this is one of the key tenets of the strategy.” § Reinforces notion that valuation target realized through additional growth initiatives |
August 14 | § Nissenson, Sheynfeld, T3 and Oberon have all day meeting and dinner at T3 offices in Greenwich, CT § Update on organic growth; also detailed presentation on additional non-organic growth initiatives (11 M&A targets & an additional RUS application) |
August 19 | § Nold calls Breslawsky to push forward with LOI signing (subsequently signed on August 22) § Sends diligence schedule and documentation request list § Outlines accelerated timetable to signing of definitive agreement |

Project Premise - CONFIDENTIAL
($ in thousands)
7
Premise: Projected Revenue Contribution
Source: Premise management financial forecast.
Project Premise - CONFIDENTIAL
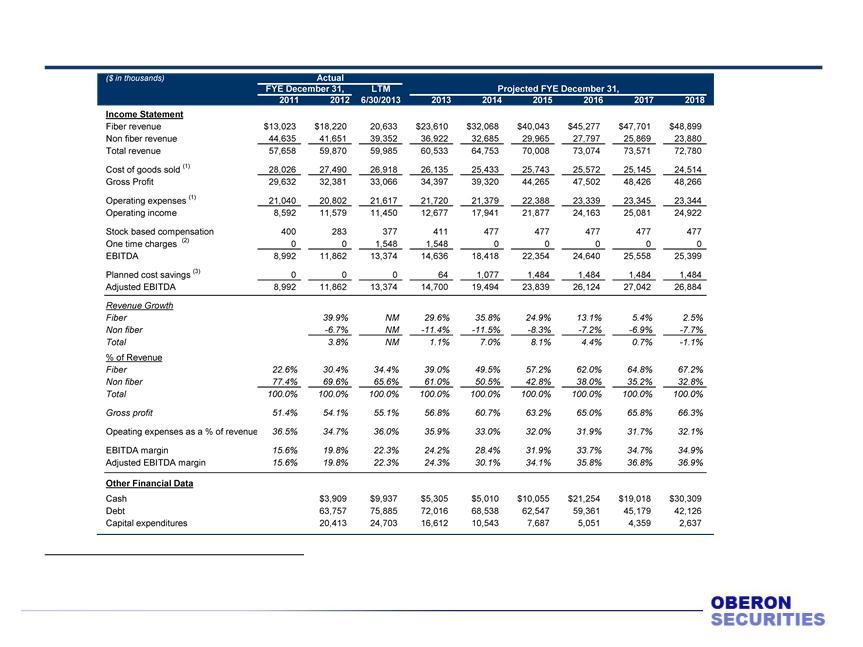
Premise Historical and Projected Financial Performance
8
Source: Capital IQ, public filings and Premise management.
(1)Excludes depreciation and amortization.
(2)Includes a write-off of $519,435 of assets acquired in various acquisitions and significantly higher than usual bad debt expense of $1.0 million.
(3)Includes reduction in payroll, IT, transport and headquarters related costs.
Project Premise - CONFIDENTIAL
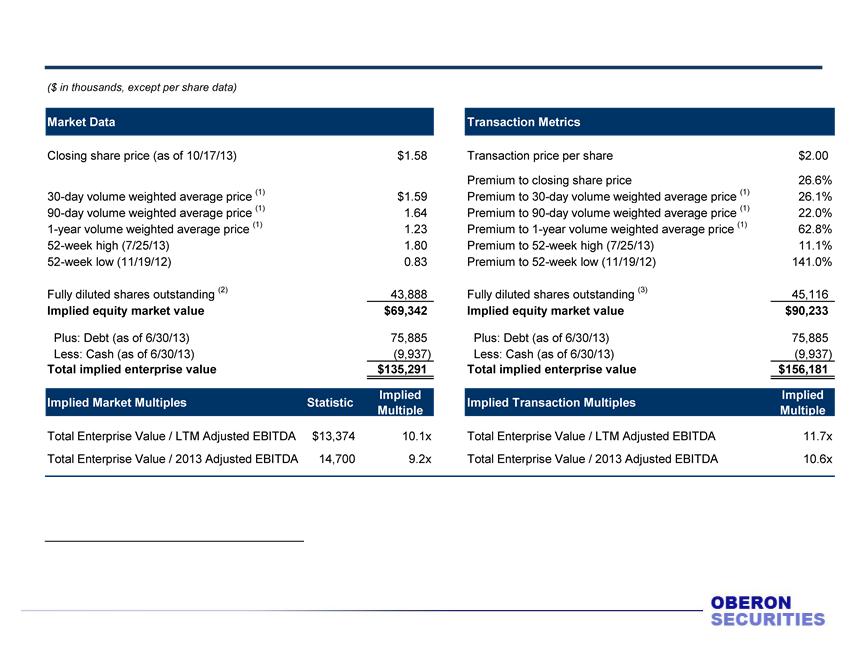
Implied Transaction Metrics
9
Source: Capital IQ, public filings and Premise management.
(1)Volume weighted average price (VWAP) is calculated by adding the product of the closing share price and the ending volume of shares traded on each
day over a defined period and dividing such sum by the total shares traded for such period.
day over a defined period and dividing such sum by the total shares traded for such period.
(2)Based on 43.888 million fully diluted shares, calculated using the treasury method with a share price of $1.58.
(3)Based on 45.116 million fully diluted shares, calculated using the treasury method with a share price of $2.00.

Project Premise - CONFIDENTIAL
Valuation Analysis
10

Project Premise - CONFIDENTIAL
Valuation Analysis
11
§ Oberon reviewed certain publicly available financial statements and other financial statements of the Company that
Oberon deemed relevant
Oberon deemed relevant
§ Oberon reviewed certain internal business, operating and financial information and forecasts of the Company for fiscal
years 2013 through 2018 (the “Forecasts”), furnished by the senior management of the Company
years 2013 through 2018 (the “Forecasts”), furnished by the senior management of the Company
§ Oberon reviewed information regarding publicly available financial terms of certain other business combinations
Oberon deemed relevant
Oberon deemed relevant
§ Oberon held discussions with members of the senior management of the Company to discuss the foregoing
§ Oberon examined the financial position and operating results of the Company and the market prices and trading
history of its stock compared with those of certain other publicly traded companies Oberon deemed relevant (as
reported by reliable information sources)
history of its stock compared with those of certain other publicly traded companies Oberon deemed relevant (as
reported by reliable information sources)
§ Oberon considered other matters which it has deemed relevant to our inquiry and has taken into account such
accepted financial and other relevant analytical analyses and considerations as deemed relevant
accepted financial and other relevant analytical analyses and considerations as deemed relevant
§ Oberon relied, without independent verification but with the Company’s approval and agreement, upon the accuracy,
completeness and fair presentation of all the information examined by or otherwise reviewed or discussed with us for
purposes of the opinion including, without limitation, the Forecasts provided by senior management
completeness and fair presentation of all the information examined by or otherwise reviewed or discussed with us for
purposes of the opinion including, without limitation, the Forecasts provided by senior management

Project Premise - CONFIDENTIAL
Valuation Methodologies
12
Methodology | Analysis Performed | |
Stock Price Trading History | § Illustrates the trading history of the Company’s shares and compares it to selected indexes and the proposed transaction stock price | § Oberon reviewed the trading history of the Company’s shares over periods ranging from the past six months through the last five years |
Comparable Public Company Analysis | § Values a company by reference to selected publicly-traded companies with similar products, similar operating and financial characteristics and servicing similar markets | § Oberon reviewed 19 public companies in two sectors of the telecom services industry with enterprise values of $76 million - $161 billion |
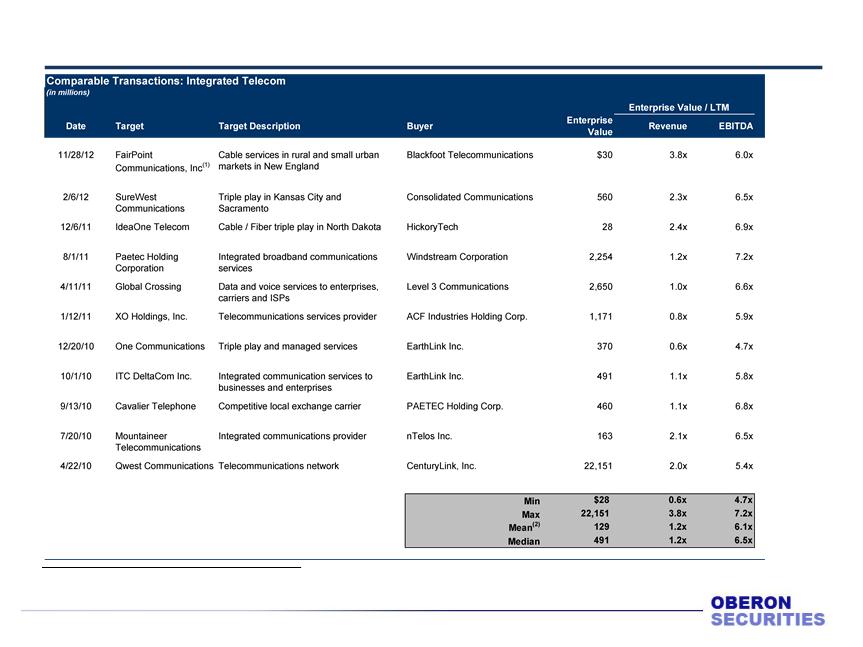
Comparable Precedent Transaction Analysis | § Values a company relative to selected recent precedent M&A transactions involving similar businesses | § Oberon reviewed 21 transactions announced since April 2010 involving fiber and non-fiber companies in the US |
Discounted Cash Flow (“DCF”) Analysis | § Values a company as the sum of its unlevered (before financing costs) free cash flows over a forecast period and the company’s terminal or residual value at the end of the forecast period | § Based on management’s projections for a 5-year period through fiscal year 2018 § Assumes that $23 million of NOLs as of 6/30/13 will be fully utilized by the end of 2016 § In calculating the terminal free cash flow, the unlevered free cash flow was adjusted for certain cost savings |
Note: Oberon did not attribute any particular weight to any analysis, methodology or factor considered, but rather made qualitative judgments as to the
significance and relevance of each analysis and factor; accordingly, Oberon analyses must be considered as a whole. Considering any portion of such
analyses and factors, without considering all analyses and factors, could create a misleading or incomplete view of the process undertaken by Oberon.
significance and relevance of each analysis and factor; accordingly, Oberon analyses must be considered as a whole. Considering any portion of such
analyses and factors, without considering all analyses and factors, could create a misleading or incomplete view of the process undertaken by Oberon.
Project Premise - CONFIDENTIAL
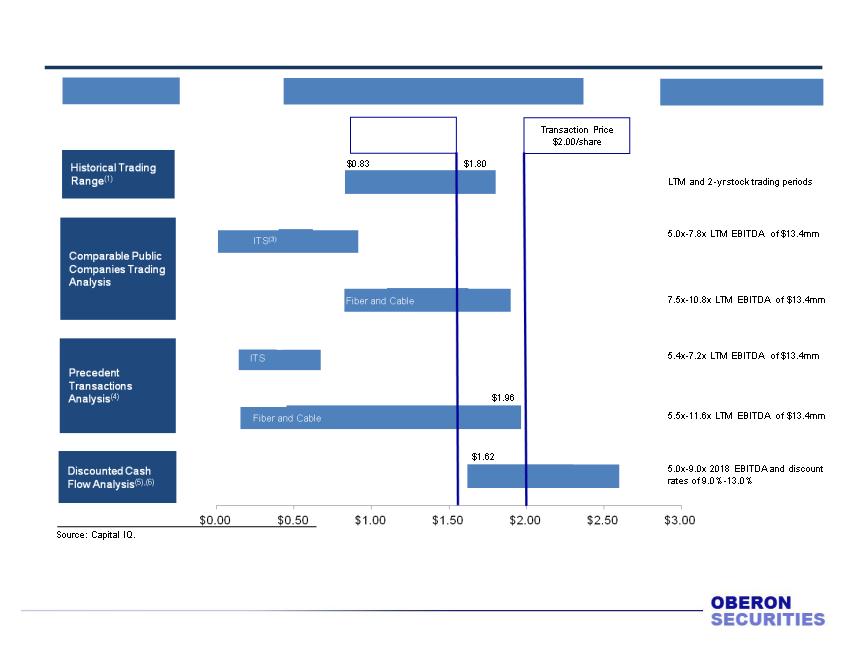
Valuation Reference Range Summary
13
Implied Premise Equity Value per Share
(1)Based on 41.464 million basic shares outstanding as of 10/17/13.
(2)Adjusted minimum EBITDA multiple to third lowest result of 5.0x. Applying the minimum multiple of 3.9x would result in negative equity.
(3)ITS - Integrated Telecom Services including alternative carriers and CLEC.
(4)Adjusted minimum EBITDA multiple to second lowest result of 5.4x. Applying the minimum multiple of 4.7x would result in negative equity.
(5)Based on 45.116 million fully diluted shares outstanding based on a $2.00 share price.
(6)Based on Premise management forecast. Discount rate based on weighted average cost of capital of selected companies. See Appendix for details.
Relevant Metrics
Methodology
Closing Price
$1.58/share
as of 10/17/13
$1.58/share
as of 10/17/13
$0.01(2)
$0.91
$0.83
$1.90
$0.14(4
)
)
$0.67
$0.16
$2.60
Project Premise - CONFIDENTIAL
(1) Volume weighted average price (VWAP) is calculated by adding the product of the closing share price and the ending volume of shares traded on
each day over a defined period and dividing such sum by the total shares traded for such period.
each day over a defined period and dividing such sum by the total shares traded for such period.
14
Project Premise - CONFIDENTIAL
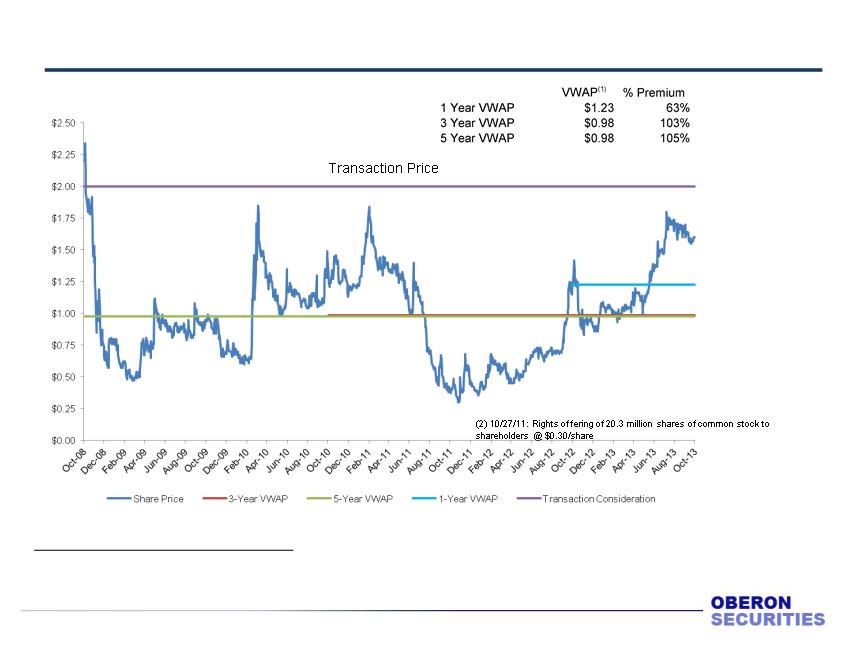
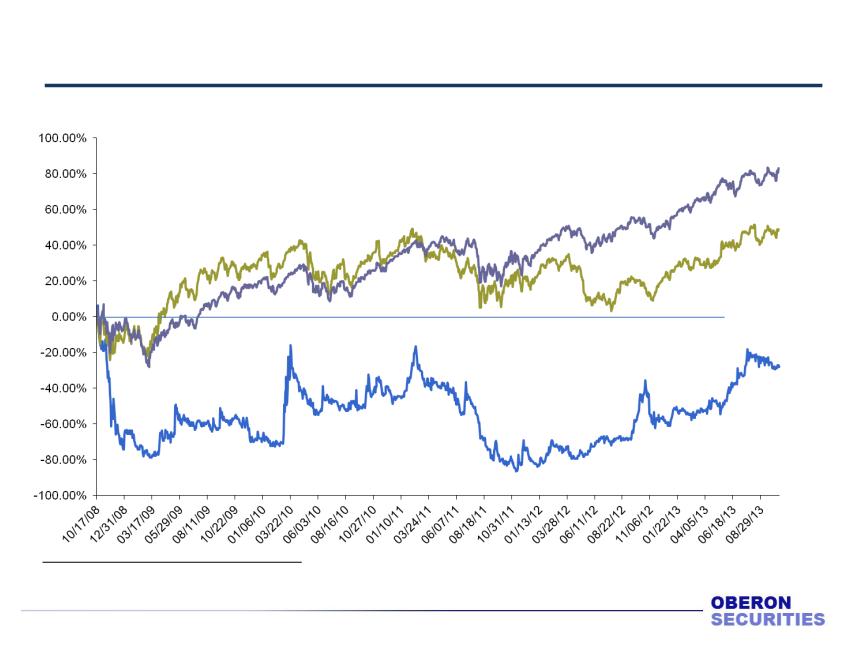
Share Price Performance - Last Five Years
Source: Capital IQ.
(1) Volume weighted average price (VWAP) is calculated by adding the product of the closing share price and the ending volume of shares traded on
each day over a defined period and dividing such sum by the total shares traded for such period.
each day over a defined period and dividing such sum by the total shares traded for such period.
(2) October 27, 2011, Premise announced that it was raising $6 million in a rights offering consisting of the issuance of 20.268 million shares of its
common stock at a purchase price of $0.30 per share to shareholders effective on 11/2/2011.
common stock at a purchase price of $0.30 per share to shareholders effective on 11/2/2011.
15
$2.00
$1.58
$1.23
$0.98
$0.98
Project Premise - CONFIDENTIAL
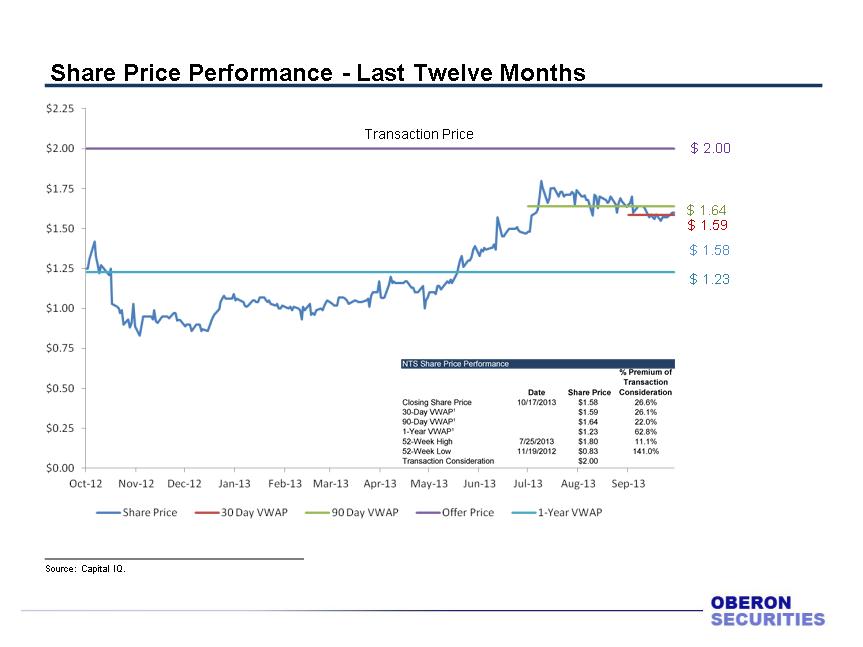
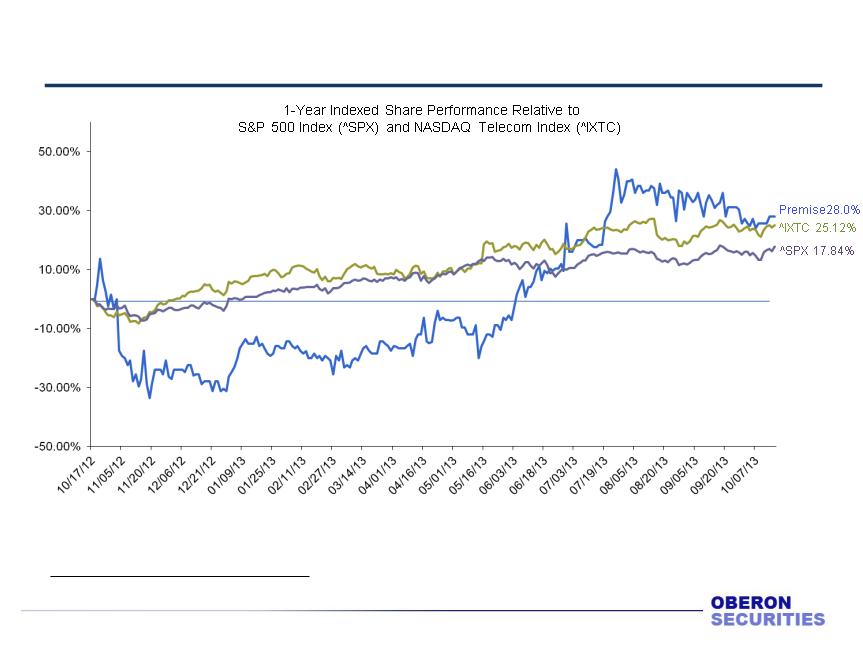
Relative Trading Performance - Last Twelve Months
Source: Capital IQ.
Note: Premise LTM as of 10/16/2013, S&P 500 LTM as of 10/16//2013, NASDAQ LTM as of 10/16/2013.
16
Project Premise - CONFIDENTIAL
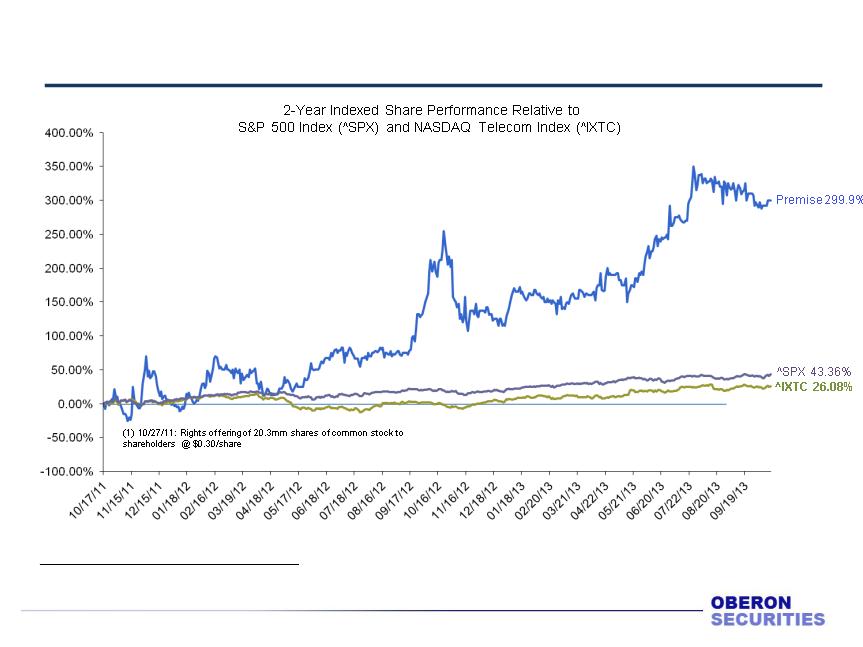
Relative Trading Performance - Last Two Years
17
Source: Capital IQ.
(1) October 27, 2011, Premise announced that it was raising $6 million in a rights offering consisting of the issuance of 20.268 million shares of its
common stock at a purchase price of $0.30 per share to shareholders effective on 11/2/2011.
common stock at a purchase price of $0.30 per share to shareholders effective on 11/2/2011.
Project Premise - CONFIDENTIAL
Relative Trading Performance - Last Five Years
5-Year Indexed Share Performance Relative to
S&P 500 Index (^SPX) and NASDAQ Telecom Index (^IXTC)
Premise -27.27%
^IXTC 48.84%
^SPX 83.04%
18
Source: Capital IQ.
(1) October 27, 2011, Premise announced that it was raising $6 million in a rights offering consisting of the issuance of 20.268 million shares of its
common stock at a purchase price of $0.30 per share to shareholders effective on 11/2/2011.
common stock at a purchase price of $0.30 per share to shareholders effective on 11/2/2011.
(1) 10/27/11: Rights offering of 20.3mm shares of common stock to
shareholders @ $0.30/share
shareholders @ $0.30/share
Project Premise - CONFIDENTIAL
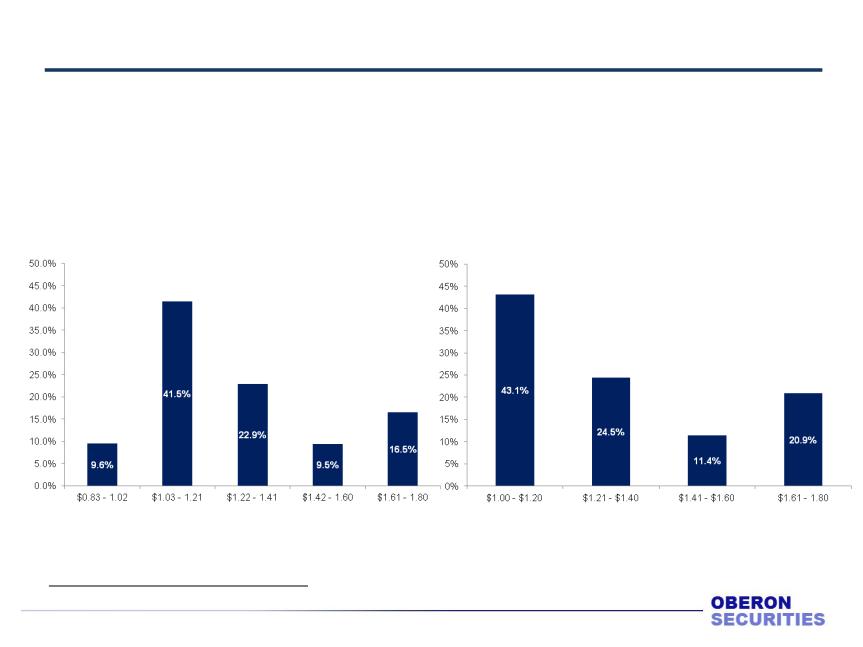
Recent Share Trading Ranges
1,636 7,087 3,919 1,615 2,821
Weighted Avg. Price/Share:$1.24
Total Shares Traded (000s): 17,078
Average Daily Volume (000s): 68
Volume
(000s)
(000s)
Volume
(000s)
(000s)
5,808 3,297 1,542 2,821
Weighted Avg. Price/Share:$1.46
Total Shares Traded (000s): 13,468
Average Daily Volume (000s): 104
19
Source: Capital IQ.
6 Month Trading Volume ($ per share)
Percentage of Shares Traded
LTM Trading Volume ($ per share)
Percentage of Shares Traded
Project Premise - CONFIDENTIAL
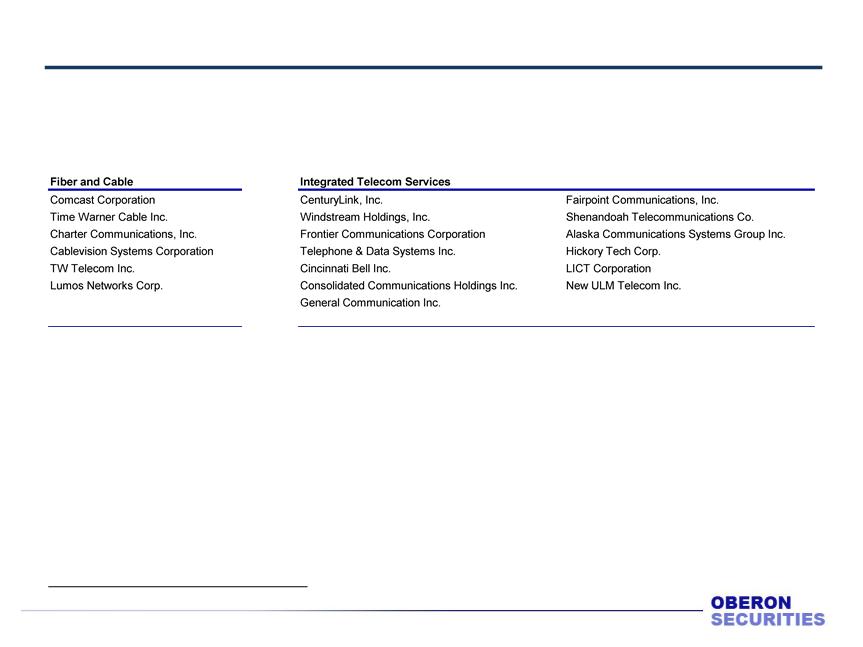
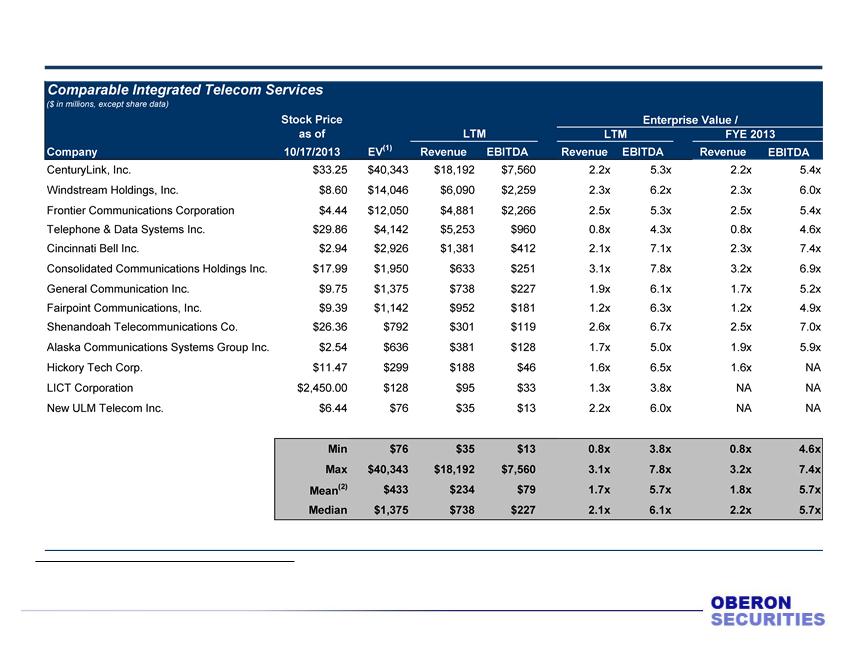
Comparable Public Company Analysis
20
§ As illustrated previously, Premise is transitioning from a CLEC providing legacy telecom services towards a pure-play
fiber based telecom service provider with triple play offering
fiber based telecom service provider with triple play offering
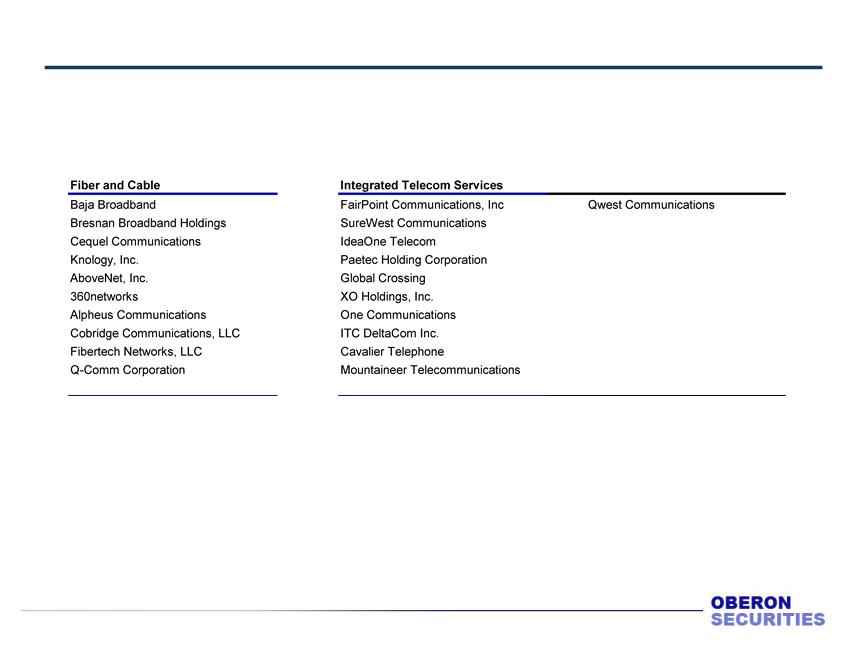
§ To capture this scope in business focus, we reviewed select universes of publicly traded companies including
(i) Fiber and Cable and (ii) Integrated Telecom Services(1) as follows:
(i) Fiber and Cable and (ii) Integrated Telecom Services(1) as follows:
§ We have separated the two groups of comparable companies due to the differences in business model, service
offering, cost structure and growth characteristics
offering, cost structure and growth characteristics
§ Although differences exist between the universe of comparable companies, the selected comparable companies share
similar customer base
similar customer base
§ Approximately two thirds of the company’s LTM revenues were generated from non-fiber services
(1) Including CLEC and alternative carriers.
Project Premise - CONFIDENTIAL
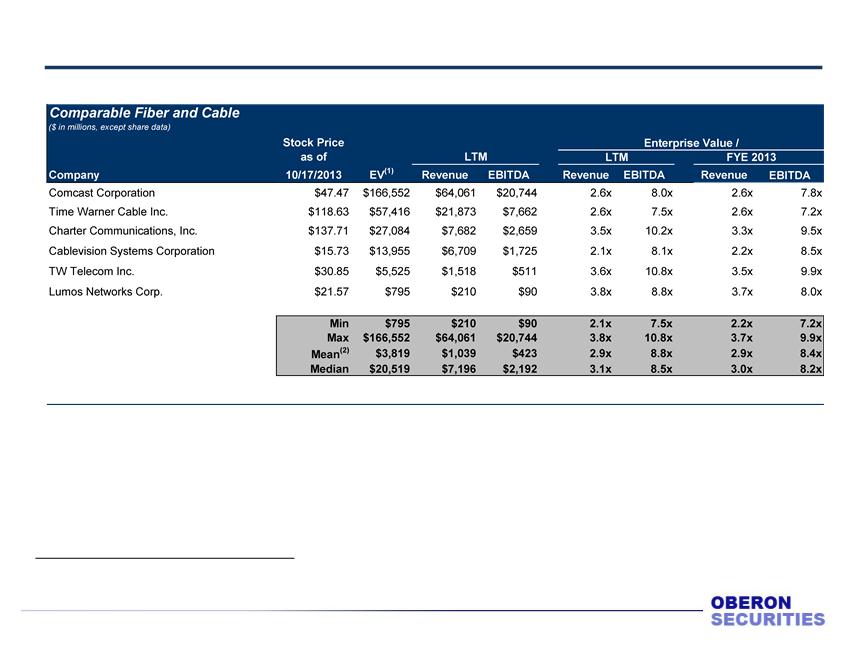
Comparable Public Company Analysis
21
Source: Capital IQ.
(1)Enterprise value (EV) = Equity value - cash and cash equivalents + total book value of debt + preferred equity + non-controlling interests.
(2)Harmonic mean.
Project Premise - CONFIDENTIAL
Comparable Public Company Analysis
22
Source: Capital IQ.
(1)Enterprise value (EV) = Equity value - cash and cash equivalents + total book value of debt + preferred equity + non-controlling interests.
(2)Harmonic mean.
Project Premise - CONFIDENTIAL
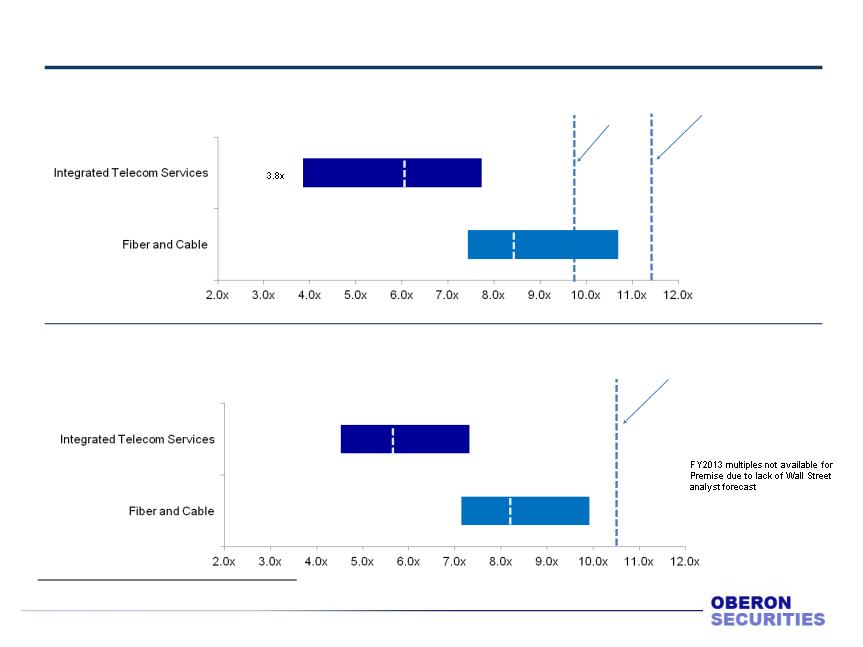
Comparable Public Company Analysis - Summary
23
Enterprise Value/LTM EBITDA
Enterprise Value/FY2013 EBITDA
Premise $1.58
Stock Price: 9.8x
Stock Price: 9.8x
Premise $2.00 Transaction
Price: 11.7x
Price: 11.7x
7.8x
10.8x
7.5x
Median 6.1x
Median 8.5x
7.4x
Median 5.7x
9.9x
Median 8.2x
Premise $2.00 Transaction
Price: 10.6x
Price: 10.6x
Note: Valuations reflect stock prices as of 10/17/13 and publicly available information.
7.2x
4.6x
Project Premise - CONFIDENTIAL
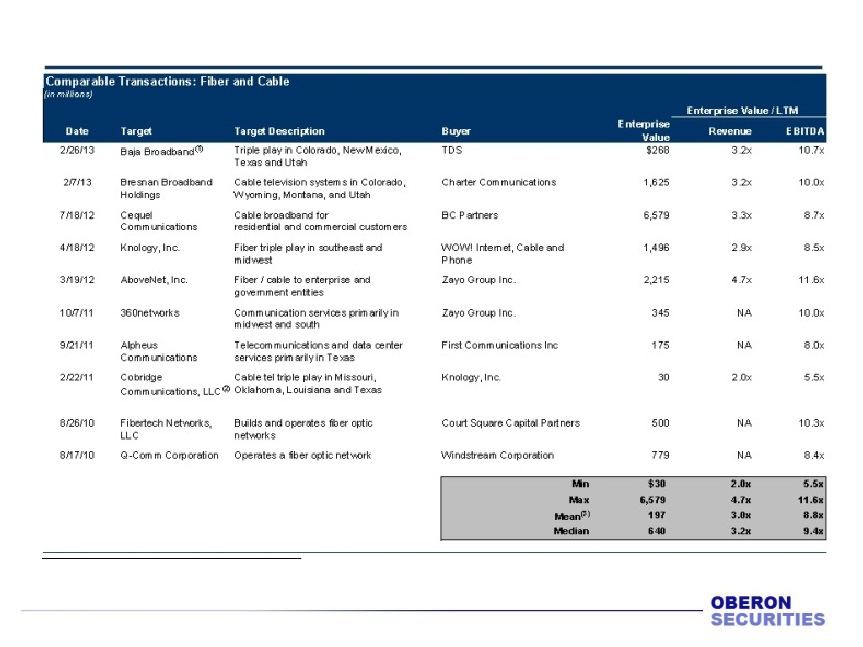
Comparable Precedent Transaction Analysis
24
§ As illustrated previously, the Company is transitioning from a CLEC providing legacy telecom services towards a pure
-play fiber based telecom service provider with triple play offering
-play fiber based telecom service provider with triple play offering
§ To capture this scope in business focus, we reviewed the precedent transactions in select universes of publicly traded
companies including (i) Fiber and Cable and (ii) Integrated Telecom Services(1) as follows:
companies including (i) Fiber and Cable and (ii) Integrated Telecom Services(1) as follows:
§ We have separated the two groups of comparable companies due to the differences in business model, service
offering, cost structure and growth characteristics
offering, cost structure and growth characteristics
§ Approximately two thirds of Premise’s LTM revenues were generated from non-fiber services
§ Although differences exist between the universe of comparable companies, the selected comparable companies share
similar customer base
similar customer base
Project Premise - CONFIDENTIAL
Comparable Precedent Transaction Analysis
25
Source: Capital IQ.
(1)EBITDA based on analyst estimates.
(2)Certain cable and broadband operations in Georgia and Alabama.
(3)Harmonic mean.
Project Premise - CONFIDENTIAL
Comparable Precedent Transaction Analysis
26
Source: Capital IQ.
(1)Represents the sale of Fairpoint Idaho-based operations.
(2)Harmonic mean.
Project Premise - CONFIDENTIAL
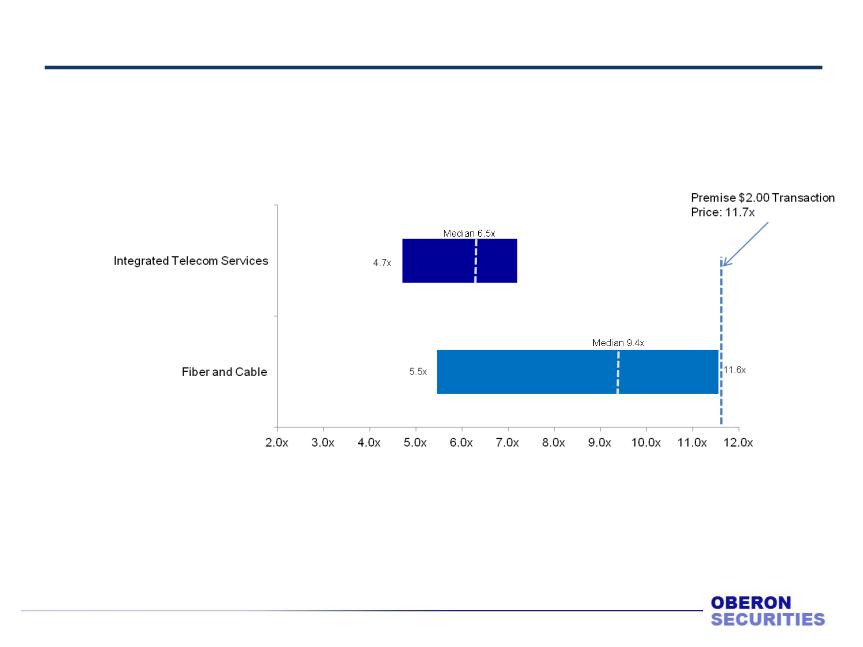
Comparable Precedent Transactions Analysis
27
Enterprise Value/LTM EBITDA
7.2x

Project Premise - CONFIDENTIAL
Discounted Cash Flow Methodology
28
Projections Utilized | § Based on management’s projections for a 5-year period through fiscal year 2018 § Assumes a 20% probability for 2 new smart build projects and a potential new RUS project § Assumes 75% of planned cost savings will be achieved during the projection period § Assumes that $22.9 million of NOLs as of 6/30/13 will be fully utilized by the end of 2016 |
Discount Rate | § Annual after-tax unlevered free cash flows for the fiscal years 2014 - 2018 were valued using discount rates ranging from 9%-13% § Discount rates used were based on CAPM using beta derived from publicly traded comparable companies in the Fiber and Cable and Integrated Telecom Services sectors and reflect the standalone WACC for the Company and the ranges of WACC of selected comparable companies |
Terminal Value | § Terminal value was calculated assuming 2018 EBITDA multiples of 5.0x-9.0x |
Project Premise - CONFIDENTIAL
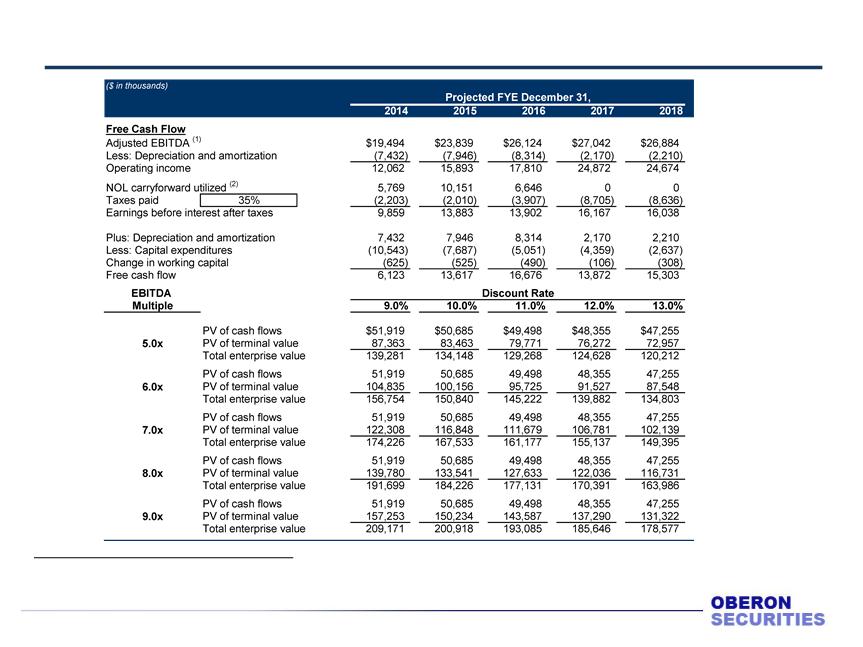
Discounted Cash Flow Analysis
29
Source: Premise management forecast.
Note: Calculated using mid-year convention and assumes transaction closes on December 31, 2013.
(1)EBITDA adjusted for planned cost savings, per Premise management. Assumes 75% of plan will be achieved.
(2)Assumes $22.9 million of NOLs as of 6/30/13 will be fully utilized by the end of 2016, per Premise management.
Project Premise - CONFIDENTIAL
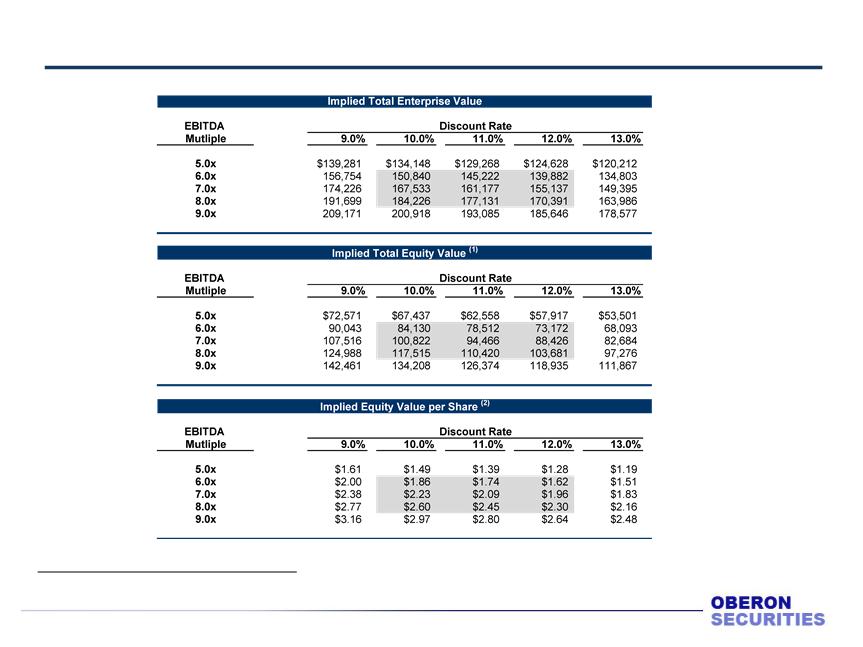
Discounted Cash Flow Analysis
($ in thousands, except per share data)
30
(1) Based on $66.7 million of estimated net debt of as of 12/31/2013.
(2) Based on 45.116 million fully diluted shares, calculated using treasury method based on $2.00 per share.

Project Premise - CONFIDENTIAL
Appendix
31
Project Premise - CONFIDENTIAL
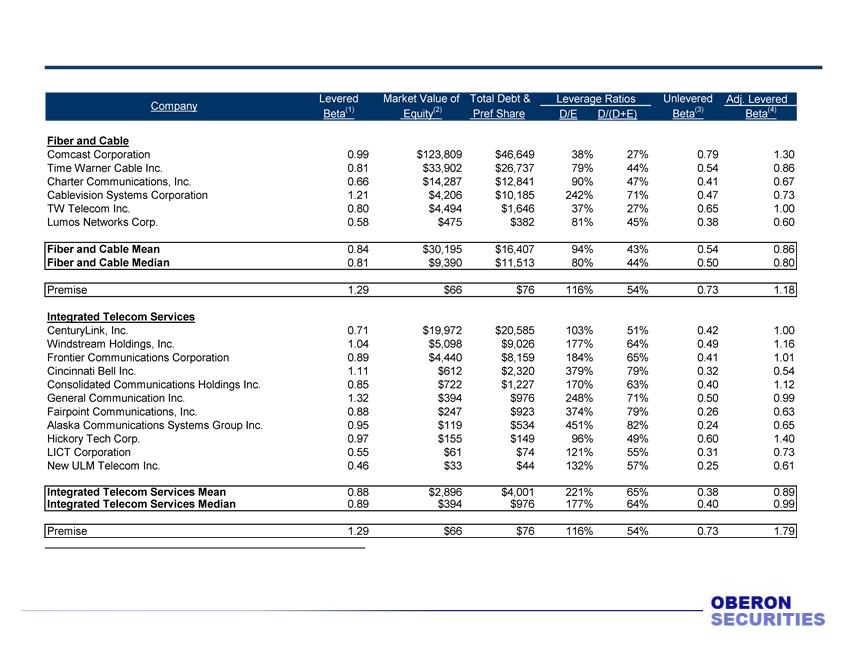
Weighted Average Cost of Capital Calculation
32
($ in thousands)
(1) 2-year historical weekly unadjusted beta provided by Capital IQ as of 10/17/13, adjusted by applying the formula employed by Bloomberg to derive
adjusted beta = (2/3 x beta) + (1/3x 1.0).
adjusted beta = (2/3 x beta) + (1/3x 1.0).
(2) Based on current shares outstanding.
(3) Unlevered beta = Levered beta / {1+ [(D/E)*(1-T)]}.
(4) Levered beta = Unlevered beta * {1 + [(D/E)*(1-T)]}.
Project Premise - CONFIDENTIAL
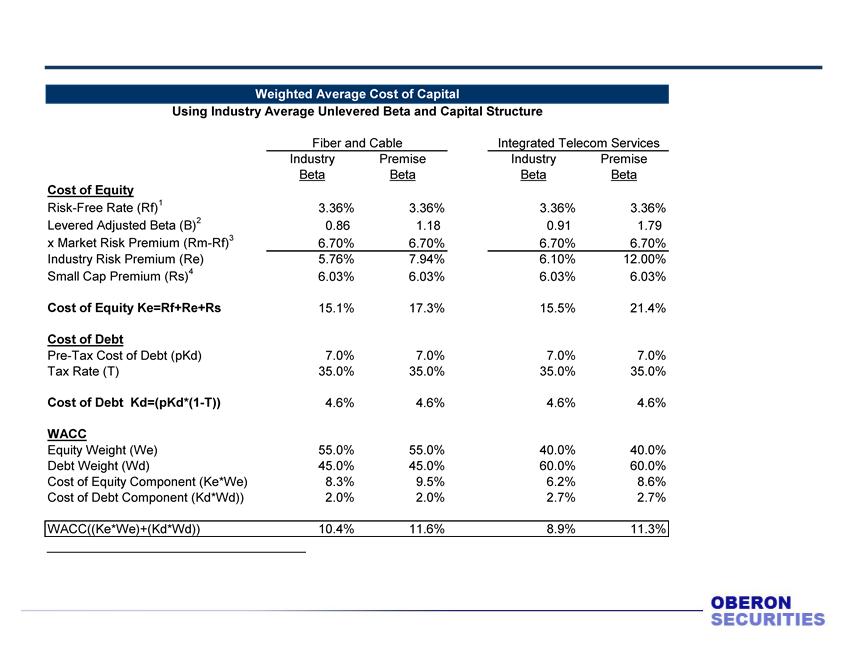
Weighted Average Cost of Capital Calculation (cont.)
33
(1) Based on 20-Year Treasury Note as of 10/17/13.
(2) Based on industry average leverage ratio.
(3) Source: Ibbotson Associates 2013 Yearbook; large company equity premiums less the risk-free rate.
(4) Source: Ibbotson Associates 2013 Yearbook; 10th decile size premium.
Project Premise - CONFIDENTIAL
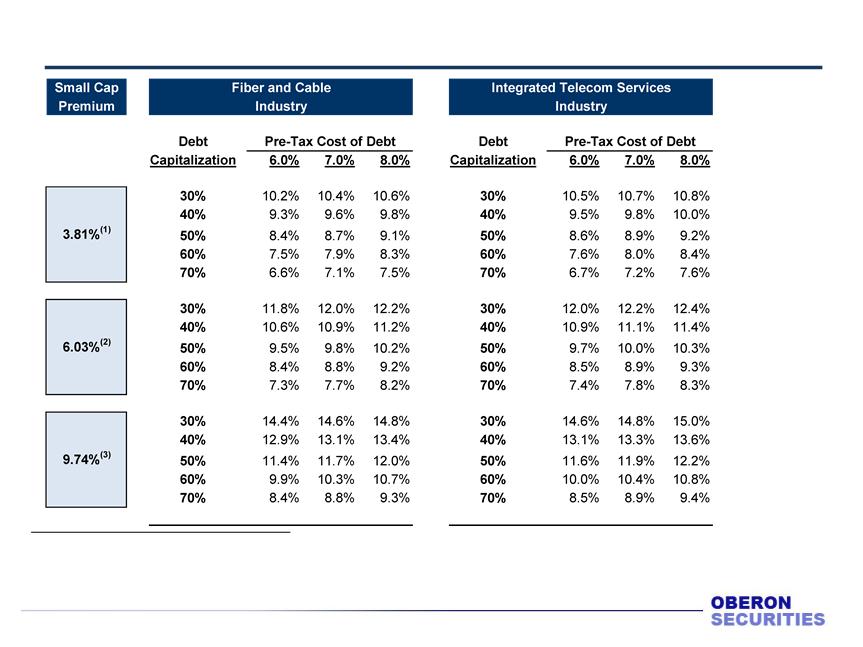
Weighted Average Cost of Capital Sensitivity Analysis
34
Note: WACC sensitivity analysis calculated using Premise’s levered adjusted betas of 1.18 using Fiber & Cable metrics and 1.79 using ITS metrics produce WACCs
that range from 7.3%-15.0% at 3.81% small cap premium, 7.9%-16.5% at 6.03% small cap premium, and 9.0%-19.1% at 9.74 small cap premium.
that range from 7.3%-15.0% at 3.81% small cap premium, 7.9%-16.5% at 6.03% small cap premium, and 9.0%-19.1% at 9.74 small cap premium.
•Ibbotson Associates 2013 Yearbook; Micro-Cap (deciles 9-10) equity risk size premium, reflecting market capitalization of $1.14 million - $514.21 million.
•Ibbotson Associates 2013 Yearbook; decile 10 equity risk size premium, reflecting market capitalization of $1.14 million - $253.77 million.
•Ibbotson Associates 2013 Yearbook; decile 10b decile equity risk size premium, reflecting market capitalization of $1.14 million - $165.60 million.
.
Project Premise - CONFIDENTIAL
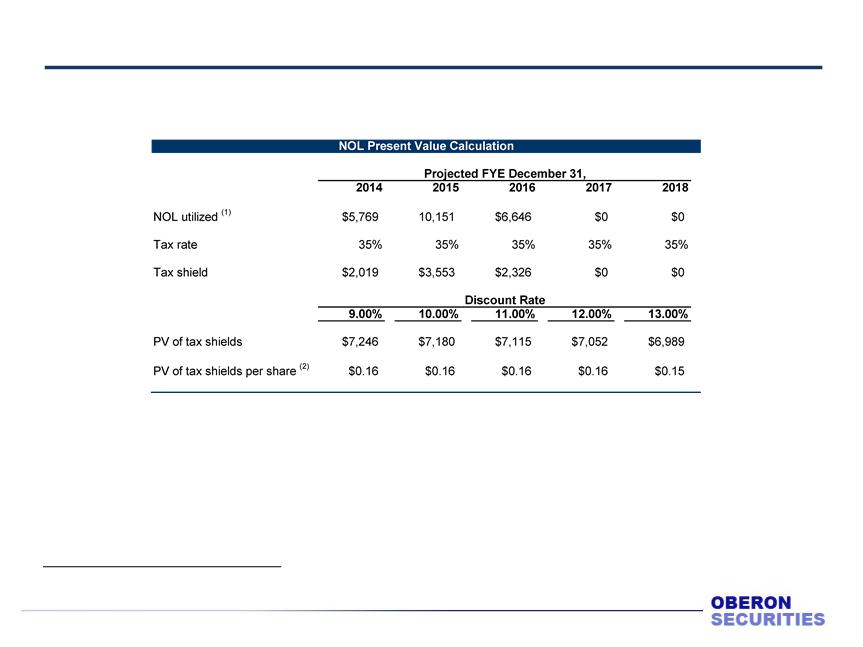
NOL Present Value Analysis
35
Note: Calculated using mid-year convention and assumes transaction closes on December 31, 2013.
(1)Assumes $22.9 million of NOLs as of 6/30/13 will be fully utilized by the end of 2016, per Premise management.
(2)Based on 45.116 million fully diluted shares, calculated using treasury method based on $2.00 per share.
EXHIBIT (c)(4)
Strictly Private and Confidential
Los Angeles
San Francisco
New York
Newport Beach
Boston
NTS, Inc. Fairness Opinion Supplement
Presentation to the Board of Directors
Presentation to the Board of Directors
October 20, 2013
B. Riley & Co., LLC
Member FINRA & SIPC
www.brileyco.com

Confidential
2
Qualification and Limiting Conditions
This document has been prepared for the Board of Directors (the “Board”) of NTS, Inc. (“NTS” or the “Company”) by B. Riley & Co., LLC (“BRC”), in
connection with its engagement by the Special Committee to the Board of Directors of NTS (the “Committee”) to provide an opinion as to the
fairness, from a financial point of view, as of the date of the opinion, to the Board in respect of the cash consideration (the “Consideration”) to be
received by the holders of Company common stock (other than any stockholders rolling over shares) from Tower Three Partners (“T3") in
connection with the proposed acquisition of 100% of NTS’ common stock by T3 North Intermediate Holdings, LLC and North Merger Sub, Inc. (the
“Proposed Transaction”).
Neither this document nor the information contained herein is for investment purposes or for distribution to the public or any other entity
without the express written permission of BRC. Any recipient of this document hereby agrees that all information contained herein is confidential,
and that they will treat it as such, and will not, without prior written consent from BRC, directly or indirectly, disclose, copy or distribute such
information.
The corporate information contained in this presentation was furnished by the management of NTS. B. Riley has relied on, but did not assume
any responsibility to independently investigate or verify the accuracy, completeness and fairness, of all such information provided during this
engagement. The conclusions contained herein are conditioned upon the information being accurate, complete and fair in all respects.
any responsibility to independently investigate or verify the accuracy, completeness and fairness, of all such information provided during this
engagement. The conclusions contained herein are conditioned upon the information being accurate, complete and fair in all respects.
All estimates, budgets, forecasts and projections contained herein have been prepared by the management of NTS and involve numerous and
significant subjective determinations. The estimates, budgets, forecasts and projections contained herein may or may not be achieved and
differences between projected results and those actually achieved may be material. BRC assumed that the forecasts and projections provided
herein were prepared on a basis reflecting the best currently available estimates and good faith judgments of NTS management as to future
performance for all periods specified therein.
No representation or warranty, expressed or implied, is made as to the accuracy, completeness, or fairness of such information and nothing
contained herein is, or shall be relied upon as, a promise or representation of past or future results. Neither BRC nor any of its advisors take any
responsibility for the accuracy or completeness of any of the accompanying information. BRC has not been requested to and did not make an
independent evaluation or appraisal of the assets or liabilities (contingent or otherwise known or unknown) of NTS.

Confidential
3
Qualification and Limiting Conditions (cont’d)
Consistent with applicable legal and regulatory requirements, BRC has adopted certain policies and procedures to establish and maintain the
independence of BRC’s research departments and personnel. As a result, the research analysts of BRC and its affiliates may hold views, make
statements or investment recommendations and/or publish research reports with respect to NTS, the Proposed Transaction and other
participants in the Proposed Transaction that differ from the views of BRC’s investment banking personnel.
In the ordinary course of its business, BRC and its affiliates may actively trade or hold (for their own accounts or for the accounts of their
customers) equity and debt securities, bank debt and/or other financial instruments issued by NTS or other participants in the Proposed
Transaction as well as derivatives thereof, and, accordingly, may at any time hold long or short positions in these securities, bank debt, financial
instruments and derivatives.
The type and amount of consideration payable in the Proposed Transaction were determined through negotiations between NTS and T3 and are
subject to the approval of its Board. The decision to enter into the Proposed Transaction is solely that of the Board. The BRC fairness opinion (the
“Opinion”) is just one of the many factors taken into consideration by the Board of NTS. Consequently, BRC’s analyses should not be viewed as
determinative of the Board’s decision with respect to the fairness, from a financial point of view, of the consideration to be paid to the holders of
Company common stock in the Proposed Transaction.
The Opinion has been approved by BRC’s Fairness Opinion Committee in accordance with its established policies and procedures.

Confidential
4
Table of Contents
1. Introduction
2. NTS, Inc. Company Overview
3. Valuation Analysis
4. Appendix

Introduction

Confidential
6
Situation Overview
q NTS, Inc. (“NTS” or the “Company”) has reached an agreement to be acquired by T3 North Intermediate
Holdings, LLC and North Merger Sub, Inc. (together “T3 North”), a wholly-owned subsidiary of Tower Three
Partners, LLC (“T3”), for cash consideration of $2.00 per share of NTS common stock (the “Proposed
Transaction”)
Holdings, LLC and North Merger Sub, Inc. (together “T3 North”), a wholly-owned subsidiary of Tower Three
Partners, LLC (“T3”), for cash consideration of $2.00 per share of NTS common stock (the “Proposed
Transaction”)
q B. Riley & Co., LLC (“BRC” or “B. Riley”) has been engaged by the Special Committee to the Board of Directors
(the “Committee”) of NTS to render an opinion (the “Opinion”) as to the fairness, as of the date of the
Opinion, from a financial point of view, of the cash consideration to be received by the holders of Company
common stock (other than any stockholders rolling over shares) in the Proposed Transaction
q B. Riley was engaged solely to render the Opinion and was not engaged to, and did not, solicit any
indications of interest from any parties with respect to a sale of all or part of the Company or any alternative
transaction. The Opinion does not address the relative merits of the Proposed Transaction as compared to
any alternative transaction or opportunity that might be available to the Company, nor does it address the
underlying business decision by the Company to engage in the Proposed Transaction. The Opinion does not
constitute a recommendation as to how any holder of shares of Company common stock should vote on the
Proposed Transaction or any matter related thereto. In addition, BRC has not been asked to address, and the
Opinion does not address, the fairness to, or any other consideration of, the holders of any other class of
securities, creditors or other constituencies of the Company

Confidential
7
Situation Overview (cont'd)
q Based on B. Riley’s conversations with certain members of senior management of the Company and Board of
Directors, we understand the Company has held discussions with strategic and financial buyers in evaluating
alternatives to execute on its strategic growth plan:
Directors, we understand the Company has held discussions with strategic and financial buyers in evaluating
alternatives to execute on its strategic growth plan:
§ In August 2011, NTS signed Non-Disclosure Agreements (“NDAs”) with and entered into discussions
with two strategic parties regarding a potential sale. It was determined that the build out of NTS’ fiber
network was too early stage for an acquisition by the strategic parties
with two strategic parties regarding a potential sale. It was determined that the build out of NTS’ fiber
network was too early stage for an acquisition by the strategic parties
§ In March 2013, T3 approached NTS via the Company’s financial advisor, Oberon Securities LLC
(“Oberon”), to engage in preliminary discussions. Key events following the initial introduction are
documented in subsequent pages
(“Oberon”), to engage in preliminary discussions. Key events following the initial introduction are
documented in subsequent pages
§ As discussions between T3 and NTS progressed, Oberon approached two additional financial buyers /
investors to gauge interest in pursuing a transaction with NTS in August 2013
investors to gauge interest in pursuing a transaction with NTS in August 2013
• Both financial buyers entered into NDAs and received diligence materials, including financial
projections prepared by management of the Company
projections prepared by management of the Company
• One party indicated an interest in providing capital in the form of subordinated debt or
preferred equity; the other party indicated a willingness to provide a PIPE at the then current
market share price of approximately $1.50
preferred equity; the other party indicated a willingness to provide a PIPE at the then current
market share price of approximately $1.50

Confidential
8
Situation Overview (cont'd)
Review of select events
q March 14 Introductory call among NTS, T3 and Oberon Securities, LLC (“Oberon”), financial
advisor to the Company
advisor to the Company
q April 10 NDA executed between NTS and T3
q April 24-25 Principal meeting in Dallas, Texas, after which diligence materials are shared
q May 29 Principal meeting in Greenwich, Connecticut to discuss actionable consolidation
opportunities
opportunities
q August 2 T3 submits non-binding Letter of Intent indicating $2.00 per share purchase price
and requesting 30-day period of exclusivity with the Company
and requesting 30-day period of exclusivity with the Company
Weil, Gotshal & Manges, LLP retained as T3 counsel
q August 14 Principal meeting to update on organic growth initiatives and non-organic growth
opportunities
opportunities
q August 19 T3 submits diligence schedule and request list
q August 21 Letter of Intent executed and 30-day period of exclusivity commences
q Mid-August Special Committee to Board of Directors (the “Committee”) formed
q Mid-September Olshan, Frome, Wolosky LLP retained as Committee counsel
Confidential
9
Current Summary of Key Transaction Terms
Price per Share | § $2.00 per share |
Consideration | § 100% cash |
Required Financing | § Rollover of one-third shares held by Guy Nissenson, Chairman of the Board, President and Chief Executive Officer § Assumes requisite waivers and / or consents are obtained, as necessary, for rollover of existing debt, including notes payable to ICON Agent, LLC, Senior Unsecured Series A Bonds issued December 2007 and Rural Utilities Service (“RUS”) loans outstanding |
Deal Protection | § 2.50% NTS break-up fee in the case of a Go-Shop Excluded Party; 4.50% NTS break-up fee in any other circumstance § 1.50x reverse break-up fee equal to the 4.50% break-up fee. Alternatively, prior to termination of the agreement the Company can seek specific performance. The reverse break-up fee and specific performance are the Company’s remedies if the Company satisfies all of its conditions to closing, yet T3 determines not to close for any reason |
Go-Shop Provision | § 30 days |
Conditions to Close | § Customary for transactions of this nature § HSR approval § Shareholder vote § Absence of Material Adverse Effect § No material breach of representations and warranties and covenants |
___________________________
Note: Defined terms have the same meaning as in the draft Agreement dated October 19, 2013.
Confidential
10
Scope of Work
BRC performed the following activities, among others, in formulating its Opinion
q Reviewed the financial terms of the draft Agreement and Plan of Merger (the “Agreement”) dated October
19, 2013;
19, 2013;
q Reviewed certain publicly available information, which we believe to be relevant, concerning the business,
financial condition and operations of NTS;
financial condition and operations of NTS;
q Reviewed certain information internal to NTS concerning its business, financial condition and operations,
prepared and furnished to us by the management of the Company;
prepared and furnished to us by the management of the Company;
q Reviewed NTS’ financial forecast furnished to us by the management of the Company;
q Reviewed certain internal financial analyses, estimates and forecasts, prepared and furnished to us by the
management of the Company;
management of the Company;
q Reviewed the Company’s annual and quarterly audited and unaudited financial statements through June 30,
2013;
2013;
q Held discussions with members of senior management of NTS concerning their evaluations of the Proposed
Transaction, the business, operating and regulatory environment, financial condition, prospects, and
strategic objectives of the Company, as well as such other matters as we deemed necessary or appropriate
for purposes of rendering the Opinion;
Transaction, the business, operating and regulatory environment, financial condition, prospects, and
strategic objectives of the Company, as well as such other matters as we deemed necessary or appropriate
for purposes of rendering the Opinion;
q Reviewed certain publicly available financial data, stock market performance data and trading multiples of
companies which we deemed to be generally comparable to the Company;
companies which we deemed to be generally comparable to the Company;

Confidential
11
Scope of Work (cont'd)
q Reviewed the publicly available financial terms of certain other business combinations that we deemed to be
relevant in industries similar to those in which the Company participates and the consideration received for
such companies that we believe to be generally relevant;
relevant in industries similar to those in which the Company participates and the consideration received for
such companies that we believe to be generally relevant;
q Performed a discounted cash flow analysis of NTS utilizing financial information prepared by and furnished
to us by the management of the Company;
to us by the management of the Company;
q Reviewed and analyzed premiums paid in business combinations involving publicly traded companies that
BRC deemed to be generally comparable to NTS with respect to size and industry; and
BRC deemed to be generally comparable to NTS with respect to size and industry; and
q Performed such other financial studies, analyses and investigations, and considered such other matters, as
we deemed necessary or appropriate for purposes of rendering the Opinion.
we deemed necessary or appropriate for purposes of rendering the Opinion.

NTS, Inc. Company Overview
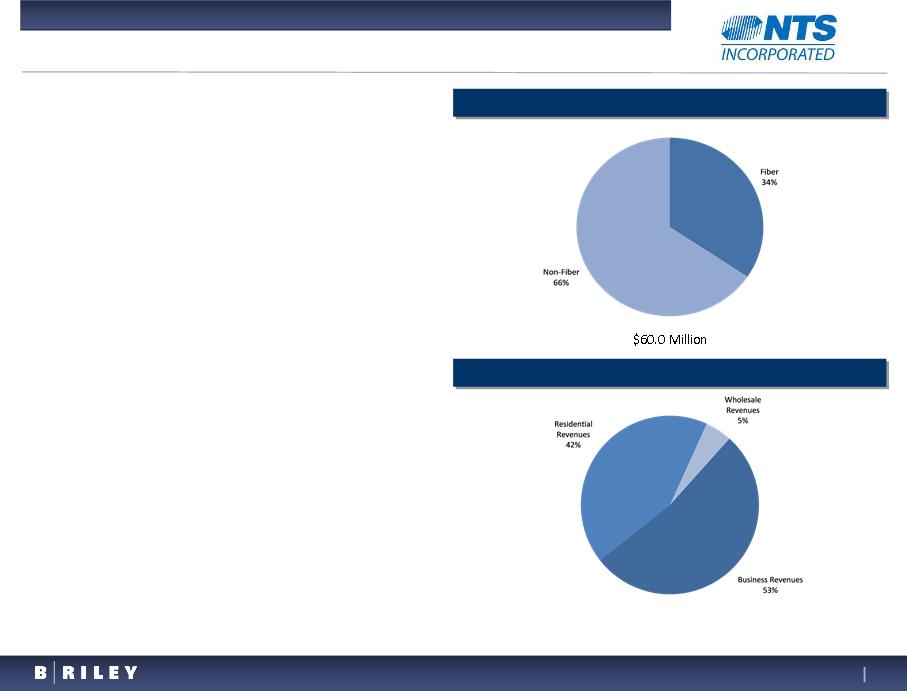
Confidential
13
NTS, Inc. Overview
___________________________
Source: Company.
q NTS is a publicly traded telecommunications company
(NYSE/TASE: NTS) operating in the U.S.
(NYSE/TASE: NTS) operating in the U.S.
q Offers a wide range of services, including broadband
data, IPTV video services, local dial tone, point-to-point
long haul, mobile wireless services, long distance and
international telephony, Toshiba telephone systems,
Internet hosting MPLS data services and reselling
opportunities
data, IPTV video services, local dial tone, point-to-point
long haul, mobile wireless services, long distance and
international telephony, Toshiba telephone systems,
Internet hosting MPLS data services and reselling
opportunities
q Operates the largest "non-ILEC" telecommunications
network in West Texas and has developed a Fiber-To-The-
Premise (“FTTP”) platform enabling the Company to
provide a voice, video and data "triple play" offering to its
customers
network in West Texas and has developed a Fiber-To-The-
Premise (“FTTP”) platform enabling the Company to
provide a voice, video and data "triple play" offering to its
customers
§ Broadband networks in underserved North Texas and
Louisiana communities funded by approximately $100
million of federal grants ($46 million) and loans ($54
million) from the USDA Rural Utility Service (“RUS”)
Louisiana communities funded by approximately $100
million of federal grants ($46 million) and loans ($54
million) from the USDA Rural Utility Service (“RUS”)
§ Recently launched “metro build” strategy specifically
targeting business customers in select markets: Wichita
Falls (Q1 2013), Abilene (Q2 2013) and Amarillo (Q4
2013E)
targeting business customers in select markets: Wichita
Falls (Q1 2013), Abilene (Q2 2013) and Amarillo (Q4
2013E)
q NTS was founded in 1981 and is headquartered in
Lubbock, Texas
Lubbock, Texas
LTM Revenues
LTM Fiber Revenues
$20.6 Million
Confidential
14
Summary Federally Funded FTTP Projects
___________________________
Source: Company.
(1) Excludes installations.
Project Name | Total Investment | Residential Passings | Business Passings | Total Passings | Sales Commencement | Project Completion(1) |
Levelland | $12 million | 5,400 | 310 | 5,710 | Q4 2009 | April 2010 |
North Texas [1] | $45 million ($22 million Grant) | 11,252 | 2,200 | 13,452 | Q2 2011 | Q4 2013E |
North Texas [2] | $19 million ($6 million Grant) | 7,800 | 500 | 8,300 | Q2 2011 | Completed |
Louisiana | $36 million ($18 million Grant) | 6,745 | 2,978 | 9,723 | Q2 2013 | Q4 2013E |
Total | $112 million ($46 million Grant) | 31,197 | 5,988 | 37,185 |
NTS’ “PRIDE Network Inc.” won approval of three applications for federal funding, representing the fifth
largest recipient of broadband funding
largest recipient of broadband funding
q NTS was selected to receive approximately $100 million in total financing that will increase total passings by 30,000+
§ $46 million in the form of grants
§ $54 million in the form of 19-year non-recourse loans to build two FTTP networks in North Texas and one FTTP network in
Louisiana
Louisiana
q Due to the nature of RUS grants and loans, BRC notes limited Federal Stimulus funding may be available on a go-forward
basis
basis
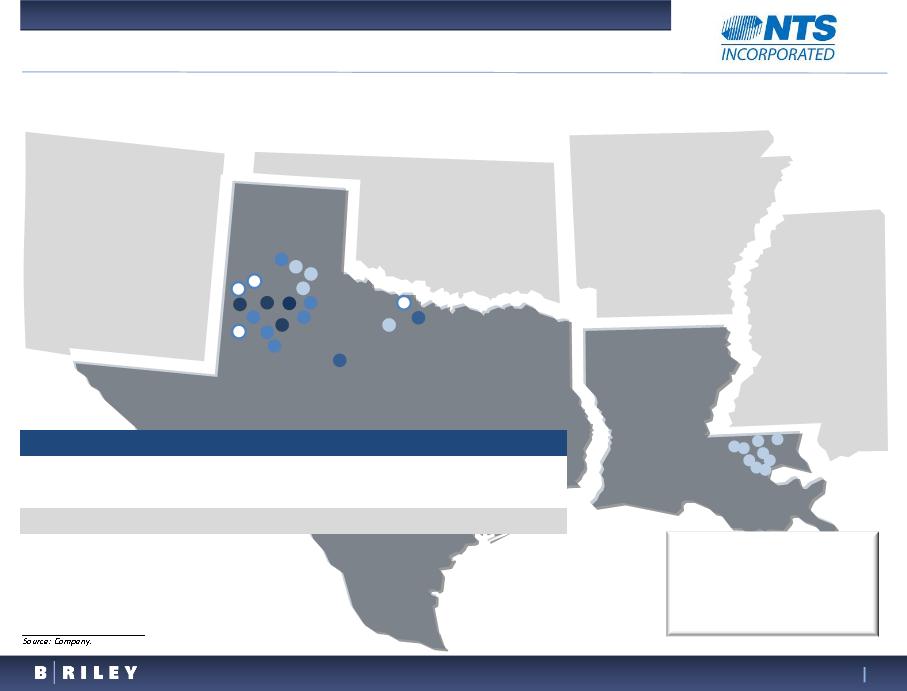
Confidential
15
NTS FTTP Network Footprint
NTS’ fiber network is currently available in 18 communities in Texas
● = Pre-PRIDE FTTP buildout
○ = 2011 FTTP buildout
● = 2012 FTTP buildout
● = 2013 FTTP buildout
● = Smart Build network
As of Q2 2013 | Passings | Customers | Take Rate | ARPU |
Business | 8,320 | 2,898 | 35% | $348 |
Residential | 38,935 | 7,894 | 20% | $102 |
Total | 47,255 | 10,792 | 23% | $178 |
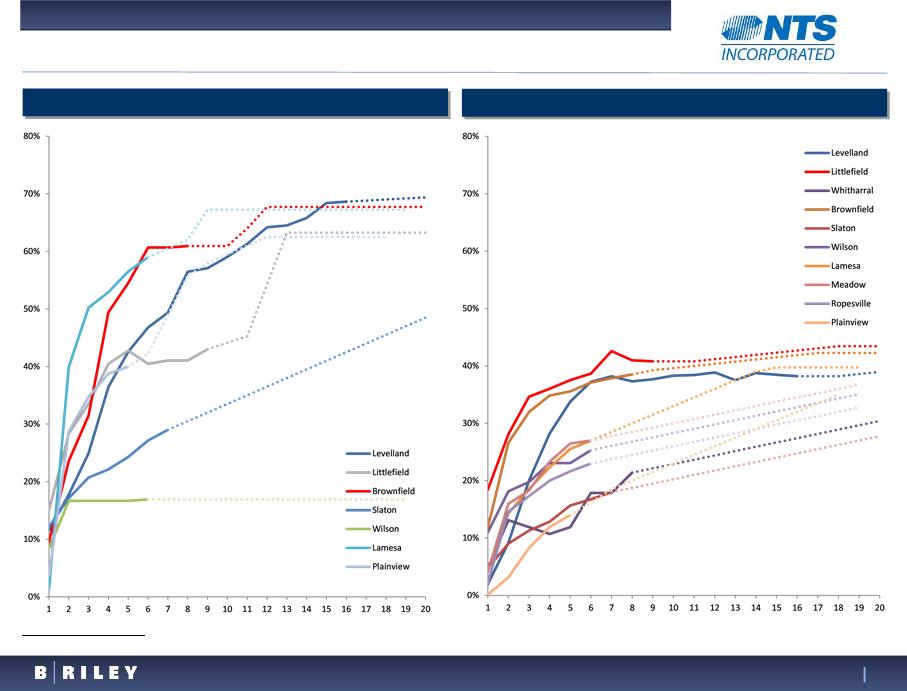
Confidential
16
NTS Take Rates in Key Markets
Source: Company.
Pride 1 - Residential Take Rates
Pride 1 - Business Take Rates

Confidential
17
Summary Financial Performance
Gross Profit and Margin(1)
Adjusted EBITDA and Margin(2)
___________________________
Source: Company filings and management forecast.
(1) Excludes depreciation and amortization.
(2) Adjusted EBITDA excludes stock-based compensation, asset impairments and cost savings.
($ in millions)
($ in millions)
($ in millions)
Net Sales
Passings and Take Rate
9.9%
3-Yr CAGR
3-Yr CAGR
30.9%
3-Yr CAGR
3-Yr CAGR
3-Yr CAGR
-9.9%
35.0%
3.9%
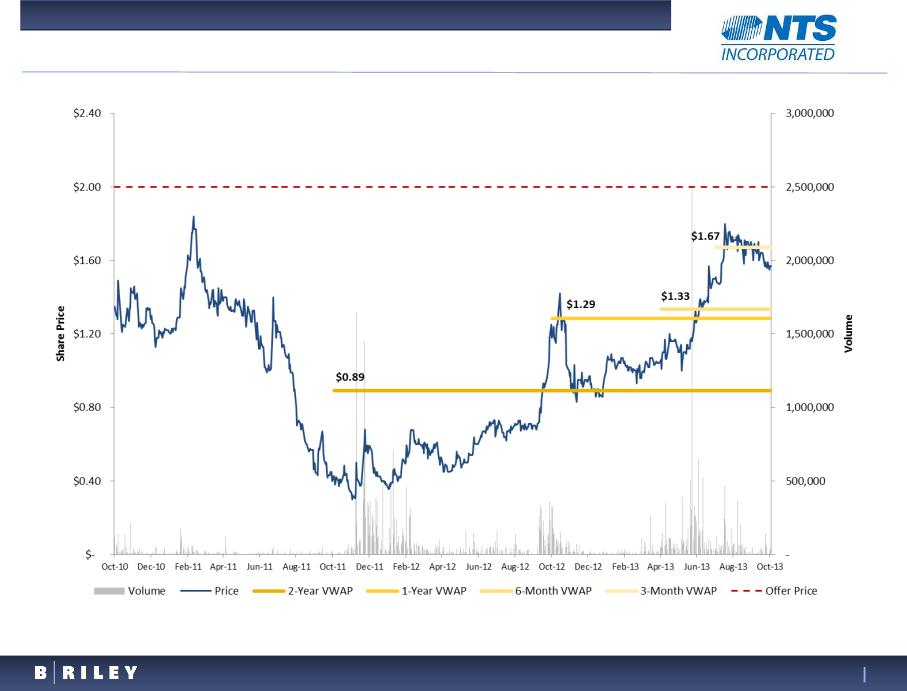
Confidential
18
NTS Historical Share Price Performance
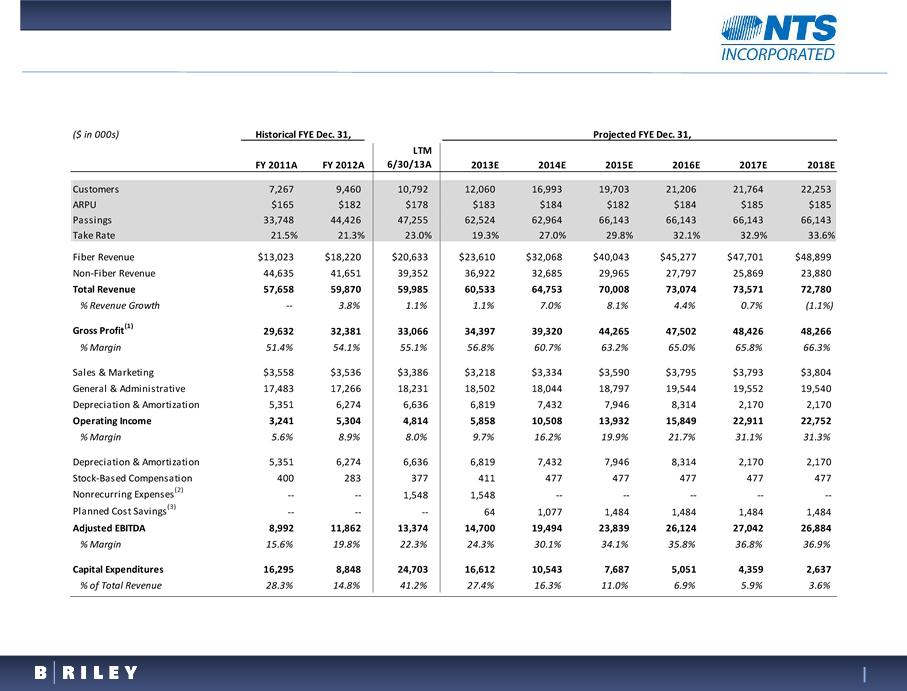
Confidential
19
Summary Financials
___________________________
Source: Company filings and management forecast.
(1) Gross profit excludes depreciation and amortization.
(2) Nonrecurring expenses include $1.0 million from an increase in bad debt expense and $519,000 due to the write-off of assets acquired during various acquisitions.
(3) Reflects planned cost reductions in IT, payroll, transport and headquarters related expenses.
Financial projections assume management base case

Valuation Analysis
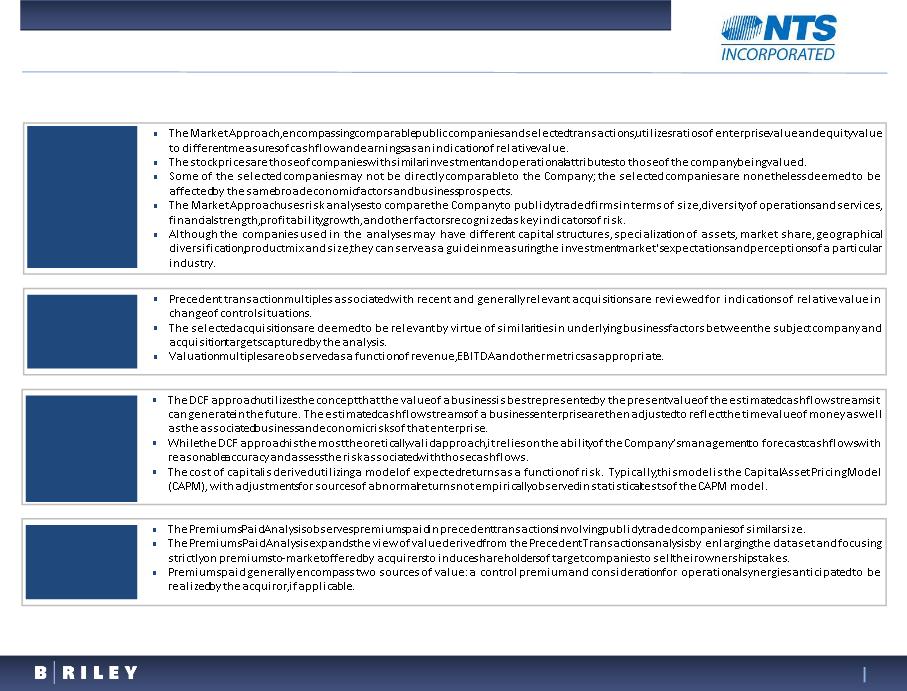
Confidential
21
Valuation Methodologies
Market
Multiples
Multiples
Discounted
Cash Flow
Cash Flow
Precedent
Transactions
Transactions
Premiums Paid
Analysis
Analysis
BRC utilized the following methodologies to value the Company
Confidential
22
Public Company Comparables - Summary Descriptions
CLEC and Telecom Comparables
Alaska Communications Systems Group, Inc. (NASDAQ: ALSK) | Alaska Communications provides leading integrated communications services to business and consumer customers in and out of Alaska. The company’s communications network extends throughout Alaska and is connected to the contiguous states via its two diverse undersea fiber optic cable systems: (i) the AKORN® system and (ii) the Northstar system. |
CenturyLink, Inc. (NYSE: CTL) | Century Link is an integrated communications company which provides an array of communications services to the residential, business, governmental and wholesale customers. Services include local and long-distance, network access, private line, public access, broadband, data, managed hosting, colocation, wireless and video services. In certain local and regional markets, they also provide local access and fiber transport services to CLECs and security monitoring. |
Cincinnati Bell Inc. (NYSE: CBB) | Cincinnati Bell provides data and voice communications services over wireline and wireless networks, managed and professional information technology services, and it resells information technology and telephony equipment. It provides telecommunications services to businesses and consumers in the Greater Cincinnati and Dayton, Ohio areas. |
Consolidated Communications Holdings, Inc. (NASDAQ: CNSL) | Consolidated Communications Holdings provides communications services to residential and business customers in Illinois, Texas, Pennsylvania, California, Kansas and Missouri. It offers local and long-distance service, high-speed broadband Internet access, video services, digital telephone service (“VOIP”), custom calling features, private line services, carrier grade access services, network capacity services over our regional fiber optic networks, directory publishing and CLEC services. |
Frontier Communications Corporation (NASDAQ: FTR) | Frontier Communications provides services to rural areas and small and medium-sized towns and cities in the U.S. It offers voice, data, Internet, and television services and products. The company provides both regulated and unregulated voice, data and video services to residential, business and wholesale customers. |
HickoryTech Corporation (NASDAQ: HTCO) | HickoryTech provides communications to business and residential customers in the upper Midwest through its multistate fiber network. The Fiber and Data segment serves wholesale, enterprise and small to medium business customers with high-speed communications products. The company also offers local phone, long distance, high-speed Internet, digital TV, advanced business and IP networking services. Its products and services support Cisco' equipment sold to business customers. |
Windstream Holdings, Inc. (NASDAQ: WIN) | Windstream Holdings provides telecommunication, high-speed Internet, long distance, network access and video services in 16 states. Windstream Yellow Pages publishes all its local directories and for more than 100 other independent telephone companies. Windstream Supply operates four warehouses across the United States which house a wide variety of products used to support voice, high-speed data and video applications. |
Confidential
23
Public Company Comparables - Summary Descriptions
Cable Comparables
Cablevision Systems Corporation (XNYS: CVC) | Cablevision Systems is a telecommunications and media company that offers advanced digital television, voice and high-speed Internet services, local media and programming properties and movie theatres. The Telecommunications Services segment includes the company's cable television business, including its video, high-speed data, and Voice over Internet Protocol operations and the operations of the commercial high-speed data and voice services provided by Optimum Lightpath. The other segment, Newsday, includes the Newsday daily newspaper, amNew York, Star Community Publishing Group, and online websites, including newsday.com and exploreLI.com. |
Charter Communications, Inc. (NASDAQ: CHTR) | Charter Communications provides entertainment, information, and communications solutions to residential and commercial customers. The company offers cable video programming services, Internet services, Charter.net and telephone services. It also provides broadband communications solutions to business and carrier organizations. |
Time Warner Cable Inc. (NYSE: TWC) | Time Warner Cable provides video, high-speed data and voice services in the U.S. The company offers residential and business customers with video, high-speed data and voice services through its broadband cable systems. Its business services also include networking and transport services and, through its wholly owned subsidiary, NaviSite, Inc., manages and outsources information technology solutions and cloud services. It also provides advertising to a variety of national, regional and local customers. |
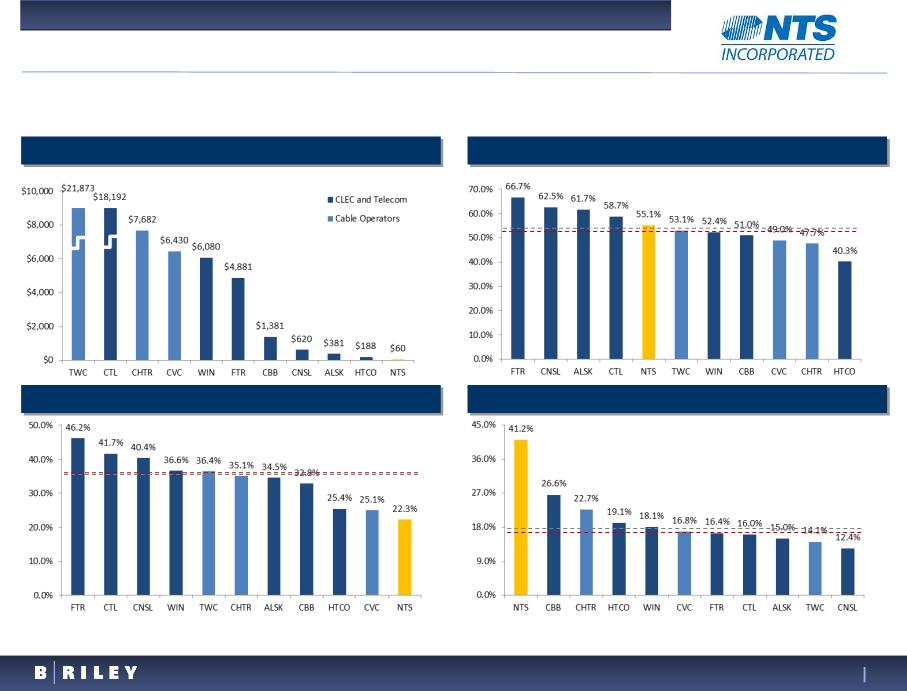
Confidential
24
Public Company Comparables - Key Financial Statistics
Median:
52.7%
Mean:
54.3%
($ in millions)
LTM Revenues
LTM Gross Profit Margin(1)
LTM Adjusted EBITDA Margin(2)
LTM Capex % Revenues
Median:
35.8%
Mean:
35.4%
Median:
16.6%
Mean:
17.7%
___________________________
Source: FactSet.
(1) Excludes depreciation and amortization.
(2) Excludes stock-based compensation.
NTS is significantly smaller than public comparables and will require high capex levels to build out its fiber
network
network
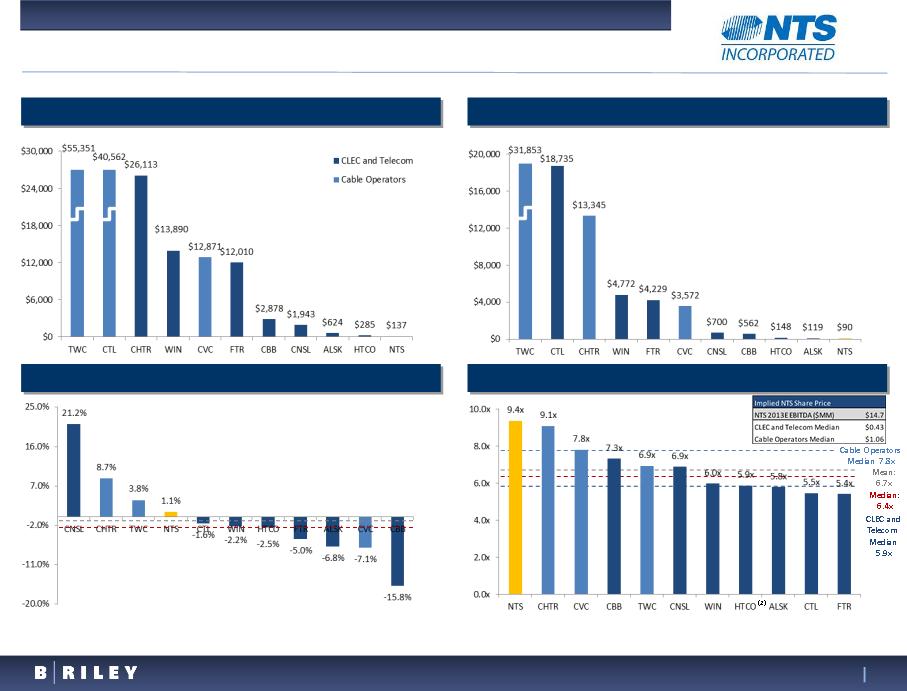
Confidential
25
Public Company Comparables - Relative Valuation
($ in millions)
Enterprise Value(1)
Market Capitalization(1)
2013E Revenue Growth
Enterprise Value / CY 2013E EBITDA(1)
Mean:
-0.7%
Median:
-2.4%
___________________________
Source: FactSet.
Note: Implied NTS share price utilizes treasury method and assumes conversion of in-the-money warrants and options in calculating diluted shares outstanding.
(1) Price as of October 11, 2013.
(2) HTCO 2013E revenue and EBITDA based on the mid point of management guidance.
($ in millions)
(2)
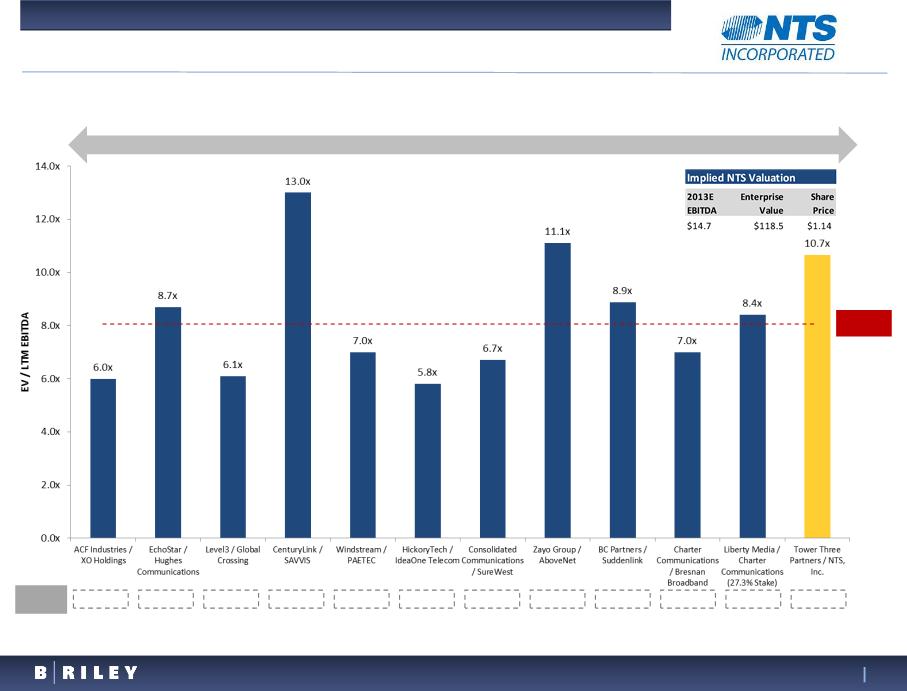
Confidential
26
Precedent Comparable Transactions
2011
2013
Average
8.1x(1)
___________________________
Source: FactSet and public filings.
Note: Implied NTS share price utilizes treasury method and assumes conversion of in-the-money warrants and options in calculating diluted shares outstanding.
(1) Average excludes Tower Three Partners / NTS, Inc. multiple.
$1,100
$1,934
$2,590
$2,964
$2,245
$28
$530
$2,142
$6,600
$1,625
$22,184
Total EV
$157
The following precedent transactions were identified on the basis of underlying similarities in the
acquired company business models and operations
acquired company business models and operations
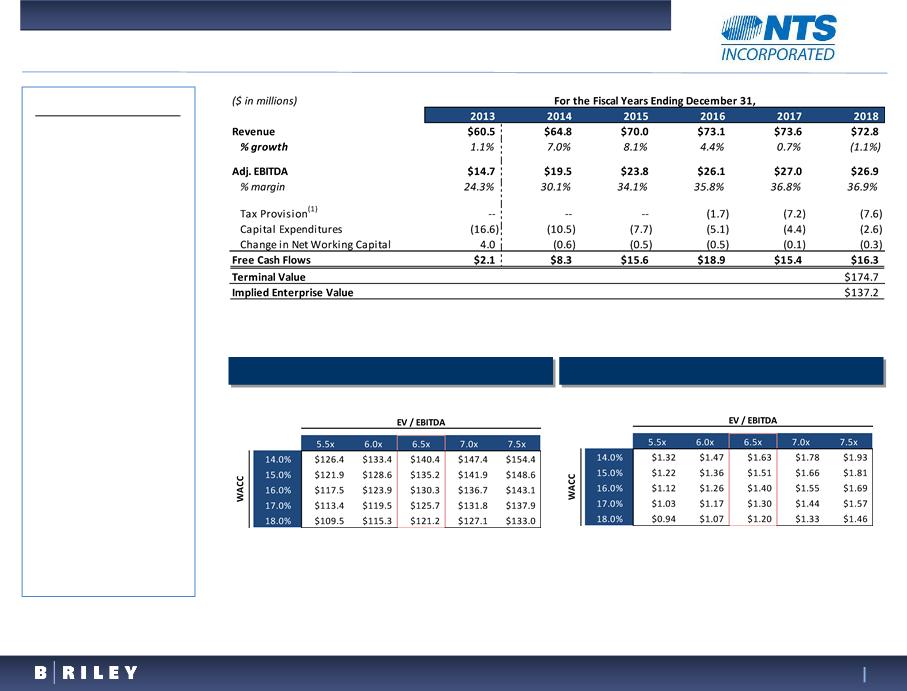
Confidential
27
Discounted Cash Flow Valuation
Key Assumptions
§NTS cost of capital derived
using CAPM adjusted for excess
returns associated with
company size
using CAPM adjusted for excess
returns associated with
company size
§Risk free rate of 2.5% based
on long-term (20-year) U.S.
Treasury coupon bond yield
on long-term (20-year) U.S.
Treasury coupon bond yield
§Market risk premium of 6.6%
§Micro-cap size premium of
11.8%
11.8%
§Un-levered Beta of 0.42,
drawn from subset of public
comparables
drawn from subset of public
comparables
§Marginal cost of debt
assumed to be 11.7%,
excluding RUS loans
assumed to be 11.7%,
excluding RUS loans
§Target capital structure
assumed to be approximately
46.6% debt / market equity
based on NTS current capital
structure
assumed to be approximately
46.6% debt / market equity
based on NTS current capital
structure
§Resulting cost of equity of
17.9%
17.9%
§WACC of 14.6%
Implied Enterprise Value
Implied Share Price
___________________________
Note: Implied NTS share price utilizes treasury method and assumes conversion of in-the-money warrants and options in calculating diluted shares outstanding.
(1) Assumes full utilization of $22.9 million NOL as of June 30, 2013.
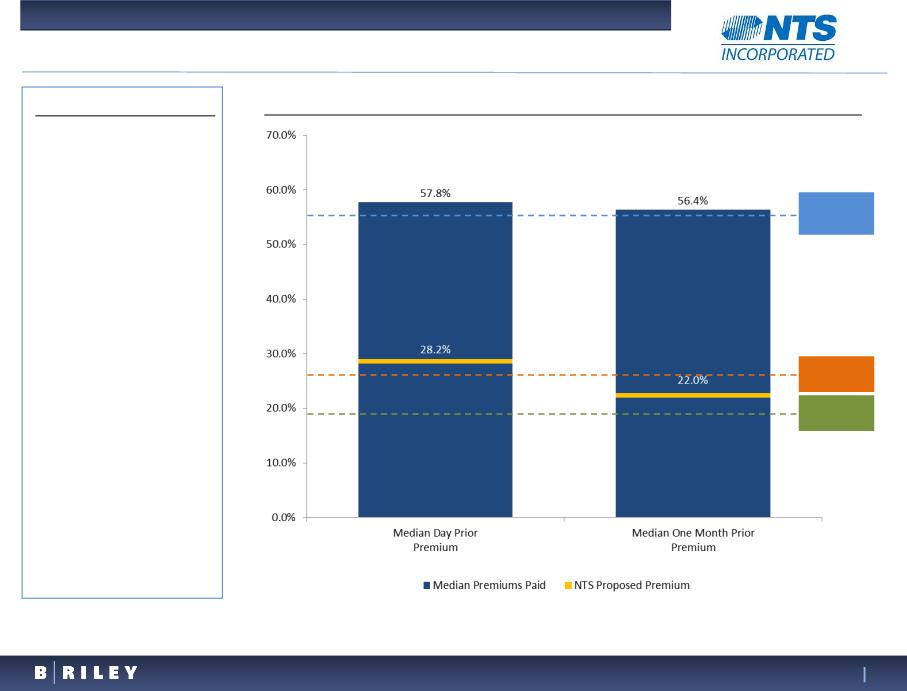
Confidential
28
Premiums Paid Analysis
Data Set
§51 selected change-of-control
transactions dating back to January
2010
transactions dating back to January
2010
§North American listed public
companies
companies
§Market capitalization range from
$25 million to $100 million
$25 million to $100 million
§Aggregate deal value of $2.9 billion
§Premia assessed based on VWAP
due to limited trading volume in NTS
stock
due to limited trading volume in NTS
stock
Premiums Paid to Prior Close and Month-Ago Closing Price(1)
___________________________
Source: Factset and BRC analysis.
(1) Last Trade as of October 11, 2013.
Premium to
30-day VWAP
30-day VWAP
25.3%
Premium to
90-day VWAP
90-day VWAP
19.7%
Premium to 1
-year VWAP
-year VWAP
55.5%
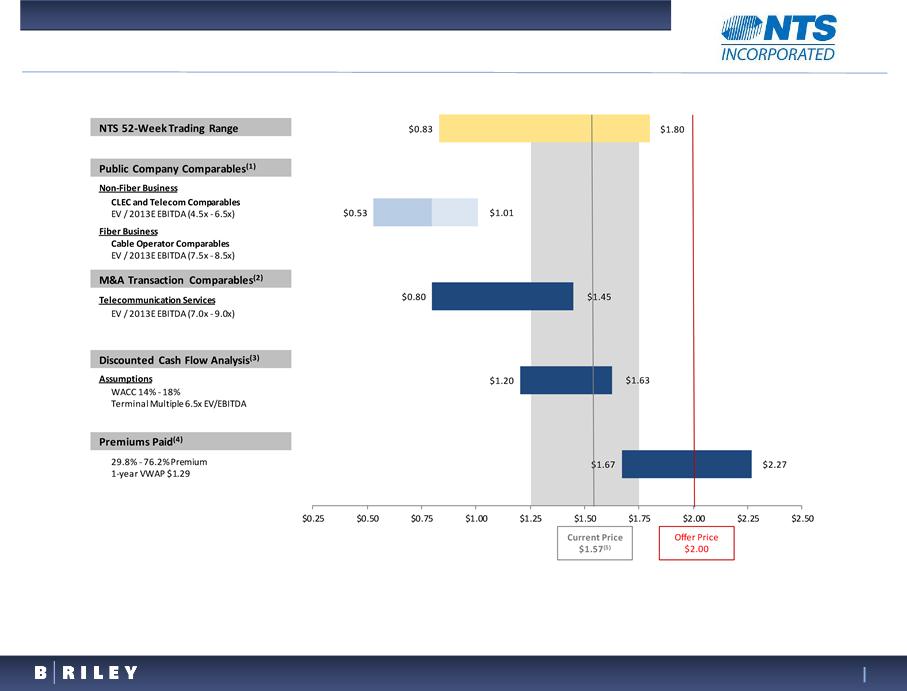
Confidential
29
Summary Valuation
___________________________
Note: Implied NTS share price utilizes treasury method and assumes conversion of in-the-money warrants and options in calculating diluted shares outstanding.
(1) Valuation based on a sum-of-the-parts analysis.
(2) Interquartile range of EV/LTM EBITDA multiples for comparable M&A transactions.
(3) See page 26 for detailed discounted cash flow analysis.
(4) Interquartile range of premiums paid in comparable size transactions involving changes of control.
(5) Price as of October 11, 2013.
FIBER
NON-FIBER
Per Share

Appendix
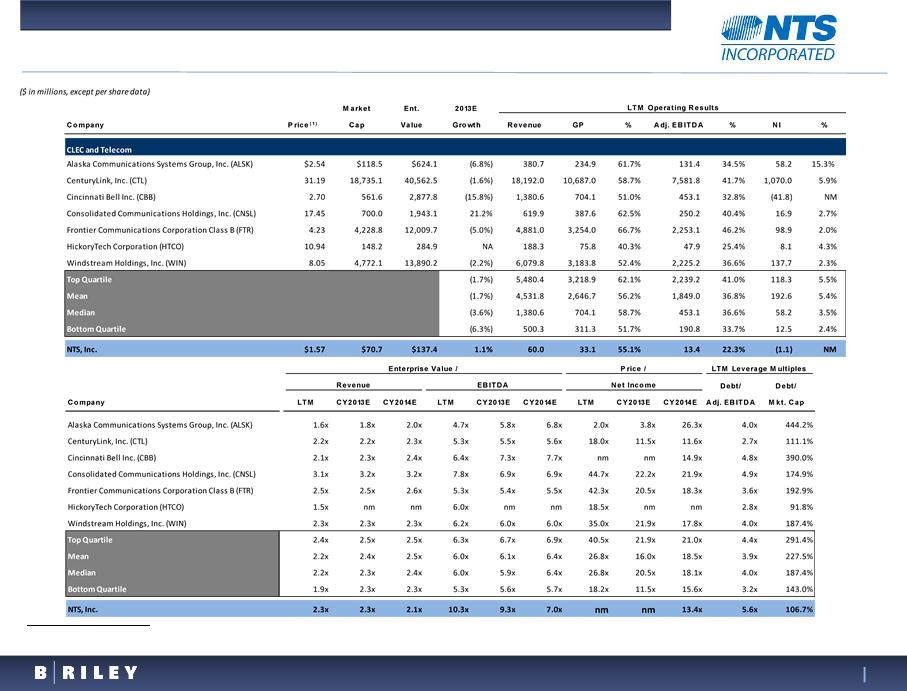
Confidential
31
Detailed Public Comparable Company Analysis
Source: Factset and company filings.
(1) Price as of October 11, 2013
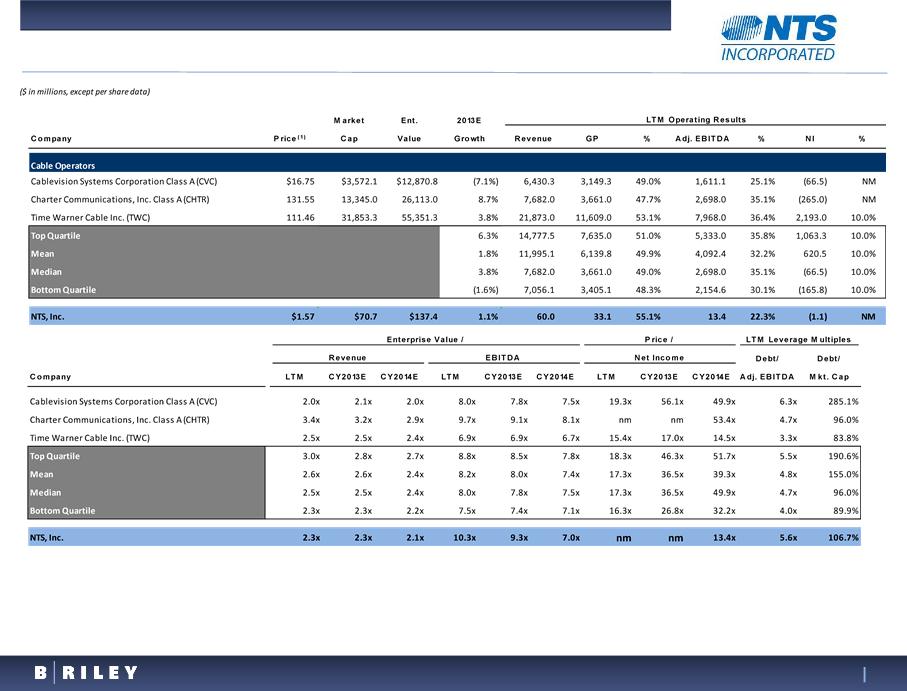
Confidential
32
Detailed Public Comparable Company Analysis (Cont'd)
___________________________
Source: Factset and company filings.
(1) Price as of October 11, 2013
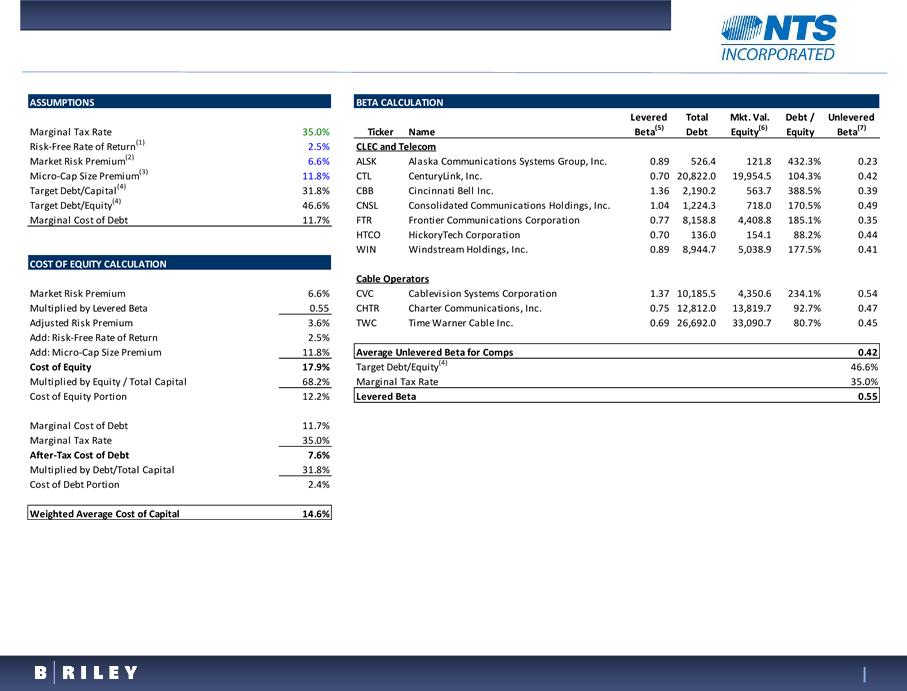
Confidential
33
___________________________
Source: Company filings and Factset.
(1) Long-term (20-year) U.S. Treasury Coupon Bond Yield (Ibbotson, 2012).
(2) Historical equity risk premium (Ibbotson, 2012).
(3) Micro-cap return in excess of CAPM (Ibbotson, 2012).
(4) Target debt / capital ratio excludes cost of government-sponsored debt instruments.
(5) Levered Beta = Unlevered Beta * (1+((D/E)*(1-T)))
(6) Market data as of October 11, 2013.
(7) Unlevered Beta = Levered Beta / (1+((D/E)*(1-T)))
Detailed Cost of Capital Calculation
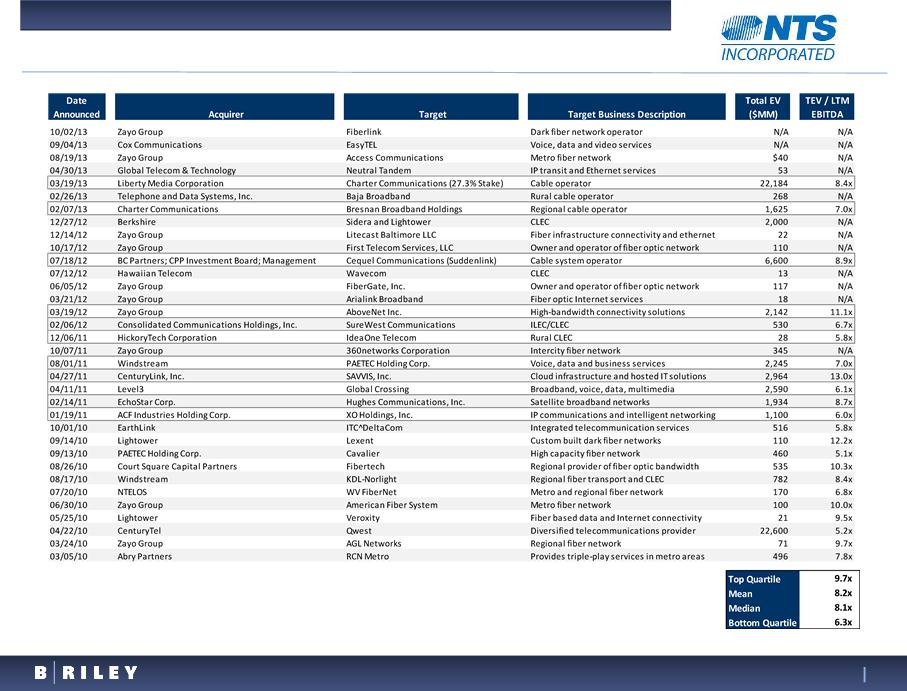
Confidential
34
Detailed Precedent Transactions
___________________________
Source: Factset.
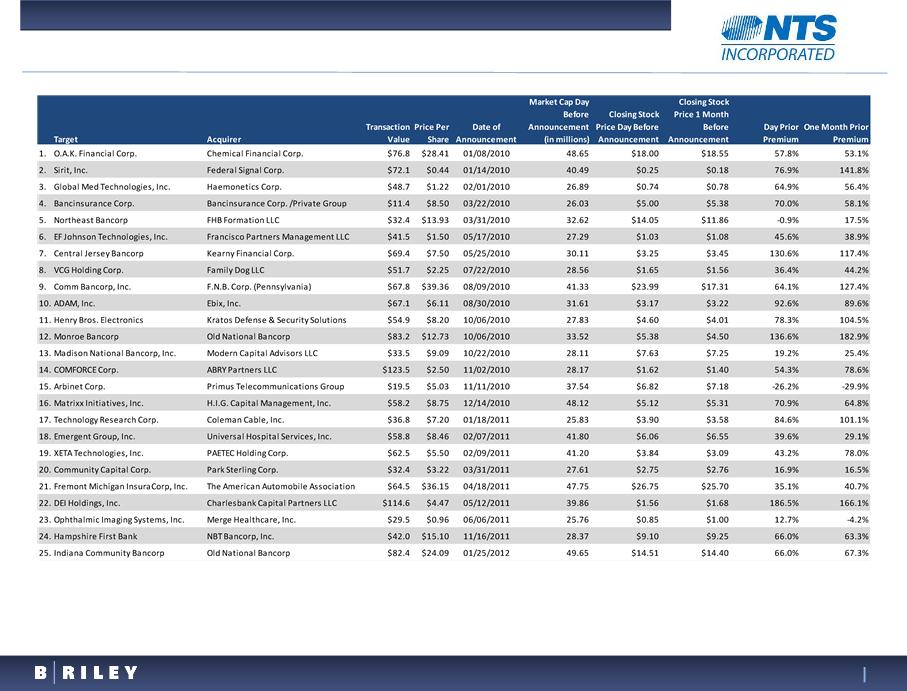
Confidential
35
Transaction Premia Analysis
___________________________
Source: Factset.
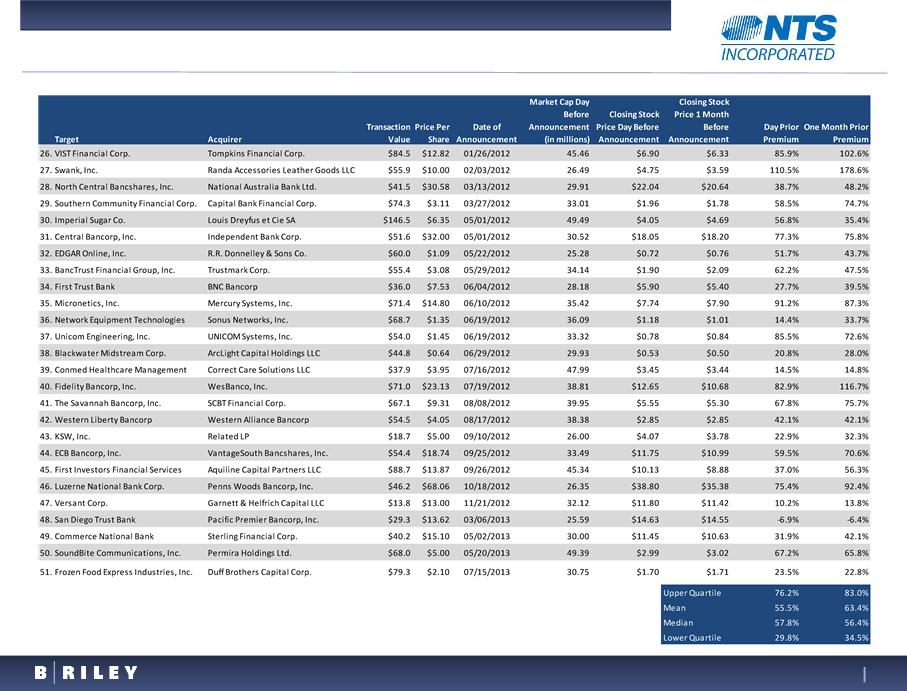
Confidential
36
Transaction Premia Analysis (Cont'd)
___________________________
Source: Factset.

Confidential
37
Disclosure - Privileged and Proprietary
The information contained in this presentation, including any and all discussions, views, opinions and financial advice
expressed or communicated by B. Riley is proprietary and highly confidential. It has been prepared by B. Riley for the sole
benefit of NTS, Inc., and as such may not be referred to, shared or disseminated without the prior written consent of B.
Riley in each instance.
expressed or communicated by B. Riley is proprietary and highly confidential. It has been prepared by B. Riley for the sole
benefit of NTS, Inc., and as such may not be referred to, shared or disseminated without the prior written consent of B.
Riley in each instance.
11100 Santa Monica Blvd.
Suite 800
Los Angeles, CA 90025
T: 310-966-1444
Los Angeles
237 Park Ave.
Suite 9022
New York, NY 10017
T: 212-225-8484
New York
425 California St.
Suite 900
San Francisco, CA 94104
T: 415-692-0073
San Francisco
4695 MacArthur Court
Suite 100
Newport Beach, CA 92660
T: 949-852-9911
Newport Beach
470 Atlantic Ave.
Suite 4051
Boston, MA 02210
T: 617-273-8133
Boston
Exhibit (c)(5)

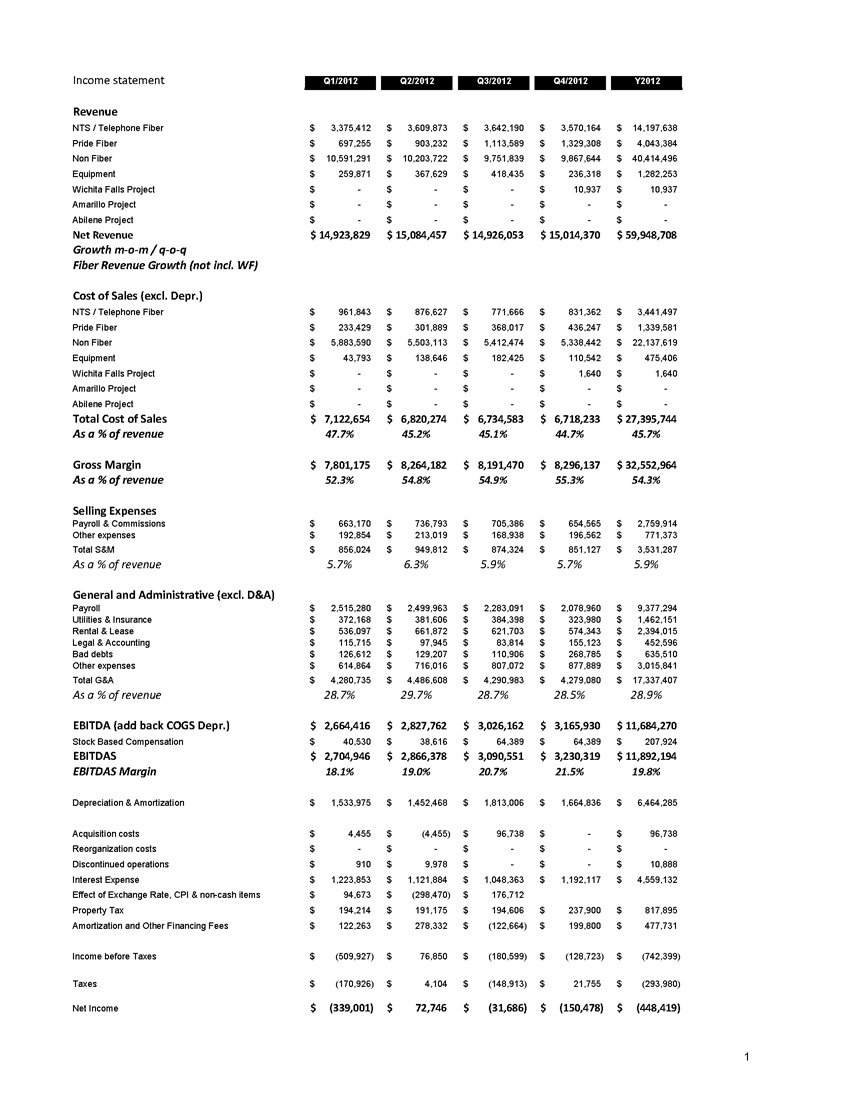
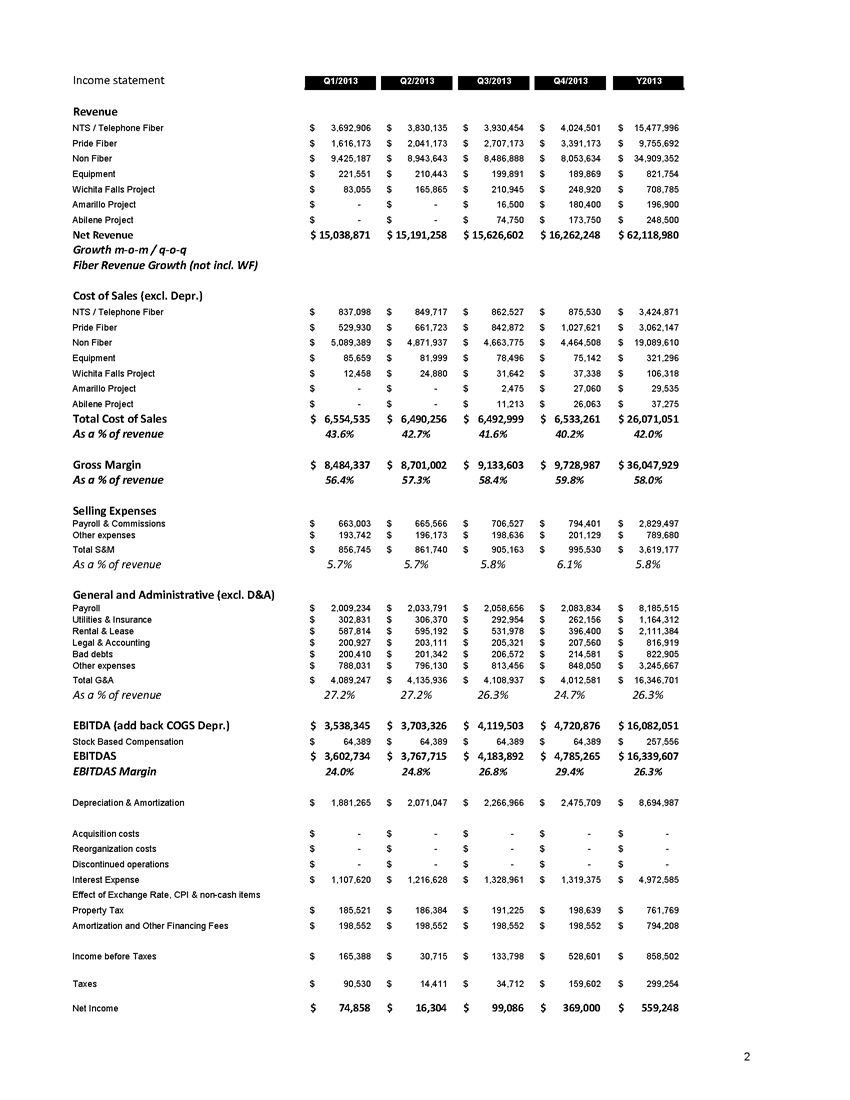
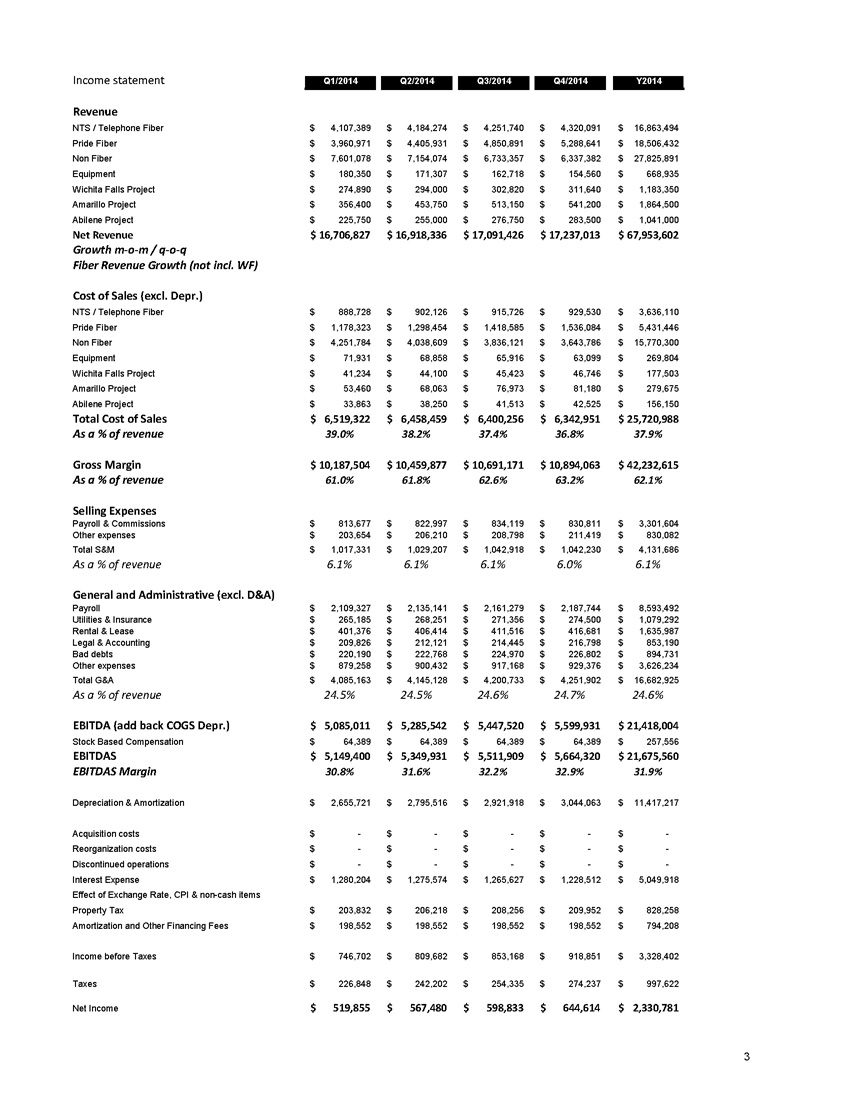
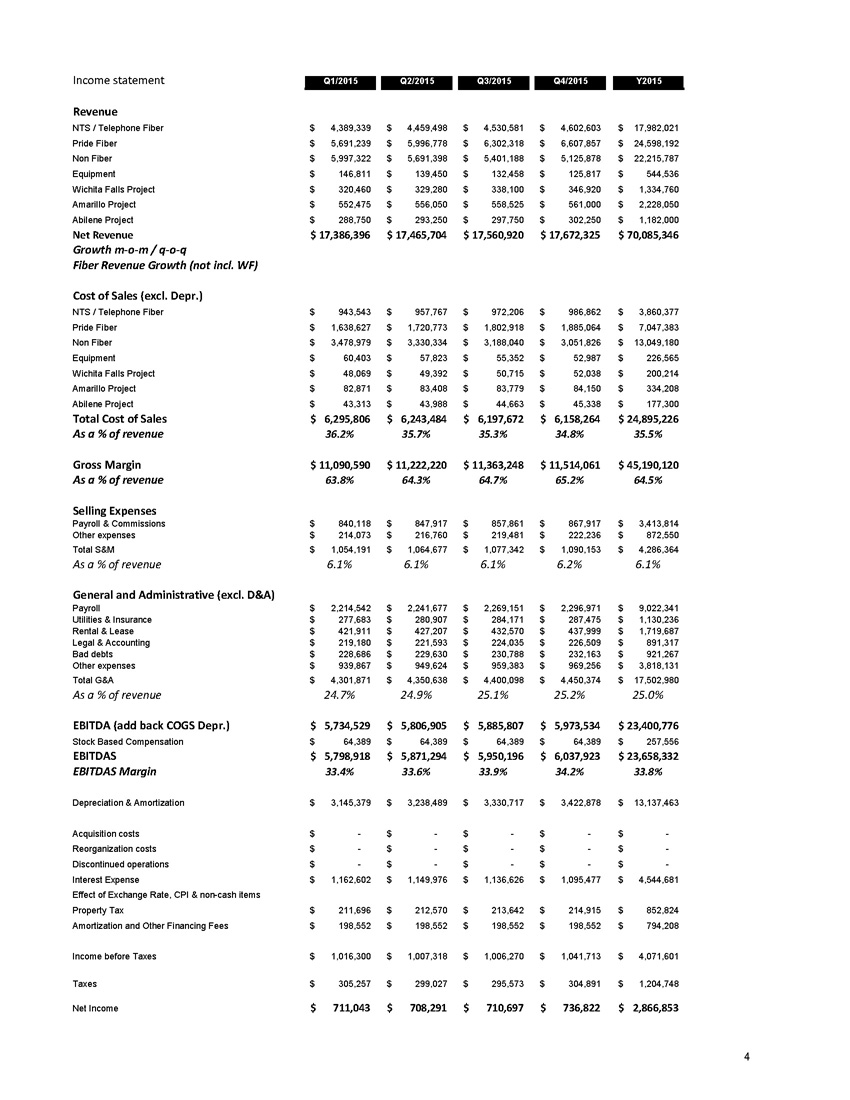
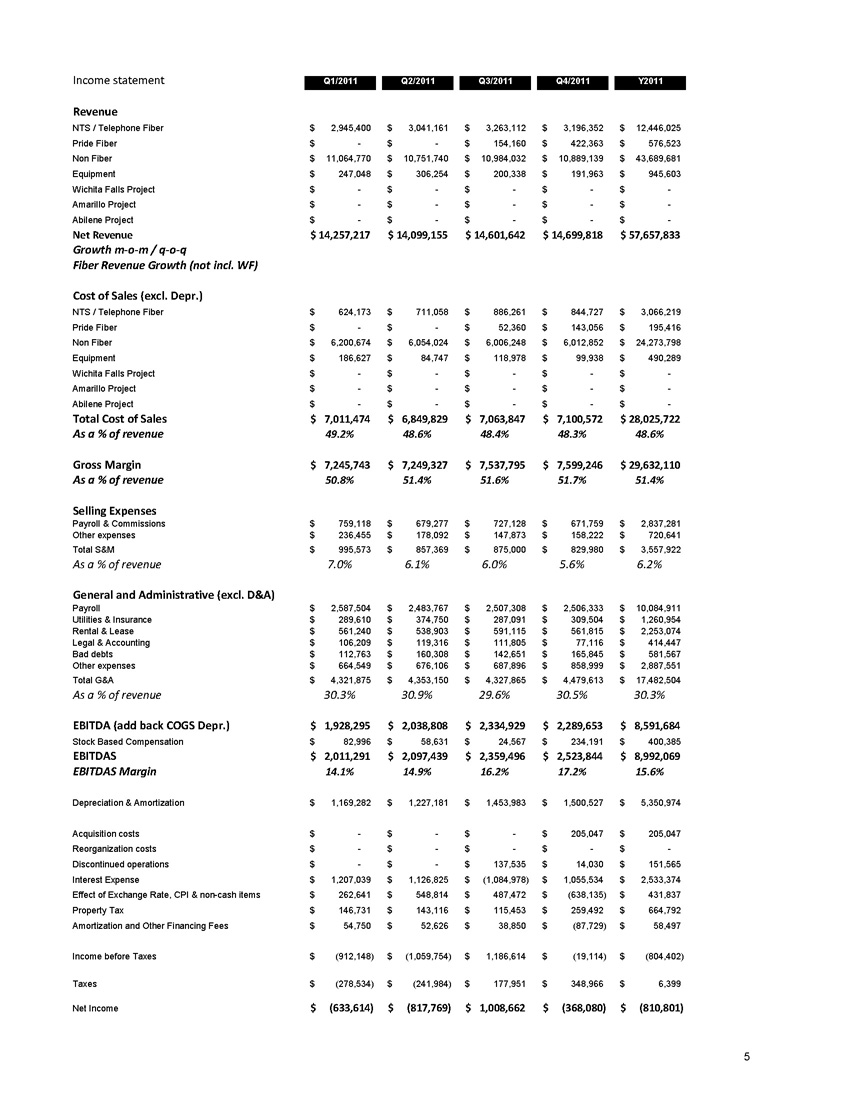
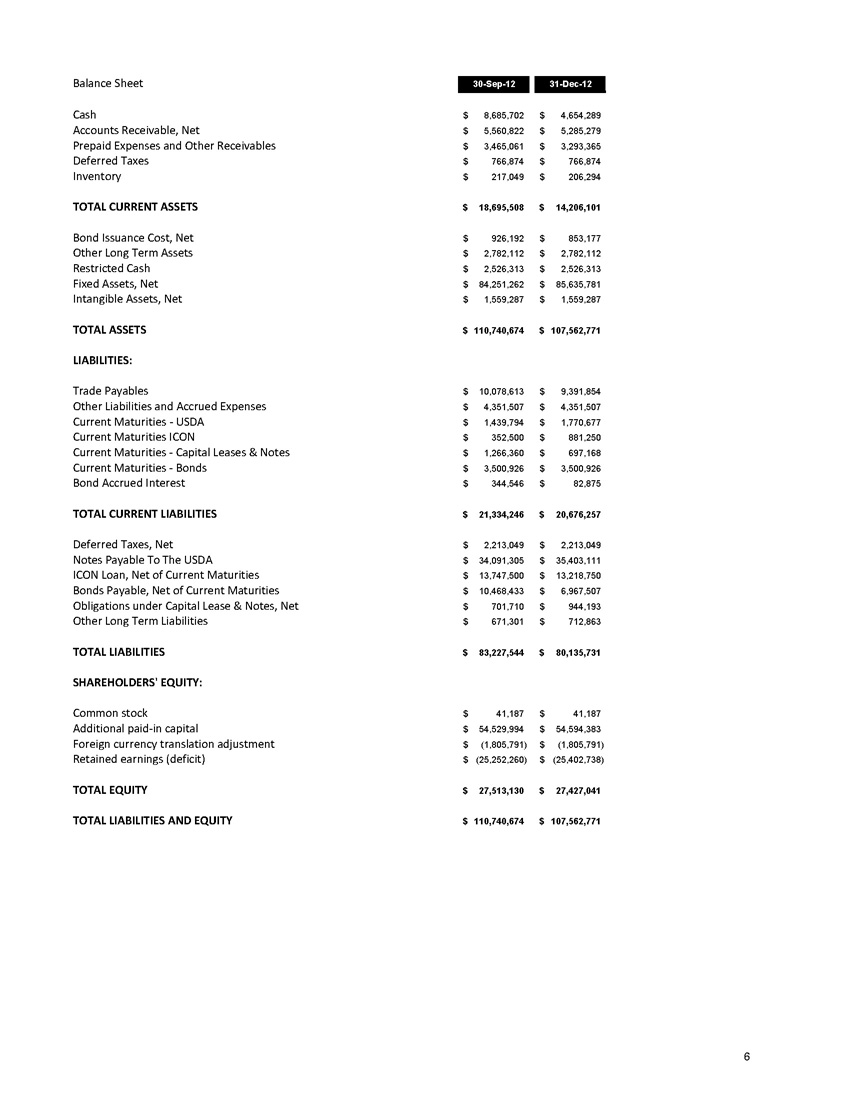
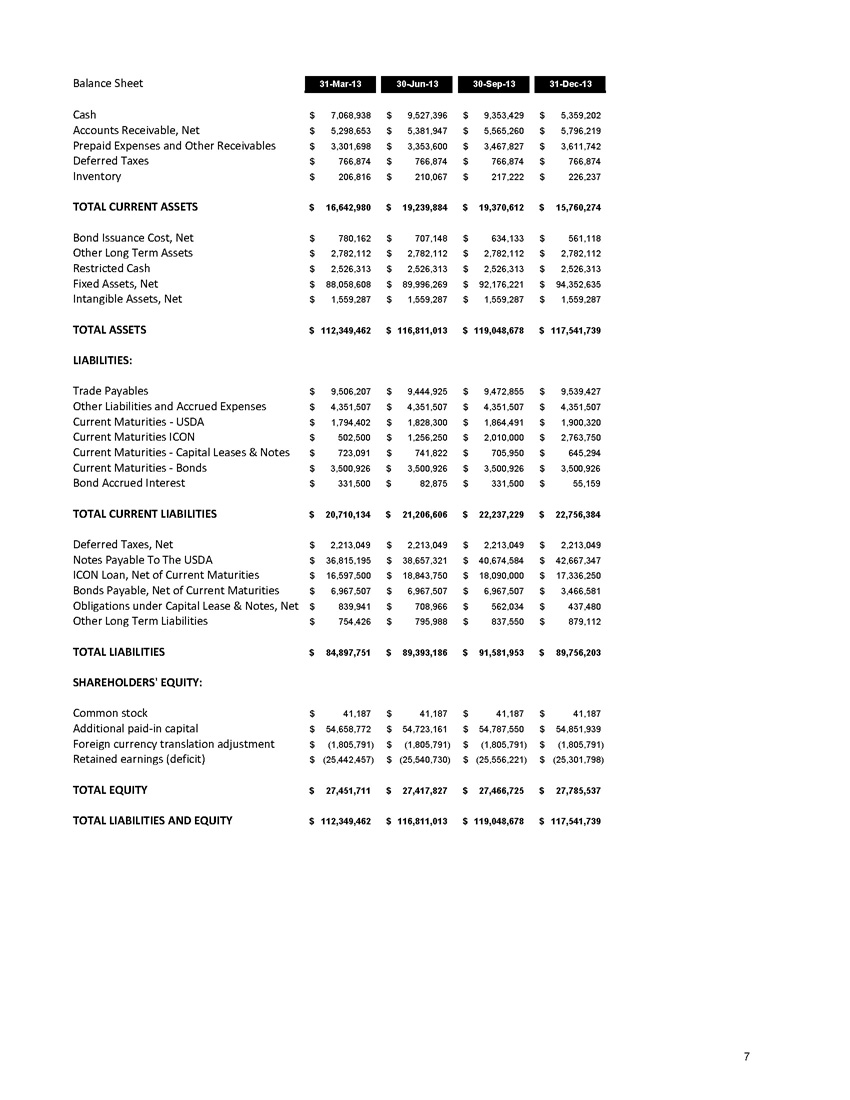

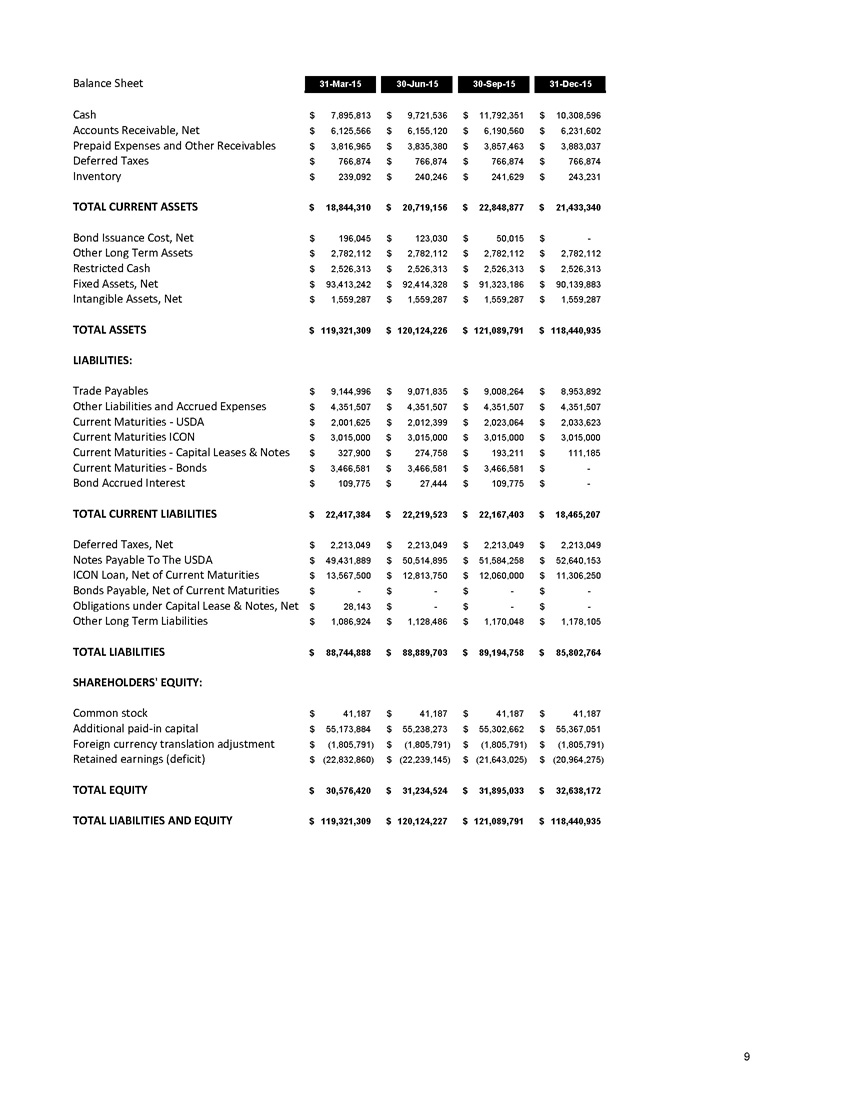
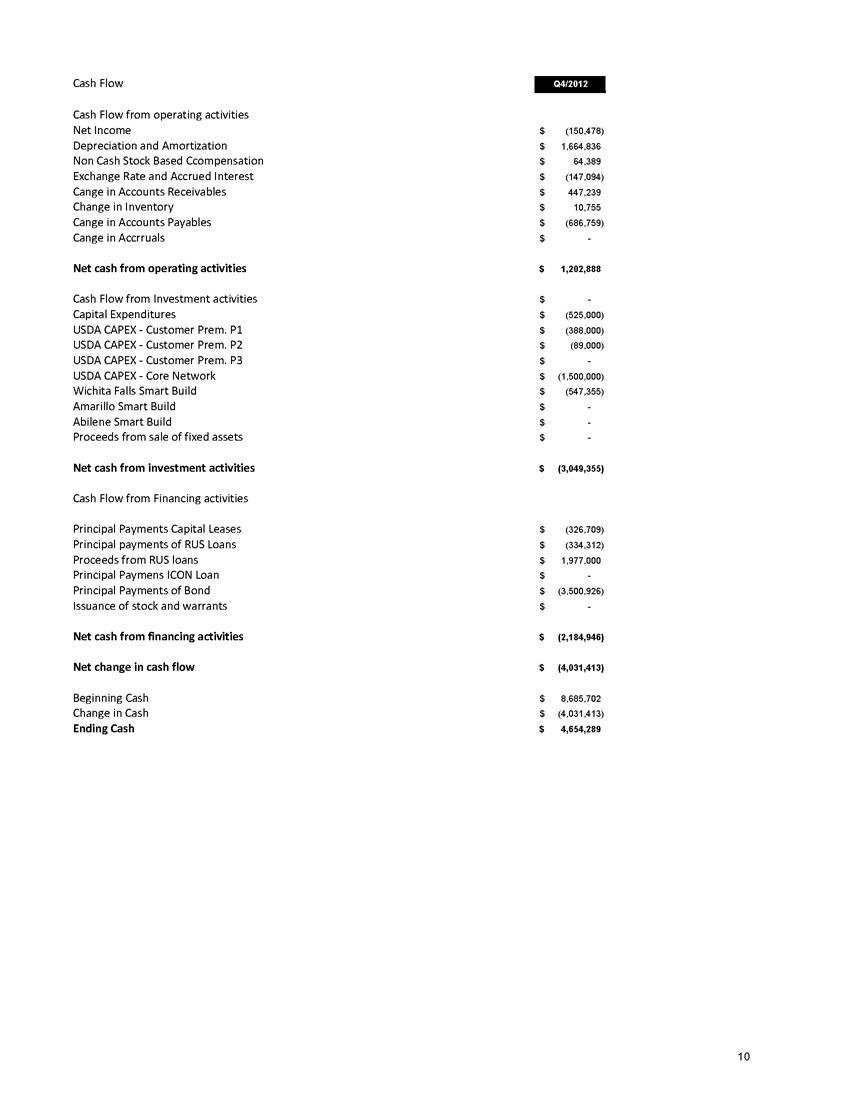
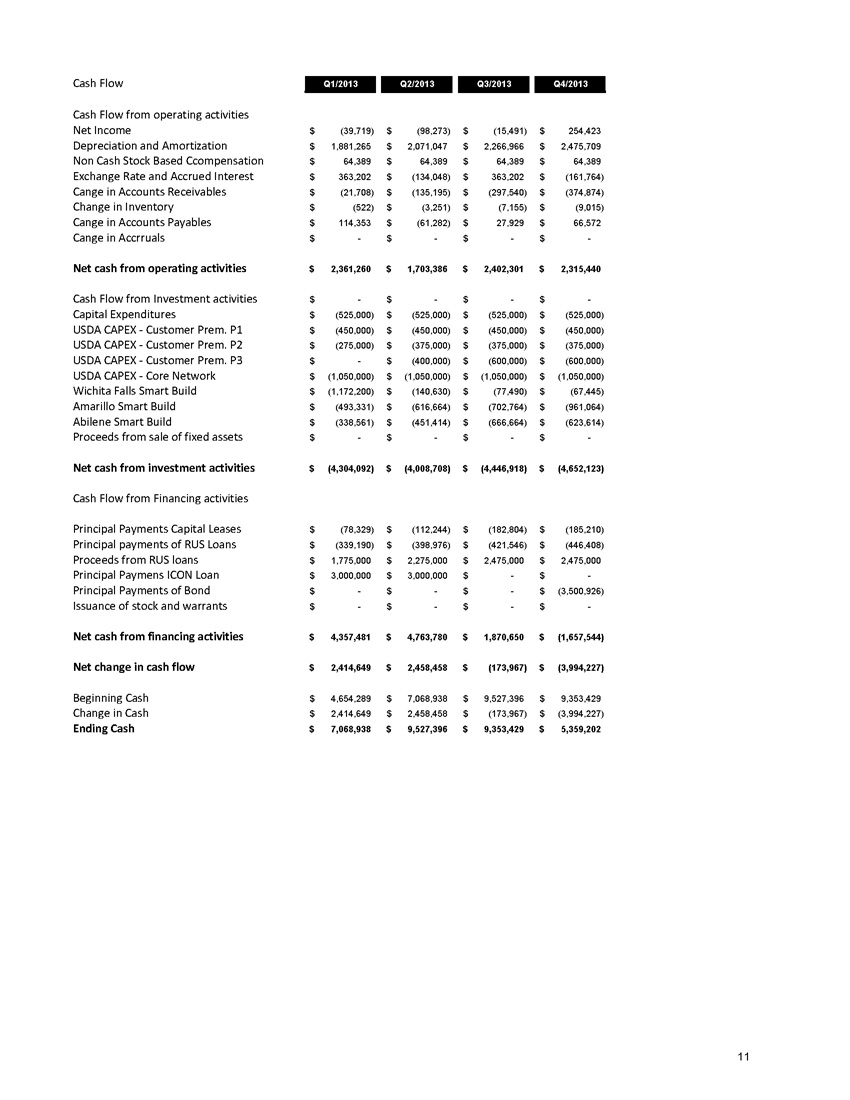
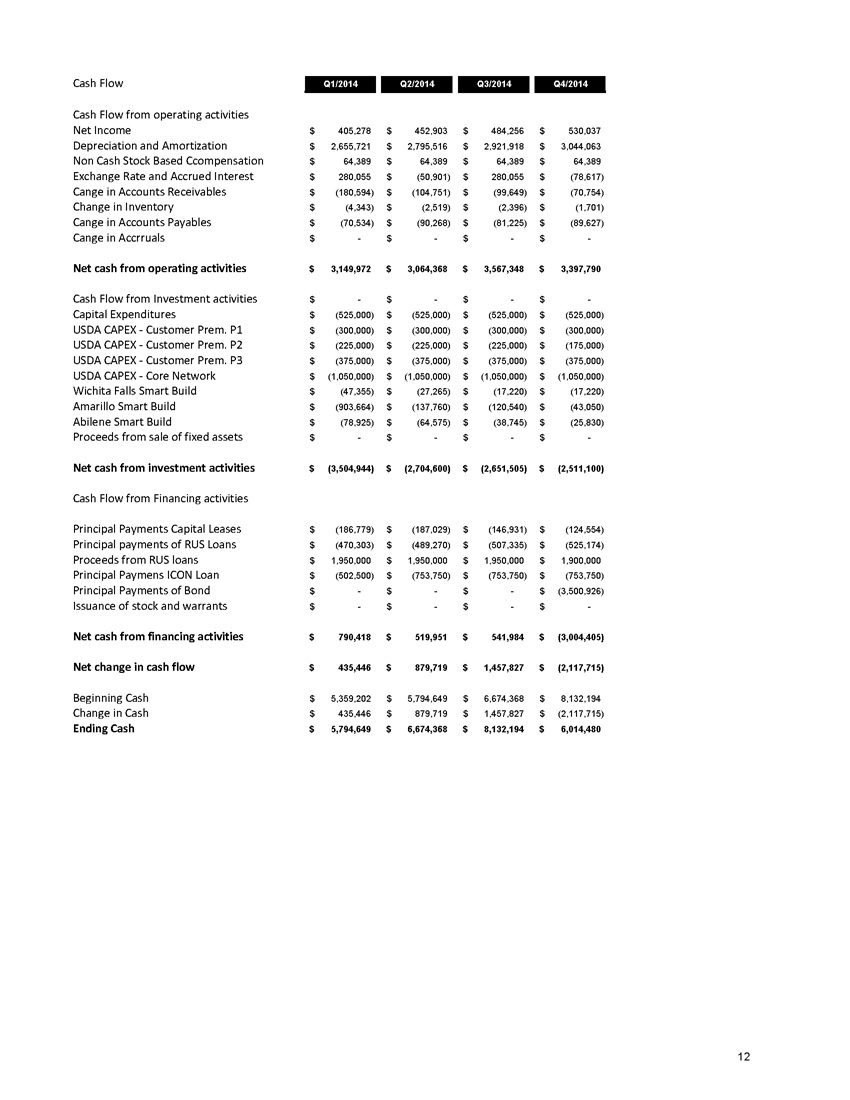
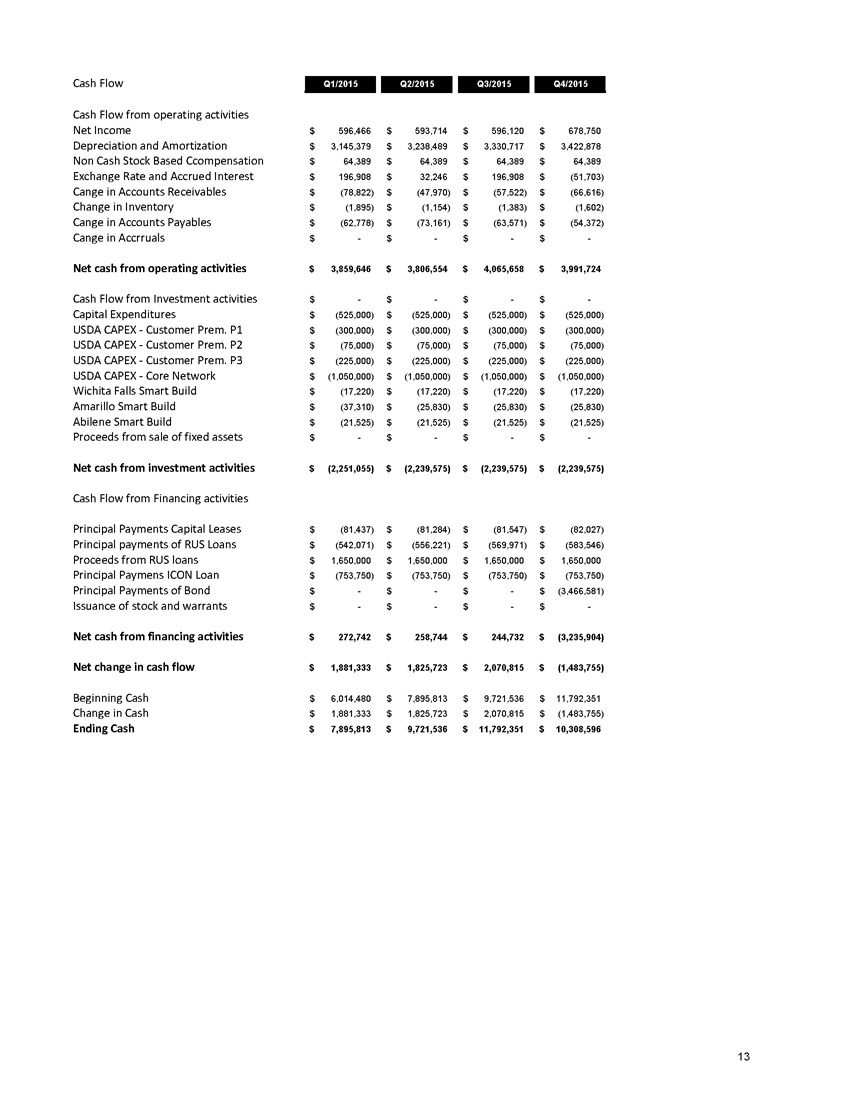
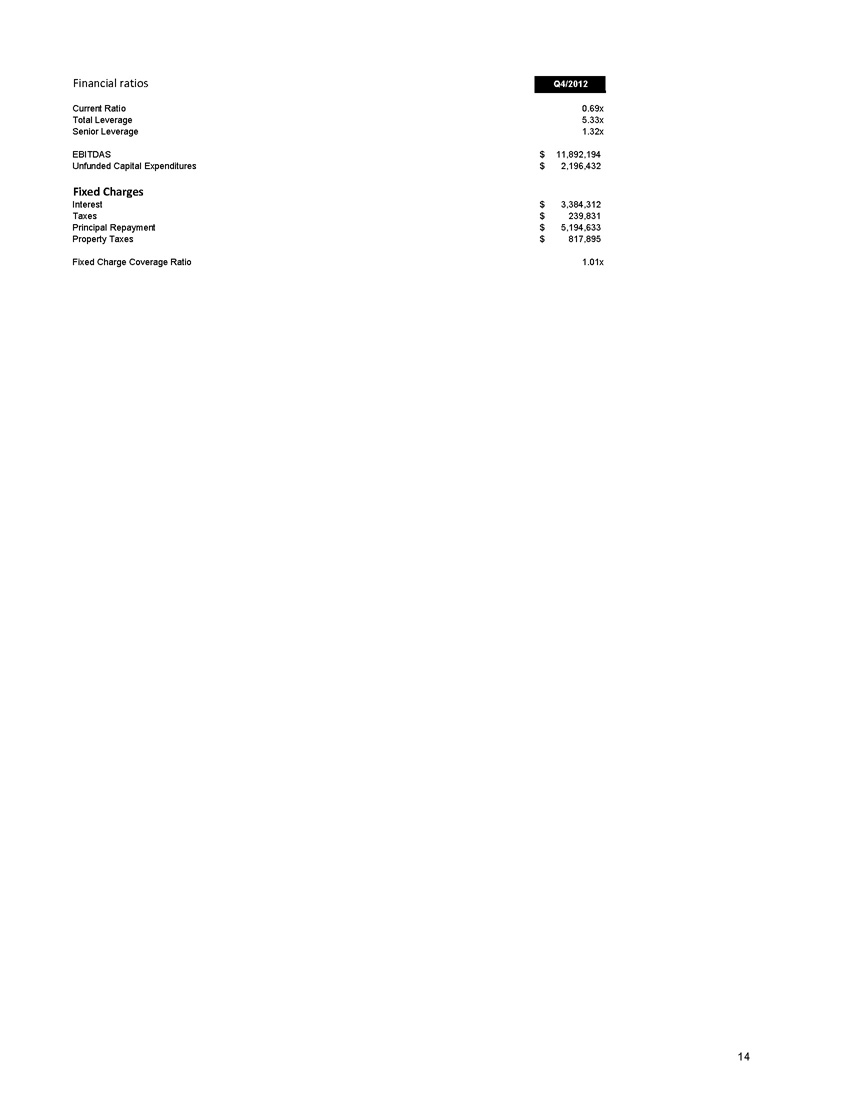

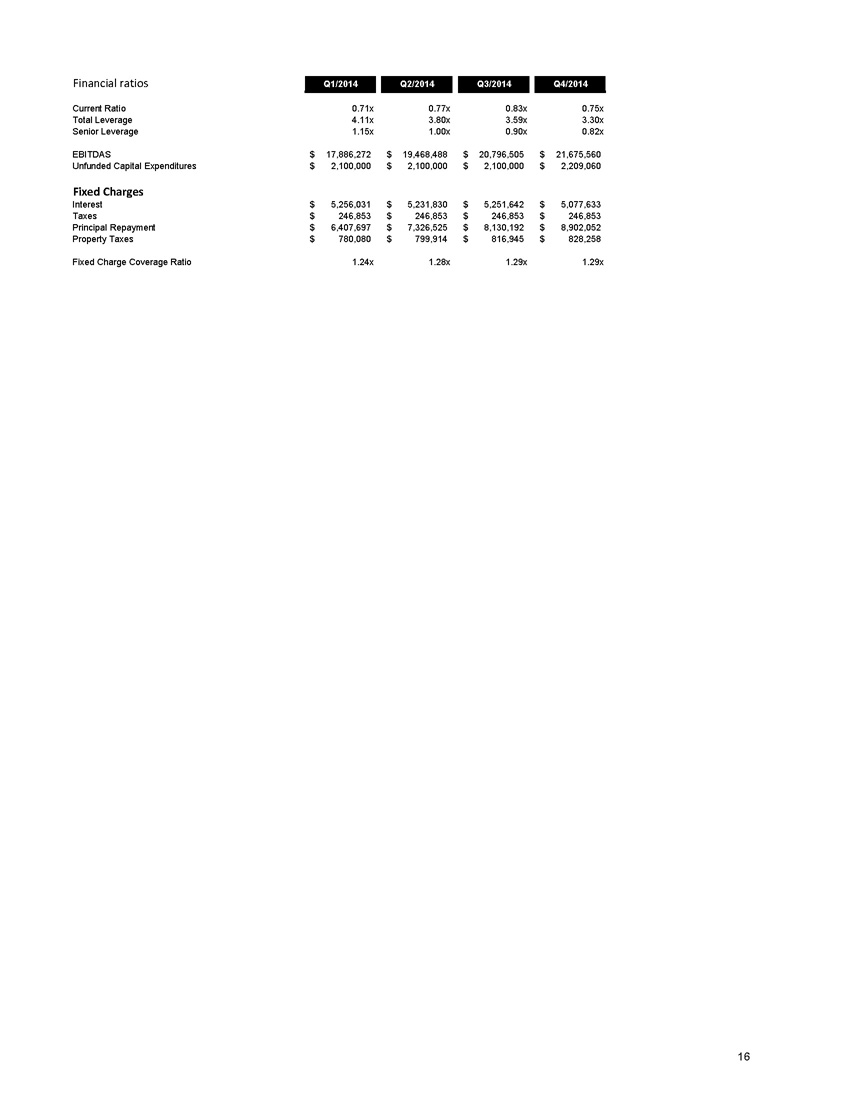

EXHIBIT (c)(6)
Presentation Materials prepared by Company management and provided to Oberon Securities and B. Riley & Co. on October 11, 2013
| Differences between Model Cases | ||||||||
| Item | ||||||||
| Inputs | ||||||||
| Fiber Take Rates - Key Communities - Aug. 2013 | Business | Residential | ||||||
| Lubbock | 53 | % | 12 | % | ||||
| Wollforth | 50 | % | 9 | % | ||||
| Levelland | 67 | % | 38 | % | ||||
| Littlefield | 42 | % | 41 | % | ||||
| Burkburnnet | 41 | % | 31 | % | ||||
| Brownfield | 61 | % | 38 | % | ||||
| Slaton | 29 | % | 17 | % | ||||
| Lamessa | 57 | % | 27 | % | ||||
| Plainview | 39 | % | 13 | % | ||||
| Witchita Falls | 27 | % | NM | |||||
| Hammond | 10 | % | 1 | % | ||||
| Ponchatoula | 0 | % | 0 | % | ||||
| Abilene | 1 | % | NM | |||||
| Amarillo | 0 | % | NM | |||||
| Fiber ARPUs - Key Communities - Aug. 2013 | ||||||||
| Lubbock | $ | 412 | $ | 89 | ||||
| Wollforth | $ | 364 | $ | 92 | ||||
| Levelland | $ | 469 | $ | 104 | ||||
| Littlefield | $ | 287 | $ | 116 | ||||
| Burkburnnet | $ | 251 | $ | 106 | ||||
| Brownfield | $ | 211 | $ | 103 | ||||
| Slaton | $ | 206 | $ | 106 | ||||
| Lamessa | $ | 188 | $ | 101 | ||||
| Plainview | $ | 253 | $ | 101 | ||||
| Witchita Falls | $ | 206 | NA | |||||
| Hammond | $ | 200 | $ | 130 | ||||
| Ponchatoula | NA | NA | ||||||
| Abilene | NA | NA | ||||||
| Amarillo | NA | NA | ||||||
| Case #1 | Case #2 | |||||||
| Fiber Business Take Rates - Key Communities - 2018 | ||||||||
| Lubbock | 60 | % | 58 | % | ||||
| Wollforth | 50 | % | 50 | % | ||||
| Levelland | 72 | % | 71 | % | ||||
| Littlefield | 70 | % | 63 | % | ||||
| Burkburnnet | 70 | % | 63 | % | ||||
| Brownfield | 70 | % | 68 | % | ||||
| Slaton | 65 | % | 56 | % | ||||
| Lamessa | 70 | % | 67 | % | ||||
| Plainview | 70 | % | 63 | % | ||||
| Witchita Falls | 60 | % | 52 | % | ||||
| Hammond | 40 | % | 32 | % | ||||
| Ponchatoula | 70 | % | 53 | % | ||||
| Abilene | 55 | % | 42 | % | ||||
| Amarillo | 46 | % | 35 | % | ||||
| Fiber Residential Take Rates - Key Communities - 2018 | ||||||||
| Lubbock | 22 | % | 19 | % | ||||
| Wollforth | 19 | % | 16 | % | ||||
| Levelland | 44 | % | 42 | % | ||||
| Littlefield | 44 | % | 43 | % | ||||
| Burkburnnet | 44 | % | 41 | % | ||||
| Brownfield | 44 | % | 42 | % | ||||
| Slaton | 37 | % | 32 | % | ||||
| Lamessa | 44 | % | 40 | % | ||||
| Plainview | 44 | % | 37 | % | ||||
| Iowa Park | 44 | % | 36 | % | ||||
| Hammond | 39 | % | 29 | % | ||||
| Ponchatoula | 39 | % | 29 | % | ||||
| Fiber Business ARPUs - Key Communities - 2018 | ||||||||
| Lubbock | $ | 436 | $ | 430 | ||||
| Wollforth | $ | 376 | $ | 370 | ||||
| Levelland | $ | 491 | $ | 485 | ||||
| Littlefield | $ | 301 | $ | 295 | ||||
| Burkburnnet | $ | 345 | $ | 317 | ||||
| Brownfield | $ | 342 | $ | 309 | ||||
| Slaton | $ | 340 | $ | 308 | ||||
| Lamessa | $ | 341 | $ | 307 | ||||
| Plainview | $ | 345 | $ | 321 | ||||
| Witchita Falls | $ | 320 | $ | 292 | ||||
| Hammond | $ | 330 | $ | 298 | ||||
| Ponchatoula | $ | 310 | $ | 283 | ||||
| Abilene | $ | 303 | $ | 277 | ||||
| Amarillo | $ | 302 | $ | 276 | ||||
| Fiber Residential ARPUs - Key Communities - 2018 | ||||||||
| Lubbock | $ | 110 | $ | 105 | ||||
| Wollforth | $ | 110 | $ | 106 | ||||
| Levelland | $ | 110 | $ | 109 | ||||
| Littlefield | $ | 110 | $ | 110 | ||||
| Burkburnnet | $ | 110 | $ | 110 | ||||
| Brownfield | $ | 110 | $ | 108 | ||||
| Slaton | $ | 110 | $ | 109 | ||||
| Lamessa | $ | 110 | $ | 108 | ||||
| Plainview | $ | 110 | $ | 108 | ||||
| Iowa Park | $ | 110 | $ | 109 | ||||
| Hammond | $ | 110 | $ | 109 | ||||
| Ponchatoula | $ | 110 | $ | 109 | ||||
| Smart build probability- Midland | 20 | % | 20 | % | ||||
| Smart build probability - Odessa | 20 | % | 20 | % | ||||
| New RUS project probability | 20 | % | 20 | % | ||||
| Planned cost savings - % of plan | 100 | % | 75 | % | ||||
| Non Fiber Assumptions | ||||||||
| Abilene bus count quarterly growth | -2.5 | % | -3.5 | % | ||||
| Abilene res count quarterly growth | -7.0 | % | -8.0 | % | ||||
| Abilene smart build cannibalization | 25.0 | % | 25.0 | % | ||||
| Amarillo bus count quarterly growth | -3.3 | % | -4.0 | % | ||||
| Amarillo res count quarterly growth | -7.0 | % | -8.0 | % | ||||
| Amarillo smart build cannibalization | 25.0 | % | 25.0 | % | ||||
| Lubbock bus count quarterly growth | -2.6 | % | -3.5 | % | ||||
| Lubbock res count quarterly growth | -6.1 | % | -7.0 | % | ||||
| Midland bus count quarterly growth | -1.9 | % | -3.0 | % | ||||
| Midland res count quarterly growth | -7.3 | % | -8.0 | % | ||||
| Midland smart build cannibalization | 25.0 | % | 25.0 | % | ||||
| Odessa bus count quarterly growth | -1.4 | % | -2.0 | % | ||||
| Odessa res count quarterly growth | -6.2 | % | -6.5 | % | ||||
| Odessa smart build cannibalization | 25.0 | % | 25.0 | % | ||||
| Wichita Falls bus count quarterly growth | -4.1 | % | -5.0 | % | ||||
| Wichita Falls res count quarterly growth | -4.8 | % | -4.8 | % | ||||
| Wichita Falls smart build cannibalization | 25.0 | % | 25.0 | % | ||||
| Minor markets bus and res count quarterly growth | -5.7 | % | -6.5 | % | ||||
| UNE-P count quarterly growth | -5.6 | % | -6.5 | % | ||||
| Other business count quarterly growth | -2.4 | % | -3.0 | % | ||||
| Carrier variable COGS quarterly increase | 0.0 | % | 0.5 | % | ||||
| Fiber Assumptions | ||||||||
| Fiber fixed costs quarterly growth | 1.0 | % | 1.0 | % | ||||
| Selling expenses quarterly growth (up to 4Q 2016) | 1.5 | % | 1.5 | % | ||||
| Selling expenses annual growth (2017-2018) | 3.0 | % | 0.0 | % | ||||
| Wholesale fiber quarterly revenue growth | 5.0 | % | 2.0 | % | ||||
| Wholesale fiber annual revenue growth (2017-2018) | 10.0 | % | 5.0 | % | ||||
| Communities Modeled as a % of Levelland take rate growth (bus and res) | 100.0 | % | 75.0 | % | ||||
| Other Communities - % of Case #1 take rate growth (bus and res) | 100.0 | % | 75.0 | % | ||||
| % of Quarterly Business ARPU Growth of Case #1 | 100.0 | % | 75.0 | % | ||||
| % of Quarterly Residential ARPU Growth of Case #1 | 100.0 | % | 75.0 | % | ||||
| Outputs | ||||||||
| Fiber Customer Adds (Net of Churn) | ||||||||
| Net Customer Adds in 2012 | 2,193 | 2,193 | ||||||
| Net Customer Adds in 2013 | 2,861 | 2,600 | ||||||
| Net Customer Adds in 2014 | 6,575 | 4,933 | ||||||
| Average Net Customer Adds in 2014 - 2018 | 2,735 | 2,039 | ||||||
| % Increase in Net Customer Adds (2012 vs. 2013) | 30 | % | 19 | % | ||||
| % Increase in Net Customer Adds (2013 vs. 2014) | 130 | % | 90 | % | ||||
| Fiber Revenues | ||||||||
| Fiber Revenues 2012 | $ | 18,219,615 | $ | 18,219,615 | ||||
| Fiber Revenues 2013 | $ | 23,710,481 | $ | 23,610,188 | ||||
| Fiber Revenues 2014 | $ | 34,785,281 | $ | 32,067,530 | ||||
| Fiber Revenues 2018 | $ | 59,768,652 | $ | 48,899,414 | ||||
| % Increase in Fiber Revenues (2012 vs. 2013) | 30 | % | 30 | % | ||||
| % Increase in Fiber Revenues (2013 vs. 2014) | 47 | % | 36 | % | ||||
| 5-year CAGR (2013 vs. 2018) | 20 | % | 16 | % | ||||
| Total Revenues | ||||||||
| Revenues 2012 | $ | 59,870,468 | $ | 59,870,468 | ||||
| Revenues 2013 | $ | 60,744,508 | $ | 60,532,567 | ||||
| Revenues 2014 | $ | 67,987,009 | $ | 64,752,580 | ||||
| Revenues 2018 | $ | 85,433,841 | $ | 72,779,878 | ||||
| % Increase in Total Revenues (2012 vs. 2013) | 1 | % | 1 | % | ||||
| % Increase in Total Revenues (2013 vs. 2014) | 12 | % | 7 | % | ||||
| 5-year CAGR (2013 vs. 2018) | 7 | % | 4 | % | ||||
| Adjusted EBITDA | ||||||||
| EBITDA 2012 | $ | 11,862,159 | $ | 11,862,159 | ||||
| EBITDA 2013 | $ | 14,880,315 | $ | 14,700,224 | ||||
| EBITDA 2014 | $ | 22,401,916 | $ | 20,146,290 | ||||
| EBITDA 2018 | $ | 36,727,481 | $ | 27,535,617 | ||||
| % Increase in EBITDA (2012 vs. 2013) | 25 | % | 24 | % | ||||
| % Increase in EBITDA (2013 vs. 2014) | 51 | % | 37 | % | ||||
| 5-year CAGR (2013 vs. 2018) | 20 | % | 13 | % | ||||
1
| Quarterly Growth Assumptions Organic | Smart Build | |||||||||||||||||||||||||||
| UNE-L Revenue | Business | Residential | Cannibalization | |||||||||||||||||||||||||
| Average | Projected | Average | Projected | |||||||||||||||||||||||||
| Abilene | ||||||||||||||||||||||||||||
| Count | -2.5% | -2.5% | -7.0% | -7.0% | 25.0% | |||||||||||||||||||||||
| ARPU | 0.5% | 0.5% | 0.9% | 0.9% | ||||||||||||||||||||||||
| Amarillo | ||||||||||||||||||||||||||||
| Count | -3.3% | -3.3% | -7.0% | -7.0% | 25.0% | |||||||||||||||||||||||
| ARPU | -0.9% | -0.9% | 0.0% | 0.0% | ||||||||||||||||||||||||
| Lubbock | ||||||||||||||||||||||||||||
| Count | -2.6% | -2.6% | -6.1% | -6.1% | ||||||||||||||||||||||||
| ARPU | -0.4% | -0.4% | 0.8% | 0.8% | ||||||||||||||||||||||||
| Midland | ||||||||||||||||||||||||||||
| Count | -1.9% | -1.9% | -7.3% | -7.3% | 25.0% | |||||||||||||||||||||||
| ARPU | 0.6% | 0.6% | 0.4% | 0.4% | ||||||||||||||||||||||||
| Odessa | ||||||||||||||||||||||||||||
| Count | -1.4% | -1.4% | -6.2% | -6.2% | 25.0% | |||||||||||||||||||||||
| ARPU | 0.4% | 0.4% | 1.3% | 1.3% | ||||||||||||||||||||||||
| Wichita Falls Bus | ||||||||||||||||||||||||||||
| Count | -4.1% | -4.1% | -4.8% | -4.8% | 25.0% | |||||||||||||||||||||||
| ARPU | -2.6% | -2.6% | 0.6% | 0.6% | ||||||||||||||||||||||||
| Minor Markets (Bus & Res) | ||||||||||||||||||||||||||||
| Count | -5.7% | -5.7% | ||||||||||||||||||||||||||
| ARPU | -1.2% | -1.2% | ||||||||||||||||||||||||||
| UNE-P | Average | Projected | ||||||||||||||||||||||||||
| Count | -5.6% | -5.6% | ||||||||||||||||||||||||||
| ARPU | 1.2% | 1.2% | ||||||||||||||||||||||||||
| Other | Average | Projected | ||||||||||||||||||||||||||
| Business Count | -2.4% | -2.4% | ||||||||||||||||||||||||||
| Business ARPU | 1.0% | 1.0% | ||||||||||||||||||||||||||
| Carrier growth (COGS Summary tab) | -0.7% | -0.7% | ||||||||||||||||||||||||||
| Equipment Revenue growth | 11.8% | 0.0% | ||||||||||||||||||||||||||
| Residential Count | -0.3% | -0.3% | ||||||||||||||||||||||||||
| Residential ARPU | 13.2% | 0.0% | ||||||||||||||||||||||||||
| Other Count | 0.0% | 0.0% | ||||||||||||||||||||||||||
| Other ARPU | 18.2% | 0.0% | ||||||||||||||||||||||||||
| Other Non-Fiber: Revenue Change | Q2 2011 | Q3 2011 | Q4 2011 | Q1 2012 | Q2 2012 | Q3 2012 | Q4 2012 | Q1 2013 | Q2 2013 | Average | Projected | |||||||||||||||||
| Carrier Access Billing change from last period | 12.4% | -10.1% | -6.5% | 1.2% | -3.9% | -6.5% | -0.3% | -9.0% | 13.6% | -1.0% | -1% | |||||||||||||||||
| Carrier Access Billing change from last year | -4.4% | -18.3% | -15.0% | -9.4% | -18.5% | -3.7% | -11.5% | |||||||||||||||||||||
| Rent Income change from last period | -5.9% | -1.4% | -5.4% | -12.8% | -1.9% | 6.2% | -9.6% | -7.4% | 1.4% | -4.1% | -4% | |||||||||||||||||
| Rent Income change from last year | -5.9% | -1.4% | -5.4% | -18.0% | -12.9% | -9.9% | -8.9% | �� | ||||||||||||||||||||
| Xfone | -7.1% | -3.2% | -6.6% | -1.5% | 2.7% | -8.0% | -4.3% | -2.5% | -5.8% | -4.0% | -4% | |||||||||||||||||
| Non Fiber COGS | Q1 2011 | Q2 2011 | Q3 2011 | Q4 2011 | Q1 2012 | Q2 2012 | Q3 2012 | Q4 2012 | Q1 2013 | Q2 2013 | Average | Q Growth | Q3 2013 | Q4 2013 | Q1 2014 | Q2 2014 | Q4 2014 | Q1 2015 | Q2 2015 | Q3 2015 | Q4 2015 | Q1 2016 | Q2 2016 | Q3 2016 | Q4 2016 | 2017 | 2018 | |
| CLEC Variable COGS as a % of revenues | 47% | 50% | 51% | 51% | 49% | 50% | 50% | 52% | 51% | 52% | 0% | 51.8% | 51.8% | 51.8% | 51.8% | 51.8% | 51.8% | 51.8% | 51.8% | 51.8% | 51.8% | 51.8% | 51.8% | 51.8% | 51.8% | 51.8% | ||
| Resale Variable COGS as a % of revenues | 60% | |||||||||||||||||||||||||||
| Business | 25% | |||||||||||||||||||||||||||
Carrier Variable COGS as a % Carrier Revenue1 | 46% | 48% | 46% | 43% | 45% | 46% | 47% | 42% | 42% | 45% | 45.1% | 0.0% | 45.1% | 45.1% | 45.1% | 45.1% | 45.1% | 45.1% | 45.1% | 45.1% | 45.1% | 45.1% | 45.1% | 45.1% | 45.1% | 45.1% | 45.1% | |
| Equipment | 34% | 78% | 66% | 59% | 40% | 48% | 57% | 36% | 46% | 51.5% | 0.0% | 51.5% | 51.5% | 51.5% | 51.5% | 51.5% | 51.5% | 51.5% | 51.5% | 51.5% | 51.5% | 51.5% | 51.5% | 51.5% | 51.5% | 51.5% | ||
Residential2 | 60% | 66% | 55% | 56% | 61% | 58% | 60% | 51% | 58.3% | 0.0% | 58.3% | 58.3% | 58.3% | 58.3% | 58.3% | 58.3% | 58.3% | 58.3% | 58.3% | 58.3% | 58.3% | 58.3% | 58.3% | 58.3% | 58.3% | |||
| Carrier Access Billing | 10% | |||||||||||||||||||||||||||
| Rent | 10% | |||||||||||||||||||||||||||
| Fixed COGS | 881,573 | 826,328 | 829,302 | 817,283 | 856,756 | 750,078 | 703,359 | 702,374 | 677,258 | 640,647 | ||||||||||||||||||
| % change | -6.3% | 0.4% | -1.4% | 4.8% | -12.5% | -6.2% | -0.1% | -3.6% | -5.4% | -3.4% | -1.0% | |||||||||||||||||
| 1) Based on Private Line historical COGS analysis | ||||||||||||||||||||||||||||
| 2) Based on cable service margin. Since cable services are inlcuded in residential revenues in 2013 and forward | ||||||||||||||||||||||||||||
Fiber COGS1 | Q1 2011 | Q2 2011 | Q3 2011 | Q4 2011 | Q1 2012 | Q2 2012 | Q3 2012 | Q4 2012 | Q1 2013 | Q2 2013 | Average | Projection | ||||||||||||||||
| Variable Bus COGS, % of business revenue | 3.8% | 3.7% | 3.4% | 3.3% | 3.3% | 3.3% | 3.2% | 3.2% | 3.6% | 3.5% | 3.4% | 3.4% | ||||||||||||||||
| Variable Res COGS, % of residential revenue | 46.4% | 46.4% | 44.7% | 43.5% | 41.9% | 42.2% | 39.5% | 40.4% | 42.4% | 41.6% | 41.3% | 41.3% | ||||||||||||||||
| Total fiber fixed costs | $229,546 | $227,256 | $253,385 | $266,897 | $321,558 | $320,219 | $328,902 | $340,648 | $377,549 | $379,851 | ||||||||||||||||||
| Quarterly growth assumption | 1.00% | |||||||||||||||||||||||||||
| Annual growth assumption (2017-2018) | 4.00% | |||||||||||||||||||||||||||
| 1) Based on COGS analysis | ||||||||||||||||||||||||||||
| Quarterly | Annual (2017-2018) | |||||||||||||||||||||||||||
| G&A Quarterly Increase | 1.00% | 2.00% | ||||||||||||||||||||||||||
| Selling expense increase | 1.50% | 3.00% | ||||||||||||||||||||||||||
| Bad Debt as a % of revenue | 1.5% | |||||||||||||||||||||||||||
| Tax Rate | 35.0% | NTS currently has ~22 million of NOLs. Model assumes NTS starting to pay taxes in 2016. | ||||||||||||||||||||||||||
| Property Tax | 1.25% | As % of sales | ||||||||||||||||||||||||||
| Yes = 1, No =0 | ||||||||||||||||||||||||||||
| Going Private Cost savings | 0 | |||||||||||||||||||||||||||
| Planned Cost savings - % of plan | 100.0% | |||||||||||||||||||||||||||
| Fiber Assumptions | ||||||||||||||||||||||||||||
| 2017-2018 annual growth | ||||||||||||||||||||||||||||
| Wholesale Fiber Growth Rate (Quarterly) | 5% | 10% | ||||||||||||||||||||||||||
| New Projects | % prob | Yes = 1, No =0 | ||||||||||||||||||||||||||
| Midland | 20.0% | 1 | With Midland | |||||||||||||||||||||||||
| Odessa | 20.0% | 1 | With Odessa | |||||||||||||||||||||||||
| New RUS | 20.0% | 1 | With New RUS Project | |||||||||||||||||||||||||
| Business Take Rate | ||||||||||||||||||||||||||||
| LTM | Q2 2013 | Aug-13 | Q3 2013 | Q4 2013 | Q1 2014 | Q2 2014 | Q3 2014 | Q4 2014 | Q1 2015 | Q2 2015 | Q3 2015 | Q4 2015 | Q1 2016 | Q2 2016 | Q3 2016 | Q4 2016 | 2017 | 2018 | ||||||||||
| Lubbock | 53% | 54% | 53% | 54% | 54% | 54% | 55% | 55% | 55% | 56% | 56% | 56% | 56% | 57% | 57% | 57% | 58% | 59% | 60% | |||||||||
| Wolfforth | 53% | 51% | 50% | 50% | 50% | 50% | 50% | 50% | 50% | 50% | 50% | 50% | 50% | 50% | 50% | 50% | 50% | 50% | 50% | |||||||||
| Levelland | 66% | 68% | 67% | 69% | 69% | 69% | 69% | 70% | 70% | 70% | 70% | 71% | 71% | 71% | 71% | 72% | 72% | 72% | 72% | |||||||||
| Smyer | 17% | 17% | 17% | 17% | 17% | 17% | 18% | 18% | 18% | 18% | 19% | 19% | 19% | 19% | 20% | 20% | 20% | 21% | 22% | |||||||||
| Littlefield | 41% | 41% | 42% | 43% | 45% | 46% | 58% | 70% | 70% | 70% | 70% | 70% | 70% | 70% | 70% | 70% | 70% | 70% | 70% | |||||||||
| Burkburnnet | 38% | 40% | 41% | 42% | 45% | 57% | 69% | 70% | 70% | 70% | 70% | 70% | 70% | 70% | 70% | 70% | 70% | 70% | 70% | |||||||||
| Brownfield | 56% | 61% | 61% | 61% | 61% | 61% | 65% | 70% | 70% | 70% | 70% | 70% | 70% | 70% | 70% | 70% | 70% | 70% | 70% | |||||||||
| Slaton | 24% | 27% | 29% | 29% | 31% | 33% | 35% | 37% | 39% | 41% | 43% | 45% | 47% | 49% | 51% | 53% | 55% | 60% | 65% | |||||||||
| Wilson | 17% | 17% | 17% | 17% | 17% | 17% | 17% | 17% | 17% | 17% | 17% | 17% | 17% | 17% | 17% | 17% | 17% | 17% | 17% | |||||||||
| Lamesa | 50% | 57% | 57% | 59% | 61% | 63% | 70% | 70% | 70% | 70% | 70% | 70% | 70% | 70% | 70% | 70% | 70% | 70% | 70% | |||||||||
| Plainview | 26% | 39% | 39% | 40% | 43% | 52% | 61% | 64% | 66% | 68% | 70% | 70% | 70% | 70% | 70% | 70% | 70% | 70% | 70% | |||||||||
| Wichita Falls | 16% | 23% | 27% | 31% | 40% | 50% | 51% | 51% | 52% | 52% | 53% | 53% | 54% | 54% | 55% | 55% | 56% | 58% | 60% | |||||||||
| Iowa Park | 9% | 12% | 14% | 15% | 18% | 21% | 36% | 51% | 53% | 55% | 57% | 59% | 61% | 63% | 65% | 67% | 69% | 71% | 71% | |||||||||
| Hammond | 1% | 3% | 10% | 10% | 13% | 15% | 17% | 18% | 20% | 21% | 23% | 24% | 26% | 27% | 29% | 30% | 32% | 36% | 40% | |||||||||
| Ponchatoula | 0% | 0% | 0% | 18% | 27% | 30% | 33% | 36% | 39% | 42% | 45% | 48% | 51% | 54% | 57% | 60% | 65% | 70% | ||||||||||
| Abilene | 0% | 0% | 1% | 3% | 20% | 35% | 50% | 51% | 51% | 52% | 52% | 53% | 53% | 54% | 54% | 55% | 55% | 55% | 55% | |||||||||
| % of Levelland growth | ||||||||||||||||||||||||||||
| Hale Center | 100% | 0% | 0% | 2% | 5% | 12% | 18% | 25% | 36% | 43% | 47% | 49% | 56% | 57% | 59% | 61% | 64% | 65% | 68% | 69% | ||||||||
| Abernathy | 100% | 0% | 0% | 12% | 18% | 25% | 36% | 43% | 47% | 49% | 56% | 57% | 59% | 61% | 64% | 65% | 68% | 69% | ||||||||||
| New Deal | 100% | 0% | 0% | 12% | 18% | 25% | 36% | 43% | 47% | 49% | 56% | 57% | 59% | 61% | 64% | 65% | 68% | 69% | ||||||||||
| Amarillo | 0% | 0% | 2% | 14% | 26% | 32% | 38% | 39% | 40% | 41% | 42% | 43% | 44% | 45% | 46% | 46% | 46% | |||||||||||
| Tickfaw Village | 100% | 0% | 0% | 0% | 18% | 25% | 36% | 43% | 47% | 49% | 56% | 57% | 59% | 61% | 64% | 65% | 68% | 69% | ||||||||||
| Independence | 100% | 0% | 0% | 0% | 18% | 25% | 36% | 43% | 47% | 49% | 56% | 57% | 59% | 61% | 64% | 65% | 68% | 69% | ||||||||||
| Amite | 100% | 0% | 0% | 0% | 18% | 25% | 36% | 43% | 47% | 49% | 56% | 57% | 59% | 61% | 64% | 65% | 68% | 69% | ||||||||||
| Pine Grove | 100% | 0% | 0% | 0% | 18% | 25% | 36% | 43% | 47% | 49% | 56% | 57% | 59% | 61% | 64% | 65% | 68% | 69% | ||||||||||
| Montpelier | 100% | 0% | 0% | 0% | 18% | 25% | 36% | 43% | 47% | 49% | 56% | 57% | 59% | 61% | 64% | 65% | 68% | 69% | ||||||||||
| Franklington | 100% | 0% | 0% | 0% | 18% | 25% | 36% | 43% | 47% | 49% | 56% | 57% | 59% | 61% | 64% | 65% | 68% | 69% | ||||||||||
| Towers | 100% | 0% | 0% | 0% | 18% | 25% | 36% | 43% | 47% | 49% | 56% | 57% | 59% | 61% | 64% | 65% | 68% | 69% | ||||||||||
| Natalbany | 100% | 0% | 0% | 0% | 18% | 25% | 36% | 43% | 47% | 49% | 56% | 57% | 59% | 61% | 64% | 65% | 68% | 69% | ||||||||||
| Midland (same as Abilene) | 3% | 20% | 35% | 50% | 51% | 51% | 52% | 52% | 53% | 53% | 54% | |||||||||||||||||
| Odessa (same as Abilene) | 3% | 20% | 35% | 50% | 51% | 51% | 52% | 52% | 53% | 53% | ||||||||||||||||||
| Snyder | 100% | 12% | 18% | 25% | 36% | 43% | 47% | 49% | 56% | 60% | 67% | |||||||||||||||||
| Sweetwater | 100% | 12% | 18% | 25% | 36% | 43% | 47% | 49% | 56% | 60% | 67% | |||||||||||||||||
| Pampa | 100% | 12% | 18% | 25% | 36% | 43% | 47% | 49% | 56% | 60% | 67% | |||||||||||||||||
| Residential Take Rate | ||||||||||||||||||||||||||||
| LTM | Q2 2013 | Aug-13 | Q3 2013 | Q4 2013 | Q1 2014 | Q2 2014 | Q3 2014 | Q4 2014 | Q1 2015 | Q2 2015 | Q3 2015 | Q4 2015 | Q1 2016 | Q2 2016 | Q3 2016 | Q4 2016 | 2017 | 2018 | ||||||||||
| Lubbock | 13% | 13% | 12% | 12% | 12% | 12% | 13% | 13% | 14% | 14% | 15% | 15% | 16% | 16% | 17% | 17% | 18% | 20% | 22% | |||||||||
| Wolfforth | 9% | 9% | 9% | 9% | 9% | 9% | 10% | 10% | 11% | 11% | 12% | 12% | 13% | 13% | 14% | 14% | 15% | 17% | 19% | |||||||||
| Levelland | 38% | 38% | 38% | 38% | 38% | 38% | 39% | 39% | 40% | 40% | 41% | 41% | 42% | 42% | 43% | 43% | 44% | 44% | 44% | |||||||||
| Smyer | 35% | 36% | 35% | 35% | 35% | 35% | 35% | 36% | 36% | 37% | 37% | 38% | 38% | 39% | 39% | 40% | 40% | 42% | 44% | |||||||||
| Littlefield | 40% | 41% | 41% | 41% | 41% | 41% | 41% | 42% | 42% | 43% | 43% | 44% | 44% | 44% | 44% | 44% | 44% | 44% | 44% | |||||||||
| Whitharral | 15% | 18% | 21% | 21% | 22% | 23% | 24% | 25% | 26% | 27% | 28% | 29% | 30% | 31% | 32% | 33% | 34% | 37% | 40% | |||||||||
| Burburnnet | 29% | 30% | 31% | 31% | 32% | 33% | 34% | 35% | 36% | 37% | 38% | 39% | 40% | 41% | 42% | 43% | 44% | 44% | 44% | |||||||||
| Brownfield | 36% | 38% | 38% | 39% | 40% | 40% | 41% | 41% | 42% | 42% | 43% | 43% | 44% | 44% | 44% | 44% | 44% | 44% | 44% | |||||||||
| Slaton | 14% | 17% | 17% | 18% | 19% | 20% | 21% | 22% | 23% | 24% | 25% | 26% | 27% | 28% | 29% | 30% | 31% | 34% | 37% | |||||||||
| Wilson | 21% | 23% | 25% | 25% | 26% | 27% | 28% | 29% | 30% | 31% | 32% | 33% | 34% | 35% | 36% | 37% | 38% | 41% | 44% | |||||||||
| Lamesa | 20% | 26% | 27% | 27% | 29% | 31% | 33% | 35% | 37% | 39% | 41% | 43% | 44% | 44% | 44% | 44% | 44% | 44% | 44% | |||||||||
| Meadow Bus/ | 21% | 26% | 26% | 27% | 28% | 29% | 30% | 31% | 32% | 33% | 34% | 35% | 36% | 37% | 38% | 39% | 40% | 42% | 44% | |||||||||
| Ropesville Bus/ | 18% | 22% | 22% | 23% | 24% | 25% | 26% | 27% | 28% | 29% | 30% | 31% | 32% | 33% | 34% | 35% | 36% | 39% | 42% | |||||||||
| Plainview | 6% | 12% | 13% | 14% | 17% | 20% | 22% | 24% | 26% | 28% | 30% | 32% | 34% | 36% | 38% | 40% | 42% | 44% | 44% | |||||||||
| Iowa Park | 6% | 10% | 12% | 13% | 16% | 19% | 21% | 23% | 25% | 27% | 29% | 31% | 33% | 35% | 37% | 39% | 41% | 44% | 44% | |||||||||
| % of Levelland growth | ||||||||||||||||||||||||||||
| Hammond | 100% | 0% | 0% | 1% | 1% | 2% | 9% | 20% | 28% | 34% | 37% | 38% | 37% | 38% | 38% | 38% | 39% | 38% | 38% | 39% | ||||||||
| Ponchatoula | 100% | 0% | 0% | 0% | 2% | 9% | 20% | 28% | 34% | 37% | 38% | 37% | 38% | 38% | 38% | 39% | 38% | 38% | 39% | |||||||||
| Hale Center | 100% | 0% | 0% | 6% | 10% | 20% | 28% | 34% | 37% | 38% | 37% | 38% | 38% | 38% | 39% | 38% | 39% | 38% | 38% | 40% | ||||||||
| Abernathy | 100% | 0% | 0% | 2% | 9% | 20% | 28% | 34% | 37% | 38% | 37% | 38% | 38% | 38% | 39% | 38% | 38% | 39% | ||||||||||
| New Deal | 100% | 0% | 0% | 2% | 9% | 20% | 28% | 34% | 37% | 38% | 37% | 38% | 38% | 38% | 39% | 38% | 38% | 39% | ||||||||||
| Tickfaw Village | 100% | 0% | 0% | 0% | 2% | 9% | 20% | 28% | 34% | 37% | 38% | 37% | 38% | 38% | 38% | 39% | 38% | 38% | ||||||||||
| Independence | 100% | 0% | 0% | 0% | 2% | 9% | 20% | 28% | 34% | 37% | 38% | 37% | 38% | 38% | 38% | 39% | 38% | 38% | ||||||||||
| Amite | 100% | 0% | 0% | 0% | 2% | 9% | 20% | 28% | 34% | 37% | 38% | 37% | 38% | 38% | 38% | 39% | 38% | 38% | ||||||||||
| Pine Grove | 100% | 0% | 0% | 0% | 2% | 9% | 20% | 28% | 34% | 37% | 38% | 37% | 38% | 38% | 38% | 39% | 38% | 38% | ||||||||||
| Montpelier | 100% | 0% | 0% | 0% | 2% | 9% | 20% | 28% | 34% | 37% | 38% | 37% | 38% | 38% | 38% | 39% | 38% | 38% | ||||||||||
| Franklington | 100% | 0% | 0% | 0% | 2% | 9% | 20% | 28% | 34% | 37% | 38% | 37% | 38% | 38% | 38% | 39% | 38% | 38% | ||||||||||
| Towers | 100% | 0% | 0% | 0% | 2% | 9% | 20% | 28% | 34% | 37% | 38% | 37% | 38% | 38% | 38% | 39% | 38% | 38% | ||||||||||
| Natalbany | 100% | 0% | 0% | 0% | 2% | 9% | 20% | 28% | 34% | 37% | 38% | 37% | 38% | 38% | 38% | 39% | 38% | 38% | ||||||||||
| Snyder | 100% | 2% | 9% | 20% | 28% | 34% | 37% | 38% | 37% | 38% | 38% | |||||||||||||||||
| Sweetwater | 100% | 2% | 9% | 20% | 28% | 34% | 37% | 38% | 37% | 38% | 38% | |||||||||||||||||
| Pampa | 100% | 2% | 9% | 20% | 28% | 34% | 37% | 38% | 37% | 38% | 38% | |||||||||||||||||
| Business ARPU (weighted average for Blitz impact) | ||||||||||||||||||||||||||||
| Business ARPU during Blitz | $200 | |||||||||||||||||||||||||||
| LTM | Q2 2013 | Aug-13 | Q3 2013 | Q4 2013 | Q1 2014 | Q2 2014 | Q3 2014 | Q4 2014 | Q1 2015 | Q2 2015 | Q3 2015 | Q4 2015 | Q1 2016 | Q2 2016 | Q3 2016 | Q4 2016 | 2017 | 2018 | ||||||||||
| Lubbock | $405 | $404 | $412 | $410 | $412 | $414 | $416 | $418 | $420 | $422 | $424 | $426 | $428 | $430 | $432 | $434 | $436 | $436 | $436 | |||||||||
| Wolfforth | $334 | $341 | $364 | $350 | $352 | $354 | $356 | $358 | $360 | $362 | $364 | $366 | $368 | $370 | $372 | $374 | $376 | $376 | $376 | |||||||||
| Misc Fiber - Other Mkts | $841 | $1,133 | $3,664 | $1,133 | $1,133 | $1,133 | $1,133 | $1,133 | $1,133 | $1,133 | $1,133 | $1,133 | $1,133 | $1,133 | $1,133 | $1,133 | $1,133 | $1,133 | $1,133 | |||||||||
| Levelland | $454 | $450 | $469 | $465 | $467 | $469 | $471 | $473 | $475 | $477 | $479 | $481 | $483 | $485 | $487 | $489 | $491 | $491 | $491 | |||||||||
| Smyer | $402 | $407 | $407 | $407 | $407 | $407 | $407 | $407 | $407 | $407 | $407 | $407 | $407 | $407 | $407 | $407 | $407 | $407 | $407 | |||||||||
| Littlefield | $291 | $300 | $287 | $300 | $302 | $304 | $296 | $283 | $285 | $287 | $289 | $291 | $293 | $295 | $297 | $299 | $301 | $301 | $301 | |||||||||
| Burkburnnet | $219 | $201 | $251 | $245 | $260 | $268 | $269 | $279 | $289 | $299 | $309 | $319 | $329 | $339 | $345 | $345 | $345 | $345 | $345 | |||||||||
| Brownfield | $216 | $195 | $211 | $210 | $225 | $240 | $254 | $265 | $280 | $295 | $305 | $315 | $325 | $335 | $342 | $342 | $342 | $342 | $342 | |||||||||
| Slaton | $214 | $207 | $206 | $210 | $225 | $240 | $255 | $270 | $285 | $300 | $310 | $320 | $330 | $340 | $340 | $340 | $340 | $340 | $340 | |||||||||
| Wilson | $140 | $105 | $116 | $115 | $115 | $115 | $115 | $115 | $115 | $115 | $115 | $115 | $115 | $115 | $115 | $115 | $115 | $115 | $115 | |||||||||
| Lamesa | $186 | $186 | $188 | $205 | $220 | $235 | $248 | $263 | $278 | $293 | $308 | $318 | $328 | $338 | $341 | $341 | $341 | $341 | $341 | |||||||||
| Plainview | $441 | $207 | $253 | $260 | $275 | $283 | $285 | $295 | $305 | $315 | $325 | $335 | $345 | $345 | $345 | $345 | $345 | $345 | $345 | |||||||||
| Wichita Falls | $235 | $215 | $206 | $213 | $220 | $225 | $240 | $255 | $270 | $285 | $295 | $305 | $315 | $320 | $320 | $320 | $320 | $320 | $320 | |||||||||
| Iowa Park | $237 | $192 | $157 | $160 | $175 | $190 | $204 | $211 | $226 | $241 | $256 | $271 | $286 | $296 | $306 | $316 | $326 | $326 | $326 | |||||||||
| Hammond | $44 | $177 | $200 | $200 | $210 | $220 | $230 | $240 | $250 | $260 | $270 | $280 | $290 | $300 | $310 | $320 | $330 | $330 | $330 | |||||||||
| Ponchatoula | $0 | $0 | $200 | $200 | $200 | $210 | $220 | $230 | $240 | $250 | $260 | $270 | $280 | $290 | $300 | $310 | $310 | $310 | ||||||||||
| Abilene | $0 | $0 | $200 | $203 | $203 | $203 | $213 | $223 | $233 | $243 | $253 | $263 | $273 | $283 | $293 | $303 | $303 | $303 | ||||||||||
| Hale Center | $0 | $0 | $200 | $210 | $220 | $230 | $240 | $250 | $260 | $270 | $280 | $290 | $300 | $310 | $320 | $330 | $330 | $330 | ||||||||||
| Abernathy | $0 | $0 | $200 | $210 | $220 | $230 | $240 | $250 | $260 | $270 | $280 | $290 | $300 | $310 | $320 | $320 | $320 | |||||||||||
| New Deal | $0 | $0 | $200 | $210 | $220 | $230 | $240 | $250 | $260 | $270 | $280 | $290 | $300 | $310 | $320 | $320 | $320 | |||||||||||
| Amarillo | $0 | $0 | $200 | $202 | $202 | $212 | $222 | $232 | $242 | $252 | $262 | $272 | $282 | $292 | $302 | $302 | $302 | |||||||||||
| Tickfaw Village | $0 | $0 | $200 | $210 | $220 | $230 | $240 | $250 | $260 | $270 | $280 | $290 | $300 | $310 | $320 | $320 | $320 | |||||||||||
| Independence | $0 | $0 | $200 | $210 | $220 | $230 | $240 | $250 | $260 | $270 | $280 | $290 | $300 | $310 | $320 | $320 | $320 | |||||||||||
| Amite | $0 | $0 | $200 | $210 | $220 | $230 | $240 | $250 | $260 | $270 | $280 | $290 | $300 | $310 | $320 | $320 | $320 | |||||||||||
| Pine Grove | $0 | $0 | $200 | $210 | $220 | $230 | $240 | $250 | $260 | $270 | $280 | $290 | $300 | $310 | $320 | $320 | $320 | |||||||||||
| Montpelier | $0 | $0 | $200 | $210 | $220 | $230 | $240 | $250 | $260 | $270 | $280 | $290 | $300 | $310 | $320 | $320 | $320 | |||||||||||
| Franklington | $0 | $0 | $200 | $210 | $220 | $230 | $240 | $250 | $260 | $270 | $280 | $290 | $300 | $310 | $320 | $320 | $320 | |||||||||||
| Towers | $0 | $0 | $200 | $210 | $220 | $230 | $240 | $250 | $260 | $270 | $280 | $290 | $300 | $310 | $320 | $320 | $320 | |||||||||||
| Natalbany | $0 | $0 | $200 | $210 | $220 | $230 | $240 | $250 | $260 | $270 | $280 | $290 | $300 | $310 | $320 | $320 | $320 | |||||||||||
| Midland (same as Abilene) | $200 | $203 | $203 | $203 | $213 | $223 | $233 | $243 | $253 | $263 | $273 | |||||||||||||||||
| Odessa (same as Abilene) | $200 | $203 | $203 | $203 | $213 | $223 | $233 | $243 | $253 | $263 | ||||||||||||||||||
| Snyder (same as Burkburnnet) | $201 | $245 | $256 | $261 | $260 | $268 | $275 | $283 | $290 | $298 | ||||||||||||||||||
| Sweetwater (same as Burkburnnet) | $201 | $245 | $256 | $261 | $260 | $268 | $275 | $283 | $290 | $298 | ||||||||||||||||||
| Pampa (same as Burkburnnet) | $201 | $245 | $256 | $261 | $260 | $268 | $275 | $283 | $290 | $298 | ||||||||||||||||||
| Residential ARPU | ||||||||||||||||||||||||||||
| LTM | Q2 2013 | Aug-13 | Q3 2013 | Q4 2013 | Q1 2014 | Q2 2014 | Q3 2014 | Q4 2014 | Q1 2015 | Q2 2015 | Q3 2015 | Q4 2015 | Q1 2016 | Q2 2016 | Q3 2016 | Q4 2016 | 2017 | 2018 | ||||||||||
| Lubbock | $87 | $85 | $89 | $88 | $90 | $92 | $94 | $96 | $98 | $100 | $102 | $104 | $106 | $108 | $110 | $110 | $110 | $110 | $110 | |||||||||
| Wolfforth | $92 | $92 | $92 | $94 | $96 | $98 | $100 | $102 | $104 | $106 | $108 | $110 | $110 | $110 | $110 | $110 | $110 | $110 | $110 | |||||||||
| Levelland | $103 | $105 | $104 | $105 | $106 | $107 | $108 | $109 | $110 | $110 | $110 | $110 | $110 | $110 | $110 | $110 | $110 | $110 | $110 | |||||||||
| Smyer | $105 | $109 | $95 | $110 | $110 | $110 | $110 | $110 | $110 | $110 | $110 | $110 | $110 | $110 | $110 | $110 | $110 | $110 | $110 | |||||||||
| Littlefield | $111 | $110 | $116 | $110 | $110 | $110 | $110 | $110 | $110 | $110 | $110 | $110 | $110 | $110 | $110 | $110 | $110 | $110 | $110 | |||||||||
| Whitharral | $112 | $93 | $104 | $104 | $105 | $106 | $107 | $108 | $109 | $110 | $110 | $110 | $110 | $110 | $110 | $110 | $110 | $110 | $110 | |||||||||
| Burkburnnet | $107 | $106 | $106 | $108 | $110 | $110 | $110 | $110 | $110 | $110 | $110 | $110 | $110 | $110 | $110 | $110 | $110 | $110 | $110 | |||||||||
| Brownfield | $104 | $100 | $103 | $102 | $104 | $106 | $108 | $110 | $110 | $110 | $110 | $110 | $110 | $110 | $110 | $110 | $110 | $110 | $110 | |||||||||
| Slaton | $108 | $101 | $106 | $106 | $108 | $110 | $110 | $110 | $110 | $110 | $110 | $110 | $110 | $110 | $110 | $110 | $110 | $110 | $110 | |||||||||
| Wilson | $116 | $112 | $106 | $112 | $112 | $112 | $112 | $112 | $112 | $112 | $112 | $112 | $112 | $112 | $112 | $112 | $112 | $112 | $112 | |||||||||
| Lamesa | $110 | $104 | $101 | $102 | $104 | $106 | $108 | $110 | $110 | $110 | $110 | $110 | $110 | $110 | $110 | $110 | $110 | $110 | $110 | |||||||||
| Meadow | $121 | $124 | $123 | $124 | $124 | $124 | $124 | $124 | $124 | $124 | $124 | $124 | $124 | $124 | $124 | $124 | $124 | $124 | $124 | |||||||||
| Ropesville | $106 | $106 | $114 | $106 | $108 | $110 | $110 | $110 | $110 | $110 | $110 | $110 | $110 | $110 | $110 | $110 | $110 | $110 | $110 | |||||||||
| Plainview | $113 | $101 | $101 | $102 | $104 | $106 | $108 | $110 | $110 | $110 | $110 | $110 | $110 | $110 | $110 | $110 | $110 | $110 | $110 | |||||||||
| Iowa Park | $104 | $98 | $107 | $104 | $106 | $108 | $110 | $110 | $110 | $110 | $110 | $110 | $110 | $110 | $110 | $110 | $110 | $110 | $110 | |||||||||
| Hammond | $0 | $0 | $130 | $105 | $106 | $108 | $110 | $110 | $110 | $110 | $110 | $110 | $110 | $110 | $110 | $110 | $110 | $110 | $110 | |||||||||
| Ponchatoula | $0 | $0 | $105 | $106 | $108 | $110 | $110 | $110 | $110 | $110 | $110 | $110 | $110 | $110 | $110 | $110 | $110 | $110 | ||||||||||
| Hale Center | $0 | $0 | $95 | $105 | $106 | $108 | $110 | $110 | $110 | $110 | $110 | $110 | $110 | $110 | $110 | $110 | $110 | $110 | $110 | |||||||||
| Abernathy | $0 | $0 | $105 | $106 | $108 | $110 | $110 | $110 | $110 | $110 | $110 | $110 | $110 | $110 | $110 | $110 | $110 | |||||||||||
| New Deal | $0 | $0 | $105 | $106 | $108 | $110 | $110 | $110 | $110 | $110 | $110 | $110 | $110 | $110 | $110 | $110 | $110 | |||||||||||
| Tickfaw Village | $0 | $0 | $105 | $106 | $108 | $110 | $110 | $110 | $110 | $110 | $110 | $110 | $110 | $110 | $110 | $110 | $110 | |||||||||||
| Independence | $0 | $0 | $105 | $106 | $108 | $110 | $110 | $110 | $110 | $110 | $110 | $110 | $110 | $110 | $110 | $110 | $110 | |||||||||||
| Amite | $0 | $0 | $105 | $106 | $108 | $110 | $110 | $110 | $110 | $110 | $110 | $110 | $110 | $110 | $110 | $110 | $110 | |||||||||||
| Pine Grove | $0 | $0 | $105 | $106 | $108 | $110 | $110 | $110 | $110 | $110 | $110 | $110 | $110 | $110 | $110 | $110 | $110 | |||||||||||
| Montpelier | $0 | $0 | $105 | $106 | $108 | $110 | $110 | $110 | $110 | $110 | $110 | $110 | $110 | $110 | $110 | $110 | $110 | |||||||||||
| Franklington | $0 | $0 | $105 | $106 | $108 | $110 | $110 | $110 | $110 | $110 | $110 | $110 | $110 | $110 | $110 | $110 | $110 | |||||||||||
| Towers | $0 | $0 | $105 | $106 | $108 | $110 | $110 | $110 | $110 | $110 | $110 | $110 | $110 | $110 | $110 | $110 | $110 | |||||||||||
| Natalbany | $0 | $0 | $105 | $106 | $108 | $110 | $110 | $110 | $110 | $110 | $110 | $110 | $110 | $110 | $110 | $110 | $110 | |||||||||||
| Snyder | $105 | $106 | $108 | $110 | $110 | $110 | $110 | $110 | $110 | $110 | ||||||||||||||||||
| Sweetwater | $105 | $106 | $108 | $110 | $110 | $110 | $110 | $110 | $110 | $110 | ||||||||||||||||||
| Pampa | $105 | $106 | $108 | $110 | $110 | $110 | $110 | $110 | $110 | $110 | ||||||||||||||||||
| ARPU Assumptions for Blitz Communities | ||||||||||||||||||||||||||||
| Business ARPU without Blitz | LTM | Q2 2013 | Aug-13 | Q3 2013 | Q4 2013 | Q1 2014 | Q2 2014 | Q3 2014 | Q4 2014 | Q1 2015 | Q2 2015 | Q3 2015 | Q4 2015 | Q1 2016 | Q2 2016 | Q3 2016 | Q4 2016 | 2017 | 2018 | |||||||||
| Littlefield | $291 | $300 | $287 | $300 | $302 | $304 | $306 | $308 | $310 | $312 | $314 | $316 | $318 | $320 | $322 | $324 | $326 | $326 | $326 | |||||||||
| Burkburnnet | $219 | $201 | $251 | $245 | $260 | $275 | $290 | $300 | $310 | $320 | $330 | $340 | $350 | $360 | $366 | $366 | $366 | $366 | $366 | |||||||||
| Brownfield | $216 | $195 | $211 | $210 | $225 | $240 | $255 | $270 | $285 | $300 | $310 | $320 | $330 | $340 | $347 | $347 | $347 | $347 | $347 | |||||||||
| Lamesa | $186 | $186 | $188 | $205 | $220 | $235 | $250 | $265 | $280 | $295 | $310 | $320 | $330 | $340 | $343 | $343 | $343 | $343 | $343 | |||||||||
| Plainview | $441 | $207 | $253 | $260 | $275 | $290 | $305 | $315 | $325 | $335 | $345 | $355 | $365 | $365 | $365 | $365 | $365 | $365 | $365 | |||||||||
| Wichita Falls | $235 | $215 | $206 | $215 | $230 | $245 | $260 | $275 | $290 | $305 | $315 | $325 | $335 | $340 | $340 | $340 | $340 | $340 | $340 | |||||||||
| Iowa Park | $237 | $192 | $157 | $160 | $175 | $190 | $205 | $220 | $235 | $250 | $265 | $280 | $295 | $305 | $315 | $325 | $335 | $335 | $335 | |||||||||
| Hammond | $44 | $177 | $200 | $200 | $210 | $220 | $230 | $240 | $250 | $260 | $270 | $280 | $290 | $300 | $310 | $320 | $330 | $330 | $330 | |||||||||
| Ponchatoula | $0 | $0 | $200 | $210 | $220 | $230 | $240 | $250 | $260 | $270 | $280 | $290 | $300 | $310 | $320 | $330 | $330 | $330 | ||||||||||
| Abilene | $0 | $0 | $200 | $210 | $220 | $230 | $240 | $250 | $260 | $270 | $280 | $290 | $300 | $310 | $320 | $330 | $330 | $330 | ||||||||||
| Amarillo | $0 | $0 | $200 | $210 | $220 | $230 | $240 | $250 | $260 | $270 | $280 | $290 | $300 | $310 | $320 | $320 | $320 | |||||||||||
| Blitz Schedule Per Market | 1= Blitz | |||||||||||||||||||||||||||
| Littlefield | 0= No Blitz | 0 | 0 | 0 | 1 | 1 | 0 | 0 | 0 | 0 | 0 | 0 | 0 | 0 | 0 | 0 | 0 | |||||||||||
| Burkburnnet | 0 | 0 | 1 | 1 | 0 | 0 | 0 | 0 | 0 | 0 | 0 | 0 | 0 | 0 | 0 | 0 | ||||||||||||
| Brownfield | 0 | 0 | 0 | 1 | 1 | 0 | 0 | 0 | 0 | 0 | 0 | 0 | 0 | 0 | 0 | 0 | ||||||||||||
| Lamesa | 0 | 0 | 0 | 1 | 0 | 0 | 0 | 0 | 0 | 0 | 0 | 0 | 0 | 0 | 0 | 0 | ||||||||||||
| Plainview | 0 | 0 | 1 | 1 | 0 | 0 | 0 | 0 | 0 | 0 | 0 | 0 | 0 | 0 | 0 | 0 | ||||||||||||
| Wichita Falls | 1 | 1 | 1 | 0 | 0 | 0 | 0 | 0 | 0 | 0 | 0 | 0 | 0 | 0 | 0 | 0 | ||||||||||||
| Iowa Park | 0 | 0 | 0 | 1 | 1 | 0 | 0 | 0 | 0 | 0 | 0 | 0 | 0 | 0 | 0 | 0 | ||||||||||||
| Hammond | 1 | 0 | 0 | 0 | 0 | 0 | 0 | 0 | 0 | 0 | 0 | 0 | 0 | 0 | 0 | 0 | ||||||||||||
| Ponchatoula | 0 | 1 | 1 | 0 | 0 | 0 | 0 | 0 | 0 | 0 | 0 | 0 | 0 | 0 | 0 | 0 | ||||||||||||
| Abilene | 0 | 1 | 1 | 1 | 0 | 0 | 0 | 0 | 0 | 0 | 0 | 0 | 0 | 0 | 0 | 0 | ||||||||||||
| Amarillo | 0 | 0 | 1 | 1 | 0 | 0 | 0 | 0 | 0 | 0 | 0 | 0 | 0 | 0 | 0 | 0 | ||||||||||||
| Q3 2013 | Q4 2013 | Q1 2014 | Q2 2014 | Q3 2014 | Q4 2014 | Q1 2015 | Q2 2015 | Q3 2015 | Q4 2015 | Q1 2016 | Q2 2016 | Q3 2016 | Q4 2016 | 2017 | 2018 | |||||||||||||
| Existing Count Prior to Blitz | ||||||||||||||||||||||||||||
| Littlefield | 71 | 74 | 76 | 78 | 78 | 78 | 0 | 0 | 0 | 0 | 0 | 0 | 0 | 0 | 0 | 0 | 0 | |||||||||||
| Burkburnnet | 104 | 110 | 116 | 116 | 116 | 0 | 0 | 0 | 0 | 0 | 0 | 0 | 0 | 0 | 0 | 0 | 0 | |||||||||||
| Brownfield | 108 | 108 | 108 | 108 | 108 | 108 | 0 | 0 | 0 | 0 | 0 | 0 | 0 | 0 | 0 | 0 | 0 | |||||||||||
| Lamesa | 126 | 132 | 135 | 138 | 138 | 0 | 0 | 0 | 0 | 0 | 0 | 0 | 0 | 0 | 0 | 0 | 0 | |||||||||||
| Plainview | 212 | 219 | 231 | 231 | 231 | 0 | 0 | 0 | 0 | 0 | 0 | 0 | 0 | 0 | 0 | 0 | 0 | |||||||||||
| Wichita Falls | 241 | 241 | 241 | 241 | 0 | 0 | 0 | 0 | 0 | 0 | 0 | 0 | 0 | 0 | 0 | 0 | 0 | |||||||||||
| Iowa Park | 21 | 27 | 31 | 35 | 35 | 35 | 0 | 0 | 0 | 0 | 0 | 0 | 0 | 0 | 0 | 0 | 0 | |||||||||||
| Hammond | 66 | 66 | 0 | 0 | 0 | 0 | 0 | 0 | 0 | 0 | 0 | 0 | 0 | 0 | 0 | 0 | 0 | |||||||||||
| Ponchatoula | 0 | 0 | 0 | 0 | 0 | 0 | 0 | 0 | 0 | 0 | 0 | 0 | 0 | 0 | 0 | 0 | 0 | |||||||||||
| Abilene | 0 | 30 | 30 | 30 | 30 | 0 | 0 | 0 | 0 | 0 | 0 | 0 | 0 | 0 | 0 | 0 | 0 | |||||||||||
| Amarillo | 0 | 0 | 30 | 30 | 30 | 0 | 0 | 0 | 0 | 0 | 0 | 0 | 0 | 0 | 0 | 0 | 0 | |||||||||||
| New Count from Blitz | ||||||||||||||||||||||||||||
| Littlefield | 0 | 0 | 0 | 16 | 16 | 0 | 0 | 0 | 0 | 0 | 0 | 0 | 0 | 0 | 0 | 0 | ||||||||||||
| Burkburnnet | 0 | 0 | 24 | 24 | 0 | 0 | 0 | 0 | 0 | 0 | 0 | 0 | 0 | 0 | 0 | 0 | ||||||||||||
| Brownfield | 0 | 0 | 0 | 5 | 7 | 0 | 0 | 0 | 0 | 0 | 0 | 0 | 0 | 0 | 0 | 0 | ||||||||||||
| Lamesa | 0 | 0 | 0 | 12 | 0 | 0 | 0 | 0 | 0 | 0 | 0 | 0 | 0 | 0 | 0 | 0 | ||||||||||||
| Plainview | 0 | 0 | 37 | 37 | 0 | 0 | 0 | 0 | 0 | 0 | 0 | 0 | 0 | 0 | 0 | 0 | ||||||||||||
| Wichita Falls | 80 | 75 | 79 | 0 | 0 | 0 | 0 | 0 | 0 | 0 | 0 | 0 | 0 | 0 | 0 | 0 | ||||||||||||
| Iowa Park | 0 | 0 | 0 | 20 | 20 | 0 | 0 | 0 | 0 | 0 | 0 | 0 | 0 | 0 | 0 | 0 | ||||||||||||
| Hammond | 148 | 0 | 0 | 0 | 0 | 0 | 0 | 0 | 0 | 0 | 0 | 0 | 0 | 0 | 0 | 0 | ||||||||||||
| Ponchatoula | 0 | 76 | 38 | 0 | 0 | 0 | 0 | 0 | 0 | 0 | 0 | 0 | 0 | 0 | 0 | 0 | ||||||||||||
| Abilene | 0 | 128 | 113 | 113 | 0 | 0 | 0 | 0 | 0 | 0 | 0 | 0 | 0 | 0 | 0 | 0 | ||||||||||||
| Amarillo | 0 | 0 | 188 | 180 | 0 | 0 | 0 | 0 | 0 | 0 | 0 | 0 | 0 | 0 | 0 | 0 | ||||||||||||
| Cumulative Avg New Count from Blitz | Q3 2015 | Q4 2015 | Q1 2016 | Q2 2016 | Q3 2016 | Q4 2016 | 2017 | 2018 | ||||||||||||||||||||
| Littlefield | 0 | 0 | 8 | 23 | 31 | 31 | 31 | 31 | 31 | 31 | 31 | 31 | 31 | 31 | 31 | |||||||||||||
| Burkburnnet | 0 | 12 | 36 | 47 | 47 | 47 | 47 | 47 | 47 | 47 | 47 | 47 | 47 | 47 | 47 | |||||||||||||
| Brownfield | 0 | 0 | 3 | 9 | 12 | 12 | 12 | 12 | 12 | 12 | 12 | 12 | 12 | 12 | 12 | |||||||||||||
| Lamesa | 0 | 0 | 6 | 12 | 12 | 12 | 12 | 12 | 12 | 12 | 12 | 12 | 12 | 12 | 12 | |||||||||||||
| Plainview | 0 | 18 | 55 | 74 | 74 | 74 | 74 | 74 | 74 | 74 | 74 | 74 | 74 | 74 | 74 | |||||||||||||
| Wichita Falls | 40 | 117 | 194 | 234 | 234 | 234 | 234 | 234 | 234 | 234 | 234 | 234 | 234 | 234 | 234 | 234 | ||||||||||||
| Iowa Park | 0 | 0 | 10 | 30 | 41 | 41 | 41 | 41 | 41 | 41 | 41 | 41 | 41 | 41 | 41 | |||||||||||||
| Hammond | 74 | 148 | 148 | 148 | 148 | 148 | 148 | 148 | 148 | 148 | 148 | 148 | 148 | 148 | 148 | 148 | ||||||||||||
| Ponchatoula | 38 | 95 | 114 | 114 | 114 | 114 | 114 | 114 | 114 | 114 | 114 | 114 | 114 | 114 | 114 | |||||||||||||
| Abilene | 64 | 184 | 296 | 353 | 353 | 353 | 353 | 353 | 353 | 353 | 353 | 353 | 353 | 353 | 353 | |||||||||||||
| Amarillo | 0 | 94 | 278 | 368 | 368 | 368 | 368 | 368 | 368 | 368 | 368 | 368 | 368 | 368 | 368 | |||||||||||||
2
| Quarterly Growth Assumptions Organic | Smart Build | |||||||||||||||||||||||||||
| UNE-L Revenue | Business | Residential | Cannibalization | |||||||||||||||||||||||||
| Average | Projected | Average | Projected | |||||||||||||||||||||||||
| Abilene | ||||||||||||||||||||||||||||
| Count | -2.5% | -3.5% | -7.0% | -8.0% | 25.0% | |||||||||||||||||||||||
| ARPU | 0.5% | 0.5% | 0.9% | 0.9% | ||||||||||||||||||||||||
| Amarillo | ||||||||||||||||||||||||||||
| Count | -3.3% | -4.0% | -7.0% | -8.0% | 25.0% | |||||||||||||||||||||||
| ARPU | -0.9% | -0.9% | 0.0% | 0.0% | ||||||||||||||||||||||||
| Lubbock | ||||||||||||||||||||||||||||
| Count | -2.6% | -3.5% | -6.1% | -7.0% | ||||||||||||||||||||||||
| ARPU | -0.4% | -0.4% | 0.8% | 0.8% | ||||||||||||||||||||||||
| Midland | ||||||||||||||||||||||||||||
| Count | -1.9% | -3.0% | -7.3% | -8.0% | 25.0% | |||||||||||||||||||||||
| ARPU | 0.6% | 0.6% | 0.4% | 0.4% | ||||||||||||||||||||||||
| Odessa | ||||||||||||||||||||||||||||
| Count | -1.4% | -2.0% | -6.2% | -6.5% | 25.0% | |||||||||||||||||||||||
| ARPU | 0.4% | 0.4% | 1.3% | 1.3% | ||||||||||||||||||||||||
| Wichita Falls Bus | ||||||||||||||||||||||||||||
| Count | -4.1% | -5.0% | -4.8% | -4.8% | 25.0% | |||||||||||||||||||||||
| ARPU | -2.6% | -2.6% | 0.6% | 0.6% | ||||||||||||||||||||||||
| Minor Markets (Bus & Res) | ||||||||||||||||||||||||||||
| Count | -5.7% | -6.5% | ||||||||||||||||||||||||||
| ARPU | -1.2% | -1.2% | ||||||||||||||||||||||||||
| UNE-P | Average | Projected | ||||||||||||||||||||||||||
| Count | -5.6% | -6.5% | ||||||||||||||||||||||||||
| ARPU | 1.2% | 1.2% | ||||||||||||||||||||||||||
| Other | Average | Projected | ||||||||||||||||||||||||||
| Business Count | -2.4% | -3.0% | ||||||||||||||||||||||||||
| Business ARPU | 1.0% | 1.0% | ||||||||||||||||||||||||||
| Carrier growth (COGS Summary tab) | -0.7% | -1.0% | ||||||||||||||||||||||||||
| Equipment Revenue growth | 11.8% | 0.0% | ||||||||||||||||||||||||||
| Residential Count | -0.3% | -0.3% | ||||||||||||||||||||||||||
| Residential ARPU | 13.2% | 0.0% | ||||||||||||||||||||||||||
| Other Count | 0.0% | 0.0% | ||||||||||||||||||||||||||
| Other ARPU | 18.2% | 0.0% | ||||||||||||||||||||||||||
| Other Non-Fiber: Revenue Change | Q2 2011 | Q3 2011 | Q4 2011 | Q1 2012 | Q2 2012 | Q3 2012 | Q4 2012 | Q1 2013 | Q2 2013 | Average | Projected | |||||||||||||||||
| Carrier Access Billing change from last period | 12.4% | -10.1% | -6.5% | 1.2% | -3.9% | -6.5% | -0.3% | -9.0% | 13.6% | -1.0% | -1% | |||||||||||||||||
| Carrier Access Billing change from last year | -4.4% | -18.3% | -15.0% | -9.4% | -18.5% | -3.7% | -11.5% | |||||||||||||||||||||
| Rent Income change from last period | -5.9% | -1.4% | -5.4% | -12.8% | -1.9% | 6.2% | -9.6% | -7.4% | 1.4% | -4.1% | -4% | |||||||||||||||||
| Rent Income change from last year | -5.9% | -1.4% | -5.4% | -18.0% | -12.9% | -9.9% | -8.9% | |||||||||||||||||||||
| Xfone | -7.1% | -3.2% | -6.6% | -1.5% | 2.7% | -8.0% | -4.3% | -2.5% | -5.8% | -4.0% | -4% | |||||||||||||||||
| Non Fiber COGS | Q1 2011 | Q2 2011 | Q3 2011 | Q4 2011 | Q1 2012 | Q2 2012 | Q3 2012 | Q4 2012 | Q1 2013 | Q2 2013 | Average | Q Growth | Q3 2013 | Q4 2013 | Q1 2014 | Q2 2014 | Q4 2014 | Q1 2015 | Q2 2015 | Q3 2015 | Q4 2015 | Q1 2016 | Q2 2016 | Q3 2016 | Q4 2016 | 2017 | 2018 | |
| CLEC Variable COGS as a % of revenues | 47% | 50% | 51% | 51% | 49% | 50% | 50% | 52% | 51% | 52% | 0% | 51.8% | 51.8% | 51.8% | 51.8% | 51.8% | 51.8% | 51.8% | 51.8% | 51.8% | 51.8% | 51.8% | 51.8% | 51.8% | 51.8% | 51.8% | ||
| Resale Variable COGS as a % of revenues | 60% | |||||||||||||||||||||||||||
| Business | 25% | |||||||||||||||||||||||||||
Carrier Variable COGS as a % Carrier Revenue1 | 46% | 48% | 46% | 43% | 45% | 46% | 47% | 42% | 42% | 45% | 45% | 0.5% | 45.3% | 45.6% | 45.8% | 46.0% | 46.2% | 46.5% | 46.7% | 46.9% | 47.2% | 47.4% | 47.7% | 47.9% | 48.1% | 49.1% | 50.1% | |
| Equipment | 34% | 78% | 66% | 59% | 40% | 48% | 57% | 36% | 46% | 52% | 0.0% | 51.5% | 51.5% | 51.5% | 51.5% | 51.5% | 51.5% | 51.5% | 51.5% | 51.5% | 51.5% | 51.5% | 51.5% | 51.5% | 51.5% | 51.5% | ||
Residential2 | 60% | 66% | 55% | 56% | 61% | 58% | 60% | 51% | 58% | 0.0% | 58.3% | 58.3% | 58.3% | 58.3% | 58.3% | 58.3% | 58.3% | 58.3% | 58.3% | 58.3% | 58.3% | 58.3% | 58.3% | 58.3% | 58.3% | |||
| Carrier Access Billing | 10% | |||||||||||||||||||||||||||
| Rent | 10% | |||||||||||||||||||||||||||
| Fixed COGS | 881,573 | 826,328 | 829,302 | 817,283 | 856,756 | 750,078 | 703,359 | 702,374 | 677,258 | 640,647 | ||||||||||||||||||
| % change | -6.3% | 0.4% | -1.4% | 4.8% | -12.5% | -6.2% | -0.1% | -3.6% | -5.4% | -3.4% | -1.0% | |||||||||||||||||
| 1) Based on Private Line historical COGS analysis | ||||||||||||||||||||||||||||
| 2) Based on cable service margin. Since cable services are inlcuded in residential revenues in 2013 and forward | ||||||||||||||||||||||||||||
Fiber COGS1 | Q1 2011 | Q2 2011 | Q3 2011 | Q4 2011 | Q1 2012 | Q2 2012 | Q3 2012 | Q4 2012 | Q1 2013 | Q2 2013 | Average | Projection | ||||||||||||||||
| Variable Bus COGS, % of business revenue | 3.8% | 3.7% | 3.4% | 3.3% | 3.3% | 3.3% | 3.2% | 3.2% | 3.6% | 3.5% | 3.4% | 3.4% | ||||||||||||||||
| Variable Res COGS, % of residential revenue | 46.4% | 46.4% | 44.7% | 43.5% | 41.9% | 42.2% | 39.5% | 40.4% | 42.4% | 41.6% | 41.3% | 41.3% | ||||||||||||||||
| Total fiber fixed costs | $229,546 | $227,256 | $253,385 | $266,897 | $321,558 | $320,219 | $328,902 | $340,648 | $377,549 | $379,851 | ||||||||||||||||||
| -1.0% | 11.5% | 5.3% | 20.5% | -0.4% | 2.7% | 3.6% | 10.8% | 0.6% | 6.0% | |||||||||||||||||||
| Quarterly growth assumption | 1.00% | |||||||||||||||||||||||||||
| Annual growth assumption (2017-2018) | 4.00% | |||||||||||||||||||||||||||
| 1) Based on COGS analysis | ||||||||||||||||||||||||||||
| Quarterly | Annual (2017-2018) | |||||||||||||||||||||||||||
| G&A Quarterly Increase | 1.00% | 0.00% | ||||||||||||||||||||||||||
| Selling expense increase | 1.50% | 0.00% | ||||||||||||||||||||||||||
| Bad Debt as a % of revenue | 1.5% | |||||||||||||||||||||||||||
| Tax Rate | 35.0% | NTS currently has ~22 million of NOLs. Model assumes NTS starting to pay taxes in 2016. | ||||||||||||||||||||||||||
| Property Tax | 1.25% | As % of sales | ||||||||||||||||||||||||||
| Yes = 1, No =0 | ||||||||||||||||||||||||||||
| Going Private Cost savings | 1 | |||||||||||||||||||||||||||
| Planned Cost savings - % of plan | 75.0% | |||||||||||||||||||||||||||
| Fiber Assumptions | ||||||||||||||||||||||||||||
| 2017-2018 annual growth | ||||||||||||||||||||||||||||
| Wholesale Fiber Growth Rate (Quarterly) | 2% | 5% | ||||||||||||||||||||||||||
| New Projects | %prob | Yes = 1, No =0 | ||||||||||||||||||||||||||
| Midland | 20.0% | 1 | With Midland | |||||||||||||||||||||||||
| Odessa | 20.0% | 1 | With Odessa | |||||||||||||||||||||||||
| New RUS | 20.0% | 1 | With New RUS Project | |||||||||||||||||||||||||
| Business Take Rate | ||||||||||||||||||||||||||||
| % of mgmt case growth | LTM | Q2 2013 | Aug-13 | Q3 2013 | Q4 2013 | Q1 2014 | Q2 2014 | Q3 2014 | Q4 2014 | Q1 2015 | Q2 2015 | Q3 2015 | Q4 2015 | Q1 2016 | Q2 2016 | Q3 2016 | Q4 2016 | 2017 | 2018 | |||||||||
| Lubbock | 75% | 53% | 54% | 53% | 54% | 54% | 54% | 54% | 55% | 55% | 55% | 55% | 56% | 56% | 56% | 56% | 56% | 57% | 57% | 58% | ||||||||
| Wolfforth | 75% | 53% | 51% | 50% | 50% | 50% | 50% | 50% | 50% | 50% | 50% | 50% | 50% | 50% | 50% | 50% | 50% | 50% | 50% | 50% | ||||||||
| Levelland | 75% | 66% | 68% | 67% | 69% | 69% | 69% | 69% | 69% | 70% | 70% | 70% | 70% | 70% | 71% | 71% | 71% | 71% | 71% | 71% | ||||||||
| Smyer | 75% | 17% | 17% | 17% | 17% | 17% | 17% | 17% | 18% | 18% | 18% | 18% | 18% | 19% | 19% | 19% | 19% | 19% | 20% | 21% | ||||||||
| Littlefield | 75% | 41% | 41% | 42% | 43% | 44% | 45% | 54% | 63% | 63% | 63% | 63% | 63% | 63% | 63% | 63% | 63% | 63% | 63% | 63% | ||||||||
| Burkburnnet | 75% | 38% | 40% | 41% | 42% | 44% | 53% | 62% | 63% | 63% | 63% | 63% | 63% | 63% | 63% | 63% | 63% | 63% | 63% | 63% | ||||||||
| Brownfield | 75% | 56% | 61% | 61% | 61% | 61% | 61% | 64% | 68% | 68% | 68% | 68% | 68% | 68% | 68% | 68% | 68% | 68% | 68% | 68% | ||||||||
| Slaton | 75% | 24% | 27% | 29% | 29% | 31% | 32% | 34% | 35% | 37% | 38% | 40% | 41% | 43% | 44% | 46% | 47% | 49% | 52% | 56% | ||||||||
| Wilson | 75% | 17% | 17% | 17% | 17% | 17% | 17% | 17% | 17% | 17% | 17% | 17% | 17% | 17% | 17% | 17% | 17% | 17% | 17% | 17% | ||||||||
| Lamesa | 75% | 50% | 57% | 57% | 59% | 61% | 62% | 67% | 67% | 67% | 67% | 67% | 67% | 67% | 67% | 67% | 67% | 67% | 67% | 67% | ||||||||
| Plainview | 75% | 26% | 39% | 39% | 40% | 42% | 49% | 56% | 58% | 60% | 61% | 63% | 63% | 63% | 63% | 63% | 63% | 63% | 63% | 63% | ||||||||
| Wichita Falls | 75% | 16% | 23% | 27% | 31% | 38% | 45% | 46% | 46% | 46% | 47% | 47% | 47% | 48% | 48% | 49% | 49% | 49% | 51% | 52% | ||||||||
| Iowa Park | 75% | 9% | 12% | 14% | 15% | 17% | 20% | 31% | 42% | 44% | 45% | 47% | 48% | 50% | 51% | 53% | 54% | 56% | 57% | 57% | ||||||||
| Hammond | 75% | 1% | 3% | 10% | 10% | 12% | 14% | 15% | 16% | 17% | 18% | 19% | 21% | 22% | 23% | 24% | 25% | 26% | 29% | 32% | ||||||||
| Ponchatoula | 75% | 0% | 0% | 0% | 14% | 20% | 23% | 25% | 27% | 29% | 32% | 34% | 36% | 38% | 41% | 43% | 45% | 49% | 53% | |||||||||
| Abilene | 75% | 0% | 0% | 1% | 3% | 16% | 27% | 38% | 39% | 39% | 39% | 40% | 40% | 41% | 41% | 41% | 42% | 42% | 42% | 42% | ||||||||
| % of Levelland growth | ||||||||||||||||||||||||||||
| Hale Center | 75% | 0% | 0% | 2% | 5% | 9% | 13% | 19% | 27% | 32% | 35% | 37% | 42% | 43% | 44% | 46% | 48% | 48% | 49% | 51% | ||||||||
| Abernathy | 75% | 0% | 0% | 9% | 13% | 19% | 27% | 32% | 35% | 37% | 42% | 43% | 44% | 46% | 48% | 48% | 49% | 51% | ||||||||||
| New Deal | 75% | 0% | 0% | 9% | 13% | 19% | 27% | 32% | 35% | 37% | 42% | 43% | 44% | 46% | 48% | 48% | 49% | 51% | ||||||||||
| Amarillo (% of mgmt growth) | 75% | 0% | 0% | 2% | 11% | 20% | 24% | 29% | 30% | 30% | 31% | 32% | 33% | 33% | 34% | 35% | 35% | 35% | ||||||||||
| Tickfaw Village | 75% | 0% | 0% | 0% | 13% | 19% | 27% | 32% | 35% | 37% | 42% | 43% | 44% | 46% | 48% | 48% | 49% | 51% | ||||||||||
| Independence | 75% | 0% | 0% | 0% | 13% | 19% | 27% | 32% | 35% | 37% | 42% | 43% | 44% | 46% | 48% | 48% | 49% | 51% | ||||||||||
| Amite | 75% | 0% | 0% | 0% | 13% | 19% | 27% | 32% | 35% | 37% | 42% | 43% | 44% | 46% | 48% | 48% | 49% | 51% | ||||||||||
| Pine Grove | 75% | 0% | 0% | 0% | 13% | 19% | 27% | 32% | 35% | 37% | 42% | 43% | 44% | 46% | 48% | 48% | 49% | 51% | ||||||||||
| Montpelier | 75% | 0% | 0% | 0% | 13% | 19% | 27% | 32% | 35% | 37% | 42% | 43% | 44% | 46% | 48% | 48% | 49% | 51% | ||||||||||
| Franklington | 75% | 0% | 0% | 0% | 13% | 19% | 27% | 32% | 35% | 37% | 42% | 43% | 44% | 46% | 48% | 48% | 49% | 51% | ||||||||||
| Towers | 75% | 0% | 0% | 0% | 13% | 19% | 27% | 32% | 35% | 37% | 42% | 43% | 44% | 46% | 48% | 48% | 49% | 51% | ||||||||||
| Natalbany | 75% | 0% | 0% | 0% | 13% | 19% | 27% | 32% | 35% | 37% | 42% | 43% | 44% | 46% | 48% | 48% | 49% | 51% | ||||||||||
| Midland (same as Abilene) | 3% | 16% | 27% | 38% | 39% | 39% | 39% | 40% | 40% | 41% | 41% | |||||||||||||||||
| Odessa (same as Abilene) | 3% | 16% | 27% | 38% | 39% | 39% | 39% | 40% | 40% | 41% | ||||||||||||||||||
| Snyder | 75% | 9% | 13% | 19% | 27% | 32% | 35% | 37% | 42% | 43% | 44% | |||||||||||||||||
| Sweetwater | 75% | 9% | 13% | 19% | 27% | 32% | 35% | 37% | 42% | 43% | 44% | |||||||||||||||||
| Pampa | 75% | 9% | 13% | 19% | 27% | 32% | 35% | 37% | 42% | 43% | 44% | |||||||||||||||||
| Residential Take Rate | ||||||||||||||||||||||||||||
| % of mgmt case growth | LTM | Q2 2013 | Aug-13 | Q3 2013 | Q4 2013 | Q1 2014 | Q2 2014 | Q3 2014 | Q4 2014 | Q1 2015 | Q2 2015 | Q3 2015 | Q4 2015 | Q1 2016 | Q2 2016 | Q3 2016 | Q4 2016 | 2017 | 2018 | |||||||||
| Lubbock | 75% | 13% | 13% | 12% | 12% | 12% | 12% | 13% | 13% | 13% | 14% | 14% | 15% | 15% | 15% | 16% | 16% | 16% | 18% | 19% | ||||||||
| Wolfforth | 75% | 9% | 9% | 9% | 9% | 9% | 9% | 9% | 10% | 10% | 11% | 11% | 11% | 12% | 12% | 12% | 13% | 13% | 15% | 16% | ||||||||
| Levelland | 75% | 38% | 38% | 38% | 38% | 38% | 38% | 39% | 39% | 39% | 40% | 40% | 40% | 41% | 41% | 42% | 42% | 42% | 42% | 42% | ||||||||
| Smyer | 75% | 35% | 36% | 35% | 35% | 35% | 35% | 35% | 35% | 36% | 36% | 37% | 37% | 37% | 38% | 38% | 38% | 39% | 40% | 42% | ||||||||
| Littlefield | 75% | 40% | 41% | 41% | 41% | 41% | 41% | 41% | 42% | 42% | 42% | 43% | 43% | 43% | 43% | 43% | 43% | 43% | 43% | 43% | ||||||||
| Whitharral | 75% | 15% | 18% | 21% | 21% | 22% | 23% | 24% | 24% | 25% | 26% | 27% | 27% | 28% | 29% | 30% | 30% | 31% | 33% | 36% | ||||||||
| Burburnnet | 75% | 29% | 30% | 31% | 31% | 32% | 33% | 33% | 34% | 35% | 36% | 36% | 37% | 38% | 39% | 39% | 40% | 41% | 41% | 41% | ||||||||
| Brownfield | 75% | 36% | 38% | 38% | 39% | 39% | 40% | 40% | 40% | 41% | 41% | 42% | 42% | 42% | 42% | 42% | 42% | 42% | 42% | 42% | ||||||||
| Slaton | 75% | 14% | 17% | 17% | 18% | 19% | 20% | 20% | 21% | 22% | 23% | 23% | 24% | 25% | 26% | 26% | 27% | 28% | 30% | 32% | ||||||||
| Wilson | 75% | 21% | 23% | 25% | 25% | 26% | 27% | 28% | 28% | 29% | 30% | 31% | 31% | 32% | 33% | 34% | 34% | 35% | 37% | 40% | ||||||||
| Lamesa | 75% | 20% | 26% | 27% | 27% | 29% | 30% | 32% | 33% | 35% | 36% | 38% | 39% | 40% | 40% | 40% | 40% | 40% | 40% | 40% | ||||||||
| Meadow Bus/ | 75% | 21% | 26% | 26% | 27% | 28% | 29% | 29% | 30% | 31% | 32% | 32% | 33% | 34% | 35% | 35% | 36% | 37% | 38% | 40% | ||||||||
| Ropesville Bus/ | 75% | 18% | 22% | 22% | 23% | 24% | 25% | 25% | 26% | 27% | 28% | 28% | 29% | 30% | 31% | 31% | 32% | 33% | 35% | 37% | ||||||||
| Plainview | 75% | 6% | 12% | 13% | 14% | 16% | 19% | 20% | 22% | 23% | 25% | 26% | 28% | 29% | 31% | 32% | 34% | 35% | 37% | 37% | ||||||||
| Iowa Park | 75% | 6% | 10% | 12% | 13% | 15% | 17% | 19% | 20% | 22% | 23% | 25% | 26% | 28% | 29% | 31% | 32% | 34% | 36% | 36% | ||||||||
| % of Levelland growth | ||||||||||||||||||||||||||||
| Hammond | 75% | 0% | 0% | 1% | 1% | 1% | 7% | 15% | 21% | 25% | 28% | 29% | 28% | 28% | 29% | 29% | 29% | 28% | 29% | 29% | ||||||||
| Ponchatoula | 75% | 0% | 0% | 0% | 1% | 7% | 15% | 21% | 25% | 28% | 29% | 28% | 28% | 29% | 29% | 29% | 28% | 29% | 29% | |||||||||
| Hale Center | 75% | 0% | 0% | 6% | 10% | 15% | 21% | 25% | 28% | 29% | 28% | 28% | 29% | 29% | 29% | 28% | 29% | 29% | 29% | 29% | ||||||||
| Abernathy | 75% | 0% | 0% | 1% | 7% | 15% | 21% | 25% | 28% | 29% | 28% | 28% | 29% | 29% | 29% | 28% | 29% | 29% | ||||||||||
| New Deal | 75% | 0% | 0% | 1% | 7% | 15% | 21% | 25% | 28% | 29% | 28% | 28% | 29% | 29% | 29% | 28% | 29% | 29% | ||||||||||
| Tickfaw Village | 75% | 0% | 0% | 0% | 1% | 7% | 15% | 21% | 25% | 28% | 29% | 28% | 28% | 29% | 29% | 29% | 28% | 29% | ||||||||||
| Independence | 75% | 0% | 0% | 0% | 1% | 7% | 15% | 21% | 25% | 28% | 29% | 28% | 28% | 29% | 29% | 29% | 28% | 29% | ||||||||||
| Amite | 75% | 0% | 0% | 0% | 1% | 7% | 15% | 21% | 25% | 28% | 29% | 28% | 28% | 29% | 29% | 29% | 28% | 29% | ||||||||||
| Pine Grove | 75% | 0% | 0% | 0% | 1% | 7% | 15% | 21% | 25% | 28% | 29% | 28% | 28% | 29% | 29% | 29% | 28% | 29% | ||||||||||
| Montpelier | 75% | 0% | 0% | 0% | 1% | 7% | 15% | 21% | 25% | 28% | 29% | 28% | 28% | 29% | 29% | 29% | 28% | 29% | ||||||||||
| Franklington | 75% | 0% | 0% | 0% | 1% | 7% | 15% | 21% | 25% | 28% | 29% | 28% | 28% | 29% | 29% | 29% | 28% | 29% | ||||||||||
| Towers | 75% | 0% | 0% | 0% | 1% | 7% | 15% | 21% | 25% | 28% | 29% | 28% | 28% | 29% | 29% | 29% | 28% | 29% | ||||||||||
| Natalbany | 75% | 0% | 0% | 0% | 1% | 7% | 15% | 21% | 25% | 28% | 29% | 28% | 28% | 29% | 29% | 29% | 28% | 29% | ||||||||||
| Snyder | 75% | 1% | 7% | 15% | 21% | 25% | 28% | 29% | 28% | 28% | 29% | |||||||||||||||||
| Sweetwater | 75% | 1% | 7% | 15% | 21% | 25% | 28% | 29% | 28% | 28% | 29% | |||||||||||||||||
| Pampa | 75% | 1% | 7% | 15% | 21% | 25% | 28% | 29% | 28% | 28% | 29% | |||||||||||||||||
| Business ARPU (weighted average for Blitz impact) | ||||||||||||||||||||||||||||
| Business ARPU during Blitz | $200 | |||||||||||||||||||||||||||
| % of Mgmt case growth | LTM | Q2 2013 | Aug-13 | Q3 2013 | Q4 2013 | Q1 2014 | Q2 2014 | Q3 2014 | Q4 2014 | Q1 2015 | Q2 2015 | Q3 2015 | Q4 2015 | Q1 2016 | Q2 2016 | Q3 2016 | Q4 2016 | 2017 | 2018 | |||||||||
| Lubbock | 75% | $405 | $404 | $412 | $410 | $412 | $413 | $415 | $416 | $418 | $419 | $421 | $422 | $424 | $425 | $427 | $428 | $430 | $430 | $430 | ||||||||
| Wolfforth | 75% | $334 | $341 | $364 | $350 | $352 | $353 | $355 | $356 | $358 | $359 | $361 | $362 | $364 | $365 | $367 | $368 | $370 | $370 | $370 | ||||||||
| Misc Fiber - Other Mkts | 75% | $841 | $1,133 | $3,664 | $1,133 | $1,133 | $1,133 | $1,133 | $1,133 | $1,133 | $1,133 | $1,133 | $1,133 | $1,133 | $1,133 | $1,133 | $1,133 | $1,133 | $1,133 | $1,133 | ||||||||
| Levelland | 75% | $454 | $450 | $469 | $465 | $467 | $468 | $470 | $471 | $473 | $474 | $476 | $477 | $479 | $480 | $482 | $483 | $485 | $485 | $485 | ||||||||
| Smyer | 75% | $402 | $407 | $407 | $407 | $407 | $407 | $407 | $407 | $407 | $407 | $407 | $407 | $407 | $407 | $407 | $407 | $407 | $407 | $407 | ||||||||
| Littlefield | $291 | $300 | $287 | $300 | $301 | $303 | $295 | $282 | $283 | $285 | $286 | $288 | $289 | $291 | $292 | $294 | $295 | $295 | $295 | |||||||||
| Burkburnnet | $219 | $201 | $251 | $245 | $256 | $261 | $260 | $268 | $275 | $283 | $290 | $298 | $305 | $313 | $317 | $317 | $317 | $317 | $317 | |||||||||
| Brownfield | $216 | $195 | $211 | $210 | $221 | $233 | $243 | $251 | $262 | $273 | $281 | $288 | $296 | $303 | $309 | $309 | $309 | $309 | $309 | |||||||||
| Slaton | 75% | $214 | $207 | $206 | $210 | $221 | $233 | $244 | $255 | $266 | $278 | $285 | $293 | $300 | $308 | $308 | $308 | $308 | $308 | $308 | ||||||||
| Wilson | 75% | $140 | $105 | $116 | $115 | $115 | $115 | $115 | $115 | $115 | $115 | $115 | $115 | $115 | $115 | $115 | $115 | $115 | $115 | $115 | ||||||||
| Lamesa | $186 | $186 | $188 | $205 | $216 | $228 | $237 | $248 | $260 | $271 | $282 | $290 | $297 | $305 | $307 | $307 | $307 | $307 | $307 | |||||||||
| Plainview | $441 | $207 | $253 | $260 | $271 | $276 | $276 | $283 | $291 | $298 | $306 | $313 | $321 | $321 | $321 | $321 | $321 | $321 | $321 | |||||||||
| Wichita Falls | $235 | $215 | $206 | $213 | $217 | $221 | $232 | $243 | $254 | $266 | $273 | $281 | $288 | $292 | $292 | $292 | $292 | $292 | $292 | |||||||||
| Iowa Park | $237 | $192 | $157 | $160 | $171 | $183 | $195 | $203 | $214 | $225 | $236 | $248 | $259 | $266 | $274 | $281 | $289 | $289 | $289 | |||||||||
| Hammond | $44 | $177 | $200 | $200 | $208 | $215 | $223 | $230 | $238 | $245 | $253 | $260 | $268 | $275 | $283 | $290 | $298 | $298 | $298 | |||||||||
| Ponchatoula | $0 | $0 | $200 | $200 | $200 | $208 | $215 | $223 | $230 | $238 | $245 | $253 | $260 | $268 | $275 | $283 | $283 | $283 | ||||||||||
| Abilene | $0 | $0 | $200 | $202 | $202 | $202 | $210 | $217 | $225 | $232 | $240 | $247 | $255 | $262 | $270 | $277 | $277 | $277 | ||||||||||
| Hale Center | 75% | $0 | $0 | $200 | $208 | $215 | $223 | $230 | $238 | $245 | $253 | $260 | $268 | $275 | $283 | $290 | $298 | $298 | $298 | |||||||||
| Abernathy | 75% | $0 | $0 | $200 | $208 | $215 | $223 | $230 | $238 | $245 | $253 | $260 | $268 | $275 | $283 | $290 | $290 | $290 | ||||||||||
| New Deal | 75% | $0 | $0 | $200 | $208 | $215 | $223 | $230 | $238 | $245 | $253 | $260 | $268 | $275 | $283 | $290 | $290 | $290 | ||||||||||
| Amarillo | $0 | $0 | $200 | $202 | $201 | $209 | $216 | $224 | $231 | $239 | $246 | $254 | $261 | $269 | $276 | $276 | $276 | |||||||||||
| Tickfaw Village | 75% | $0 | $0 | $200 | $208 | $215 | $223 | $230 | $238 | $245 | $253 | $260 | $268 | $275 | $283 | $290 | $290 | $290 | ||||||||||
| Independence | 75% | $0 | $0 | $200 | $208 | $215 | $223 | $230 | $238 | $245 | $253 | $260 | $268 | $275 | $283 | $290 | $290 | $290 | ||||||||||
| Amite | 75% | $0 | $0 | $200 | $208 | $215 | $223 | $230 | $238 | $245 | $253 | $260 | $268 | $275 | $283 | $290 | $290 | $290 | ||||||||||
| Pine Grove | 75% | $0 | $0 | $200 | $208 | $215 | $223 | $230 | $238 | $245 | $253 | $260 | $268 | $275 | $283 | $290 | $290 | $290 | ||||||||||
| Montpelier | 75% | $0 | $0 | $200 | $208 | $215 | $223 | $230 | $238 | $245 | $253 | $260 | $268 | $275 | $283 | $290 | $290 | $290 | ||||||||||
| Franklington | 75% | $0 | $0 | $200 | $208 | $215 | $223 | $230 | $238 | $245 | $253 | $260 | $268 | $275 | $283 | $290 | $290 | $290 | ||||||||||
| Towers | 75% | $0 | $0 | $200 | $208 | $215 | $223 | $230 | $238 | $245 | $253 | $260 | $268 | $275 | $283 | $290 | $290 | $290 | ||||||||||
| Natalbany | 75% | $0 | $0 | $200 | $208 | $215 | $223 | $230 | $238 | $245 | $253 | $260 | $268 | $275 | $283 | $290 | $290 | $290 | ||||||||||
| Midland (same as Abilene) | $200 | $202 | $202 | $202 | $210 | $217 | $225 | $232 | $240 | $247 | $255 | |||||||||||||||||
| Odessa (same as Abilene) | $200 | $202 | $202 | $202 | $210 | $217 | $225 | $232 | $240 | $247 | ||||||||||||||||||
| Snyder (same as Burkburnnet) | $201 | $245 | $256 | $261 | $260 | $268 | $275 | $283 | $290 | $298 | ||||||||||||||||||
| Sweetwater (same as Burkburnnet) | $201 | $245 | $256 | $261 | $260 | $268 | $275 | $283 | $290 | $298 | ||||||||||||||||||
| Pampa (same as Burkburnnet) | $201 | $245 | $256 | $261 | $260 | $268 | $275 | $283 | $290 | $298 | ||||||||||||||||||
| Residential ARPU | ||||||||||||||||||||||||||||
| % of Mgmt case growth | LTM | Q2 2013 | Aug-13 | Q3 2013 | Q4 2013 | Q1 2014 | Q2 2014 | Q3 2014 | Q4 2014 | Q1 2015 | Q2 2015 | Q3 2015 | Q4 2015 | Q1 2016 | Q2 2016 | Q3 2016 | Q4 2016 | 2017 | 2018 | |||||||||
| Lubbock | 75% | $87 | $85 | $89 | $88 | $90 | $91 | $93 | $94 | $96 | $97 | $99 | $100 | $102 | $103 | $105 | $105 | $105 | $105 | $105 | ||||||||
| Wolfforth | 75% | $92 | $92 | $92 | $94 | $96 | $97 | $99 | $100 | $102 | $103 | $105 | $106 | $106 | $106 | $106 | $106 | $106 | $106 | $106 | ||||||||
| Levelland | 75% | $103 | $105 | $104 | $105 | $106 | $106 | $107 | $108 | $109 | $109 | $109 | $109 | $109 | $109 | $109 | $109 | $109 | $109 | $109 | ||||||||
| Smyer | 75% | $105 | $109 | $95 | $110 | $110 | $110 | $110 | $110 | $110 | $110 | $110 | $110 | $110 | $110 | $110 | $110 | $110 | $110 | $110 | ||||||||
| Littlefield | 75% | $111 | $110 | $116 | $110 | $110 | $110 | $110 | $110 | $110 | $110 | $110 | $110 | $110 | $110 | $110 | $110 | $110 | $110 | $110 | ||||||||
| Whitharral | 75% | $112 | $93 | $104 | $104 | $105 | $106 | $106 | $107 | $108 | $109 | $109 | $109 | $109 | $109 | $109 | $109 | $109 | $109 | $109 | ||||||||
| Burkburnnet | 75% | $107 | $106 | $106 | $108 | $110 | $110 | $110 | $110 | $110 | $110 | $110 | $110 | $110 | $110 | $110 | $110 | $110 | $110 | $110 | ||||||||
| Brownfield | 75% | $104 | $100 | $103 | $102 | $104 | $105 | $107 | $108 | $108 | $108 | $108 | $108 | $108 | $108 | $108 | $108 | $108 | $108 | $108 | ||||||||
| Slaton | 75% | $108 | $101 | $106 | $106 | $108 | $109 | $109 | $109 | $109 | $109 | $109 | $109 | $109 | $109 | $109 | $109 | $109 | $109 | $109 | ||||||||
| Wilson | 75% | $116 | $112 | $106 | $112 | $112 | $112 | $112 | $112 | $112 | $112 | $112 | $112 | $112 | $112 | $112 | $112 | $112 | $112 | $112 | ||||||||
| Lamesa | 75% | $110 | $104 | $101 | $102 | $104 | $105 | $107 | $108 | $108 | $108 | $108 | $108 | $108 | $108 | $108 | $108 | $108 | $108 | $108 | ||||||||
| Meadow | 75% | $121 | $124 | $123 | $124 | $124 | $124 | $124 | $124 | $124 | $124 | $124 | $124 | $124 | $124 | $124 | $124 | $124 | $124 | $124 | ||||||||
| Ropesville | 75% | $106 | $106 | $114 | $106 | $107 | $109 | $109 | $109 | $109 | $109 | $109 | $109 | $109 | $109 | $109 | $109 | $109 | $109 | $109 | ||||||||
| Plainview | 75% | $113 | $101 | $101 | $102 | $104 | $105 | $107 | $108 | $108 | $108 | $108 | $108 | $108 | $108 | $108 | $108 | $108 | $108 | $108 | ||||||||
| Iowa Park | 75% | $104 | $98 | $107 | $104 | $106 | $107 | $109 | $109 | $109 | $109 | $109 | $109 | $109 | $109 | $109 | $109 | $109 | $109 | $109 | ||||||||
| Hammond | 75% | $0 | $0 | $130 | $105 | $106 | $107 | $109 | $109 | $109 | $109 | $109 | $109 | $109 | $109 | $109 | $109 | $109 | $109 | $109 | ||||||||
| Ponchatoula | 75% | $0 | $0 | $105 | $106 | $107 | $109 | $109 | $109 | $109 | $109 | $109 | $109 | $109 | $109 | $109 | $109 | $109 | $109 | |||||||||
| Hale Center | 75% | $0 | $0 | $95 | $105 | $106 | $107 | $109 | $109 | $109 | $109 | $109 | $109 | $109 | $109 | $109 | $109 | $109 | $109 | $109 | ||||||||
| Abernathy | 75% | $0 | $0 | $105 | $106 | $107 | $109 | $109 | $109 | $109 | $109 | $109 | $109 | $109 | $109 | $109 | $109 | $109 | ||||||||||
| New Deal | 75% | $0 | $0 | $105 | $106 | $107 | $109 | $109 | $109 | $109 | $109 | $109 | $109 | $109 | $109 | $109 | $109 | $109 | ||||||||||
| Tickfaw Village | 75% | $0 | $0 | $105 | $106 | $107 | $109 | $109 | $109 | $109 | $109 | $109 | $109 | $109 | $109 | $109 | $109 | $109 | ||||||||||
| Independence | 75% | $0 | $0 | $105 | $106 | $107 | $109 | $109 | $109 | $109 | $109 | $109 | $109 | $109 | $109 | $109 | $109 | $109 | ||||||||||
| Amite | 75% | $0 | $0 | $105 | $106 | $107 | $109 | $109 | $109 | $109 | $109 | $109 | $109 | $109 | $109 | $109 | $109 | $109 | ||||||||||
| Pine Grove | 75% | $0 | $0 | $105 | $106 | $107 | $109 | $109 | $109 | $109 | $109 | $109 | $109 | $109 | $109 | $109 | $109 | $109 | ||||||||||
| Montpelier | 75% | $0 | $0 | $105 | $106 | $107 | $109 | $109 | $109 | $109 | $109 | $109 | $109 | $109 | $109 | $109 | $109 | $109 | ||||||||||
| Franklington | 75% | $0 | $0 | $105 | $106 | $107 | $109 | $109 | $109 | $109 | $109 | $109 | $109 | $109 | $109 | $109 | $109 | $109 | ||||||||||
| Towers | 75% | $0 | $0 | $105 | $106 | $107 | $109 | $109 | $109 | $109 | $109 | $109 | $109 | $109 | $109 | $109 | $109 | $109 | ||||||||||
| Natalbany | 75% | $0 | $0 | $105 | $106 | $107 | $109 | $109 | $109 | $109 | $109 | $109 | $109 | $109 | $109 | $109 | $109 | $109 | ||||||||||
| Snyder (same as Burkburnnet) | $105 | $106 | $108 | $110 | $110 | $110 | $110 | $110 | $110 | $110 | ||||||||||||||||||
| Sweetwater (same as Burkburnnet) | $105 | $106 | $108 | $110 | $110 | $110 | $110 | $110 | $110 | $110 | ||||||||||||||||||
| Pampa (same as Burkburnnet) | $105 | $106 | $108 | $110 | $110 | $110 | $110 | $110 | $110 | $110 | ||||||||||||||||||
| ARPU Assumptions for Blitz Communities | ||||||||||||||||||||||||||||
| % of Mgmt | ||||||||||||||||||||||||||||
| Business ARPU without Blitz | Case growth | LTM | Q2 2013 | Aug-13 | Q3 2013 | Q4 2013 | Q1 2014 | Q2 2014 | Q3 2014 | Q4 2014 | Q1 2015 | Q2 2015 | Q3 2015 | Q4 2015 | Q1 2016 | Q2 2016 | Q3 2016 | Q4 2016 | 2017 | 2018 | ||||||||
| Littlefield | 75% | $291 | $300 | $287 | $300 | $301 | $303 | $304 | $306 | $307 | $309 | $310 | $312 | $313 | $315 | $316 | $318 | $319 | $319 | $319 | Lower growth estimated for 2017-2018 | |||||||
| Burkburnnet | 75% | $219 | $201 | $251 | $245 | $256 | $268 | $279 | $286 | $294 | $301 | $309 | $316 | $324 | $331 | $336 | $336 | $336 | $336 | $336 | ||||||||
| Brownfield | 75% | $216 | $195 | $211 | $210 | $221 | $233 | $244 | $255 | $266 | $278 | $285 | $293 | $300 | $308 | $313 | $313 | $313 | $313 | $313 | Using quarterly assumptions for annual growth | |||||||
| Lamesa | 75% | $186 | $186 | $188 | $205 | $216 | $228 | $239 | $250 | $261 | $273 | $284 | $291 | $299 | $306 | $309 | $309 | $309 | $309 | $309 | ||||||||
| Plainview | 75% | $441 | $207 | $253 | $260 | $271 | $283 | $294 | $301 | $309 | $316 | $324 | $331 | $339 | $339 | $339 | $339 | $339 | $339 | $339 | ||||||||
| Wichita Falls | 75% | $235 | $215 | $206 | $215 | $226 | $237 | $248 | $260 | $271 | $282 | $290 | $297 | $305 | $308 | $308 | $308 | $308 | $308 | $308 | ||||||||
| Iowa Park | 75% | $237 | $192 | $157 | $160 | $171 | $183 | $194 | $205 | $216 | $228 | $239 | $250 | $261 | $269 | $276 | $284 | $291 | $291 | $291 | ||||||||
| Hammond | 75% | $44 | $177 | $200 | $200 | $208 | $215 | $223 | $230 | $238 | $245 | $253 | $260 | $268 | $275 | $283 | $290 | $298 | $298 | $298 | ||||||||
| Ponchatoula | 75% | $0 | $0 | $200 | $208 | $215 | $223 | $230 | $238 | $245 | $253 | $260 | $268 | $275 | $283 | $290 | $298 | $298 | $298 | |||||||||
| Abilene | 75% | $0 | $0 | $200 | $208 | $215 | $223 | $230 | $238 | $245 | $253 | $260 | $268 | $275 | $283 | $290 | $298 | $298 | $298 | |||||||||
| Amarillo | 75% | $0 | $0 | $200 | $208 | $215 | $223 | $230 | $238 | $245 | $253 | $260 | $268 | $275 | $283 | $290 | $290 | $290 | ||||||||||
| Blitz Schedule Per Market | 1= Blitz | |||||||||||||||||||||||||||
| Littlefield | 0= No Blitz | 0 | 0 | 0 | 1 | 1 | 0 | 0 | 0 | 0 | 0 | 0 | 0 | 0 | 0 | 0 | 0 | |||||||||||
| Burkburnnet | 0 | 0 | 1 | 1 | 0 | 0 | 0 | 0 | 0 | 0 | 0 | 0 | 0 | 0 | 0 | 0 | ||||||||||||
| Brownfield | 0 | 0 | 0 | 1 | 1 | 0 | 0 | 0 | 0 | 0 | 0 | 0 | 0 | 0 | 0 | 0 | ||||||||||||
| Lamesa | 0 | 0 | 0 | 1 | 0 | 0 | 0 | 0 | 0 | 0 | 0 | 0 | 0 | 0 | 0 | 0 | ||||||||||||
| Plainview | 0 | 0 | 1 | 1 | 0 | 0 | 0 | 0 | 0 | 0 | 0 | 0 | 0 | 0 | 0 | 0 | ||||||||||||
| Wichita Falls | 1 | 1 | 1 | 0 | 0 | 0 | 0 | 0 | 0 | 0 | 0 | 0 | 0 | 0 | 0 | 0 | ||||||||||||
| Iowa Park | 0 | 0 | 0 | 1 | 1 | 0 | 0 | 0 | 0 | 0 | 0 | 0 | 0 | 0 | 0 | 0 | ||||||||||||
| Hammond | 1 | 0 | 0 | 0 | 0 | 0 | 0 | 0 | 0 | 0 | 0 | 0 | 0 | 0 | 0 | 0 | ||||||||||||
| Ponchatoula | 0 | 1 | 1 | 0 | 0 | 0 | 0 | 0 | 0 | 0 | 0 | 0 | 0 | 0 | 0 | 0 | ||||||||||||
| Abilene | 0 | 1 | 1 | 1 | 0 | 0 | 0 | 0 | 0 | 0 | 0 | 0 | 0 | 0 | 0 | 0 | ||||||||||||
| Amarillo | 0 | 0 | 1 | 1 | 0 | 0 | 0 | 0 | 0 | 0 | 0 | 0 | 0 | 0 | 0 | 0 | ||||||||||||
| Q3 2013 | Q4 2013 | Q1 2014 | Q2 2014 | Q3 2014 | Q4 2014 | Q1 2015 | Q2 2015 | Q3 2015 | Q4 2015 | Q1 2016 | Q2 2016 | Q3 2016 | Q4 2016 | 2017 | 2018 | |||||||||||||
| Existing Count Prior to Blitz | ||||||||||||||||||||||||||||
| Littlefield | 71 | 74 | 76 | 78 | 78 | 78 | 0 | 0 | 0 | 0 | 0 | 0 | 0 | 0 | 0 | 0 | 0 | |||||||||||
| Burkburnnet | 104 | 110 | 116 | 116 | 116 | 0 | 0 | 0 | 0 | 0 | 0 | 0 | 0 | 0 | 0 | 0 | 0 | |||||||||||
| Brownfield | 108 | 108 | 108 | 108 | 108 | 108 | 0 | 0 | 0 | 0 | 0 | 0 | 0 | 0 | 0 | 0 | 0 | |||||||||||
| Lamesa | 126 | 132 | 135 | 138 | 138 | 0 | 0 | 0 | 0 | 0 | 0 | 0 | 0 | 0 | 0 | 0 | 0 | |||||||||||
| Plainview | 212 | 219 | 231 | 231 | 231 | 0 | 0 | 0 | 0 | 0 | 0 | 0 | 0 | 0 | 0 | 0 | 0 | |||||||||||
| Wichita Falls | 241 | 241 | 241 | 241 | 0 | 0 | 0 | 0 | 0 | 0 | 0 | 0 | 0 | 0 | 0 | 0 | 0 | |||||||||||
| Iowa Park | 21 | 27 | 31 | 35 | 35 | 35 | 0 | 0 | 0 | 0 | 0 | 0 | 0 | 0 | 0 | 0 | 0 | |||||||||||
| Hammond | 66 | 66 | 0 | 0 | 0 | 0 | 0 | 0 | 0 | 0 | 0 | 0 | 0 | 0 | 0 | 0 | 0 | |||||||||||
| Ponchatoula | 0 | 0 | 0 | 0 | 0 | 0 | 0 | 0 | 0 | 0 | 0 | 0 | 0 | 0 | 0 | 0 | 0 | |||||||||||
| Abilene | 0 | 30 | 30 | 30 | 30 | 0 | 0 | 0 | 0 | 0 | 0 | 0 | 0 | 0 | 0 | 0 | 0 | |||||||||||
| Amarillo | 0 | 0 | 30 | 30 | 30 | 0 | 0 | 0 | 0 | 0 | 0 | 0 | 0 | 0 | 0 | 0 | 0 | |||||||||||
| New Count from Blitz | ||||||||||||||||||||||||||||
| Littlefield | 0 | 0 | 0 | 16 | 16 | 0 | 0 | 0 | 0 | 0 | 0 | 0 | 0 | 0 | 0 | 0 | ||||||||||||
| Burkburnnet | 0 | 0 | 24 | 24 | 0 | 0 | 0 | 0 | 0 | 0 | 0 | 0 | 0 | 0 | 0 | 0 | ||||||||||||
| Brownfield | 0 | 0 | 0 | 5 | 7 | 0 | 0 | 0 | 0 | 0 | 0 | 0 | 0 | 0 | 0 | 0 | ||||||||||||
| Lamesa | 0 | 0 | 0 | 12 | 0 | 0 | 0 | 0 | 0 | 0 | 0 | 0 | 0 | 0 | 0 | 0 | ||||||||||||
| Plainview | 0 | 0 | 37 | 37 | 0 | 0 | 0 | 0 | 0 | 0 | 0 | 0 | 0 | 0 | 0 | 0 | ||||||||||||
| Wichita Falls | 80 | 75 | 79 | 0 | 0 | 0 | 0 | 0 | 0 | 0 | 0 | 0 | 0 | 0 | 0 | 0 | ||||||||||||
| Iowa Park | 0 | 0 | 0 | 20 | 20 | 0 | 0 | 0 | 0 | 0 | 0 | 0 | 0 | 0 | 0 | 0 | ||||||||||||
| Hammond | 148 | 0 | 0 | 0 | 0 | 0 | 0 | 0 | 0 | 0 | 0 | 0 | 0 | 0 | 0 | 0 | ||||||||||||
| Ponchatoula | 0 | 76 | 38 | 0 | 0 | 0 | 0 | 0 | 0 | 0 | 0 | 0 | 0 | 0 | 0 | 0 | ||||||||||||
| Abilene | 0 | 128 | 113 | 113 | 0 | 0 | 0 | 0 | 0 | 0 | 0 | 0 | 0 | 0 | 0 | 0 | ||||||||||||
| Amarillo | 0 | 0 | 188 | 180 | 0 | 0 | 0 | 0 | 0 | 0 | 0 | 0 | 0 | 0 | 0 | 0 | ||||||||||||
| Cumulative Avg New Count from Blitz | Q3 2015 | Q4 2015 | Q1 2016 | Q2 2016 | Q3 2016 | Q4 2016 | 2017 | 2018 | ||||||||||||||||||||
| Littlefield | 0 | 0 | 8 | 23 | 31 | 31 | 31 | 31 | 31 | 31 | 31 | 31 | 31 | 31 | 31 | |||||||||||||
| Burkburnnet | 0 | 12 | 36 | 47 | 47 | 47 | 47 | 47 | 47 | 47 | 47 | 47 | 47 | 47 | 47 | |||||||||||||
| Brownfield | 0 | 0 | 3 | 9 | 12 | 12 | 12 | 12 | 12 | 12 | 12 | 12 | 12 | 12 | 12 | |||||||||||||
| Lamesa | 0 | 0 | 6 | 12 | 12 | 12 | 12 | 12 | 12 | 12 | 12 | 12 | 12 | 12 | 12 | |||||||||||||
| Plainview | 0 | 18 | 55 | 74 | 74 | 74 | 74 | 74 | 74 | 74 | 74 | 74 | 74 | 74 | 74 | |||||||||||||
| Wichita Falls | 40 | 117 | 194 | 234 | 234 | 234 | 234 | 234 | 234 | 234 | 234 | 234 | 234 | 234 | 234 | 234 | ||||||||||||
| Iowa Park | 0 | 0 | 10 | 30 | 41 | 41 | 41 | 41 | 41 | 41 | 41 | 41 | 41 | 41 | 41 | |||||||||||||
| Hammond | 74 | 148 | 148 | 148 | 148 | 148 | 148 | 148 | 148 | 148 | 148 | 148 | 148 | 148 | 148 | 148 | ||||||||||||
| Ponchatoula | 38 | 95 | 114 | 114 | 114 | 114 | 114 | 114 | 114 | 114 | 114 | 114 | 114 | 114 | 114 | |||||||||||||
| Abilene | 64 | 184 | 296 | 353 | 353 | 353 | 353 | 353 | 353 | 353 | 353 | 353 | 353 | 353 | 353 | |||||||||||||
| Amarillo | 0 | 94 | 278 | 368 | 368 | 368 | 368 | 368 | 368 | 368 | 368 | 368 | 368 | 368 | 368 | |||||||||||||
3
| Assumptions | ||||||||||||||||||||||||||||
| Model Case | Case 2 | |||||||||||||||||||||||||||
| Case 2 | 1 | |||||||||||||||||||||||||||
| Case 1 | 0 | |||||||||||||||||||||||||||
| Quarterly Growth Assumptions Organic | Smart Build | |||||||||||||||||||||||||||
| UNE-L Revenue | Business | Residential | Cannibalization | |||||||||||||||||||||||||
| Average | Projected | Average | Projected | |||||||||||||||||||||||||
| Abilene | ||||||||||||||||||||||||||||
| Count | -2.5% | -3.5% | -7.0% | -8.0% | 25.0% | |||||||||||||||||||||||
| ARPU | 0.5% | 0.5% | 0.9% | 0.9% | ||||||||||||||||||||||||
| Amarillo | ||||||||||||||||||||||||||||
| Count | -3.3% | -4.0% | -7.0% | -8.0% | 25.0% | |||||||||||||||||||||||
| ARPU | -0.9% | -0.9% | 0.0% | 0.0% | ||||||||||||||||||||||||
| Lubbock | ||||||||||||||||||||||||||||
| Count | -2.6% | -3.5% | -6.1% | -7.0% | ||||||||||||||||||||||||
| ARPU | -0.4% | -0.4% | 0.8% | 0.8% | ||||||||||||||||||||||||
| Midland | ||||||||||||||||||||||||||||
| Count | -1.9% | -3.0% | -7.3% | -8.0% | 25.0% | |||||||||||||||||||||||
| ARPU | 0.6% | 0.6% | 0.4% | 0.4% | ||||||||||||||||||||||||
| Odessa | ||||||||||||||||||||||||||||
| Count | -1.4% | -2.0% | -6.2% | -6.5% | 25.0% | |||||||||||||||||||||||
| ARPU | 0.4% | 0.4% | 1.3% | 1.3% | ||||||||||||||||||||||||
| Wichita Falls Bus | ||||||||||||||||||||||||||||
| Count | -4.1% | -5.0% | -4.8% | -4.8% | 25.0% | |||||||||||||||||||||||
| ARPU | -2.6% | -2.6% | 0.6% | 0.6% | ||||||||||||||||||||||||
| Minor Markets (Bus & Res) | ||||||||||||||||||||||||||||
| Count | -5.7% | -6.5% | ||||||||||||||||||||||||||
| ARPU | -1.2% | -1.2% | ||||||||||||||||||||||||||
| UNE-P | Average | Projected | ||||||||||||||||||||||||||
| Count | -5.6% | -6.5% | ||||||||||||||||||||||||||
| ARPU | 1.2% | 1.2% | ||||||||||||||||||||||||||
| Other | Average | Projected | ||||||||||||||||||||||||||
| Business Count | -2.4% | -3.0% | ||||||||||||||||||||||||||
| Business ARPU | 1.0% | 1.0% | ||||||||||||||||||||||||||
| Carrier growth (COGS Summary tab) | -0.7% | -1.0% | ||||||||||||||||||||||||||
| Equipment Revenue growth | 11.8% | 0.0% | ||||||||||||||||||||||||||
| Residential Count | -0.3% | -0.3% | ||||||||||||||||||||||||||
| Residential ARPU | 13.2% | 0.0% | ||||||||||||||||||||||||||
| Other Count | 0.0% | 0.0% | ||||||||||||||||||||||||||
| Other ARPU | 18.2% | 0.0% | ||||||||||||||||||||||||||
| Other Non-Fiber: Revenue Change | Q2 2011 | Q3 2011 | Q4 2011 | Q1 2012 | Q2 2012 | Q3 2012 | Q4 2012 | Q1 2013 | Q2 2013 | Average | Projected | |||||||||||||||||
| Carrier Access Billing change from last period | 12.4% | -10.1% | -6.5% | 1.2% | -3.9% | -6.5% | -0.3% | -9.0% | 13.6% | -1.0% | -1.0% | |||||||||||||||||
| Carrier Access Billing change from last year | -4.4% | -18.3% | -15.0% | -9.4% | -18.5% | -3.7% | -11.5% | |||||||||||||||||||||
| Rent Income change from last period | -5.9% | -1.4% | -5.4% | -12.8% | -1.9% | 6.2% | -9.6% | -7.4% | 1.4% | -4.1% | -4.0% | |||||||||||||||||
| Rent Income change from last year | -5.9% | -1.4% | -5.4% | -18.0% | -12.9% | -9.9% | -8.9% | |||||||||||||||||||||
| Xfone | -7.1% | -3.2% | -6.6% | -1.5% | 2.7% | -8.0% | -4.3% | -2.5% | -5.8% | -4.0% | -4.0% | |||||||||||||||||
| Non Fiber COGS | Q1 2011 | Q2 2011 | Q3 2011 | Q4 2011 | Q1 2012 | Q2 2012 | Q3 2012 | Q4 2012 | Q1 2013 | Q2 2013 | Average | Q Growth | Q3 2013 | Q4 2013 | Q1 2014 | Q2 2014 | Q4 2014 | Q1 2015 | Q2 2015 | Q3 2015 | Q4 2015 | Q1 2016 | Q2 2016 | Q3 2016 | Q4 2016 | 2017 | 2018 | |
| CLEC Variable COGS as a % of revenues | 47% | 50% | 51% | 51% | 49% | 50% | 50% | 52% | 51% | 52% | 0.0% | 51.8% | 51.8% | 51.8% | 51.8% | 51.8% | 51.8% | 51.8% | 51.8% | 51.8% | 51.8% | 51.8% | 51.8% | 51.8% | 51.8% | 51.8% | ||
| Resale Variable COGS as a % of revenues | 60.0% | |||||||||||||||||||||||||||
| Business | 25.0% | |||||||||||||||||||||||||||
Carrier Variable COGS as a % Carrier Revenue1 | 46% | 48% | 46% | 43% | 45% | 46% | 47% | 42% | 42% | 45% | 45.1% | 0.5% | 45.3% | 45.6% | 45.8% | 46.0% | 46.2% | 46.5% | 46.7% | 46.9% | 47.2% | 47.4% | 47.7% | 47.9% | 48.1% | 49.1% | 50.1% | |
| Equipment | 34% | 78% | 66% | 59% | 40% | 48% | 57% | 36% | 46% | 51.5% | 0.0% | 51.5% | 51.5% | 51.5% | 51.5% | 51.5% | 51.5% | 51.5% | 51.5% | 51.5% | 51.5% | 51.5% | 51.5% | 51.5% | 51.5% | 51.5% | ||
Residential2 | 60.0% | 66% | 55% | 56% | 61% | 58% | 60% | 51% | 58.3% | 0.0% | 58.3% | 58.3% | 58.3% | 58.3% | 58.3% | 58.3% | 58.3% | 58.3% | 58.3% | 58.3% | 58.3% | 58.3% | 58.3% | 58.3% | 58.3% | |||
| Carrier Access Billing | 10.0% | |||||||||||||||||||||||||||
| Rent | 10.0% | |||||||||||||||||||||||||||
| Fixed COGS | 881,573 | 826,328 | 829,302 | 817,283 | 856,756 | 750,078 | 703,359 | 702,374 | 677,258 | 640,647 | ||||||||||||||||||
| % change | -6.3% | 0.4% | -1.4% | 4.8% | -12.5% | -6.2% | -0.1% | -3.6% | -5.4% | -3.4% | -1.0% | |||||||||||||||||
| �� | ||||||||||||||||||||||||||||
| 1) Based on Private Line historical COGS analysis | ||||||||||||||||||||||||||||
| 2) Based on cable service margin. Since cable services are inlcuded in residential revenues in 2013 and forward | ||||||||||||||||||||||||||||
Fiber COGS1 | Q1 2011 | Q2 2011 | Q3 2011 | Q4 2011 | Q1 2012 | Q2 2012 | Q3 2012 | Q4 2012 | Q1 2013 | Q2 2013 | Average | Projection | ||||||||||||||||
| Variable Bus COGS, % of business revenue | 3.8% | 3.7% | 3.4% | 3.3% | 3.3% | 3.3% | 3.2% | 3.2% | 3.6% | 3.5% | 3.4% | 3.4% | ||||||||||||||||
| Variable Res COGS, % of residential revenue | 46.4% | 46.4% | 44.7% | 43.5% | 41.9% | 42.2% | 39.5% | 40.4% | 42.4% | 41.6% | 41.3% | 41.3% | ||||||||||||||||
| Total fiber fixed costs | $229,546 | $227,256 | $253,385 | $266,897 | $321,558 | $320,219 | $328,902 | $340,648 | $377,549 | $379,851 | ||||||||||||||||||
| Quarterly growth assumption | 1.0% | |||||||||||||||||||||||||||
| Annual growth assumption (2017-2018) | 4.0% | |||||||||||||||||||||||||||
| 1) Based on COGS analysis | ||||||||||||||||||||||||||||
| Quarterly | Annual (2017-2018) | |||||||||||||||||||||||||||
| G&A Quarterly Increase | 1.0% | 0.0% | ||||||||||||||||||||||||||
| Selling expense increase | 1.5% | 0.0% | ||||||||||||||||||||||||||
| Bad Debt as a % of revenue | 1.5% | |||||||||||||||||||||||||||
| Tax Rate | 35.0% | NTS currently has ~22 million of NOLs. Model assumes NTS starting to pay taxes in 2016. | ||||||||||||||||||||||||||
| Property Tax | 1.25% | As % of sales | ||||||||||||||||||||||||||
| Yes = 1, No =0 | ||||||||||||||||||||||||||||
| Going Private Cost savings | 1 | |||||||||||||||||||||||||||
| Planned Cost savings - % of plan | 75.0% | |||||||||||||||||||||||||||
| Fiber Assumptions | ||||||||||||||||||||||||||||
| 2017-2018 annual growth | ||||||||||||||||||||||||||||
| Wholesale Fiber Growth Rate (Quarterly) | 2.0% | 5.0% | ||||||||||||||||||||||||||
| New Projects | % prob | Yes = 1, No =0 | ||||||||||||||||||||||||||
| Midland | 20.0% | 1 | With Midland | |||||||||||||||||||||||||
| Odessa | 20.0% | 1 | With Odessa | |||||||||||||||||||||||||
| New RUS | 20.0% | 1 | With New RUS Project | |||||||||||||||||||||||||
| Business Take Rate | ||||||||||||||||||||||||||||
| LTM | Q2 2013 | Aug-13 | Q3 2013 | Q4 2013 | Q1 2014 | Q2 2014 | Q3 2014 | Q4 2014 | Q1 2015 | Q2 2015 | Q3 2015 | Q4 2015 | Q1 2016 | Q2 2016 | Q3 2016 | Q4 2016 | 2017 | 2018 | ||||||||||
| Lubbock | 53% | 54% | 53% | 54% | 54% | 54% | 54% | 55% | 55% | 55% | 55% | 56% | 56% | 56% | 56% | 56% | 57% | 57% | 58% | |||||||||
| Wolfforth | 53% | 51% | 50% | 50% | 50% | 50% | 50% | 50% | 50% | 50% | 50% | 50% | 50% | 50% | 50% | 50% | 50% | 50% | 50% | |||||||||
| Levelland | 66% | 68% | 67% | 69% | 69% | 69% | 69% | 69% | 70% | 70% | 70% | 70% | 70% | 71% | 71% | 71% | 71% | 71% | 71% | |||||||||
| Smyer | 17% | 17% | 17% | 17% | 17% | 17% | 17% | 18% | 18% | 18% | 18% | 18% | 19% | 19% | 19% | 19% | 19% | 20% | 21% | |||||||||
| Littlefield | 41% | 41% | 42% | 43% | 44% | 45% | 54% | 63% | 63% | 63% | 63% | 63% | 63% | 63% | 63% | 63% | 63% | 63% | 63% | |||||||||
| Burkburnnet | 38% | 40% | 41% | 42% | 44% | 53% | 62% | 63% | 63% | 63% | 63% | 63% | 63% | 63% | 63% | 63% | 63% | 63% | 63% | |||||||||
| Brownfield | 56% | 61% | 61% | 61% | 61% | 61% | 64% | 68% | 68% | 68% | 68% | 68% | 68% | 68% | 68% | 68% | 68% | 68% | 68% | |||||||||
| Slaton | 24% | 27% | 29% | 29% | 31% | 32% | 34% | 35% | 37% | 38% | 40% | 41% | 43% | 44% | 46% | 47% | 49% | 52% | 56% | |||||||||
| Wilson | 17% | 17% | 17% | 17% | 17% | 17% | 17% | 17% | 17% | 17% | 17% | 17% | 17% | 17% | 17% | 17% | 17% | 17% | 17% | |||||||||
| Lamesa | 50% | 57% | 57% | 59% | 61% | 62% | 67% | 67% | 67% | 67% | 67% | 67% | 67% | 67% | 67% | 67% | 67% | 67% | 67% | |||||||||
| Plainview | 26% | 39% | 39% | 40% | 42% | 49% | 56% | 58% | 60% | 61% | 63% | 63% | 63% | 63% | 63% | 63% | 63% | 63% | 63% | |||||||||
| Wichita Falls | 16% | 23% | 27% | 31% | 38% | 45% | 46% | 46% | 46% | 47% | 47% | 47% | 48% | 48% | 49% | 49% | 49% | 51% | 52% | |||||||||
| Iowa Park | 9% | 12% | 14% | 15% | 17% | 20% | 31% | 42% | 44% | 45% | 47% | 48% | 50% | 51% | 53% | 54% | 56% | 57% | 57% | |||||||||
| Hammond | 1% | 3% | 10% | 10% | 12% | 14% | 15% | 16% | 17% | 18% | 19% | 21% | 22% | 23% | 24% | 25% | 26% | 29% | 32% | |||||||||
| Ponchatoula | 0% | 0% | 0% | 14% | 20% | 23% | 25% | 27% | 29% | 32% | 34% | 36% | 38% | 41% | 43% | 45% | 49% | 53% | ||||||||||
| Abilene | 0% | 0% | 1% | 3% | 16% | 27% | 38% | 39% | 39% | 39% | 40% | 40% | 41% | 41% | 41% | 42% | 42% | 42% | 42% | |||||||||
| Hale Center | 0% | 0% | 2% | 5% | 9% | 13% | 19% | 27% | 32% | 35% | 37% | 42% | 43% | 44% | 46% | 48% | 48% | 49% | 51% | |||||||||
| Abernathy | 0% | 0% | 9% | 13% | 19% | 27% | 32% | 35% | 37% | 42% | 43% | 44% | 46% | 48% | 48% | 49% | 51% | |||||||||||
| New Deal | 0% | 0% | 9% | 13% | 19% | 27% | 32% | 35% | 37% | 42% | 43% | 44% | 46% | 48% | 48% | 49% | 51% | |||||||||||
| Amarillo | 0% | 0% | 2% | 11% | 20% | 24% | 29% | 30% | 30% | 31% | 32% | 33% | 33% | 34% | 35% | 35% | 35% | |||||||||||
| Tickfaw Village | 0% | 0% | 0% | 13% | 19% | 27% | 32% | 35% | 37% | 42% | 43% | 44% | 46% | 48% | 48% | 49% | 51% | |||||||||||
| Independence | 0% | 0% | 0% | 13% | 19% | 27% | 32% | 35% | 37% | 42% | 43% | 44% | 46% | 48% | 48% | 49% | 51% | |||||||||||
| Amite | 0% | 0% | 0% | 13% | 19% | 27% | 32% | 35% | 37% | 42% | 43% | 44% | 46% | 48% | 48% | 49% | 51% | |||||||||||
| Pine Grove | 0% | 0% | 0% | 13% | 19% | 27% | 32% | 35% | 37% | 42% | 43% | 44% | 46% | 48% | 48% | 49% | 51% | |||||||||||
| Montpelier | 0% | 0% | 0% | 13% | 19% | 27% | 32% | 35% | 37% | 42% | 43% | 44% | 46% | 48% | 48% | 49% | 51% | |||||||||||
| Franklington | 0% | 0% | 0% | 13% | 19% | 27% | 32% | 35% | 37% | 42% | 43% | 44% | 46% | 48% | 48% | 49% | 51% | |||||||||||
| Towers | 0% | 0% | 0% | 13% | 19% | 27% | 32% | 35% | 37% | 42% | 43% | 44% | 46% | 48% | 48% | 49% | 51% | |||||||||||
| Natalbany | 0% | 0% | 0% | 13% | 19% | 27% | 32% | 35% | 37% | 42% | 43% | 44% | 46% | 48% | 48% | 49% | 51% | |||||||||||
| Midland | 3% | 16% | 27% | 38% | 39% | 39% | 39% | 40% | 40% | 41% | 41% | |||||||||||||||||
| Odessa | 3% | 16% | 27% | 38% | 39% | 39% | 39% | 40% | 40% | 41% | ||||||||||||||||||
| Snyder | 9% | 13% | 19% | 27% | 32% | 35% | 37% | 42% | 43% | 44% | ||||||||||||||||||
| Sweetwater | 9% | 13% | 19% | 27% | 32% | 35% | 37% | 42% | 43% | 44% | ||||||||||||||||||
| Pampa | 9% | 13% | 19% | 27% | 32% | 35% | 37% | 42% | 43% | 44% | ||||||||||||||||||
| Residential Take Rate | ||||||||||||||||||||||||||||
| LTM | Q2 2013 | Aug-13 | Q3 2013 | Q4 2013 | Q1 2014 | Q2 2014 | Q3 2014 | Q4 2014 | Q1 2015 | Q2 2015 | Q3 2015 | Q4 2015 | Q1 2016 | Q2 2016 | Q3 2016 | Q4 2016 | 2017 | 2018 | ||||||||||
| Lubbock | 13% | 13% | 12% | 12% | 12% | 12% | 13% | 13% | 13% | 14% | 14% | 15% | 15% | 15% | 16% | 16% | 16% | 18% | 19% | |||||||||
| Wolfforth | 9% | 9% | 9% | 9% | 9% | 9% | 9% | 10% | 10% | 11% | 11% | 11% | 12% | 12% | 12% | 13% | 13% | 15% | 16% | |||||||||
| Levelland | 38% | 38% | 38% | 38% | 38% | 38% | 39% | 39% | 39% | 40% | 40% | 40% | 41% | 41% | 42% | 42% | 42% | 42% | 42% | |||||||||
| Smyer | 35% | 36% | 35% | 35% | 35% | 35% | 35% | 35% | 36% | 36% | 37% | 37% | 37% | 38% | 38% | 38% | 39% | 40% | 42% | |||||||||
| Littlefield | 40% | 41% | 41% | 41% | 41% | 41% | 41% | 42% | 42% | 42% | 43% | 43% | 43% | 43% | 43% | 43% | 43% | 43% | 43% | |||||||||
| Whitharral | 15% | 18% | 21% | 21% | 22% | 23% | 24% | 24% | 25% | 26% | 27% | 27% | 28% | 29% | 30% | 30% | 31% | 33% | 36% | |||||||||
| Burburnnet | 29% | 30% | 31% | 31% | 32% | 33% | 33% | 34% | 35% | 36% | 36% | 37% | 38% | 39% | 39% | 40% | 41% | 41% | 41% | |||||||||
| Brownfield | 36% | 38% | 38% | 39% | 39% | 40% | 40% | 40% | 41% | 41% | 42% | 42% | 42% | 42% | 42% | 42% | 42% | 42% | 42% | |||||||||
| Slaton | 14% | 17% | 17% | 18% | 19% | 20% | 20% | 21% | 22% | 23% | 23% | 24% | 25% | 26% | 26% | 27% | 28% | 30% | 32% | |||||||||
| Wilson | 21% | 23% | 25% | 25% | 26% | 27% | 28% | 28% | 29% | 30% | 31% | 31% | 32% | 33% | 34% | 34% | 35% | 37% | 40% | |||||||||
| Lamesa | 20% | 26% | 27% | 27% | 29% | 30% | 32% | 33% | 35% | 36% | 38% | 39% | 40% | 40% | 40% | 40% | 40% | 40% | 40% | |||||||||
| Meadow Bus/ | 21% | 26% | 26% | 27% | 28% | 29% | 29% | 30% | 31% | 32% | 32% | 33% | 34% | 35% | 35% | 36% | 37% | 38% | 40% | |||||||||
| Ropesville Bus/ | 18% | 22% | 22% | 23% | 24% | 25% | 25% | 26% | 27% | 28% | 28% | 29% | 30% | 31% | 31% | 32% | 33% | 35% | 37% | |||||||||
| Plainview | 6% | 12% | 13% | 14% | 16% | 19% | 20% | 22% | 23% | 25% | 26% | 28% | 29% | 31% | 32% | 34% | 35% | 37% | 37% | |||||||||
| Iowa Park | 6% | 10% | 12% | 13% | 15% | 17% | 19% | 20% | 22% | 23% | 25% | 26% | 28% | 29% | 31% | 32% | 34% | 36% | 36% | |||||||||
| Hammond | 0% | 0% | 1% | 1% | 1% | 7% | 15% | 21% | 25% | 28% | 29% | 28% | 28% | 29% | 29% | 29% | 28% | 29% | 29% | |||||||||
| Ponchatoula | 0% | 0% | 0% | 1% | 7% | 15% | 21% | 25% | 28% | 29% | 28% | 28% | 29% | 29% | 29% | 28% | 29% | 29% | ||||||||||
| Abilene | 0% | 0% | 5% | 15% | 20% | 25% | 30% | 35% | 40% | 41% | 41% | 41% | 41% | 42% | 42% | 42% | 42% | 42% | ||||||||||
| Hale Center | 0% | 0% | 6% | 10% | 15% | 21% | 25% | 28% | 29% | 28% | 28% | 29% | 29% | 29% | 28% | 29% | 29% | 29% | 29% | |||||||||
| Abernathy | 0% | 0% | 1% | 7% | 15% | 21% | 25% | 28% | 29% | 28% | 28% | 29% | 29% | 29% | 28% | 29% | 29% | |||||||||||
| New Deal | 0% | 0% | 1% | 7% | 15% | 21% | 25% | 28% | 29% | 28% | 28% | 29% | 29% | 29% | 28% | 29% | 29% | |||||||||||
| Tickfaw Village | 0% | 0% | 0% | 1% | 7% | 15% | 21% | 25% | 28% | 29% | 28% | 28% | 29% | 29% | 29% | 28% | 29% | |||||||||||
| Independence | 0% | 0% | 0% | 1% | 7% | 15% | 21% | 25% | 28% | 29% | 28% | 28% | 29% | 29% | 29% | 28% | 29% | |||||||||||
| Amite | 0% | 0% | 0% | 1% | 7% | 15% | 21% | 25% | 28% | 29% | 28% | 28% | 29% | 29% | 29% | 28% | 29% | |||||||||||
| Pine Grove | 0% | 0% | 0% | 1% | 7% | 15% | 21% | 25% | 28% | 29% | 28% | 28% | 29% | 29% | 29% | 28% | 29% | |||||||||||
| Montpelier | 0% | 0% | 0% | 1% | 7% | 15% | 21% | 25% | 28% | 29% | 28% | 28% | 29% | 29% | 29% | 28% | 29% | |||||||||||
| Franklington | 0% | 0% | 0% | 1% | 7% | 15% | 21% | 25% | 28% | 29% | 28% | 28% | 29% | 29% | 29% | 28% | 29% | |||||||||||
| Towers | 0% | 0% | 0% | 1% | 7% | 15% | 21% | 25% | 28% | 29% | 28% | 28% | 29% | 29% | 29% | 28% | 29% | |||||||||||
| Natalbany | 0% | 0% | 0% | 1% | 7% | 15% | 21% | 25% | 28% | 29% | 28% | 28% | 29% | 29% | 29% | 28% | 29% | |||||||||||
| Snyder | 1% | 7% | 15% | 21% | 25% | 28% | 29% | 28% | 28% | 29% | ||||||||||||||||||
| Sweetwater | 1% | 7% | 15% | 21% | 25% | 28% | 29% | 28% | 28% | 29% | ||||||||||||||||||
| Pampa | 1% | 7% | 15% | 21% | 25% | 28% | 29% | 28% | 28% | 29% | ||||||||||||||||||
| Business ARPU (weighted average for Blitz impact) | ||||||||||||||||||||||||||||
| Business ARPU during Blitz | $200 | |||||||||||||||||||||||||||
| LTM | Q2 2013 | Aug-13 | Q3 2013 | Q4 2013 | Q1 2014 | Q2 2014 | Q3 2014 | Q4 2014 | Q1 2015 | Q2 2015 | Q3 2015 | Q4 2015 | Q1 2016 | Q2 2016 | Q3 2016 | Q4 2016 | 2017 | 2018 | ||||||||||
| Lubbock | $405 | $404 | $412 | $410 | $412 | $413 | $415 | $416 | $418 | $419 | $421 | $422 | $424 | $425 | $427 | $428 | $430 | $430 | $430 | |||||||||
| Wolfforth | $334 | $341 | $364 | $350 | $352 | $353 | $355 | $356 | $358 | $359 | $361 | $362 | $364 | $365 | $367 | $368 | $370 | $370 | $370 | |||||||||
| Misc Fiber - Other Mkts | $841 | $1,133 | $3,664 | $1,133 | $1,133 | $1,133 | $1,133 | $1,133 | $1,133 | $1,133 | $1,133 | $1,133 | $1,133 | $1,133 | $1,133 | $1,133 | $1,133 | $1,133 | $1,133 | |||||||||
| Levelland | $454 | $450 | $469 | $465 | $467 | $468 | $470 | $471 | $473 | $474 | $476 | $477 | $479 | $480 | $482 | $483 | $485 | $485 | $485 | |||||||||
| Smyer | $402 | $407 | $407 | $407 | $407 | $407 | $407 | $407 | $407 | $407 | $407 | $407 | $407 | $407 | $407 | $407 | $407 | $407 | $407 | |||||||||
| Littlefield | $291 | $300 | $287 | $300 | $301 | $303 | $295 | $282 | $283 | $285 | $286 | $288 | $289 | $291 | $292 | $294 | $295 | $295 | $295 | |||||||||
| Burkburnnet | $219 | $201 | $251 | $245 | $256 | $261 | $260 | $268 | $275 | $283 | $290 | $298 | $305 | $313 | $317 | $317 | $317 | $317 | $317 | |||||||||
| Brownfield | $216 | $195 | $211 | $210 | $221 | $233 | $243 | $251 | $262 | $273 | $281 | $288 | $296 | $303 | $309 | $309 | $309 | $309 | $309 | |||||||||
| Slaton | $214 | $207 | $206 | $210 | $221 | $233 | $244 | $255 | $266 | $278 | $285 | $293 | $300 | $308 | $308 | $308 | $308 | $308 | $308 | |||||||||
| Wilson | $140 | $105 | $116 | $115 | $115 | $115 | $115 | $115 | $115 | $115 | $115 | $115 | $115 | $115 | $115 | $115 | $115 | $115 | $115 | |||||||||
| Lamesa | $186 | $186 | $188 | $205 | $216 | $228 | $237 | $248 | $260 | $271 | $282 | $290 | $297 | $305 | $307 | $307 | $307 | $307 | $307 | |||||||||
| Plainview | $441 | $207 | $253 | $260 | $271 | $276 | $276 | $283 | $291 | $298 | $306 | $313 | $321 | $321 | $321 | $321 | $321 | $321 | $321 | |||||||||
| Wichita Falls | $235 | $215 | $206 | $213 | $217 | $221 | $232 | $243 | $254 | $266 | $273 | $281 | $288 | $292 | $292 | $292 | $292 | $292 | $292 | |||||||||
| Iowa Park | $237 | $192 | $157 | $160 | $171 | $183 | $195 | $203 | $214 | $225 | $236 | $248 | $259 | $266 | $274 | $281 | $289 | $289 | $289 | |||||||||
| Hammond | $44 | $177 | $200 | $200 | $208 | $215 | $223 | $230 | $238 | $245 | $253 | $260 | $268 | $275 | $283 | $290 | $298 | $298 | $298 | |||||||||
| Ponchatoula | $0 | $0 | $200 | $200 | $200 | $208 | $215 | $223 | $230 | $238 | $245 | $253 | $260 | $268 | $275 | $283 | $283 | $283 | ||||||||||
| Abilene | $0 | $0 | $200 | $202 | $202 | $202 | $210 | $217 | $225 | $232 | $240 | $247 | $255 | $262 | $270 | $277 | $277 | $277 | ||||||||||
| Hale Center | $0 | $0 | $200 | $208 | $215 | $223 | $230 | $238 | $245 | $253 | $260 | $268 | $275 | $283 | $290 | $298 | $298 | $298 | ||||||||||
| Abernathy | $0 | $0 | $200 | $208 | $215 | $223 | $230 | $238 | $245 | $253 | $260 | $268 | $275 | $283 | $290 | $290 | $290 | |||||||||||
| New Deal | $0 | $0 | $200 | $208 | $215 | $223 | $230 | $238 | $245 | $253 | $260 | $268 | $275 | $283 | $290 | $290 | $290 | |||||||||||
| Amarillo | $0 | $0 | $200 | $202 | $201 | $209 | $216 | $224 | $231 | $239 | $246 | $254 | $261 | $269 | $276 | $276 | $276 | |||||||||||
| Tickfaw Village | $0 | $0 | $200 | $208 | $215 | $223 | $230 | $238 | $245 | $253 | $260 | $268 | $275 | $283 | $290 | $290 | $290 | |||||||||||
| Independence | $0 | $0 | $200 | $208 | $215 | $223 | $230 | $238 | $245 | $253 | $260 | $268 | $275 | $283 | $290 | $290 | $290 | |||||||||||
| Amite | $0 | $0 | $200 | $208 | $215 | $223 | $230 | $238 | $245 | $253 | $260 | $268 | $275 | $283 | $290 | $290 | $290 | |||||||||||
| Pine Grove | $0 | $0 | $200 | $208 | $215 | $223 | $230 | $238 | $245 | $253 | $260 | $268 | $275 | $283 | $290 | $290 | $290 | |||||||||||
| Montpelier | $0 | $0 | $200 | $208 | $215 | $223 | $230 | $238 | $245 | $253 | $260 | $268 | $275 | $283 | $290 | $290 | $290 | |||||||||||
| Franklington | $0 | $0 | $200 | $208 | $215 | $223 | $230 | $238 | $245 | $253 | $260 | $268 | $275 | $283 | $290 | $290 | $290 | |||||||||||
| Towers | $0 | $0 | $200 | $208 | $215 | $223 | $230 | $238 | $245 | $253 | $260 | $268 | $275 | $283 | $290 | $290 | $290 | |||||||||||
| Natalbany | $0 | $0 | $200 | $208 | $215 | $223 | $230 | $238 | $245 | $253 | $260 | $268 | $275 | $283 | $290 | $290 | $290 | |||||||||||
| Midland | $200 | $202 | $202 | $202 | $210 | $217 | $225 | $232 | $240 | $247 | $255 | |||||||||||||||||
| Odessa | $200 | $202 | $202 | $202 | $210 | $217 | $225 | $232 | $240 | $247 | ||||||||||||||||||
| Snyder | $201 | $245 | $256 | $261 | $260 | $268 | $275 | $283 | $290 | $298 | ||||||||||||||||||
| Sweetwater | $201 | $245 | $256 | $261 | $260 | $268 | $275 | $283 | $290 | $298 | ||||||||||||||||||
| Pampa | $201 | $245 | $256 | $261 | $260 | $268 | $275 | $283 | $290 | $298 | ||||||||||||||||||
| Residential ARPU | ||||||||||||||||||||||||||||
| LTM | Q2 2013 | Aug-13 | Q3 2013 | Q4 2013 | Q1 2014 | Q2 2014 | Q3 2014 | Q4 2014 | Q1 2015 | Q2 2015 | Q3 2015 | Q4 2015 | Q1 2016 | Q2 2016 | Q3 2016 | Q4 2016 | 2017 | 2018 | ||||||||||
| Lubbock | $87 | $85 | $89 | $88 | $90 | $91 | $93 | $94 | $96 | $97 | $99 | $100 | $102 | $103 | $105 | $105 | $105 | $105 | $105 | |||||||||
| Wolfforth | $92 | $92 | $92 | $94 | $96 | $97 | $99 | $100 | $102 | $103 | $105 | $106 | $106 | $106 | $106 | $106 | $106 | $106 | $106 | |||||||||
| Levelland | $103 | $105 | $104 | $105 | $106 | $106 | $107 | $108 | $109 | $109 | $109 | $109 | $109 | $109 | $109 | $109 | $109 | $109 | $109 | |||||||||
| Smyer | $105 | $109 | $95 | $110 | $110 | $110 | $110 | $110 | $110 | $110 | $110 | $110 | $110 | $110 | $110 | $110 | $110 | $110 | $110 | |||||||||
| Littlefield | $111 | $110 | $116 | $110 | $110 | $110 | $110 | $110 | $110 | $110 | $110 | $110 | $110 | $110 | $110 | $110 | $110 | $110 | $110 | |||||||||
| Whitharral | $112 | $93 | $104 | $104 | $105 | $106 | $106 | $107 | $108 | $109 | $109 | $109 | $109 | $109 | $109 | $109 | $109 | $109 | $109 | |||||||||
| Burkburnnet | $107 | $106 | $106 | $108 | $110 | $110 | $110 | $110 | $110 | $110 | $110 | $110 | $110 | $110 | $110 | $110 | $110 | $110 | $110 | |||||||||
| Brownfield | $104 | $100 | $103 | $102 | $104 | $105 | $107 | $108 | $108 | $108 | $108 | $108 | $108 | $108 | $108 | $108 | $108 | $108 | $108 | |||||||||
| Slaton | $108 | $101 | $106 | $106 | $108 | $109 | $109 | $109 | $109 | $109 | $109 | $109 | $109 | $109 | $109 | $109 | $109 | $109 | $109 | |||||||||
| Wilson | $116 | $112 | $106 | $112 | $112 | $112 | $112 | $112 | $112 | $112 | $112 | $112 | $112 | $112 | $112 | $112 | $112 | $112 | $112 | |||||||||
| Lamesa | $110 | $104 | $101 | $102 | $104 | $105 | $107 | $108 | $108 | $108 | $108 | $108 | $108 | $108 | $108 | $108 | $108 | $108 | $108 | |||||||||
| Meadow | $121 | $124 | $123 | $124 | $124 | $124 | $124 | $124 | $124 | $124 | $124 | $124 | $124 | $124 | $124 | $124 | $124 | $124 | $124 | |||||||||
| Ropesville | $106 | $106 | $114 | $106 | $107 | $109 | $109 | $109 | $109 | $109 | $109 | $109 | $109 | $109 | $109 | $109 | $109 | $109 | $109 | |||||||||
| Plainview | $113 | $101 | $101 | $102 | $104 | $105 | $107 | $108 | $108 | $108 | $108 | $108 | $108 | $108 | $108 | $108 | $108 | $108 | $108 | |||||||||
| Iowa Park | $104 | $98 | $107 | $104 | $106 | $107 | $109 | $109 | $109 | $109 | $109 | $109 | $109 | $109 | $109 | $109 | $109 | $109 | $109 | |||||||||
| Hammond | $0 | $0 | $130 | $105 | $106 | $107 | $109 | $109 | $109 | $109 | $109 | $109 | $109 | $109 | $109 | $109 | $109 | $109 | $109 | |||||||||
| Ponchatoula | $0 | $0 | $105 | $106 | $107 | $109 | $109 | $109 | $109 | $109 | $109 | $109 | $109 | $109 | $109 | $109 | $109 | $109 | ||||||||||
| Hale Center | $0 | $0 | $95 | $105 | $106 | $107 | $109 | $109 | $109 | $109 | $109 | $109 | $109 | $109 | $109 | $109 | $109 | $109 | $109 | |||||||||
| Abernathy | $0 | $0 | $105 | $106 | $107 | $109 | $109 | $109 | $109 | $109 | $109 | $109 | $109 | $109 | $109 | $109 | $109 | |||||||||||
| New Deal | $0 | $0 | $105 | $106 | $107 | $109 | $109 | $109 | $109 | $109 | $109 | $109 | $109 | $109 | $109 | $109 | $109 | |||||||||||
| Tickfaw Village | $0 | $0 | $105 | $106 | $107 | $109 | $109 | $109 | $109 | $109 | $109 | $109 | $109 | $109 | $109 | $109 | $109 | |||||||||||
| Independence | $0 | $0 | $105 | $106 | $107 | $109 | $109 | $109 | $109 | $109 | $109 | $109 | $109 | $109 | $109 | $109 | $109 | |||||||||||
| Amite | $0 | $0 | $105 | $106 | $107 | $109 | $109 | $109 | $109 | $109 | $109 | $109 | $109 | $109 | $109 | $109 | $109 | |||||||||||
| Pine Grove | $0 | $0 | $105 | $106 | $107 | $109 | $109 | $109 | $109 | $109 | $109 | $109 | $109 | $109 | $109 | $109 | $109 | |||||||||||
| Montpelier | $0 | $0 | $105 | $106 | $107 | $109 | $109 | $109 | $109 | $109 | $109 | $109 | $109 | $109 | $109 | $109 | $109 | |||||||||||
| Franklington | $0 | $0 | $105 | $106 | $107 | $109 | $109 | $109 | $109 | $109 | $109 | $109 | $109 | $109 | $109 | $109 | $109 | |||||||||||
| Towers | $0 | $0 | $105 | $106 | $107 | $109 | $109 | $109 | $109 | $109 | $109 | $109 | $109 | $109 | $109 | $109 | $109 | |||||||||||
| Natalbany | $0 | $0 | $105 | $106 | $107 | $109 | $109 | $109 | $109 | $109 | $109 | $109 | $109 | $109 | $109 | $109 | $109 | |||||||||||
| Snyder | $105 | $106 | $108 | $110 | $110 | $110 | $110 | $110 | $110 | $110 | ||||||||||||||||||
| Sweetwater | $105 | $106 | $108 | $110 | $110 | $110 | $110 | $110 | $110 | $110 | ||||||||||||||||||
| Pampa | $105 | $106 | $108 | $110 | $110 | $110 | $110 | $110 | $110 | $110 | ||||||||||||||||||
4
| NTS Summary | ||||||||||||||||||||||||||||||||||||||
| Case 2 | 2011A | 2012A | 2013E | 2014P | 2015P | 2016 | 2017 | 2018 | ||||||||||||||||||||||||||||||
| Q1 | Q2 | Q3 | Q4 | Year | Q1 | Q2 | Q3 | Q4 | Year | Q1 | Q2 | Q3 | Q4 | Year | Q1 | Q2 | Q3 | Q4 | Year | Q1 | Q2 | Q3 | Q4 | Year | Q1 | Q2 | Q3 | Q4 | Year | |||||||||
| Fiber Revenue Summary | ||||||||||||||||||||||||||||||||||||||
| Business Revenues | $1,801,965 | $1,862,533 | $2,022,291 | $2,083,533 | $7,770,321 | $2,268,515 | $2,431,899 | $2,499,819 | $2,648,921 | $9,849,154 | $2,793,006 | $2,927,366 | $3,172,874 | $3,406,335 | $12,299,581 | $3,756,037 | $4,148,058 | $4,463,524 | $4,695,439 | $17,063,058 | $4,910,789 | $5,125,789 | $5,339,840 | $5,554,471 | $20,930,889 | $5,733,834 | $5,891,355 | $6,042,520 | $6,200,234 | $23,867,943 | $25,294,886 | $25,876,912 | ||||||
| Count | 1,704 | 1,732 | 1,816 | 1,892 | 1,892 | 2,007 | 2,083 | 2,252 | 2,452 | 2,452 | 2,707 | 2,898 | 3,183 | 3,574 | 3,574 | 4,162 | 4,645 | 4,888 | 5,072 | 5,072 | 5,257 | 5,428 | 5,610 | 5,764 | 5,764 | 5,873 | 5,974 | 6,070 | 6,177 | 6,177 | 6,316 | 6,464 | ||||||
| ARPU | $348 | $361 | $380 | $375 | $361 | $388 | $396 | $384 | $375 | $378 | $361 | $348 | $348 | $336 | $340 | $324 | $314 | $312 | $314 | $329 | $317 | $320 | $323 | $326 | $322 | $328 | $332 | $334 | $338 | $333 | $337 | $337 | ||||||
| Passings | 3,463 | 3,463 | 3,899 | 4,077 | 4,077 | 4,217 | 4,464 | 5,011 | 5,491 | 5,491 | 6,241 | 8,320 | 9,943 | 12,390 | 12,390 | 12,390 | 12,390 | 12,390 | 12,830 | 12,830 | 13,466 | 13,466 | 13,466 | 13,466 | 13,466 | 13,466 | 13,466 | 13,466 | 13,466 | 13,466 | 13,466 | 13,466 | ||||||
| Take Rate | 49% | 50% | 47% | 46% | 46% | 48% | 47% | 45% | 45% | 45% | 43% | 35% | 32% | 29% | 29% | 34% | 37% | 39% | 40% | 40% | 39% | 40% | 42% | 43% | 43% | 44% | 44% | 45% | 46% | 46% | 47% | 48% | ||||||
| Residential Revenues | $1,143,144 | $1,177,619 | $1,314,496 | $1,517,851 | $5,153,109 | $1,734,887 | $1,893,087 | $2,002,848 | $2,092,255 | $7,723,077 | $2,285,726 | $2,374,856 | $2,452,254 | $2,575,818 | $9,688,655 | $2,751,162 | $3,041,158 | $3,388,832 | $3,691,707 | $12,872,860 | $3,928,558 | $4,127,914 | $4,301,274 | $4,447,376 | $16,805,123 | $4,577,199 | $4,693,919 | $4,786,043 | $4,854,088 | $18,911,249 | $19,783,909 | $20,268,982 | ||||||
| Count | 4,313 | 4,366 | 4,796 | 5,375 | 5,375 | 6,041 | 6,444 | 6,852 | 7,008 | 7,008 | 7,686 | 7,894 | 8,178 | 8,486 | 8,486 | 9,126 | 10,135 | 11,138 | 11,920 | 11,920 | 12,546 | 13,098 | 13,555 | 13,939 | 13,939 | 14,305 | 14,607 | 14,873 | 15,028 | 15,028 | 15,448 | 15,789 | ||||||
| ARPU | $90 | $90 | $96 | $99 | $90 | $101 | $101 | $100 | $101 | $104 | $104 | $102 | $102 | $103 | $104 | $104 | $105 | $106 | $107 | $105 | $107 | $107 | $108 | $108 | $108 | $108 | $108 | $108 | $108 | $109 | $108 | $108 | ||||||
| Passings | 22,390 | 22,390 | 28,086 | 29,671 | 29,671 | 30,954 | 33,248 | 36,328 | 38,935 | 38,935 | 38,935 | 38,935 | 44,387 | 50,134 | 50,134 | 50,134 | 50,134 | 50,134 | 50,134 | 50,134 | 52,677 | 52,677 | 52,677 | 52,677 | 52,677 | 52,677 | 52,677 | 52,677 | 52,677 | 52,677 | 52,677 | 52,677 | ||||||
| Take Rate | 19% | 19% | 17% | 18% | 18% | 20% | 19% | 19% | 18% | 18% | 20% | 20% | 18% | 17% | 17% | 18% | 20% | 22% | 24% | 24% | 24% | 25% | 26% | 26% | 26% | 27% | 28% | 28% | 29% | 29% | 29% | 30% | ||||||
| Wholesale Revenues | $291 | $1,009 | $80,485 | $17,333 | $99,117 | $69,265 | $188,118 | $253,112 | $136,888 | $647,384 | $267,420 | $350,396 | $497,097 | $507,039 | $1,621,952 | $517,180 | $527,523 | $538,074 | $548,835 | $2,131,612 | $559,812 | $571,008 | $582,428 | $594,077 | $2,307,325 | $605,958 | $618,078 | $630,439 | $643,048 | $2,497,523 | $2,622,399 | $2,753,519 | ||||||
| Total Fiber Revenues | $2,945,400 | $3,041,161 | $3,417,271 | $3,618,716 | $13,022,548 | $4,072,667 | $4,513,105 | $4,755,779 | $4,878,064 | $18,219,615 | $5,346,152 | $5,652,618 | $6,122,225 | $6,489,193 | $23,610,188 | $7,024,379 | $7,716,740 | $8,390,430 | $8,935,981 | $32,067,530 | $9,399,160 | $9,824,712 | $10,223,542 | $10,595,924 | $40,043,338 | $10,916,992 | $11,203,351 | $11,459,002 | $11,697,370 | $45,276,715 | $47,701,194 | $48,899,414 | ||||||
| Count | 6,017 | 6,098 | 6,612 | 7,267 | 7,267 | 8,048 | 8,527 | 9,104 | 9,460 | 9,460 | 10,393 | 10,792 | 11,361 | 12,060 | 12,060 | 13,288 | 14,780 | 16,027 | 16,993 | 16,993 | 17,804 | 18,526 | 19,165 | 19,703 | 19,703 | 20,178 | 20,581 | 20,943 | 21,206 | 21,206 | 21,764 | 22,253 | ||||||
| ARPU | $163 | $167 | $179 | $174 | $165 | $177 | $182 | $180 | $175 | $182 | $180 | $178 | $184 | $185 | $183 | $185 | $183 | $182 | $180 | $184 | $180 | $180 | $181 | $182 | $182 | $182 | $183 | $184 | $185 | $184 | $185 | $185 | ||||||
| Passings | 25,853 | 25,853 | 31,985 | 33,748 | 33,748 | 35,171 | 37,712 | 41,339 | 44,426 | 44,426 | 45,176 | 47,255 | 54,330 | 62,524 | 62,524 | 62,524 | 62,524 | 62,524 | 62,964 | 62,964 | 66,143 | 66,143 | 66,143 | 66,143 | 66,143 | 66,143 | 66,143 | 66,143 | 66,143 | 66,143 | 66,143 | 66,143 | ||||||
| Take Rate | 23% | 24% | 21% | 22% | 22% | 23% | 23% | 22% | 21% | 21% | 23% | 23% | 21% | 19% | 19% | 21% | 24% | 26% | 27% | 27% | 27% | 28% | 29% | 30% | 30% | 31% | 31% | 32% | 32% | 32% | 33% | 34% | ||||||
| Net increase in count | 81 | 514 | 655 | 781 | 479 | 577 | 356 | 2,193 | 933 | 399 | 569 | 699 | 2,600 | 1,229 | 1,492 | 1,247 | 966 | 4,933 | 811 | 722 | 639 | 537 | 2,710 | 475 | 403 | 362 | 262 | 1,503 | 559 | 488 | ||||||||
| Revenue | ||||||||||||||||||||||||||||||||||||||
| Fiber | 2,945,400 | 3,041,161 | 3,417,271 | 3,618,716 | 13,022,548 | 4,072,667 | 4,513,105 | 4,755,779 | 4,878,064 | 18,219,615 | 5,346,152 | 5,652,618 | 6,122,225 | 6,489,193 | 23,610,188 | 7,024,379 | 7,716,740 | 8,390,430 | 8,935,981 | 32,067,530 | 9,399,160 | 9,824,712 | 10,223,542 | 10,595,924 | 40,043,338 | 10,916,992 | 11,203,351 | 11,459,002 | 11,697,370 | 45,276,715 | 47,701,194 | 48,899,414 | ||||||
| Wireless | 0 | 0 | 0 | 0 | 0 | 0 | 0 | 0 | 0 | 0 | 0 | 0 | 0 | 0 | 0 | 0 | 9,567 | 34,903 | 67,149 | 111,619 | 100,105 | 133,061 | 166,017 | 198,972 | 598,155 | 231,928 | 264,884 | 283,489 | 285,617 | 1,065,918 | 1,142,466 | 1,142,466 | ||||||
| Non-Fiber | 11,311,818 | 11,057,995 | 11,184,371 | 11,081,102 | 44,635,286 | 10,851,162 | 10,571,454 | 10,170,267 | 10,057,970 | 41,650,853 | 9,590,084 | 9,533,566 | 9,034,998 | 8,763,730 | 36,922,378 | 8,491,599 | 8,238,631 | 8,024,789 | 7,818,412 | 32,573,431 | 7,621,530 | 7,428,955 | 7,244,329 | 7,071,704 | 29,366,519 | 6,910,170 | 6,754,774 | 6,605,216 | 6,461,210 | 26,731,370 | 24,726,995 | 22,737,998 | ||||||
| Total Revenue | 14,257,218 | 14,099,156 | 14,601,642 | 14,699,818 | 57,657,834 | 14,923,829 | 15,084,559 | 14,926,046 | 14,936,034 | 59,870,468 | 14,936,236 | 15,186,185 | 15,157,223 | 15,252,923 | 60,532,567 | 15,515,978 | 15,964,938 | 16,450,122 | 16,821,543 | 64,752,580 | 17,120,795 | 17,386,728 | 17,633,888 | 17,866,601 | 70,008,011 | 18,059,090 | 18,223,009 | 18,347,707 | 18,444,197 | 73,074,003 | 73,570,656 | 72,779,878 | ||||||
| COGS | ||||||||||||||||||||||||||||||||||||||
| Fiber | 827,400 | 841,951 | 908,677 | 996,407 | 3,574,435 | 1,123,680 | 1,199,253 | 1,201,130 | 1,271,190 | 4,795,252 | 1,446,306 | 1,470,298 | 1,506,072 | 1,568,985 | 5,991,661 | 1,657,322 | 1,794,545 | 1,953,031 | 2,090,175 | 7,495,074 | 2,199,497 | 2,293,347 | 2,376,457 | 2,448,361 | 9,317,662 | 2,512,368 | 2,570,252 | 2,617,793 | 2,655,647 | 10,356,061 | 10,834,515 | 11,126,560 | ||||||
| Wireless | 0 | 0 | 0 | 0 | 0 | 0 | 0 | 0 | 0 | 0 | 0 | 0 | 0 | 0 | 0 | 0 | 478 | 1,745 | 3,357 | 5,581 | 5,005 | 6,653 | 8,301 | 9,949 | 29,908 | 11,596 | 13,244 | 14,174 | 14,281 | 53,296 | 57,123 | 57,123 | ||||||
| Non-Fiber | 6,184,075 | 6,007,878 | 6,155,170 | 6,104,165 | 24,451,288 | 5,998,974 | 5,621,023 | 5,533,454 | 5,541,040 | 22,694,491 | 5,194,112 | 5,260,548 | 4,909,382 | 4,779,441 | 20,143,483 | 4,648,761 | 4,527,725 | 4,426,677 | 4,329,229 | 17,932,393 | 4,230,697 | 4,139,915 | 4,053,004 | 3,972,071 | 16,395,687 | 3,896,648 | 3,824,179 | 3,754,514 | 3,687,510 | 15,162,852 | 14,253,235 | 13,329,912 | ||||||
| Total COGS | 7,011,475 | 6,849,829 | 7,063,847 | 7,100,572 | 28,025,723 | 7,122,654 | 6,820,276 | 6,734,583 | 6,812,230 | 27,489,743 | 6,640,418 | 6,730,847 | 6,415,454 | 6,348,425 | 26,135,145 | 6,306,083 | 6,322,749 | 6,381,454 | 6,422,762 | 25,433,048 | 6,435,199 | 6,439,915 | 6,437,763 | 6,430,380 | 25,743,257 | 6,420,612 | 6,407,676 | 6,386,482 | 6,357,438 | 25,572,208 | 25,144,873 | 24,513,595 | ||||||
| Gross Profit | ||||||||||||||||||||||||||||||||||||||
| Fiber | 2,118,000 | 2,199,210 | 2,508,594 | 2,622,309 | 9,448,113 | 2,948,987 | 3,313,852 | 3,554,649 | 3,606,874 | 13,424,363 | 3,899,846 | 4,182,320 | 4,616,153 | 4,920,208 | 17,618,527 | 5,367,057 | 5,922,194 | 6,437,399 | 6,845,806 | 24,572,456 | 7,199,663 | 7,531,365 | 7,847,085 | 8,147,563 | 30,725,676 | 8,404,624 | 8,633,099 | 8,841,208 | 9,041,723 | 34,920,654 | 36,866,680 | 37,772,854 | ||||||
| Wireless | 0 | 0 | 0 | 0 | 0 | 0 | 0 | 0 | 0 | 0 | 0 | 0 | 0 | 0 | 0 | 0 | 9,089 | 33,158 | 63,792 | 106,038 | 95,100 | 126,408 | 157,716 | 189,024 | 568,247 | 220,332 | 251,640 | 269,315 | 271,336 | 1,012,622 | 1,085,343 | 1,085,343 | ||||||
| Non-Fiber | 5,127,743 | 5,050,117 | 5,029,201 | 4,976,937 | 20,183,998 | 4,852,188 | 4,950,431 | 4,636,814 | 4,516,930 | 18,956,362 | 4,395,972 | 4,273,018 | 4,125,616 | 3,984,290 | 16,778,895 | 3,842,837 | 3,710,906 | 3,598,112 | 3,489,183 | 14,641,038 | 3,390,833 | 3,289,040 | 3,191,325 | 3,099,634 | 12,970,832 | 3,013,522 | 2,930,595 | 2,850,702 | 2,773,700 | 11,568,518 | 10,473,760 | 9,408,086 | ||||||
| Total Gross Profit | 7,245,743 | 7,249,327 | 7,537,795 | 7,599,246 | 29,632,111 | 7,801,175 | 8,264,283 | 8,191,463 | 8,123,804 | 32,380,725 | 8,295,818 | 8,455,338 | 8,741,769 | 8,904,498 | 34,397,422 | 9,209,894 | 9,642,189 | 10,068,668 | 10,398,781 | 39,319,532 | 10,685,595 | 10,946,813 | 11,196,125 | 11,436,221 | 44,264,755 | 11,638,477 | 11,815,333 | 11,961,225 | 12,086,759 | 47,501,794 | 48,425,783 | 48,266,283 | ||||||
| Gross Margin | ||||||||||||||||||||||||||||||||||||||
| Fiber | 72% | 72% | 73% | 72% | 73% | 72% | 73% | 75% | 74% | 74% | 73% | 74% | 75% | 76% | 75% | 76% | 77% | 77% | 77% | 77% | 77% | 77% | 77% | 77% | 77% | 77% | 77% | 77% | 77% | 77% | 77% | 77% | ||||||
| Wireless | NM | NM | NM | NM | NM | NM | NM | NM | NM | NM | NM | NM | NM | NM | NM | NM | 95% | 95% | 95% | 95% | 95% | 95% | 95% | 95% | 95% | 95% | 95% | 95% | 95% | 95% | 95% | 95% | ||||||
| Non-Fiber | 45% | 46% | 45% | 45% | 45% | 45% | 47% | 46% | 45% | 46% | 46% | 45% | 46% | 45% | 45% | 45% | 45% | 45% | 45% | 45% | 44% | 44% | 44% | 44% | 44% | 44% | 43% | 43% | 43% | 43% | 42% | 41% | ||||||
| Total Gross Margin | 51% | 51% | 52% | 52% | 51% | 52% | 55% | 55% | 54% | 54% | 56% | 56% | 58% | 58% | 57% | 59% | 60% | 61% | 62% | 61% | 62% | 63% | 63% | 64% | 63% | 64% | 65% | 65% | 66% | 65% | 66% | 66% | ||||||
| Operating Expenses | ||||||||||||||||||||||||||||||||||||||
| Sales & Marketing | $995,573 | $857,369 | $875,000 | $829,980 | $3,557,922 | $856,024 | $949,812 | $874,324 | $855,570 | $3,535,730 | $870,184 | $786,098 | $774,525 | $787,627 | $3,218,434 | $802,392 | $825,101 | $845,537 | $861,291 | $3,334,321 | $875,968 | $890,449 | $904,837 | $919,135 | $3,590,389 | $933,120 | $946,945 | $951,081 | $963,368 | $3,794,513 | $3,793,138 | $3,804,018 | ||||||
| General & Administrative | 4,321,875 | 4,353,150 | 4,327,865 | 4,479,613 | $17,482,504 | 4,280,736 | 4,486,710 | 4,290,866 | 4,207,958 | 17,266,271 | 4,116,949 | 5,614,866 | 4,375,171 | 4,394,893 | 18,501,879 | 4,439,308 | 4,486,916 | 4,535,476 | 4,582,742 | 18,044,441 | 4,629,343 | 4,675,865 | 4,722,531 | 4,769,409 | 18,797,148 | 4,816,119 | 4,862,838 | 4,909,411 | 4,956,008 | 19,544,375 | 19,551,825 | 19,539,963 | ||||||
| Total SG&A | 5,317,448 | 5,210,519 | 5,202,866 | 5,309,593 | 21,040,426 | 5,136,760 | 5,436,522 | 5,165,190 | 5,063,528 | 20,802,001 | 4,987,133 | 6,400,964 | 5,149,697 | 5,182,520 | 21,720,313 | 5,241,700 | 5,312,017 | 5,381,013 | 5,444,032 | 21,378,761 | 5,505,310 | 5,566,314 | 5,627,368 | 5,688,544 | 22,387,536 | 5,749,239 | 5,809,782 | 5,860,492 | 5,919,376 | 23,338,889 | 23,344,963 | 23,343,981 | ||||||
| Stock Based Compensation | 82,996 | 58,631 | 24,567 | 234,191 | 400,385 | 40,530 | 38,616 | 64,389 | 139,900 | 283,435 | 53,085 | 119,217 | 119,217 | 119,217 | 410,736 | 119,217 | 119,217 | 119,217 | 119,217 | 476,868 | 119,217 | 119,217 | 119,217 | 119,217 | 476,868 | 119,217 | 119,217 | 119,217 | 119,217 | 476,868 | 476,868 | 476,868 | ||||||
| EBITDA | 2,011,291 | 2,097,439 | 2,359,496 | 2,523,844 | 8,992,070 | 2,704,944 | 2,866,377 | 3,090,661 | 3,200,176 | 11,862,159 | 3,361,770 | 2,173,591 | 3,711,289 | 3,841,195 | 13,087,845 | 4,087,411 | 4,449,390 | 4,806,872 | 5,073,965 | 18,417,638 | 5,299,502 | 5,499,716 | 5,687,975 | 5,866,893 | 22,354,087 | 6,008,456 | 6,124,768 | 6,219,950 | 6,286,600 | 24,639,774 | 25,557,687 | 25,399,169 | ||||||
| EBITDA Margin | 14% | 15% | 16% | 17% | 16% | 18% | 19% | 21% | 21% | 20% | 23% | 14% | 24% | 25% | 22% | 26% | 28% | 29% | 30% | 28% | 31% | 32% | 32% | 33% | 32% | 33% | 34% | 34% | 34% | 34% | ||||||||
| One Time Charge | $0 | $1,547,973 | $0 | $0 | $1,547,973 | $0 | $0 | $0 | $0 | $0 | $0 | $0 | $0 | $0 | $0 | $0 | $0 | $0 | $0 | $0 | $0 | $0 | ||||||||||||||||
| Cost savings - general | 0 | 0 | 0 | 64,406 | 64,406 | 146,097 | 238,875 | 331,653 | 360,026 | 1,076,652 | 371,112 | 371,112 | 371,112 | 371,112 | 1,484,448 | 371,112 | 371,112 | 371,112 | 371,112 | 1,484,448 | 1,484,448 | 1,484,448 | ||||||||||||||||
| Cost savings - going private | 0 | 0 | 0 | 0 | 0 | 163,000 | 163,000 | 163,000 | 163,000 | 652,000 | 163,000 | 163,000 | 163,000 | 163,000 | 652,000 | 163,000 | 163,000 | 163,000 | 163,000 | 652,000 | 652,000 | 652,000 | ||||||||||||||||
| Adjusted EBITDA | $2,011,291 | $2,097,439 | $2,359,496 | $2,523,844 | $8,992,070 | $2,704,944 | $2,866,377 | $3,090,661 | $3,200,176 | $11,862,159 | $3,361,770 | $3,721,564 | $3,711,289 | $3,905,600 | $14,700,224 | $4,396,509 | $4,851,265 | $5,301,526 | $5,596,991 | $20,146,290 | $5,833,614 | $6,033,828 | $6,222,087 | $6,401,005 | $24,490,535 | $6,542,568 | $6,658,880 | $6,754,062 | $6,820,712 | $26,776,222 | $27,694,135 | $27,535,617 | ||||||
Pro Forma EBITDA (1) | 2,545,403 | 2,631,551 | 2,893,608 | 3,057,956 | 11,128,518 | 3,239,056 | 3,400,489 | 3,624,773 | 3,734,288 | 13,998,607 | 3,895,882 | 4,255,676 | 4,245,401 | 4,375,307 | 16,772,266 | 4,621,523 | 4,983,502 | 5,340,984 | 5,608,077 | 20,554,086 | 5,833,614 | 6,033,828 | 6,222,087 | 6,401,005 | 24,490,535 | 6,542,568 | 6,658,880 | 6,754,062 | 6,820,712 | 26,776,222 | 27,694,135 | 27,535,617 | ||||||
| Capex | 3,895,612 | 8,847,569 | 3,732,690 | 8,227,012 | 2,314,414 | 2,338,092 | 16,612,209 | 3,191,446 | 2,754,681 | 2,426,291 | 2,171,050 | 10,543,468 | 2,064,420 | 2,047,559 | 1,913,024 | 1,662,026 | 7,687,029 | 1,451,136 | 1,328,853 | 1,195,143 | 1,075,827 | 5,050,959 | 4,358,771 | 2,636,774 | ||||||||||||||
| Interest Expense | 645,171 | 1,366,764 | 745,417 | 1,246,447 | 1,013,709 | 1,577,350 | $4,582,923 | 1,007,195 | 1,371,527 | 982,575 | 1,351,642 | 4,712,940 | 960,276 | 1,141,113 | 926,553 | 1,095,493 | 4,123,434 | 875,161 | 847,199 | 819,089 | 791,104 | 3,332,552 | 2,869,248 | 1,337,711 | ||||||||||||||
| Total Debt | ||||||||||||||||||||||||||||||||||||||
| ICON Debt | 14,100,000 | 14,100,000 | 14,100,000 | 15,800,000 | 20,100,000 | 20,100,000 | 20,100,000 | 20,100,000 | 19,597,500 | 18,843,750 | 18,090,000 | 17,336,250 | 17,336,250 | 16,582,500 | 15,828,750 | 15,075,000 | 14,321,250 | 14,321,250 | 13,567,500 | 12,813,750 | 12,060,000 | 11,306,250 | 11,306,250 | 0 | 0 | |||||||||||||
| Existing RUS/USDA Debt | 35,531,099 | 37,337,663 | 37,337,663 | 41,277,130 | 43,476,810 | 43,688,721 | 43,778,684 | 43,778,684 | 44,224,430 | 44,912,741 | 45,289,814 | 45,367,706 | 45,367,706 | 45,217,521 | 44,881,825 | 44,387,369 | 43,841,779 | 43,841,779 | 43,312,516 | 42,756,859 | 42,212,152 | 41,578,722 | 41,578,722 | 39,025,753 | 36,297,047 | |||||||||||||
| New RUS Project | 0 | 0 | 0 | 0 | 0 | 0 | 0 | 0 | 0 | 277,206 | 554,412 | 1,018,386 | 1,018,386 | 1,627,569 | 2,383,823 | 3,052,210 | 3,343,190 | 3,343,190 | 3,575,411 | 3,803,985 | 4,028,910 | 5,636,219 | 5,636,219 | 5,492,753 | 5,349,286 | |||||||||||||
| New Smart Build Debt | 0 | 0 | 0 | 0 | 0 | 0 | 0 | 0 | 0 | 300,000 | 600,000 | 888,750 | 888,750 | 1,155,000 | 1,110,000 | 1,065,000 | 1,020,000 | 1,020,000 | 975,000 | 930,000 | 885,000 | 840,000 | 840,000 | 660,000 | 480,000 | |||||||||||||
| Bond | 14,313,905 | 10,653,728 | 10,653,728 | 11,183,749 | 11,339,128 | 11,339,128 | 7,597,216 | 7,597,216 | 7,597,216 | 7,597,216 | 7,597,216 | 3,855,304 | 3,855,304 | 3,855,304 | 3,855,304 | 3,855,304 | 0 | 0 | 0 | 0 | 0 | 0 | 0 | 0 | 0 | |||||||||||||
| Other Debt | 1,968,070 | 1,666,080 | 1,666,080 | 1,332,430 | 969,464 | 732,694 | 539,663 | 539,663 | 377,885 | 234,498 | 139,958 | 71,172 | 71,172 | 49,997 | 39,497 | 30,344 | 20,957 | 20,957 | 11,144 | 5,282 | 2,167 | 188 | 188 | 0 | 0 | |||||||||||||
| Total Debt | 65,913,074 | 63,757,471 | 63,757,471 | 69,593,309 | 75,885,402 | 75,860,543 | 72,015,563 | 72,015,563 | 71,797,031 | 72,165,411 | 72,271,399 | 68,537,568 | 68,537,568 | 68,487,891 | 68,099,199 | 67,465,226 | 62,547,176 | 62,547,176 | 61,441,571 | 60,309,876 | 59,188,229 | 59,361,379 | 59,361,379 | 45,178,505 | 42,126,334 | |||||||||||||
| Cash | 8,685,702 | 3,908,620 | 3,908,620 | 6,872,540 | 9,937,102 | 9,631,912 | 5,304,977 | 5,304,977 | 4,671,457 | 5,354,888 | 7,031,014 | 5,010,165 | 5,010,165 | 7,248,094 | 9,353,688 | 11,746,023 | 10,055,046 | 10,055,046 | 12,637,172 | 15,651,402 | 17,758,345 | 21,253,728 | 21,253,728 | 19,017,905 | 30,309,283 | |||||||||||||
| Net Debt | 57,227,372 | 59,848,851 | 59,848,851 | 62,720,769 | 65,948,300 | 66,228,631 | 66,710,586 | 66,710,586 | 67,125,574 | 66,810,522 | 65,240,385 | 63,527,403 | 63,527,403 | 61,239,796 | 58,745,511 | 55,719,202 | 52,492,131 | 52,492,131 | 48,804,399 | 44,658,474 | 41,429,884 | 38,107,650 | 38,107,650 | 26,160,601 | 11,817,051 | |||||||||||||
_____________________________________________________________________________________
(1) Pro forma EBITDA assumes full impact of the total costs savings taking effect as of January 1, 2011.
5
| Awards Status Detailed | Price | 2 | |||||||||||||
Company: NTS Inc. Employee: All Branch: All Department: All Sub Department: All Emp/Non Emp: All Active Optionee: All Company Status: All Entity: All As Of Date: 27/09/2013 Granted Under Branch: All Plan: All Board Resolution: All Tax Chapter: All Exercise Price From: All To: All Outstanding > 0: All Exercisable > 0: All Grant Date From: 01/01/1990 To: 27/09/2013 Citizenship Group: All Grant Type: AllNoWarrants | |||||||||||||||
Generated By: Krikov Niv | Basic shares | 41,463,879 | |||||||||||||
Issue Date: 27/09/2013 17:37 | |||||||||||||||
| Last Name | First Name | WW ID | Grant Date | Plan | Tax Chapter | Exercise Price | Outstanding | Unvested | Exercisable | Change of Control | Total vested | Fully Diluted | In the money | Cash from exercise | |
| Alan L | Bazaar | 1AB01 | 8/5/2013 | NTS 2007 | NQ | 1.1000 | 50,000 | 10,000 | 40,000 | 40,000 | 18,000 | 40,000 | $44,000 | ||
| Almog | Itzhak | 1YA01 | 20/09/2010 | NTS 2007 | Section 3(I) | 1.2210 | 90,000 | 0 | 90,000 | 90,000 | 35,055 | 90,000 | $109,890 | ||
| Almog | Itzhak | 1YA01 | 2/11/2011 | NTS 2004 | Section 3(I) | 1.1000 | 348 | 0 | 348 | 348 | 157 | 348 | $383 | ||
| Almog | Itzhak | 1YA01 | 2/11/2011 | NTS 2007 | Section 3(I) | 1.1000 | 76,581 | 0 | 76,581 | 76,581 | 34,461 | 76,581 | $84,239 | ||
| Ambrose | Dawn | 3DA01 | 15/02/2010 | NTS 2007 | ISO | 1.1000 | 10,000 | 1,250 | 8,750 | 8,750 | 3,938 | 8,750 | $9,625 | ||
| Ambrose | Dawn | 3DA01 | 2/11/2011 | NTS 2007 | ISO | 1.1000 | 9,780 | 1,223 | 8,557 | 8,557 | 3,851 | 8,557 | $9,413 | ||
| Bash | Todd M. | 3TB01 | 8/5/2013 | NTS 2007 | ISO | 1.1000 | 19,780 | 19,780 | 0 | 0 | 0 | 0 | $0 | ||
| Burton | John Mark | 4JB01 | 3/7/2006 | NTS 2004 | NQ | 1.5000 | 40,000 | 0 | 40,000 | 40,000 | 10,000 | 40,000 | $60,000 | ||
| Burton | John Mark | 4JB01 | 3/7/2006 | NTS 2004 | NQ | 3.5000 | 260,000 | 0 | 260,000 | 260,000 | 0 | 0 | $0 | ||
| Burton | John Mark | 4JB01 | 2/11/2011 | NTS 2004 | NQ | 1.1000 | 46,157 | 0 | 46,157 | 46,157 | 20,771 | 46,157 | $50,773 | ||
| Carlos Bell III | Don | 1DB01 | 8/5/2013 | NTS 2007 | NQ | 1.1000 | 50,000 | 10,000 | 40,000 | 40,000 | 18,000 | 40,000 | $44,000 | ||
| Clark | Betty | 3BC01 | 15/02/2010 | NTS 2007 | ISO | 1.1000 | 7,500 | 938 | 6,562 | 6,562 | 2,953 | 6,562 | $7,218 | ||
| Clark | Betty | 3BC01 | 2/11/2011 | NTS 2007 | ISO | 1.1000 | 7,335 | 917 | 6,418 | 6,418 | 2,888 | 6,418 | $7,060 | ||
| Coleman Jr. | Richard K | 1RC01 | 8/5/2013 | NTS 2007 | NQ | 1.1000 | 50,000 | 10,000 | 40,000 | 40,000 | 18,000 | 40,000 | $44,000 | ||
| Collins | Kevin | 3KC02 | 15/02/2010 | NTS 2007 | ISO | 1.1000 | 5,000 | 625 | 4,375 | 4,375 | 1,969 | 4,375 | $4,813 | ||
| Collins | Kevin | 3KC02 | 2/11/2011 | NTS 2007 | ISO | 1.1000 | 4,890 | 612 | 4,278 | 4,278 | 1,925 | 4,278 | $4,706 | ||
| Crow | Karen | 3KC01 | 15/02/2010 | NTS 2007 | ISO | 1.1000 | 7,500 | 938 | 6,562 | 6,562 | 2,953 | 6,562 | $7,218 | ||
| Crow | Karen | 3KC01 | 2/11/2011 | NTS 2007 | ISO | 1.1000 | 7,335 | 917 | 6,418 | 6,418 | 2,888 | 6,418 | $7,060 | ||
| Crow | Morris | 3MC01 | 15/02/2010 | NTS 2007 | ISO | 1.1000 | 5,000 | 625 | 4,375 | 4,375 | 1,969 | 4,375 | $4,813 | ||
| Crow | Morris | 3MC01 | 2/11/2011 | NTS 2007 | ISO | 1.1000 | 4,890 | 612 | 4,278 | 4,278 | 1,925 | 4,278 | $4,706 | ||
| Drumma | Bernadette | 3BD01 | 15/02/2010 | NTS 2007 | ISO | 1.1000 | 7,500 | 938 | 6,562 | 6,562 | 2,953 | 6,562 | $7,218 | ||
| Drumma | Bernadette | 3BD01 | 2/11/2011 | NTS 2007 | ISO | 1.1000 | 7,335 | 917 | 6,418 | 6,418 | 2,888 | 6,418 | $7,060 | ||
| Duvall | Kathy | 3KD01 | 15/02/2010 | NTS 2007 | ISO | 1.1000 | 10,000 | 1,250 | 8,750 | 8,750 | 3,938 | 8,750 | $9,625 | ||
| Duvall | Kathy | 3KD01 | 2/11/2011 | NTS 2007 | ISO | 1.1000 | 9,780 | 1,223 | 8,557 | 8,557 | 3,851 | 8,557 | $9,413 | ||
| Eberwein | Jeffrey E. | 1JE01 | 8/5/2013 | NTS 2007 | NQ | 1.1000 | 50,000 | 10,000 | 40,000 | 40,000 | 18,000 | 40,000 | $44,000 | ||
| Fink | Gershon | 1GF01 | 13/12/2012 | NTS 2007 | Section 3(I) | 1.1000 | 19,780 | 19,780 | 0 | 0 | 0 | 0 | $0 | ||
| Garner | Dennis | 3DG01 | 15/02/2010 | NTS 2007 | ISO | 1.1000 | 7,500 | 938 | 6,562 | 6,562 | 2,953 | 6,562 | $7,218 | ||
| Garner | Dennis | 3DG01 | 2/11/2011 | NTS 2007 | ISO | 1.1000 | 7,335 | 917 | 6,418 | 6,418 | 2,888 | 6,418 | $7,060 | ||
| Gonzales | Renee | 3RG01 | 15/02/2010 | NTS 2007 | ISO | 1.1000 | 5,000 | 625 | 4,375 | 4,375 | 1,969 | 4,375 | $4,813 | ||
| Gonzales | Renee | 3RG01 | 2/11/2011 | NTS 2007 | ISO | 1.1000 | 4,890 | 612 | 4,278 | 4,278 | 1,925 | 4,278 | $4,706 | ||
| Groce | Gene | 2GG01 | 15/02/2010 | NTS 2007 | ISO | 1.1000 | 7,500 | 938 | 6,562 | 6,562 | 2,953 | 6,562 | $7,218 | ||
| Groce | Gene | 2GG01 | 2/11/2011 | NTS 2007 | ISO | 1.1000 | 7,335 | 917 | 6,418 | 6,418 | 2,888 | 6,418 | $7,060 | ||
| Hasse | Nathaniel | 3NH01 | 20/09/2010 | NTS 2007 | ISO | 1.2210 | 7,500 | 1,875 | 5,625 | 5,625 | 2,191 | 5,625 | $6,868 | ||
| Hasse | Nathaniel | 3NH01 | 2/11/2011 | NTS 2007 | ISO | 1.1000 | 7,164 | 1,791 | 5,373 | 5,373 | 2,418 | 5,373 | $5,910 | ||
| Hasse | Nathaniel | 3NH01 | 13/12/2012 | NTS 2007 | ISO | 1.1000 | 133,688 | 133,688 | 0 | 0 | 0 | 0 | $0 | ||
| Hoover | Jerry | 3JH01 | 26/02/2008 | NTS 2007 | ISO | 5.0000 | 267,000 | 0 | 267,000 | 267,000 | 0 | 0 | $0 | ||
| Key | Suzette | 3SK01 | 15/02/2010 | NTS 2007 | ISO | 1.1000 | 10,000 | 1,250 | 8,750 | 8,750 | 3,938 | 8,750 | $9,625 | ||
| Key | Suzette | 3SK01 | 2/11/2011 | NTS 2007 | ISO | 1.1000 | 9,780 | 1,223 | 8,557 | 8,557 | 3,851 | 8,557 | $9,413 | ||
| Krikov | Niv | 1NK01 | 15/02/2010 | NTS 2007 | ISO | 1.1000 | 400,000 | 50,000 | 350,000 | 50,000 | 400,000 | 180,000 | 400,000 | $440,000 | |
| Krikov | Niv | 1NK01 | 2/11/2011 | NTS 2007 | ISO | 1.1000 | 391,212 | 48,902 | 342,310 | 48,902 | 391,212 | 176,045 | 391,212 | $430,333 | |
| Landry | Dorres | 2DL01 | 15/02/2010 | NTS 2007 | ISO | 1.1000 | 5,000 | 625 | 4,375 | 4,375 | 1,969 | 4,375 | $4,813 | ||
| Landry | Dorres | 2DL01 | 2/11/2011 | NTS 2007 | ISO | 1.1000 | 4,890 | 612 | 4,278 | 4,278 | 1,925 | 4,278 | $4,706 | ||
| Lanham | Byron | 3BL01 | 20/09/2010 | NTS 2007 | ISO | 1.2210 | 7,500 | 1,875 | 5,625 | 5,625 | 2,191 | 5,625 | $6,868 | ||
| Lanham | Byron | 3BL01 | 2/11/2011 | NTS 2007 | ISO | 1.1000 | 7,164 | 1,791 | 5,373 | 5,373 | 2,418 | 5,373 | $5,910 | ||
| Lee | Wendy | 3WL01 | 15/02/2010 | NTS 2007 | ISO | 1.1000 | 75,000 | 9,375 | 65,625 | 65,625 | 29,531 | 65,625 | $72,188 | ||
| Lee | Wendy | 3WL01 | 2/11/2011 | NTS 2007 | ISO | 1.1000 | 73,352 | 9,169 | 64,183 | 64,183 | 28,882 | 64,183 | $70,601 | ||
| M Farrar | Timothy | 1TF01 | 15/12/2011 | NTS 2007 | ISO | 1.2200 | 90,000 | 0 | 90,000 | 90,000 | 35,100 | 90,000 | $109,800 | ||
| M Farrar | Timothy | 1TF01 | 15/12/2011 | NTS 2007 | ISO | 1.1000 | 76,581 | 0 | 76,581 | 76,581 | 34,461 | 76,581 | $84,239 | ||
| MacMillan | Andrew J. | 1AM02 | 8/5/2013 | NTS 2007 | NQ | 1.1000 | 50,000 | 10,000 | 40,000 | 40,000 | 18,000 | 40,000 | $44,000 | ||
| Marin | Mike | 3MM02 | 15/02/2010 | NTS 2007 | ISO | 1.1000 | 5,000 | 625 | 4,375 | 4,375 | 1,969 | 4,375 | $4,813 | ||
| Marin | Mike | 3MM02 | 2/11/2011 | NTS 2007 | ISO | 1.1000 | 4,890 | 612 | 4,278 | 4,278 | 1,925 | 4,278 | $4,706 | ||
| Martin | Robert | 3BM01 | 15/02/2010 | NTS 2007 | ISO | 1.1000 | 5,000 | 625 | 4,375 | 4,375 | 1,969 | 4,375 | $4,813 | ||
| Martin | Robert | 3BM01 | 2/11/2011 | NTS 2007 | ISO | 1.1000 | 4,890 | 612 | 4,278 | 4,278 | 1,925 | 4,278 | $4,706 | ||
| Martinez | Angeal | 3AM01 | 20/09/2010 | NTS 2007 | ISO | 1.2210 | 1,563 | 1,250 | 313 | 313 | 122 | 313 | $382 | ||
| Martinez | Angeal | 3AM01 | 2/11/2011 | NTS 2007 | ISO | 1.1000 | 1,493 | 1,194 | 299 | 299 | 135 | 299 | $329 | ||
| Martinez | Veronica | 3VM01 | 15/02/2010 | NTS 2007 | ISO | 1.1000 | 7,500 | 938 | 6,562 | 6,562 | 2,953 | 6,562 | $7,218 | ||
| Martinez | Veronica | 3VM01 | 2/11/2011 | NTS 2007 | ISO | 1.1000 | 7,335 | 917 | 6,418 | 6,418 | 2,888 | 6,418 | $7,060 | ||
| McAllister | Hunter | 2HM01 | 5/6/2007 | NTS 2004 | NQ | 3.1460 | 200,000 | 0 | 200,000 | 200,000 | 0 | 0 | $0 | ||
| McAllister | Hunter | 2HM01 | 15/02/2010 | NTS 2007 | ISO | 1.1000 | 7,500 | 938 | 6,562 | 6,562 | 2,953 | 6,562 | $7,218 | ||
| McAllister | Hunter | 2HM01 | 2/11/2011 | NTS 2007 | ISO | 1.1000 | 7,335 | 917 | 6,418 | 6,418 | 2,888 | 6,418 | $7,060 | ||
| McAllister | Hunter | 2HM01 | 2/11/2011 | NTS 2004 | NQ | 1.1000 | 66,956 | 0 | 66,956 | 66,956 | 30,130 | 66,956 | $73,652 | ||
| Medley | Melinda | 3MM01 | 15/02/2010 | NTS 2007 | ISO | 1.1000 | 7,500 | 938 | 6,562 | 6,562 | 2,953 | 6,562 | $7,218 | ||
| Medley | Melinda | 3MM01 | 2/11/2011 | NTS 2007 | ISO | 1.1000 | 7,335 | 917 | 6,418 | 6,418 | 2,888 | 6,418 | $7,060 | ||
| Moore | Norma | 3NM01 | 15/02/2010 | NTS 2007 | ISO | 1.1000 | 5,000 | 625 | 4,375 | 4,375 | 1,969 | 4,375 | $4,813 | ||
| Moore | Norma | 3NM01 | 2/11/2011 | NTS 2007 | ISO | 1.1000 | 4,890 | 612 | 4,278 | 4,278 | 1,925 | 4,278 | $4,706 | ||
| Moreno | Ed | 3EM01 | 15/02/2010 | NTS 2007 | ISO | 1.1000 | 5,000 | 625 | 4,375 | 4,375 | 1,969 | 4,375 | $4,813 | ||
| Moreno | Ed | 3EM01 | 2/11/2011 | NTS 2007 | ISO | 1.1000 | 4,890 | 612 | 4,278 | 4,278 | 1,925 | 4,278 | $4,706 | ||
| Nichols | Stephanie | 3SN01 | 20/09/2010 | NTS 2007 | ISO | 1.2210 | 5,000 | 1,250 | 3,750 | 3,750 | 1,461 | 3,750 | $4,579 | ||
| Nichols | Stephanie | 3SN01 | 2/11/2011 | NTS 2007 | ISO | 1.1000 | 4,776 | 1,194 | 3,582 | 3,582 | 1,612 | 3,582 | $3,940 | ||
| Nissenson | Guy | 1GN01 | 15/02/2010 | NTS 2007 | ISO | 1.1000 | 1,500,000 | 0 | 1,500,000 | 1,500,000 | 675,000 | 1,500,000 | $1,650,000 | ||
| Nissenson | Guy | 1GN01 | 2/11/2011 | NTS 2004 | NQ | 1.1000 | 1,642,379 | 0 | 1,642,379 | 1,642,379 | 739,071 | 1,642,379 | $1,806,617 | ||
| Nix | Kecia | 3KN01 | 15/02/2010 | NTS 2007 | ISO | 1.1000 | 7,500 | 938 | 6,562 | 6,562 | 2,953 | 6,562 | $7,218 | ||
| Nix | Kecia | 3KN01 | 2/11/2011 | NTS 2007 | ISO | 1.1000 | 7,335 | 917 | 6,418 | 6,418 | 2,888 | 6,418 | $7,060 | ||
| Peters | Aaron | 3AP01 | 15/02/2010 | NTS 2007 | ISO | 1.1000 | 75,000 | 9,375 | 65,625 | 65,625 | 29,531 | 65,625 | $72,188 | ||
| Peters | Aaron | 3AP01 | 2/11/2011 | NTS 2007 | ISO | 1.1000 | 73,352 | 9,169 | 64,183 | 64,183 | 28,882 | 64,183 | $70,601 | ||
| Reisser | Alon | 1AR01 | 15/02/2010 | NTS 2007 | Section 3(I) | 1.1000 | 35,500 | 15,630 | 19,870 | 15,630 | 35,500 | 15,975 | 35,500 | $39,050 | |
| Reisser | Alon | 1AR01 | 2/11/2011 | NTS 2007 | Section 3(I) | 1.1000 | 102,073 | 15,283 | 86,790 | 15,283 | 102,073 | 45,933 | 102,073 | $112,280 | |
| Rivas | Priscilla | 3PR01 | 15/02/2010 | NTS 2007 | ISO | 1.1000 | 9,375 | 9,375 | 0 | 0 | 0 | 0 | $0 | ||
| Rivas | Priscilla | 3PR01 | 2/11/2011 | NTS 2007 | ISO | 1.1000 | 9,169 | 9,169 | 0 | 0 | 0 | 0 | $0 | ||
| Roberts | Glen | 3GR01 | 15/02/2010 | NTS 2007 | ISO | 1.1000 | 938 | 938 | 0 | 0 | 0 | 0 | $0 | ||
| Roberts | Glen | 3GR01 | 2/11/2011 | NTS 2007 | ISO | 1.1000 | 7,335 | 917 | 6,418 | 6,418 | 2,888 | 6,418 | $7,060 | ||
| Rosenfeld | Arie | 1AR02 | 20/09/2010 | NTS 2007 | NQ | 1.2210 | 90,000 | 0 | 90,000 | 90,000 | 35,055 | 90,000 | $109,890 | ||
| Rosenfeld | Arie | 1AR02 | 2/11/2011 | NTS 2007 | NQ | 1.1000 | 76,581 | 0 | 76,581 | 76,581 | 34,461 | 76,581 | $84,239 | ||
| Salazar | Jessica | 3JS01 | 20/09/2010 | NTS 2007 | ISO | 1.2210 | 5,000 | 1,250 | 3,750 | 3,750 | 1,461 | 3,750 | $4,579 | ||
| Salazar | Jessica | 3JS01 | 2/11/2011 | NTS 2007 | ISO | 1.1000 | 4,776 | 1,194 | 3,582 | 3,582 | 1,612 | 3,582 | $3,940 | ||
| Schwarz | Shemer S. | 1SS01 | 20/09/2010 | NTS 2007 | Section 3(I) | 1.2210 | 90,000 | 0 | 90,000 | 90,000 | 35,055 | 90,000 | $109,890 | ||
| Schwarz | Shemer S. | 1SS01 | 2/11/2011 | NTS 2007 | Section 3(I) | 1.1000 | 76,581 | 0 | 76,581 | 76,581 | 34,461 | 76,581 | $84,239 | ||
| Sheynfeld | Tal | 3TS02 | 13/06/2012 | NTS 2007 | ISO | 1.1000 | 791,212 | 534,068 | 257,144 | 534,068 | 791,212 | 356,045 | 791,212 | $870,333 | |
| Shivers | Shelton | 3SS01 | 20/09/2010 | NTS 2007 | ISO | 1.2210 | 1,563 | 1,250 | 313 | 313 | 122 | 313 | $382 | ||
| Shivers | Shelton | 3SS01 | 2/11/2011 | NTS 2007 | ISO | 1.1000 | 1,493 | 1,194 | 299 | 299 | 135 | 299 | $329 | ||
| Singer | Israel | 1IS01 | 20/09/2010 | NTS 2007 | Section 3(I) | 1.2210 | 90,000 | 0 | 90,000 | 90,000 | 35,055 | 90,000 | $109,890 | ||
| Singer | Israel | 1IS01 | 2/11/2011 | NTS 2004 | Section 3(I) | 1.1000 | 1,122 | 0 | 1,122 | 1,122 | 505 | 1,122 | $1,234 | ||
| Singer | Israel | 1IS01 | 2/11/2011 | NTS 2007 | Section 3(I) | 1.1000 | 76,581 | 0 | 76,581 | 76,581 | 34,461 | 76,581 | $84,239 | ||
| Smith | Becky | 3BS01 | 15/02/2010 | NTS 2007 | ISO | 1.1000 | 7,500 | 938 | 6,562 | 6,562 | 2,953 | 6,562 | $7,218 | ||
| Smith | Becky | 3BS01 | 2/11/2011 | NTS 2007 | ISO | 1.1000 | 7,335 | 917 | 6,418 | 6,418 | 2,888 | 6,418 | $7,060 | ||
| Stone | Kendall | 3KS01 | 15/02/2010 | NTS 2007 | ISO | 1.1000 | 5,000 | 625 | 4,375 | 4,375 | 1,969 | 4,375 | $4,813 | ||
| Stone | Kendall | 3KS01 | 2/11/2011 | NTS 2007 | ISO | 1.1000 | 4,890 | 612 | 4,278 | 4,278 | 1,925 | 4,278 | $4,706 | ||
| Wheeler | Dan | 3DW01 | 15/02/2010 | NTS 2007 | ISO | 1.1000 | 75,000 | 9,375 | 65,625 | 65,625 | 29,531 | 65,625 | $72,188 | ||
| Wheeler | Dan | 3DW01 | 2/11/2011 | NTS 2007 | ISO | 1.1000 | 73,352 | 9,169 | 64,183 | 64,183 | 28,882 | 64,183 | $70,601 | ||
| Worthington | Brad | 3BW01 | 26/02/2008 | NTS 2007 | ISO | 5.0000 | 267,000 | 0 | 267,000 | 267,000 | 0 | 0 | $0 | ||
| Worthington | Brad | 3BW01 | 15/02/2010 | NTS 2007 | ISO | 1.1000 | 215,000 | 26,875 | 188,125 | 188,125 | 84,656 | 188,125 | $206,938 | ||
| Worthington | Brad | 3BW01 | 2/11/2011 | NTS 2007 | ISO | 1.1000 | 64,369 | 0 | 64,369 | 64,369 | 28,966 | 64,369 | $70,806 | ||
| Worthington | Brad | 3BW01 | 2/11/2011 | NTS 2007 | ISO | 1.1000 | 210,277 | 26,285 | 183,992 | 183,992 | 82,796 | 183,992 | $202,391 | ||
| 8,580,323 | 1,070,532 | 7,509,791 | 3,194,501 | 7,179,674 | $7,970,346 | ||||||||||
| Warrants | |||||||||||||||
| Burlingame Equity Investors, LP | 5/5/2010 | 1.1000 | 950,000 | 950,000 | 427,500 | 950,000 | $1,045,000 | ||||||||
| Parsons Ted | 5/4/2009 | 1.8650 | 95,000 | 95,000 | 6,413 | 95,000 | $177,175 | ||||||||
| Parsons Valerie D. | 5/4/2009 | 1.8650 | 55,000 | 55,000 | 3,713 | 55,000 | $102,575 | ||||||||
| Spooner Wade | 4/30/2009 | 1.8650 | 300,000 | 300,000 | 20,250 | 300,000 | $559,500 | ||||||||
| 1,400,000 | 1,400,000 | 457,875 | 1,400,000 | $1,884,250 |
| shares from cash | (4,927,298) | ||||||||||||||
| Fully diluted | |||||||||||||||
| check | 45,116,255 | 45,116,255 | |||||||||||||
| Gross Fully diluted shares | 50,043,553 | ||||||||||
| Additional cash | $9,854,596 |
6
Case 2
| Historical and Projected Financial Performance | ||||||||||||||||||||
| Actual | ||||||||||||||||||||
| FYE December 31, | LTM | Projected FYE December 31, | ||||||||||||||||||
| 2011 | 2012 | 6/30/2013 | 2013 | 2014 | 2015 | 2016 | 2017 | 2018 | ||||||||||||
| ($ in thousands) | ||||||||||||||||||||
| Income Statement | ||||||||||||||||||||
| Fiber revenue | $13,023 | $18,220 | 20,633 | $23,610 | $32,068 | $40,043 | $45,277 | $47,701 | $48,899 | |||||||||||
| Non fiber revenue | 44,635 | 41,651 | 39,352 | 36,922 | 32,685 | 29,965 | 27,797 | 25,869 | 23,880 | |||||||||||
| Total revenue | 57,658 | 59,870 | 59,985 | 60,533 | 64,753 | 70,008 | 73,074 | 73,571 | 72,780 | |||||||||||
Cost of goods sold (1) | 28,026 | 27,490 | 26,918 | 26,135 | 25,433 | 25,743 | 25,572 | 25,145 | 24,514 | |||||||||||
| Gross Profit | 29,632 | 32,381 | 33,066 | 34,397 | 39,320 | 44,265 | 47,502 | 48,426 | 48,266 | |||||||||||
Operating expenses (1) | 21,040 | 20,802 | 21,617 | 21,720 | 21,379 | 22,388 | 23,339 | 23,345 | 23,344 | |||||||||||
| Operating income | 8,592 | 11,579 | 11,450 | 12,677 | 17,941 | 21,877 | 24,163 | 25,081 | 24,922 | |||||||||||
| Stock based compensation | 400 | 283 | 377 | 411 | 477 | 477 | 477 | 477 | 477 | |||||||||||
One time charges (2) | 0 | 0 | 1,548 | 1,548 | 0 | 0 | 0 | 0 | 0 | |||||||||||
| EBITDA | 8,992 | 11,862 | 13,374 | 14,636 | 18,418 | 22,354 | 24,640 | 25,558 | 25,399 | |||||||||||
Planned cost savings (3) | 0 | 0 | 0 | 64 | 1,077 | 1,484 | 1,484 | 1,484 | 1,484 | |||||||||||
| Adjusted EBITDA | 8,992 | 11,862 | 13,374 | 14,700 | 19,494 | 23,839 | 26,124 | 27,042 | 26,884 | |||||||||||
| Revenue Growth | ||||||||||||||||||||
| Fiber | 39.9% | NM | 29.6% | 35.8% | 24.9% | 13.1% | 5.4% | 2.5% | ||||||||||||
| Non fiber | -6.7% | NM | -11.4% | -11.5% | -8.3% | -7.2% | -6.9% | -7.7% | ||||||||||||
| Total | 3.8% | NM | 1.1% | 7.0% | 8.1% | 4.4% | 0.7% | -1.1% | ||||||||||||
| % of Revenue | ||||||||||||||||||||
| Fiber | 22.6% | 30.4% | 34.4% | 39.0% | 49.5% | 57.2% | 62.0% | 64.8% | 67.2% | |||||||||||
| Non fiber | 77.4% | 69.6% | 65.6% | 61.0% | 50.5% | 42.8% | 38.0% | 35.2% | 32.8% | |||||||||||
| Total | 100.0% | 100.0% | 100.0% | 100.0% | 100.0% | 100.0% | 100.0% | 100.0% | 100.0% | |||||||||||
| Gross profit | 51.4% | 54.1% | 55.1% | 56.8% | 60.7% | 63.2% | 65.0% | 65.8% | 66.3% | |||||||||||
| Opeating expenses as a % of revenue | 36.5% | 34.7% | 36.0% | 35.9% | 33.0% | 32.0% | 31.9% | 31.7% | 32.1% | |||||||||||
| EBITDA margin | 15.6% | 19.8% | 22.3% | 24.2% | 28.4% | 31.9% | 33.7% | 34.7% | 34.9% | |||||||||||
| Adjusted EBITDA margin | 15.6% | 19.8% | 22.3% | 24.3% | 30.1% | 34.1% | 35.8% | 36.8% | 36.9% | |||||||||||
| Other Financial Data | ||||||||||||||||||||
| Cash | $3,909 | $9,937 | $5,305 | $5,010 | $10,055 | $21,254 | $19,018 | $30,309 | ||||||||||||
| Debt | 63,757 | 75,885 | 72,016 | 68,538 | 62,547 | 59,361 | 45,179 | 42,126 | ||||||||||||
| Capital expenditures | 20,413 | 24,703 | 16,612 | 10,543 | 7,687 | 5,051 | 4,359 | 2,637 | ||||||||||||
| (1) Excludes depreciation and amortization. | ||||||||||||||||||||
| (2) Includes a write-off of $519,435 of assets acquired in various acquisitions and significantly higher than usual bad debt expense of $1.0 million. | ||||||||||||||||||||
| (3) Includes reduction in payroll, IT, transport and headquarters related costs. | ||||||||||||||||||||
| LTM EBITDA Breakdown | 80% | 20% | ||||
| Fiber | Non Fiber | Total | ||||
| ($ in thousands) | ||||||
| Gross profit | $15,244 | $17,823 | $33,066 | |||
Sales and marketing expenses (1) | 2,709 | 677 | 3,386 | |||
G&A expenses (2) | 5,609 | 10,697 | 16,306 | |||
| LTM EBITDA | $6,926 | $6,448 | $13,374 | |||
| (1) Assuming 80% of sales and marketing expenses associated with fiber business. | ||||||
| (2) Allocated based on revenue contribution and excludes stock based compensation and one time charge. | ||||||
| (3) Allocated based on revenue contribution. | ||||||
7
| Case 2 | |||||||||
| 2011 | 2012 | 2013E | 2014P | 2015P | 2016P | 2017P | 2018P | ||
| Non-Fiber | $44,635 | $41,651 | $36,922 | $32,685 | $29,965 | $27,797 | $25,869 | $23,880 | |
| Fiber | 13,023 | 18,220 | 23,610 | 32,068 | 40,043 | 45,277 | 47,701 | 48,899 | |
| Total Revenue | $57,658 | $59,870 | $60,533 | $64,753 | $70,008 | $73,074 | $73,571 | $72,780 | |
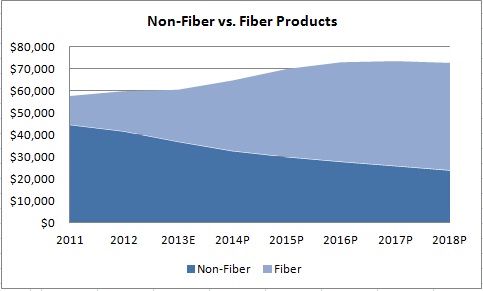
8
| P&L, Balance Sheet, Cash flow | |||||||||||||||||||||||||||||||||||||||
| 2011 | 2012 | 2013 | 2014 | 2015 | 2016 | 2017 | 2018 | ||||||||||||||||||||||||||||||||
| Q1 | Q2 | Q3 | Q4 | Year | Q1 | Q2 | Q3 | Q4 | Year | Q1 | Q2 | Q3 | Q4 | Year | Q1 | Q2 | Q3 | Q4 | Year | Q1 | Q2 | Q3 | Q4 | Year | Q1 | Q2 | Q3 | Q4 | Year | ||||||||||
| Income Statement | |||||||||||||||||||||||||||||||||||||||
| Revenue | 14,257,218 | 14,099,156 | 14,601,642 | 14,699,818 | 57,657,834 | 14,923,829 | 15,084,559 | 14,926,046 | 14,936,034 | 59,870,468 | 14,936,236 | 15,186,185 | 15,157,223 | 15,252,923 | 60,532,567 | 15,515,978 | 15,964,938 | 16,450,122 | 16,821,543 | 64,752,580 | 17,120,795 | 17,386,728 | 17,633,888 | 17,866,601 | 70,008,011 | 18,059,090 | 18,223,009 | 18,347,707 | 18,444,197 | 73,074,003 | 73,570,656 | 72,779,878 | |||||||
| Cost of goods sold | 7,011,475 | 6,849,829 | 7,063,847 | 7,100,572 | 28,025,723 | 7,122,654 | 6,820,276 | 6,734,583 | 6,812,230 | 27,489,743 | 6,640,418 | 6,730,847 | 6,415,454 | 6,348,425 | 26,135,145 | 6,306,083 | 6,322,749 | 6,381,454 | 6,422,762 | 25,433,048 | 6,435,199 | 6,439,915 | 6,437,763 | 6,430,380 | 25,743,257 | 6,420,612 | 6,407,676 | 6,386,482 | 6,357,438 | 25,572,208 | 25,144,873 | 24,513,595 | |||||||
| Gross Profit | 7,245,743 | 7,249,327 | 7,537,795 | 7,599,246 | 29,632,111 | 7,801,175 | 8,264,283 | 8,191,463 | 8,123,804 | 32,380,725 | 8,295,818 | 8,455,338 | 8,741,769 | 8,904,498 | 34,397,422 | 9,209,894 | 9,642,189 | 10,068,668 | 10,398,781 | 39,319,532 | 10,685,595 | 10,946,813 | 11,196,125 | 11,436,221 | 44,264,755 | 11,638,477 | 11,815,333 | 11,961,225 | 12,086,759 | 47,501,794 | 48,425,783 | 48,266,283 | |||||||
| Operating expenses | 5,317,448 | 5,210,519 | 5,202,866 | 5,309,593 | 21,040,426 | 5,136,760 | 5,436,522 | 5,165,190 | 5,063,528 | 20,802,001 | 4,987,133 | 6,400,964 | 5,149,697 | 5,182,520 | 21,720,313 | 5,241,700 | 5,312,017 | 5,381,013 | 5,444,032 | 21,378,761 | 5,505,310 | 5,566,314 | 5,627,368 | 5,688,544 | 22,387,536 | 5,749,239 | 5,809,782 | 5,860,492 | 5,919,376 | 23,338,889 | 23,344,963 | 23,343,981 | |||||||
| Operating income | 1,928,295 | 2,038,808 | 2,334,929 | 2,289,653 | 8,591,685 | 2,664,414 | 2,827,761 | 3,026,272 | 3,060,276 | 11,578,724 | 3,308,685 | 2,054,374 | 3,592,072 | 3,721,978 | 12,677,109 | 3,968,194 | 4,330,173 | 4,687,655 | 4,954,748 | 17,940,770 | 5,180,285 | 5,380,499 | 5,568,758 | 5,747,676 | 21,877,219 | 5,889,239 | 6,005,551 | 6,100,733 | 6,167,383 | 24,162,906 | 25,080,819 | 24,922,301 | |||||||
| Stock based compensation | 82,996 | 58,631 | 24,567 | 234,191 | 400,385 | 40,530 | 38,616 | 64,389 | 139,900 | 283,435 | 53,085 | 119,217 | 119,217 | 119,217 | 410,736 | 119,217 | 119,217 | 119,217 | 119,217 | 476,868 | 119,217 | 119,217 | 119,217 | 119,217 | 476,868 | 119,217 | 119,217 | 119,217 | 119,217 | 476,868 | 476,868 | 476,868 | |||||||
| One time charges | 0 | 0 | 0 | 0 | 0 | 0 | 0 | 0 | 0 | 0 | 0 | 1,547,973 | 0 | 0 | 1,547,973 | 0 | 0 | 0 | 0 | 0 | 0 | 0 | 0 | 0 | 0 | 0 | 0 | 0 | 0 | 0 | 0 | 0 | |||||||
| Cost savings - general | 0 | 0 | 0 | 0 | 0 | 0 | 0 | 0 | 0 | 0 | 0 | 0 | 0 | 64,406 | 64,406 | 146,097 | 238,875 | 331,653 | 360,026 | 1,076,652 | 371,112 | 371,112 | 371,112 | 371,112 | 1,484,448 | 371,112 | 371,112 | 371,112 | 371,112 | 1,484,448 | 1,484,448 | 1,484,448 | |||||||
| Cost savings - going private | 0 | 0 | 0 | 0 | 0 | 0 | 0 | 0 | 0 | 0 | 0 | 0 | 0 | 0 | 0 | 163,000 | 163,000 | 163,000 | 163,000 | 652,000 | 163,000 | 163,000 | 163,000 | 163,000 | 652,000 | 163,000 | 163,000 | 163,000 | 163,000 | 652,000 | 652,000 | 652,000 | |||||||
| EBITDA | 2,011,291 | 2,097,439 | 2,359,496 | 2,523,844 | 8,992,070 | 2,704,944 | 2,866,377 | 3,090,661 | 3,200,176 | 11,862,159 | 3,361,770 | 3,721,564 | 3,711,289 | 3,905,600 | 14,700,224 | 4,396,509 | 4,851,265 | 5,301,526 | 5,596,991 | 20,146,290 | 5,833,614 | 6,033,828 | 6,222,087 | 6,401,005 | 24,490,535 | 6,542,568 | 6,658,880 | 6,754,062 | 6,820,712 | 26,776,222 | 27,694,135 | 27,535,617 | |||||||
| Depreciation & amortization | 1,533,973 | 1,452,468 | 1,813,006 | 1,475,041 | 6,274,488 | 1,664,842 | 1,683,128 | 1,717,945 | 1,753,111 | 6,819,026 | 1,800,745 | 1,842,002 | 1,878,463 | 1,911,198 | 7,432,409 | 1,942,378 | 1,973,314 | 2,002,287 | 2,027,596 | 7,945,576 | 2,049,827 | 2,070,273 | 2,088,769 | 2,105,524 | 8,314,392 | 2,170,243 | 2,209,808 | ||||||||||||
| Interest expense | 486,159 | 1,115,492 | 645,171 | 1,366,764 | 3,613,586 | 745,417 | 1,246,447 | 1,013,709 | 1,577,350 | 4,582,923 | 1,007,195 | 1,371,527 | 982,575 | 1,351,642 | 4,712,940 | 960,276 | 1,141,113 | 926,553 | 1,095,493 | 4,123,434 | 875,161 | 847,199 | 819,089 | 791,104 | 3,332,552 | 2,869,248 | 1,337,711 | ||||||||||||
| Interest income | 0 | 0 | 0 | 0 | 0 | 0 | 0 | (24,843) | (24,080) | (48,923) | (13,262) | (11,679) | (13,387) | (17,578) | (55,906) | (12,525) | (18,120) | (23,384) | (29,365) | (83,395) | (25,138) | (31,593) | (39,129) | (44,396) | (140,255) | 0 | (190,179) | ||||||||||||
| Amortization of discount on bond | 30,417 | 30,417 | 30,417 | 30,417 | 121,668 | 30,417 | 30,417 | 30,417 | 30,417 | 121,668 | 30,417 | 30,417 | 30,417 | 30,417 | 121,668 | 30,417 | 30,417 | 30,417 | 30,417 | 121,668 | 0 | 0 | 0 | 0 | 0 | 0 | 0 | ||||||||||||
| Other non cash financial charges | 778,487 | (190,318) | 492,060 | 165,854 | 1,246,083 | 266,266 | 230,117 | 230,117 | 67,050 | 793,550 | 67,050 | 67,050 | 67,050 | 67,050 | 268,200 | 67,050 | 67,050 | 67,050 | 67,050 | 268,200 | 0 | 0 | 0 | 0 | 0 | 0 | 0 | ||||||||||||
| Bond issuance costs | 72,345 | 72,345 | 72,345 | 72,345 | 289,380 | 72,345 | 72,345 | 70,916 | 70,916 | 286,521 | 70,916 | 70,916 | 70,916 | 70,916 | 283,663 | 70,916 | 70,916 | 70,916 | 70,916 | 283,663 | 0 | 0 | 0 | 0 | 0 | 0 | 0 | ||||||||||||
| Bank charges and other cash financial expenses | 74,296 | 91,301 | 84,072 | 30,685 | 280,354 | 87,245 | 82,007 | 82,007 | 82,007 | 333,266 | 82,007 | 82,007 | 82,007 | 82,007 | 328,028 | 82,007 | 82,007 | 82,007 | 82,007 | 328,028 | 82,007 | 82,007 | 82,007 | 82,007 | 328,028 | 82,007 | 328,028 | ||||||||||||
| Property taxes | 194,214 | 191,175 | 194,606 | 238,942 | 818,937 | 210,245 | 215,590 | 189,465 | 190,662 | 805,962 | 193,950 | 199,562 | 205,627 | 210,269 | 809,407 | 214,010 | 217,334 | 220,424 | 223,333 | 875,100 | 225,739 | 227,788 | 229,346 | 230,552 | 913,425 | 919,633 | 909,748 | ||||||||||||
| Misc expenses (income) | 4,450 | (11,968) | (124,917) | 25 | (132,410) | 0 | 7,789 | 0 | 0 | 7,789 | 0 | 0 | 0 | 0 | 0 | 0 | 0 | 0 | 0 | 0 | 0 | 0 | 0 | 0 | 0 | 0 | 0 | ||||||||||||
| Income before tax | (509,927) | 76,849 | (180,488) | (319,797) | (933,362) | 231,908 | (1,513,466) | 282,339 | 38,951 | (960,268) | 1,038,274 | 1,080,246 | 1,878,641 | 1,771,852 | 5,769,013 | 2,359,869 | 2,350,581 | 2,726,601 | 2,714,342 | 10,151,392 | 3,215,755 | 3,343,990 | 3,454,763 | 3,536,703 | 13,551,211 | 21,176,136 | 22,463,633 | ||||||||||||
| Income tax expense (benefit) | (170,926) | 4,104 | (148,913) | (70,635) | (386,370) | 44,927 | (528,735) | 0 | 0 | (483,808) | 0 | 0 | 0 | 0 | 0 | 0 | 0 | 0 | 0 | 0 | 0 | 0 | 1,179,129 | 1,237,846 | 2,416,975 | 7,411,648 | 7,862,272 | ||||||||||||
| Net income | ($339,001) | $72,745 | ($31,575) | ($249,162) | ($546,992) | $186,981 | ($984,731) | $282,339 | $38,951 | (476,460) | 1,038,274 | 1,080,246 | 1,878,641 | 1,771,852 | 5,769,013 | 2,359,869 | 2,350,581 | 2,726,601 | 2,714,342 | 10,151,392 | 3,215,755 | 3,343,990 | 2,275,634 | 2,298,857 | 11,134,236 | 13,764,489 | 14,601,362 | ||||||||||||
| Balance sheet | |||||||||||||||||||||||||||||||||||||||
| Assets | |||||||||||||||||||||||||||||||||||||||
| Cash | $8,685,702 | $3,908,620 | $3,908,620 | $6,872,540 | $9,937,102 | 9,631,912 | 5,304,977 | $5,304,977 | $4,671,457 | $5,354,888 | $7,031,014 | $5,010,165 | $5,010,165 | $7,248,094 | $9,353,688 | $11,746,023 | $10,055,046 | $10,055,046 | $12,637,172 | $15,651,402 | $17,758,345 | $21,253,728 | $21,253,728 | $19,017,905 | $30,309,283 | ||||||||||||||
| Accounts receivable, net | 4,531,672 | 4,543,014 | 4,571,698 | 4,571,698 | 4,753,888 | 4,837,691 | 4,930,530 | 5,041,854 | 5,041,854 | 5,245,582 | 5,268,522 | 5,285,335 | 5,355,085 | 5,355,085 | 5,533,063 | 5,521,931 | 5,499,285 | 5,528,206 | 5,528,206 | 5,558,070 | 5,498,329 | ||||||||||||||||||
| Prepaid expenses and other receivables | 3,111,507 | 3,144,933 | 3,164,789 | 3,164,789 | 3,219,370 | 3,312,523 | 3,413,193 | 3,490,258 | 3,490,258 | 3,552,349 | 3,607,527 | 3,658,810 | 3,707,094 | 3,707,094 | 3,747,034 | 3,781,045 | 3,806,918 | 3,826,938 | 3,826,938 | 3,816,246 | 3,775,227 | ||||||||||||||||||
| Deferred taxes | 928,607 | 928,607 | 928,607 | 928,607 | 928,607 | 928,607 | 928,607 | 928,607 | 928,607 | 928,607 | 928,607 | 928,607 | 928,607 | 928,607 | 928,607 | 928,607 | 928,607 | 928,607 | 928,607 | 928,607 | 928,607 | ||||||||||||||||||
| Inventory | 211,384 | 213,655 | 215,004 | 215,004 | 218,712 | 225,040 | 231,879 | 237,115 | 237,115 | 241,333 | 245,082 | 248,566 | 251,846 | 251,846 | 254,559 | 256,870 | 258,628 | 259,988 | 259,988 | 259,261 | 256,475 | ||||||||||||||||||
| Current assets | 18,720,272 | 18,462,121 | 14,185,075 | 14,185,075 | 13,792,033 | 14,658,750 | 16,535,223 | 14,707,999 | 14,707,999 | 17,215,966 | 19,403,426 | 21,867,341 | 20,297,678 | 20,297,678 | 23,100,435 | 26,139,855 | 28,251,783 | 31,797,467 | 31,797,467 | 29,580,089 | 40,767,921 | ||||||||||||||||||
| Bond issuance cost, net | 709,157 | 638,241 | 567,326 | 567,326 | 496,410 | 425,494 | 354,579 | 283,663 | 283,663 | 212,747 | 141,831 | 70,916 | 0 | 0 | 0 | 0 | 0 | 0 | 0 | 0 | 0 | ||||||||||||||||||
| Other long term assets | 2,704,470 | 2,637,420 | 2,570,370 | 2,570,370 | 2,503,320 | 2,436,270 | 2,369,220 | 2,302,170 | 2,302,170 | 2,235,120 | 2,168,070 | 2,101,020 | 2,033,970 | 2,033,970 | 2,033,970 | 2,033,970 | 2,033,970 | 2,033,970 | 2,033,970 | 2,033,970 | 2,033,970 | ||||||||||||||||||
| Restricted cash | 252,059 | 252,059 | 252,059 | 252,059 | 252,059 | 252,059 | 252,059 | 252,059 | 252,059 | 252,059 | 252,059 | 252,059 | 252,059 | 252,059 | 252,059 | 252,059 | 252,059 | 252,059 | 252,059 | 252,059 | 252,059 | ||||||||||||||||||
| Fixed assets, net | 98,295,252 | 98,891,721 | 99,476,703 | 99,476,703 | 100,867,403 | 101,780,082 | 102,327,910 | 102,587,761 | 102,587,761 | 102,709,803 | 102,784,048 | 102,694,784 | 102,329,214 | 102,329,214 | 101,730,523 | 100,989,103 | 100,095,478 | 99,065,781 | 99,065,781 | 101,254,309 | 101,681,275 | ||||||||||||||||||
| Intangible assets, net | 1,278,086 | 1,278,086 | 1,278,086 | 1,278,086 | 1,278,086 | 1,278,086 | 1,278,086 | 1,278,086 | 1,278,086 | 1,278,086 | 1,278,086 | 1,278,086 | 1,278,086 | 1,278,086 | 1,278,086 | 1,278,086 | 1,278,086 | 1,278,086 | 1,278,086 | 1,278,086 | 1,278,086 | ||||||||||||||||||
| Total Assets | $121,959,296 | $122,159,648 | $118,329,619 | $118,329,619 | $119,189,311 | $120,830,741 | $123,117,076 | $121,411,738 | $121,411,738 | $123,903,781 | $126,027,520 | $128,264,206 | $126,191,007 | $126,191,007 | $128,395,073 | $130,693,073 | $131,911,375 | $134,427,363 | $134,427,363 | $134,398,513 | $146,013,311 | ||||||||||||||||||
| Liabilities & stockholders' equity | |||||||||||||||||||||||||||||||||||||||
| Trade payables | $12,344,959 | $12,063,843 | $11,937,800 | $11,937,800 | $11,858,179 | $11,889,516 | $11,999,907 | $12,077,585 | $12,077,585 | $12,100,973 | $12,109,840 | $12,105,793 | $12,091,910 | $12,091,910 | $12,073,543 | $12,049,217 | $12,009,363 | $11,954,748 | $11,954,748 | $11,917,981 | $11,618,773 | ||||||||||||||||||
| Other liabilities and accrued expenses | 4,643,686 | 4,554,973 | 4,507,382 | 4,507,382 | 4,477,319 | 4,489,152 | 4,530,832 | 4,560,161 | 4,560,161 | 4,568,992 | 4,572,340 | 4,570,811 | 4,565,570 | 4,565,570 | 4,558,635 | 4,549,450 | 4,534,402 | 4,513,781 | 4,513,781 | 4,463,215 | 4,351,163 | ||||||||||||||||||
| Current liabilities | 16,988,645 | 16,618,816 | 16,445,181 | 16,445,181 | 16,335,498 | 16,378,668 | 16,530,740 | 16,637,746 | 16,637,746 | 16,669,964 | 16,682,179 | 16,676,604 | 16,657,479 | 16,657,479 | 16,632,178 | 16,598,667 | 16,543,765 | 16,468,529 | 16,468,529 | 16,381,196 | 15,969,936 | ||||||||||||||||||
| ICON Debt | 14,100,000 | 14,100,000 | 14,100,000 | 15,800,000 | 20,100,000 | 20,100,000 | 20,100,000 | 20,100,000 | 19,597,500 | 18,843,750 | 18,090,000 | 17,336,250 | 17,336,250 | 16,582,500 | 15,828,750 | 15,075,000 | 14,321,250 | 14,321,250 | 13,567,500 | 12,813,750 | 12,060,000 | 11,306,250 | 11,306,250 | 0 | 0 | ||||||||||||||
| Existing RUS/USDA Debt | 35,531,099 | 37,337,663 | 37,337,663 | 41,277,130 | 43,476,810 | 43,688,721 | 43,778,684 | 43,778,684 | 44,224,430 | 44,912,741 | 45,289,814 | 45,367,706 | 45,367,706 | 45,217,521 | 44,881,825 | 44,387,369 | 43,841,779 | 43,841,779 | 43,312,516 | 42,756,859 | 42,212,152 | 41,578,722 | 41,578,722 | 39,025,753 | 36,297,047 | ||||||||||||||
| New RUS Project | 0 | 0 | 0 | 0 | 0 | 0 | 0 | 0 | 0 | 277,206 | 554,412 | 1,018,386 | 1,018,386 | 1,627,569 | 2,383,823 | 3,052,210 | 3,343,190 | 3,343,190 | 3,575,411 | 3,803,985 | 4,028,910 | 5,636,219 | 5,636,219 | 5,492,753 | 5,349,286 | ||||||||||||||
| New Smart Build Debt | 0 | 0 | 0 | 0 | 0 | 0 | 0 | 0 | 0 | 300,000 | 600,000 | 888,750 | 888,750 | 1,155,000 | 1,110,000 | 1,065,000 | 1,020,000 | 1,020,000 | 975,000 | 930,000 | 885,000 | 840,000 | 840,000 | 660,000 | 480,000 | ||||||||||||||
| Bond | 14,313,905 | 10,653,728 | 10,653,728 | 11,183,749 | 11,339,128 | 11,339,128 | 7,597,216 | 7,597,216 | 7,597,216 | 7,597,216 | 7,597,216 | 3,855,304 | 3,855,304 | 3,855,304 | 3,855,304 | 3,855,304 | 0 | 0 | 0 | 0 | 0 | 0 | 0 | 0 | 0 | ||||||||||||||
| Cobrdige / Reach | 851,569 | 700,601 | 700,601 | 605,467 | 508,811 | 410,588 | 310,784 | 310,784 | 209,373 | 106,328 | 42,659 | 0 | 0 | 0 | 0 | 0 | 0 | 0 | 0 | 0 | 0 | 0 | 0 | 0 | 0 | ||||||||||||||
| Capital leases & Other notes | 1,116,502 | 965,479 | 965,479 | 726,963 | 460,653 | 322,106 | 228,879 | 228,879 | 168,512 | 128,170 | 97,299 | 71,172 | 71,172 | 49,997 | 39,497 | 30,344 | 20,957 | 20,957 | 11,144 | 5,282 | 2,167 | 188 | 188 | 0 | 0 | ||||||||||||||
| Total debt | 65,913,074 | 63,757,471 | 63,757,471 | 69,593,309 | 75,885,402 | 75,860,543 | 72,015,563 | 72,015,563 | 71,797,031 | 72,165,411 | 72,271,399 | 68,537,568 | 68,537,568 | 68,487,891 | 68,099,199 | 67,465,226 | 62,547,176 | 62,547,176 | 61,441,571 | 60,309,876 | 59,188,229 | 59,361,379 | 59,361,379 | 45,178,505 | 42,126,334 | ||||||||||||||
| Other long term liabilities | 2,105,201 | 2,298,685 | 2,329,102 | 2,329,102 | 2,359,519 | 2,389,936 | 2,420,353 | 2,450,770 | 2,450,770 | 2,481,187 | 2,511,604 | 2,542,021 | 2,572,438 | 2,572,438 | 2,572,438 | 2,572,438 | 2,572,438 | 2,572,438 | 2,572,438 | 2,572,438 | 2,572,438 | ||||||||||||||||||
| Total Liabilities | 94,979,248 | 94,778,044 | 90,789,846 | 90,789,846 | 90,492,048 | 90,934,014 | 91,222,492 | 87,626,084 | 87,626,084 | 87,639,042 | 87,292,983 | 86,683,851 | 81,777,094 | 81,777,094 | 80,646,187 | 79,480,980 | 78,304,432 | 78,402,346 | 78,402,346 | 64,132,139 | 60,668,707 | ||||||||||||||||||
| Common stock | 53,279,220 | 53,279,220 | 53,279,220 | 53,279,220 | 53,279,220 | 53,279,220 | 53,279,220 | 53,279,220 | 53,279,220 | 53,279,220 | 53,279,220 | 53,279,220 | 53,279,220 | 53,279,220 | 53,279,220 | 53,279,220 | 53,279,220 | 53,279,220 | 53,279,220 | 53,279,220 | 53,279,220 | ||||||||||||||||||
| Retained earning | (26,299,172) | (25,897,616) | (25,739,448) | (25,739,448) | (24,581,957) | (23,382,494) | (21,384,636) | (19,493,567) | (19,493,567) | (17,014,481) | (14,544,683) | (11,698,865) | (8,865,306) | (8,865,306) | (5,530,334) | (2,067,128) | 327,723 | 2,745,797 | 2,745,797 | 16,987,154 | 32,065,384 | ||||||||||||||||||
| Total stockholders' equity | 26,980,048 | 27,381,604 | 27,539,772 | 27,539,772 | 28,697,263 | 29,896,726 | 31,894,584 | 33,785,653 | 33,785,653 | 36,264,739 | 38,734,537 | 41,580,355 | 44,413,914 | 44,413,914 | 47,748,886 | 51,212,092 | 53,606,943 | 56,025,017 | 56,025,017 | 70,266,374 | 85,344,604 | ||||||||||||||||||
| Total Liabilities and stockholders' equity | $121,959,296 | $122,159,648 | $118,329,619 | $118,329,619 | $119,189,311 | $120,830,741 | $123,117,076 | $121,411,738 | $121,411,738 | $123,903,781 | $126,027,520 | $128,264,206 | $126,191,007 | $126,191,007 | $128,395,073 | $130,693,073 | $131,911,375 | $134,427,363 | $134,427,363 | $134,398,513 | $146,013,311 | ||||||||||||||||||
| OK | OK | OK | OK | OK | OK | OK | OK | OK | OK | OK | OK | OK | OK | OK | OK | OK | OK | OK | OK | OK | |||||||||||||||||||
| Cash Flow Statement | |||||||||||||||||||||||||||||||||||||||
| Cash flow from Operations | |||||||||||||||||||||||||||||||||||||||
| Net income | $282,339 | $38,951 | $1,038,274 | $1,080,246 | $1,878,641 | $1,771,852 | $2,359,869 | $2,350,581 | $2,726,601 | $2,714,342 | $3,215,755 | $3,343,990 | $2,275,634 | $2,298,857 | $13,764,489 | $14,601,362 | |||||||||||||||||||||||
| Depreciation and amortization | 1,717,945 | 1,753,111 | 1,800,745 | 1,842,002 | 1,878,463 | 1,911,198 | 1,942,378 | 1,973,314 | 2,002,287 | 2,027,596 | 2,049,827 | 2,070,273 | 2,088,769 | 2,105,524 | 2,170,243 | 2,209,808 | |||||||||||||||||||||||
| Stock based compensation | 119,217 | 119,217 | 119,217 | 119,217 | 119,217 | 119,217 | 119,217 | 119,217 | 119,217 | 119,217 | 119,217 | 119,217 | 119,217 | 119,217 | 476,868 | 476,868 | |||||||||||||||||||||||
| Amortization of discount on bond | 30,417 | 30,417 | 30,417 | 30,417 | 30,417 | 30,417 | 30,417 | 30,417 | 30,417 | 30,417 | 0 | 0 | 0 | 0 | 0 | 0 | |||||||||||||||||||||||
| Non cash financial expenses | 230,117 | 67,050 | 67,050 | 67,050 | 67,050 | 67,050 | 67,050 | 67,050 | 67,050 | 67,050 | 0 | 0 | 0 | 0 | 0 | 0 | |||||||||||||||||||||||
| Amortization of bond issuance costs | 70,916 | 70,916 | 70,916 | 70,916 | 70,916 | 70,916 | 70,916 | 70,916 | 70,916 | 70,916 | 0 | 0 | 0 | 0 | 0 | 0 | |||||||||||||||||||||||
| Accounts receivable, net | (11,342) | (28,684) | ($182,190) | ($83,803) | ($92,839) | ($111,325) | ($203,728) | ($22,939) | ($16,814) | ($69,750) | ($177,978) | $11,132 | $22,646 | ($28,921) | ($29,865) | $59,741 | |||||||||||||||||||||||
| Prepaid expenses and other receivables | (33,426) | (19,856) | (54,581) | (93,154) | (100,670) | (77,065) | (62,091) | (55,178) | (51,283) | (48,285) | (39,939) | (34,011) | (25,873) | (20,020) | 10,692 | 41,019 | |||||||||||||||||||||||
| Deferred taxes | 0 | 0 | 0 | 0 | 0 | 0 | 0 | 0 | 0 | 0 | 0 | 0 | 0 | 0 | 0 | 0 | |||||||||||||||||||||||
| Inventory | (2,271) | (1,349) | (3,708) | (6,329) | (6,839) | (5,236) | (4,218) | (3,749) | (3,484) | (3,280) | (2,713) | (2,311) | (1,758) | (1,360) | 726 | 2,787 | |||||||||||||||||||||||
| Trade payables | (281,116) | (126,044) | ($79,621) | $31,338 | $110,391 | $77,678 | $23,387 | $8,867 | ($4,047) | ($13,883) | ($18,367) | ($24,326) | ($39,854) | ($54,614) | ($36,767) | ($299,208) | |||||||||||||||||||||||
| Other liabilities and accrued expenses | (88,713) | (47,591) | (30,063) | 11,832 | 41,681 | 29,329 | 8,830 | 3,348 | (1,528) | (5,242) | (6,935) | (9,185) | (15,048) | (20,621) | (50,566) | (112,052) | |||||||||||||||||||||||
| Increase (decrease) in net working capital | (416,868) | (223,524) | (350,162) | (140,115) | (48,276) | (86,618) | (625,171) | (237,819) | (69,651) | (77,155) | (140,440) | (525,065) | (245,932) | (58,701) | (59,887) | (125,537) | (490,056) | (105,779) | (307,713) | ||||||||||||||||||||
| Cash from operations | 2,034,083 | 1,856,138 | 2,776,457 | 3,069,733 | 3,996,428 | 3,884,032 | 4,352,028 | 4,541,844 | 4,939,333 | 4,889,098 | $5,138,867 | $5,474,779 | $4,423,733 | $4,398,061 | $16,305,821 | $16,980,324 | |||||||||||||||||||||||
| Cash flow from Investing Activities | |||||||||||||||||||||||||||||||||||||||
| RUS Capex | (844,759) | (709,039) | (1,092,403) | (1,353,770) | (1,058,093) | (770,240) | (569,215) | (389,433) | (234,333) | (186,517) | (224,635) | (201,389) | (215,936) | (129,843) | (250,393) | (169,028) | |||||||||||||||||||||||
| Smart Build Capex | (814,599) | (983,573) | (1,343,722) | (575,399) | (140,192) | (140,192) | (32,567) | (32,567) | (32,567) | (32,567) | (32,567) | (32,567) | (32,567) | (32,567) | (22,644) | (22,644) | |||||||||||||||||||||||
| New RUS Capex | 0 | 0 | 0 | 0 | (277,206) | (277,206) | (463,974) | (609,183) | (759,901) | (699,801) | (547,624) | (448,588) | (338,599) | (311,049) | (1,683,366) | (42,734) | |||||||||||||||||||||||
| New Smart Build Capex | 0 | 0 | 0 | (75,000) | (183,750) | (226,971) | (267,223) | (293,268) | (179,783) | (36,700) | (2,368) | (2,368) | (2,368) | (2,368) | (2,368) | (2,368) | |||||||||||||||||||||||
| Wireless Capex | 0 | 0 | 0 | (25,512) | (42,050) | (43,941) | (43,941) | (43,941) | (43,941) | (43,941) | (43,941) | (43,941) | (5,673) | 0 | 0 | 0 | |||||||||||||||||||||||
| NTS Comm Capex | (655,056) | (645,481) | (755,321) | (725,000) | (725,000) | (712,500) | (687,500) | (679,167) | (662,500) | (662,500) | (600,000) | (600,000) | (600,000) | (600,000) | (2,400,000) | (2,400,000) | |||||||||||||||||||||||
| Other | 0 | 0 | 0 | 0 | 0 | 0 | 0 | 0 | 0 | 0 | 0 | 0 | 0 | 0 | 0 | 0 | |||||||||||||||||||||||
| Net cash flow provided by (used in) investing activities | (2,314,414) | (2,338,092) | (3,191,446) | (2,754,681) | (2,426,291) | (2,171,050) | (2,064,420) | (2,047,559) | (1,913,024) | (1,662,026) | (1,451,136) | (1,328,853) | (1,195,143) | (1,075,827) | (4,358,771) | (2,636,774) | |||||||||||||||||||||||
| Cash flow from financing activities: | |||||||||||||||||||||||||||||||||||||||
| ICON Debt amortization | 0 | 0 | (502,500) | (753,750) | (753,750) | (753,750) | (753,750) | (753,750) | (753,750) | (753,750) | (753,750) | (753,750) | (753,750) | (753,750) | (11,306,250) | 0 | |||||||||||||||||||||||
| Existing RUS/USDA Debt additions | 844,759 | 709,039 | 1,092,403 | 1,353,770 | 1,058,093 | 770,240 | 569,215 | 389,433 | 234,333 | 186,517 | 224,635 | 201,389 | 215,936 | 129,843 | 250,393 | 169,028 | |||||||||||||||||||||||
| Existing RUS/USDA Debt amortization | (632,848) | (619,075) | (646,657) | (665,460) | (681,020) | (692,347) | (719,401) | (725,128) | (728,789) | (732,107) | (753,898) | (757,045) | (760,644) | (763,273) | (2,803,362) | (2,897,734) | |||||||||||||||||||||||
| New RUS Project additions | 0 | 0 | 0 | 277,206 | 277,206 | 463,974 | 609,183 | 759,901 | 699,801 | 331,603 | 277,206 | 277,206 | 277,206 | 1,663,236 | 0 | 0 | |||||||||||||||||||||||
| New RUS Project amortization | 0 | 0 | 0 | 0 | 0 | 0 | 0 | (3,647) | (31,414) | (40,622) | (44,985) | (48,633) | (52,280) | (55,928) | (143,466) | (143,466) | |||||||||||||||||||||||
| New Smart Build additions | 0 | 0 | 0 | 300,000 | 300,000 | 300,000 | 300,000 | 0 | 0 | 0 | 0 | 0 | 0 | 0 | 0 | 0 | |||||||||||||||||||||||
| New Smart Build amortizatoin | 0 | 0 | 0 | 0 | 0 | (11,250) | (33,750) | (45,000) | (45,000) | (45,000) | (45,000) | (45,000) | (45,000) | (45,000) | (180,000) | (180,000) | |||||||||||||||||||||||
| Bond amortization | 0 | (3,741,912) | 0 | 0 | 0 | (3,741,912) | 0 | 0 | 0 | (3,855,304) | 0 | 0 | 0 | 0 | 0 | 0 | |||||||||||||||||||||||
| Cobrdige / Reach amortization | (98,222) | (99,804) | (101,411) | (103,045) | (63,670) | (42,659) | 0 | 0 | 0 | 0 | 0 | 0 | 0 | 0 | 0 | 0 | |||||||||||||||||||||||
| Capital leases & Other notes amortization | (138,547) | (93,227) | (60,367) | (40,342) | (30,870) | (26,127) | (21,175) | (10,500) | (9,154) | (9,387) | (9,813) | (5,862) | (3,115) | (1,979) | (188) | 0 | |||||||||||||||||||||||
| Net cash provided by (used in) financing activities | (24,859) | (3,844,980) | (218,532) | 368,380 | 105,989 | (3,733,831) | (49,677) | (388,691) | (633,973) | (4,918,049) | (1,105,605) | (1,131,695) | (1,121,647) | 173,150 | (14,182,873) | (3,052,172) | |||||||||||||||||||||||
| Beginning cash balance | 9,937,102 | 9,631,912 | 5,304,977 | 4,671,457 | 5,354,888 | 7,031,014 | 5,010,165 | 7,248,094 | 9,353,688 | 11,746,023 | 10,055,046 | 12,637,172 | 15,651,402 | 17,758,345 | 21,253,728 | 19,017,905 | |||||||||||||||||||||||
| Net addition (reduction) in cash | (305,190) | (4,326,935) | (633,521) | 683,432 | 1,676,126 | (2,020,849) | 2,237,930 | 2,105,594 | 2,392,335 | (1,690,978) | 2,582,126 | 3,014,230 | 2,106,943 | 3,495,384 | (2,235,824) | 11,291,378 | |||||||||||||||||||||||
| Ending cash balance | $9,937,102 | 9,631,912 | 5,304,977 | 4,671,457 | 5,354,888 | 7,031,014 | 5,010,165 | 7,248,094 | 9,353,688 | 11,746,023 | 10,055,046 | 12,637,172 | 15,651,402 | 17,758,345 | 21,253,728 | 19,017,905 | 30,309,283 | ||||||||||||||||||||||
| Debt Schedule | |||||||||||||||||||||||||||||||||||||||
| ICON | |||||||||||||||||||||||||||||||||||||||
| Beginning Balance | $20,100,000 | $20,100,000 | $20,100,000 | $19,597,500 | $18,843,750 | $18,090,000 | $17,336,250 | $16,582,500 | $15,828,750 | $15,075,000 | $14,321,250 | 13,567,500 | 12,813,750 | 12,060,000 | $11,306,250 | 0 | |||||||||||||||||||||||
| Scheduled amortization | 0 | 0 | (502,500) | (753,750) | (753,750) | (753,750) | (753,750) | (753,750) | (753,750) | (753,750) | (753,750) | (753,750) | (753,750) | (753,750) | (11,306,250) | 0 | |||||||||||||||||||||||
| Ending balance | $20,100,000 | 20,100,000 | 20,100,000 | 19,597,500 | 18,843,750 | 18,090,000 | 17,336,250 | 16,582,500 | 15,828,750 | 15,075,000 | 14,321,250 | 13,567,500 | 12,813,750 | 12,060,000 | 11,306,250 | 0 | 0 | ||||||||||||||||||||||
| Interest | 12.75% | 640,688 | 640,688 | 640,688 | 624,670 | 600,645 | 576,619 | 552,593 | 528,567 | 504,541 | 480,516 | 456,490 | 432,464 | 408,438 | 384,413 | 1,441,547 | 0 | ||||||||||||||||||||||
| Existing RUS / USDA | |||||||||||||||||||||||||||||||||||||||
| Beginning Balance | 43,476,810 | 43,688,721 | 43,778,684 | 44,224,430 | 44,912,741 | 45,289,814 | 45,367,706 | 45,217,521 | 44,881,825 | 44,387,369 | 43,841,779 | 43,312,516 | 42,756,859 | 42,212,152 | 41,578,722 | 39,025,753 | |||||||||||||||||||||||
| Additions | 844,759 | 709,039 | 1,092,403 | 1,353,770 | 1,058,093 | 770,240 | 569,215 | 389,433 | 234,333 | 186,517 | 224,635 | 201,389 | 215,936 | 129,843 | 250,393 | 169,028 | |||||||||||||||||||||||
| Scheduled amortization | (632,848) | (619,075) | (646,657) | (665,460) | (681,020) | (692,347) | (719,401) | (725,128) | (728,789) | (732,107) | (753,898) | (757,045) | (760,644) | (763,273) | (2,803,362) | (2,897,734) | |||||||||||||||||||||||
| Ending balance | 43,476,810 | 43,688,721 | 43,778,684 | 44,224,430 | 44,912,741 | 45,289,814 | 45,367,706 | 45,217,521 | 44,881,825 | 44,387,369 | 43,841,779 | 43,312,516 | 42,756,859 | 42,212,152 | 41,578,722 | 39,025,753 | 36,297,047 | ||||||||||||||||||||||
| Interest | 3.25% | 353,249 | 354,971 | 355,702 | 359,323 | 364,916 | 367,980 | 368,613 | 367,392 | 364,665 | 360,647 | 356,214 | 351,914 | 347,399 | 342,974 | 1,351,308 | 1,268,337 | ||||||||||||||||||||||
| New RUS Project | |||||||||||||||||||||||||||||||||||||||
| Beginning Balance | 0 | 277,206 | 554,412 | 1,018,386 | 1,627,569 | 2,383,823 | 3,052,210 | 3,343,190 | 3,575,411 | 3,803,985 | 4,028,910 | 5,636,219 | 5,492,753 | ||||||||||||||||||||||||||
| Additions | 277,206 | 277,206 | 463,974 | 609,183 | 759,901 | 699,801 | 331,603 | 277,206 | 277,206 | 277,206 | 1,663,236 | 0 | 0 | ||||||||||||||||||||||||||
| Scheduled amortization | 0 | 0 | 0 | 0 | (3,647) | (31,414) | (40,622) | (44,985) | (48,633) | (52,280) | (55,928) | (143,466) | (143,466) | ||||||||||||||||||||||||||
| Ending balance | 277,206 | 554,412 | 1,018,386 | 1,627,569 | 2,383,823 | 3,052,210 | 3,343,190 | 3,575,411 | 3,803,985 | 4,028,910 | 5,636,219 | 5,492,753 | 5,349,286 | ||||||||||||||||||||||||||
| Interest | 3.52% | 0 | 2,439 | 4,879 | 8,962 | 14,323 | 20,978 | 26,859 | 29,420 | 31,464 | 33,475 | 35,454 | 49,599 | 48,336 | |||||||||||||||||||||||||
| �� | |||||||||||||||||||||||||||||||||||||||
| New Smart Build | |||||||||||||||||||||||||||||||||||||||
| Beginning Balance | 0 | 300,000 | 600,000 | 888,750 | 1,155,000 | 1,110,000 | 1,065,000 | 1,020,000 | 975,000 | 930,000 | 885,000 | 840,000 | 660,000 | ||||||||||||||||||||||||||
| Additions | 300,000 | 300,000 | 300,000 | 300,000 | 0 | 0 | 0 | 0 | 0 | 0 | 0 | 0 | 0 | ||||||||||||||||||||||||||
| Scheduled amortization | 0 | 0 | (11,250) | (33,750) | (45,000) | (45,000) | (45,000) | (45,000) | (45,000) | (45,000) | (45,000) | (180,000) | (180,000) | ||||||||||||||||||||||||||
| Ending balance | 300,000 | 600,000 | 888,750 | 1,155,000 | 1,110,000 | 1,065,000 | 1,020,000 | 975,000 | 930,000 | 885,000 | 840,000 | 660,000 | 480,000 | ||||||||||||||||||||||||||
| Interest | 12.75% | 0 | 9,563 | 19,125 | 28,329 | 36,816 | 35,381 | 33,947 | 32,513 | 31,078 | 29,644 | 28,209 | 26,775 | 21,038 | |||||||||||||||||||||||||
| Bond | |||||||||||||||||||||||||||||||||||||||
| Beginning Balance | 11,339,128 | 11,339,128 | 7,597,216 | 7,597,216 | 7,597,216 | 7,597,216 | 3,855,304 | 3,855,304 | 3,855,304 | 3,855,304 | 0 | 0 | 0 | 0 | 0 | 0 | |||||||||||||||||||||||
| Scheduled amortization | 0 | (3,741,912) | 0 | 0 | 0 | (3,741,912) | 0 | 0 | 0 | (3,855,304) | 0 | 0 | 0 | 0 | 0 | 0 | |||||||||||||||||||||||
| Ending balance | 11,339,128 | 11,339,128 | 7,597,216 | 7,597,216 | 7,597,216 | 7,597,216 | 3,855,304 | 3,855,304 | 3,855,304 | 3,855,304 | 0 | 0 | 0 | 0 | 0 | 0 | 0 | ||||||||||||||||||||||
| Interest | 10.00% | 566,956 | 379,861 | 379,861 | 192,765 | 192,765 | 0 | 0 | 0 | 0 | |||||||||||||||||||||||||||||
| Cobridge | |||||||||||||||||||||||||||||||||||||||
| Beginning Balance | 259,280 | 201,001 | 141,843 | 81,794 | 20,839 | 0 | 0 | 0 | 0 | 0 | 0 | 0 | 0 | 0 | 0 | 0 | |||||||||||||||||||||||
| Scheduled amortization | (58,279) | (59,158) | (60,049) | (60,955) | (20,839) | 0 | 0 | 0 | 0 | 0 | 0 | 0 | 0 | 0 | 0 | 0 | |||||||||||||||||||||||
| Ending balance | 259,280 | 201,001 | 141,843 | 81,794 | 20,839 | 0 | 0 | 0 | 0 | 0 | 0 | 0 | 0 | 0 | 0 | 0 | 0 | ||||||||||||||||||||||
| Interest | 6.00% | 3,889 | 3,015 | 2,128 | 1,227 | 313 | 0 | 0 | 0 | 0 | 0 | 0 | 0 | 0 | 0 | 0 | 0 | ||||||||||||||||||||||
| Reach | |||||||||||||||||||||||||||||||||||||||
| Beginning Balance | 249,531 | 209,588 | 168,941 | 127,579 | 85,489 | 42,659 | 0 | 0 | 0 | 0 | 0 | 0 | 0 | 0 | 0 | 0 | |||||||||||||||||||||||
| Scheduled amortization | (39,943) | (40,646) | (41,362) | (42,090) | (42,831) | (42,659) | 0 | 0 | 0 | 0 | 0 | 0 | 0 | 0 | 0 | 0 | |||||||||||||||||||||||
| Ending balance | 249,531 | 209,588 | 168,941 | 127,579 | 85,489 | 42,659 | 0 | 0 | 0 | 0 | 0 | 0 | 0 | 0 | 0 | 0 | 0 | ||||||||||||||||||||||
| Interest | 7.00% | 4,367 | 3,668 | 2,956 | 2,233 | 1,496 | 747 | 0 | 0 | 0 | 0 | 0 | 0 | 0 | 0 | 0 | 0 | ||||||||||||||||||||||
| Capital Leases& Other Notes | |||||||||||||||||||||||||||||||||||||||
| Beginning Balance | 460,653 | 322,106 | 228,879 | 168,512 | 128,170 | 97,299 | 71,172 | 49,997 | 39,497 | 30,344 | 20,957 | 11,144 | 5,282 | 2,167 | 188 | 0 | |||||||||||||||||||||||
| Scheduled amortization | (138,547) | (93,227) | (60,367) | (40,342) | (30,870) | (26,127) | (21,175) | (10,500) | (9,154) | (9,387) | (9,813) | (5,862) | (3,115) | (1,979) | (188) | 0 | |||||||||||||||||||||||
| Ending balance | 460,653 | 322,106 | 228,879 | 168,512 | 128,170 | 97,299 | 71,172 | 49,997 | 39,497 | 30,344 | 20,957 | 11,144 | 5,282 | 2,167 | 188 | 0 | 0 | ||||||||||||||||||||||
| Interest | 10.00% | 11,516 | 8,053 | 5,722 | 4,213 | 3,204 | 2,432 | 1,779 | 1,250 | 987 | 759 | 524 | 279 | 132 | 54 | 19 | 0 | ||||||||||||||||||||||
| Total cash interest expense | 1,013,709 | 1,577,350 | 1,007,195 | 1,371,527 | 982,575 | 1,351,642 | 960,276 | 1,141,113 | 926,553 | 1,095,493 | 875,161 | 847,199 | 819,089 | 791,104 | 2,869,248 | 1,337,711 | |||||||||||||||||||||||
| Interest income | 1.00% | 24,843 | 24,080 | 13,262 | 11,679 | 13,387 | 17,578 | 12,525 | 18,120 | 23,384 | 29,365 | 25,138 | 31,593 | 39,129 | 44,396 | 0 | 190,179 | ||||||||||||||||||||||
| Fixed Assets | |||||||||||||||||||||||||||||||||||||||
| Capex | |||||||||||||||||||||||||||||||||||||||
| Out-of-Pocket | $600,000 | 600,000 | 600,000 | 600,000 | 600,000 | 600,000 | 600,000 | 600,000 | 600,000 | 600,000 | 600,000 | 600,000 | 600,000 | 600,000 | 2,400,000 | 2,400,000 | |||||||||||||||||||||||
| PRIDE 1 | $1,000 | 225,378 | 210,411 | 282,560 | 311,232 | 244,251 | 171,925 | 138,870 | 121,408 | 103,306 | 90,950 | 73,902 | 58,865 | 77,939 | 49,301 | 105,063 | 48,085 | ||||||||||||||||||||||
| PRIDE 2 | $1,000 | 122,739 | 101,993 | 119,745 | 116,393 | 94,695 | 75,172 | 75,173 | 75,173 | 75,173 | 75,172 | 75,173 | 75,173 | 75,173 | 75,173 | 61,358 | 0 | ||||||||||||||||||||||
| PRIDE 3 | $1,000 | 246,642 | 146,635 | 440,099 | 676,145 | 719,148 | 523,142 | 355,173 | 192,852 | 55,854 | 20,394 | 75,560 | 67,351 | 62,824 | 5,369 | 83,973 | 120,943 | ||||||||||||||||||||||
| PRIDE core network | 250,000 | 250,000 | 250,000 | 250,000 | 0 | 0 | 0 | 0 | 0 | 0 | 0 | 0 | 0 | 0 | 0 | 0 | |||||||||||||||||||||||
| New RUS Project | 0 | 0 | 0 | 0 | 277,206 | 277,206 | 463,974 | 609,183 | 759,901 | 699,801 | 547,624 | 448,588 | 338,599 | 311,049 | 1,683,366 | 42,734 | |||||||||||||||||||||||
| Wichita Falls Smart Build | $1,435 | 114,599 | 107,560 | 113,222 | 5,661 | 5,661 | 5,661 | 5,661 | 5,661 | 5,661 | 5,661 | 5,661 | 5,661 | 5,661 | 5,661 | 22,644 | 22,644 | ||||||||||||||||||||||
| Amarillo Smart Build | $1,435 | 250,000 | 443,050 | 919,063 | 408,300 | 129,150 | 129,150 | 21,525 | 21,525 | 21,525 | 21,525 | 21,525 | 21,525 | 21,525 | 21,525 | 0 | 0 | ||||||||||||||||||||||
| Abilene Smart Build | $1,435 | 450,000 | 432,963 | 311,438 | 161,438 | 5,381 | 5,381 | 5,381 | 5,381 | 5,381 | 5,381 | 5,381 | 5,381 | 5,381 | 5,381 | 0 | 0 | ||||||||||||||||||||||
| Midland Smart Build | 0 | 0 | 0 | 75,000 | 108,750 | 118,221 | 149,002 | 144,266 | 35,516 | 1,184 | 1,184 | 1,184 | 1,184 | 1,184 | 1,184 | 1,184 | |||||||||||||||||||||||
| Odessa Smart Build | 0 | 0 | 0 | 0 | 75,000 | 108,750 | 118,221 | 149,002 | 144,266 | 35,516 | 1,184 | 1,184 | 1,184 | 1,184 | 1,184 | 1,184 | |||||||||||||||||||||||
| Wireless | 0 | 0 | 0 | 25,512 | 42,050 | 43,941 | 43,941 | 43,941 | 43,941 | 43,941 | 43,941 | 43,941 | 5,673 | 0 | 0 | 0 | |||||||||||||||||||||||
| Metro Tower upgrade | 55,056 | 45,481 | 155,321 | 125,000 | 125,000 | 112,500 | 87,500 | 79,167 | 62,500 | 62,500 | 0 | 0 | 0 | 0 | 0 | 0 | |||||||||||||||||||||||
| Total Capex | $3,309,512 | $4,360,593 | $3,895,612 | $8,847,569 | 20,413,286 | $3,732,690 | $8,227,012 | 2,314,414 | 2,338,092 | $3,191,446 | $2,754,681 | $2,426,291 | $2,171,050 | $2,064,420 | $2,047,559 | $1,913,024 | $1,662,026 | $1,451,136 | $1,328,853 | $1,195,143 | $1,075,827 | $4,358,771 | $2,636,774 | ||||||||||||||||
| Depreciation | Monthly dep. % | ||||||||||||||||||||||||||||||||||||||
| Electronics | 72.2% | 1.67% | 27,831 | 28,116 | 38,377 | 33,125 | 29,176 | 26,107 | 24,825 | 24,622 | 23,004 | 19,986 | 17,450 | 15,979 | 14,372 | 12,937 | 52,414 | 31,707 | |||||||||||||||||||||
| Fiber | 74.1% | 1.04% | 5,798 | 5,857 | 7,995 | 6,901 | 6,078 | 5,439 | 5,172 | 5,130 | 4,793 | 4,164 | 3,635 | 3,329 | 2,994 | 2,695 | 10,920 | 6,606 | |||||||||||||||||||||
| Real Estate | 3.8% | 0.21% | 183 | 185 | 253 | 218 | 192 | 172 | 163 | 162 | 151 | 132 | 115 | 105 | 95 | 85 | 345 | 209 | |||||||||||||||||||||
| Total | 33,812 | 34,158 | 46,625 | 40,244 | 35,447 | 31,718 | 30,160 | 29,914 | 27,948 | 24,281 | 21,200 | 19,414 | 17,460 | 15,717 | 63,679 | 38,522 | |||||||||||||||||||||||
| Depreciation and Amortization | |||||||||||||||||||||||||||||||||||||||
| Depreciation telecom equipment | 1,281,219 | 1,315,031 | 1,349,189 | 1,395,814 | 1,436,058 | 1,471,505 | 1,503,222 | 1,533,382 | 1,563,296 | 1,591,244 | 1,615,525 | 1,636,725 | 1,656,139 | 1,673,599 | 1,689,316 | 1,752,995 | 1,791,517 | ||||||||||||||||||||||
| Amortization | 73,143 | 73,326 | 73,509 | 73,693 | 73,877 | 74,062 | 74,247 | 74,432 | 74,618 | 74,805 | 74,992 | 75,179 | 75,367 | 75,556 | 75,745 | 75,934 | 76,124 | ||||||||||||||||||||||
| Depreciation expense | 328,767 | 329,589 | 330,413 | 331,239 | 332,067 | 332,897 | 333,729 | 334,564 | 335,400 | 336,239 | 337,079 | 337,922 | 338,767 | 339,614 | 340,463 | 341,314 | 342,167 | ||||||||||||||||||||||
| Total D&A | 1,717,945 | 1,753,111 | 1,800,745 | 1,842,002 | 1,878,463 | 1,911,198 | 1,942,378 | 1,973,314 | 2,002,287 | 2,027,596 | 2,049,827 | 2,070,273 | 2,088,769 | 2,105,524 | 2,170,243 | 2,209,808 | |||||||||||||||||||||||
| Additional debt amortization | |||||||||||||||||||||||||||||||||||||||
| 3Q 13 - 2Q 14 | 18 | years | 11,733 | 9,848 | 15,172 | 18,802 | |||||||||||||||||||||||||||||||||
| 3Q 14 - 2Q 15 | 17 | years | 15,560 | 11,327 | 8,371 | 5,727 | |||||||||||||||||||||||||||||||||
| 3Q 15 - 2Q 16 | 16 | years | 3,661 | 2,914 | 3,510 | 3,147 | |||||||||||||||||||||||||||||||||
| 3Q 16 - 4Q 17 | 15 | years | 3,599 | 2,164 | 16,693 | ||||||||||||||||||||||||||||||||||
| 2018 | 14 | years | 12,073 | ||||||||||||||||||||||||||||||||||||
| Cumulative debt amortization | 11,733 | 21,581 | 36,753 | 55,555 | 71,115 | 82,442 | 90,813 | 96,540 | 100,202 | 103,116 | 106,626 | 109,773 | 113,371 | 115,536 | 132,228 | 144,302 | |||||||||||||||||||||||
| Other Assumptions | |||||||||||||||||||||||||||||||||||||||
| Current assets | |||||||||||||||||||||||||||||||||||||||
| Accounts receivable (days receivable) | 28 | 28 | 28 | 28 | 28 | 28 | 28 | 28 | 28 | 28 | 28 | 28 | 28 | 28 | 28 | 28 | 28 | ||||||||||||||||||||||
| Prepaid expenses and other receivables as a % of revenue | 5.2% | 5.2% | 5.2% | 5.2% | 5.2% | 5.2% | 5.2% | 5.2% | 5.2% | 5.2% | 5.2% | 5.2% | 5.2% | 5.2% | 5.2% | 5.2% | 5.2% | ||||||||||||||||||||||
| Inventory as a % of revenue | 0.4% | 0.4% | 0.4% | 0.4% | 0.4% | 0.4% | 0.4% | 0.4% | 0.4% | 0.4% | 0.4% | 0.4% | 0.4% | 0.4% | 0.4% | 0.4% | 0.4% | ||||||||||||||||||||||
| Current liabilities | |||||||||||||||||||||||||||||||||||||||
| Trade payables (days) | 169 | 173 | 173 | 173 | 173 | 173 | 173 | 173 | 173 | 173 | 173 | 173 | 173 | 173 | 173 | 173 | 173 | ||||||||||||||||||||||
| Other liabilities and accrued expenses as a % of COGS | 17.2% | 17.8% | 17.8% | 17.8% | 17.8% | 17.8% | 17.8% | 17.8% | 17.8% | 17.8% | 17.8% | 17.8% | 17.8% | 17.8% | 17.8% | 17.8% | 17.8% | ||||||||||||||||||||||
| Taxes | |||||||||||||||||||||||||||||||||||||||
| Income before tax | 282,339 | 38,951 | 1,038,274 | 1,080,246 | 1,878,641 | 1,771,852 | 2,359,869 | 2,350,581 | 2,726,601 | 2,714,342 | 3,215,755 | 3,343,990 | 3,454,763 | 3,536,703 | 21,176,136 | 22,463,633 | |||||||||||||||||||||||
| Plus: non taxable items | 0 | 0 | 0 | 0 | 0 | 0 | 0 | 0 | 0 | 0 | 0 | 0 | 0 | 0 | 0 | 0 | |||||||||||||||||||||||
| Taxable Income before NOL | 282,339 | 38,951 | 1,038,274 | 1,080,246 | 1,878,641 | 1,771,852 | 2,359,869 | 2,350,581 | 2,726,601 | 2,714,342 | 3,215,755 | 3,343,990 | 3,454,763 | 3,536,703 | 21,176,136 | 22,463,633 | |||||||||||||||||||||||
| Utilization of Tax NOL | 282,339 | 38,951 | 1,038,274 | 1,080,246 | 1,878,641 | 1,771,852 | 2,359,869 | 2,350,581 | 2,726,601 | 2,714,342 | 3,215,755 | 3,343,990 | 85,823 | 0 | 0 | 0 | |||||||||||||||||||||||
| Net Adjusted Taxable Income | 0 | 0 | 0 | 0 | 0 | 0 | 0 | 0 | 0 | 0 | 0 | 0 | 3,368,941 | 3,536,703 | 21,176,136 | 22,463,633 | |||||||||||||||||||||||
| Tax Provision | 35.0% | 0 | 0 | 0 | 0 | 0 | 0 | 0 | 0 | 0 | 0 | 0 | 0 | 1,179,129 | 1,237,846 | 7,411,648 | 7,862,272 | ||||||||||||||||||||||
| Summary of estimated NOL carryforwards: | |||||||||||||||||||||||||||||||||||||||
| Beginning of period NOL carryforward | 22,887,263 | 22,604,924 | 22,565,973 | 21,527,699 | 20,447,453 | 18,568,812 | 16,796,960 | 14,437,091 | 12,086,510 | 9,359,909 | 6,645,567 | 3,429,812 | 85,823 | 0 | 0 | 0 | |||||||||||||||||||||||
| Additions | 0 | 0 | 0 | 0 | 0 | 0 | 0 | 0 | 0 | 0 | 0 | 0 | 0 | 0 | 0 | 0 | |||||||||||||||||||||||
| Subtractions | 282,339 | 38,951 | 1,038,274 | 1,080,246 | 1,878,641 | 1,771,852 | 5,769,013 | 2,359,869 | 2,350,581 | 2,726,601 | 2,714,342 | 10,151,392 | 3,215,755 | 3,343,990 | 85,823 | 0 | 6,645,567 | 0 | 0 | ||||||||||||||||||||
| End of period NOL carryforward | $22,887,263 | 22,604,924 | 22,565,973 | 21527698.9 | 20447452.59 | 18568811.7 | 16796959.72 | 14437090.69 | 12086510.06 | 9359909.428 | 6645567.451 | 3429812.277 | 85822.57539 | 0 | 0 | 0 | 0 | ||||||||||||||||||||||
9
| P&L Detail | ||||||||||||||||||||||||||||||||||||||
| 2011 | 2012 | 2013 | 2014 | 2015 | 2016 | 2017 | 2018 | |||||||||||||||||||||||||||||||
| Q1 | Q2 | Q3 | Q4 | Year | Q1 | Q2 | Q3 | Q4 | Year | Q1 | Q2 | Q3 | Q4 | Year | Q1 | Q2 | Q3 | Q4 | Year | Q1 | Q2 | Q3 | Q4 | Year | Q1 | Q2 | Q3 | Q4 | Year | |||||||||
| Fiber Revenue | ||||||||||||||||||||||||||||||||||||||
| NTS | $2,945,400 | $3,041,161 | $3,253,652 | $3,198,651 | $12,438,864 | $3,397,928 | $3,635,149 | $3,669,435 | $3,586,037 | $14,288,549 | $3,778,221 | $3,870,700 | $4,051,572 | $4,078,814 | $15,779,307 | $4,119,822 | $4,173,368 | $4,239,951 | $4,307,473 | $16,840,613 | $4,371,326 | $4,436,039 | $4,501,615 | $4,565,463 | $17,874,444 | $4,630,015 | $4,695,275 | $4,752,716 | $4,810,471 | $18,888,477 | $19,585,225 | $20,157,719 | ||||||
| Pride 1 | 0 | 0 | 76,739 | 195,529 | 272,268 | 351,201 | 467,371 | 653,451 | 825,749 | 2,297,772 | 951,875 | 1,046,786 | 1,149,293 | 1,253,319 | 4,401,273 | 1,372,609 | 1,514,479 | 1,657,079 | 1,760,165 | 6,304,332 | 1,838,744 | 1,906,958 | 1,966,621 | 2,018,717 | 7,731,041 | 2,057,102 | 2,086,357 | 2,113,795 | 2,139,154 | 8,396,407 | 8,668,523 | 8,786,933 | ||||||
| Pride 2 | 0 | 0 | 86,879 | 224,536 | 311,416 | 323,539 | 410,584 | 432,893 | 457,134 | 1,624,150 | 542,465 | 568,101 | 623,089 | 674,719 | 2,408,373 | 722,631 | 777,887 | 828,631 | 866,416 | 3,195,566 | 898,255 | 930,276 | 962,480 | 994,865 | 3,785,877 | 1,026,416 | 1,056,597 | 1,084,662 | 1,112,849 | 4,280,523 | 4,546,322 | 4,589,189 | ||||||
| Pride 3 | 0 | 0 | 0 | 0 | 0 | 0 | 0 | 0 | 0 | 0 | 0 | 16,310 | 89,082 | 182,649 | 288,042 | 316,735 | 535,822 | 795,186 | 1,031,642 | 2,679,385 | 1,207,360 | 1,329,607 | 1,406,691 | 1,456,720 | 5,400,378 | 1,508,871 | 1,571,475 | 1,634,512 | 1,688,014 | 6,402,872 | 6,946,912 | 7,276,270 | ||||||
| Smart Build | 0 | 0 | 0 | 0 | 0 | 0 | 0 | 0 | 9,144 | 9,144 | 73,591 | 150,722 | 209,189 | 299,692 | 733,194 | 492,582 | 715,184 | 869,582 | 970,286 | 3,047,634 | 1,060,822 | 1,136,584 | 1,217,822 | 1,293,748 | 4,708,976 | 1,352,463 | 1,399,215 | 1,446,886 | 1,495,474 | 5,694,038 | 6,068,111 | 6,144,231 | ||||||
| New RUS Projects | 0 | 0 | 0 | 0 | 0 | 0 | 0 | 0 | 0 | 0 | 0 | 0 | 0 | 0 | 0 | 0 | 0 | 0 | 0 | 0 | 22,653 | 85,247 | 168,312 | 266,411 | 542,622 | 342,125 | 394,433 | 426,431 | 451,409 | 1,614,398 | 1,886,102 | 1,945,072 | ||||||
| Total Fiber Revenue | 2,945,400 | 3,041,161 | 3,417,271 | 3,618,716 | 13,022,548 | 4,072,667 | 4,513,105 | 4,755,779 | 4,878,064 | 18,219,615 | 5,346,152 | 5,652,618 | 6,122,225 | 6,489,193 | 23,610,188 | 7,024,379 | 7,716,740 | 8,390,430 | 8,935,981 | 32,067,530 | 9,399,160 | 9,824,712 | 10,223,542 | 10,595,924 | 40,043,338 | 10,916,992 | 11,203,351 | 11,459,002 | 11,697,370 | 45,276,715 | 47,701,194 | 48,899,414 | ||||||
| Wireless Revenue | 0 | 0 | 0 | 0 | 0 | 0 | 0 | 0 | 0 | 0 | 0 | 0 | 0 | 0 | 0 | 0 | 9,567 | 34,903 | 67,149 | 111,619 | 100,105 | 133,061 | 166,017 | 198,972 | 598,155 | 231,928 | 264,884 | 283,489 | 285,617 | 1,065,918 | 1,142,466 | 1,142,466 | ||||||
| Non-Fiber Revenue | ||||||||||||||||||||||||||||||||||||||
| CLEC | 6,340,138 | 6,106,321 | 5,983,630 | 5,739,493 | 24,169,581 | 5,571,592 | 5,433,343 | 5,178,704 | 4,931,896 | 21,115,536 | 4,764,954 | 4,443,050 | 4,180,206 | 3,964,661 | 17,352,871 | 3,747,310 | 3,548,203 | 3,387,320 | 3,233,023 | 13,915,856 | 3,087,360 | 2,945,162 | 2,810,090 | 2,686,214 | 11,528,826 | 2,572,640 | 2,464,434 | 2,361,310 | 2,263,001 | 9,661,384 | 8,296,520 | 6,999,890 | ||||||
| Other | 4,847,218 | 4,884,184 | 5,212,211 | 5,201,010 | 20,144,623 | 5,311,503 | 5,302,033 | 5,291,598 | 5,238,037 | 21,143,170 | 4,668,578 | 4,989,372 | 4,854,792 | 4,799,069 | 19,311,811 | 4,744,288 | 4,690,428 | 4,637,469 | 4,585,389 | 18,657,574 | 4,534,170 | 4,483,793 | 4,434,239 | 4,385,490 | 17,837,692 | 4,337,530 | 4,290,340 | 4,243,906 | 4,198,210 | 17,069,986 | 16,430,475 | 15,738,108 | ||||||
| Total before reconciliation | 11,187,356 | 10,990,505 | 11,195,841 | 10,940,503 | 44,314,204 | 10,883,095 | 10,735,376 | 10,470,302 | 10,169,933 | 42,258,706 | 9,433,532 | 9,432,421 | 9,034,998 | 8,763,730 | 36,664,682 | 8,491,599 | 8,238,631 | 8,024,789 | 7,818,412 | 32,573,431 | 7,621,530 | 7,428,955 | 7,244,329 | 7,071,704 | 29,366,519 | 6,910,170 | 6,754,774 | 6,605,216 | 6,461,210 | 26,731,370 | 24,726,995 | 22,737,998 | ||||||
| Reconciliation adjustment | 124,462 | 67,490 | (11,470) | 140,599 | 321,082 | (31,933) | (163,922) | (300,035) | (111,964) | (607,853) | 156,552 | 101,145 | 0 | 0 | 257,697 | 0 | 0 | 0 | 0 | 0 | 0 | 0 | 0 | 0 | 0 | 0 | 0 | 0 | 0 | 0 | 0 | 0 | ||||||
| Total non-fiber revenue | 11,311,818 | 11,057,995 | 11,184,371 | 11,081,102 | 44,635,286 | 10,851,162 | 10,571,454 | 10,170,267 | 10,057,970 | 41,650,853 | 9,590,084 | 9,533,566 | 9,034,998 | 8,763,730 | 36,922,378 | 8,491,599 | 8,238,631 | 8,024,789 | 7,818,412 | 32,573,431 | 7,621,530 | 7,428,955 | 7,244,329 | 7,071,704 | 29,366,519 | 6,910,170 | 6,754,774 | 6,605,216 | 6,461,210 | 26,731,370 | 24,726,995 | 22,737,998 | ||||||
| Total Revenue | 14,257,218 | 14,099,156 | 14,601,642 | 14,699,818 | 57,657,834 | 14,923,829 | 15,084,559 | 14,926,046 | 14,936,034 | 59,870,468 | 14,936,236 | 15,186,185 | 15,157,223 | 15,252,923 | 60,532,567 | 15,515,978 | 15,964,938 | 16,450,122 | 16,821,543 | 64,752,580 | 17,120,795 | 17,386,728 | 17,633,888 | 17,866,601 | 70,008,011 | 18,059,090 | 18,223,009 | 18,347,707 | 18,444,197 | 73,074,003 | 73,570,656 | 72,779,878 | ||||||
| Variable Fiber COGS | ||||||||||||||||||||||||||||||||||||||
| NTS | 597,854 | 614,695 | 600,483 | 587,479 | 2,400,511 | 577,291 | 583,960 | 540,294 | 542,372 | 2,243,917 | 584,516 | 572,717 | 566,424 | 568,823 | 2,292,480 | 574,852 | 585,956 | 602,338 | 618,997 | 2,382,143 | 634,025 | 649,292 | 664,799 | 679,471 | 2,627,587 | 694,314 | 709,325 | 720,980 | 732,637 | 2,857,256 | 3,022,457 | 3,160,871 | ||||||
| Pride 1 | 0 | 0 | 27,680 | 66,489 | 94,169 | 112,839 | 150,674 | 187,572 | 226,665 | 677,751 | 277,988 | 302,810 | 320,477 | 349,775 | 1,251,051 | 381,845 | 418,006 | 452,238 | 477,231 | 1,729,321 | 497,066 | 513,679 | 528,085 | 541,011 | 2,079,841 | 552,055 | 560,683 | 569,423 | 577,650 | 2,259,811 | 2,350,385 | 2,388,782 | ||||||
| Pride 2 | 0 | 0 | 27,129 | 75,542 | 102,671 | 111,992 | 144,400 | 144,361 | 161,208 | 561,961 | 203,621 | 209,049 | 223,338 | 240,220 | 876,228 | 253,771 | 266,567 | 277,287 | 287,563 | 1,085,189 | 297,636 | 307,715 | 317,800 | 327,891 | 1,251,042 | 337,954 | 347,970 | 357,913 | 367,861 | 1,411,697 | 1,507,137 | 1,523,084 | ||||||
| Pride 3 | 0 | 0 | 0 | 0 | 0 | 0 | 0 | 0 | 0 | 0 | 0 | 573 | 5,020 | 12,418 | 18,012 | 38,626 | 104,253 | 192,165 | 269,942 | 604,986 | 324,152 | 356,683 | 368,710 | 369,461 | 1,419,006 | 372,321 | 378,185 | 383,123 | 384,211 | 1,517,840 | 1,535,095 | 1,553,392 | ||||||
| Smart Build | 0 | 0 | 0 | 0 | 0 | 0 | 0 | 0 | 296 | 296 | 2,634 | 5,298 | 7,163 | 10,262 | 25,356 | 16,867 | 24,489 | 29,775 | 33,224 | 104,354 | 36,324 | 38,918 | 41,699 | 44,299 | 161,240 | 46,310 | 47,911 | 49,543 | 51,207 | 194,970 | 207,778 | 210,385 | ||||||
| New RUS Projects | 0 | 0 | 0 | 0 | 0 | 0 | 0 | 0 | 0 | 0 | 0 | 0 | 0 | 0 | 0 | 0 | 0 | 0 | 0 | 0 | 3,043 | 15,737 | 39,927 | 66,635 | 125,341 | 85,627 | 98,154 | 104,506 | 105,453 | 393,739 | 422,084 | 428,885 | ||||||
| Total Variable Fiber COGS | 597,854 | 614,695 | 655,292 | 729,510 | 2,597,351 | 802,122 | 879,034 | 872,228 | 930,542 | 3,483,925 | 1,068,758 | 1,090,447 | 1,122,423 | 1,181,499 | 4,463,126 | 1,265,961 | 1,399,271 | 1,553,804 | 1,686,956 | 5,905,992 | 1,792,246 | 1,882,023 | 1,961,020 | 2,028,769 | 7,664,057 | 2,088,580 | 2,142,227 | 2,185,488 | 2,219,018 | 8,635,313 | 9,044,937 | 9,265,399 | ||||||
| Fixed Fiber COGS | 229,546 | 227,256 | 253,385 | 266,897 | 977,084 | 321,558 | 320,219 | 328,902 | 340,648 | 1,311,327 | 377,549 | 379,851 | 383,649 | 387,486 | 1,528,535 | 391,361 | 395,274 | 399,227 | 403,219 | 1,589,082 | 407,252 | 411,324 | 415,437 | 419,592 | 1,653,605 | 423,788 | 428,026 | 432,306 | 436,629 | 1,720,748 | 1,789,578 | 1,861,161 | ||||||
| Total Fiber COGS | 827,400 | 841,951 | 908,677 | 996,407 | 3,574,435 | 1,123,680 | 1,199,253 | 1,201,130 | 1,271,190 | 4,795,252 | 1,446,306 | 1,470,298 | 1,506,072 | 1,568,985 | 5,991,661 | 1,657,322 | 1,794,545 | 1,953,031 | 2,090,175 | 7,495,074 | 2,199,497 | 2,293,347 | 2,376,457 | 2,448,361 | 9,317,662 | 2,512,368 | 2,570,252 | 2,617,793 | 2,655,647 | 10,356,061 | 10,834,515 | 11,126,560 | ||||||
| Wireless COGS | 0 | 0 | 0 | 0 | 0 | 0 | 0 | 0 | 0 | 0 | 0 | 0 | 0 | 0 | 0 | 0 | 478 | 1,745 | 3,357 | 5,581 | 5,005 | 6,653 | 8,301 | 9,949 | 29,908 | 11,596 | 13,244 | 14,174 | 14,281 | 53,296 | 57,123 | 57,123 | ||||||
| Non Fiber COGS | ||||||||||||||||||||||||||||||||||||||
| Variable | 4,980,937 | 4,954,444 | 5,128,398 | 4,985,612 | 20,049,391 | 4,923,372 | 4,866,563 | 4,828,151 | 4,622,115 | 19,240,202 | 4,192,673 | 4,284,281 | 4,125,142 | 4,001,542 | 16,603,638 | 3,877,142 | 3,762,322 | 3,667,428 | 3,576,073 | 14,882,965 | 3,483,572 | 3,398,761 | 3,317,762 | 3,242,681 | 13,442,776 | 3,173,052 | 3,106,319 | 3,042,333 | 2,980,951 | 12,302,655 | 11,483,446 | 10,646,915 | ||||||
| Fixed | 881,573 | 826,328 | 829,302 | 817,283 | 3,354,486 | 856,756 | 750,078 | 703,359 | 702,374 | 3,012,567 | 677,258 | 640,647 | 634,241 | 627,898 | 2,580,044 | 621,619 | 615,403 | 609,249 | 603,157 | 2,449,428 | 597,125 | 591,154 | 585,242 | 579,390 | 2,352,911 | 573,596 | 567,860 | 562,181 | 556,560 | 2,260,197 | 2,169,789 | 2,082,997 | ||||||
| Reconciliatoin adjustment | 321,564 | 227,106 | 197,470 | 301,270 | 1,047,411 | 218,847 | 4,382 | 1,943 | 216,551 | 441,723 | 324,181 | 335,620 | 150,000 | 150,000 | 959,802 | 150,000 | 150,000 | 150,000 | 150,000 | 600,000 | 150,000 | 150,000 | 150,000 | 150,000 | 600,000 | 150,000 | 150,000 | 150,000 | 150,000 | 600,000 | 600,000 | 600,000 | ||||||
| Total Non-Fiber COGS | 6,184,075 | 6,007,878 | 6,155,170 | 6,104,165 | 24,451,288 | 5,998,974 | 5,621,023 | 5,533,454 | 5,541,040 | 22,694,491 | 5,194,112 | 5,260,548 | 4,909,382 | 4,779,441 | 20,143,483 | 4,648,761 | 4,527,725 | 4,426,677 | 4,329,229 | 17,932,393 | 4,230,697 | 4,139,915 | 4,053,004 | 3,972,071 | 16,395,687 | 3,896,648 | 3,824,179 | 3,754,514 | 3,687,510 | 15,162,852 | 14,253,235 | 13,329,912 | ||||||
| Total COGS | 7,011,475 | 6,849,829 | 7,063,847 | 7,100,572 | 28,025,723 | 7,122,654 | 6,820,276 | 6,734,583 | 6,812,230 | 27,489,743 | 6,640,418 | 6,730,847 | 6,415,454 | 6,348,425 | 26,135,145 | 6,306,083 | 6,322,749 | 6,381,454 | 6,422,762 | 25,433,048 | 6,435,199 | 6,439,915 | 6,437,763 | 6,430,380 | 25,743,257 | 6,420,612 | 6,407,676 | 6,386,482 | 6,357,438 | 25,572,208 | 25,144,873 | 24,513,595 | ||||||
| Sales & Marketing Expenses | ||||||||||||||||||||||||||||||||||||||
| Commission Expense | 58,062 | 49,735 | 5,757 | (39,370) | 74,184 | 14,775 | (131,662) | (1,053) | 68,457 | (49,484) | 150,359 | 51,324 | 55,588 | 58,920 | 316,192 | 63,780 | 70,066 | 76,183 | 81,137 | 291,166 | 85,342 | 89,206 | 92,827 | 96,209 | 363,584 | 99,124 | 101,724 | 104,045 | 106,209 | 411,102 | 433,116 | 443,996 | ||||||
| Wireless | 0 | 0 | 0 | 0 | 0 | 0 | 0 | 0 | 0 | 0 | 0 | 0 | 0 | 0 | 0 | 0 | 6,378 | 10,513 | 10,985 | 27,876 | 10,985 | 10,985 | 10,985 | 10,985 | 43,941 | 10,985 | 10,985 | 1,418 | 0 | 23,389 | 0 | 0 | ||||||
| Contract Labor | 0 | 0 | 200 | 1,910 | 2,110 | 446 | (446) | 0 | 0 | 0 | 0 | 0 | 0 | 0 | 0 | 0 | 0 | 0 | 0 | 0 | 0 | 0 | 0 | 0 | 0 | 0 | 0 | 0 | 0 | 0 | 0 | 0 | ||||||
| Employer 401(K) Expense | 4,091 | 3,763 | 4,197 | 3,569 | 15,619 | 3,804 | 3,608 | 4,701 | 3,880 | 15,994 | 3,212 | 3,115 | 3,162 | 3,210 | 12,699 | 3,258 | 3,307 | 3,356 | 3,406 | 13,327 | 3,458 | 3,509 | 3,562 | 3,615 | 14,144 | 3,670 | 3,725 | 3,781 | 3,837 | 15,012 | 15,012 | 15,012 | ||||||
| Insurance Expense Group | 58,782 | 54,667 | 56,798 | 56,021 | 226,269 | 53,931 | 70,066 | 50,070 | 44,534 | 218,601 | 43,763 | 47,445 | 48,157 | 48,879 | 188,245 | 49,612 | 50,357 | 51,112 | 51,879 | 202,960 | 52,657 | 53,447 | 54,248 | 55,062 | 215,414 | 55,888 | 56,726 | 57,577 | 58,441 | 228,633 | 228,633 | 228,633 | ||||||
| Salary Expense | 574,273 | 529,139 | 611,230 | 603,440 | 2,318,083 | 499,785 | 758,808 | 605,875 | 501,819 | 2,366,286 | 433,449 | 423,765 | 430,122 | 436,573 | 1,723,909 | 443,122 | 449,769 | 456,515 | 463,363 | 1,812,769 | 470,314 | 477,368 | 484,529 | 491,797 | 1,924,007 | 499,174 | 506,661 | 514,261 | 521,975 | 2,042,071 | 2,042,071 | 2,042,071 | ||||||
| Payroll Taxes | 63,910 | 41,972 | 48,945 | 46,189 | 201,016 | 90,429 | 36,420 | 45,793 | 35,875 | 208,517 | 32,220 | 34,110 | 34,622 | 35,141 | 136,093 | 35,668 | 36,203 | 36,746 | 37,298 | 145,916 | 37,857 | 38,425 | 39,001 | 39,586 | 154,870 | 40,180 | 40,783 | 41,395 | 42,015 | 164,373 | 164,373 | 164,373 | ||||||
| Total Payroll And Comissions | 759,118 | 679,277 | 727,128 | 671,759 | 2,837,281 | 663,170 | 736,793 | 705,386 | 654,565 | 2,759,914 | 663,003 | 559,760 | 571,651 | 582,724 | 2,377,138 | 595,440 | 616,080 | 634,426 | 648,068 | 2,494,013 | 660,613 | 672,941 | 685,153 | 697,255 | 2,715,961 | 709,021 | 720,604 | 722,477 | 732,478 | 2,884,581 | 2,883,205 | 2,894,085 | ||||||
| Total Other Expenses | 236,455 | 178,092 | 147,873 | 158,222 | 720,641 | 192,854 | 213,019 | 168,938 | 201,005 | 775,816 | 207,181 | 226,338 | 202,874 | 204,903 | 841,296 | 206,952 | 209,021 | 211,112 | 213,223 | 840,308 | 215,355 | 217,509 | 219,684 | 221,880 | 874,427 | 224,099 | 226,340 | 228,604 | 230,890 | 909,933 | 909,933 | 909,933 | ||||||
| Total Sales & Marketing | 995,573 | 857,369 | 875,000 | 829,980 | 3,557,922 | 856,024 | 949,812 | 874,324 | 855,570 | 3,535,730 | 870,184 | 786,098 | 774,525 | 787,627 | 3,218,434 | 802,392 | 825,101 | 845,537 | 861,291 | 3,334,321 | 875,968 | 890,449 | 904,837 | 919,135 | 3,590,389 | 933,120 | 946,945 | 951,081 | 963,368 | 3,794,513 | 3,793,138 | 3,804,018 | ||||||
| Genral & Administrative | ||||||||||||||||||||||||||||||||||||||
| Contract Labor | 54,100 | 70,877 | 61,916 | 57,830 | 244,723 | 19,456 | 28,641 | 29,296 | 26,284 | 103,678 | 26,384 | 39,385 | 30,641 | 30,947 | 96,410 | 31,257 | 31,569 | 31,885 | 32,204 | 126,915 | 32,526 | 32,851 | 33,180 | 33,511 | 132,068 | 33,847 | 34,185 | 34,527 | 34,872 | 137,430 | 137,430 | 137,430 | ||||||
| Employer 401(K) Expense | 12,802 | 13,564 | 12,724 | 11,365 | 50,454 | 10,799 | 11,603 | 10,015 | 8,272 | 40,689 | 8,400 | 6,958 | 8,495 | 8,580 | 32,434 | 8,666 | 8,753 | 8,840 | 8,929 | 35,188 | 9,018 | 9,108 | 9,199 | 9,291 | 36,617 | 9,384 | 9,478 | 9,573 | 9,669 | 38,104 | 38,104 | 38,104 | ||||||
| Insurance Expense Group | 194,182 | 209,049 | 200,238 | 202,895 | 806,363 | 190,581 | 243,723 | 180,015 | 155,945 | 770,264 | 157,493 | 193,382 | 173,426 | 175,160 | 699,461 | 176,912 | 178,681 | 180,468 | 182,272 | 718,332 | 184,095 | 185,936 | 187,795 | 189,673 | 747,499 | 191,570 | 193,486 | 195,421 | 197,375 | 777,851 | 777,851 | 777,851 | ||||||
| Salary Expense | 2,173,953 | 2,020,883 | 2,090,961 | 2,104,910 | 8,390,706 | 2,050,246 | 2,112,463 | 1,894,187 | 1,776,724 | 7,833,620 | 1,703,793 | 1,835,256 | 1,536,515 | 1,409,880 | 6,485,444 | 1,423,979 | 1,438,219 | 1,452,601 | 1,467,127 | 5,781,925 | 1,481,798 | 1,496,616 | 1,511,582 | 1,526,698 | 6,016,695 | 1,541,965 | 1,557,385 | 1,572,959 | 1,588,688 | 6,260,997 | 6,260,997 | 6,260,997 | ||||||
| Payroll Taxes | 152,467 | 169,395 | 141,470 | 129,333 | 592,665 | 244,197 | 103,636 | 169,461 | 111,735 | 629,028 | 113,164 | 159,813 | 139,928 | 141,328 | 554,233 | 142,741 | 144,168 | 145,610 | 147,066 | 579,586 | 148,537 | 150,022 | 151,522 | 153,038 | 603,119 | 154,568 | 156,114 | 157,675 | 159,252 | 627,608 | 627,608 | 627,608 | ||||||
| Total Payroll | 2,587,504 | 2,483,767 | 2,507,308 | 2,506,333 | 10,084,911 | 2,515,280 | 2,500,065 | 2,282,974 | 2,078,960 | 9,377,279 | 2,009,234 | 2,234,794 | 1,889,005 | 1,765,896 | 7,898,929 | 1,783,554 | 1,801,390 | 1,819,404 | 1,837,598 | 7,241,946 | 1,855,974 | 1,874,534 | 1,893,279 | 1,912,212 | 7,535,998 | 1,931,334 | 1,950,647 | 1,970,154 | 1,989,855 | 7,841,990 | 7,841,990 | 7,841,990 | ||||||
| Ins Exp Cas & Liability | 100,117 | 130,283 | 88,977 | 104,957 | 424,334 | 124,053 | 137,963 | 119,308 | 117,402 | 498,725 | 117,409 | 136,102 | 123,780 | 125,018 | 502,309 | 126,268 | 127,531 | 128,806 | 130,095 | 512,701 | 131,395 | 132,709 | 134,037 | 135,377 | 533,518 | 136,731 | 138,098 | 139,479 | 140,874 | 555,181 | 555,181 | 555,181 | ||||||
| Utilities | 132,852 | 147,914 | 152,099 | 138,038 | 570,903 | 187,203 | 162,824 | 195,066 | 158,066 | 703,159 | 154,706 | 181,786 | 174,130 | 175,872 | 686,494 | 177,630 | 179,407 | 181,201 | 183,013 | 721,250 | 184,843 | 186,691 | 188,558 | 190,444 | 750,536 | 192,348 | 194,272 | 196,214 | 198,176 | 781,010 | 781,010 | 781,010 | ||||||
| Repair & Maintenance | 56,641 | 96,553 | 46,016 | 66,509 | 265,718 | 60,911 | 80,820 | 70,024 | 48,512 | 260,267 | 30,716 | 45,122 | 49,079 | 49,570 | 174,488 | 50,066 | 50,567 | 51,072 | 51,583 | 203,288 | 52,099 | 52,620 | 53,146 | 53,677 | 211,542 | 54,214 | 54,756 | 55,304 | 55,857 | 220,131 | 220,131 | 220,131 | ||||||
| Total Utilities & Insurance | 289,610 | 374,750 | 287,091 | 309,504 | 1,260,954 | 372,168 | 381,606 | 384,398 | 323,980 | 1,462,151 | 302,831 | 363,009 | 346,990 | 350,460 | 1,363,291 | 353,965 | 357,504 | 361,079 | 364,690 | 1,437,238 | 368,337 | 372,020 | 375,741 | 379,498 | 1,495,596 | 383,293 | 387,126 | 390,997 | 394,907 | 1,556,323 | 1,556,323 | 1,556,323 | ||||||
| Rent Expense - Parking | 1,500 | 1,500 | 1,500 | 1,500 | 6,000 | 1,416 | 1,584 | 1,500 | 1,502 | 6,002 | 1,519 | 1,500 | 1,520 | 1,535 | 6,075 | 1,551 | 1,566 | 1,582 | 1,598 | 6,297 | 1,614 | 1,630 | 1,646 | 1,663 | 6,553 | 1,679 | 1,696 | 1,713 | 1,730 | 6,819 | 6,819 | 6,819 | ||||||
| Rental - Building | 318,599 | 308,091 | 320,860 | 324,956 | 1,272,506 | 292,249 | 342,174 | 322,114 | 322,561 | 1,279,097 | 327,175 | 315,067 | 324,947 | 328,196 | 1,295,386 | 331,478 | 334,793 | 338,141 | 341,522 | 1,345,934 | 344,937 | 348,387 | 351,871 | 355,389 | 1,400,584 | 358,943 | 362,533 | 366,158 | 369,820 | 1,457,453 | 1,457,453 | 1,457,453 | ||||||
| Rental Exp Equipment | 241,142 | 229,313 | 268,755 | 235,359 | 974,569 | 242,432 | 318,114 | 298,090 | 250,280 | 1,108,916 | 259,119 | 256,651 | 268,695 | 271,382 | 1,055,848 | 274,096 | 276,837 | 279,606 | 282,402 | 1,112,941 | 285,226 | 288,078 | 290,959 | 293,868 | 1,158,130 | 296,807 | 299,775 | 302,773 | 305,800 | 1,205,155 | 1,205,155 | 1,205,155 | ||||||
| Total Rental & Leases | 561,240 | 538,903 | 591,115 | 561,815 | 2,253,074 | 536,097 | 661,872 | 621,703 | 574,343 | 2,394,015 | 587,814 | 573,219 | 595,162 | 601,114 | 2,357,308 | 607,125 | 613,196 | 619,328 | 625,522 | 2,465,171 | 631,777 | 638,095 | 644,476 | 650,920 | 2,565,267 | 657,429 | 664,004 | 670,644 | 677,350 | 2,669,427 | 2,669,427 | 2,669,427 | ||||||
| Total Legal & Accounting | 106,209 | 119,316 | 111,805 | 77,116 | 414,447 | 115,715 | 97,945 | 83,814 | 155,123 | 452,596 | 200,927 | 164,851 | 152,691 | 154,217 | 672,687 | 155,760 | 157,317 | 158,890 | 160,479 | 632,447 | 162,084 | 163,705 | 165,342 | 166,995 | 658,127 | 168,665 | 170,352 | 172,056 | 173,776 | 684,849 | 684,849 | 684,849 | ||||||
| Bad Debt Expense | 112,763 | 160,308 | 142,651 | 165,845 | 581,567 | 126,612 | 129,207 | 110,906 | 195,469 | 562,194 | 200,410 | 1,159,144 | 227,358 | 228,794 | 1,815,706 | 232,740 | 239,474 | 246,752 | 252,323 | 971,289 | 256,812 | 260,801 | 264,508 | 267,999 | 1,050,120 | 270,886 | 273,345 | 275,216 | 276,663 | 1,096,110 | 1,103,560 | 1,091,698 | ||||||
| Advertising | 14,399 | 9,412 | 1,476 | 570 | 25,858 | 1,400 | (1,060) | 140 | 132 | 612 | 83 | (231) | 31 | 32 | (85) | 32 | 32 | 33 | 33 | 130 | 33 | 34 | 34 | 34 | 135 | 35 | 35 | 35 | 36 | 140 | 140 | 140 | ||||||
| Auto Expense | 57,153 | 55,243 | 77,810 | 80,776 | 270,982 | 59,999 | 86,940 | 59,843 | 58,306 | 265,089 | 59,776 | 58,134 | 59,605 | 60,201 | 237,717 | 60,803 | 61,411 | 62,025 | 62,646 | 246,885 | 63,272 | 63,905 | 64,544 | 65,189 | 256,910 | 65,841 | 66,500 | 67,164 | 67,836 | 267,341 | 267,341 | 267,341 | ||||||
| Collection Fees | 1,302 | 966 | 918 | 5,007 | 8,193 | 21,800 | (626) | 10,694 | 14,703 | 46,571 | 11,266 | 10,894 | 12,008 | 12,128 | 46,297 | 12,250 | 12,372 | 12,496 | 12,621 | 49,738 | 12,747 | 12,874 | 13,003 | 13,133 | 51,758 | 13,265 | 13,397 | 13,531 | 13,667 | 53,860 | 53,860 | 53,860 | ||||||
| Business Meals | 9,774 | 2,651 | 8,806 | 6,987 | 28,218 | 15 | (57) | 251 | 366 | 575 | 267 | 187 | 270 | 273 | 998 | 276 | 279 | 281 | 284 | 1,120 | 287 | 290 | 293 | 296 | 1,166 | 299 | 302 | 305 | 308 | 1,213 | 1,213 | 1,213 | ||||||
| Computer Expense | 151,308 | 152,431 | 149,943 | 138,192 | 591,874 | 138,544 | 164,005 | 245,307 | 290,188 | 838,044 | 314,674 | 456,381 | 555,000 | 680,550 | 2,006,605 | 687,356 | 694,229 | 701,171 | 708,183 | 2,790,939 | 715,265 | 722,418 | 729,642 | 736,938 | 2,904,262 | 744,308 | 751,751 | 759,268 | 766,861 | 3,022,187 | 3,022,187 | 3,022,187 | ||||||
| Custodial Services | 18,796 | 18,517 | 18,806 | 19,845 | 75,965 | 17,835 | 18,068 | 17,467 | 14,468 | 67,839 | 16,079 | 15,024 | 15,917 | 16,076 | 63,097 | 16,237 | 16,400 | 16,564 | 16,729 | 65,930 | 16,897 | 17,065 | 17,236 | 17,408 | 68,607 | 17,583 | 17,758 | 17,936 | 18,115 | 71,392 | 71,392 | 71,392 | ||||||
| Bank Charges | 0 | 0 | 0 | 0 | 0 | 909 | (409) | 118 | 39 | 657 | 0 | 0 | 40 | 40 | 80 | 40 | 41 | 41 | 42 | 164 | 42 | 43 | 43 | 43 | 171 | 44 | 44 | 45 | 45 | 178 | 178 | 178 | ||||||
| Provision For Disputes | 0 | 0 | 0 | 0 | 0 | 0 | 0 | 0 | 0 | 0 | 0 | 0 | 0 | 0 | 0 | 0 | 0 | 0 | 0 | 0 | 0 | 0 | 0 | 0 | 0 | 0 | 0 | 0 | 0 | 0 | 0 | 0 | ||||||
| Director Fees & Expense | 27,000 | (11,100) | 30,122 | 12,386 | 58,408 | 134 | 6,000 | 13,867 | 13,867 | 33,867 | 13,867 | 11,522 | 13,413 | 13,547 | 52,349 | 13,683 | 13,820 | 13,958 | 14,097 | 55,558 | 14,238 | 14,381 | 14,525 | 14,670 | 57,813 | 14,816 | 14,965 | 15,114 | 15,265 | 60,161 | 60,161 | 60,161 | ||||||
| Dues & Subscriptions | 8,724 | 7,538 | 7,653 | 2,801 | 26,716 | 3,915 | 12,164 | 5,236 | 5,115 | 26,430 | 6,064 | 6,392 | 5,759 | 5,817 | 24,032 | 5,875 | 5,933 | 5,993 | 6,053 | 23,854 | 6,113 | 6,174 | 6,236 | 6,299 | 24,822 | 6,361 | 6,425 | 6,489 | 6,554 | 25,830 | 25,830 | 25,830 | ||||||
| Engineering Fees | 480 | 2,888 | 2,912 | 3,242 | 9,522 | 3,898 | (146) | 1,672 | 2,299 | 7,723 | 2,454 | 608 | 1,776 | 1,794 | 6,632 | 1,812 | 1,830 | 1,848 | 1,867 | 7,356 | 1,885 | 1,904 | 1,923 | 1,942 | 7,655 | 1,962 | 1,981 | 2,001 | 2,021 | 7,966 | 7,966 | 7,966 | ||||||
| Entertainment & Promo | 3,882 | 3,376 | 2,609 | 9,223 | 19,090 | 8,837 | (1,769) | 3,352 | 10,488 | 20,908 | 8,665 | 10,707 | 8,386 | 8,470 | 36,227 | 8,555 | 8,640 | 8,726 | 8,814 | 34,735 | 8,902 | 8,991 | 9,081 | 9,172 | 36,145 | 9,263 | 9,356 | 9,450 | 9,544 | 37,613 | 37,613 | 37,613 | ||||||
| Freight Expense | 6,874 | 8,635 | 13,769 | 8,745 | 38,023 | 9,244 | 7,158 | 6,786 | 5,291 | 28,479 | 4,650 | 11,485 | 7,123 | 7,195 | 30,453 | 7,267 | 7,339 | 7,413 | 7,487 | 29,505 | 7,562 | 7,637 | 7,714 | 7,791 | 30,703 | 7,869 | 7,947 | 8,027 | 8,107 | 31,950 | 31,950 | 31,950 | ||||||
| Internet Expense | 1,500 | 1,500 | 1,500 | 1,500 | 6,000 | 1,416 | 3,998 | 5,241 | 11,941 | 22,596 | 11,631 | 13,195 | 10,607 | 10,713 | 46,146 | 10,820 | 10,928 | 11,038 | 11,148 | 43,934 | 11,260 | 11,372 | 11,486 | 11,601 | 45,718 | 11,717 | 11,834 | 11,952 | 12,072 | 47,575 | 47,575 | 47,575 | ||||||
| Licenses & Fees | 35,297 | 28,654 | 32,757 | 42,772 | 139,479 | 34,749 | 39,091 | 52,554 | 45,848 | 172,242 | 43,586 | 64,291 | 52,086 | 52,606 | 212,569 | 53,132 | 53,664 | 54,200 | 54,742 | 215,739 | 55,290 | 55,843 | 56,401 | 56,965 | 224,499 | 57,535 | 58,110 | 58,691 | 59,278 | 233,615 | 233,615 | 233,615 | ||||||
| Management Service Fee | 8,846 | 9,147 | 6,453 | 9,740 | 34,187 | 8,298 | 9,992 | 9,284 | 9,604 | 37,179 | 10,006 | 8,659 | 9,482 | 9,577 | 37,723 | 9,673 | 9,769 | 9,867 | 9,966 | 39,275 | 10,065 | 10,166 | 10,268 | 10,370 | 40,869 | 10,474 | 10,579 | 10,685 | 10,791 | 42,529 | 42,529 | 42,529 | ||||||
| Miscellaneous Expense | 35,812 | 133,406 | 80,702 | 64,122 | 314,042 | 49,075 | 84,561 | 64,739 | 77,972 | 276,347 | 64,930 | 130,895 | 85,481 | 86,335 | 367,641 | 87,199 | 88,071 | 88,951 | 89,841 | 354,062 | 90,739 | 91,647 | 92,563 | 93,489 | 368,438 | 94,424 | 95,368 | 96,322 | 97,285 | 383,398 | 383,398 | 383,398 | ||||||
| Moving Expenses | 0 | 0 | 0 | 3,812 | 3,812 | 0 | 1,149 | 0 | 0 | 1,149 | 0 | 0 | 0 | 0 | 0 | 0 | 0 | 0 | 0 | 0 | 0 | 0 | 0 | 0 | 0 | 0 | 0 | 0 | 0 | 0 | 0 | 0 | ||||||
| Office Suppl & Postage | 95,629 | 93,811 | 92,641 | 81,007 | 363,087 | 91,419 | 107,723 | 86,155 | 8,778 | 294,075 | 34,501 | 25,167 | 39,037 | 39,427 | 138,131 | 39,821 | 40,219 | 40,622 | 41,028 | 161,690 | 41,438 | 41,853 | 42,271 | 42,694 | 168,256 | 43,121 | 43,552 | 43,987 | 44,427 | 175,087 | 175,087 | 175,087 | ||||||
| Office Relocation Exp | 7,097 | 1,241 | 0 | 0 | 8,338 | 0 | 0 | 0 | 0 | 0 | 0 | 0 | 0 | 0 | 0 | 0 | 0 | 0 | 0 | 0 | 0 | 0 | 0 | 0 | 0 | 0 | 0 | 0 | 0 | 0 | 0 | 0 | ||||||
| Supplies | 11,656 | 4,011 | 43,715 | 29,574 | 88,956 | 35,151 | 27,198 | 15,532 | 25,925 | 103,806 | 27,019 | 46,121 | 28,936 | 29,225 | 131,300 | 29,517 | 29,812 | 30,110 | 30,412 | 119,852 | 30,716 | 31,023 | 31,333 | 31,646 | 124,718 | 31,963 | 32,283 | 32,605 | 32,931 | 129,782 | 129,782 | 129,782 | ||||||
| Taxes Other | 0 | 22,747 | 21,833 | 25,561 | 70,141 | 19,132 | 22,379 | 25,373 | 39,440 | 106,325 | 26,906 | 21,582 | 28,608 | 28,894 | 105,990 | 29,183 | 29,475 | 29,770 | 30,068 | 118,496 | 30,368 | 30,672 | 30,979 | 31,289 | 123,308 | 31,601 | 31,917 | 32,237 | 32,559 | 128,315 | 128,315 | 128,315 | ||||||
| Taxes Property | 0 | 0 | 0 | 0 | 0 | 0 | 0 | 0 | 0 | 0 | 0 | 0 | 0 | 0 | 0 | 0 | 0 | 0 | 0 | 0 | 0 | 0 | 0 | 0 | 0 | 0 | 0 | 0 | 0 | 0 | 0 | 0 | ||||||
| Taxes Franchise | 21,117 | 0 | 0 | 1,395 | 22,511 | (1,623) | 1,050 | 0 | 0 | (573) | 0 | 0 | 0 | 0 | 0 | 0 | 0 | 0 | 0 | 0 | 0 | 0 | 0 | 0 | 0 | 0 | 0 | 0 | 0 | 0 | 0 | 0 | ||||||
| Telephone Expense | 27,560 | 23,086 | 27,114 | 27,045 | 104,806 | 29,439 | 31,919 | 32,842 | 33,309 | 127,509 | 32,266 | 34,645 | 33,598 | 33,934 | 134,443 | 34,273 | 34,616 | 34,962 | 35,312 | 139,164 | 35,665 | 36,022 | 36,382 | 36,746 | 144,814 | 37,113 | 37,484 | 37,859 | 38,238 | 150,694 | 150,694 | 150,694 | ||||||
| Training Expense | 1,015 | 0 | 1,061 | 6,499 | 8,575 | (846) | (3,552) | 27,723 | 17,737 | 41,062 | 26,605 | 20,208 | 23,299 | 23,532 | 93,644 | 23,767 | 24,005 | 24,245 | 24,487 | 96,504 | 24,732 | 24,980 | 25,229 | 25,482 | 100,423 | 25,736 | 25,994 | 26,254 | 26,516 | 104,500 | 104,500 | 104,500 | ||||||
| Travel | 36,331 | 49,317 | 40,729 | 44,006 | 170,383 | 41,595 | 61,621 | 58,508 | 54,367 | 216,091 | 47,352 | 54,765 | 54,285 | 54,828 | 211,231 | 55,377 | 55,930 | 56,490 | 57,055 | 224,851 | 57,625 | 58,201 | 58,783 | 59,371 | 233,981 | 59,965 | 60,565 | 61,170 | 61,782 | 243,482 | 243,482 | 243,482 | ||||||
| Stock Option Comp | 82,996 | 58,631 | 24,567 | 234,191 | 400,385 | 40,530 | 38,616 | 64,389 | 139,900 | 283,435 | 53,085 | 119,217 | 119,217 | 119,217 | 410,736 | 119,217 | 119,217 | 119,217 | 119,217 | 476,868 | 119,217 | 119,217 | 119,217 | 119,217 | 476,868 | 119,217 | 119,217 | 119,217 | 119,217 | 476,868 | 476,868 | 476,868 | ||||||
| Admin Expenses Of Amarillo Project | 0 | 0 | 0 | 0 | 0 | 0 | 0 | 0 | 0 | 0 | 0 | 0 | 0 | 0 | 0 | 0 | 0 | 0 | 0 | 0 | 0 | 0 | 0 | 0 | 0 | 0 | 0 | 0 | 0 | 0 | 0 | 0 | ||||||
| Admin Expenses Of Abilene Project | 0 | 0 | 0 | 0 | 0 | 0 | 0 | 0 | 0 | 0 | 0 | 0 | 0 | 0 | 0 | 0 | 0 | 0 | 0 | 0 | 0 | 0 | 0 | 0 | 0 | 0 | 0 | 0 | 0 | 0 | 0 | 0 | ||||||
| Total Other Expenses | 664,549 | 676,106 | 687,896 | 858,999 | 2,887,551 | 614,865 | 716,016 | 807,072 | 880,084 | 3,018,036 | 815,733 | 1,119,848 | 1,163,965 | 1,294,412 | 4,393,957 | 1,306,164 | 1,318,034 | 1,330,022 | 1,342,130 | 5,296,349 | 1,354,359 | 1,366,710 | 1,379,185 | 1,391,785 | 5,492,039 | 1,404,511 | 1,417,364 | 1,430,345 | 1,443,456 | 5,695,676 | 5,695,676 | 5,695,676 | ||||||
| Total G&A | 4,321,875 | 4,353,150 | 4,327,865 | 4,479,613 | 17,482,504 | 4,280,736 | 4,486,710 | 4,290,866 | 4,207,958 | 17,266,271 | 4,116,949 | 5,614,866 | 4,375,171 | 4,394,893 | 18,501,879 | 4,439,308 | 4,486,916 | 4,535,476 | 4,582,742 | 18,044,441 | 4,629,343 | 4,675,865 | 4,722,531 | 4,769,409 | 18,797,148 | 4,816,119 | 4,862,838 | 4,909,411 | 4,956,008 | 19,544,375 | 19,551,825 | 19,539,963 | ||||||
| Total SG&A | 5,317,448 | 5,210,519 | 5,202,866 | 5,309,593 | 21,040,426 | 5,136,760 | 5,436,522 | 5,165,190 | 5,063,528 | 20,802,001 | 4,987,133 | 6,400,964 | 5,149,697 | 5,182,520 | 21,720,313 | 5,241,700 | 5,312,017 | 5,381,013 | 5,444,032 | 21,378,761 | 5,505,310 | 5,566,314 | 5,627,368 | 5,688,544 | 22,387,536 | 5,749,239 | 5,809,782 | 5,860,492 | 5,919,376 | 23,338,889 | 23,344,963 | 23,343,981 | ||||||
| Growth | ||||||||||||||||||||||||||||||||||||||
| Fiber revenue | 3.3% | 12.4% | 5.9% | 12.5% | 10.8% | 5.4% | 2.6% | 9.6% | 5.7% | 8.3% | 6.0% | 29.6% | 8.2% | 9.9% | 8.7% | 6.5% | 35.8% | 5.2% | 4.5% | 4.1% | 3.6% | 24.9% | 3.0% | 2.6% | 2.3% | 2.1% | 13.1% | 5.4% | 2.5% | |||||||||
| Non Fiber revenue | -2.2% | 1.1% | -0.9% | -2.1% | -2.6% | -3.8% | -1.1% | -4.7% | -0.6% | -5.2% | -3.0% | -11.4% | -3.1% | -3.0% | -2.6% | -2.6% | -11.8% | -2.5% | -2.5% | -2.5% | -2.4% | -9.8% | -2.3% | -2.2% | -2.2% | -2.2% | -9.0% | -7.5% | -8.0% | |||||||||
| Total | -1.1% | 3.6% | 0.7% | 1.5% | 1.1% | -1.1% | 0.1% | 0.0% | 1.7% | -0.2% | 0.6% | 1.7% | 2.9% | 3.0% | 2.3% | 1.8% | 1.6% | 1.4% | 1.3% | 1.1% | 0.9% | 0.7% | 0.5% | 0.7% | -1.1% | |||||||||||||
| Total Sales and Marketing as a % of revenue | 7.0% | 6.1% | 6.0% | 5.6% | 6.2% | 5.7% | 6.3% | 5.9% | 5.7% | 5.9% | 5.8% | 5.2% | 5.1% | 5.2% | 5.3% | 5.2% | 5.2% | 5.1% | 5.1% | 5.1% | 5.1% | 5.1% | 5.1% | 5.1% | 5.1% | 5.2% | 5.2% | 5.2% | 5.2% | 5.2% | 5.2% | 5.2% | ||||||
| Private Line Revenue | ||||||||||||||||||||||||||||||||||||||
| Fiber | 291 | 1,009 | 80,485 | 17,333 | 99,117 | 69,265 | 188,118 | 253,112 | 136,888 | 647,384 | 267,420 | 350,396 | 497,097 | 507,039 | 1,621,952 | 517,180 | 527,523 | 538,074 | 548,835 | 2,131,612 | 559,812 | 571,008 | 582,428 | 594,077 | 2,307,325 | 605,958 | 618,078 | 630,439 | 643,048 | 2,497,523 | ||||||||
| Non Fiber | 2,844,888 | 2,937,663 | 2,973,746 | 2,994,592 | 11,750,889 | 2,875,911 | 2,706,897 | 2,706,989 | 2,944,299 | 11,234,096 | 2,763,634 | 2,651,233 | 2,624,720 | 2,598,473 | 10,638,061 | 2,572,488 | 2,546,764 | 2,521,296 | 2,496,083 | 10,136,631 | 2,471,122 | 2,446,411 | 2,421,947 | 2,397,727 | 9,737,207 | 2,373,750 | 2,350,013 | 2,326,512 | 2,303,247 | 9,353,523 | ||||||||
| 2,845,179 | 2,938,672 | 3,054,230 | 3,011,925 | 11,850,006 | 2,945,176 | 2,895,015 | 2,960,101 | 3,081,187 | 11,881,480 | 3,031,054 | 3,001,629 | 3,121,817 | 3,105,512 | 12,260,013 | 3,089,668 | 3,074,287 | 3,059,370 | 3,044,918 | 12,268,243 | 3,030,934 | 3,017,419 | 3,004,375 | 2,991,804 | 12,044,533 | 2,979,709 | 2,968,090 | 2,956,952 | 2,946,295 | 11,851,046 | |||||||||
10
| NTS Fiber Billing Summary | ||||||||||||||||||||||||||||
| Case 2 | A C T U A L | P R O J E C T E D | ||||||||||||||||||||||||||
| Q1 2011 | Q2 2011 | Q3 2011 | Q4 2011 | Q1 2012 | Q2 2012 | Q3 2012 | Q4 2012 | Q1 2013 | Q2 2013 | Q3 2013 | Q4 2013 | Q1 2014 | Q2 2014 | Q3 2014 | Q4 2014 | Q1 2015 | Q2 2015 | Q3 2015 | Q4 2015 | Q1 2016 | Q2 2016 | Q3 2016 | Q4 2016 | 2017 | 2018 | |||
| Gross Fiber Business | $1,801,965 | $1,862,533 | $2,022,291 | $2,083,533 | $2,268,515 | $2,431,899 | $2,499,819 | $2,648,921 | $2,793,006 | $2,927,366 | $3,172,874 | $3,406,335 | $3,756,037 | $4,148,058 | $4,463,524 | $4,695,439 | $4,910,789 | $5,125,789 | $5,339,840 | $5,554,471 | $5,733,834 | $5,891,355 | $6,042,520 | $6,200,234 | $25,294,886 | $25,876,912 | ||
| Count | 1,704 | 1,732 | 1,816 | 1,892 | 2,007 | 2,083 | 2,252 | 2,452 | 2,707 | 2,898 | 3,183 | 3,574 | 4,162 | 4,645 | 4,888 | 5,072 | 5,257 | 5,428 | 5,610 | 5,764 | 5,873 | 5,974 | 6,070 | 6,177 | 6,316 | 6,464 | ||
| ARPU | $348 | $361 | $380 | $375 | $388 | $396 | $384 | $375 | $361 | $348 | $348 | $336 | $324 | $314 | $312 | $314 | $317 | $320 | $323 | $326 | $328 | $332 | $334 | $338 | $337 | $337 | ||
| Passings | 3,463 | 3,463 | 3,899 | 4,077 | 4,217 | 4,464 | 5,011 | 5,491 | 6,241 | 8,320 | 9,943 | 12,390 | 12,390 | 12,390 | 12,390 | 12,830 | 13,466 | 13,466 | 13,466 | 13,466 | 13,466 | 13,466 | 13,466 | 13,466 | 13,466 | 13,466 | ||
| Take Rate | 49% | 50% | 47% | 46% | 48% | 47% | 45% | 45% | 43% | 35% | 32% | 29% | 34% | 37% | 39% | 40% | 39% | 40% | 42% | 43% | 44% | 44% | 45% | 46% | 47% | 48% | ||
| Gross Fiber Residential | $1,143,144 | $1,177,619 | $1,314,496 | $1,517,851 | $1,734,887 | $1,893,087 | $2,002,848 | $2,092,255 | $2,285,726 | $2,374,856 | $2,452,254 | $2,575,818 | $2,751,162 | $3,041,158 | $3,388,832 | $3,691,707 | $3,928,558 | $4,127,914 | $4,301,274 | $4,447,376 | $4,577,199 | $4,693,919 | $4,786,043 | $4,854,088 | $19,783,909 | $20,268,982 | ||
| Count | 4,313 | 4,366 | 4,796 | 5,375 | 6,041 | 6,444 | 6,852 | 7,008 | 7,686 | 7,894 | 8,178 | 8,486 | 9,126 | 10,135 | 11,138 | 11,920 | 12,546 | 13,098 | 13,555 | 13,939 | 14,305 | 14,607 | 14,873 | 15,028 | 15,448 | 15,789 | ||
| ARPU | $90 | $90 | $96 | $99 | $101 | $101 | $100 | $101 | $104 | $102 | $102 | $103 | $104 | $105 | $106 | $107 | $107 | $107 | $108 | $108 | $108 | $108 | $108 | $108 | $108 | $108 | ||
| Passings | 22,390 | 22,390 | 28,086 | 29,671 | 30,954 | 33,248 | 36,328 | 38,935 | 38,935 | 38,935 | 44,387 | 50,134 | 50,134 | 50,134 | 50,134 | 50,134 | 52,677 | 52,677 | 52,677 | 52,677 | 52,677 | 52,677 | 52,677 | 52,677 | 52,677 | 52,677 | ||
| Take Rate | 19% | 19% | 17% | 18% | 20% | 19% | 19% | 18% | 20% | 20% | 18% | 17% | 18% | 20% | 22% | 24% | 24% | 25% | 26% | 26% | 27% | 28% | 28% | 29% | 29% | 30% | ||
| Gross Fiber Wholesale | $291 | $1,009 | $80,485 | $17,333 | $69,265 | $188,118 | $253,112 | $136,888 | $267,420 | $350,396 | $497,097 | $507,039 | $517,180 | $527,523 | $538,074 | $548,835 | $559,812 | $571,008 | $582,428 | $594,077 | $605,958 | $618,078 | $630,439 | $643,048 | $2,622,399 | $2,753,519 | ||
| Gross Fiber Totals | $2,945,400 | $3,041,161 | $3,417,271 | $3,618,716 | $4,072,667 | $4,513,105 | $4,755,779 | $4,878,064 | $5,346,152 | $5,652,618 | $6,122,225 | $6,489,193 | $7,024,379 | $7,716,740 | $8,390,430 | $8,935,981 | $9,399,160 | $9,824,712 | $10,223,542 | $10,595,924 | $10,916,992 | $11,203,351 | $11,459,002 | $11,697,370 | $47,701,194 | $48,899,414 | ||
| Count | 6,017 | 6,098 | 6,612 | 7,267 | 8,048 | 8,527 | 9,104 | 9,460 | 10,393 | 10,792 | 11,361 | 12,060 | 13,288 | 14,780 | 16,027 | 16,993 | 17,804 | 18,526 | 19,165 | 19,703 | 20,178 | 20,581 | 20,943 | 21,206 | 21,764 | 22,253 | ||
| ARPU | $163.17 | $167 | $179 | $174 | $177 | $182 | $180 | $175 | $180 | $178 | $184 | $185 | $185 | $183 | $182 | $180 | $180 | $180 | $181 | $182 | $182 | $183 | $184 | $185 | $185.02 | $185.16 | ||
| Passings | 25,853 | 25,853 | 31,985 | 33,748 | 35,171 | 37,712 | 41,339 | 44,426 | 45,176 | 47,255 | 54,330 | 62,524 | 62,524 | 62,524 | 62,524 | 62,964 | 66,143 | 66,143 | 66,143 | 66,143 | 66,143 | 66,143 | 66,143 | 66,143 | 66,143 | 66,143 | ||
| Take Rate | 23% | 24% | 21% | 22% | 23% | 23% | 22% | 21% | 23% | 23% | 21% | 19% | 21% | 24% | 26% | 27% | 27% | 28% | 29% | 30% | 31% | 31% | 32% | 32% | 33% | 34% | ||
| NTS FIBER MARKET BY MARKET INFORMATION | ||||||||||||||||||||||||||||
| Lubbock Bus. | $1,554,753 | $1,601,717 | $1,622,012 | $1,676,424 | $1,788,089 | $1,868,164 | $1,862,162 | $1,904,193 | $1,939,002 | $1,956,115 | $1,982,145 | $1,992,946 | $2,008,574 | $2,024,263 | $2,040,012 | $2,055,822 | $2,071,693 | $2,087,625 | $2,103,617 | $2,119,670 | $2,135,784 | $2,151,959 | $2,168,195 | $2,184,491 | $8,813,340 | $8,929,305 | ||
| Count | 1,484 | 1,501 | 1,509 | 1,503 | 1,537 | 1,550 | 1,554 | 1,566 | 1,593 | 1,612 | 1,611 | 1,618 | 1,625 | 1,631 | 1,638 | 1,645 | 1,652 | 1,658 | 1,665 | 1,672 | 1,679 | 1,685 | 1,692 | 1,699 | 1,721 | 1,744 | ||
| ARPU | $349 | $358 | $358 | $373 | $391 | $404 | $400 | $407 | $409 | $404 | $410 | $412 | $413 | $415 | $416 | $418 | $419 | $421 | $422 | $424 | $425 | $427 | $428 | $430 | $430 | $430 | ||
| Passings | 2,997 | 2,997 | 2,997 | 2,997 | 2,997 | 2,997 | 2,997 | 2,997 | 2,997 | 3,000 | 3,000 | 3,000 | 3,000 | 3,000 | 3,000 | 3,000 | 3,000 | 3,000 | 3,000 | 3,000 | 3,000 | 3,000 | 3,000 | 3,000 | 3,000 | 3,000 | ||
| Take Rate | 50% | 50% | 50% | 50% | 51% | 52% | 52% | 52% | 53% | 54% | 54% | 54% | 54% | 54% | 55% | 55% | 55% | 55% | 56% | 56% | 56% | 56% | 56% | 57% | 57% | 58% | ||
| Lubbock Res. | $456,722 | $463,504 | $457,337 | $452,525 | $450,036 | $441,852 | $421,647 | $410,510 | $411,758 | $391,980 | $392,654 | $394,333 | $400,942 | $413,789 | $433,178 | $452,971 | $473,168 | $493,771 | $514,778 | $536,189 | $558,006 | $580,226 | $594,321 | $608,416 | $2,574,608 | $2,800,121 | ||
| Count | 1,824 | 1,825 | 1,784 | 1,716 | 1,698 | 1,657 | 1,620 | 1,548 | 1,559 | 1,506 | 1,469 | 1,469 | 1,469 | 1,514 | 1,559 | 1,604 | 1,648 | 1,693 | 1,738 | 1,783 | 1,828 | 1,873 | 1,918 | 1,963 | 2,143 | 2,323 | ||
| ARPU | $84 | $85 | $84 | $87 | $88 | $88 | $86 | $88 | $88 | $85 | $88 | $90 | $91 | $93 | $94 | $96 | $97 | $99 | $100 | $102 | $103 | $105 | $105 | $105 | $105 | $105 | ||
| Passings | 11,989 | 11,989 | 11,989 | 11,989 | 11,989 | 11,989 | 11,989 | 11,989 | 11,989 | 11,989 | 11,989 | 11,989 | 11,989 | 11,989 | 11,989 | 11,989 | 11,989 | 11,989 | 11,989 | 11,989 | 11,989 | 11,989 | 11,989 | 11,989 | 11,989 | 11,989 | ||
| Take Rate | 15% | 15% | 15% | 14% | 14% | 14% | 14% | 13% | 13% | 13% | 12% | 12% | 12% | 13% | 13% | 13% | 14% | 14% | 15% | 15% | 15% | 16% | 16% | 16% | 18% | 19% | ||
| Lubbock Totals | $2,011,475 | $2,065,222 | $2,079,349 | $2,128,949 | $2,238,126 | $2,310,016 | $2,283,810 | $2,314,703 | $2,350,760 | $2,348,094 | $2,374,799 | $2,387,279 | $2,409,516 | $2,438,052 | $2,473,190 | $2,508,793 | $2,544,861 | $2,581,396 | $2,618,395 | $2,655,860 | $2,693,790 | $2,732,185 | $2,762,515 | $2,792,906 | $11,387,948 | $11,729,426 | ||
| Count | 3,308 | 3,326 | 3,293 | 3,219 | 3,235 | 3,207 | 3,174 | 3,114 | 3,152 | 3,118 | 3,080 | 3,086 | 3,093 | 3,145 | 3,197 | 3,248 | 3,300 | 3,352 | 3,403 | 3,455 | 3,507 | 3,559 | 3,610 | 3,662 | 3,864 | 4,067 | ||
| ARPU | $203 | $208 | $209 | $219 | $231 | $239 | $239 | $247 | $250 | $249 | $257 | $258 | $260 | $258 | $258 | $257 | $257 | $257 | $256 | $256 | $256 | $256 | $255 | $254 | 245.5812537 | 240.3599196 | ||
| Passings | 14,986 | 14,986 | 14,986 | 14,986 | 14,986 | 14,986 | 14,986 | 14,986 | 14,986 | 14,989 | 14,989 | 14,989 | 14,989 | 14,989 | 14,989 | 14,989 | 14,989 | 14,989 | 14,989 | 14,989 | 14,989 | 14,989 | 14,989 | 14,989 | 14,989 | 14,989 | ||
| Take Rate | 22% | 22% | 22% | 21% | 22% | 21% | 21% | 21% | 21% | 21% | 21% | 21% | 21% | 21% | 21% | 22% | 22% | 22% | 23% | 23% | 23% | 24% | 24% | 24% | 26% | 27% | ||
| Wolfforth Bus. | $67,871 | $67,677 | $70,569 | $75,239 | $72,430 | $74,741 | $73,072 | $83,441 | $86,971 | $78,818 | $79,275 | $79,088 | $79,425 | $79,763 | $80,100 | $80,438 | $80,775 | $81,113 | $81,450 | $81,788 | $82,125 | $82,463 | $82,800 | $83,138 | $332,550 | $332,550 | ||
| Count | 73 | 76 | 79 | 81 | 82 | 84 | 83 | 79 | 80 | 76 | 75 | 75 | 75 | 75 | 75 | 75 | 75 | 75 | 75 | 75 | 75 | 75 | 75 | 75 | 75 | 75 | ||
| ARPU | $310 | $301 | $305 | $308 | $298 | $299 | $291 | $348 | $358 | $341 | $350 | $352 | $353 | $355 | $356 | $358 | $359 | $361 | $362 | $364 | $365 | $367 | $368 | $370 | $370 | $370 | ||
| Passings | 150 | 150 | 150 | 150 | 150 | 150 | 150 | 150 | 150 | 150 | 150 | 150 | 150 | 150 | 150 | 150 | 150 | 150 | 150 | 150 | 150 | 150 | 150 | 150 | 150 | 150 | ||
| Take Rate | 49% | 51% | 53% | 54% | 55% | 56% | 55% | 53% | 53% | 51% | 50% | 50% | 50% | 50% | 50% | 50% | 50% | 50% | 50% | 50% | 50% | 50% | 50% | 50% | 50% | 50% | ||
| Wolfforth Res. | $128,384 | $128,467 | $127,450 | $126,493 | $128,553 | $130,074 | $129,630 | $127,651 | $131,988 | $130,417 | $129,579 | $130,358 | $132,405 | $137,223 | $144,938 | $152,821 | $160,873 | $169,094 | $177,484 | $183,446 | $189,409 | $195,371 | $201,334 | $207,296 | $888,810 | $984,210 | ||
| Count | 495 | 494 | 482 | 470 | 472 | 478 | 472 | 464 | 464 | 464 | 455 | 455 | 455 | 474 | 493 | 511 | 530 | 549 | 568 | 586 | 605 | 624 | 643 | 661 | 736 | 811 | ||
| ARPU | $86 | $86 | $87 | $89 | $91 | $91 | $90 | $92 | $95 | $92 | $94 | $96 | $97 | $99 | $100 | $102 | $103 | $105 | $106 | $106 | $106 | $106 | $106 | $106 | $106 | $106 | ||
| Passings | 5,000 | 5,000 | 5,000 | 5,000 | 5,000 | 5,000 | 5,000 | 5,000 | 5,000 | 5,000 | 5,000 | 5,000 | 5,000 | 5,000 | 5,000 | 5,000 | 5,000 | 5,000 | 5,000 | 5,000 | 5,000 | 5,000 | 5,000 | 5,000 | 5,000 | 5,000 | ||
| Take Rate | 10% | 10% | 10% | 9% | 9% | 10% | 10% | 9% | 9% | 9% | 9% | 9% | 9% | 9% | 10% | 10% | 11% | 11% | 11% | 12% | 12% | 12% | 13% | 13% | 15% | 16% | ||
| Wolfforth Totals | $196,255 | $196,144 | $198,019 | $201,732 | $200,983 | $204,815 | $202,702 | $211,093 | $218,959 | $209,236 | $208,854 | $209,445 | $211,830 | $216,985 | $225,038 | $233,258 | $241,648 | $250,207 | $258,934 | $265,234 | $271,534 | $277,834 | $284,134 | $290,434 | $1,221,360 | $1,316,760 | ||
| Count | 568 | 570 | 561 | 551 | 554 | 562 | 555 | 543 | 544 | 540 | 530 | 530 | 530 | 549 | 568 | 586 | 605 | 624 | 643 | 661 | 680 | 699 | 718 | 736 | 811 | 886 | ||
| ARPU | $114 | $115 | $117 | $121 | $121 | $122 | $120 | $129 | $134 | $128 | $131 | $132 | $133 | $132 | $132 | $133 | $133 | $134 | $134 | $134 | $133 | $133 | $132 | $131 | $125.46 | $123.81 | ||
| Passings | 5,150 | 5,150 | 5,150 | 5,150 | 5,150 | 5,150 | 5,150 | 5,150 | 5,150 | 5,150 | 5,150 | 5,150 | 5,150 | 5,150 | 5,150 | 5,150 | 5,150 | 5,150 | 5,150 | 5,150 | 5,150 | 5,150 | 5,150 | 5,150 | 5,150 | 5,150 | ||
| Take Rate | 11% | 11% | 11% | 11% | 11% | 11% | 11% | 11% | 11% | 10% | 10% | 10% | 10% | 11% | 11% | 11% | 12% | 12% | 12% | 13% | 13% | 14% | 14% | 14% | 16% | 17% | ||
| Misc. Bus. Fiber - Other Mkts. | $19,916 | $19,811 | $20,101 | $21,399 | $20,863 | $22,902 | $25,119 | $26,229 | $25,138 | $22,670 | $22,670 | $22,670 | $22,670 | $22,670 | $22,670 | $22,670 | $22,670 | $22,670 | $22,670 | $22,670 | $22,670 | $22,670 | $22,670 | $22,670 | $90,679 | $90,679 | ||
| Count | 12 | 11 | 16 | 10 | 10 | 6 | 0 | 0 | ||||||||||||||||||||
| ARPU | $673 | $716 | $598 | $820 | $811 | $1,133 | $1,133 | $1,133 | $1,133 | $1,133 | $1,133 | $1,133 | $1,133 | $1,133 | $1,133 | $1,133 | $1,133 | $1,133 | $1,133 | $1,133 | $1,133 | $1,133 | ||||||
| Levelland Bus | $157,803 | $171,640 | $264,052 | $207,902 | $235,462 | $270,645 | $269,597 | $274,440 | $276,022 | $282,087 | $296,281 | $298,185 | $299,960 | $301,740 | $303,526 | $305,316 | $307,112 | $308,913 | $310,719 | $312,531 | $314,348 | $316,169 | $317,997 | $319,829 | $1,281,006 | $1,281,006 | ||
| Count | 145 | 153 | 175 | 177 | 183 | 190 | 199 | 200 | 204 | 212 | 213 | 213 | 214 | 215 | 215 | 216 | 216 | 217 | 217 | 218 | 219 | 219 | 220 | 220 | 220 | 220 | ||
| ARPU | $375 | $381 | $537 | $392 | $428 | $473 | $455 | $458 | $452 | $450 | $465 | $467 | $468 | $470 | $471 | $473 | $474 | $476 | $477 | $479 | $480 | $482 | $483 | $485 | $485 | $485 | ||
| Passings | 310 | 310 | 310 | 310 | 310 | 310 | 310 | 310 | 310 | 310 | 310 | 310 | 310 | 310 | 310 | 310 | 310 | 310 | 310 | 310 | 310 | 310 | 310 | 310 | 310 | 310 | ||
| Take Rate | 47% | 49% | 56% | 57% | 59% | 61% | 64% | 65% | 66% | 68% | 69% | 69% | 69% | 69% | 69% | 70% | 70% | 70% | 70% | 70% | 71% | 71% | 71% | 71% | 71% | 71% | ||
| Levelland Res | $539,774 | $567,592 | $591,443 | $598,412 | $606,335 | $613,654 | $609,974 | $600,068 | $613,324 | $631,385 | $625,406 | $628,217 | $632,673 | $640,257 | $651,034 | $661,898 | $668,240 | $674,582 | $680,924 | $687,266 | $693,608 | $699,950 | $706,292 | $712,634 | $2,863,222 | $2,863,222 | ||
| Count | 1,930 | 1,980 | 1,934 | 1,953 | 1,986 | 1,992 | 2,015 | 1,946 | 2,009 | 1,994 | 1,981 | 1,981 | 1,981 | 2,000 | 2,020 | 2,039 | 2,058 | 2,078 | 2,097 | 2,117 | 2,136 | 2,156 | 2,175 | 2,195 | 2,195 | 2,195 | ||
| ARPU | $96 | $96 | $101 | $102 | $103 | $102 | $102 | $102 | $103 | $105 | $105 | $106 | $106 | $107 | $108 | $109 | $109 | $109 | $109 | $109 | $109 | $109 | $109 | $109 | $109 | $109 | ||
| Passings | 5,185 | 5,185 | 5,185 | 5,185 | 5,185 | 5,185 | 5,185 | 5,185 | 5,185 | 5,185 | 5,185 | 5,185 | 5,185 | 5,185 | 5,185 | 5,185 | 5,185 | 5,185 | 5,185 | 5,185 | 5,185 | 5,185 | 5,185 | 5,185 | 5,185 | 5,185 | ||
| Take Rate | 37% | 38% | 37% | 38% | 38% | 38% | 39% | 38% | 39% | 38% | 38% | 38% | 38% | 39% | 39% | 39% | 40% | 40% | 40% | 41% | 41% | 42% | 42% | 42% | 42% | 42% | ||
| Levelland Totals | $697,577 | $739,232 | $855,495 | $806,314 | $841,796 | $884,299 | $879,571 | $874,508 | $889,346 | $913,472 | $921,687 | $926,402 | $932,634 | $941,998 | $954,560 | $967,214 | $975,352 | $983,495 | $991,644 | $999,797 | $1,007,956 | $1,016,120 | $1,024,289 | $1,032,463 | $4,144,228 | $4,144,228 | ||
| Count | 2,075 | 2,133 | 2,109 | 2,130 | 2,169 | 2,182 | 2,214 | 2,146 | 2,213 | 2,206 | 2,193 | 2,194 | 2,195 | 2,215 | 2,235 | 2,255 | 2,275 | 2,295 | 2,315 | 2,335 | 2,355 | 2,375 | 2,395 | 2,415 | 2,415 | 2,415 | ||
| ARPU | $116 | $116 | $135 | $126 | $131 | $134 | $133 | $135 | $135 | $137 | $140 | $141 | $142 | $142 | $142 | $143 | $143 | $143 | $143 | $143 | $143 | $143 | $143 | $143 | $143.01 | $143.01 | ||
| Passings | 5,495 | 5,495 | 5,495 | 5,495 | 5,495 | 5,495 | 5,495 | 5,495 | 5,495 | 5,495 | 5,495 | 5,495 | 5,495 | 5,495 | 5,495 | 5,495 | 5,495 | 5,495 | 5,495 | 5,495 | 5,495 | 5,495 | 5,495 | 5,495 | 5,495 | 5,495 | ||
| Take Rate | 38% | 39% | 38% | 39% | 39% | 40% | 40% | 39% | 40% | 40% | 40% | 40% | 40% | 40% | 41% | 41% | 41% | 42% | 42% | 42% | 43% | 43% | 44% | 44% | 44% | 44% | ||
| Smyer Bus. | $1,622 | $1,687 | $1,316 | $1,146 | $1,263 | $1,198 | $1,197 | $1,215 | $1,194 | $1,220 | $1,229 | $1,245 | $1,258 | $1,272 | $1,286 | $1,300 | $1,313 | $1,327 | $1,341 | $1,355 | $1,368 | $1,382 | $1,396 | $1,409 | $5,775 | $5,994 | ||
| Count | 2 | 2 | 2 | 1 | 1 | 1 | 1 | 1 | 1 | 1 | 1 | 1 | 1 | 1 | 1 | 1 | 1 | 1 | 1 | 1 | 1 | 1 | 1 | 1 | 1 | 1 | ||
| ARPU | $270 | $281 | $219 | $286 | $421 | $399 | $399 | $405 | $398 | $407 | $407 | $407 | $407 | $407 | $407 | $407 | $407 | $407 | $407 | $407 | $407 | $407 | $407 | $407 | $407 | $407 | ||
| Passings | 6 | 6 | 6 | 6 | 6 | 6 | 6 | 6 | 6 | 6 | 6 | 6 | 6 | 6 | 6 | 6 | 6 | 6 | 6 | 6 | 6 | 6 | 6 | 6 | 6 | 6 | ||
| Take Rate | 33% | 33% | 33% | 17% | 17% | 17% | 17% | 17% | 17% | 17% | 17% | 17% | 17% | 17% | 18% | 18% | 18% | 18% | 18% | 19% | 19% | 19% | 19% | 19% | 20% | 21% | ||
| Smyer Res. | $18,265 | $18,056 | $18,888 | $21,778 | $25,630 | $23,802 | $23,924 | $21,401 | $25,403 | $25,612 | $25,237 | $24,734 | $24,734 | $24,868 | $25,135 | $25,402 | $25,670 | $25,937 | $26,204 | $26,472 | $26,739 | $27,006 | $27,274 | $27,541 | $112,836 | $117,113 | ||
| Count | 64 | 67 | 65 | 74 | 76 | 77 | 76 | 72 | 78 | 78 | 75 | 75 | 75 | 76 | 77 | 77 | 78 | 79 | 80 | 81 | 81 | 82 | 83 | 84 | 87 | 90 | ||
| ARPU | $94 | $92 | $94 | $99 | $113 | $103 | $104 | $98 | $109 | $109 | $110 | $110 | $110 | $110 | $110 | $110 | $110 | $110 | $110 | $110 | $110 | $110 | $110 | $110 | $110 | $110 | ||
| Passings | 216 | 216 | 216 | 216 | 216 | 216 | 216 | 216 | 216 | 216 | 216 | 216 | 216 | 216 | 216 | 216 | 216 | 216 | 216 | 216 | 216 | 216 | 216 | 216 | 216 | 216 | ||
| Take Rate | 30% | 31% | 30% | 34% | 35% | 36% | 35% | 33% | 36% | 36% | 35% | 35% | 35% | 35% | 35% | 36% | 36% | 37% | 37% | 37% | 38% | 38% | 38% | 39% | 40% | 42% | ||
| Smyer Totals | $19,886 | $19,743 | $20,204 | $22,924 | $26,894 | $25,000 | $25,121 | $22,616 | $26,598 | $26,832 | $26,466 | $25,979 | $25,993 | $26,140 | $26,421 | $26,702 | $26,983 | $27,264 | $27,545 | $27,826 | $28,107 | $28,388 | $28,669 | $28,950 | $118,611 | $123,107 | ||
| Count | 66 | 69 | 67 | 75 | 77 | 78 | 77 | 73 | 79 | 79 | 76 | 76 | 76 | 77 | 78 | 78 | 79 | 80 | 81 | 82 | 83 | 83 | 84 | 85 | 88 | 92 | ||
| ARPU | $99 | $98 | $97 | $103 | $117 | $107 | $108 | $102 | $113 | $113 | $116 | $114 | $114 | $113 | $113 | $113 | $113 | $113 | $113 | $113 | $113 | $113 | $113 | $113 | $111.93 | $112.01 | ||
| Passings | 222 | 222 | 222 | 222 | 222 | 222 | 222 | 222 | 222 | 222 | 222 | 222 | 222 | 222 | 222 | 222 | 222 | 222 | 222 | 222 | 222 | 222 | 222 | 222 | 222 | 222 | ||
| Take Rate | 30% | 31% | 30% | 34% | 35% | 35% | 35% | 33% | 36% | 36% | 34% | 34% | 34% | 35% | 35% | 35% | 36% | 36% | 36% | 37% | 37% | 38% | 38% | 38% | 40% | 41% | ||
| Littlefield Bus. (Incl. Hockley Co.) | $15,970 | $39,827 | $53,686 | $56,672 | $61,757 | $59,661 | $65,159 | $63,581 | $65,406 | $68,146 | $70,254 | $76,161 | $85,856 | $92,924 | $93,417 | $93,909 | $94,401 | $94,894 | $95,386 | $95,879 | $96,371 | $96,863 | $387,454 | $387,454 | ||||
| Count | 26 | 49 | 58 | 70 | 74 | 70 | 71 | 71 | 74 | 76 | 78 | 94 | 109 | 109 | 109 | 109 | 109 | 109 | 109 | 109 | 109 | 109 | 109 | 109 | ||||
| ARPU | $456 | $306 | $321 | $298 | $281 | $277 | $307 | $300 | $300 | $301 | $303 | $295 | $282 | $283 | $285 | $286 | $288 | $289 | $291 | $292 | $294 | $295 | $295 | $295 | ||||
| Passings | 173 | 173 | 173 | 173 | 173 | 173 | 173 | 173 | 173 | 173 | 173 | 173 | 173 | 173 | 173 | 173 | 173 | 173 | 173 | 173 | 173 | 173 | 173 | 173 | ||||
| Take Rate | 15% | 28% | 34% | 40% | 43% | 40% | 41% | 41% | 43% | 44% | 45% | 54% | 63% | 63% | 63% | 63% | 63% | 63% | 63% | 63% | 63% | 63% | 63% | 63% | ||||
| Littlefield Res. (Incl. Hockley Co.) | $60,770 | $110,052 | $138,245 | $146,370 | $152,181 | $161,244 | $170,182 | $173,428 | $168,436 | $168,069 | $168,069 | $168,841 | $170,386 | $171,931 | $173,476 | $175,020 | $176,565 | $178,110 | $178,882 | $178,882 | $178,882 | $178,882 | $715,529 | $715,529 | ||||
| Count | 230 | 350 | 432 | 449 | 468 | 482 | 531 | 511 | 509 | 509 | 509 | 513 | 518 | 523 | 527 | 532 | 537 | 542 | 542 | 542 | 542 | 542 | 542 | 542 | ||||
| ARPU | $129 | $113 | $112 | $110 | $110 | $113 | $112 | $110 | $110 | $110 | $110 | $110 | $110 | $110 | $110 | $110 | $110 | $110 | $110 | $110 | $110 | $110 | $110 | $110 | ||||
| Passings | 1,247 | 1,247 | 1,247 | 1,247 | 1,247 | 1,247 | 1,247 | 1,247 | 1,247 | 1,247 | 1,247 | 1,247 | 1,247 | 1,247 | 1,247 | 1,247 | 1,247 | 1,247 | 1,247 | 1,247 | 1,247 | 1,247 | 1,247 | 1,247 | ||||
| Take Rate | 18% | 28% | 35% | 36% | 38% | 39% | 43% | 41% | 41% | 41% | 41% | 41% | 42% | 42% | 42% | 43% | 43% | 43% | 43% | 43% | 43% | 43% | 43% | 43% | ||||
| Littlefield Totals (Incl. Hockley Co.) | $76,739 | $149,879 | $191,931 | $203,043 | $213,938 | $220,905 | $235,341 | $237,010 | $233,843 | $236,215 | $238,323 | $245,003 | $256,242 | $264,855 | $266,892 | $268,929 | $270,967 | $273,004 | $274,269 | $274,761 | $275,253 | $275,746 | $1,102,983 | $1,102,983 | ||||
| Count | 256 | 399 | 490 | 519 | 542 | 552 | 602 | 582 | 583 | 585 | 587 | 607 | 628 | 632 | 637 | 642 | 646 | 651 | 651 | 651 | 651 | 651 | 651 | 651 | ||||
| ARPU | $152 | $136 | $137 | $133 | $133 | $134 | $136 | $133 | $134 | $135 | $135 | $134 | $136 | $140 | $140 | $140 | $140 | $140 | $140 | $141 | $141 | $141 | $141 | $141 | ||||
| Passings | 1,420 | 1,420 | 1,420 | 1,420 | 1,420 | 1,420 | 1,420 | 1,420 | 1,420 | 1,420 | 1,420 | 1,420 | 1,420 | 1,420 | 1,420 | 1,420 | 1,420 | 1,420 | 1,420 | 1,420 | 1,420 | 1,420 | 1,420 | 1,420 | ||||
| Take Rate | 18% | 28% | 35% | 37% | 38% | 39% | 42% | 41% | 41% | 41% | 41% | 43% | 44% | 45% | 45% | 45% | 46% | 46% | 46% | 46% | 46% | 46% | 46% | 46% | ||||
| Whitharral Res. | $1,168 | $3,843 | $3,902 | $4,021 | $2,637 | $5,522 | $4,444 | $5,144 | $5,748 | $5,988 | $6,232 | $6,478 | $6,727 | $6,979 | $7,184 | $7,389 | $7,594 | $7,799 | $8,004 | $8,209 | $8,415 | $35,298.52 | $37,759.30 | |||||
| Count | 4 | 11 | 10 | 9 | 10 | 15 | 15 | 18 | 19 | 19 | 20 | 20 | 21 | 22 | 22 | 23 | 24 | 24 | 25 | 26 | 26 | 28 | 30 | |||||
| ARPU | $167 | $128 | $115 | $126 | $101 | $128 | $93 | $104 | $105 | $106 | $106 | $107 | $108 | $109 | $109 | $109 | $109 | $109 | $109 | $109 | $109 | $109 | $109 | |||||
| Passings | 84 | 84 | 84 | 84 | 84 | 84 | 84 | 84 | 84 | 84 | 84 | 84 | 84 | 84 | 84 | 84 | 84 | 84 | 84 | 84 | 84 | 84 | 84 | |||||
| Take Rate | 5% | 13% | 12% | 11% | 12% | 18% | 18% | 21% | 22% | 23% | 24% | 24% | 25% | 26% | 27% | 27% | 28% | 29% | 30% | 30% | 31% | 33% | 36% | |||||
| Burkburnnet Bus. | $28,271 | $55,152 | $61,293 | $74,398 | $73,780 | $62,877 | $61,550 | $62,222 | $78,814 | $87,191 | $100,494 | $118,624 | $132,343 | $136,864 | $140,592 | $144,320 | $148,048 | $151,776 | $155,504 | $157,741 | $157,741 | $157,741 | $630,963 | $630,963 | ||||
| Count | 25 | 64 | 75 | 92 | 95 | 99 | 102 | 104 | 110 | 116 | 140 | 164 | 166 | 166 | 166 | 166 | 166 | 166 | 166 | 166 | 166 | 166 | 166 | 166 | ||||
| ARPU | $744 | $358 | $281 | $293 | $260 | $212 | $203 | $201 | $245 | $256 | $261 | $260 | $268 | $275 | $283 | $290 | $298 | $305 | $313 | $317 | $317 | $317 | $317 | $317 | ||||
| Passings | 263 | 263 | 263 | 263 | 263 | 263 | 263 | 263 | 263 | 263 | 263 | 263 | 263 | 263 | 263 | 263 | 263 | 263 | 263 | 263 | 263 | 263 | 263 | 263 | ||||
| Take Rate | 10% | 24% | 29% | 35% | 36% | 38% | 39% | 40% | 42% | 44% | 53% | 62% | 63% | 63% | 63% | 63% | 63% | 63% | 63% | 63% | 63% | 63% | 63% | 63% | ||||
| Burkburnnet Res. | $58,608 | $169,384 | $262,246 | $336,186 | $359,114 | $391,932 | $424,484 | $427,845 | $441,481 | $458,545 | $469,506 | $480,467 | $491,428 | $502,389 | $513,351 | $524,312 | $535,273 | $546,234 | $557,196 | $568,157 | $579,118 | $590,079 | $2,382,239 | $2,382,239 | ||||
| Count | 301 | 630 | 906 | 1,078 | 1,180 | 1,242 | 1,315 | 1,346 | 1,379 | 1,413 | 1,446 | 1,479 | 1,513 | 1,546 | 1,579 | 1,613 | 1,646 | 1,679 | 1,713 | 1,746 | 1,780 | 1,813 | 1,813 | 1,813 | ||||
| ARPU | $116 | $107 | $106 | $109 | $104 | $107 | $110 | $106 | $108 | $110 | $110 | $110 | $110 | $110 | $110 | $110 | $110 | $110 | $110 | $110 | $110 | $110 | $110 | $110 | ||||
| Passings | 4,449 | 4,449 | 4,449 | 4,449 | 4,449 | 4,449 | 4,449 | 4,449 | 4,449 | 4,449 | 4,449 | 4,449 | 4,449 | 4,449 | 4,449 | 4,449 | 4,449 | 4,449 | 4,449 | 4,449 | 4,449 | 4,449 | 4,449 | 4,449 | ||||
| Take Rate | 7% | 14% | 20% | 24% | 27% | 28% | 30% | 30% | 31% | 32% | 33% | 33% | 34% | 35% | 36% | 36% | 37% | 38% | 39% | 39% | 40% | 41% | 41% | 41% | ||||
| Burkburnnet Totals | $86,879 | $224,536 | $323,539 | $410,584 | $432,893 | $454,809 | $486,034 | $490,067 | $520,295 | $545,735 | $570,000 | $599,091 | $623,771 | $639,253 | $653,942 | $668,632 | $683,321 | $698,010 | $712,699 | $725,897 | $736,859 | $747,820 | $3,013,202 | $3,013,202 | ||||
| Count | 326 | 694 | 981 | 1,170 | 1,275 | 1,341 | 1,417 | 1,450 | 1,490 | 1,529 | 1,586 | 1,643 | 1,678 | 1,712 | 1,745 | 1,778 | 1,812 | 1,845 | 1,879 | 1,912 | 1,945 | 1,979 | 1,979 | 1,979 | ||||
| ARPU | $160 | $130 | $120 | $123 | $116 | $115 | $117 | $113 | $116 | $119 | $120 | $122 | $124 | $124 | $125 | $125 | $126 | $126 | $126 | $127 | $126 | $126 | $127 | $127 | ||||
| Passings | 4,712 | 4,712 | 4,712 | 4,712 | 4,712 | 4,712 | 4,712 | 4,712 | 4,712 | 4,712 | 4,712 | 4,712 | 4,712 | 4,712 | 4,712 | 4,712 | 4,712 | 4,712 | 4,712 | 4,712 | 4,712 | 4,712 | 4,712 | 4,712 | ||||
| Take Rate | 7% | 15% | 21% | 25% | 27% | 28% | 30% | 31% | 32% | 32% | 34% | 35% | 36% | 36% | 37% | 38% | 38% | 39% | 40% | 41% | 41% | 42% | 42% | 42% | ||||
| Brownfield Bus. | $6,443 | $26,406 | $42,170 | $55,476 | $62,892 | $64,689 | $64,080 | $68,180 | $71,980 | $75,640 | $80,933 | $88,228 | $94,809 | $98,878 | $101,590 | $104,303 | $107,015 | $109,728 | $111,627 | $111,627 | $111,627 | $446,507 | $446,507 | |||||
| Count | 17 | 42 | 56 | 88 | 97 | 108 | 108 | 108 | 108 | 108 | 114 | 121 | 121 | 121 | 121 | 121 | 121 | 121 | 121 | 121 | 121 | 121 | 121 | |||||
| ARPU | $230 | $267 | $277 | $244 | $221 | $203 | $195 | $210 | $221 | $233 | $243 | $251 | $262 | $273 | $281 | $288 | $296 | $303 | $309 | $309 | $309 | $309 | $309 | |||||
| Passings | 178 | 178 | 178 | 178 | 178 | 178 | 178 | 178 | 178 | 178 | 178 | 178 | 178 | 178 | 178 | 178 | 178 | 178 | 178 | 178 | 178 | 178 | 178 | |||||
| Take Rate | 10% | 24% | 31% | 49% | 54% | 61% | 61% | 61% | 61% | 61% | 64% | 68% | 68% | 68% | 68% | 68% | 68% | 68% | 68% | 68% | 68% | 68% | 68% | |||||
| Brownfield Res. | $38,038 | $108,667 | $148,595 | $162,323 | $168,788 | $168,835 | $173,465 | $175,320 | $181,181 | $186,466 | $190,929 | $195,441 | $197,265 | $199,089 | $200,913 | $202,736 | $204,560 | $205,472 | $205,472 | $205,472 | $205,472 | $821,888 | $821,888 | |||||
| Count | 178 | 399 | 480 | 523 | 534 | 557 | 568 | 578 | 589 | 595 | 600 | 606 | 612 | 617 | 623 | 629 | 634 | 634 | 634 | 634 | 634 | 634 | 634 | |||||
| ARPU | $132 | $110 | $107 | $106 | $106 | $104 | $100 | $102 | $104 | $105 | $107 | $108 | $108 | $108 | $108 | $108 | $108 | $108 | $108 | $108 | $108 | $108 | $108 | |||||
| Passings | 1,501 | 1,501 | 1,501 | 1,501 | 1,501 | 1,501 | 1,501 | 1,501 | 1,501 | 1,501 | 1,501 | 1,501 | 1,501 | 1,501 | 1,501 | 1,501 | 1,501 | 1,501 | 1,501 | 1,501 | 1,501 | 1,501 | 1,501 | |||||
| Take Rate | 12% | 27% | 32% | 35% | 36% | 37% | 38% | 39% | 39% | 40% | 40% | 40% | 41% | 41% | 42% | 42% | 42% | 42% | 42% | 42% | 42% | 42% | 42% | |||||
| Brownfield Totals | $44,481 | $135,073 | $190,765 | $217,799 | $231,681 | $233,525 | $237,545 | $243,501 | $253,161 | $262,107 | $271,861 | $283,669 | $292,074 | $297,966 | $302,503 | $307,039 | $311,575 | $315,200 | $317,099 | $317,099 | $317,099 | $1,268,395 | $1,268,395 | |||||
| Count | 195 | 441 | 536 | 611 | 631 | 665 | 676 | 686 | 698 | 703 | 714 | 727 | 732 | 738 | 743 | 749 | 755 | 755 | 755 | 755 | 755 | 755 | 755 | |||||
| ARPU | $140 | $124 | $124 | $124 | $124 | $104 | $100 | $118 | $121 | $124 | $127 | $130 | $133 | $135 | $136 | $137 | $138 | $139 | $140 | $140 | $140 | $140 | $140 | |||||
| Passings | 1,679 | 1,679 | 1,679 | 1,679 | 1,679 | 1,679 | 1,679 | 1,679 | 1,679 | 1,679 | 1,679 | 1,679 | 1,679 | 1,679 | 1,679 | 1,679 | 1,679 | 1,679 | 1,679 | 1,679 | 1,679 | 1,679 | 1,679 | |||||
| Take Rate | 12% | 26% | 32% | 36% | 38% | 37% | 38% | 41% | 42% | 42% | 43% | 43% | 44% | 44% | 44% | 45% | 45% | 45% | 45% | 45% | 45% | 45% | 45% | |||||
| Slaton Bus. | $9,022 | $19,438 | $18,503 | $18,981 | $20,351 | $22,349 | $24,759 | $27,645 | $30,516 | $33,528 | $36,682 | $39,977 | $43,415 | $46,384 | $49,447 | $52,605 | $55,857 | $57,795 | $59,732 | $61,669 | $260,237 | $279,610 | ||||||
| Count | 17 | 24 | 29 | 31 | 34 | 38 | 41 | 43 | 45 | 47 | 49 | 51 | 53 | 55 | 57 | 60 | 62 | 64 | 66 | 68 | 73 | 78 | ||||||
| ARPU | $361 | $314 | $234 | $211 | $204 | $207 | $210 | $221 | $233 | $244 | $255 | $266 | $278 | $285 | $293 | $300 | $308 | $308 | $308 | $308 | $308 | $308 | ||||||
| Passings | 140 | 140 | 140 | 140 | 140 | 140 | 140 | 140 | 140 | 140 | 140 | 140 | 140 | 140 | 140 | 140 | 140 | 140 | 140 | 140 | 140 | 140 | ||||||
| Take Rate | 12% | 17% | 21% | 22% | 24% | 27% | 29% | 31% | 32% | 34% | 35% | 37% | 38% | 40% | 41% | 43% | 44% | 46% | 47% | 49% | 52% | 56% | ||||||
| Slaton Res. | $11,332 | $31,399 | $43,196 | $51,385 | $64,492 | $65,528 | $70,904 | $76,030 | $80,237 | $83,384 | $86,530 | $89,677 | $92,823 | $95,970 | $99,117 | $102,263 | $105,410 | $108,556 | $111,703 | $114,849 | $484,570 | $522,329 | ||||||
| Count | 61 | 116 | 145 | 165 | 201 | 215 | 231 | 241 | 250 | 260 | 269 | 279 | 289 | 298 | 308 | 318 | 327 | 337 | 346 | 356 | 385 | 414 | ||||||
| ARPU | $122 | $107 | $109 | $111 | $113 | $101 | $106 | $108 | $109 | $109 | $109 | $109 | $109 | $109 | $109 | $109 | $109 | $109 | $109 | $109 | $109 | $109 | ||||||
| Passings | 1,283 | 1,283 | 1,283 | 1,283 | 1,283 | 1,283 | 1,283 | 1,283 | 1,283 | 1,283 | 1,283 | 1,283 | 1,283 | 1,283 | 1,283 | 1,283 | 1,283 | 1,283 | 1,283 | 1,283 | 1,283 | 1,283 | ||||||
| Take Rate | 5% | 9% | 11% | 13% | 16% | 17% | 18% | 19% | 20% | 20% | 21% | 22% | 23% | 23% | 24% | 25% | 26% | 26% | 27% | 28% | 30% | 32% | ||||||
| Slaton Totals | $20,354 | $50,836 | $61,699 | $70,366 | $84,843 | $87,877 | $95,663 | $103,675 | $110,753 | $116,912 | $123,212 | $129,654 | $136,238 | $142,354 | $148,564 | $154,868 | $161,267 | $166,351 | $171,435 | $176,518 | $744,807 | $801,938 | ||||||
| Count | 78 | 140 | 174 | 196 | 235 | 253 | 272 | 283 | 295 | 307 | 318 | 330 | 342 | 354 | 365 | 377 | 389 | 400 | 412 | 424 | 458 | 492 | ||||||
| ARPU | $172 | $143 | $130 | $127 | $126 | $116 | $117 | $122 | $125 | $127 | $129 | $131 | $133 | $134 | $136 | $137 | $138 | $138 | $139 | $139 | $136 | $136 | ||||||
| Passings | 1,423 | 1,423 | 1,423 | 1,423 | 1,423 | 1,423 | 1,423 | 1,423 | 1,423 | 1,423 | 1,423 | 1,423 | 1,423 | 1,423 | 1,423 | 1,423 | 1,423 | 1,423 | 1,423 | 1,423 | 1,423 | 1,423 | ||||||
| Take Rate | 5% | 10% | 12% | 14% | 17% | 18% | 19% | 20% | 21% | 22% | 22% | 23% | 24% | 25% | 26% | 26% | 27% | 28% | 29% | 30% | 32% | 35% | ||||||
| Wilson Bus. | $499 | $1,541 | $1,714 | $1,693 | $1,258 | $1,390 | $1,401 | $1,401 | $1,401 | $1,401 | $1,401 | $1,401 | $1,401 | $1,401 | $1,401 | $1,401 | $1,401 | $1,401 | $1,401 | $5,603 | $5,603 | |||||||
| Count | 2 | 4 | 4 | 4 | 4 | 4 | 4 | 4 | 4 | 4 | 4 | 4 | 4 | 4 | 4 | 4 | 4 | 4 | 4 | 4 | 4 | |||||||
| ARPU | $125 | $171 | $143 | $141 | $105 | $115 | $115 | $115 | $115 | $115 | $115 | $115 | $115 | $115 | $115 | $115 | $115 | $115 | $115 | $115 | $115 | |||||||
| Passings | 24 | 24 | 24 | 24 | 24 | 24 | 24 | 24 | 24 | 24 | 24 | 24 | 24 | 24 | 24 | 24 | 24 | 24 | 24 | 24 | 24 | |||||||
| Take Rate | 8% | 17% | 17% | 17% | 17% | 17% | 17% | 17% | 17% | 17% | 17% | 17% | 17% | 17% | 17% | 17% | 17% | 17% | 17% | 17% | 17% | |||||||
| Wilson Res. | $3,491 | $10,414 | $12,597 | $15,000 | $14,170 | $14,852 | $15,765 | $16,226 | $16,686 | $17,147 | $17,607 | $18,068 | $18,528 | $18,989 | $19,449 | $19,910 | $20,371 | $20,831 | $21,292 | $88,850 | $94,377 | |||||||
| Count | 20 | 33 | 36 | 42 | 42 | 46 | 47 | 49 | 50 | 52 | 53 | 54 | 56 | 57 | 58 | 60 | 61 | 62 | 64 | 68 | 72 | |||||||
| ARPU | $120 | $105 | $122 | $123 | $112 | $112 | $112 | $112 | $112 | $112 | $112 | $112 | $112 | $112 | $112 | $112 | $112 | $112 | $112 | $112 | $112 | |||||||
| Passings | 182 | 182 | 182 | 182 | 182 | 182 | 182 | 182 | 182 | 182 | 182 | 182 | 182 | 182 | 182 | 182 | 182 | 182 | 182 | 182 | 182 | |||||||
| Take Rate | 11% | 18% | 20% | 23% | 23% | 25% | 26% | 27% | 28% | 28% | 29% | 30% | 31% | 31% | 32% | 33% | 34% | 34% | 35% | 37% | 40% | |||||||
| Wilson Totals | $3,990 | $11,955 | $14,311 | $16,693 | $15,428 | $16,243 | $17,166 | $17,626 | $18,087 | $18,548 | $19,008 | $19,469 | $19,929 | $20,390 | $20,850 | $21,311 | $21,771 | $22,232 | $22,692 | $94,453 | $99,979 | |||||||
| Count | 22 | 37 | 40 | 46 | 46 | 50 | 51 | 53 | 54 | 56 | 57 | 58 | 60 | 61 | 62 | 64 | 65 | 66 | 68 | 72 | 76 | |||||||
| ARPU | $121 | $111 | $124 | $125 | $112 | $108 | $111 | $111 | $111 | $111 | $111 | $111 | $111 | $111 | $111 | $111 | $111 | $111 | $111 | $109 | $110 | |||||||
| Passings | 206 | 206 | 206 | 206 | 206 | 206 | 206 | 206 | 206 | 206 | 206 | 206 | 206 | 206 | 206 | 206 | 206 | 206 | 206 | 206 | 206 | |||||||
| Take Rate | 11% | 18% | 19% | 22% | 22% | 24% | 25% | 26% | 26% | 27% | 28% | 28% | 29% | 30% | 30% | 31% | 32% | 32% | 33% | 35% | 37% | |||||||
| Lamesa Bus. (incl. Dawson Co) | $1,073 | $34,107 | $54,165 | $59,323 | $68,907 | $79,203 | $86,441 | $93,221 | $102,541 | $111,767 | $116,829 | $121,890 | $126,952 | $130,326 | $133,700 | $137,075 | $138,087 | $138,087 | $138,087 | $552,347 | $552,347 | |||||||
| Count | 3 | 89 | 112 | 118 | 126 | 132 | 135 | 138 | 150 | 150 | 150 | 150 | 150 | 150 | 150 | 150 | 150 | 150 | 150 | 150 | 150 | |||||||
| ARPU | $358 | $223 | $167 | $169 | $186 | $205 | $216 | $228 | $237 | $248 | $260 | $271 | $282 | $290 | $297 | $305 | $307 | $307 | $307 | $307 | $307 | |||||||
| Passings | 223 | 223 | 223 | 223 | 223 | 223 | 223 | 223 | 223 | 223 | 223 | 223 | 223 | 223 | 223 | 223 | 223 | 223 | 223 | 223 | 223 | |||||||
| Take Rate | 1% | 40% | 50% | 53% | 57% | 59% | 61% | 62% | 67% | 67% | 67% | 67% | 67% | 67% | 67% | 67% | 67% | 67% | 67% | 67% | 67% | |||||||
| Lamesa Res. | $11,791 | $66,190 | $95,973 | $114,056 | $129,924 | $137,265 | $147,168 | $157,371 | $167,805 | $178,469 | $186,770 | $195,071 | $203,372 | $211,672 | $217,898 | $219,973 | $219,973 | $219,973 | $219,973 | $879,893 | $879,893 | |||||||
| Count | 74 | 244 | 317 | 381 | 436 | 461 | 487 | 512 | 538 | 564 | 589 | 615 | 641 | 666 | 679 | 679 | 679 | 679 | 679 | 679 | 679 | |||||||
| �� | ARPU | $155 | $118 | $110 | $106 | $104 | $102 | $104 | $105 | $107 | $108 | $108 | $108 | $108 | $108 | $108 | $108 | $108 | $108 | $108 | $108 | $108 | ||||||
| Passings | 1,708 | 1,708 | 1,708 | 1,708 | 1,708 | 1,708 | 1,708 | 1,708 | 1,708 | 1,708 | 1,708 | 1,708 | 1,708 | 1,708 | 1,708 | 1,708 | 1,708 | 1,708 | 1,708 | 1,708 | 1,708 | |||||||
| Take Rate | 4% | 14% | 19% | 22% | 26% | 27% | 29% | 30% | 32% | 33% | 35% | 36% | 38% | 39% | 40% | 40% | 40% | 40% | 40% | 40% | 40% | |||||||
| Lamesa Totals | $12,864 | $100,298 | $150,138 | $173,379 | $198,832 | $216,468 | $233,609 | $250,592 | $270,346 | $290,236 | $303,599 | $316,961 | $330,323 | $341,998 | $351,598 | $357,048 | $358,060 | $358,060 | $358,060 | $1,432,240 | $1,432,240 | |||||||
| Count | 77 | 333 | 429 | 499 | 562 | 593 | 622 | 651 | 688 | 714 | 739 | 765 | 790 | 816 | 829 | 829 | 829 | 829 | 829 | 829 | 829 | |||||||
| ARPU | $163 | $141 | $126 | $121 | $123 | $122 | $125 | $128 | $131 | $136 | $137 | $138 | $139 | $140 | $141 | $144 | $144 | $144 | $144 | $144 | $144 | |||||||
| Passings | 1,931 | 1,931 | 1,931 | 1,931 | 1,931 | 1,931 | 1,931 | 1,931 | 1,931 | 1,931 | 1,931 | 1,931 | 1,931 | 1,931 | 1,931 | 1,931 | 1,931 | 1,931 | 1,931 | 1,931 | 1,931 | |||||||
| Take Rate | 4% | 17% | 22% | 26% | 29% | 31% | 32% | 34% | 36% | 37% | 38% | 40% | 41% | 42% | 43% | 43% | 43% | 43% | 43% | 43% | 43% | |||||||
| Meadow Bus/Res. | $1,505 | $11,659 | $13,637 | $17,136 | $20,531 | $21,730 | $22,245 | $22,854 | $23,463 | $24,073 | $24,682 | $25,292 | $25,901 | $26,511 | $27,120 | $27,730 | $28,339 | $28,948 | $29,558 | $121,888.15 | $126,763.67 | |||||||
| Count | 9 | 35 | 40 | 51 | 58 | 59 | 61 | 62 | 64 | 66 | 67 | 69 | 71 | 72 | 74 | 76 | 77 | 79 | 80 | 84 | 87 | |||||||
| ARPU | $167 | $124 | $115 | $122 | $124 | $124 | $124 | $124 | $124 | $124 | $124 | $124 | $124 | $124 | $124 | $124 | $124 | $124 | $124 | $124 | $124 | |||||||
| Passings | 219 | 219 | 219 | 219 | 219 | 219 | 219 | 219 | 219 | 219 | 219 | 219 | 219 | 219 | 219 | 219 | 219 | 219 | 219 | 219 | 219 | |||||||
| Take Rate | 4% | 16% | 18% | 23% | 26% | 27% | 28% | 29% | 29% | 30% | 31% | 32% | 32% | 33% | 34% | 35% | 35% | 36% | 37% | 38% | 40% | |||||||
| Ropesville Bus/Res. | $467 | $7,931 | $9,430 | $11,351 | $12,371 | $13,093 | $13,912 | $14,559 | $15,012 | $15,465 | $15,917 | $16,370 | $16,823 | $17,275 | $17,728 | $18,180 | $18,633 | $19,086 | $19,538 | $81,774.47 | $87,205.98 | |||||||
| Count | 4 | 27 | 32 | 37 | 40 | 43 | 44 | 45 | 47 | 48 | 49 | 51 | 52 | 54 | 55 | 56 | 58 | 59 | 61 | 65 | 69 | |||||||
| ARPU | $117 | $112 | $99 | $106 | $106 | $106 | $107 | $109 | $109 | $109 | $109 | $109 | $109 | $109 | $109 | $109 | $109 | $109 | $109 | $109 | $109 | |||||||
| Passings | 185 | 185 | 185 | 185 | 185 | 185 | 185 | 185 | 185 | 185 | 185 | 185 | 185 | 185 | 185 | 185 | 185 | 185 | 185 | 185 | 185 | |||||||
| Take Rate | 2% | 15% | 17% | 20% | 22% | 23% | 24% | 25% | 25% | 26% | 27% | 28% | 28% | 29% | 30% | 31% | 31% | 32% | 33% | 35% | 37% | |||||||
| Plainview Bus. | $23,509 | $89,968 | $112,093 | $127,830 | $168,012 | $183,056 | $206,940 | $236,894 | $264,247 | $280,189 | $294,758 | $309,697 | $321,150 | $328,843 | $328,843 | $328,843 | $328,843 | $328,843 | $1,315,370 | $1,315,370 | ||||||||
| Count | 20 | 157 | 190 | 212 | 219 | 231 | 268 | 305 | 317 | 325 | 334 | 342 | 342 | 342 | 342 | 342 | 342 | 342 | 342 | 342 | ||||||||
| ARPU | $1,119 | $234 | $205 | $207 | $260 | $271 | $276 | $276 | $283 | $291 | $298 | $306 | $313 | $321 | $321 | $321 | $321 | $321 | $321 | $321 | ||||||||
| Passings | 547 | 547 | 547 | 547 | 547 | 547 | 547 | 547 | 547 | 547 | 547 | 547 | 547 | 547 | 547 | 547 | 547 | 547 | 547 | 547 | ||||||||
| Take Rate | 4% | 29% | 35% | 39% | 40% | 42% | 49% | 56% | 58% | 60% | 61% | 63% | 63% | 63% | 63% | 63% | 63% | 63% | 63% | 63% | ||||||||
| Plainview Res. | $643 | $22,675 | $61,993 | $104,918 | $122,125 | $144,646 | $168,572 | $189,432 | $207,068 | $222,037 | $237,006 | $251,975 | $266,944 | $281,912 | $296,881 | $311,850 | $326,819 | $341,788 | $1,427,026 | $1,456,963 | ||||||||
| Count | 5 | 97 | 254 | 367 | 431 | 501 | 570 | 616 | 662 | 708 | 755 | 801 | 847 | 893 | 939 | 986 | 1,032 | 1,078 | 1,124 | 1,124 | ||||||||
| ARPU | $129 | $117 | $104 | $101 | $102 | $104 | $105 | $107 | $108 | $108 | $108 | $108 | $108 | $108 | $108 | $108 | $108 | $108 | $108 | $108 | ||||||||
| Passings | 3,080 | 3,080 | 3,080 | 3,080 | 3,080 | 3,080 | 3,080 | 3,080 | 3,080 | 3,080 | 3,080 | 3,080 | 3,080 | 3,080 | 3,080 | 3,080 | 3,080 | 3,080 | 3,080 | 3,080 | ||||||||
| Take Rate | 0% | 3% | 8% | 12% | 14% | 16% | 19% | 20% | 22% | 23% | 25% | 26% | 28% | 29% | 31% | 32% | 34% | 35% | 37% | 37% | ||||||||
| Plainview Totals | $24,152 | $112,643 | $174,086 | $232,748 | $290,137 | $327,703 | $375,513 | $426,325 | $471,316 | $502,227 | $531,764 | $561,671 | $588,094 | $610,755 | $625,724 | $640,693 | $655,661 | $670,630 | $2,742,396 | $2,772,333 | ||||||||
| Count | 25 | 254 | 444 | 579 | 650 | 732 | 838 | 921 | 979 | 1,034 | 1,088 | 1,143 | 1,189 | 1,235 | 1,281 | 1,327 | 1,374 | 1,420 | 1,466 | 1,466 | ||||||||
| ARPU | $929 | $195 | $153 | $140 | $149 | $149 | $149 | $154 | $160 | $162 | $163 | $164 | $165 | $165 | $163 | $161 | $159 | $157 | $155.88 | $157.58 | ||||||||
| Passings | 3,627 | 3,627 | 3,627 | 3,627 | 3,627 | 3,627 | 3,627 | 3,627 | 3,627 | 3,627 | 3,627 | 3,627 | 3,627 | 3,627 | 3,627 | 3,627 | 3,627 | 3,627 | 3,627 | 3,627 | ||||||||
| Take Rate | 1% | 7% | 12% | 16% | 18% | 20% | 23% | 25% | 27% | 29% | 30% | 32% | 33% | 34% | 35% | 37% | 38% | 39% | 40% | 40% | ||||||||
| Wichita Falls Bus. | $9,144 | $73,591 | $150,722 | $179,189 | $233,767 | $288,057 | $331,559 | $350,524 | $369,756 | $389,253 | $403,477 | $417,879 | $432,458 | $441,541 | $444,995 | $448,449 | $451,903 | $1,842,151.62 | $1,897,416.17 | |||||||||
| Count | 26 | 180 | 241 | 321 | 396 | 475 | 479 | 483 | 487 | 490 | 494 | 498 | 502 | 506 | 510 | 514 | 518 | 534 | 550 | |||||||||
| ARPU | $277 | $214 | $215 | $213 | $217 | $221 | $232 | $243 | $254 | $266 | $273 | $281 | $288 | $292 | $292 | $292 | $292 | $292 | $292 | |||||||||
| Passings | 300 | 1,050 | 1,052 | 1,052 | 1,052 | 1,052 | 1,052 | 1,052 | 1,052 | 1,052 | 1,052 | 1,052 | 1,052 | 1,052 | 1,052 | 1,052 | 1,052 | 1,052 | 1,052 | |||||||||
| Take Rate | 9% | 17% | 23% | 31% | 38% | 45% | 46% | 46% | 46% | 47% | 47% | 47% | 48% | 48% | 49% | 49% | 49% | 51% | 52% | |||||||||
| Iowa Park Bus. | $0 | $6,228 | $9,197 | $11,520 | $14,912 | $18,109 | $26,477 | $39,812 | $49,386 | $53,807 | $58,410 | $63,196 | $68,163 | $72,296 | $76,550 | $80,925 | $85,422 | $351,050.45 | $355,731.12 | |||||||||
| Count | 0 | 12 | 21 | 27 | 31 | 35 | 55 | 76 | 78 | 81 | 84 | 86 | 89 | 92 | 95 | 97 | 100 | 103 | 103 | |||||||||
| ARPU | $0 | $283 | $192 | $160 | $171 | $183 | $195 | $203 | $214 | $225 | $236 | $248 | $259 | $266 | $274 | $281 | $289 | $289 | $289 | |||||||||
| Passings | 180 | 180 | 180 | 180 | 180 | 180 | 180 | 180 | 180 | 180 | 180 | 180 | 180 | 180 | 180 | 180 | 180 | 180 | 180 | |||||||||
| Take Rate | 0% | 7% | 12% | 15% | 17% | 20% | 31% | 42% | 44% | 45% | 47% | 48% | 50% | 51% | 53% | 54% | 56% | 57% | 57% | |||||||||
| Iowa Park Res. | $2,324 | $50,203 | $68,837 | $91,274 | $114,072 | $134,523 | $152,320 | $165,049 | $177,777 | $190,506 | $203,235 | $215,963 | $228,692 | $241,421 | $254,149 | $266,878 | $279,607 | $1,182,069.85 | $1,220,255.88 | |||||||||
| Count | 23 | 192 | 254 | 331 | 390 | 448 | 488 | 527 | 566 | 605 | 644 | 683 | 722 | 761 | 800 | 839 | 879 | 937 | 937 | |||||||||
| ARPU | $101 | $112 | $98 | $104 | $106 | $107 | $109 | $109 | $109 | $109 | $109 | $109 | $109 | $109 | $109 | $109 | $109 | $109 | $109 | |||||||||
| Passings | 2,607 | 2,607 | 2,607 | 2,607 | 2,607 | 2,607 | 2,607 | 2,607 | 2,607 | 2,607 | 2,607 | 2,607 | 2,607 | 2,607 | 2,607 | 2,607 | 2,607 | 2,607 | 2,607 | |||||||||
| Take Rate | 1% | 7% | 10% | 13% | 15% | 17% | 19% | 20% | 22% | 23% | 25% | 26% | 28% | 29% | 31% | 32% | 34% | 36% | 36% | |||||||||
| Iowa Park Totals | $2,324 | $56,431 | $78,034 | $102,794 | $128,984 | $152,632 | $178,797 | $204,860 | $227,163 | $244,313 | $261,645 | $279,159 | $296,855 | $313,716 | $330,699 | $347,803 | $365,029 | $1,533,120 | $1,575,987 | |||||||||
| Count | 23 | 204 | 275 | 358 | 421 | 484 | 543 | 602 | 644 | 686 | 728 | 769 | 811 | 853 | 895 | 937 | 978 | 1,040 | 1,040 | |||||||||
| ARPU | $101 | $120 | $104 | $96 | $102 | $105 | $110 | $113 | $118 | $119 | $120 | $121 | $122 | $123 | $123 | $124 | $124 | $122.87 | $126.30 | |||||||||
| Passings | 2,787 | 2,787 | 2,787 | 2,787 | 2,787 | 2,787 | 2,787 | 2,787 | 2,787 | 2,787 | 2,787 | 2,787 | 2,787 | 2,787 | 2,787 | 2,787 | 2,787 | 2,787 | 2,787 | |||||||||
| Take Rate | 1% | 7% | 10% | 13% | 15% | 17% | 19% | 22% | 23% | 25% | 26% | 28% | 29% | 31% | 32% | 34% | 35% | 37% | 37% | |||||||||
| Hammond Bus | $16,310 | $83,887 | $143,631 | $172,400 | $199,180 | $221,993 | $245,856 | $270,770 | $296,733 | $323,746 | $351,809 | $380,923 | $411,086 | $442,299 | $474,562 | $2,050,957.86 | $2,273,083.26 | |||||||||||
| Count | 66 | 214 | 248 | 287 | 310 | 333 | 357 | 380 | 403 | 427 | 450 | 473 | 497 | 520 | 543 | 606 | 668 | |||||||||||
| ARPU | $177 | $200 | $208 | $215 | $223 | $230 | $238 | $245 | $253 | $260 | $268 | $275 | $283 | $290 | $298 | $298 | $298 | |||||||||||
| Passings | 2,074 | 2,074 | 2,074 | 2,074 | 2,074 | 2,074 | 2,074 | 2,074 | 2,074 | 2,074 | 2,074 | 2,074 | 2,074 | 2,074 | 2,074 | 2,074 | 2,074 | |||||||||||
| Take Rate | 3% | 10% | 12% | 14% | 15% | 16% | 17% | 18% | 19% | 21% | 22% | 23% | 24% | 25% | 26% | 29% | 32% | |||||||||||
| Hammond Res. | $5,196 | $13,054 | $44,409 | $117,798 | $194,698 | $250,217 | $286,561 | $304,356 | $304,667 | $302,566 | $306,613 | $309,649 | $311,906 | $308,326 | $1,231,434.92 | $1,246,380.27 | ||||||||||||
| Count | 0 | 33 | 49 | 227 | 496 | 699 | 837 | 922 | 946 | 924 | 933 | 949 | 951 | 962 | 929 | 960 | 952 | |||||||||||
| ARPU | $105 | $106 | $107 | $109 | $109 | $109 | $109 | $109 | $109 | $109 | $109 | $109 | $109 | $109 | $109 | $109 | ||||||||||||
| Passings | 3,302 | 3,302 | 3,302 | 3,302 | 3,302 | 3,302 | 3,302 | 3,302 | 3,302 | 3,302 | 3,302 | 3,302 | 3,302 | 3,302 | 3,302 | 3,302 | ||||||||||||
| Take Rate | 1% | 1% | 7% | 15% | 21% | 25% | 28% | 29% | 28% | 28% | 29% | 29% | 29% | 28% | 29% | 29% | ||||||||||||
| Hammond Total | $16,310 | $89,082 | $156,685 | $216,809 | $316,978 | $416,692 | $496,073 | $557,331 | $601,089 | $628,413 | $654,375 | $687,536 | $720,735 | $754,205 | $782,887 | $3,282,393 | $3,519,464 | |||||||||||
| Count | 247 | 297 | 514 | 806 | 1,032 | 1,193 | 1,302 | 1,349 | 1,350 | 1,383 | 1,422 | 1,448 | 1,482 | 1,473 | 1,565 | 1,620 | ||||||||||||
| ARPU | $120 | $176 | $141 | $131 | $135 | $139 | $143 | $149 | $155 | $158 | $161 | $166 | $170 | $177 | $174.76 | $181.02 | ||||||||||||
| Passings | 5,376 | 5,376 | 5,376 | 5,376 | 5,376 | 5,376 | 5,376 | 5,376 | 5,376 | 5,376 | 5,376 | 5,376 | 5,376 | 5,376 | 5,376 | 5,376 | ||||||||||||
| Take Rate | 5% | 6% | 10% | 15% | 19% | 22% | 24% | 25% | 25% | 26% | 26% | 27% | 28% | 27% | 29% | 30% | ||||||||||||
| Ponchatoula Bus | $0 | $22,761 | $56,903 | $74,779 | $85,638 | $97,066 | $109,063 | $121,629 | $134,764 | $148,468 | $162,741 | $177,583 | $192,994 | $208,974 | $893,053.13 | $964,497.38 | ||||||||||||
| Count | 0 | 0 | 76 | 114 | 126 | 139 | 152 | 164 | 177 | 190 | 202 | 215 | 228 | 240 | 253 | 274 | 295 | |||||||||||
| ARPU | $200 | $200 | $200 | $208 | $215 | $223 | $230 | $238 | $245 | $253 | $260 | $268 | $275 | $283 | $283 | $283 | ||||||||||||
| Passings | 562 | 562 | 562 | 562 | 562 | 562 | 562 | 562 | 562 | 562 | 562 | 562 | 562 | 562 | 562 | 562 | ||||||||||||
| Take Rate | 0% | 14% | 20% | 23% | 25% | 27% | 29% | 32% | 34% | 36% | 38% | 41% | 43% | 45% | 49% | 53% | ||||||||||||
| Ponchatoula Res | $0 | $3,203 | $18,183 | $48,232 | $79,719 | $102,451 | $117,332 | $124,618 | $124,746 | $123,885 | $125,542 | $126,785 | $127,710 | $126,244 | $504,209.57 | $510,328.93 | ||||||||||||
| Count | 0 | 0 | 20 | 93 | 203 | 286 | 343 | 377 | 387 | 378 | 382 | 388 | 390 | 394 | 381 | 393 | 390 | |||||||||||
| ARPU | $105 | $106 | $107 | $109 | $109 | $109 | $109 | $109 | $109 | $109 | $109 | $109 | $109 | $109 | $109 | $109 | ||||||||||||
| Passings | 1,352 | 1,352 | 1,352 | 1,352 | 1,352 | 1,352 | 1,352 | 1,352 | 1,352 | 1,352 | 1,352 | 1,352 | 1,352 | 1,352 | 1,352 | 1,352 | ||||||||||||
| Take Rate | 0% | 1% | 7% | 15% | 21% | 25% | 28% | 29% | 28% | 28% | 29% | 29% | 29% | 28% | 29% | 29% | ||||||||||||
| Ponchatoula Total | $0 | $25,964 | $75,086 | $123,011 | $165,357 | $199,517 | $226,395 | $246,247 | $259,510 | $272,353 | $288,284 | $304,369 | $320,704 | $335,218 | $1,397,263 | $1,474,826 | ||||||||||||
| Count | 0 | 96 | 207 | 329 | 425 | 494 | 542 | 564 | 568 | 584 | 603 | 617 | 634 | 633 | 667 | 685 | ||||||||||||
| ARPU | $0 | $90 | $121 | $124 | $130 | $135 | $139 | $145 | $152 | $155 | $159 | $164 | $169 | $176 | $174.61 | $179.42 | ||||||||||||
| Passings | 1,914 | 1,914 | 1,914 | 1,914 | 1,914 | 1,914 | 1,914 | 1,914 | 1,914 | 1,914 | 1,914 | 1,914 | 1,914 | 1,914 | 1,914 | 1,914 | ||||||||||||
| Take Rate | 0% | 5% | 11% | 17% | 22% | 26% | 28% | 29% | 30% | 31% | 32% | 32% | 33% | 33% | 35% | 36% | ||||||||||||
| Abilene Bus | $30,000 | $56,925 | $129,600 | $197,775 | $241,659 | $252,750 | $264,009 | $275,437 | $287,034 | $298,799 | $310,733 | $322,836 | $335,108 | $347,548 | $1,396,428 | $1,396,428 | ||||||||||||
| Count | 0 | 30 | 158 | 270 | 383 | 386 | 390 | 394 | 398 | 401 | 405 | 409 | 413 | 416 | 420 | 420 | 420 | |||||||||||
| ARPU | NM | $202 | $202 | $202 | $210 | $217 | $225 | $232 | $240 | $247 | $255 | $262 | $270 | $277 | $277 | $277 | ||||||||||||
| Passings | 1,000 | 1,000 | 1,000 | 1,000 | 1,000 | 1,000 | 1,000 | 1,000 | 1,000 | 1,000 | 1,000 | 1,000 | 1,000 | 1,000 | 1,000 | 1,000 | ||||||||||||
| Take Rate | 3% | 16% | 27% | 38% | 39% | 39% | 39% | 40% | 40% | 41% | 41% | 41% | 42% | 42% | 42% | 42% | ||||||||||||
| Abilene Res | ||||||||||||||||||||||||||||
| Count | ||||||||||||||||||||||||||||
| ARPU | ||||||||||||||||||||||||||||
| Passings | ||||||||||||||||||||||||||||
| Take Rate | ||||||||||||||||||||||||||||
| Abilene Total | $30,000 | $56,925 | $129,600 | $197,775 | $241,659 | $252,750 | $264,009 | $275,437 | $287,034 | $298,799 | $310,733 | $322,836 | $335,108 | $347,548 | $1,396,428 | $1,396,428 | ||||||||||||
| Count | 30 | 158 | 270 | 383 | 386 | 390 | 394 | 398 | 401 | 405 | 409 | 413 | 416 | 420 | 420 | 420 | ||||||||||||
| ARPU | NM | $202 | $202 | $202 | $210 | $217 | $225 | $232 | $240 | $247 | $255 | $262 | $270 | $277 | $277 | $277 | ||||||||||||
| Passings | 1,000 | 1,000 | 1,000 | 1,000 | 1,000 | 1,000 | 1,000 | 1,000 | 1,000 | 1,000 | 1,000 | 1,000 | 1,000 | 1,000 | 1,000 | 1,000 | ||||||||||||
| Take Rate | 3% | 16% | 27% | 38% | 39% | 39% | 39% | 40% | 40% | 41% | 41% | 41% | 42% | 42% | 42% | 42% | ||||||||||||
| Hale Center Bus | $915 | $2,603 | $4,331 | $6,515 | $9,690 | $12,883 | $15,023 | $16,657 | $18,879 | $20,844 | $21,916 | $23,326 | $24,973 | $26,277 | $106,426.31 | $109,587.48 | ||||||||||||
| Count | 0 | 3 | 5 | 8 | 11 | 17 | 19 | 21 | 23 | 26 | 26 | 27 | 28 | 29 | 30 | 30 | 31 | |||||||||||
| ARPU | $200 | $208 | $215 | $223 | $230 | $238 | $245 | $253 | $260 | $268 | $275 | $283 | $290 | $298 | $298 | $298 | ||||||||||||
| Passings | 61 | 61 | 61 | 61 | 61 | 61 | 61 | 61 | 61 | 61 | 61 | 61 | 61 | 61 | 61 | 61 | ||||||||||||
| Take Rate | 5% | 9% | 13% | 19% | 27% | 32% | 35% | 37% | 42% | 43% | 44% | 46% | 48% | 48% | 49% | 51% | ||||||||||||
| Hale Center Res | $12,556 | $31,637 | $46,404 | $60,470 | $69,254 | $73,554 | $73,629 | $73,122 | $74,100 | $74,833 | $75,379 | $74,514 | $74,401 | $75,304 | $299,083.10 | $298,080.06 | ||||||||||||
| Count | 0 | 80 | 120 | 169 | 202 | 223 | 229 | 223 | 225 | 229 | 230 | 233 | 225 | 232 | 230 | 229 | 229 | |||||||||||
| ARPU | $105 | $106 | $107 | $109 | $109 | $109 | $109 | $109 | $109 | $109 | $109 | $109 | $109 | $109 | $109 | $109 | ||||||||||||
| Passings | 798 | 798 | 798 | 798 | 798 | 798 | 798 | 798 | 798 | 798 | 798 | 798 | 798 | 798 | 798 | 798 | ||||||||||||
| Take Rate | 10% | 15% | 21% | 25% | 28% | 29% | 28% | 28% | 29% | 29% | 29% | 28% | 29% | 29% | 29% | 29% | ||||||||||||
| Hale Center Total | $13,471 | $34,240 | $50,735 | $66,986 | $78,944 | $86,437 | $88,653 | $89,779 | $92,978 | $95,678 | $97,295 | $97,840 | $99,374 | $101,581 | $405,509 | $407,668 | ||||||||||||
| Count | 83 | 125 | 177 | 214 | 239 | 248 | 245 | 248 | 255 | 256 | 260 | 253 | 261 | 260 | 259 | 260 | ||||||||||||
| ARPU | $54 | $91 | $96 | $105 | $110 | $116 | $121 | $121 | $122 | $125 | $125 | $129 | $127 | $130 | $130.61 | $130.71 | ||||||||||||
| Passings | 859 | 859 | 859 | 859 | 859 | 859 | 859 | 859 | 859 | 859 | 859 | 859 | 859 | 859 | 859 | 859 | ||||||||||||
| Take Rate | 10% | 15% | 21% | 25% | 28% | 29% | 28% | 29% | 30% | 30% | 30% | 29% | 30% | 30% | 30% | 30% | ||||||||||||
| Abernathy Bus | $2,247 | $5,893 | $8,876 | $13,216 | $17,589 | $20,532 | $22,786 | $25,848 | $28,563 | $30,055 | $32,013 | $34,297 | $36,113 | $146,261.03 | $150,605.42 | |||||||||||||
| Count | 0 | 7 | 11 | 16 | 24 | 27 | 30 | 32 | 36 | 37 | 38 | 40 | 41 | 42 | 42 | 44 | ||||||||||||
| ARPU | $200 | $208 | $215 | $223 | $230 | $238 | $245 | $253 | $260 | $268 | $275 | $283 | $290 | $290 | $290 | |||||||||||||
| Passings | 86 | 86 | 86 | 86 | 86 | 86 | 86 | 86 | 86 | 86 | 86 | 86 | 86 | 86 | 86 | |||||||||||||
| Take Rate | 9% | 13% | 19% | 27% | 32% | 35% | 37% | 42% | 43% | 44% | 46% | 48% | 48% | 49% | 51% | |||||||||||||
| Abernathy Res | $2,340 | $13,194 | $35,006 | $58,669 | $75,398 | $86,350 | $91,712 | $91,806 | $91,173 | $92,393 | $93,307 | $93,988 | $92,909 | $371,071.39 | $375,574.92 | |||||||||||||
| Count | 0 | 15 | 68 | 149 | 211 | 252 | 278 | 285 | 278 | 281 | 286 | 287 | 290 | 280 | 289 | 287 | ||||||||||||
| ARPU | $105 | $106 | $107 | $109 | $109 | $109 | $109 | $109 | $109 | $109 | $109 | $109 | $109 | $109 | $109 | |||||||||||||
| Passings | 995 | 995 | 995 | 995 | 995 | 995 | 995 | 995 | 995 | 995 | 995 | 995 | 995 | 995 | 995 | |||||||||||||
| Take Rate | 1% | 7% | 15% | 21% | 25% | 28% | 29% | 28% | 28% | 29% | 29% | 29% | 28% | 29% | 29% | |||||||||||||
| Abernathy Total | $4,587 | $19,088 | $43,882 | $71,885 | $92,988 | $106,882 | $114,499 | $117,654 | $119,736 | $122,447 | $125,321 | $128,285 | $129,021 | $517,332 | $526,180 | |||||||||||||
| Count | 22 | 80 | 165 | 234 | 280 | 308 | 317 | 315 | 318 | 324 | 326 | 331 | 322 | 332 | 331 | |||||||||||||
| ARPU | $68 | $80 | $88 | $102 | $111 | $116 | $120 | $125 | $126 | $126 | $128 | $129 | $134 | $130.01 | $132.43 | |||||||||||||
| Passings | 1,081 | 1,081 | 1,081 | 1,081 | 1,081 | 1,081 | 1,081 | 1,081 | 1,081 | 1,081 | 1,081 | 1,081 | 1,081 | 1,081 | 1,081 | |||||||||||||
| Take Rate | 2% | 7% | 15% | 22% | 26% | 28% | 29% | 29% | 29% | 30% | 30% | 31% | 30% | 31% | 31% | |||||||||||||
| New Deal Bus | $496 | $1,302 | $1,961 | $2,920 | $3,886 | $4,536 | $5,034 | $5,711 | $6,310 | $6,640 | $7,073 | $7,577 | $7,978 | $32,313.48 | $33,273.29 | |||||||||||||
| Count | 0 | 2 | 3 | 4 | 5 | 6 | 7 | 7 | 8 | 8 | 8 | 9 | 9 | 9 | 9 | 10 | ||||||||||||
| ARPU | $200 | $208 | $215 | $223 | $230 | $238 | $245 | $253 | $260 | $268 | $275 | $283 | $290 | $290 | $290 | |||||||||||||
| Passings | 19 | 19 | 19 | 19 | 19 | 19 | 19 | 19 | 19 | 19 | 19 | 19 | 19 | 19 | 19 | |||||||||||||
| Take Rate | 9% | 13% | 19% | 27% | 32% | 35% | 37% | 42% | 43% | 44% | 46% | 48% | 48% | 49% | 51% | |||||||||||||
| New Deal Res | $562 | $3,169 | $8,409 | $14,092 | $18,111 | $20,741 | $22,029 | $22,052 | $21,900 | $22,193 | $22,413 | $22,576 | $22,317 | $89,131.72 | $90,213.47 | |||||||||||||
| Count | 0 | 4 | 16 | 36 | 51 | 61 | 67 | 68 | 67 | 68 | 69 | 69 | 70 | 67 | 69 | 69 | ||||||||||||
| ARPU | $105 | $106 | $107 | $109 | $109 | $109 | $109 | $109 | $109 | $109 | $109 | $109 | $109 | $109 | $109 | |||||||||||||
| Passings | 239 | 239 | 239 | 239 | 239 | 239 | 239 | 239 | 239 | 239 | 239 | 239 | 239 | 239 | 239 | |||||||||||||
| Take Rate | 1% | 7% | 15% | 21% | 25% | 28% | 29% | 28% | 28% | 29% | 29% | 29% | 28% | 29% | 29% | |||||||||||||
| New Deal Total | $1,059 | $4,471 | $10,370 | $17,012 | $21,997 | $25,278 | $27,064 | $27,763 | $28,210 | $28,833 | $29,485 | $30,153 | $30,295 | $121,445 | $123,487 | |||||||||||||
| Count | 5 | 19 | 39 | 56 | 67 | 73 | 75 | 75 | 76 | 77 | 78 | 79 | 76 | 79 | 79 | |||||||||||||
| ARPU | $68 | $79 | $88 | $102 | $110 | $115 | $120 | $124 | $124 | $125 | $127 | $128 | $132 | $128.38 | $130.79 | |||||||||||||
| Passings | 258 | 258 | 258 | 258 | 258 | 258 | 258 | 258 | 258 | 258 | 258 | 258 | 258 | 258 | 258 | |||||||||||||
| Take Rate | 2% | 7% | 15% | 22% | 26% | 28% | 29% | 29% | 29% | 30% | 30% | 31% | 30% | 31% | 30% | |||||||||||||
| Amarillo Bus | $9,000 | $74,925 | $185,850 | $277,399 | $345,800 | $393,056 | $416,634 | $440,888 | $465,816 | $491,419 | $517,698 | $544,651 | $572,279 | $2,313,999 | $2,313,999 | |||||||||||||
| Count | 0 | 30 | 218 | 398 | 488 | 578 | 593 | 608 | 623 | 638 | 653 | 668 | 683 | 698 | 698 | 698 | ||||||||||||
| ARPU | $200 | $202 | $201 | $209 | $216 | $224 | $231 | $239 | $246 | $254 | $261 | $269 | $276 | $276 | $276 | |||||||||||||
| Passings | 2,000 | 2,000 | 2,000 | 2,000 | 2,000 | 2,000 | 2,000 | 2,000 | 2,000 | 2,000 | 2,000 | 2,000 | 2,000 | 2,000 | 2,000 | |||||||||||||
| Take Rate | 2% | 11% | 20% | 24% | 29% | 30% | 30% | 31% | 32% | 33% | 33% | 34% | 35% | 35% | 35% | |||||||||||||
| Amarillo Res | ||||||||||||||||||||||||||||
| Count | ||||||||||||||||||||||||||||
| ARPU | ||||||||||||||||||||||||||||
| Passings | ||||||||||||||||||||||||||||
| Take Rate | ||||||||||||||||||||||||||||
| Amarillo Total | $9,000 | $74,925 | $185,850 | $277,399 | $345,800 | $393,056 | $416,634 | $440,888 | $465,816 | $491,419 | $517,698 | $544,651 | $572,279 | $2,313,999 | $2,313,999 | |||||||||||||
| Count | 30 | 218 | 398 | 488 | 578 | 593 | 608 | 623 | 638 | 653 | 668 | 683 | 698 | 698 | 698 | |||||||||||||
| ARPU | $200 | $202 | $201 | $209 | $216 | $224 | $231 | $239 | $246 | $254 | $261 | $269 | $276 | $276 | $276 | |||||||||||||
| Passings | 2,000 | 2,000 | 2,000 | 2,000 | 2,000 | 2,000 | 2,000 | 2,000 | 2,000 | 2,000 | 2,000 | 2,000 | 2,000 | 2,000 | 2,000 | |||||||||||||
| Take Rate | 2% | 11% | 20% | 24% | 29% | 30% | 30% | 31% | 32% | 33% | 33% | 34% | 35% | 35% | 35% | |||||||||||||
| Tickfaw Village Bus | $0 | $373 | $929 | $1,383 | $1,841 | $2,149 | $2,385 | $2,705 | $2,989 | $3,145 | $3,350 | $3,589 | $3,779 | $15,306.39 | $15,761.03 | |||||||||||||
| Count | 0 | 0 | 1 | 2 | 2 | 3 | 3 | 3 | 4 | 4 | 4 | 4 | 4 | 4 | 4 | 5 | ||||||||||||
| ARPU | $200 | $208 | $215 | $223 | $230 | $238 | $245 | $253 | $260 | $268 | $275 | $283 | $290 | $290 | $290 | |||||||||||||
| Passings | 9 | 9 | 9 | 9 | 9 | 9 | 9 | 9 | 9 | 9 | 9 | 9 | 9 | 9 | 9 | |||||||||||||
| Take Rate | 0% | 13% | 19% | 27% | 32% | 35% | 37% | 42% | 43% | 44% | 46% | 48% | 48% | 49% | 51% | |||||||||||||
| Tickfaw Village Res | $0 | $1,196 | $6,792 | $18,016 | $29,777 | $38,268 | $43,826 | $46,547 | $46,595 | $46,274 | $46,893 | $47,357 | $47,702 | $188,618.43 | $188,332.72 | |||||||||||||
| Count | 0 | 0 | 8 | 35 | 76 | 107 | 128 | 141 | 145 | 141 | 143 | 145 | 146 | 147 | 142 | 147 | ||||||||||||
| ARPU | $105 | $106 | $107 | $109 | $109 | $109 | $109 | $109 | $109 | $109 | $109 | $109 | $109 | $109 | $109 | |||||||||||||
| Passings | �� | 505 | 505 | 505 | 505 | 505 | 505 | 505 | 505 | 505 | 505 | 505 | 505 | 505 | 505 | 505 | ||||||||||||
| Take Rate | 0% | 1% | 7% | 15% | 21% | 25% | 28% | 29% | 28% | 28% | 29% | 29% | 29% | 28% | 29% | |||||||||||||
| Tickfaw Village Totals | $0 | $1,569 | $7,721 | $19,399 | $31,617 | $40,416 | $46,211 | $49,252 | $49,584 | $49,419 | $50,243 | $50,946 | $51,481 | $203,925 | $204,094 | |||||||||||||
| Count | 0 | 9 | 36 | 78 | 110 | 131 | 144 | 148 | 145 | 147 | 149 | 150 | 152 | 147 | 151 | |||||||||||||
| ARPU | $0 | $60 | $71 | $83 | $96 | $103 | $107 | $111 | $114 | $112 | $112 | $113 | $113 | $115.93 | $112.36 | |||||||||||||
| Passings | 514 | 514 | 514 | 514 | 514 | 514 | 514 | 514 | 514 | 514 | 514 | 514 | 514 | 514 | 514 | |||||||||||||
| Take Rate | 0% | 2% | 7% | 15% | 21% | 26% | 28% | 29% | 28% | 29% | 29% | 29% | 29% | 29% | 29% | |||||||||||||
| Independence Bus | $0 | $456 | $1,135 | $1,690 | $2,250 | $2,626 | $2,915 | $3,306 | $3,653 | $3,844 | $4,095 | $4,387 | $4,619 | $18,707.81 | $19,263.48 | |||||||||||||
| Count | 0 | 0 | 1 | 2 | 3 | 4 | 4 | 4 | 5 | 5 | 5 | 5 | 5 | 5 | 5 | 6 | ||||||||||||
| ARPU | $200 | $208 | $215 | $223 | $230 | $238 | $245 | $253 | $260 | $268 | $275 | $283 | $290 | $290 | $290 | |||||||||||||
| Passings | 11 | 11 | 11 | 11 | 11 | 11 | 11 | 11 | 11 | 11 | 11 | 11 | 11 | 11 | 11 | |||||||||||||
| Take Rate | 0% | 13% | 19% | 27% | 32% | 35% | 37% | 42% | 43% | 44% | 46% | 48% | 48% | 49% | 51% | |||||||||||||
| Independence Res | $0 | $1,293 | $7,343 | $19,478 | $32,194 | $41,374 | $47,384 | $50,327 | $50,378 | $50,031 | $50,700 | $51,202 | $51,575 | $203,932.01 | $203,623.10 | |||||||||||||
| Count | 0 | 0 | 8 | 38 | 82 | 116 | 138 | 152 | 156 | 153 | 154 | 157 | 157 | 159 | 154 | 159 | ||||||||||||
| ARPU | $105 | $106 | $107 | $109 | $109 | $109 | $109 | $109 | $109 | $109 | $109 | $109 | $109 | $109 | $109 | |||||||||||||
| Passings | 546 | 546 | 546 | 546 | 546 | 546 | 546 | 546 | 546 | 546 | 546 | 546 | 546 | 546 | 546 | |||||||||||||
| Take Rate | 0% | 1% | 7% | 15% | 21% | 25% | 28% | 29% | 28% | 28% | 29% | 29% | 29% | 28% | 29% | |||||||||||||
| Independence Total | $0 | $1,749 | $8,478 | $21,169 | $34,444 | $44,001 | $50,299 | $53,633 | $54,031 | $53,875 | $54,795 | $55,589 | $56,194 | $222,640 | $222,887 | |||||||||||||
| Count | 0 | 10 | 40 | 85 | 119 | 142 | 156 | 161 | 157 | 159 | 162 | 163 | 164 | 159 | 164 | |||||||||||||
| ARPU | $0 | $61 | $71 | $83 | $96 | $103 | $107 | $111 | $114 | $113 | $113 | $114 | $114 | $116.60 | $113.04 | |||||||||||||
| Passings | 557 | 557 | 557 | 557 | 557 | 557 | 557 | 557 | 557 | 557 | 557 | 557 | 557 | 557 | 557 | |||||||||||||
| Take Rate | 0% | 2% | 7% | 15% | 21% | 26% | 28% | 29% | 28% | 29% | 29% | 29% | 30% | 29% | 29% | |||||||||||||
| Amite Bus | $0 | $3,645 | $9,082 | $13,523 | $17,998 | $21,010 | $23,316 | $26,449 | $29,227 | $30,754 | $32,758 | $35,095 | $36,953 | $149,662.45 | $154,107.87 | |||||||||||||
| Count | 0 | 0 | 12 | 16 | 24 | 28 | 31 | 33 | 37 | 38 | 39 | 40 | 42 | 43 | 43 | 45 | ||||||||||||
| ARPU | $200 | $208 | $215 | $223 | $230 | $238 | $245 | $253 | $260 | $268 | $275 | $283 | $290 | $290 | $290 | |||||||||||||
| Passings | 88 | 88 | 88 | 88 | 88 | 88 | 88 | 88 | 88 | 88 | 88 | 88 | 88 | 88 | 88 | |||||||||||||
| Take Rate | 0% | 13% | 19% | 27% | 32% | 35% | 37% | 42% | 43% | 44% | 46% | 48% | 48% | 49% | 51% | |||||||||||||
| Amite Res | $0 | $2,028 | $11,512 | $30,537 | $50,473 | $64,865 | $74,287 | $78,900 | $78,981 | $78,436 | $79,485 | $80,272 | $80,858 | $319,717.58 | $319,233.28 | |||||||||||||
| Count | 0 | 0 | 13 | 59 | 129 | 181 | 217 | 239 | 245 | 239 | 242 | 246 | 247 | 249 | 241 | 249 | ||||||||||||
| ARPU | $105 | $106 | $107 | $109 | $109 | $109 | $109 | $109 | $109 | $109 | $109 | $109 | $109 | $109 | $109 | |||||||||||||
| Passings | 856 | 856 | 856 | 856 | 856 | 856 | 856 | 856 | 856 | 856 | 856 | 856 | 856 | 856 | 856 | |||||||||||||
| Take Rate | 0% | 1% | 7% | 15% | 21% | 25% | 28% | 29% | 28% | 28% | 29% | 29% | 29% | 28% | 29% | |||||||||||||
| Amite Total | $0 | $5,672 | $20,595 | $44,061 | $68,471 | $85,875 | $97,603 | $105,349 | $108,208 | $109,190 | $112,243 | $115,367 | $117,810 | $469,380 | $473,341 | |||||||||||||
| Count | 0 | 25 | 75 | 153 | 209 | 248 | 272 | 282 | 277 | 281 | 286 | 289 | 292 | 284 | 294 | |||||||||||||
| ARPU | $0 | $77 | $91 | $96 | $109 | $116 | $120 | $124 | $130 | $130 | $131 | $133 | $134 | $137.54 | $134.22 | |||||||||||||
| Passings | 944 | 944 | 944 | 944 | 944 | 944 | 944 | 944 | 944 | 944 | 944 | 944 | 944 | 944 | 944 | |||||||||||||
| Take Rate | 0% | 3% | 8% | 16% | 22% | 26% | 29% | 30% | 29% | 30% | 30% | 31% | 31% | 30% | 31% | |||||||||||||
| Pine Grove Bus | $0 | $290 | $722 | $1,076 | $1,432 | $1,671 | $1,855 | $2,104 | $2,325 | $2,446 | $2,606 | $2,792 | $2,939 | $11,904.97 | $12,258.58 | |||||||||||||
| Count | 0 | 0 | 1 | 1 | 2 | 2 | 2 | 3 | 3 | 3 | 3 | 3 | 3 | 3 | 3 | 4 | ||||||||||||
| ARPU | $200 | $208 | $215 | $223 | $230 | $238 | $245 | $253 | $260 | $268 | $275 | $283 | $290 | $290 | $290 | |||||||||||||
| Passings | 7 | 7 | 7 | 7 | 7 | 7 | 7 | 7 | 7 | 7 | 7 | 7 | 7 | 7 | 7 | |||||||||||||
| Take Rate | 0% | 13% | 19% | 27% | 32% | 35% | 37% | 42% | 43% | 44% | 46% | 48% | 48% | 49% | 51% | |||||||||||||
| Pine Grove Res | $0 | $1,128 | $6,402 | $16,981 | $28,067 | $36,070 | $41,309 | $43,874 | $43,919 | $43,616 | $44,200 | $44,637 | $44,963 | $177,786.88 | $177,517.57 | |||||||||||||
| Count | 0 | 0 | 7 | 33 | 71 | 101 | 121 | 133 | 136 | 133 | 134 | 137 | 137 | 139 | 134 | 138 | ||||||||||||
| ARPU | $105 | $106 | $107 | $109 | $109 | $109 | $109 | $109 | $109 | $109 | $109 | $109 | $109 | $109 | $109 | |||||||||||||
| Passings | 476 | 476 | 476 | 476 | 476 | 476 | 476 | 476 | 476 | 476 | 476 | 476 | 476 | 476 | 476 | |||||||||||||
| Take Rate | 0% | 1% | 7% | 15% | 21% | 25% | 28% | 29% | 28% | 28% | 29% | 29% | 29% | 28% | 29% | |||||||||||||
| Pine Grove Total | $0 | $1,417 | $7,124 | $18,057 | $29,498 | $37,741 | $43,164 | $45,978 | $46,244 | $46,063 | $46,806 | $47,429 | $47,902 | $189,692 | $189,776 | |||||||||||||
| Count | 0 | 8 | 34 | 73 | 103 | 123 | 135 | 139 | 136 | 138 | 140 | 141 | 142 | 137 | 142 | |||||||||||||
| ARPU | $0 | $59 | $70 | $82 | $95 | $102 | $106 | $110 | $113 | $112 | $111 | $113 | $112 | $115.01 | $111.44 | |||||||||||||
| Passings | 483 | 483 | 483 | 483 | 483 | 483 | 483 | 483 | 483 | 483 | 483 | 483 | 483 | 483 | 483 | |||||||||||||
| Take Rate | 0% | 2% | 7% | 15% | 21% | 25% | 28% | 29% | 28% | 28% | 29% | 29% | 29% | 28% | 29% | |||||||||||||
| Montpelier Bus | $0 | $497 | $1,239 | $1,844 | $2,454 | $2,865 | $3,179 | $3,607 | $3,986 | $4,194 | $4,467 | $4,786 | $5,039 | $20,408.52 | $21,014.71 | |||||||||||||
| Count | 0 | 0 | 2 | 2 | 3 | 4 | 4 | 4 | 5 | 5 | 5 | 6 | 6 | 6 | 6 | 6 | ||||||||||||
| ARPU | $200 | $208 | $215 | $223 | $230 | $238 | $245 | $253 | $260 | $268 | $275 | $283 | $290 | $290 | $290 | |||||||||||||
| Passings | 12 | 12 | 12 | 12 | 12 | 12 | 12 | 12 | 12 | 12 | 12 | 12 | 12 | 12 | 12 | |||||||||||||
| Take Rate | 0% | 13% | 19% | 27% | 32% | 35% | 37% | 42% | 43% | 44% | 46% | 48% | 48% | 49% | 51% | |||||||||||||
| Montpelier Res | $0 | $1,812 | $10,289 | $27,291 | $45,107 | $57,970 | $66,390 | $70,512 | $70,585 | $70,098 | $71,035 | $71,739 | $72,262 | $285,728.91 | $285,296.10 | |||||||||||||
| Count | 0 | 0 | 11 | 53 | 115 | 162 | 194 | 214 | 219 | 214 | 216 | 220 | 220 | 223 | 215 | 222 | ||||||||||||
| ARPU | $105 | $106 | $107 | $109 | $109 | $109 | $109 | $109 | $109 | $109 | $109 | $109 | $109 | $109 | $109 | |||||||||||||
| Passings | 765 | 765 | 765 | 765 | 765 | 765 | 765 | 765 | 765 | 765 | 765 | 765 | 765 | 765 | 765 | |||||||||||||
| Take Rate | 0% | 1% | 7% | 15% | 21% | 25% | 28% | 29% | 28% | 28% | 29% | 29% | 29% | 28% | 29% | |||||||||||||
| Montpelier Total | $0 | $2,309 | $11,527 | $29,135 | $47,562 | $60,835 | $69,569 | $74,119 | $74,570 | $74,291 | $75,502 | $76,524 | $77,301 | $306,137 | $306,311 | |||||||||||||
| Count | 0 | 13 | 55 | 118 | 166 | 198 | 218 | 224 | 219 | 221 | 225 | 226 | 229 | 221 | 228 | |||||||||||||
| ARPU | $0 | $59 | $70 | $82 | $96 | $102 | $106 | $110 | $113 | $112 | $112 | $113 | $113 | $115.30 | $111.73 | |||||||||||||
| Passings | 777 | 777 | 777 | 777 | 777 | 777 | 777 | 777 | 777 | 777 | 777 | 777 | 777 | 777 | 777 | |||||||||||||
| Take Rate | 0% | 2% | 7% | 15% | 21% | 25% | 28% | 29% | 28% | 28% | 29% | 29% | 29% | 28% | 29% | |||||||||||||
| Franklinton Bus | $0 | $2,361 | $5,883 | $8,759 | $11,658 | $13,608 | $15,102 | $17,132 | $18,931 | $19,920 | $21,218 | $22,732 | $23,935 | $96,940 | $99,820 | |||||||||||||
| Count | 0 | 0 | 8 | 11 | 16 | 18 | 20 | 21 | 24 | 24 | 25 | 26 | 27 | 28 | 28 | 29 | ||||||||||||
| ARPU | $200 | $208 | $215 | $223 | $230 | $238 | $245 | $253 | $260 | $268 | $275 | $283 | $290 | $290 | $290 | |||||||||||||
| Passings | 57 | 57 | 57 | 57 | 57 | 57 | 57 | 57 | 57 | 57 | 57 | 57 | 57 | 57 | 57 | |||||||||||||
| Take Rate | 0% | 13% | 19% | 27% | 32% | 35% | 37% | 42% | 43% | 44% | 46% | 48% | 48% | 49% | 51% | |||||||||||||
| Franklinton Res | $0 | $474 | $2,690 | $7,135 | $11,793 | $15,155 | $17,357 | $18,435 | $18,453 | $18,326 | $18,571 | $18,755 | $18,892 | $74,700 | $74,587 | |||||||||||||
| Count | 0 | 0 | 3 | 14 | 30 | 42 | 51 | 56 | 57 | 56 | 56 | 57 | 58 | 58 | 56 | 58 | ||||||||||||
| ARPU | $105 | $106 | $107 | $109 | $109 | $109 | $109 | $109 | $109 | $109 | $109 | $109 | $109 | $108.65 | $108.65 | |||||||||||||
| Passings | 200 | 200 | 200 | 200 | 200 | 200 | 200 | 200 | 200 | 200 | 200 | 200 | 200 | 200 | 200 | |||||||||||||
| Take Rate | 0% | 1% | 7% | 15% | 21% | 25% | 28% | 29% | 28% | 28% | 29% | 29% | 29% | 28% | 29% | |||||||||||||
| Franklington Total | $0 | $2,834 | $8,573 | $15,894 | $23,451 | $28,764 | $32,459 | $35,566 | $37,385 | $38,246 | $39,790 | $41,487 | $42,827 | $171,641 | $174,407 | |||||||||||||
| Count | 0 | 11 | 24 | 46 | 61 | 71 | 77 | 81 | 80 | 82 | 84 | 85 | 86 | 84 | 87 | |||||||||||||
| ARPU | $0 | $89 | $117 | $116 | $129 | $136 | $141 | $146 | $155 | $156 | $159 | $163 | $166 | $169 | $166 | |||||||||||||
| Passings | 257 | 257 | 257 | 257 | 257 | 257 | 257 | 257 | 257 | 257 | 257 | 257 | 257 | 257 | 257 | |||||||||||||
| Take Rate | 0% | 4% | 9% | 18% | 24% | 27% | 30% | 32% | 31% | 32% | 33% | 33% | 33% | 33% | 34% | |||||||||||||
| Towers Bus | $0 | $5,508 | $13,727 | $20,438 | $27,202 | $31,753 | $35,239 | $39,974 | $44,173 | $46,480 | $49,509 | $53,041 | $55,849 | $226,194.39 | $232,913.03 | |||||||||||||
| Count | 0 | 0 | 18 | 25 | 36 | 42 | 47 | 49 | 56 | 57 | 59 | 61 | 64 | 64 | 66 | 68 | ||||||||||||
| ARPU | $200 | $208 | $215 | $223 | $230 | $238 | $245 | $253 | $260 | $268 | $275 | $283 | $290 | $290 | $290 | |||||||||||||
| Passings | 133 | 133 | 133 | 133 | 133 | 133 | 133 | 133 | 133 | 133 | 133 | 133 | 133 | 133 | 133 | |||||||||||||
| Take Rate | 0% | 13% | 19% | 27% | 32% | 35% | 37% | 42% | 43% | 44% | 46% | 48% | 48% | 49% | 51% | |||||||||||||
| Towers Res | $0 | $1,999 | $11,272 | $29,905 | $50,119 | $64,411 | $73,766 | $78,347 | $78,427 | $77,886 | $78,928 | $79,710 | $80,291 | $317,476.57 | $316,995.66 | |||||||||||||
| Count | 0 | 0 | 13 | 58 | 128 | 180 | 215 | 237 | 243 | 238 | 240 | 244 | 245 | 248 | 239 | 247 | ||||||||||||
| ARPU | $105 | $105 | $106 | $107 | $109 | $109 | $109 | $109 | $109 | $109 | $109 | $109 | $109 | $109 | $109 | |||||||||||||
| Passings | 850 | 850 | 850 | 850 | 850 | 850 | 850 | 850 | 850 | 850 | 850 | 850 | 850 | 850 | 850 | |||||||||||||
| Take Rate | 0% | 1% | 7% | 15% | 21% | 25% | 28% | 29% | 28% | 28% | 29% | 29% | 29% | 28% | 29% | |||||||||||||
| Towers Totals | $0 | $7,508 | $24,999 | $50,343 | $77,321 | $96,164 | $109,006 | $118,321 | $122,601 | $124,367 | $128,437 | $132,751 | $136,140 | $543,671 | $549,909 | |||||||||||||
| Count | 0 | 30 | 83 | 164 | 222 | 262 | 287 | 300 | 295 | 299 | 305 | 309 | 312 | 305 | 315 | |||||||||||||
| ARPU | $0 | $82 | $100 | $102 | $116 | $122 | $127 | $132 | $139 | $139 | $140 | $143 | $145 | $148.59 | $145.37 | |||||||||||||
| Passings | 983 | 983 | 983 | 983 | 983 | 983 | 983 | 983 | 983 | 983 | 983 | 983 | 983 | 983 | 983 | |||||||||||||
| Take Rate | 0% | 3% | 8% | 17% | 23% | 27% | 29% | 30% | 30% | 30% | 31% | 31% | 32% | 31% | 32% | |||||||||||||
| Natalbany Bus | $0 | $1,035 | $2,580 | $3,842 | $5,113 | $5,969 | $6,624 | $7,514 | $8,303 | $8,737 | $9,306 | $9,970 | $10,498 | $42,517.74 | $43,780.65 | |||||||||||||
| Count | 0 | 0 | 3 | 5 | 7 | 8 | 9 | 9 | 11 | 11 | 11 | 11 | 12 | 12 | 12 | 13 | ||||||||||||
| ARPU | $200 | $208 | $215 | $223 | $230 | $238 | $245 | $253 | $260 | $268 | $275 | $283 | $290 | $290 | $290 | |||||||||||||
| Passings | 25 | 25 | 25 | 25 | 25 | 25 | 25 | 25 | 25 | 25 | 25 | 25 | 25 | 25 | 25 | |||||||||||||
| Take Rate | 0% | 13% | 19% | 27% | 32% | 35% | 37% | 42% | 43% | 44% | 46% | 48% | 48% | 49% | 51% | |||||||||||||
| Natalbany Res | $0 | $746 | $4,236 | $11,238 | $18,574 | $23,870 | $27,337 | $29,035 | $29,064 | $28,864 | $29,250 | $29,540 | $29,755 | $117,653.08 | $117,474.86 | |||||||||||||
| Count | 0 | 0 | 5 | 22 | 47 | 67 | 80 | 88 | 90 | 88 | 89 | 90 | 91 | 92 | 89 | 92 | ||||||||||||
| ARPU | $105 | $106 | $107 | $109 | $109 | $109 | $109 | $109 | $109 | $109 | $109 | $109 | $109 | $109 | $109 | |||||||||||||
| Passings | 315 | 315 | 315 | 315 | 315 | 315 | 315 | 315 | 315 | 315 | 315 | 315 | 315 | 315 | 315 | |||||||||||||
| Take Rate | 0% | 1% | 7% | 15% | 21% | 25% | 28% | 29% | 28% | 28% | 29% | 29% | 29% | 28% | 29% | |||||||||||||
| Natalbany Totals | $0 | $1,782 | $6,817 | $15,079 | $23,687 | $29,838 | $33,961 | $36,548 | $37,367 | $37,601 | $38,556 | $39,510 | $40,253 | $160,171 | $161,256 | |||||||||||||
| Count | 0 | 8 | 26 | 54 | 75 | 89 | 97 | 101 | 99 | 100 | 102 | 103 | 104 | 101 | 104 | |||||||||||||
| ARPU | $0 | $74 | $86 | $93 | $106 | $112 | $116 | $121 | $126 | $125 | $126 | $128 | $129 | $132.15 | $128.76 | |||||||||||||
| Passings | 340 | 340 | 340 | 340 | 340 | 340 | 340 | 340 | 340 | 340 | 340 | 340 | 340 | 340 | 340 | |||||||||||||
| Take Rate | 0% | 2% | 8% | 16% | 22% | 26% | 29% | 30% | 29% | 29% | 30% | 30% | 31% | 30% | 31% | |||||||||||||
| Midland Bus | $1,980 | $12,524 | $28,512 | $43,511 | $53,165 | $55,605 | $58,082 | $60,596 | $63,147 | $262,943 | $273,445 | |||||||||||||||||
| Count | 0 | 7 | 35 | 59 | 84 | 85 | 86 | 87 | 87 | 88 | 89 | 90 | ||||||||||||||||
| ARPU | $0 | $0 | $200 | $202 | $202 | $202 | $210 | $217 | $225 | $232 | $240 | $247 | $255 | |||||||||||||||
| Passings | 220 | 220 | 220 | 220 | 220 | 220 | 220 | 220 | 220 | 220 | 220 | 220 | 220 | |||||||||||||||
| Take Rate | 3% | 16% | 27% | 38% | 39% | 39% | 39% | 40% | 40% | 41% | 41% | |||||||||||||||||
| Odessa Bus | $0 | $1,980 | $12,524 | $28,512 | $43,511 | $53,165 | $55,605 | $58,082 | $60,596 | $252,590 | $262,943 | |||||||||||||||||
| Count | 0 | 0 | 7 | 35 | 59 | 84 | 85 | 86 | 87 | 87 | 88 | 89 | ||||||||||||||||
| ARPU | $0 | $0 | $0 | $200 | $202 | $202 | $202 | $210 | $217 | $225 | $232 | $240 | $247 | |||||||||||||||
| Passings | 220 | 220 | 220 | 220 | 220 | 220 | 220 | 220 | 220 | 220 | 220 | 220 | 220 | |||||||||||||||
| Take Rate | 0% | 3% | 16% | 27% | 38% | 39% | 39% | 39% | 40% | 40% | 41% | |||||||||||||||||
| Snyder Bus | $4,280 | $13,204 | $20,076 | $29,449 | $37,782 | $43,941 | $48,596 | $54,945 | $242,115 | $254,014 | ||||||||||||||||||
| Count | 0 | 14 | 22 | 31 | 45 | 52 | 57 | 60 | 69 | 70 | 72 | |||||||||||||||||
| ARPU | $201 | $245 | $256 | $261 | $260 | $268 | $275 | $283 | $290 | $298 | ||||||||||||||||||
| Passings | 163 | 163 | 163 | 163 | 163 | 163 | 163 | 163 | 163 | 163 | 163 | |||||||||||||||||
| Take Rate | 9% | 13% | 19% | 27% | 32% | 35% | 37% | 42% | 43% | 44% | ||||||||||||||||||
| Snyder Res | $1,535 | $8,676 | $23,124 | $38,928 | $50,029 | $57,295 | $60,853 | $60,916 | $241,982 | $245,219 | ||||||||||||||||||
| Count | 0 | 10 | 45 | 98 | 138 | 165 | 182 | 187 | 183 | 184 | 187 | |||||||||||||||||
| ARPU | $105 | $106 | $108 | $110 | $110 | $110 | $110 | $110 | $110 | $110 | ||||||||||||||||||
| Passings | 653 | 653 | 653 | 653 | 653 | 653 | 653 | 653 | 653 | 653 | 653 | |||||||||||||||||
| Take Rate | 1% | 7% | 15% | 21% | 25% | 28% | 29% | 28% | 28% | 29% | ||||||||||||||||||
| Snyder Total | $5,814 | $21,880 | $43,200 | $68,378 | $87,811 | $101,236 | $109,449 | $115,861 | $484,097 | $499,233 | ||||||||||||||||||
| Count | 24 | 67 | 129 | 183 | 217 | 239 | 247 | 252 | 254 | 260 | ||||||||||||||||||
| ARPU | $81 | $110 | $112 | $125 | $135 | $141 | $148 | $153 | $159 | $160 | ||||||||||||||||||
| Passings | 816 | 816 | 816 | 816 | 816 | 816 | 816 | 816 | 816 | 816 | 816 | |||||||||||||||||
| Take Rate | 3% | 8% | 16% | 22% | 27% | 29% | 30% | 31% | 31% | 32% | ||||||||||||||||||
| Sweetwater Bus | $3,923 | $12,104 | $18,403 | $26,995 | $34,633 | $40,279 | $44,546 | $50,366 | $221,939 | $232,846 | ||||||||||||||||||
| Count | 0 | 13 | 20 | 28 | 41 | 48 | 52 | 55 | 63 | 64 | 66 | |||||||||||||||||
| ARPU | $201 | $245 | $256 | $261 | $260 | $268 | $275 | $283 | $290 | $298 | ||||||||||||||||||
| Passings | 150 | 150 | 150 | 150 | 150 | 150 | 150 | 150 | 150 | 150 | 150 | |||||||||||||||||
| Take Rate | 9% | 13% | 19% | 27% | 32% | 35% | 37% | 42% | 43% | 44% | ||||||||||||||||||
| Sweetwater Res | $1,407 | $7,953 | $21,197 | $35,683 | $45,858 | $52,519 | $55,781 | $55,838 | $221,811 | $224,778 | ||||||||||||||||||
| Count | 0 | 9 | 41 | 90 | 127 | 152 | 167 | 171 | 167 | 169 | 172 | |||||||||||||||||
| ARPU | $105 | $106 | $108 | $110 | $110 | $110 | $110 | $110 | $110 | $110 | ||||||||||||||||||
| Passings | 598 | 598 | 598 | 598 | 598 | 598 | 598 | 598 | 598 | 598 | 598 | |||||||||||||||||
| Take Rate | 1% | 7% | 15% | 21% | 25% | 28% | 29% | 28% | 28% | 29% | ||||||||||||||||||
| Sweetwater Total | $5,330 | $20,057 | $39,599 | $62,679 | $80,492 | $92,798 | $100,327 | $106,204 | $443,749 | $457,624 | ||||||||||||||||||
| Count | 22 | 61 | 118 | 168 | 199 | 219 | 227 | 231 | 233 | 238 | ||||||||||||||||||
| ARPU | $81 | $110 | $112 | $125 | $135 | $141 | $148 | $153 | $158.67 | $160.18 | ||||||||||||||||||
| Passings | 748 | 748 | 748 | 748 | 748 | 748 | 748 | 748 | 748 | 748 | 748 | |||||||||||||||||
| Take Rate | 3% | 8% | 16% | 22% | 27% | 29% | 30% | 31% | 31% | 32% | ||||||||||||||||||
| Pampa Bus | $8,470 | $26,134 | $39,733 | $58,285 | $74,777 | $86,966 | $96,179 | $108,745 | $479,186 | $502,736 | ||||||||||||||||||
| Count | 0 | 28 | 43 | 60 | 88 | 103 | 113 | 120 | 137 | 138 | 143 | |||||||||||||||||
| ARPU | $201 | $245 | $256 | $261 | $260 | $268 | $275 | $283 | $290 | $298 | ||||||||||||||||||
| Passings | 323 | 323 | 323 | 323 | 323 | 323 | 323 | 323 | 323 | 323 | 323 | |||||||||||||||||
| Take Rate | 9% | 13% | 19% | 27% | 32% | 35% | 37% | 42% | 43% | 44% | ||||||||||||||||||
| Pampa Res | $3,039 | $17,176 | $45,781 | $77,069 | $99,046 | $113,432 | $120,476 | $120,599 | $479,069 | $485,478 | ||||||||||||||||||
| Count | 0 | 19 | 89 | 194 | 273 | 327 | 361 | 370 | 361 | 365 | 371 | |||||||||||||||||
| ARPU | $105 | $106 | $108 | $110 | $110 | $110 | $110 | $110 | $110 | $110 | ||||||||||||||||||
| Passings | 1,292 | 1,292 | 1,292 | 1,292 | 1,292 | 1,292 | 1,292 | 1,292 | 1,292 | 1,292 | 1,292 | |||||||||||||||||
| Take Rate | 1% | 7% | 15% | 21% | 25% | 28% | 29% | 28% | 28% | 29% | ||||||||||||||||||
| Pampa Total | $11,509 | $43,310 | $85,513 | $135,354 | $173,822 | $200,398 | $216,655 | $229,344 | $958,256 | $988,215 | ||||||||||||||||||
| Count | 47 | 132 | 254 | 362 | 430 | 474 | 490 | 498 | 503 | 514 | ||||||||||||||||||
| ARPU | $81 | $110 | $112 | $125 | $135 | $141 | $148 | $153 | $158.66 | $160.17 | ||||||||||||||||||
| Passings | 1,615 | 1,615 | 1,615 | 1,615 | 1,615 | 1,615 | 1,615 | 1,615 | 1,615 | 1,615 | 1,615 | |||||||||||||||||
| Take Rate | 3% | 8% | 16% | 22% | 27% | 29% | 30% | 31% | 31% | 32% | ||||||||||||||||||
| NTS / Telephone Fiber Revenue | ||||||||||||||||||||||||||||
| Lubbock | $2,011,475 | $2,065,222 | $2,079,349 | $2,128,949 | $2,238,126 | $2,310,016 | $2,283,810 | $2,314,703 | $2,350,760 | $2,348,094 | $2,374,799 | $2,387,279 | $2,409,516 | $2,438,052 | $2,473,190 | $2,508,793 | $2,544,861 | $2,581,396 | $2,618,395 | $2,655,860 | $2,693,790 | $2,732,185 | $2,762,515 | $2,792,906 | $11,387,948 | $11,729,426 | ||
| Wolfforth | $196,255 | $196,144 | $198,019 | $201,732 | $200,983 | $204,815 | $202,702 | $211,093 | $218,959 | $209,236 | $208,854 | $209,445 | $211,830 | $216,985 | $225,038 | $233,258 | $241,648 | $250,207 | $258,934 | $265,234 | $271,534 | $277,834 | $284,134 | $290,434 | $1,221,360 | $1,316,760 | ||
| Misc. Bus. Fiber - Other Mks | $19,916 | $19,811 | $20,101 | $21,399 | $20,863 | $22,902 | $25,119 | $26,229 | $25,138 | $22,670 | $22,670 | $22,670 | $22,670 | $22,670 | $22,670 | $22,670 | $22,670 | $22,670 | $22,670 | $22,670 | $22,670 | $22,670 | $22,670 | $22,670 | $90,679 | $90,679 | ||
| Levelland | $697,577 | $739,232 | $855,495 | $806,314 | $841,796 | $884,299 | $879,571 | $874,508 | $889,346 | $913,472 | $921,687 | $926,402 | $932,634 | $941,998 | $954,560 | $967,214 | $975,352 | $983,495 | $991,644 | $999,797 | $1,007,956 | $1,016,120 | $1,024,289 | $1,032,463 | $4,144,228 | $4,144,228 | ||
| Smyer | $19,886 | $19,743 | $20,204 | $22,924 | $26,894 | $25,000 | $25,121 | $22,616 | $26,598 | $26,832 | $26,466 | $25,979 | $25,993 | $26,140 | $26,421 | $26,702 | $26,983 | $27,264 | $27,545 | $27,826 | $28,107 | $28,388 | $28,669 | $28,950 | $118,611 | $123,107 | ||
| Total Revenue | $2,945,109 | $3,040,152 | $3,173,168 | $3,181,318 | $3,328,662 | $3,447,031 | $3,416,322 | $3,449,149 | $3,510,801 | $3,520,303 | $3,554,475 | $3,571,775 | $3,602,642 | $3,645,844 | $3,701,877 | $3,758,637 | $3,811,515 | $3,865,031 | $3,919,187 | $3,971,386 | $4,024,056 | $4,077,197 | $4,122,277 | $4,167,423 | $16,962,825 | $17,404,200 | ||
| NTS Variable COGS | ||||||||||||||||||||||||||||
| Bus Revenue | $1,801,965 | $1,862,533 | $1,978,050 | $1,982,110 | $2,118,108 | $2,237,649 | $2,231,146 | $2,289,518 | $2,328,328 | $2,340,909 | $2,381,599 | $2,394,133 | $2,411,887 | $2,429,707 | $2,447,593 | $2,465,545 | $2,483,563 | $2,501,647 | $2,519,797 | $2,538,013 | $2,556,295 | $2,574,643 | $2,593,057 | $2,611,536 | $10,523,350 | $10,639,534 | ||
| Res Revenue | $1,143,144 | $1,177,619 | $1,195,118 | $1,199,208 | $1,210,554 | $1,209,382 | $1,185,176 | $1,159,631 | $1,182,473 | $1,179,394 | $1,172,876 | $1,177,642 | $1,190,755 | $1,216,137 | $1,254,284 | $1,293,092 | $1,327,951 | $1,363,384 | $1,399,390 | $1,433,373 | $1,467,761 | $1,502,554 | $1,529,221 | $1,555,887 | $6,439,476 | $6,764,666 | ||
| Total NTS Revenue | $2,945,109 | $3,040,152 | $3,173,168 | $3,181,318 | $3,328,662 | $3,447,031 | $3,416,322 | $3,449,149 | $3,510,801 | $3,520,303 | $3,554,475 | $3,571,775 | $3,602,642 | $3,645,844 | $3,701,877 | $3,758,637 | $3,811,515 | $3,865,031 | $3,919,187 | $3,971,386 | $4,024,056 | $4,077,197 | $4,122,277 | $4,167,423 | $16,962,825 | $17,404,200 | ||
| Bus Revenue, % | 61.2% | 61.3% | 62.3% | 62.3% | 63.6% | 64.9% | 65.3% | 66.4% | 66.3% | 66.5% | 67.0% | 67.0% | 66.9% | 66.6% | 66.1% | 65.6% | 65.2% | 64.7% | 64.3% | 63.9% | 63.5% | 63.1% | 62.9% | 62.7% | 62.0% | 61.1% | ||
| Res Revenue, % | 38.8% | 38.7% | 37.7% | 37.7% | 36.4% | 35.1% | 34.7% | 33.6% | 33.7% | 33.5% | 33.0% | 33.0% | 33.1% | 33.4% | 33.9% | 34.4% | 34.8% | 35.3% | 35.7% | 36.1% | 36.5% | 36.9% | 37.1% | 37.3% | 38.0% | 38.9% | ||
| Total Revenue, % | 100.0% | 100.0% | 100.0% | 100.0% | 100.0% | 100.0% | 100.0% | 100.0% | 100.0% | 100.0% | 100.0% | 100.0% | 100.0% | 100.0% | 100.0% | 100.0% | 100.0% | 100.0% | 100.0% | 100.0% | 100.0% | 100.0% | 100.0% | 100.0% | 100.0% | 100.0% | ||
| Variable Bus COGS | $67,884 | $68,612 | $66,716 | $65,573 | $69,627 | $73,264 | $71,685 | $74,201 | $83,326 | $82,282 | $81,548 | $81,978 | $82,586 | $83,196 | $83,808 | $84,423 | $85,040 | $85,659 | $86,280 | $86,904 | $87,530 | $88,158 | $88,789 | $89,422 | $360,330 | $364,309 | ||
| Variable Res COGS | $529,970 | $546,083 | $533,767 | $521,906 | $507,664 | $510,696 | $468,610 | $468,170 | $501,189 | $490,435 | $484,876 | $486,846 | $492,267 | $502,760 | $518,530 | $534,574 | $548,985 | $563,633 | $578,518 | $592,567 | $606,783 | $621,167 | $632,191 | $643,215 | $2,662,127 | $2,796,563 | ||
| Total Variable COGS | $597,854 | $614,695 | $600,483 | $587,479 | $577,291 | $583,960 | $540,294 | $542,372 | $584,516 | $572,717 | $566,424 | $568,823 | $574,852 | $585,956 | $602,338 | $618,997 | $634,025 | $649,292 | $664,799 | $679,471 | $694,314 | $709,325 | $720,980 | $732,637 | $3,022,457 | $3,160,871 | ||
| NTS Passings | ||||||||||||||||||||||||||||
| Lubbock Totals | 14,986 | 14,986 | 14,986 | 14,986 | 14,986 | 14,986 | 14,986 | 14,986 | 14,986 | 14,989 | 14,989 | 14,989 | 14,989 | 14,989 | 14,989 | 14,989 | 14,989 | 14,989 | 14,989 | 14,989 | 14,989 | 14,989 | 14,989 | 14,989 | 14,989 | 14,989 | ||
| Wolfforth Totals | 5,150 | 5,150 | 5,150 | 5,150 | 5,150 | 5,150 | 5,150 | 5,150 | 5,150 | 5,150 | 5,150 | 5,150 | 5,150 | 5,150 | 5,150 | 5,150 | 5,150 | 5,150 | 5,150 | 5,150 | 5,150 | 5,150 | 5,150 | 5,150 | 5,150 | 5,150 | ||
| Misc. Bus. Fiber - Other Mkts. | ||||||||||||||||||||||||||||
| Levelland Totals | 310 | 310 | 310 | 310 | 310 | 310 | 310 | 310 | 310 | 310 | 310 | 310 | 310 | 310 | 310 | 310 | 310 | 310 | 310 | 310 | 310 | 310 | 310 | 310 | 310 | 310 | ||
| Smyer Totals | 222 | 222 | 222 | 222 | 222 | 222 | 222 | 222 | 222 | 222 | 222 | 222 | 222 | 222 | 222 | 222 | 222 | 222 | 222 | 222 | 222 | 222 | 222 | 222 | 222 | 222 | ||
| Total Passings | 20,668 | 20,668 | 20,668 | 20,668 | 20,668 | 20,668 | 20,668 | 20,668 | 20,668 | 20,671 | 20,671 | 20,671 | 20,671 | 20,671 | 20,671 | 20,671 | 20,671 | 20,671 | 20,671 | 20,671 | 20,671 | 20,671 | 20,671 | 20,671 | 20,671 | 20,671 | ||
| NTS Count | ||||||||||||||||||||||||||||
| Lubbock Totals | 3,308 | 3,326 | 3,293 | 3,219 | 3,235 | 3,207 | 3,174 | 3,114 | 3,152 | 3,118 | 3,080 | 3,086 | 3,093 | 3,145 | 3,197 | 3,248 | 3,300 | 3,352 | 3,403 | 3,455 | 3,507 | 3,559 | 3,610 | 3,662 | 3,864 | 4,067 | ||
| Wolfforth Totals | 568 | 570 | 561 | 551 | 554 | 562 | 555 | 543 | 544 | 540 | 530 | 530 | 530 | 549 | 568 | 586 | 605 | 624 | 643 | 661 | 680 | 699 | 718 | 736 | 811 | 886 | ||
| Misc. Bus. Fiber - Other Mkts. | 0 | 0 | 0 | 0 | 12 | 11 | 16 | 10 | 10 | 6 | 0 | 0 | 0 | 0 | 0 | 0 | 0 | 0 | 0 | 0 | 0 | 0 | 0 | 0 | 0 | 0 | ||
| Levelland Totals | 2,075 | 2,133 | 2,109 | 2,130 | 2,169 | 2,182 | 2,214 | 2,146 | 2,213 | 2,206 | 2,193 | 2,194 | 2,195 | 2,215 | 2,235 | 2,255 | 2,275 | 2,295 | 2,315 | 2,335 | 2,355 | 2,375 | 2,395 | 2,415 | 2,415 | 2,415 | ||
| Smyer Totals | 66 | 69 | 67 | 75 | 77 | 78 | 77 | 73 | 79 | 79 | 76 | 76 | 76 | 77 | 78 | 78 | 79 | 80 | 81 | 82 | 83 | 83 | 84 | 85 | 88 | 92 | ||
| Total Count | 6,017 | 6,098 | 6,030 | 5,975 | 6,047 | 6,040 | 6,036 | 5,886 | 5,998 | 5,949 | 5,879 | 5,886 | 5,894 | 5,985 | 6,076 | 6,168 | 6,259 | 6,350 | 6,442 | 6,533 | 6,624 | 6,715 | 6,807 | 6,898 | 7,179 | 7,459 | ||
| NTS ARPU | ||||||||||||||||||||||||||||
| Blended ARPU | $163 | $166 | $175 | $177 | $183 | $190 | $189 | $195 | $195 | $197 | $202 | $202 | $204 | $203 | $203 | $203 | $203 | $203 | $203 | $203 | $202 | $202 | $202 | $201 | $196.91 | $194.43 | ||
| Pride 1 Revenue | ||||||||||||||||||||||||||||
| Littlefield | $0 | $0 | $76,739 | $149,879 | $191,931 | $203,043 | $213,938 | $220,905 | $235,341 | $237,010 | $233,843 | $236,215 | $238,323 | $245,003 | $256,242 | $264,855 | $266,892 | $268,929 | $270,967 | $273,004 | $274,269 | $274,761 | $275,253 | $275,746 | $1,102,983 | $1,102,983 | ||
| Whitharral | $0 | $0 | $0 | $1,168 | $3,843 | $3,902 | $4,021 | $2,637 | $5,522 | $4,444 | $5,144 | $5,748 | $5,988 | $6,232 | $6,478 | $6,727 | $6,979 | $7,184 | $7,389 | $7,594 | $7,799 | $8,004 | $8,209 | $8,415 | $35,299 | $37,759 | ||
| Brownfield | $0 | $0 | $0 | $44,481 | $135,073 | $190,765 | $217,799 | $231,681 | $233,525 | $237,545 | $243,501 | $253,161 | $262,107 | $271,861 | $283,669 | $292,074 | $297,966 | $302,503 | $307,039 | $311,575 | $315,200 | $317,099 | $317,099 | $317,099 | $1,268,395 | $1,268,395 | ||
| Slaton | $0 | $0 | $0 | $0 | $20,354 | $50,836 | $61,699 | $70,366 | $84,843 | $87,877 | $95,663 | $103,675 | $110,753 | $116,912 | $123,212 | $129,654 | $136,238 | $142,354 | $148,564 | $154,868 | $161,267 | $166,351 | $171,435 | $176,518 | $744,807 | $801,938 | ||
| Wilson | $0 | $0 | $0 | $0 | $0 | $3,990 | $11,955 | $14,311 | $16,693 | $15,428 | $16,243 | $17,166 | $17,626 | $18,087 | $18,548 | $19,008 | $19,469 | $19,929 | $20,390 | $20,850 | $21,311 | $21,771 | $22,232 | $22,692 | $94,453 | $99,979 | ||
| Lamesa (incl Dawson Co) | $0 | $0 | $0 | $0 | $0 | $12,864 | $100,298 | $150,138 | $173,379 | $198,832 | $216,468 | $233,609 | $250,592 | $270,346 | $290,236 | $303,599 | $316,961 | $330,323 | $341,998 | $351,598 | $357,048 | $358,060 | $358,060 | $358,060 | $1,432,240 | $1,432,240 | ||
| Meadow | $0 | $0 | $0 | $0 | $0 | $1,505 | $11,659 | $13,637 | $17,136 | $20,531 | $21,730 | $22,245 | $22,854 | $23,463 | $24,073 | $24,682 | $25,292 | $25,901 | $26,511 | $27,120 | $27,730 | $28,339 | $28,948 | $29,558 | $121,888 | $126,764 | ||
| Ropesville | $0 | $0 | $0 | $0 | $0 | $467 | $7,931 | $9,430 | $11,351 | $12,371 | $13,093 | $13,912 | $14,559 | $15,012 | $15,465 | $15,917 | $16,370 | $16,823 | $17,275 | $17,728 | $18,180 | $18,633 | $19,086 | $19,538 | $81,774 | $87,206 | ||
| Plainview | $0 | $0 | $0 | $0 | $0 | $0 | $24,152 | $112,643 | $174,086 | $232,748 | $290,137 | $327,703 | $375,513 | $426,325 | $471,316 | $502,227 | $531,764 | $561,671 | $588,094 | $610,755 | $625,724 | $640,693 | $655,661 | $670,630 | $2,742,396 | $2,772,333 | ||
| Hale Center | $0 | $0 | $0 | $0 | $0 | $0 | $0 | $0 | $0 | $0 | $13,471 | $34,240 | $50,735 | $66,986 | $78,944 | $86,437 | $88,653 | $89,779 | $92,978 | $95,678 | $97,295 | $97,840 | $99,374 | $101,581 | $405,509 | $407,668 | ||
| Abernathy | $0 | $0 | $0 | $0 | $0 | $0 | $0 | $0 | $0 | $0 | $0 | $4,587 | $19,088 | $43,882 | $71,885 | $92,988 | $106,882 | $114,499 | $117,654 | $119,736 | $122,447 | $125,321 | $128,285 | $129,021 | $517,332 | $526,180 | ||
| New Deal | $0 | $0 | $0 | $0 | $0 | $0 | $0 | $0 | $0 | $0 | $0 | $1,059 | $4,471 | $10,370 | $17,012 | $21,997 | $25,278 | $27,064 | $27,763 | $28,210 | $28,833 | $29,485 | $30,153 | $30,295 | $121,445 | $123,487 | ||
| Total Revenue | $0 | $0 | $76,739 | $195,529 | $351,201 | $467,371 | $653,451 | $825,749 | $951,875 | $1,046,786 | $1,149,293 | $1,253,319 | $1,372,609 | $1,514,479 | $1,657,079 | $1,760,165 | $1,838,744 | $1,906,958 | $1,966,621 | $2,018,717 | $2,057,102 | $2,086,357 | $2,113,795 | $2,139,154 | $8,668,523 | $8,786,933 | ||
| PRIDE 1 Variable COGS | ||||||||||||||||||||||||||||
| Bus Revenue | 0 | 0 | 15,970 | 46,271 | 89,114 | 119,852 | 194,893 | $287,381 | $323,309 | $348,005 | $407,866 | $444,016 | $489,498 | $548,810 | $614,006 | $660,487 | $693,850 | $724,409 | $751,465 | $774,176 | $786,900 | $796,043 | $802,907 | $808,858 | $3,252,519 | $3,280,357 | ||
| Res Revenue | 0 | 0 | 60,770 | 149,258 | 262,086 | 347,520 | 458,558 | $538,367 | $628,567 | $698,780 | $741,428 | $809,303 | $883,111 | $965,669 | $1,043,073 | $1,099,678 | $1,144,894 | $1,182,549 | $1,215,156 | $1,244,541 | $1,270,202 | $1,290,314 | $1,310,888 | $1,330,296 | $5,416,003 | $5,506,576 | ||
| Total Revenue | 0 | 0 | 76,739 | 195,529 | 351,201 | 467,371 | 653,451 | $825,749 | $951,875 | $1,046,786 | $1,149,293 | $1,253,319 | $1,372,609 | $1,514,479 | $1,657,079 | $1,760,165 | $1,838,744 | $1,906,958 | $1,966,621 | $2,018,717 | $2,057,102 | $2,086,357 | $2,113,795 | $2,139,154 | $8,668,523 | $8,786,933 | ||
| Bus Revenue, % | NA | NA | 20.8% | 23.7% | 25.4% | 25.6% | 29.8% | 34.8% | 34.0% | 33.2% | 35.5% | 35.4% | 35.7% | 36.2% | 37.1% | 37.5% | 37.7% | 38.0% | 38.2% | 38.3% | 38.3% | 38.2% | 38.0% | 37.8% | 37.5% | 37.3% | ||
| Res Revenue, % | NA | NA | 79.2% | 76.3% | 74.6% | 74.4% | 70.2% | 65.2% | 66.0% | 66.8% | 64.5% | 64.6% | 64.3% | 63.8% | 62.9% | 62.5% | 62.3% | 62.0% | 61.8% | 61.7% | 61.7% | 61.8% | 62.0% | 62.2% | 62.5% | 62.7% | ||
| Total Revenue, % | NA | NA | 100.0% | 100.0% | 100.0% | 100.0% | 100.0% | 100.0% | 100.0% | 100.0% | 100.0% | 100.0% | 100.0% | 100.0% | 100.0% | 100.0% | 100.0% | 100.0% | 100.0% | 100.0% | 100.0% | 100.0% | 100.0% | 100.0% | 100.0% | 100.0% | ||
| Variable Bus COGS | 0 | 0 | 539 | 1,531 | 2,929 | 3,924 | 6,262 | $9,314 | $11,571 | $12,232 | $13,966 | $15,204 | $16,761 | $18,792 | $21,024 | $22,616 | $23,758 | $24,805 | $25,731 | $26,509 | $26,944 | $27,257 | $27,492 | $27,696 | $111,370 | $112,323 | ||
| Variable Res COGS | 0 | 0 | 27,141 | 64,958 | 109,910 | 146,750 | 181,310 | $217,352 | $266,417 | $290,578 | $306,512 | $334,572 | $365,085 | $399,215 | $431,214 | $454,615 | $473,308 | $488,875 | $502,354 | $514,503 | $525,111 | $533,425 | $541,931 | $549,954 | $2,239,016 | $2,276,459 | ||
| Total Variable COGS | 0 | 0 | 27,680 | 66,489 | 112,839 | 150,674 | 187,572 | $226,665 | $277,988 | $302,810 | $320,477 | $349,775 | $381,845 | $418,006 | $452,238 | $477,231 | $497,066 | $513,679 | $528,085 | $541,011 | $552,055 | $560,683 | $569,423 | $577,650 | $2,350,385 | $2,388,782 | ||
| Pride 1 Passings | ||||||||||||||||||||||||||||
| Littlefield | 0 | 0 | 1,420 | 1,420 | 1,420 | 1,420 | 1,420 | 1,420 | 1,420 | 1,420 | 1,420 | 1,420 | 1,420 | 1,420 | 1,420 | 1,420 | 1,420 | 1,420 | 1,420 | 1,420 | 1,420 | 1,420 | 1,420 | 1,420 | 1,420 | 1,420 | ||
| Whitharral | 0 | 0 | 0 | 84 | 84 | 84 | 84 | 84 | 84 | 84 | 84 | 84 | 84 | 84 | 84 | 84 | 84 | 84 | 84 | 84 | 84 | 84 | 84 | 84 | 84 | 84 | ||
| Brownfield | 0 | 0 | 0 | 1,679 | 1,679 | 1,679 | 1,679 | 1,679 | 1,679 | 1,679 | 1,679 | 1,679 | 1,679 | 1,679 | 1,679 | 1,679 | 1,679 | 1,679 | 1,679 | 1,679 | 1,679 | 1,679 | 1,679 | 1,679 | 1,679 | 1,679 | ||
| Slaton | 0 | 0 | 0 | 0 | 1,423 | 1,423 | 1,423 | 1,423 | 1,423 | 1,423 | 1,423 | 1,423 | 1,423 | 1,423 | 1,423 | 1,423 | 1,423 | 1,423 | 1,423 | 1,423 | 1,423 | 1,423 | 1,423 | 1,423 | 1,423 | 1,423 | ||
| Wilson | 0 | 0 | 0 | 0 | 0 | 206 | 206 | 206 | 206 | 206 | 206 | 206 | 206 | 206 | 206 | 206 | 206 | 206 | 206 | 206 | 206 | 206 | 206 | 206 | 206 | 206 | ||
| Lamesa (incl Dawson Co) | 0 | 0 | 0 | 0 | 0 | 1,931 | 1,931 | 1,931 | 1,931 | 1,931 | 1,931 | 1,931 | 1,931 | 1,931 | 1,931 | 1,931 | 1,931 | 1,931 | 1,931 | 1,931 | 1,931 | 1,931 | 1,931 | 1,931 | 1,931 | 1,931 | ||
| Meadow | 0 | 0 | 0 | 0 | 0 | 219 | 219 | 219 | 219 | 219 | 219 | 219 | 219 | 219 | 219 | 219 | 219 | 219 | 219 | 219 | 219 | 219 | 219 | 219 | 219 | 219 | ||
| Ropesville | 0 | 0 | 0 | 0 | 0 | 185 | 185 | 185 | 185 | 185 | 185 | 185 | 185 | 185 | 185 | 185 | 185 | 185 | 185 | 185 | 185 | 185 | 185 | 185 | 185 | 185 | ||
| Plainview | 0 | 0 | 0 | 0 | 0 | 0 | 3,627 | 3,627 | 3,627 | 3,627 | 3,627 | 3,627 | 3,627 | 3,627 | 3,627 | 3,627 | 3,627 | 3,627 | 3,627 | 3,627 | 3,627 | 3,627 | 3,627 | 3,627 | 3,627 | 3,627 | ||
| Hale Center | 0 | 0 | 0 | 0 | 0 | 0 | 0 | 0 | 0 | 0 | 859 | 859 | 859 | 859 | 859 | 859 | 859 | 859 | 859 | 859 | 859 | 859 | 859 | 859 | 859 | 859 | ||
| Abernathy | 0 | 0 | 0 | 0 | 0 | 0 | 0 | 0 | 0 | 0 | 0 | 1,081 | 1,081 | 1,081 | 1,081 | 1,081 | 1,081 | 1,081 | 1,081 | 1,081 | 1,081 | 1,081 | 1,081 | 1,081 | 1,081 | 1,081 | ||
| New Deal | 0 | 0 | 0 | 0 | 0 | 0 | 0 | 0 | 0 | 0 | 0 | 258 | 258 | 258 | 258 | 258 | 258 | 258 | 258 | 258 | 258 | 258 | 258 | 258 | 258 | 258 | ||
| Total Passings | 0 | 0 | 1,420 | 3,183 | 4,606 | 7,147 | 10,774 | 10,774 | 10,774 | 10,774 | 11,633 | 12,972 | 12,972 | 12,972 | 12,972 | 12,972 | 12,972 | 12,972 | 12,972 | 12,972 | 12,972 | 12,972 | 12,972 | 12,972 | 12,972 | 12,972 | ||
| Pride 1 Count | ||||||||||||||||||||||||||||
| Littlefield | 0 | 0 | 256 | 399 | 490 | 519 | 542 | 552 | 602 | 582 | 583 | 585 | 587 | 607 | 628 | 632 | 637 | 642 | 646 | 651 | 651 | 651 | 651 | 651 | 651 | 651 | ||
| Whitharral | 0 | 0 | 0 | 4 | 11 | 10 | 9 | 10 | 15 | 15 | 18 | 19 | 19 | 20 | 20 | 21 | 22 | 22 | 23 | 24 | 24 | 25 | 26 | 26 | 28 | 30 | ||
| Brownfield | 0 | 0 | 0 | 195 | 441 | 536 | 611 | 631 | 665 | 676 | 686 | 698 | 703 | 714 | 727 | 732 | 738 | 743 | 749 | 755 | 755 | 755 | 755 | 755 | 755 | 755 | ||
| Slaton | 0 | 0 | 0 | 0 | 78 | 140 | 174 | 196 | 235 | 253 | 272 | 283 | 295 | 307 | 318 | 330 | 342 | 354 | 365 | 377 | 389 | 400 | 412 | 424 | 458 | 492 | ||
| Wilson | 0 | 0 | 0 | 0 | 0 | 22 | 37 | 40 | 46 | 46 | 50 | 51 | 53 | 54 | 56 | 57 | 58 | 60 | 61 | 62 | 64 | 65 | 66 | 68 | 72 | 76 | ||
| Lamesa (incl Dawson Co) | 0 | 0 | 0 | 0 | 0 | 77 | 333 | 429 | 499 | 562 | 593 | 622 | 651 | 688 | 714 | 739 | 765 | 790 | 816 | 829 | 829 | 829 | 829 | 829 | 829 | 829 | ||
| Meadow | 0 | 0 | 0 | 0 | 0 | 9 | 35 | 40 | 51 | 58 | 59 | 61 | 62 | 64 | 66 | 67 | 69 | 71 | 72 | 74 | 76 | 77 | 79 | 80 | 84 | 87 | ||
| Ropesville | 0 | 0 | 0 | 0 | 0 | 4 | 27 | 32 | 37 | 40 | 43 | 44 | 45 | 47 | 48 | 49 | 51 | 52 | 54 | 55 | 56 | 58 | 59 | 61 | 65 | 69 | ||
| Plainview | 0 | 0 | 0 | 0 | 0 | 0 | 25 | 254 | 444 | 579 | 650 | 732 | 838 | 921 | 979 | 1,034 | 1,088 | 1,143 | 1,189 | 1,235 | 1,281 | 1,327 | 1,374 | 1,420 | 1,466 | 1,466 | ||
| Hale Center | 0 | 0 | 0 | 0 | 0 | 0 | 0 | 0 | 0 | 0 | 83 | 125 | 177 | 214 | 239 | 248 | 245 | 248 | 255 | 256 | 260 | 253 | 261 | 260 | 259 | 260 | ||
| Abernathy | 0 | 0 | 0 | 0 | 0 | 0 | 0 | 0 | 0 | 0 | 0 | 22 | 80 | 165 | 234 | 280 | 308 | 317 | 315 | 318 | 324 | 326 | 331 | 322 | 332 | 331 | ||
| New Deal | 0 | 0 | 0 | 0 | 0 | 0 | 0 | 0 | 0 | 0 | 0 | 5 | 19 | 39 | 56 | 67 | 73 | 75 | 75 | 76 | 77 | 78 | 79 | 76 | 79 | 79 | ||
| Total Count | 0 | 0 | 256 | 598 | 1,020 | 1,317 | 1,793 | 2,184 | 2,594 | 2,811 | 3,036 | 3,247 | 3,529 | 3,841 | 4,085 | 4,257 | 4,396 | 4,517 | 4,620 | 4,711 | 4,785 | 4,844 | 4,922 | 4,971 | 5,076 | 5,124 | ||
| Pride 1 ARPU | ||||||||||||||||||||||||||||
| Blended ARPU | #DIV/0! | #DIV/0! | $100 | $109 | $115 | $118 | $121 | $126 | $122 | $124 | $126 | $129 | $130 | $131 | $135 | $138 | $139 | $141 | $142 | $143 | $143 | $144 | $143 | $143 | $142.30 | $142.89 | ||
| Pride 2 Revenue | ||||||||||||||||||||||||||||
| Burkburnnet | $0 | $0 | $86,879 | $224,536 | $323,539 | $410,584 | $432,893 | $454,809 | $486,034 | $490,067 | $520,295 | $545,735 | $570,000 | $599,091 | $623,771 | $639,253 | $653,942 | $668,632 | $683,321 | $698,010 | $712,699 | $725,897 | $736,859 | $747,820 | $3,013,202 | $3,013,202 | ||
| Iowa Park | $0 | $0 | $0 | $0 | $0 | $0 | $0 | $2,324 | $56,431 | $78,034 | $102,794 | $128,984 | $152,632 | $178,797 | $204,860 | $227,163 | $244,313 | $261,645 | $279,159 | $296,855 | $313,716 | $330,699 | $347,803 | $365,029 | $1,533,120 | $1,575,987 | ||
| Total Revenue | $0 | $0 | $86,879 | $224,536 | $323,539 | $410,584 | $432,893 | $457,134 | $542,465 | $568,101 | $623,089 | $674,719 | $722,631 | $777,887 | $828,631 | $866,416 | $898,255 | $930,276 | $962,480 | $994,865 | $1,026,416 | $1,056,597 | $1,084,662 | $1,112,849 | $4,546,322 | $4,589,189 | ||
| PRIDE 2 Variable COGS | ||||||||||||||||||||||||||||
| Bus Revenue | $0 | $0 | $28,271 | $55,152 | $61,293 | $74,398 | $73,780 | $62,877 | $67,778 | $71,419 | $90,334 | $102,102 | $118,603 | $145,101 | $172,155 | $186,250 | $194,399 | $202,730 | $211,243 | $219,939 | $227,800 | $234,290 | $238,666 | $243,163 | $982,013 | $986,694 | ||
| Res Revenue | $0 | $0 | $58,608 | $169,384 | $262,246 | $336,186 | $359,114 | $394,256 | $474,687 | $496,682 | $532,755 | $572,617 | $604,029 | $632,787 | $656,477 | $680,167 | $703,857 | $727,546 | $751,236 | $774,926 | $798,616 | $822,306 | $845,996 | $869,686 | $3,564,309 | $3,602,495 | ||
| Total Revenue | $0 | $0 | $86,879 | $224,536 | $323,539 | $410,584 | $432,893 | $457,134 | $542,465 | $568,101 | $623,089 | $674,719 | $722,631 | $777,887 | $828,631 | $866,416 | $898,255 | $930,276 | $962,480 | $994,865 | $1,026,416 | $1,056,597 | $1,084,662 | $1,112,849 | $4,546,322 | $4,589,189 | ||
| Bus Revenue, % | NA | NA | 32.5% | 24.6% | 18.9% | 18.1% | 17.0% | 13.8% | 12.5% | 12.6% | 14.5% | 15.1% | 16.4% | 18.7% | 20.8% | 21.5% | 21.6% | 21.8% | 21.9% | 22.1% | 22.2% | 22.2% | 22.0% | 21.9% | 21.6% | 21.5% | ||
| Res Revenue, % | NA | NA | 67.5% | 75.4% | 81.1% | 81.9% | 83.0% | 86.2% | 87.5% | 87.4% | 85.5% | 84.9% | 83.6% | 81.3% | 79.2% | 78.5% | 78.4% | 78.2% | 78.1% | 77.9% | 77.8% | 77.8% | 78.0% | 78.1% | 78.4% | 78.5% | ||
| Total Revenue, % | NA | NA | 100.0% | 100.0% | 100.0% | 100.0% | 100.0% | 100.0% | 100.0% | 100.0% | 100.0% | 100.0% | 100.0% | 100.0% | 100.0% | 100.0% | 100.0% | 100.0% | 100.0% | 100.0% | 100.0% | 100.0% | 100.0% | 100.0% | 100.0% | 100.0% | ||
| Variable Bus COGS | $0 | $0 | $954 | $1,825 | $2,015 | $2,436 | $2,370 | $2,038 | $2,426 | $2,510 | $3,093 | $3,496 | $4,061 | $4,968 | $5,895 | $6,377 | $6,656 | $6,942 | $7,233 | $7,531 | $7,800 | $8,022 | $8,172 | $8,326 | $33,625 | $33,785 | ||
| Variable Res COGS | $0 | $0 | $26,176 | $73,718 | $109,977 | $141,964 | $141,991 | $159,171 | $201,195 | $206,538 | $220,245 | $236,724 | $249,710 | $261,599 | $271,392 | $281,186 | $290,979 | $300,773 | $310,567 | $320,360 | $330,154 | $339,947 | $349,741 | $359,535 | $1,473,512 | $1,489,298 | ||
| Total Variable COGS | $0 | $0 | $27,129 | $75,542 | $111,992 | $144,400 | $144,361 | $161,208 | $203,621 | $209,049 | $223,338 | $240,220 | $253,771 | $266,567 | $277,287 | $287,563 | $297,636 | $307,715 | $317,800 | $327,891 | $337,954 | $347,970 | $357,913 | $367,861 | $1,507,137 | $1,523,084 | ||
| Pride 2 Passings | ||||||||||||||||||||||||||||
| Burburnnet | 0 | 0 | 4,712 | 4,712 | 4,712 | 4,712 | 4,712 | 4,712 | 4,712 | 4,712 | 4,712 | 4,712 | 4,712 | 4,712 | 4,712 | 4,712 | 4,712 | 4,712 | 4,712 | 4,712 | 4,712 | 4,712 | 4,712 | 4,712 | 4,712 | 4,712 | ||
| Iowa Park | 0 | 0 | 0 | 0 | 0 | 0 | 0 | 2,787 | 2,787 | 2,787 | 2,787 | 2,787 | 2,787 | 2,787 | 2,787 | 2,787 | 2,787 | 2,787 | 2,787 | 2,787 | 2,787 | 2,787 | 2,787 | 2,787 | 2,787 | 2,787 | ||
| Total Passings | 0 | 0 | 4,712 | 4,712 | 4,712 | 4,712 | 4,712 | 7,499 | 7,499 | 7,499 | 7,499 | 7,499 | 7,499 | 7,499 | 7,499 | 7,499 | 7,499 | 7,499 | 7,499 | 7,499 | 7,499 | 7,499 | 7,499 | 7,499 | 7,499 | 7,499 | ||
| Pride 2 Count | ||||||||||||||||||||||||||||
| Burburnnet | 0 | 0 | 326 | 694 | 981 | 1,170 | 1,275 | 1,341 | 1,417 | 1,450 | 1,490 | 1,529 | 1,586 | 1,643 | 1,678 | 1,712 | 1,745 | 1,778 | 1,812 | 1,845 | 1,879 | 1,912 | 1,945 | 1,979 | 1,979 | 1,979 | ||
| Iowa Park | 0 | 0 | 0 | 0 | 0 | 0 | 0 | 23 | 204 | 275 | 358 | 421 | 484 | 543 | 602 | 644 | 686 | 728 | 769 | 811 | 853 | 895 | 937 | 978 | 1,040 | 1,040 | ||
| Total Count | 0 | 0 | 326 | 694 | 981 | 1,170 | 1,275 | 1,364 | 1,621 | 1,725 | 1,848 | 1,950 | 2,069 | 2,186 | 2,281 | 2,356 | 2,431 | 2,506 | 2,581 | 2,656 | 2,732 | 2,807 | 2,882 | 2,957 | 3,018 | 3,018 | ||
| Pride 2 ARPU | ||||||||||||||||||||||||||||
| Blended ARPU | #DIV/0! | #DIV/0! | $89 | $108 | $110 | $117 | $113 | $112 | $112 | $110 | $112 | $115 | $116 | $119 | $121 | $123 | $123 | $124 | $124 | $125 | $125 | $125 | $125 | $125 | $125.51 | $126.70 | ||
| Pride 3 Revenue | ||||||||||||||||||||||||||||
| Hammond | $0 | $0 | $0 | $0 | $0 | $0 | $0 | $0 | $0 | $16,310 | $89,082 | $156,685 | $216,809 | $316,978 | $416,692 | $496,073 | $557,331 | $601,089 | $628,413 | $654,375 | $687,536 | $720,735 | $754,205 | $782,887 | $3,282,393 | $3,519,464 | ||
| Ponchatoula | $0 | $0 | $0 | $0 | $0 | $0 | $0 | $0 | $0 | $0 | $0 | $25,964 | $75,086 | $123,011 | $165,357 | $199,517 | $226,395 | $246,247 | $259,510 | $272,353 | $288,284 | $304,369 | $320,704 | $335,218 | $1,397,263 | $1,474,826 | ||
| Tickfaw Village | $0 | $0 | $0 | $0 | $0 | $0 | $0 | $0 | $0 | $0 | $0 | $0 | $1,569 | $7,721 | $19,399 | $31,617 | $40,416 | $46,211 | $49,252 | $49,584 | $49,419 | $50,243 | $50,946 | $51,481 | $203,925 | $204,094 | ||
| Independence | $0 | $0 | $0 | $0 | $0 | $0 | $0 | $0 | $0 | $0 | $0 | $0 | $1,749 | $8,478 | $21,169 | $34,444 | $44,001 | $50,299 | $53,633 | $54,031 | $53,875 | $54,795 | $55,589 | $56,194 | $222,640 | $222,887 | ||
| Amite | $0 | $0 | $0 | $0 | $0 | $0 | $0 | $0 | $0 | $0 | $0 | $0 | $5,672 | $20,595 | $44,061 | $68,471 | $85,875 | $97,603 | $105,349 | $108,208 | $109,190 | $112,243 | $115,367 | $117,810 | $469,380 | $473,341 | ||
| Pine Grove | $0 | $0 | $0 | $0 | $0 | $0 | $0 | $0 | $0 | $0 | $0 | $0 | $1,417 | $7,124 | $18,057 | $29,498 | $37,741 | $43,164 | $45,978 | $46,244 | $46,063 | $46,806 | $47,429 | $47,902 | $189,692 | $189,776 | ||
| Montpelier | $0 | $0 | $0 | $0 | $0 | $0 | $0 | $0 | $0 | $0 | $0 | $0 | $2,309 | $11,527 | $29,135 | $47,562 | $60,835 | $69,569 | $74,119 | $74,570 | $74,291 | $75,502 | $76,524 | $77,301 | $306,137 | $306,311 | ||
| Franklinton | $0 | $0 | $0 | $0 | $0 | $0 | $0 | $0 | $0 | $0 | $0 | $0 | $2,834 | $8,573 | $15,894 | $23,451 | $28,764 | $32,459 | $35,566 | $37,385 | $38,246 | $39,790 | $41,487 | $42,827 | $171,641 | $174,407 | ||
| Towers | $0 | $0 | $0 | $0 | $0 | $0 | $0 | $0 | $0 | $0 | $0 | $0 | $7,508 | $24,999 | $50,343 | $77,321 | $96,164 | $109,006 | $118,321 | $122,601 | $124,367 | $128,437 | $132,751 | $136,140 | $543,671 | $549,909 | ||
| Natalbany | $0 | $0 | $0 | $0 | $0 | $0 | $0 | $0 | $0 | $0 | $0 | $0 | $1,782 | $6,817 | $15,079 | $23,687 | $29,838 | $33,961 | $36,548 | $37,367 | $37,601 | $38,556 | $39,510 | $40,253 | $160,171 | $161,256 | ||
| Total Revenue | $0 | $0 | $0 | $0 | $0 | $0 | $0 | $0 | $0 | $16,310 | $89,082 | $182,649 | $316,735 | $535,822 | $795,186 | $1,031,642 | $1,207,360 | $1,329,607 | $1,406,691 | $1,456,720 | $1,508,871 | $1,571,475 | $1,634,512 | $1,688,014 | $6,946,912 | $7,276,270 | ||
| PRIDE 3 Variable COGS | ||||||||||||||||||||||||||||
| Bus Revenue | $0 | $0 | $0 | $0 | $0 | $0 | $0 | $0 | $0 | $16,310 | $83,887 | $166,392 | $243,467 | $309,257 | $360,188 | $412,871 | $461,484 | $508,977 | $561,301 | $613,866 | $663,184 | $715,978 | $771,684 | $827,147 | $3,525,654 | $3,836,500 | ||
| Res Revenue | $0 | $0 | $0 | $0 | $0 | $0 | $0 | $0 | $0 | $0 | $5,196 | $16,257 | $73,268 | $226,565 | $434,999 | $618,771 | $745,876 | $820,630 | $845,391 | $842,854 | $845,686 | $855,497 | $862,828 | $860,867 | $3,421,258 | $3,439,770 | ||
| Total Revenue | $0 | $0 | $0 | $0 | $0 | $0 | $0 | $0 | $0 | $16,310 | $89,082 | $182,649 | $316,735 | $535,822 | $795,186 | $1,031,642 | $1,207,360 | $1,329,607 | $1,406,691 | $1,456,720 | $1,508,871 | $1,571,475 | $1,634,512 | $1,688,014 | $6,946,912 | $7,276,270 | ||
| Bus Revenue, % | NA | NA | NA | NA | NA | NA | NA | NA | NA | 100.0% | 94.2% | 91.1% | 76.9% | 57.7% | 45.3% | 40.0% | 38.2% | 38.3% | 39.9% | 42.1% | 44.0% | 45.6% | 47.2% | 49.0% | 50.8% | 52.7% | ||
| Res revenue, % | NA | NA | NA | NA | NA | NA | NA | NA | NA | 0.0% | 5.8% | 8.9% | 23.1% | 42.3% | 54.7% | 60.0% | 61.8% | 61.7% | 60.1% | 57.9% | 56.0% | 54.4% | 52.8% | 51.0% | 49.2% | 47.3% | ||
| Total, % | NA | NA | NA | NA | NA | NA | NA | NA | NA | 100.0% | 100.0% | 100.0% | 100.0% | 100.0% | 100.0% | 100.0% | 100.0% | 100.0% | 100.0% | 100.0% | 100.0% | 100.0% | 100.0% | 100.0% | 100.0% | 100.0% | ||
| Variable Bus COGS | 0 | 0 | 0 | 0 | 0 | 0 | 0 | $0 | $0 | $573 | $2,872 | $5,697 | $8,337 | $10,589 | $12,333 | $14,137 | $15,802 | $17,428 | $19,220 | $21,019 | $22,708 | $24,516 | $26,423 | $28,322 | $120,722 | $131,366 | ||
| Variable Res COGS | 0 | 0 | 0 | 0 | 0 | 0 | 0 | $0 | $0 | $0 | $2,148 | $6,721 | $30,289 | $93,664 | $179,832 | $255,805 | $308,351 | $339,255 | $349,491 | $348,442 | $349,613 | $353,669 | $356,700 | $355,889 | $1,414,373 | $1,422,026 | ||
| Total Variable COGS | 0 | 0 | 0 | 0 | 0 | 0 | 0 | $0 | $0 | $573 | $5,020 | $12,418 | $38,626 | $104,253 | $192,165 | $269,942 | $324,152 | $356,683 | $368,710 | $369,461 | $372,321 | $378,185 | $383,123 | $384,211 | $1,535,095 | $1,553,392 | ||
| Pride 3 Passings | ||||||||||||||||||||||||||||
| Hammond | 0 | 0 | 0 | 0 | 0 | 0 | 0 | 0 | 0 | 0 | 5,376 | 5,376 | 5,376 | 5,376 | 5,376 | 5,376 | 5,376 | 5,376 | 5,376 | 5,376 | 5,376 | 5,376 | 5,376 | 5,376 | 5,376 | 5,376 | ||
| Ponchatoula | 0 | 0 | 0 | 0 | 0 | 0 | 0 | 0 | 0 | 0 | 1,914 | 1,914 | 1,914 | 1,914 | 1,914 | 1,914 | 1,914 | 1,914 | 1,914 | 1,914 | 1,914 | 1,914 | 1,914 | 1,914 | 1,914 | 1,914 | ||
| Tickfaw Village | 0 | 0 | 0 | 0 | 0 | 0 | 0 | 0 | 0 | 0 | 0 | 514 | 514 | 514 | 514 | 514 | 514 | 514 | 514 | 514 | 514 | 514 | 514 | 514 | 514 | 514 | ||
| Independence | 0 | 0 | 0 | 0 | 0 | 0 | 0 | 0 | 0 | 0 | 0 | 557 | 557 | 557 | 557 | 557 | 557 | 557 | 557 | 557 | 557 | 557 | 557 | 557 | 557 | 557 | ||
| Amite | 0 | 0 | 0 | 0 | 0 | 0 | 0 | 0 | 0 | 0 | 0 | 944 | 944 | 944 | 944 | 944 | 944 | 944 | 944 | 944 | 944 | 944 | 944 | 944 | 944 | 944 | ||
| Pine Grove | 0 | 0 | 0 | 0 | 0 | 0 | 0 | 0 | 0 | 0 | 0 | 483 | 483 | 483 | 483 | 483 | 483 | 483 | 483 | 483 | 483 | 483 | 483 | 483 | 483 | 483 | ||
| Montpelier | 0 | 0 | 0 | 0 | 0 | 0 | 0 | 0 | 0 | 0 | 0 | 777 | 777 | 777 | 777 | 777 | 777 | 777 | 777 | 777 | 777 | 777 | 777 | 777 | 777 | 777 | ||
| Franklinton | 0 | 0 | 0 | 0 | 0 | 0 | 0 | 0 | 0 | 0 | 0 | 257 | 257 | 257 | 257 | 257 | 257 | 257 | 257 | 257 | 257 | 257 | 257 | 257 | 257 | 257 | ||
| Towers | 0 | 0 | 0 | 0 | 0 | 0 | 0 | 0 | 0 | 0 | 0 | 983 | 983 | 983 | 983 | 983 | 983 | 983 | 983 | 983 | 983 | 983 | 983 | 983 | 983 | 983 | ||
| Natalbany | 0 | 0 | 0 | 0 | 0 | 0 | 0 | 0 | 0 | 0 | 0 | 340 | 340 | 340 | 340 | 340 | 340 | 340 | 340 | 340 | 340 | 340 | 340 | 340 | 340 | 340 | ||
| Total Passings | 0 | 0 | 0 | 0 | 0 | 0 | 0 | 0 | 0 | 0 | 7,290 | 12,145 | 12,145 | 12,145 | 12,145 | 12,145 | 12,145 | 12,145 | 12,145 | 12,145 | 12,145 | 12,145 | 12,145 | 12,145 | 12,145 | 12,145 | ||
| Pride 3 Count | ||||||||||||||||||||||||||||
| Hammond | 0 | 0 | 0 | 0 | 0 | 0 | 0 | 0 | 0 | 0 | 247 | 297 | 514 | 806 | 1,032 | 1,193 | 1,302 | 1,349 | 1,350 | 1,383 | 1,422 | 1,448 | 1,482 | 1,473 | 1,565 | 1,620 | ||
| Ponchatoula | 0 | 0 | 0 | 0 | 0 | 0 | 0 | 0 | 0 | 0 | 0 | 96 | 207 | 329 | 425 | 494 | 542 | 564 | 568 | 584 | 603 | 617 | 634 | 633 | 667 | 685 | ||
| Tickfaw Village | 0 | 0 | 0 | 0 | 0 | 0 | 0 | 0 | 0 | 0 | 0 | 0 | 9 | 36 | 78 | 110 | 131 | 144 | 148 | 145 | 147 | 149 | 150 | 152 | 147 | 151 | ||
| Independence | 0 | 0 | 0 | 0 | 0 | 0 | 0 | 0 | 0 | 0 | 0 | 0 | 10 | 40 | 85 | 119 | 142 | 156 | 161 | 157 | 159 | 162 | 163 | 164 | 159 | 164 | ||
| Amite | 0 | 0 | 0 | 0 | 0 | 0 | 0 | 0 | 0 | 0 | 0 | 0 | 25 | 75 | 153 | 209 | 248 | 272 | 282 | 277 | 281 | 286 | 289 | 292 | 284 | 294 | ||
| Pine Grove | 0 | 0 | 0 | 0 | 0 | 0 | 0 | 0 | 0 | 0 | 0 | 0 | 8 | 34 | 73 | 103 | 123 | 135 | 139 | 136 | 138 | 140 | 141 | 142 | 137 | 142 | ||
| Montpelier | 0 | 0 | 0 | 0 | 0 | 0 | 0 | 0 | 0 | 0 | 0 | 0 | 13 | 55 | 118 | 166 | 198 | 218 | 224 | 219 | 221 | 225 | 226 | 229 | 221 | 228 | ||
| Franklinton | 0 | 0 | 0 | 0 | 0 | 0 | 0 | 0 | 0 | 0 | 0 | 0 | 11 | 24 | 46 | 61 | 71 | 77 | 81 | 80 | 82 | 84 | 85 | 86 | 84 | 87 | ||
| Towers | 0 | 0 | 0 | 0 | 0 | 0 | 0 | 0 | 0 | 0 | 0 | 0 | 30 | 83 | 164 | 222 | 262 | 287 | 300 | 295 | 299 | 305 | 309 | 312 | 305 | 315 | ||
| Natalbany | 0 | 0 | 0 | 0 | 0 | 0 | 0 | 0 | 0 | 0 | 0 | 0 | 8 | 26 | 54 | 75 | 89 | 97 | 101 | 99 | 100 | 102 | 103 | 104 | 101 | 104 | ||
| Total Count | 0 | 0 | 0 | 0 | 0 | 0 | 0 | 0 | 0 | 0 | 247 | 393 | 833 | 1,510 | 2,229 | 2,752 | 3,107 | 3,300 | 3,356 | 3,376 | 3,452 | 3,519 | 3,582 | 3,587 | 3,671 | 3,792 | ||
| Pride 3 ARPU | ||||||||||||||||||||||||||||
| Blended ARPU | #DIV/0! | #DIV/0! | #DIV/0! | #DIV/0! | #DIV/0! | #DIV/0! | #DIV/0! | #DIV/0! | #DIV/0! | #DIV/0! | $120 | $155 | $127 | $118 | $119 | $125 | $130 | $134 | $140 | $144 | $146 | $149 | $152 | $157 | $157.69 | $159.90 | ||
| Total Pride Variable COGS | ||||||||||||||||||||||||||||
| Bus Revenue | $0 | $0 | $44,241 | $101,423 | $150,407 | $194,250 | $268,673 | $350,258 | $391,087 | $435,735 | $582,086 | $712,510 | $851,568 | $1,003,167 | $1,146,348 | $1,259,608 | $1,349,732 | $1,436,116 | $1,524,009 | $1,607,980 | $1,677,884 | $1,746,311 | $1,813,257 | $1,879,168 | $7,760,186 | $8,103,551 | ||
| Res Revenue | $0 | $0 | $119,378 | $318,643 | $524,332 | $683,705 | $817,672 | $932,624 | $1,103,254 | $1,195,462 | $1,279,378 | $1,398,176 | $1,560,407 | $1,825,021 | $2,134,548 | $2,398,615 | $2,594,627 | $2,730,726 | $2,811,783 | $2,862,321 | $2,914,505 | $2,968,118 | $3,019,712 | $3,060,848 | $12,401,571 | $12,548,841 | ||
| Total Revenue | $0 | $0 | $163,619 | $420,065 | $674,739 | $877,956 | $1,086,344 | $1,282,882 | $1,494,340 | $1,631,197 | $1,861,464 | $2,110,687 | $2,411,975 | $2,828,188 | $3,280,897 | $3,658,223 | $3,944,359 | $4,166,842 | $4,335,792 | $4,470,302 | $4,592,389 | $4,714,428 | $4,832,969 | $4,940,016 | $20,161,757 | $20,652,392 | ||
| Bus Revenue, % | NA | NA | 27.0% | 24.1% | 22.3% | 22.1% | 24.7% | 27.3% | 26.2% | 26.7% | 31.3% | 33.8% | 35.3% | 35.5% | 34.9% | 34.4% | 34.2% | 34.5% | 35.1% | 36.0% | 36.5% | 37.0% | 37.5% | 38.0% | 38.5% | 39.2% | ||
| Res Revenue, % | NA | NA | 73.0% | 75.9% | 77.7% | 77.9% | 75.3% | 72.7% | 73.8% | 73.3% | 68.7% | 66.2% | 64.7% | 64.5% | 65.1% | 65.6% | 65.8% | 65.5% | 64.9% | 64.0% | 63.5% | 63.0% | 62.5% | 62.0% | 61.5% | 60.8% | ||
| Total Revenue, % | NA | NA | 100.0% | 100.0% | 100.0% | 100.0% | 100.0% | 100.0% | 100.0% | 100.0% | 100.0% | 100.0% | 100.0% | 100.0% | 100.0% | 100.0% | 100.0% | 100.0% | 100.0% | 100.0% | 100.0% | 100.0% | 100.0% | 100.0% | 100.0% | 100.0% | ||
| Variable Bus COGS | $0 | $0 | $1,492 | $3,355 | $4,944 | $6,360 | $8,632 | $11,352 | $13,996 | $15,316 | $19,931 | $24,397 | $29,159 | $34,349 | $39,252 | $43,130 | $46,216 | $49,174 | $52,184 | $55,059 | $57,452 | $59,795 | $62,088 | $64,345 | $265,717 | $277,474 | ||
| Variable Res COGS | $0 | $0 | $53,317 | $138,676 | $219,887 | $288,714 | $323,301 | $376,522 | $467,612 | $497,116 | $528,904 | $578,016 | $645,084 | $754,477 | $882,438 | $991,605 | $1,072,638 | $1,128,902 | $1,162,412 | $1,183,305 | $1,204,878 | $1,227,042 | $1,248,371 | $1,265,377 | $5,126,901 | $5,187,783 | ||
| Total Variable COGS | $0 | $0 | $54,809 | $142,031 | $224,831 | $295,074 | $331,933 | $387,874 | $481,609 | $512,432 | $548,836 | $602,414 | $674,243 | $788,827 | $921,690 | $1,034,736 | $1,118,854 | $1,178,076 | $1,214,595 | $1,238,364 | $1,262,330 | $1,286,837 | $1,310,459 | $1,329,722 | $5,392,618 | $5,465,257 | ||
| Smart Build Revenue | ||||||||||||||||||||||||||||
| Wichita Falls | $0 | $0 | $0 | $0 | $0 | $0 | $0 | $9,144 | $73,591 | $150,722 | $179,189 | $233,767 | $288,057 | $331,559 | $350,524 | $369,756 | $389,253 | $403,477 | $417,879 | $432,458 | $441,541 | $444,995 | $448,449 | $451,903 | $1,842,152 | $1,897,416 | ||
| Amarillo | $0 | $0 | $0 | $0 | $0 | $0 | $0 | $0 | $0 | $0 | $0 | $9,000 | $74,925 | $185,850 | $277,399 | $345,800 | $393,056 | $416,634 | $440,888 | $465,816 | $491,419 | $517,698 | $544,651 | $572,279 | $2,313,999 | $2,313,999 | ||
| Abilene | $0 | $0 | $0 | $0 | $0 | $0 | $0 | $0 | $0 | $0 | $30,000 | $56,925 | $129,600 | $197,775 | $241,659 | $252,750 | $264,009 | $275,437 | $287,034 | $298,799 | $310,733 | $322,836 | $335,108 | $347,548 | $1,396,428 | $1,396,428 | ||
| Midland | $0 | $0 | $0 | $0 | $0 | $0 | $0 | $0 | $0 | $0 | $0 | $0 | $0 | $0 | $0 | $1,980 | $12,524 | $28,512 | $43,511 | $53,165 | $55,605 | $58,082 | $60,596 | $63,147 | $262,943 | $273,445 | ||
| Odessa | $0 | $0 | $0 | $0 | $0 | $0 | $0 | $0 | $0 | $0 | $0 | $0 | $0 | $0 | $0 | $0 | $1,980 | $12,524 | $28,512 | $43,511 | $53,165 | $55,605 | $58,082 | $60,596 | $252,590 | $262,943 | ||
| Total Revenue | $0 | $0 | $0 | $0 | $0 | $0 | $0 | $9,144 | $73,591 | $150,722 | $209,189 | $299,692 | $492,582 | $715,184 | $869,582 | $970,286 | $1,060,822 | $1,136,584 | $1,217,822 | $1,293,748 | $1,352,463 | $1,399,215 | $1,446,886 | $1,495,474 | $6,068,111 | $6,144,231 | ||
| Smart Build Variable COGS | ||||||||||||||||||||||||||||
| Bus Revenue | $0 | $0 | $0 | $0 | $0 | $0 | $0 | $9,144 | $73,591 | $150,722 | $209,189 | $299,692 | $492,582 | $715,184 | $869,582 | $970,286 | $1,060,822 | $1,136,584 | $1,217,822 | $1,293,748 | $1,352,463 | $1,399,215 | $1,446,886 | $1,495,474 | $6,068,111 | $6,144,231 | ||
| Res Revenue | $0 | $0 | $0 | $0 | $0 | $0 | $0 | $0 | $0 | $0 | $0 | $0 | $0 | $0 | $0 | $0 | $0 | $0 | $0 | $0 | $0 | $0 | $0 | $0 | $0 | $0 | ||
| Total Revenue | $0 | $0 | $0 | $0 | $0 | $0 | $0 | $9,144 | $73,591 | $150,722 | $209,189 | $299,692 | $492,582 | $715,184 | $869,582 | $970,286 | $1,060,822 | $1,136,584 | $1,217,822 | $1,293,748 | $1,352,463 | $1,399,215 | $1,446,886 | $1,495,474 | $6,068,111 | $6,144,231 | ||
| Bus Revenue, % | NA | NA | NA | NA | NA | NA | NA | 100.0% | 100.0% | 100.0% | 100.0% | 100.0% | 100.0% | 100.0% | 100.0% | 100.0% | 100.0% | 100.0% | 100.0% | 100.0% | 100.0% | 100.0% | 100.0% | 100.0% | 100.0% | 100.0% | ||
| Res Revenue, % | NA | NA | NA | NA | NA | NA | NA | 0.0% | 0.0% | 0.0% | 0.0% | 0.0% | 0.0% | 0.0% | 0.0% | 0.0% | 0.0% | 0.0% | 0.0% | 0.0% | 0.0% | 0.0% | 0.0% | 0.0% | 0.0% | 0.0% | ||
| Total Revenue, % | NA | NA | NA | NA | NA | NA | NA | 100.0% | 100.0% | 100.0% | 100.0% | 100.0% | 100.0% | 100.0% | 100.0% | 100.0% | 100.0% | 100.0% | 100.0% | 100.0% | 100.0% | 100.0% | 100.0% | 100.0% | 100.0% | 100.0% | ||
| Variable Bus COGS | $0 | $0 | $0 | $0 | $0 | $0 | $0 | $296 | $2,634 | $5,298 | $7,163 | $10,262 | $16,867 | $24,489 | $29,775 | $33,224 | $36,324 | $38,918 | $41,699 | $44,299 | $46,310 | $47,911 | $49,543 | $51,207 | $207,778 | $210,385 | ||
| Variable Res COGS | $0 | $0 | $0 | $0 | $0 | $0 | $0 | $0 | $0 | $0 | $0 | $0 | $0 | $0 | $0 | $0 | $0 | $0 | $0 | $0 | $0 | $0 | $0 | $0 | $0 | $0 | ||
| Total Variable COGS | $0 | $0 | $0 | $0 | $0 | $0 | $0 | $296 | $2,634 | $5,298 | $7,163 | $10,262 | $16,867 | $24,489 | $29,775 | $33,224 | $36,324 | $38,918 | $41,699 | $44,299 | $46,310 | $47,911 | $49,543 | $51,207 | $207,778 | $210,385 | ||
| New RUS Projects Revenue | ||||||||||||||||||||||||||||
| Snyder | $0 | $0 | $0 | $0 | $0 | $0 | $0 | $0 | $0 | $0 | $0 | $0 | $0 | $0 | $0 | $0 | $5,814 | $21,880 | $43,200 | $68,378 | $87,811 | $101,236 | $109,449 | $115,861 | $484,097 | $499,233 | ||
| Sweetwater | $0 | $0 | $0 | $0 | $0 | $0 | $0 | $0 | $0 | $0 | $0 | $0 | $0 | $0 | $0 | $0 | $5,330 | $20,057 | $39,599 | $62,679 | $80,492 | $92,798 | $100,327 | $106,204 | $443,749 | $457,624 | ||
| Pampa | $0 | $0 | $0 | $0 | $0 | $0 | $0 | $0 | $0 | $0 | $0 | $0 | $0 | $0 | $0 | $0 | $11,509 | $43,310 | $85,513 | $135,354 | $173,822 | $200,398 | $216,655 | $229,344 | $958,256 | $988,215 | ||
| Total Revenue | $0 | $0 | $0 | $0 | $0 | $0 | $0 | $0 | $0 | $0 | $0 | $0 | $0 | $0 | $0 | $0 | $22,653 | $85,247 | $168,312 | $266,411 | $342,125 | $394,433 | $426,431 | $451,409 | $1,886,102 | $1,945,072 | ||
| New RUS Variable COGS | ||||||||||||||||||||||||||||
| Bus Revenue | $0 | $0 | $0 | $0 | $0 | $0 | $0 | $0 | $0 | $0 | $0 | $0 | $0 | $0 | $0 | $0 | $16,672 | $51,442 | $78,211 | $114,730 | $147,192 | $171,186 | $189,321 | $214,056 | $943,240 | $989,597 | ||
| Res Revenue | $0 | $0 | $0 | $0 | $0 | $0 | $0 | $0 | $0 | $0 | $0 | $0 | $0 | $0 | $0 | $0 | $5,980 | $33,805 | $90,101 | $151,681 | $194,933 | $223,247 | $237,110 | $237,353 | $942,862 | $955,476 | ||
| Total Revenue | $0 | $0 | $0 | $0 | $0 | $0 | $0 | $0 | $0 | $0 | $0 | $0 | $0 | $0 | $0 | $0 | $22,653 | $85,247 | $168,312 | $266,411 | $342,125 | $394,433 | $426,431 | $451,409 | $1,886,102 | $1,945,072 | ||
| Bus Revenue, % | NA | NA | NA | NA | NA | NA | NA | NA | NA | NA | NA | NA | NA | NA | NA | NA | 73.6% | 60.3% | 46.5% | 43.1% | 43.0% | 43.4% | 44.4% | 47.4% | 50.0% | 50.9% | ||
| Res Revenue, % | NA | NA | NA | NA | NA | NA | NA | NA | NA | NA | NA | NA | NA | NA | NA | NA | 26.4% | 39.7% | 53.5% | 56.9% | 57.0% | 56.6% | 55.6% | 52.6% | 50.0% | 49.1% | ||
| Total Revenue, % | NA | NA | NA | NA | NA | NA | NA | NA | NA | NA | NA | NA | NA | NA | NA | NA | 100.0% | 100.0% | 100.0% | 100.0% | 100.0% | 100.0% | 100.0% | 100.0% | 100.0% | 100.0% | ||
| Variable Bus COGS | $0 | $0 | $0 | $0 | $0 | $0 | $0 | $0 | $0 | $0 | $0 | $0 | $0 | $0 | $0 | $0 | $571 | $1,761 | $2,678 | $3,928 | $5,040 | $5,862 | $6,483 | $7,329 | $32,298 | $33,885 | ||
| Variable Res COGS | $0 | $0 | $0 | $0 | $0 | $0 | $0 | $0 | $0 | $0 | $0 | $0 | $0 | $0 | $0 | $0 | $2,472 | $13,975 | $37,248 | $62,706 | $80,587 | $92,292 | $98,023 | $98,123 | $389,786 | $395,001 | ||
| Total Variable COGS | $0 | $0 | $0 | $0 | $0 | $0 | $0 | $0 | $0 | $0 | $0 | $0 | $0 | $0 | $0 | $0 | $3,043 | $15,737 | $39,927 | $66,635 | $85,627 | $98,154 | $104,506 | $105,453 | $422,084 | $428,885 | ||
| New RUS Passings | ||||||||||||||||||||||||||||
| Snyder | 0 | 0 | 0 | 0 | 0 | 0 | 0 | 0 | 0 | 0 | 0 | 0 | 0 | 0 | 0 | 816 | 816 | 816 | 816 | 816 | 816 | 816 | 816 | 816 | 816 | 816 | ||
| Sweetwater | 0 | 0 | 0 | 0 | 0 | 0 | 0 | 0 | 0 | 0 | 0 | 0 | 0 | 0 | 0 | 748 | 748 | 748 | 748 | 748 | 748 | 748 | 748 | 748 | 748 | 748 | ||
| Pampa | 0 | 0 | 0 | 0 | 0 | 0 | 0 | 0 | 0 | 0 | 0 | 0 | 0 | 0 | 0 | 1,615 | 1,615 | 1,615 | 1,615 | 1,615 | 1,615 | 1,615 | 1,615 | 1,615 | 1,615 | 1,615 | ||
| Total | 0 | 0 | 0 | 0 | 0 | 0 | 0 | 0 | 0 | 0 | 0 | 0 | 0 | 0 | 0 | 3,179 | 3,179 | 3,179 | 3,179 | 3,179 | 3,179 | 3,179 | 3,179 | 3,179 | 3,179 | 3,179 | ||
| New RUS Count | ||||||||||||||||||||||||||||
| Snyder | 0 | 0 | 0 | 0 | 0 | 0 | 0 | 0 | 0 | 0 | 0 | 0 | 0 | 0 | 0 | 0 | 24 | 67 | 129 | 183 | 217 | 239 | 247 | 252 | 254 | 260 | ||
| Sweetwater | 0 | 0 | 0 | 0 | 0 | 0 | 0 | 0 | 0 | 0 | 0 | 0 | 0 | 0 | 0 | 0 | 22 | 61 | 118 | 168 | 199 | 219 | 227 | 231 | 233 | 238 | ||
| Pampa | 0 | 0 | 0 | 0 | 0 | 0 | 0 | 0 | 0 | 0 | 0 | 0 | 0 | 0 | 0 | 0 | 47 | 132 | 254 | 362 | 430 | 474 | 490 | 498 | 503 | 514 | ||
| Total | 0 | 0 | 0 | 0 | 0 | 0 | 0 | 0 | 0 | 0 | 0 | 0 | 0 | 0 | 0 | 0 | 93 | 259 | 501 | 712 | 847 | 933 | 964 | 981 | 991 | 1,012 |
| Gross Fiber Business | |||||||||||||||||||||||||
| Lubbock Bus. | $1,554,753 | $1,601,717 | $1,622,012 | $1,676,424 | $1,788,089 | $1,868,164 | $1,862,162 | $1,904,193 | $1,939,002 | $1,956,115 | $1,982,145 | $1,992,946 | $2,008,574 | $2,024,263 | $2,040,012 | $2,055,822 | $2,071,693 | $2,087,625 | $2,103,617 | $2,119,670 | $2,135,784 | $2,151,959 | $2,168,195 | $2,184,491 | |
| Wolfforth Bus. | $67,871 | $67,677 | $70,569 | $75,239 | $72,430 | $74,741 | $73,072 | $83,441 | $86,971 | $78,818 | $79,275 | $79,088 | $79,425 | $79,763 | $80,100 | $80,438 | $80,775 | $81,113 | $81,450 | $81,788 | $82,125 | $82,463 | $82,800 | $83,138 | |
| Misc. Bus. Fiber - Other Mkts. | $19,916 | $19,811 | $20,101 | $21,399 | $20,863 | $22,902 | $25,119 | $26,229 | $25,138 | $22,670 | $22,670 | $22,670 | $22,670 | $22,670 | $22,670 | $22,670 | $22,670 | $22,670 | $22,670 | $22,670 | $22,670 | $22,670 | $22,670 | $22,670 | |
| Levelland Bus | $157,803 | $171,640 | $264,052 | $207,902 | $235,462 | $270,645 | $269,597 | $274,440 | $276,022 | $282,087 | $296,281 | $298,185 | $299,960 | $301,740 | $303,526 | $305,316 | $307,112 | $308,913 | $310,719 | $312,531 | $314,348 | $316,169 | $317,997 | $319,829 | |
| Smyer Bus. | $1,622 | $1,687 | $1,316 | $1,146 | $1,263 | $1,198 | $1,197 | $1,215 | $1,194 | $1,220 | $1,229 | $1,245 | $1,258 | $1,272 | $1,286 | $1,300 | $1,313 | $1,327 | $1,341 | $1,355 | $1,368 | $1,382 | $1,396 | $1,409 | |
| Littlefield Bus. (Incl. Hockley Co.) | $0 | $0 | $15,970 | $39,827 | $53,686 | $56,672 | $61,757 | $59,661 | $65,159 | $63,581 | $65,406 | $68,146 | $70,254 | $76,161 | $85,856 | $92,924 | $93,417 | $93,909 | $94,401 | $94,894 | $95,386 | $95,879 | $96,371 | $96,863 | |
| Burkburnnet Bus. | $0 | $0 | $28,271 | $55,152 | $61,293 | $74,398 | $73,780 | $62,877 | $61,550 | $62,222 | $78,814 | $87,191 | $100,494 | $118,624 | $132,343 | $136,864 | $140,592 | $144,320 | $148,048 | $151,776 | $155,504 | $157,741 | $157,741 | $157,741 | |
| Brownfield Bus. | $0 | $0 | $0 | $6,443 | $26,406 | $42,170 | $55,476 | $62,892 | $64,689 | $64,080 | $68,180 | $71,980 | $75,640 | $80,933 | $88,228 | $94,809 | $98,878 | $101,590 | $104,303 | $107,015 | $109,728 | $111,627 | $111,627 | $111,627 | |
| Slaton Bus. | $0 | $0 | $0 | $0 | $9,022 | $19,438 | $18,503 | $18,981 | $20,351 | $22,349 | $24,759 | $27,645 | $30,516 | $33,528 | $36,682 | $39,977 | $43,415 | $46,384 | $49,447 | $52,605 | $55,857 | $57,795 | $59,732 | $61,669 | |
| Wilson Bus. | $0 | $0 | $0 | $0 | $0 | $499 | $1,541 | $1,714 | $1,693 | $1,258 | $1,390 | $1,401 | $1,401 | $1,401 | $1,401 | $1,401 | $1,401 | $1,401 | $1,401 | $1,401 | $1,401 | $1,401 | $1,401 | $1,401 | |
| Lamesa Bus. (incl. Dawson Co) | $0 | $0 | $0 | $0 | $0 | $1,073 | $34,107 | $54,165 | $59,323 | $68,907 | $79,203 | $86,441 | $93,221 | $102,541 | $111,767 | $116,829 | $121,890 | $126,952 | $130,326 | $133,700 | $137,075 | $138,087 | $138,087 | $138,087 | |
| Plainview Bus. | $0 | $0 | $0 | $0 | $0 | $0 | $23,509 | $89,968 | $112,093 | $127,830 | $168,012 | $183,056 | $206,940 | $236,894 | $264,247 | $280,189 | $294,758 | $309,697 | $321,150 | $328,843 | $328,843 | $328,843 | $328,843 | $328,843 | |
| Wichita Falls Bus. | $0 | $0 | $0 | $0 | $0 | $0 | $0 | $9,144 | $73,591 | $150,722 | $179,189 | $233,767 | $288,057 | $331,559 | $350,524 | $369,756 | $389,253 | $403,477 | $417,879 | $432,458 | $441,541 | $444,995 | $448,449 | $451,903 | |
| Iowa Park Bus. | $0 | $0 | $0 | $0 | $0 | $0 | $0 | $0 | $6,228 | $9,197 | $11,520 | $14,912 | $18,109 | $26,477 | $39,812 | $49,386 | $53,807 | $58,410 | $63,196 | $68,163 | $72,296 | $76,550 | $80,925 | $85,422 | |
| Hammond Bus | $0 | $0 | $0 | $0 | $0 | $0 | $0 | $0 | $0 | $16,310 | $83,887 | $143,631 | $172,400 | $199,180 | $221,993 | $245,856 | $270,770 | $296,733 | $323,746 | $351,809 | $380,923 | $411,086 | $442,299 | $474,562 | |
| Ponchatoula Bus | $0 | $0 | $0 | $0 | $0 | $0 | $0 | $0 | $0 | $0 | $0 | $22,761 | $56,903 | $74,779 | $85,638 | $97,066 | $109,063 | $121,629 | $134,764 | $148,468 | $162,741 | $177,583 | $192,994 | $208,974 | |
| Abilene Bus | $0 | $0 | $0 | $0 | $0 | $0 | $0 | $0 | $0 | $0 | $30,000 | $56,925 | $129,600 | $197,775 | $241,659 | $252,750 | $264,009 | $275,437 | $287,034 | $298,799 | $310,733 | $322,836 | $335,108 | $347,548 | |
| Hale Center Bus | $0 | $0 | $0 | $0 | $0 | $0 | $0 | $0 | $0 | $0 | $915 | $2,603 | $4,331 | $6,515 | $9,690 | $12,883 | $15,023 | $16,657 | $18,879 | $20,844 | $21,916 | $23,326 | $24,973 | $26,277 | |
| Abernathy Bus | $0 | $0 | $0 | $0 | $0 | $0 | $0 | $0 | $0 | $0 | $0 | $2,247 | $5,893 | $8,876 | $13,216 | $17,589 | $20,532 | $22,786 | $25,848 | $28,563 | $30,055 | $32,013 | $34,297 | $36,113 | |
| New Deal Bus | $0 | $0 | $0 | $0 | $0 | $0 | $0 | $0 | $0 | $0 | $0 | $496 | $1,302 | $1,961 | $2,920 | $3,886 | $4,536 | $5,034 | $5,711 | $6,310 | $6,640 | $7,073 | $7,577 | $7,978 | |
| Amarillo Bus | $0 | $0 | $0 | $0 | $0 | $0 | $0 | $0 | $0 | $0 | $0 | $9,000 | $74,925 | $185,850 | $277,399 | $345,800 | $393,056 | $416,634 | $440,888 | $465,816 | $491,419 | $517,698 | $544,651 | $572,279 | |
| Tickfaw Village Bus | $0 | $0 | $0 | $0 | $0 | $0 | $0 | $0 | $0 | $0 | $0 | $0 | $373 | $929 | $1,383 | $1,841 | $2,149 | $2,385 | $2,705 | $2,989 | $3,145 | $3,350 | $3,589 | $3,779 | |
| Independence Bus | $0 | $0 | $0 | $0 | $0 | $0 | $0 | $0 | $0 | $0 | $0 | $0 | $456 | $1,135 | $1,690 | $2,250 | $2,626 | $2,915 | $3,306 | $3,653 | $3,844 | $4,095 | $4,387 | $4,619 | |
| Amite Bus | $0 | $0 | $0 | $0 | $0 | $0 | $0 | $0 | $0 | $0 | $0 | $0 | $3,645 | $9,082 | $13,523 | $17,998 | $21,010 | $23,316 | $26,449 | $29,227 | $30,754 | $32,758 | $35,095 | $36,953 | |
| Pine Grove Bus | $0 | $0 | $0 | $0 | $0 | $0 | $0 | $0 | $0 | $0 | $0 | $0 | $290 | $722 | $1,076 | $1,432 | $1,671 | $1,855 | $2,104 | $2,325 | $2,446 | $2,606 | $2,792 | $2,939 | |
| Montpelier Bus | $0 | $0 | $0 | $0 | $0 | $0 | $0 | $0 | $0 | $0 | $0 | $0 | $497 | $1,239 | $1,844 | $2,454 | $2,865 | $3,179 | $3,607 | $3,986 | $4,194 | $4,467 | $4,786 | $5,039 | |
| Franklinton Bus | $0 | $0 | $0 | $0 | $0 | $0 | $0 | $0 | $0 | $0 | $0 | $0 | $2,361 | $5,883 | $8,759 | $11,658 | $13,608 | $15,102 | $17,132 | $18,931 | $19,920 | $21,218 | $22,732 | $23,935 | |
| Towers Bus | $0 | $0 | $0 | $0 | $0 | $0 | $0 | $0 | $0 | $0 | $0 | $0 | $5,508 | $13,727 | $20,438 | $27,202 | $31,753 | $35,239 | $39,974 | $44,173 | $46,480 | $49,509 | $53,041 | $55,849 | |
| Natalbany Bus | $0 | $0 | $0 | $0 | $0 | $0 | $0 | $0 | $0 | $0 | $0 | $0 | $1,035 | $2,580 | $3,842 | $5,113 | $5,969 | $6,624 | $7,514 | $8,303 | $8,737 | $9,306 | $9,970 | $10,498 | |
| $1,801,965 | $1,862,533 | $2,022,291 | $2,083,533 | $2,268,515 | $2,431,899 | $2,499,819 | $2,648,921 | $2,793,006 | $2,927,366 | $3,172,874 | $3,406,335 | $3,756,037 | $4,148,058 | $4,463,524 | $4,693,459 | $4,879,614 | $5,033,312 | $5,189,606 | $5,343,066 | $5,477,872 | $5,606,482 | $5,734,521 | $5,862,435 | ||
| ok | ok | ok | ok | ok | ERROR | ERROR | ERROR | ERROR | ERROR | ERROR | ERROR | ERROR | ERROR | ||||||||||||
| Gross Fiber Residential | |||||||||||||||||||||||||
| Lubbock Res. | $456,722 | $463,504 | $457,337 | $452,525 | $450,036 | $441,852 | $421,647 | $410,510 | $411,758 | $391,980 | $392,654 | $394,333 | $400,942 | $413,789 | $433,178 | $452,971 | $473,168 | $493,771 | $514,778 | $536,189 | $558,006 | $580,226 | $594,321 | $608,416 | |
| Wolfforth Res. | $128,384 | $128,467 | $127,450 | $126,493 | $128,553 | $130,074 | $129,630 | $127,651 | $131,988 | $130,417 | $129,579 | $130,358 | $132,405 | $137,223 | $144,938 | $152,821 | $160,873 | $169,094 | $177,484 | $183,446 | $189,409 | $195,371 | $201,334 | $207,296 | |
| Levelland Res | $539,774 | $567,592 | $591,443 | $598,412 | $606,335 | $613,654 | $609,974 | $600,068 | $613,324 | $631,385 | $625,406 | $628,217 | $632,673 | $640,257 | $651,034 | $661,898 | $668,240 | $674,582 | $680,924 | $687,266 | $693,608 | $699,950 | $706,292 | $712,634 | |
| Smyer Res. | $18,265 | $18,056 | $18,888 | $21,778 | $25,630 | $23,802 | $23,924 | $21,401 | $25,403 | $25,612 | $25,237 | $24,734 | $24,734 | $24,868 | $25,135 | $25,402 | $25,670 | $25,937 | $26,204 | $26,472 | $26,739 | $27,006 | $27,274 | $27,541 | |
| Littlefield Res. (Incl. Hockley Co.) | $0 | $0 | $60,770 | $110,052 | $138,245 | $146,370 | $152,181 | $161,244 | $170,182 | $173,428 | $168,436 | $168,069 | $168,069 | $168,841 | $170,386 | $171,931 | $173,476 | $175,020 | $176,565 | $178,110 | $178,882 | $178,882 | $178,882 | $178,882 | |
| Whitharral Res. | $0 | $0 | $0 | $1,168 | $3,843 | $3,902 | $4,021 | $2,637 | $5,522 | $4,444 | $5,144 | $5,748 | $5,988 | $6,232 | $6,478 | $6,727 | $6,979 | $7,184 | $7,389 | $7,594 | $7,799 | $8,004 | $8,209 | $8,415 | |
| Burkburnnet Res. | $0 | $0 | $58,608 | $169,384 | $262,246 | $336,186 | $359,114 | $391,932 | $424,484 | $427,845 | $441,481 | $458,545 | $469,506 | $480,467 | $491,428 | $502,389 | $513,351 | $524,312 | $535,273 | $546,234 | $557,196 | $568,157 | $579,118 | $590,079 | |
| Brownfield Res. | $0 | $0 | $0 | $38,038 | $108,667 | $148,595 | $162,323 | $168,788 | $168,835 | $173,465 | $175,320 | $181,181 | $186,466 | $190,929 | $195,441 | $197,265 | $199,089 | $200,913 | $202,736 | $204,560 | $205,472 | $205,472 | $205,472 | $205,472 | |
| Slaton Res. | $0 | $0 | $0 | $0 | $11,332 | $31,399 | $43,196 | $51,385 | $64,492 | $65,528 | $70,904 | $76,030 | $80,237 | $83,384 | $86,530 | $89,677 | $92,823 | $95,970 | $99,117 | $102,263 | $105,410 | $108,556 | $111,703 | $114,849 | |
| Wilson Res. | $0 | $0 | $0 | $0 | $0 | $3,491 | $10,414 | $12,597 | $15,000 | $14,170 | $14,852 | $15,765 | $16,226 | $16,686 | $17,147 | $17,607 | $18,068 | $18,528 | $18,989 | $19,449 | $19,910 | $20,371 | $20,831 | $21,292 | |
| Lamesa Res. | $0 | $0 | $0 | $0 | $0 | $11,791 | $66,190 | $95,973 | $114,056 | $129,924 | $137,265 | $147,168 | $157,371 | $167,805 | $178,469 | $186,770 | $195,071 | $203,372 | $211,672 | $217,898 | $219,973 | $219,973 | $219,973 | $219,973 | |
| Meadow Bus/Res. | $0 | $0 | $0 | $0 | $0 | $1,505 | $11,659 | $13,637 | $17,136 | $20,531 | $21,730 | $22,245 | $22,854 | $23,463 | $24,073 | $24,682 | $25,292 | $25,901 | $26,511 | $27,120 | $27,730 | $28,339 | $28,948 | $29,558 | |
| Ropesville Bus/Res. | $0 | $0 | $0 | $0 | $0 | $467 | $7,931 | $9,430 | $11,351 | $12,371 | $13,093 | $13,912 | $14,559 | $15,012 | $15,465 | $15,917 | $16,370 | $16,823 | $17,275 | $17,728 | $18,180 | $18,633 | $19,086 | $19,538 | |
| Plainview Res. | $0 | $0 | $0 | $0 | $0 | $0 | $643 | $22,675 | $61,993 | $104,918 | $122,125 | $144,646 | $168,572 | $189,432 | $207,068 | $222,037 | $237,006 | $251,975 | $266,944 | $281,912 | $296,881 | $311,850 | $326,819 | $341,788 | |
| Iowa Park Res. | $0 | $0 | $0 | $0 | $0 | $0 | $0 | $2,324 | $50,203 | $68,837 | $91,274 | $114,072 | $134,523 | $152,320 | $165,049 | $177,777 | $190,506 | $203,235 | $215,963 | $228,692 | $241,421 | $254,149 | $266,878 | $279,607 | |
| Hammond Res. | $0 | $0 | $0 | $0 | $0 | $0 | $0 | $0 | $0 | $0 | $5,196 | $13,054 | $44,409 | $117,798 | $194,698 | $250,217 | $286,561 | $304,356 | $304,667 | $302,566 | $306,613 | $309,649 | $311,906 | $308,326 | |
| Ponchatoula Res | $0 | $0 | $0 | $0 | $0 | $0 | $0 | $0 | $0 | $0 | $0 | $3,203 | $18,183 | $48,232 | $79,719 | $102,451 | $117,332 | $124,618 | $124,746 | $123,885 | $125,542 | $126,785 | $127,710 | $126,244 | |
| Abilene Res | $0 | $0 | $0 | $0 | $0 | $0 | $0 | $0 | $0 | $0 | $0 | $0 | $0 | $0 | $0 | $0 | $0 | $0 | $0 | $0 | $0 | $0 | $0 | $0 | |
| Hale Center Res | $0 | $0 | $0 | $0 | $0 | $0 | $0 | $0 | $0 | $0 | $12,556 | $31,637 | $46,404 | $60,470 | $69,254 | $73,554 | $73,629 | $73,122 | $74,100 | $74,833 | $75,379 | $74,514 | $74,401 | $75,304 | |
| Abernathy Res | $0 | $0 | $0 | $0 | $0 | $0 | $0 | $0 | $0 | $0 | $0 | $2,340 | $13,194 | $35,006 | $58,669 | $75,398 | $86,350 | $91,712 | $91,806 | $91,173 | $92,393 | $93,307 | $93,988 | $92,909 | |
| New Deal Res | $0 | $0 | $0 | $0 | $0 | $0 | $0 | $0 | $0 | $0 | $0 | $562 | $3,169 | $8,409 | $14,092 | $18,111 | $20,741 | $22,029 | $22,052 | $21,900 | $22,193 | $22,413 | $22,576 | $22,317 | |
| Amarillo Res | $0 | $0 | $0 | $0 | $0 | $0 | $0 | $0 | $0 | $0 | $0 | $0 | $0 | $0 | $0 | $0 | $0 | $0 | $0 | $0 | $0 | $0 | $0 | $0 | |
| Tickfaw Village Res | $0 | $0 | $0 | $0 | $0 | $0 | $0 | $0 | $0 | $0 | $0 | $0 | $1,196 | $6,792 | $18,016 | $29,777 | $38,268 | $43,826 | $46,547 | $46,595 | $46,274 | $46,893 | $47,357 | $47,702 | |
| Independence Res | $0 | $0 | $0 | $0 | $0 | $0 | $0 | $0 | $0 | $0 | $0 | $0 | $1,293 | $7,343 | $19,478 | $32,194 | $41,374 | $47,384 | $50,327 | $50,378 | $50,031 | $50,700 | $51,202 | $51,575 | |
| Amite Res | $0 | $0 | $0 | $0 | $0 | $0 | $0 | $0 | $0 | $0 | $0 | $0 | $2,028 | $11,512 | $30,537 | $50,473 | $64,865 | $74,287 | $78,900 | $78,981 | $78,436 | $79,485 | $80,272 | $80,858 | |
| Pine Grove Res | $0 | $0 | $0 | $0 | $0 | $0 | $0 | $0 | $0 | $0 | $0 | $0 | $1,128 | $6,402 | $16,981 | $28,067 | $36,070 | $41,309 | $43,874 | $43,919 | $43,616 | $44,200 | $44,637 | $44,963 | |
| Montpelier Res | $0 | $0 | $0 | $0 | $0 | $0 | $0 | $0 | $0 | $0 | $0 | $0 | $1,812 | $10,289 | $27,291 | $45,107 | $57,970 | $66,390 | $70,512 | $70,585 | $70,098 | $71,035 | $71,739 | $72,262 | |
| Franklinton Res | $0 | $0 | $0 | $0 | $0 | $0 | $0 | $0 | $0 | $0 | $0 | $0 | $474 | $2,690 | $7,135 | $11,793 | $15,155 | $17,357 | $18,435 | $18,453 | $18,326 | $18,571 | $18,755 | $18,892 | |
| Towers Res | $0 | $0 | $0 | $0 | $0 | $0 | $0 | $0 | $0 | $0 | $0 | $0 | $1,999 | $11,272 | $29,905 | $50,119 | $64,411 | $73,766 | $78,347 | $78,427 | $77,886 | $78,928 | $79,710 | $80,291 | |
| Natalbany Res | $0 | $0 | $0 | $0 | $0 | $0 | $0 | $0 | $0 | $0 | $0 | $0 | $746 | $4,236 | $11,238 | $18,574 | $23,870 | $27,337 | $29,035 | $29,064 | $28,864 | $29,250 | $29,540 | $29,755 | |
| $1,143,144 | $1,177,619 | $1,314,496 | $1,517,851 | $1,734,887 | $1,893,087 | $2,002,848 | $2,092,255 | $2,285,726 | $2,374,856 | $2,452,254 | $2,575,818 | $2,751,162 | $3,041,158 | $3,388,832 | $3,691,707 | $3,922,578 | $4,094,110 | $4,211,173 | $4,295,695 | $4,382,266 | $4,470,672 | $4,548,933 | $4,616,735 | ||
| ok | ok | ok | ok | ok | ok | ERROR | ERROR | ERROR | ERROR | ERROR | ERROR | ERROR | ERROR | ||||||||||||
| Gross Fiber Totals | $2,945,400 | $3,041,161 | $3,417,271 | $3,618,716 | $4,072,667 | $4,513,105 | $4,755,779 | $4,878,064 | $5,346,152 | $5,652,618 | $6,122,225 | $6,489,193 | |||||||||||||
| Gross Fiber Wholesale | $291 | $1,009 | $80,485 | $17,333 | $69,265 | $188,118 | $253,112 | $136,888 | $267,420 | $350,396 | $497,097 | $507,039 | $517,180 | $527,523 | $538,074 | $548,835 | $559,812 | $571,008 | $582,428 | $594,077 | $605,958 | $618,078 | $630,439 | $643,048 | |
| Lubbock Totals | $2,011,475 | $2,065,222 | $2,079,349 | $2,128,949 | $2,238,126 | $2,310,016 | $2,283,810 | $2,314,703 | $2,350,760 | $2,348,094 | $2,374,799 | $2,387,279 | $2,409,516 | $2,438,052 | $2,473,190 | $2,508,793 | $2,544,861 | $2,581,396 | $2,618,395 | $2,655,860 | $2,693,790 | $2,732,185 | $2,762,515 | $2,792,906 | |
| Wolfforth Totals | $196,255 | $196,144 | $198,019 | $201,732 | $200,983 | $204,815 | $202,702 | $211,093 | $218,959 | $209,236 | $208,854 | $209,445 | $211,830 | $216,985 | $225,038 | $233,258 | $241,648 | $250,207 | $258,934 | $265,234 | $271,534 | $277,834 | $284,134 | $290,434 | |
| Misc. Bus. Fiber - Other Mkts. | $19,916 | $19,811 | $20,101 | $21,399 | $20,863 | $22,902 | $25,119 | $26,229 | $25,138 | $22,670 | $22,670 | $22,670 | $22,670 | $22,670 | $22,670 | $22,670 | $22,670 | $22,670 | $22,670 | $22,670 | $22,670 | $22,670 | $22,670 | $22,670 | |
| Levelland Totals | $697,577 | $739,232 | $855,495 | $806,314 | $841,796 | $884,299 | $879,571 | $874,508 | $889,346 | $913,472 | $921,687 | $926,402 | $932,634 | $941,998 | $954,560 | $967,214 | $975,352 | $983,495 | $991,644 | $999,797 | $1,007,956 | $1,016,120 | $1,024,289 | $1,032,463 | |
| Smyer Totals | $19,886 | $19,743 | $20,204 | $22,924 | $26,894 | $25,000 | $25,121 | $22,616 | $26,598 | $26,832 | $26,466 | $25,979 | $25,993 | $26,140 | $26,421 | $26,702 | $26,983 | $27,264 | $27,545 | $27,826 | $28,107 | $28,388 | $28,669 | $28,950 | |
| Littlefield Totals (Incl. Hockley Co.) | $0 | $0 | $76,739 | $149,879 | $191,931 | $203,043 | $213,938 | $220,905 | $235,341 | $237,010 | $233,843 | $236,215 | $238,323 | $245,003 | $256,242 | $264,855 | $266,892 | $268,929 | $270,967 | $273,004 | $274,269 | $274,761 | $275,253 | $275,746 | |
| Whitharral Res. | $0 | $0 | $0 | $1,168 | $3,843 | $3,902 | $4,021 | $2,637 | $5,522 | $4,444 | $5,144 | $5,748 | $5,988 | $6,232 | $6,478 | $6,727 | $6,979 | $7,184 | $7,389 | $7,594 | $7,799 | $8,004 | $8,209 | $8,415 | |
| Burkburnnet Totals | $0 | $0 | $86,879 | $224,536 | $323,539 | $410,584 | $432,893 | $454,809 | $486,034 | $490,067 | $520,295 | $545,735 | $570,000 | $599,091 | $623,771 | $639,253 | $653,942 | $668,632 | $683,321 | $698,010 | $712,699 | $725,897 | $736,859 | $747,820 | |
| Brownfield Totals | $0 | $0 | $0 | $44,481 | $135,073 | $190,765 | $217,799 | $231,681 | $233,525 | $237,545 | $243,501 | $253,161 | $262,107 | $271,861 | $283,669 | $292,074 | $297,966 | $302,503 | $307,039 | $311,575 | $315,200 | $317,099 | $317,099 | $317,099 | |
| Slaton Totals | $0 | $0 | $0 | $0 | $20,354 | $50,836 | $61,699 | $70,366 | $84,843 | $87,877 | $95,663 | $103,675 | $110,753 | $116,912 | $123,212 | $129,654 | $136,238 | $142,354 | $148,564 | $154,868 | $161,267 | $166,351 | $171,435 | $176,518 | |
| Wilson Totals | $0 | $0 | $0 | $0 | $0 | $3,990 | $11,955 | $14,311 | $16,693 | $15,428 | $16,243 | $17,166 | $17,626 | $18,087 | $18,548 | $19,008 | $19,469 | $19,929 | $20,390 | $20,850 | $21,311 | $21,771 | $22,232 | $22,692 | |
| Meadow Bus/Res. | $0 | $0 | $0 | $0 | $0 | $1,505 | $11,659 | $13,637 | $17,136 | $20,531 | $21,730 | $22,245 | $22,854 | $23,463 | $24,073 | $24,682 | $25,292 | $25,901 | $26,511 | $27,120 | $27,730 | $28,339 | $28,948 | $29,558 | |
| Lamesa Totals | $0 | $0 | $0 | $0 | $0 | $12,864 | $100,298 | $150,138 | $173,379 | $198,832 | $216,468 | $233,609 | $250,592 | $270,346 | $290,236 | $303,599 | $316,961 | $330,323 | $341,998 | $351,598 | $357,048 | $358,060 | $358,060 | $358,060 | |
| Ropesville Bus/Res. | $0 | $0 | $0 | $0 | $0 | $467 | $7,931 | $9,430 | $11,351 | $12,371 | $13,093 | $13,912 | $14,559 | $15,012 | $15,465 | $15,917 | $16,370 | $16,823 | $17,275 | $17,728 | $18,180 | $18,633 | $19,086 | $19,538 | |
| Plainview Totals | $0 | $0 | $0 | $0 | $0 | $0 | $24,152 | $112,643 | $174,086 | $232,748 | $290,137 | $327,703 | $375,513 | $426,325 | $471,316 | $502,227 | $531,764 | $561,671 | $588,094 | $610,755 | $625,724 | $640,693 | $655,661 | $670,630 | |
| Wichita Falls Bus. | $0 | $0 | $0 | $0 | $0 | $0 | $0 | $9,144 | $73,591 | $150,722 | $179,189 | $233,767 | $288,057 | $331,559 | $350,524 | $369,756 | $389,253 | $403,477 | $417,879 | $432,458 | $441,541 | $444,995 | $448,449 | $451,903 | |
| Iowa Park Totals | $0 | $0 | $0 | $0 | $0 | $0 | $0 | $2,324 | $56,431 | $78,034 | $102,794 | $128,984 | $152,632 | $178,797 | $204,860 | $227,163 | $244,313 | $261,645 | $279,159 | $296,855 | $313,716 | $330,699 | $347,803 | $365,029 | |
| Hammond Total | $0 | $0 | $0 | $0 | $0 | $0 | $0 | $0 | $0 | $16,310 | $89,082 | $156,685 | $216,809 | $316,978 | $416,692 | $496,073 | $557,331 | $601,089 | $628,413 | $654,375 | $687,536 | $720,735 | $754,205 | $782,887 | |
| Ponchatoula Total | $0 | $0 | $0 | $0 | $0 | $0 | $0 | $0 | $0 | $0 | $0 | $25,964 | $75,086 | $123,011 | $165,357 | $199,517 | $226,395 | $246,247 | $259,510 | $272,353 | $288,284 | $304,369 | $320,704 | $335,218 | |
| Abilene Total | $0 | $0 | $0 | $0 | $0 | $0 | $0 | $0 | $0 | $0 | $30,000 | $56,925 | $129,600 | $197,775 | $241,659 | $252,750 | $264,009 | $275,437 | $287,034 | $298,799 | $310,733 | $322,836 | $335,108 | $347,548 | |
| Hale Center Total | $0 | $0 | $0 | $0 | $0 | $0 | $0 | $0 | $0 | $0 | $13,471 | $34,240 | $50,735 | $66,986 | $78,944 | $86,437 | $88,653 | $89,779 | $92,978 | $95,678 | $97,295 | $97,840 | $99,374 | $101,581 | |
| Abernathy Total | $0 | $0 | $0 | $0 | $0 | $0 | $0 | $0 | $0 | $0 | $0 | $4,587 | $19,088 | $43,882 | $71,885 | $92,988 | $106,882 | $114,499 | $117,654 | $119,736 | $122,447 | $125,321 | $128,285 | $129,021 | |
| New Deal Total | $0 | $0 | $0 | $0 | $0 | $0 | $0 | $0 | $0 | $0 | $0 | $1,059 | $4,471 | $10,370 | $17,012 | $21,997 | $25,278 | $27,064 | $27,763 | $28,210 | $28,833 | $29,485 | $30,153 | $30,295 | |
| Amarillo Total | $0 | $0 | $0 | $0 | $0 | $0 | $0 | $0 | $0 | $0 | $0 | $9,000 | $74,925 | $185,850 | $277,399 | $345,800 | $393,056 | $416,634 | $440,888 | $465,816 | $491,419 | $517,698 | $544,651 | $572,279 | |
| Tickfaw Village Totals | $0 | $0 | $0 | $0 | $0 | $0 | $0 | $0 | $0 | $0 | $0 | $0 | $1,569 | $7,721 | $19,399 | $31,617 | $40,416 | $46,211 | $49,252 | $49,584 | $49,419 | $50,243 | $50,946 | $51,481 | |
| Independence Total | $0 | $0 | $0 | $0 | $0 | $0 | $0 | $0 | $0 | $0 | $0 | $0 | $1,749 | $8,478 | $21,169 | $34,444 | $44,001 | $50,299 | $53,633 | $54,031 | $53,875 | $54,795 | $55,589 | $56,194 | |
| Amite Total | $0 | $0 | $0 | $0 | $0 | $0 | $0 | $0 | $0 | $0 | $0 | $0 | $5,672 | $20,595 | $44,061 | $68,471 | $85,875 | $97,603 | $105,349 | $108,208 | $109,190 | $112,243 | $115,367 | $117,810 | |
| Pine Grove Total | $0 | $0 | $0 | $0 | $0 | $0 | $0 | $0 | $0 | $0 | $0 | $0 | $1,417 | $7,124 | $18,057 | $29,498 | $37,741 | $43,164 | $45,978 | $46,244 | $46,063 | $46,806 | $47,429 | $47,902 | |
| Montpelier Total | $0 | $0 | $0 | $0 | $0 | $0 | $0 | $0 | $0 | $0 | $0 | $0 | $2,309 | $11,527 | $29,135 | $47,562 | $60,835 | $69,569 | $74,119 | $74,570 | $74,291 | $75,502 | $76,524 | $77,301 | |
| Franklington Total | $0 | $0 | $0 | $0 | $0 | $0 | $0 | $0 | $0 | $0 | $0 | $0 | $2,834 | $8,573 | $15,894 | $23,451 | $28,764 | $32,459 | $35,566 | $37,385 | $38,246 | $39,790 | $41,487 | $42,827 | |
| Towers Totals | $0 | $0 | $0 | $0 | $0 | $0 | $0 | $0 | $0 | $0 | $0 | $0 | $7,508 | $24,999 | $50,343 | $77,321 | $96,164 | $109,006 | $118,321 | $122,601 | $124,367 | $128,437 | $132,751 | $136,140 | |
| Natalbany Totals | $0 | $0 | $0 | $0 | $0 | $0 | $0 | $0 | $0 | $0 | $0 | $0 | $1,782 | $6,817 | $15,079 | $23,687 | $29,838 | $33,961 | $36,548 | $37,367 | $37,601 | $38,556 | $39,510 | $40,253 | |
| $2,945,400 | $3,041,161 | $3,417,271 | $3,618,716 | $4,072,667 | $4,513,105 | $4,755,779 | $4,878,064 | $5,346,152 | $5,652,618 | $6,122,225 | $6,489,193 | $7,024,379 | $7,716,740 | $8,390,430 | $8,934,001 | $9,362,004 | $9,698,430 | $9,983,207 | $10,232,838 | $10,466,097 | $10,695,231 | $10,913,893 | $11,122,218 | ||
| Business Count | |||||||||||||||||||||||||
| Lubbock Bus. | 1,484 | 1,501 | 1,509 | 1,503 | 1,537 | 1,550 | 1,554 | 1,566 | 1,593 | 1,612 | 1,611 | 1,618 | 1,625 | 1,631 | 1,638 | 1,645 | 1,652 | 1,658 | 1,665 | 1,672 | 1,679 | 1,685 | 1,692 | 1,699 | |
| Wolfforth Bus. | 73 | 76 | 79 | 81 | 82 | 84 | 83 | 79 | 80 | 76 | 75 | 75 | 75 | 75 | 75 | 75 | 75 | 75 | 75 | 75 | 75 | 75 | 75 | 75 | |
| Misc. Bus. Fiber - Other Mkts. | 0 | 0 | 0 | 0 | 12 | 11 | 16 | 10 | 10 | 6 | 0 | 0 | 0 | 0 | 0 | 0 | 0 | 0 | 0 | 0 | 0 | 0 | 0 | 0 | |
| Levelland Bus | 145 | 153 | 175 | 177 | 183 | 190 | 199 | 200 | 204 | 212 | 213 | 213 | 214 | 215 | 215 | 216 | 216 | 217 | 217 | 218 | 219 | 219 | 220 | 220 | |
| Smyer Bus. | 2 | 2 | 2 | 1 | 1 | 1 | 1 | 1 | 1 | 1 | 1 | 1 | 1 | 1 | 1 | 1 | 1 | 1 | 1 | 1 | 1 | 1 | 1 | 1 | |
| Littlefield Bus. (Incl. Hockley Co.) | 0 | 0 | 26 | 49 | 58 | 70 | 74 | 70 | 71 | 71 | 74 | 76 | 78 | 94 | 109 | 109 | 109 | 109 | 109 | 109 | 109 | 109 | 109 | 109 | |
| Burkburnnet Bus. | 0 | 0 | 25 | 64 | 75 | 92 | 95 | 99 | 102 | 104 | 110 | 116 | 140 | 164 | 166 | 166 | 166 | 166 | 166 | 166 | 166 | 166 | 166 | 166 | |
| Brownfield Bus. | 0 | 0 | 0 | 17 | 42 | 56 | 88 | 97 | 108 | 108 | 108 | 108 | 108 | 114 | 121 | 121 | 121 | 121 | 121 | 121 | 121 | 121 | 121 | 121 | |
| Slaton Bus. | 0 | 0 | 0 | 0 | 17 | 24 | 29 | 31 | 34 | 38 | 41 | 43 | 45 | 47 | 49 | 51 | 53 | 55 | 57 | 60 | 62 | 64 | 66 | 68 | |
| Wilson Bus. | 0 | 0 | 0 | 0 | 0 | 2 | 4 | 4 | 4 | 4 | 4 | 4 | 4 | 4 | 4 | 4 | 4 | 4 | 4 | 4 | 4 | 4 | 4 | 4 | |
| Lamesa Bus. (incl. Dawson Co) | 0 | 0 | 0 | 0 | 0 | 3 | 89 | 112 | 118 | 126 | 132 | 135 | 138 | 150 | 150 | 150 | 150 | 150 | 150 | 150 | 150 | 150 | 150 | 150 | |
| Plainview Bus. | 0 | 0 | 0 | 0 | 0 | 0 | 20 | 157 | 190 | 212 | 219 | 231 | 268 | 305 | 317 | 325 | 334 | 342 | 342 | 342 | 342 | 342 | 342 | 342 | |
| Wichita Falls Bus. | 0 | 0 | 0 | 0 | 0 | 0 | 0 | 26 | 180 | 241 | 321 | 396 | 475 | 479 | 483 | 487 | 490 | 494 | 498 | 502 | 506 | 510 | 514 | 518 | |
| Iowa Park Bus. | 0 | 0 | 0 | 0 | 0 | 0 | 0 | 0 | 12 | 21 | 27 | 31 | 35 | 55 | 76 | 78 | 81 | 84 | 86 | 89 | 92 | 95 | 97 | 100 | |
| Hammond Bus | 0 | 0 | 0 | 0 | 0 | 0 | 0 | 0 | 0 | 66 | 214 | 248 | 287 | 310 | 333 | 357 | 380 | 403 | 427 | 450 | 473 | 497 | 520 | 543 | |
| Ponchatoula Bus | 0 | 0 | 0 | 0 | 0 | 0 | 0 | 0 | 0 | 0 | 0 | 76 | 114 | 126 | 139 | 152 | 164 | 177 | 190 | 202 | 215 | 228 | 240 | 253 | |
| Abilene Bus | 0 | 0 | 0 | 0 | 0 | 0 | 0 | 0 | 0 | 0 | 30 | 158 | 270 | 383 | 386 | 390 | 394 | 398 | 401 | 405 | 409 | 413 | 416 | 420 | |
| Hale Center Bus | 0 | 0 | 0 | 0 | 0 | 0 | 0 | 0 | 0 | 0 | 3 | 5 | 8 | 11 | 17 | 19 | 21 | 23 | 26 | 26 | 27 | 28 | 29 | 30 | |
| Abernathy Bus | 0 | 0 | 0 | 0 | 0 | 0 | 0 | 0 | 0 | 0 | 0 | 7 | 11 | 16 | 24 | 27 | 30 | 32 | 36 | 37 | 38 | 40 | 41 | 42 | |
| New Deal Bus | 0 | 0 | 0 | 0 | 0 | 0 | 0 | 0 | 0 | 0 | 0 | 2 | 3 | 4 | 5 | 6 | 7 | 7 | 8 | 8 | 8 | 9 | 9 | 9 | |
| Amarillo Bus | 0 | 0 | 0 | 0 | 0 | 0 | 0 | 0 | 0 | 0 | 0 | 30 | 218 | 398 | 488 | 578 | 593 | 608 | 623 | 638 | 653 | 668 | 683 | 698 | |
| Tickfaw Village Bus | 0 | 0 | 0 | 0 | 0 | 0 | 0 | 0 | 0 | 0 | 0 | 0 | 1 | 2 | 2 | 3 | 3 | 3 | 4 | 4 | 4 | 4 | 4 | 4 | |
| Independence Bus | 0 | 0 | 0 | 0 | 0 | 0 | 0 | 0 | 0 | 0 | 0 | 0 | 1 | 2 | 3 | 4 | 4 | 4 | 5 | 5 | 5 | 5 | 5 | 5 | |
| Amite Bus | 0 | 0 | 0 | 0 | 0 | 0 | 0 | 0 | 0 | 0 | 0 | 0 | 12 | 16 | 24 | 28 | 31 | 33 | 37 | 38 | 39 | 40 | 42 | 43 | |
| Pine Grove Bus | 0 | 0 | 0 | 0 | 0 | 0 | 0 | 0 | 0 | 0 | 0 | 0 | 1 | 1 | 2 | 2 | 2 | 3 | 3 | 3 | 3 | 3 | 3 | 3 | |
| Montpelier Bus | 0 | 0 | 0 | 0 | 0 | 0 | 0 | 0 | 0 | 0 | 0 | 0 | 2 | 2 | 3 | 4 | 4 | 4 | 5 | 5 | 5 | 6 | 6 | 6 | |
| Franklinton Bus | 0 | 0 | 0 | 0 | 0 | 0 | 0 | 0 | 0 | 0 | 0 | 0 | 8 | 11 | 16 | 18 | 20 | 21 | 24 | 24 | 25 | 26 | 27 | 28 | |
| Towers Bus | 0 | 0 | 0 | 0 | 0 | 0 | 0 | 0 | 0 | 0 | 0 | 0 | 18 | 25 | 36 | 42 | 47 | 49 | 56 | 57 | 59 | 61 | 64 | 64 | |
| Natalbany Bus | 0 | 0 | 0 | 0 | 0 | 0 | 0 | 0 | 0 | 0 | 0 | 0 | 3 | 5 | 7 | 8 | 9 | 9 | 11 | 11 | 11 | 11 | 12 | 12 | |
| 1,704 | 1,732 | 1,816 | 1,892 | 2,007 | 2,083 | 2,252 | 2,452 | 2,707 | 2,898 | 3,183 | 3,574 | 4,162 | 4,645 | 4,888 | 5,066 | 5,161 | 5,250 | 5,348 | 5,421 | 5,499 | 5,578 | 5,660 | 5,732 | ||
| ok | ok | ok | ok | ok | ERROR | ERROR | ERROR | ERROR | ERROR | ERROR | ERROR | ERROR | ERROR | ||||||||||||
| Residential Count | |||||||||||||||||||||||||
| Lubbock Res. | 1,824 | 1,825 | 1,784 | 1,716 | 1,698 | 1,657 | 1,620 | 1,548 | 1,559 | 1,506 | 1,469 | 1,469 | 1,469 | 1,514 | 1,559 | 1,604 | 1,648 | 1,693 | 1,738 | 1,783 | 1,828 | 1,873 | 1,918 | 1,963 | |
| Wolfforth Res. | 495 | 494 | 482 | 470 | 472 | 478 | 472 | 464 | 464 | 464 | 455 | 455 | 455 | 474 | 493 | 511 | 530 | 549 | 568 | 586 | 605 | 624 | 643 | 661 | |
| Levelland Res | 1,930 | 1,980 | 1,934 | 1,953 | 1,986 | 1,992 | 2,015 | 1,946 | 2,009 | 1,994 | 1,981 | 1,981 | 1,981 | 2,000 | 2,020 | 2,039 | 2,058 | 2,078 | 2,097 | 2,117 | 2,136 | 2,156 | 2,175 | 2,195 | |
| Smyer Res. | 64 | 67 | 65 | 74 | 76 | 77 | 76 | 72 | 78 | 78 | 75 | 75 | 75 | 76 | 77 | 77 | 78 | 79 | 80 | 81 | 81 | 82 | 83 | 84 | |
| Littlefield Res. (Incl. Hockley Co.) | 0 | 0 | 230 | 350 | 432 | 449 | 468 | 482 | 531 | 511 | 509 | 509 | 509 | 513 | 518 | 523 | 527 | 532 | 537 | 542 | 542 | 542 | 542 | 542 | |
| Whitharral Res. | 0 | 0 | 0 | 4 | 11 | 10 | 9 | 10 | 15 | 15 | 18 | 19 | 19 | 20 | 20 | 21 | 22 | 22 | 23 | 24 | 24 | 25 | 26 | 26 | |
| Burkburnnet Res. | 0 | 0 | 301 | 630 | 906 | 1,078 | 1,180 | 1,242 | 1,315 | 1,346 | 1,379 | 1,413 | 1,446 | 1,479 | 1,513 | 1,546 | 1,579 | 1,613 | 1,646 | 1,679 | 1,713 | 1,746 | 1,780 | 1,813 | |
| Brownfield Res. | 0 | 0 | 0 | 178 | 399 | 480 | 523 | 534 | 557 | 568 | 578 | 589 | 595 | 600 | 606 | 612 | 617 | 623 | 629 | 634 | 634 | 634 | 634 | 634 | |
| Slaton Res. | 0 | 0 | 0 | 0 | 61 | 116 | 145 | 165 | 201 | 215 | 231 | 241 | 250 | 260 | 269 | 279 | 289 | 298 | 308 | 318 | 327 | 337 | 346 | 356 | |
| Wilson Res. | 0 | 0 | 0 | 0 | 0 | 20 | 33 | 36 | 42 | 42 | 46 | 47 | 49 | 50 | 52 | 53 | 54 | 56 | 57 | 58 | 60 | 61 | 62 | 64 | |
| Lamesa Res. | 0 | 0 | 0 | 0 | 0 | 74 | 244 | 317 | 381 | 436 | 461 | 487 | 512 | 538 | 564 | 589 | 615 | 641 | 666 | 679 | 679 | 679 | 679 | 679 | |
| Meadow Bus/Res. | 0 | 0 | 0 | 0 | 0 | 9 | 35 | 40 | 51 | 58 | 59 | 61 | 62 | 64 | 66 | 67 | 69 | 71 | 72 | 74 | 76 | 77 | 79 | 80 | |
| Ropesville Bus/Res. | 0 | 0 | 0 | 0 | 0 | 4 | 27 | 32 | 37 | 40 | 43 | 44 | 45 | 47 | 48 | 49 | 51 | 52 | 54 | 55 | 56 | 58 | 59 | 61 | |
| Plainview Res. | 0 | 0 | 0 | 0 | 0 | 0 | 5 | 97 | 254 | 367 | 431 | 501 | 570 | 616 | 662 | 708 | 755 | 801 | 847 | 893 | 939 | 986 | 1,032 | 1,078 | |
| Iowa Park Res. | 0 | 0 | 0 | 0 | 0 | 0 | 0 | 23 | 192 | 254 | 331 | 390 | 448 | 488 | 527 | 566 | 605 | 644 | 683 | 722 | 761 | 800 | 839 | 879 | |
| Hammond Res. | 0 | 0 | 0 | 0 | 0 | 0 | 0 | 0 | 0 | 0 | 33 | 49 | 227 | 496 | 699 | 837 | 922 | 946 | 924 | 933 | 949 | 951 | 962 | 929 | |
| Ponchatoula Res | 0 | 0 | 0 | 0 | 0 | 0 | 0 | 0 | 0 | 0 | 0 | 20 | 93 | 203 | 286 | 343 | 377 | 387 | 378 | 382 | 388 | 390 | 394 | 381 | |
| Abilene Res | 0 | 0 | 0 | 0 | 0 | 0 | 0 | 0 | 0 | 0 | 0 | 0 | 0 | 0 | 0 | 0 | 0 | 0 | 0 | 0 | 0 | 0 | 0 | 0 | |
| Hale Center Res | 0 | 0 | 0 | 0 | 0 | 0 | 0 | 0 | 0 | 0 | 80 | 120 | 169 | 202 | 223 | 229 | 223 | 225 | 229 | 230 | 233 | 225 | 232 | 230 | |
| Abernathy Res | 0 | 0 | 0 | 0 | 0 | 0 | 0 | 0 | 0 | 0 | 0 | 15 | 68 | 149 | 211 | 252 | 278 | 285 | 278 | 281 | 286 | 287 | 290 | 280 | |
| New Deal Res | 0 | 0 | 0 | 0 | 0 | 0 | 0 | 0 | 0 | 0 | 0 | 4 | 16 | 36 | 51 | 61 | 67 | 68 | 67 | 68 | 69 | 69 | 70 | 67 | |
| Amarillo Res | 0 | 0 | 0 | 0 | 0 | 0 | 0 | 0 | 0 | 0 | 0 | 0 | 0 | 0 | 0 | 0 | 0 | 0 | 0 | 0 | 0 | 0 | 0 | 0 | |
| Tickfaw Village Res | 0 | 0 | 0 | 0 | 0 | 0 | 0 | 0 | 0 | 0 | 0 | 0 | 8 | 35 | 76 | 107 | 128 | 141 | 145 | 141 | 143 | 145 | 146 | 147 | |
| Independence Res | 0 | 0 | 0 | 0 | 0 | 0 | 0 | 0 | 0 | 0 | 0 | 0 | 8 | 38 | 82 | 116 | 138 | 152 | 156 | 153 | 154 | 157 | 157 | 159 | |
| Amite Res | 0 | 0 | 0 | 0 | 0 | 0 | 0 | 0 | 0 | 0 | 0 | 0 | 13 | 59 | 129 | 181 | 217 | 239 | 245 | 239 | 242 | 246 | 247 | 249 | |
| Pine Grove Res | 0 | 0 | 0 | 0 | 0 | 0 | 0 | 0 | 0 | 0 | 0 | 0 | 7 | 33 | 71 | 101 | 121 | 133 | 136 | 133 | 134 | 137 | 137 | 139 | |
| Montpelier Res | 0 | 0 | 0 | 0 | 0 | 0 | 0 | 0 | 0 | 0 | 0 | 0 | 11 | 53 | 115 | 162 | 194 | 214 | 219 | 214 | 216 | 220 | 220 | 223 | |
| Franklinton Res | 0 | 0 | 0 | 0 | 0 | 0 | 0 | 0 | 0 | 0 | 0 | 0 | 3 | 14 | 30 | 42 | 51 | 56 | 57 | 56 | 56 | 57 | 58 | 58 | |
| Towers Res | 0 | 0 | 0 | 0 | 0 | 0 | 0 | 0 | 0 | 0 | 0 | 0 | 13 | 58 | 128 | 180 | 215 | 237 | 243 | 238 | 240 | 244 | 245 | 248 | |
| Natalbany Res | 0 | 0 | 0 | 0 | 0 | 0 | 0 | 0 | 0 | 0 | 0 | 0 | 5 | 22 | 47 | 67 | 80 | 88 | 90 | 88 | 89 | 90 | 91 | 92 | |
| 4,313 | 4,366 | 4,796 | 5,375 | 6,041 | 6,444 | 6,852 | 7,008 | 7,686 | 7,894 | 8,178 | 8,486 | 9,126 | 10,135 | 11,138 | 11,920 | 12,508 | 12,923 | 13,173 | 13,401 | 13,661 | 13,897 | 14,145 | 14,317 | ||
| ok | ok | ok | ok | ok | ok | ERROR | ERROR | ERROR | ERROR | ERROR | ERROR | ERROR | ERROR | ||||||||||||
| Total Count | |||||||||||||||||||||||||
| Lubbock Totals | 3,308 | 3,326 | 3,293 | 3,219 | 3,235 | 3,207 | 3,174 | 3,114 | 3,152 | 3,118 | 3,080 | 3,086 | 3,093 | 3,145 | 3,197 | 3,248 | 3,300 | 3,352 | 3,403 | 3,455 | 3,507 | 3,559 | 3,610 | 3,662 | |
| Wolfforth Totals | 568 | 570 | 561 | 551 | 554 | 562 | 555 | 543 | 544 | 540 | 530 | 530 | 530 | 549 | 568 | 586 | 605 | 624 | 643 | 661 | 680 | 699 | 718 | 736 | |
| Misc. Bus. Fiber - Other Mkts. | 0 | 0 | 0 | 0 | 12 | 11 | 16 | 10 | 10 | 6 | 0 | 0 | 0 | 0 | 0 | 0 | 0 | 0 | 0 | 0 | 0 | 0 | 0 | 0 | |
| Levelland Totals | 2,075 | 2,133 | 2,109 | 2,130 | 2,169 | 2,182 | 2,214 | 2,146 | 2,213 | 2,206 | 2,193 | 2,194 | 2,195 | 2,215 | 2,235 | 2,255 | 2,275 | 2,295 | 2,315 | 2,335 | 2,355 | 2,375 | 2,395 | 2,415 | |
| Smyer Totals | 66 | 69 | 67 | 75 | 77 | 78 | 77 | 73 | 79 | 79 | 76 | 76 | 76 | 77 | 78 | 78 | 79 | 80 | 81 | 82 | 83 | 83 | 84 | 85 | |
| Littlefield Totals (Incl. Hockley Co.) | 0 | 0 | 256 | 399 | 490 | 519 | 542 | 552 | 602 | 582 | 583 | 585 | 587 | 607 | 628 | 632 | 637 | 642 | 646 | 651 | 651 | 651 | 651 | 651 | |
| Whitharral Res. | 0 | 0 | 0 | 4 | 11 | 10 | 9 | 10 | 15 | 15 | 18 | 19 | 19 | 20 | 20 | 21 | 22 | 22 | 23 | 24 | 24 | 25 | 26 | 26 | |
| Burkburnnet Totals | 0 | 0 | 326 | 694 | 981 | 1,170 | 1,275 | 1,341 | 1,417 | 1,450 | 1,490 | 1,529 | 1,586 | 1,643 | 1,678 | 1,712 | 1,745 | 1,778 | 1,812 | 1,845 | 1,879 | 1,912 | 1,945 | 1,979 | |
| Brownfield Totals | 0 | 0 | 0 | 195 | 441 | 536 | 611 | 631 | 665 | 676 | 686 | 698 | 703 | 714 | 727 | 732 | 738 | 743 | 749 | 755 | 755 | 755 | 755 | 755 | |
| Slaton Totals | 0 | 0 | 0 | 0 | 78 | 140 | 174 | 196 | 235 | 253 | 272 | 283 | 295 | 307 | 318 | 330 | 342 | 354 | 365 | 377 | 389 | 400 | 412 | 424 | |
| Wilson Totals | 0 | 0 | 0 | 0 | 0 | 22 | 37 | 40 | 46 | 46 | 50 | 51 | 53 | 54 | 56 | 57 | 58 | 60 | 61 | 62 | 64 | 65 | 66 | 68 | |
| Meadow Bus/Res. | 0 | 0 | 0 | 0 | 0 | 9 | 35 | 40 | 51 | 58 | 59 | 61 | 62 | 64 | 66 | 67 | 69 | 71 | 72 | 74 | 76 | 77 | 79 | 80 | |
| Lamesa Totals | 0 | 0 | 0 | 0 | 0 | 77 | 333 | 429 | 499 | 562 | 593 | 622 | 651 | 688 | 714 | 739 | 765 | 790 | 816 | 829 | 829 | 829 | 829 | 829 | |
| Ropesville Bus/Res. | 0 | 0 | 0 | 0 | 0 | 4 | 27 | 32 | 37 | 40 | 43 | 44 | 45 | 47 | 48 | 49 | 51 | 52 | 54 | 55 | 56 | 58 | 59 | 61 | |
| Plainview Totals | 0 | 0 | 0 | 0 | 0 | 0 | 25 | 254 | 444 | 579 | 650 | 732 | 838 | 921 | 979 | 1,034 | 1,088 | 1,143 | 1,189 | 1,235 | 1,281 | 1,327 | 1,374 | 1,420 | |
| Wichita Falls Bus. | 0 | 0 | 0 | 0 | 0 | 0 | 0 | 26 | 180 | 241 | 321 | 396 | 475 | 479 | 483 | 487 | 490 | 494 | 498 | 502 | 506 | 510 | 514 | 518 | |
| Iowa Park Totals | 0 | 0 | 0 | 0 | 0 | 0 | 0 | 23 | 204 | 275 | 358 | 421 | 484 | 543 | 602 | 644 | 686 | 728 | 769 | 811 | 853 | 895 | 937 | 978 | |
| Hammond Total | 0 | 0 | 0 | 0 | 0 | 0 | 0 | 0 | 0 | 0 | 247 | 297 | 514 | 806 | 1,032 | 1,193 | 1,302 | 1,349 | 1,350 | 1,383 | 1,422 | 1,448 | 1,482 | 1,473 | |
| Ponchatoula Total | 0 | 0 | 0 | 0 | 0 | 0 | 0 | 0 | 0 | 0 | 0 | 96 | 207 | 329 | 425 | 494 | 542 | 564 | 568 | 584 | 603 | 617 | 634 | 633 | |
| Abilene Total | 0 | 0 | 0 | 0 | 0 | 0 | 0 | 0 | 0 | 0 | 30 | 158 | 270 | 383 | 386 | 390 | 394 | 398 | 401 | 405 | 409 | 413 | 416 | 420 | |
| Hale Center Total | 0 | 0 | 0 | 0 | 0 | 0 | 0 | 0 | 0 | 0 | 83 | 125 | 177 | 214 | 239 | 248 | 245 | 248 | 255 | 256 | 260 | 253 | 261 | 260 | |
| Abernathy Total | 0 | 0 | 0 | 0 | 0 | 0 | 0 | 0 | 0 | 0 | 0 | 22 | 80 | 165 | 234 | 280 | 308 | 317 | 315 | 318 | 324 | 326 | 331 | 322 | |
| New Deal Total | 0 | 0 | 0 | 0 | 0 | 0 | 0 | 0 | 0 | 0 | 0 | 5 | 19 | 39 | 56 | 67 | 73 | 75 | 75 | 76 | 77 | 78 | 79 | 76 | |
| Amarillo Total | 0 | 0 | 0 | 0 | 0 | 0 | 0 | 0 | 0 | 0 | 0 | 30 | 218 | 398 | 488 | 578 | 593 | 608 | 623 | 638 | 653 | 668 | 683 | 698 | |
| Tickfaw Village Totals | 0 | 0 | 0 | 0 | 0 | 0 | 0 | 0 | 0 | 0 | 0 | 0 | 9 | 36 | 78 | 110 | 131 | 144 | 148 | 145 | 147 | 149 | 150 | 152 | |
| Independence Total | 0 | 0 | 0 | 0 | 0 | 0 | 0 | 0 | 0 | 0 | 0 | 0 | 10 | 40 | 85 | 119 | 142 | 156 | 161 | 157 | 159 | 162 | 163 | 164 | |
| Amite Total | 0 | 0 | 0 | 0 | 0 | 0 | 0 | 0 | 0 | 0 | 0 | 0 | 25 | 75 | 153 | 209 | 248 | 272 | 282 | 277 | 281 | 286 | 289 | 292 | |
| Pine Grove Total | 0 | 0 | 0 | 0 | 0 | 0 | 0 | 0 | 0 | 0 | 0 | 0 | 8 | 34 | 73 | 103 | 123 | 135 | 139 | 136 | 138 | 140 | 141 | 142 | |
| Montpelier Total | 0 | 0 | 0 | 0 | 0 | 0 | 0 | 0 | 0 | 0 | 0 | 0 | 13 | 55 | 118 | 166 | 198 | 218 | 224 | 219 | 221 | 225 | 226 | 229 | |
| Franklington Total | 0 | 0 | 0 | 0 | 0 | 0 | 0 | 0 | 0 | 0 | 0 | 0 | 11 | 24 | 46 | 61 | 71 | 77 | 81 | 80 | 82 | 84 | 85 | 86 | |
| Towers Totals | 0 | 0 | 0 | 0 | 0 | 0 | 0 | 0 | 0 | 0 | 0 | 0 | 30 | 83 | 164 | 222 | 262 | 287 | 300 | 295 | 299 | 305 | 309 | 312 | |
| Natalbany Totals | 0 | 0 | 0 | 0 | 0 | 0 | 0 | 0 | 0 | 0 | 0 | 0 | 8 | 26 | 54 | 75 | 89 | 97 | 101 | 99 | 100 | 102 | 103 | 104 | |
| 6,017 | 6,098 | 6,612 | 7,267 | 8,048 | 8,527 | 9,104 | 9,460 | 10,393 | 10,726 | 11,361 | 12,060 | 13,288 | 14,780 | 16,027 | 16,986 | 17,669 | 18,173 | 18,521 | 18,822 | 19,160 | 19,476 | 19,805 | 20,049 | ||
| Business ARPU | |||||||||||||||||||||||||
| Lubbock Bus. | $349 | $358 | $358 | $373 | $391 | $404 | $400 | $407 | $409 | $404 | $410 | $412 | $413 | $415 | $416 | $418 | $419 | $421 | $422 | $424 | $425 | $427 | $428 | $430 | |
| Wolfforth Bus. | $310 | $301 | $305 | $308 | $298 | $299 | $291 | $348 | $358 | $341 | $350 | $352 | $353 | $355 | $356 | $358 | $359 | $361 | $362 | $364 | $365 | $367 | $368 | $370 | |
| Misc. Bus. Fiber - Other Mkts. | $0 | $0 | $0 | $0 | $673 | $716 | $598 | $820 | $811 | $1,133 | $1,133 | $1,133 | $1,133 | $1,133 | $1,133 | $1,133 | $1,133 | $1,133 | $1,133 | $1,133 | $1,133 | $1,133 | $1,133 | $1,133 | |
| Levelland Bus | $375 | $381 | $537 | $392 | $428 | $473 | $455 | $458 | $452 | $450 | $465 | $467 | $468 | $470 | $471 | $473 | $474 | $476 | $477 | $479 | $480 | $482 | $483 | $485 | |
| Smyer Bus. | $270 | $281 | $219 | $286 | $421 | $399 | $399 | $405 | $398 | $407 | $407 | $407 | $407 | $407 | $407 | $407 | $407 | $407 | $407 | $407 | $407 | $407 | $407 | $407 | |
| Littlefield Bus. (Incl. Hockley Co.) | $0 | $0 | $456 | $306 | $321 | $298 | $281 | $277 | $307 | $300 | $300 | $301 | $303 | $295 | $282 | $283 | $285 | $286 | $288 | $289 | $291 | $292 | $294 | $295 | |
| Burkburnnet Bus. | $0 | $0 | $744 | $358 | $281 | $293 | $260 | $212 | $203 | $201 | $245 | $256 | $261 | $260 | $268 | $275 | $283 | $290 | $298 | $305 | $313 | $317 | $317 | $317 | |
| Brownfield Bus. | $0 | $0 | $0 | $230 | $267 | $277 | $244 | $221 | $203 | $195 | $210 | $221 | $233 | $243 | $251 | $262 | $273 | $281 | $288 | $296 | $303 | $309 | $309 | $309 | |
| Slaton Bus. | $0 | $0 | $0 | $0 | $361 | $314 | $234 | $211 | $204 | $207 | $210 | $221 | $233 | $244 | $255 | $266 | $278 | $285 | $293 | $300 | $308 | $308 | $308 | $308 | |
| Wilson Bus. | $0 | $0 | $0 | $0 | $0 | $125 | $171 | $143 | $141 | $105 | $115 | $115 | $115 | $115 | $115 | $115 | $115 | $115 | $115 | $115 | $115 | $115 | $115 | $115 | |
| Lamesa Bus. (incl. Dawson Co) | $0 | $0 | $0 | $0 | $0 | $358 | $223 | $167 | $169 | $186 | $205 | $216 | $228 | $237 | $248 | $260 | $271 | $282 | $290 | $297 | $305 | $307 | $307 | $307 | |
| Plainview Bus. | $0 | $0 | $0 | $0 | $0 | $0 | $1,119 | $234 | $205 | $207 | $260 | $271 | $276 | $276 | $283 | $291 | $298 | $306 | $313 | $321 | $321 | $321 | $321 | $321 | |
| Wichita Falls Bus. | $0 | $0 | $0 | $0 | $0 | $0 | $0 | $277 | $214 | $215 | $213 | $217 | $221 | $232 | $243 | $254 | $266 | $273 | $281 | $288 | $292 | $292 | $292 | $292 | |
| Iowa Park Bus. | $0 | $0 | $0 | $0 | $0 | $0 | $0 | $0 | $283 | $192 | $160 | $171 | $183 | $195 | $203 | $214 | $225 | $236 | $248 | $259 | $266 | $274 | $281 | $289 | |
| Hammond Bus | $0 | $0 | $0 | $0 | $0 | $0 | $0 | $0 | $0 | $177 | $200 | $208 | $215 | $223 | $230 | $238 | $245 | $253 | $260 | $268 | $275 | $283 | $290 | $298 | |
| Ponchatoula Bus | $0 | $0 | $0 | $0 | $0 | $0 | $0 | $0 | $0 | $0 | $200 | $200 | $200 | $208 | $215 | $223 | $230 | $238 | $245 | $253 | $260 | $268 | $275 | $283 | |
| Abilene Bus | $0 | $0 | $0 | $0 | $0 | $0 | $0 | $0 | $0 | $0 | NM | $202 | $202 | $202 | $210 | $217 | $225 | $232 | $240 | $247 | $255 | $262 | $270 | $277 | |
| Hale Center Bus | $0 | $0 | $0 | $0 | $0 | $0 | $0 | $0 | $0 | $0 | $200 | $208 | $215 | $223 | $230 | $238 | $245 | $253 | $260 | $268 | $275 | $283 | $290 | $298 | |
| Abernathy Bus | $0 | $0 | $0 | $0 | $0 | $0 | $0 | $0 | $0 | $0 | $0 | $200 | $208 | $215 | $223 | $230 | $238 | $245 | $253 | $260 | $268 | $275 | $283 | $290 | |
| New Deal Bus | $0 | $0 | $0 | $0 | $0 | $0 | $0 | $0 | $0 | $0 | $0 | $200 | $208 | $215 | $223 | $230 | $238 | $245 | $253 | $260 | $268 | $275 | $283 | $290 | |
| Amarillo Bus | $0 | $0 | $0 | $0 | $0 | $0 | $0 | $0 | $0 | $0 | $0 | $200 | $202 | $201 | $209 | $216 | $224 | $231 | $239 | $246 | $254 | $261 | $269 | $276 | |
| Tickfaw Village Bus | $0 | $0 | $0 | $0 | $0 | $0 | $0 | $0 | $0 | $0 | $0 | $200 | $208 | $215 | $223 | $230 | $238 | $245 | $253 | $260 | $268 | $275 | $283 | $290 | |
| Independence Bus | $0 | $0 | $0 | $0 | $0 | $0 | $0 | $0 | $0 | $0 | $0 | $200 | $208 | $215 | $223 | $230 | $238 | $245 | $253 | $260 | $268 | $275 | $283 | $290 | |
| Amite Bus | $0 | $0 | $0 | $0 | $0 | $0 | $0 | $0 | $0 | $0 | $0 | $200 | $208 | $215 | $223 | $230 | $238 | $245 | $253 | $260 | $268 | $275 | $283 | $290 | |
| Pine Grove Bus | $0 | $0 | $0 | $0 | $0 | $0 | $0 | $0 | $0 | $0 | $0 | $200 | $208 | $215 | $223 | $230 | $238 | $245 | $253 | $260 | $268 | $275 | $283 | $290 | |
| Montpelier Bus | $0 | $0 | $0 | $0 | $0 | $0 | $0 | $0 | $0 | $0 | $0 | $200 | $208 | $215 | $223 | $230 | $238 | $245 | $253 | $260 | $268 | $275 | $283 | $290 | |
| Franklinton Bus | $0 | $0 | $0 | $0 | $0 | $0 | $0 | $0 | $0 | $0 | $0 | $200 | $208 | $215 | $223 | $230 | $238 | $245 | $253 | $260 | $268 | $275 | $283 | $290 | |
| Towers Bus | $0 | $0 | $0 | $0 | $0 | $0 | $0 | $0 | $0 | $0 | $0 | $105 | $208 | $215 | $223 | $230 | $238 | $245 | $253 | $260 | $268 | $275 | $283 | $290 | |
| Natalbany Bus | $0 | $0 | $0 | $0 | $0 | $0 | $0 | $0 | $0 | $0 | $0 | $200 | $208 | $215 | $223 | $230 | $238 | $245 | $253 | $260 | $268 | $275 | $283 | $290 | |
| Residential ARPU | |||||||||||||||||||||||||
| Lubbock Res. | $84 | $85 | $84 | $87 | $88 | $88 | $86 | $88 | $88 | $85 | $88 | $90 | $91 | $93 | $94 | $96 | $97 | $99 | $100 | $102 | $103 | $105 | $105 | $105 | |
| Wolfforth Res. | $86 | $86 | $87 | $89 | $91 | $91 | $90 | $92 | $95 | $92 | $94 | $96 | $97 | $99 | $100 | $102 | $103 | $105 | $106 | $106 | $106 | $106 | $106 | $106 | |
| Levelland Res | $96 | $96 | $101 | $102 | $103 | $102 | $102 | $102 | $103 | $105 | $105 | $106 | $106 | $107 | $108 | $109 | $109 | $109 | $109 | $109 | $109 | $109 | $109 | $109 | |
| Smyer Res. | $94 | $92 | $94 | $99 | $113 | $103 | $104 | $98 | $109 | $109 | $110 | $110 | $110 | $110 | $110 | $110 | $110 | $110 | $110 | $110 | $110 | $110 | $110 | $110 | |
| Littlefield Res. (Incl. Hockley Co.) | $0 | $0 | $129 | $113 | $112 | $110 | $110 | $113 | $112 | $110 | $110 | $110 | $110 | $110 | $110 | $110 | $110 | $110 | $110 | $110 | $110 | $110 | $110 | $110 | |
| Whitharral Res. | $0 | $0 | $0 | $167 | $128 | $115 | $126 | $101 | $128 | $93 | $104 | $105 | $106 | $106 | $107 | $108 | $109 | $109 | $109 | $109 | $109 | $109 | $109 | $109 | |
| Burkburnnet Res. | $0 | $0 | $116 | $107 | $106 | $109 | $104 | $107 | $110 | $106 | $108 | $110 | $110 | $110 | $110 | $110 | $110 | $110 | $110 | $110 | $110 | $110 | $110 | $110 | |
| Brownfield Res. | $0 | $0 | $0 | $132 | $110 | $107 | $106 | $106 | $104 | $100 | $102 | $104 | $105 | $107 | $108 | $108 | $108 | $108 | $108 | $108 | $108 | $108 | $108 | $108 | |
| Slaton Res. | $0 | $0 | $0 | $0 | $122 | $107 | $109 | $111 | $113 | $101 | $106 | $108 | $109 | $109 | $109 | $109 | $109 | $109 | $109 | $109 | $109 | $109 | $109 | $109 | |
| Wilson Res. | $0 | $0 | $0 | $0 | $0 | $120 | $105 | $122 | $123 | $112 | $112 | $112 | $112 | $112 | $112 | $112 | $112 | $112 | $112 | $112 | $112 | $112 | $112 | $112 | |
| Lamesa Res. | $0 | $0 | $0 | $0 | $0 | $155 | $118 | $110 | $106 | $104 | $102 | $104 | $105 | $107 | $108 | $108 | $108 | $108 | $108 | $108 | $108 | $108 | $108 | $108 | |
| Meadow Bus/Res. | $0 | $0 | $0 | $0 | $0 | $167 | $124 | $115 | $122 | $124 | $124 | $124 | $124 | $124 | $124 | $124 | $124 | $124 | $124 | $124 | $124 | $124 | $124 | $124 | |
| Ropesville Bus/Res. | $0 | $0 | $0 | $0 | $0 | $117 | $112 | $99 | $106 | $106 | $106 | $107 | $109 | $109 | $109 | $109 | $109 | $109 | $109 | $109 | $109 | $109 | $109 | $109 | |
| Plainview Res. | $0 | $0 | $0 | $0 | $0 | $0 | $129 | $117 | $104 | $101 | $102 | $104 | $105 | $107 | $108 | $108 | $108 | $108 | $108 | $108 | $108 | $108 | $108 | $108 | |
| Iowa Park Res. | $0 | $0 | $0 | $0 | $0 | $0 | $0 | $101 | $112 | $98 | $104 | $106 | $107 | $109 | $109 | $109 | $109 | $109 | $109 | $109 | $109 | $109 | $109 | $109 | |
| Hammond Res. | $0 | $0 | $0 | $0 | $0 | $0 | $0 | $0 | $0 | $0 | $105 | $106 | $107 | $109 | $109 | $109 | $109 | $109 | $109 | $109 | $109 | $109 | $109 | $109 | |
| Ponchatoula Res | $0 | $0 | $0 | $0 | $0 | $0 | $0 | $0 | $0 | $0 | $105 | $106 | $107 | $109 | $109 | $109 | $109 | $109 | $109 | $109 | $109 | $109 | $109 | $109 | |
| Abilene Res | $0 | $0 | $0 | $0 | $0 | $0 | $0 | $0 | $0 | $0 | $0 | $0 | $0 | $0 | $0 | $0 | $0 | $0 | $0 | $0 | $0 | $0 | $0 | $0 | |
| Hale Center Res | $0 | $0 | $0 | $0 | $0 | $0 | $0 | $0 | $0 | $0 | $105 | $106 | $107 | $109 | $109 | $109 | $109 | $109 | $109 | $109 | $109 | $109 | $109 | $109 | |
| Abernathy Res | $0 | $0 | $0 | $0 | $0 | $0 | $0 | $0 | $0 | $0 | $0 | $105 | $106 | $107 | $109 | $109 | $109 | $109 | $109 | $109 | $109 | $109 | $109 | $109 | |
| New Deal Res | $0 | $0 | $0 | $0 | $0 | $0 | $0 | $0 | $0 | $0 | $0 | $105 | $106 | $107 | $109 | $109 | $109 | $109 | $109 | $109 | $109 | $109 | $109 | $109 | |
| Amarillo Res | $0 | $0 | $0 | $0 | $0 | $0 | $0 | $0 | $0 | $0 | $0 | $0 | $0 | $0 | $0 | $0 | $0 | $0 | $0 | $0 | $0 | $0 | $0 | $0 | |
| Tickfaw Village Res | $0 | $0 | $0 | $0 | $0 | $0 | $0 | $0 | $0 | $0 | $0 | $105 | $106 | $107 | $109 | $109 | $109 | $109 | $109 | $109 | $109 | $109 | $109 | $109 | |
| Independence Res | $0 | $0 | $0 | $0 | $0 | $0 | $0 | $0 | $0 | $0 | $0 | $105 | $106 | $107 | $109 | $109 | $109 | $109 | $109 | $109 | $109 | $109 | $109 | $109 | |
| Amite Res | $0 | $0 | $0 | $0 | $0 | $0 | $0 | $0 | $0 | $0 | $0 | $105 | $106 | $107 | $109 | $109 | $109 | $109 | $109 | $109 | $109 | $109 | $109 | $109 | |
| Pine Grove Res | $0 | $0 | $0 | $0 | $0 | $0 | $0 | $0 | $0 | $0 | $0 | $105 | $106 | $107 | $109 | $109 | $109 | $109 | $109 | $109 | $109 | $109 | $109 | $109 | |
| Montpelier Res | $0 | $0 | $0 | $0 | $0 | $0 | $0 | $0 | $0 | $0 | $0 | $105 | $106 | $107 | $109 | $109 | $109 | $109 | $109 | $109 | $109 | $109 | $109 | $109 | |
| Franklinton Res | $0 | $0 | $0 | $0 | $0 | $0 | $0 | $0 | $0 | $0 | $0 | $105 | $106 | $107 | $109 | $109 | $109 | $109 | $109 | $109 | $109 | $109 | $109 | $109 | |
| Towers Res | $0 | $0 | $0 | $0 | $0 | $0 | $0 | $0 | $0 | $0 | $0 | $105 | $105 | $106 | $107 | $109 | $109 | $109 | $109 | $109 | $109 | $109 | $109 | $109 | |
| Natalbany Res | $0 | $0 | $0 | $0 | $0 | $0 | $0 | $0 | $0 | $0 | $0 | $105 | $106 | $107 | $109 | $109 | $109 | $109 | $109 | $109 | $109 | $109 | $109 | $109 | |
| Total ARPU | |||||||||||||||||||||||||
| Lubbock Totals | $203 | $208 | $209 | $219 | $231 | $239 | $239 | $247 | $250 | $249 | $257 | $258 | $260 | $258 | $258 | $257 | $257 | $257 | $256 | $256 | $256 | $256 | $255 | $254 | |
| Wolfforth Totals | $114 | $115 | $117 | $121 | $121 | $122 | $120 | $129 | $134 | $128 | $131 | $132 | $133 | $132 | $132 | $133 | $133 | $134 | $134 | $134 | $133 | $133 | $132 | $131 | |
| Misc. Bus. Fiber - Other Mkts. | $0 | $0 | $0 | $0 | $673 | $716 | $598 | $820 | $811 | $1,133 | $1,133 | $1,133 | $1,133 | $1,133 | $1,133 | $1,133 | $1,133 | $1,133 | $1,133 | $1,133 | $1,133 | $1,133 | $1,133 | $1,133 | |
| Levelland Totals | $116 | $116 | $135 | $126 | $131 | $134 | $133 | $135 | $135 | $137 | $140 | $141 | $142 | $142 | $142 | $143 | $143 | $143 | $143 | $143 | $143 | $143 | $143 | $143 | |
| Smyer Totals | $99 | $98 | $97 | $103 | $117 | $107 | $108 | $102 | $113 | $113 | $116 | $114 | $114 | $113 | $113 | $113 | $113 | $113 | $113 | $113 | $113 | $113 | $113 | $113 | |
| Littlefield Totals (Incl. Hockley Co.) | $0 | $0 | $152 | $136 | $137 | $133 | $133 | $134 | $136 | $133 | $134 | $135 | $135 | $134 | $136 | $140 | $140 | $140 | $140 | $140 | $140 | $141 | $141 | $141 | |
| Whitharral Res. | $0 | $0 | $0 | $167 | $128 | $115 | $126 | $101 | $128 | $93 | $104 | $105 | $106 | $106 | $107 | $108 | $109 | $109 | $109 | $109 | $109 | $109 | $109 | $109 | |
| Burkburnnet Totals | $0 | $0 | $160 | $130 | $120 | $123 | $116 | $115 | $117 | $113 | $116 | $119 | $120 | $122 | $124 | $124 | $125 | $125 | $126 | $126 | $126 | $127 | $126 | $126 | |
| Brownfield Totals | $0 | $0 | $0 | $140 | $124 | $124 | $124 | $124 | $104 | $100 | $118 | $121 | $124 | $127 | $130 | $133 | $135 | $136 | $137 | $138 | $139 | $140 | $140 | $140 | |
| Slaton Totals | $0 | $0 | $0 | $0 | $172 | $143 | $130 | $127 | $126 | $116 | $117 | $122 | $125 | $127 | $129 | $131 | $133 | $134 | $136 | $137 | $138 | $138 | $139 | $139 | |
| Wilson Totals | $0 | $0 | $0 | $0 | $0 | $121 | $111 | $124 | $125 | $112 | $108 | $111 | $111 | $111 | $111 | $111 | $111 | $111 | $111 | $111 | $111 | $111 | $111 | $111 | |
| Meadow Bus/Res. | $0 | $0 | $0 | $0 | $0 | $167 | $124 | $115 | $122 | $124 | $124 | $124 | $124 | $124 | $124 | $124 | $124 | $124 | $124 | $124 | $124 | $124 | $124 | $124 | |
| Lamesa Totals | $0 | $0 | $0 | $0 | $0 | $163 | $141 | $126 | $121 | $123 | $122 | $125 | $128 | $131 | $136 | $137 | $138 | $139 | $140 | $141 | $144 | $144 | $144 | $144 | |
| Ropesville Bus/Res. | $0 | $0 | $0 | $0 | $0 | $117 | $112 | $99 | $106 | $106 | $106 | $107 | $109 | $109 | $109 | $109 | $109 | $109 | $109 | $109 | $109 | $109 | $109 | $109 | |
| Plainview Totals | $0 | $0 | $0 | $0 | $0 | $0 | $929 | $195 | $153 | $140 | $149 | $149 | $149 | $154 | $160 | $162 | $163 | $164 | $165 | $165 | $163 | $161 | $159 | $157 | |
| Wichita Falls Bus. | $0 | $0 | $0 | $0 | $0 | $0 | $0 | $277 | $214 | $215 | $213 | $217 | $221 | $232 | $243 | $254 | $266 | $273 | $281 | $288 | $292 | $292 | $292 | $292 | |
| Iowa Park Totals | $0 | $0 | $0 | $0 | $0 | $0 | $0 | $101 | $120 | $104 | $96 | $102 | $105 | $110 | $113 | $118 | $119 | $120 | $121 | $122 | $123 | $123 | $124 | $124 | |
| Hammond Total | $0 | $0 | $0 | $0 | $0 | $0 | $0 | $0 | $0 | $0 | $120 | $176 | $141 | $131 | $135 | $139 | $143 | $149 | $155 | $158 | $161 | $166 | $170 | $177 | |
| Ponchatoula Total | $0 | $0 | $0 | $0 | $0 | $0 | $0 | $0 | $0 | $0 | $1,914 | $1,914 | $1,914 | $1,914 | $1,914 | $1,914 | $1,914 | $1,914 | $1,914 | $1,914 | $1,914 | $1,914 | $1,914 | $1,914 | |
| Abilene Total | $0 | $0 | $0 | $0 | $0 | $0 | $0 | $0 | $0 | $0 | NM | $202 | $202 | $202 | $210 | $217 | $225 | $232 | $240 | $247 | $255 | $262 | $270 | $277 | |
| Hale Center Total | $0 | $0 | $0 | $0 | $0 | $0 | $0 | $0 | $0 | $0 | $54 | $91 | $96 | $105 | $110 | $116 | $121 | $121 | $122 | $125 | $125 | $129 | $127 | $130 | |
| Abernathy Total | $0 | $0 | $0 | $0 | $0 | $0 | $0 | $0 | $0 | $0 | $0 | $68 | $80 | $88 | $102 | $111 | $116 | $120 | $125 | $126 | $126 | $128 | $129 | $134 | |
| New Deal Total | $0 | $0 | $0 | $0 | $0 | $0 | $0 | $0 | $0 | $0 | $0 | $68 | $79 | $88 | $102 | $110 | $115 | $120 | $124 | $124 | $125 | $127 | $128 | $132 | |
| Amarillo Total | $0 | $0 | $0 | $0 | $0 | $0 | $0 | $0 | $0 | $0 | $0 | $200 | $202 | $201 | $209 | $216 | $224 | $231 | $239 | $246 | $254 | $261 | $269 | $276 | |
| Tickfaw Village Totals | $0 | $0 | $0 | $0 | $0 | $0 | $0 | $0 | $0 | $0 | $0 | $0 | $60 | $71 | $83 | $96 | $103 | $107 | $111 | $114 | $112 | $112 | $113 | $113 | |
| Independence Total | $0 | $0 | $0 | $0 | $0 | $0 | $0 | $0 | $0 | $0 | $0 | $0 | $61 | $71 | $83 | $96 | $103 | $107 | $111 | $114 | $113 | $113 | $114 | $114 | |
| Amite Total | $0 | $0 | $0 | $0 | $0 | $0 | $0 | $0 | $0 | $0 | $0 | $0 | $77 | $91 | $96 | $109 | $116 | $120 | $124 | $130 | $130 | $131 | $133 | $134 | |
| Pine Grove Total | $0 | $0 | $0 | $0 | $0 | $0 | $0 | $0 | $0 | $0 | $0 | $0 | $59 | $70 | $82 | $95 | $102 | $106 | $110 | $113 | $112 | $111 | $113 | $112 | |
| Montpelier Total | $0 | $0 | $0 | $0 | $0 | $0 | $0 | $0 | $0 | $0 | $0 | $0 | $59 | $70 | $82 | $96 | $102 | $106 | $110 | $113 | $112 | $112 | $113 | $113 | |
| Franklington Total | $0 | $0 | $0 | $0 | $0 | $0 | $0 | $0 | $0 | $0 | $0 | $0 | $89 | $117 | $116 | $129 | $136 | $141 | $146 | $155 | $156 | $159 | $163 | $166 | |
| Towers Totals | $0 | $0 | $0 | $0 | $0 | $0 | $0 | $0 | $0 | $0 | $0 | $0 | $82 | $100 | $102 | $116 | $122 | $127 | $132 | $139 | $139 | $140 | $143 | $145 | |
| Natalbany Totals | $0 | $0 | $0 | $0 | $0 | $0 | $0 | $0 | $0 | $0 | $0 | $0 | $74 | $86 | $93 | $106 | $112 | $116 | $121 | $126 | $125 | $126 | $128 | $129 | |
| Business Passings | |||||||||||||||||||||||||
| Lubbock Bus. | 2,997 | 2,997 | 2,997 | 2,997 | 2,997 | 2,997 | 2,997 | 2,997 | 2,997 | 3,000 | 3,000 | 3,000 | 3,000 | 3,000 | 3,000 | 3,000 | 3,000 | 3,000 | 3,000 | 3,000 | 3,000 | 3,000 | 3,000 | 3,000 | |
| Wolfforth Bus. | 150 | 150 | 150 | 150 | 150 | 150 | 150 | 150 | 150 | 150 | 150 | 150 | 150 | 150 | 150 | 150 | 150 | 150 | 150 | 150 | 150 | 150 | 150 | 150 | |
| Misc. Bus. Fiber - Other Mkts. | |||||||||||||||||||||||||
| Levelland Bus | 310 | 310 | 310 | 310 | 310 | 310 | 310 | 310 | 310 | 310 | 310 | 310 | 310 | 310 | 310 | 310 | 310 | 310 | 310 | 310 | 310 | 310 | 310 | 310 | |
| Smyer Bus. | 6 | 6 | 6 | 6 | 6 | 6 | 6 | 6 | 6 | 6 | 6 | 6 | 6 | 6 | 6 | 6 | 6 | 6 | 6 | 6 | 6 | 6 | 6 | 6 | |
| Littlefield Bus. (Incl. Hockley Co.) | 0 | 0 | 173 | 173 | 173 | 173 | 173 | 173 | 173 | 173 | 173 | 173 | 173 | 173 | 173 | 173 | 173 | 173 | 173 | 173 | 173 | 173 | 173 | 173 | |
| Burkburnnet Bus. | 0 | 0 | 263 | 263 | 263 | 263 | 263 | 263 | 263 | 263 | 263 | 263 | 263 | 263 | 263 | 263 | 263 | 263 | 263 | 263 | 263 | 263 | 263 | 263 | |
| Brownfield Bus. | 0 | 0 | 0 | 178 | 178 | 178 | 178 | 178 | 178 | 178 | 178 | 178 | 178 | 178 | 178 | 178 | 178 | 178 | 178 | 178 | 178 | 178 | 178 | 178 | |
| Slaton Bus. | 0 | 0 | 0 | 0 | 140 | 140 | 140 | 140 | 140 | 140 | 140 | 140 | 140 | 140 | 140 | 140 | 140 | 140 | 140 | 140 | 140 | 140 | 140 | 140 | |
| Wilson Bus. | 0 | 0 | 0 | 0 | 0 | 24 | 24 | 24 | 24 | 24 | 24 | 24 | 24 | 24 | 24 | 24 | 24 | 24 | 24 | 24 | 24 | 24 | 24 | 24 | |
| Lamesa Bus. (incl. Dawson Co) | 0 | 0 | 0 | 0 | 0 | 223 | 223 | 223 | 223 | 223 | 223 | 223 | 223 | 223 | 223 | 223 | 223 | 223 | 223 | 223 | 223 | 223 | 223 | 223 | |
| Plainview Bus. | 0 | 0 | 0 | 0 | 0 | 0 | 547 | 547 | 547 | 547 | 547 | 547 | 547 | 547 | 547 | 547 | 547 | 547 | 547 | 547 | 547 | 547 | 547 | 547 | |
| Wichita Falls Bus. | 0 | 0 | 0 | 0 | 0 | 0 | 0 | 300 | 1,050 | 1,052 | 1,052 | 1,052 | 1,052 | 1,052 | 1,052 | 1,052 | 1,052 | 1,052 | 1,052 | 1,052 | 1,052 | 1,052 | 1,052 | 1,052 | |
| Iowa Park Bus. | 0 | 0 | 0 | 0 | 0 | 0 | 0 | 180 | 180 | 180 | 180 | 180 | 180 | 180 | 180 | 180 | 180 | 180 | 180 | 180 | 180 | 180 | 180 | 180 | |
| Hammond Bus | 0 | 0 | 0 | 0 | 0 | 0 | 0 | 0 | 0 | 2,074 | 2,074 | 2,074 | 2,074 | 2,074 | 2,074 | 2,074 | 2,074 | 2,074 | 2,074 | 2,074 | 2,074 | 2,074 | 2,074 | 2,074 | |
| Ponchatoula Bus | 0 | 0 | 0 | 0 | 0 | 0 | 0 | 0 | 0 | 0 | 562 | 562 | 562 | 562 | 562 | 562 | 562 | 562 | 562 | 562 | 562 | 562 | 562 | 562 | |
| Abilene Bus | 0 | 0 | 0 | 0 | 0 | 0 | 0 | 0 | 0 | 0 | 1,000 | 1,000 | 1,000 | 1,000 | 1,000 | 1,000 | 1,000 | 1,000 | 1,000 | 1,000 | 1,000 | 1,000 | 1,000 | 1,000 | |
| Hale Center Bus | 0 | 0 | 0 | 0 | 0 | 0 | 0 | 0 | 0 | 0 | 61 | 61 | 61 | 61 | 61 | 61 | 61 | 61 | 61 | 61 | 61 | 61 | 61 | 61 | |
| Abernathy Bus | 0 | 0 | 0 | 0 | 0 | 0 | 0 | 0 | 0 | 0 | 0 | 86 | 86 | 86 | 86 | 86 | 86 | 86 | 86 | 86 | 86 | 86 | 86 | 86 | |
| New Deal Bus | 0 | 0 | 0 | 0 | 0 | 0 | 0 | 0 | 0 | 0 | 0 | 19 | 19 | 19 | 19 | 19 | 19 | 19 | 19 | 19 | 19 | 19 | 19 | 19 | |
| Amarillo Bus | 0 | 0 | 0 | 0 | 0 | 0 | 0 | 0 | 0 | 0 | 0 | 2,000 | 2,000 | 2,000 | 2,000 | 2,000 | 2,000 | 2,000 | 2,000 | 2,000 | 2,000 | 2,000 | 2,000 | 2,000 | |
| Tickfaw Village Bus | 0 | 0 | 0 | 0 | 0 | 0 | 0 | 0 | 0 | 0 | 0 | 9 | 9 | 9 | 9 | 9 | 9 | 9 | 9 | 9 | 9 | 9 | 9 | 9 | |
| Independence Bus | 0 | 0 | 0 | 0 | 0 | 0 | 0 | 0 | 0 | 0 | 0 | 11 | 11 | 11 | 11 | 11 | 11 | 11 | 11 | 11 | 11 | 11 | 11 | 11 | |
| Amite Bus | 0 | 0 | 0 | 0 | 0 | 0 | 0 | 0 | 0 | 0 | 0 | 88 | 88 | 88 | 88 | 88 | 88 | 88 | 88 | 88 | 88 | 88 | 88 | 88 | |
| Pine Grove Bus | 0 | 0 | 0 | 0 | 0 | 0 | 0 | 0 | 0 | 0 | 0 | 7 | 7 | 7 | 7 | 7 | 7 | 7 | 7 | 7 | 7 | 7 | 7 | 7 | |
| Montpelier Bus | 0 | 0 | 0 | 0 | 0 | 0 | 0 | 0 | 0 | 0 | 0 | 12 | 12 | 12 | 12 | 12 | 12 | 12 | 12 | 12 | 12 | 12 | 12 | 12 | |
| Franklinton Bus | 0 | 0 | 0 | 0 | 0 | 0 | 0 | 0 | 0 | 0 | 0 | 57 | 57 | 57 | 57 | 57 | 57 | 57 | 57 | 57 | 57 | 57 | 57 | 57 | |
| Towers Bus | 0 | 0 | 0 | 0 | 0 | 0 | 0 | 0 | 0 | 0 | 0 | 133 | 133 | 133 | 133 | 133 | 133 | 133 | 133 | 133 | 133 | 133 | 133 | 133 | |
| Natalbany Bus | 0 | 0 | 0 | 0 | 0 | 0 | 0 | 0 | 0 | 0 | 0 | 25 | 25 | 25 | 25 | 25 | 25 | 25 | 25 | 25 | 25 | 25 | 25 | 25 | |
| 3,463 | 3,463 | 3,899 | 4,077 | 4,217 | 4,464 | 5,011 | 5,491 | 6,241 | 8,320 | 9,943 | 12,390 | 12,390 | 12,390 | 12,390 | 12,390 | 12,390 | 12,390 | 12,390 | 12,390 | 12,390 | 12,390 | 12,390 | 12,390 | ||
| Residential Passings | |||||||||||||||||||||||||
| Lubbock Res. | 11,989 | 11,989 | 11,989 | 11,989 | 11,989 | 11,989 | 11,989 | 11,989 | 11,989 | 11,989 | 11,989 | 11,989 | 11,989 | 11,989 | 11,989 | 11,989 | 11,989 | 11,989 | 11,989 | 11,989 | 11,989 | 11,989 | 11,989 | 11,989 | |
| Wolfforth Res. | 5,000 | 5,000 | 5,000 | 5,000 | 5,000 | 5,000 | 5,000 | 5,000 | 5,000 | 5,000 | 5,000 | 5,000 | 5,000 | 5,000 | 5,000 | 5,000 | 5,000 | 5,000 | 5,000 | 5,000 | 5,000 | 5,000 | 5,000 | 5,000 | |
| Levelland Res | 5,185 | 5,185 | 5,185 | 5,185 | 5,185 | 5,185 | 5,185 | 5,185 | 5,185 | 5,185 | 5,185 | 5,185 | 5,185 | 5,185 | 5,185 | 5,185 | 5,185 | 5,185 | 5,185 | 5,185 | 5,185 | 5,185 | 5,185 | 5,185 | |
| Smyer Res. | 216 | 216 | 216 | 216 | 216 | 216 | 216 | 216 | 216 | 216 | 216 | 216 | 216 | 216 | 216 | 216 | 216 | 216 | 216 | 216 | 216 | 216 | 216 | 216 | |
| Littlefield Res. (Incl. Hockley Co.) | 0 | 0 | 1,247 | 1,247 | 1,247 | 1,247 | 1,247 | 1,247 | 1,247 | 1,247 | 1,247 | 1,247 | 1,247 | 1,247 | 1,247 | 1,247 | 1,247 | 1,247 | 1,247 | 1,247 | 1,247 | 1,247 | 1,247 | 1,247 | |
| Whitharral Res. | 0 | 0 | 0 | 84 | 84 | 84 | 84 | 84 | 84 | 84 | 84 | 84 | 84 | 84 | 84 | 84 | 84 | 84 | 84 | 84 | 84 | 84 | 84 | 84 | |
| Burkburnnet Res. | 0 | 0 | 4,449 | 4,449 | 4,449 | 4,449 | 4,449 | 4,449 | 4,449 | 4,449 | 4,449 | 4,449 | 4,449 | 4,449 | 4,449 | 4,449 | 4,449 | 4,449 | 4,449 | 4,449 | 4,449 | 4,449 | 4,449 | 4,449 | |
| Brownfield Res. | 0 | 0 | 0 | 1,501 | 1,501 | 1,501 | 1,501 | 1,501 | 1,501 | 1,501 | 1,501 | 1,501 | 1,501 | 1,501 | 1,501 | 1,501 | 1,501 | 1,501 | 1,501 | 1,501 | 1,501 | 1,501 | 1,501 | 1,501 | |
| Slaton Res. | 0 | 0 | 0 | 0 | 1,283 | 1,283 | 1,283 | 1,283 | 1,283 | 1,283 | 1,283 | 1,283 | 1,283 | 1,283 | 1,283 | 1,283 | 1,283 | 1,283 | 1,283 | 1,283 | 1,283 | 1,283 | 1,283 | 1,283 | |
| Wilson Res. | 0 | 0 | 0 | 0 | 0 | 182 | 182 | 182 | 182 | 182 | 182 | 182 | 182 | 182 | 182 | 182 | 182 | 182 | 182 | 182 | 182 | 182 | 182 | 182 | |
| Lamesa Res. | 0 | 0 | 0 | 0 | 0 | 1,708 | 1,708 | 1,708 | 1,708 | 1,708 | 1,708 | 1,708 | 1,708 | 1,708 | 1,708 | 1,708 | 1,708 | 1,708 | 1,708 | 1,708 | 1,708 | 1,708 | 1,708 | 1,708 | |
| Meadow Bus/Res. | 0 | 0 | 0 | 0 | 0 | 219 | 219 | 219 | 219 | 219 | 219 | 219 | 219 | 219 | 219 | 219 | 219 | 219 | 219 | 219 | 219 | 219 | 219 | 219 | |
| Ropesville Bus/Res. | 0 | 0 | 0 | 0 | 0 | 185 | 185 | 185 | 185 | 185 | 185 | 185 | 185 | 185 | 185 | 185 | 185 | 185 | 185 | 185 | 185 | 185 | 185 | 185 | |
| Plainview Res. | 0 | 0 | 0 | 0 | 0 | 0 | 3,080 | 3,080 | 3,080 | 3,080 | 3,080 | 3,080 | 3,080 | 3,080 | 3,080 | 3,080 | 3,080 | 3,080 | 3,080 | 3,080 | 3,080 | 3,080 | 3,080 | 3,080 | |
| Iowa Park Res. | 0 | 0 | 0 | 0 | 0 | 0 | 0 | 2,607 | 2,607 | 2,607 | 2,607 | 2,607 | 2,607 | 2,607 | 2,607 | 2,607 | 2,607 | 2,607 | 2,607 | 2,607 | 2,607 | 2,607 | 2,607 | 2,607 | |
| Hammond Res. | 0 | 0 | 0 | 0 | 0 | 0 | 0 | 0 | 0 | 0 | 3,302 | 3,302 | 3,302 | 3,302 | 3,302 | 3,302 | 3,302 | 3,302 | 3,302 | 3,302 | 3,302 | 3,302 | 3,302 | 3,302 | |
| Ponchatoula Res | 0 | 0 | 0 | 0 | 0 | 0 | 0 | 0 | 0 | 0 | 1,352 | 1,352 | 1,352 | 1,352 | 1,352 | 1,352 | 1,352 | 1,352 | 1,352 | 1,352 | 1,352 | 1,352 | 1,352 | 1,352 | |
| Abilene Res | 0 | 0 | 0 | 0 | 0 | 0 | 0 | 0 | 0 | 0 | 0 | 0 | 0 | 0 | 0 | 0 | 0 | 0 | 0 | 0 | 0 | 0 | 0 | 0 | |
| Hale Center Res | 0 | 0 | 0 | 0 | 0 | 0 | 0 | 0 | 0 | 0 | 798 | 798 | 798 | 798 | 798 | 798 | 798 | 798 | 798 | 798 | 798 | 798 | 798 | 798 | |
| Abernathy Res | 0 | 0 | 0 | 0 | 0 | 0 | 0 | 0 | 0 | 0 | 0 | 995 | 995 | 995 | 995 | 995 | 995 | 995 | 995 | 995 | 995 | 995 | 995 | 995 | |
| New Deal Res | 0 | 0 | 0 | 0 | 0 | 0 | 0 | 0 | 0 | 0 | 0 | 239 | 239 | 239 | 239 | 239 | 239 | 239 | 239 | 239 | 239 | 239 | 239 | 239 | |
| Amarillo Res | 0 | 0 | 0 | 0 | 0 | 0 | 0 | 0 | 0 | 0 | 0 | 0 | 0 | 0 | 0 | 0 | 0 | 0 | 0 | 0 | 0 | 0 | 0 | 0 | |
| Tickfaw Village Res | 0 | 0 | 0 | 0 | 0 | 0 | 0 | 0 | 0 | 0 | 0 | 505 | 505 | 505 | 505 | 505 | 505 | 505 | 505 | 505 | 505 | 505 | 505 | 505 | |
| Independence Res | 0 | 0 | 0 | 0 | 0 | 0 | 0 | 0 | 0 | 0 | 0 | 546 | 546 | 546 | 546 | 546 | 546 | 546 | 546 | 546 | 546 | 546 | 546 | 546 | |
| Amite Res | 0 | 0 | 0 | 0 | 0 | 0 | 0 | 0 | 0 | 0 | 0 | 856 | 856 | 856 | 856 | 856 | 856 | 856 | 856 | 856 | 856 | 856 | 856 | 856 | |
| Pine Grove Res | 0 | 0 | 0 | 0 | 0 | 0 | 0 | 0 | 0 | 0 | 0 | 476 | 476 | 476 | 476 | 476 | 476 | 476 | 476 | 476 | 476 | 476 | 476 | 476 | |
| Montpelier Res | 0 | 0 | 0 | 0 | 0 | 0 | 0 | 0 | 0 | 0 | 0 | 765 | 765 | 765 | 765 | 765 | 765 | 765 | 765 | 765 | 765 | 765 | 765 | 765 | |
| Franklinton Res | 0 | 0 | 0 | 0 | 0 | 0 | 0 | 0 | 0 | 0 | 0 | 200 | 200 | 200 | 200 | 200 | 200 | 200 | 200 | 200 | 200 | 200 | 200 | 200 | |
| Towers Res | 0 | 0 | 0 | 0 | 0 | 0 | 0 | 0 | 0 | 0 | 0 | 850 | 850 | 850 | 850 | 850 | 850 | 850 | 850 | 850 | 850 | 850 | 850 | 850 | |
| Natalbany Res | 0 | 0 | 0 | 0 | 0 | 0 | 0 | 0 | 0 | 0 | 0 | 315 | 315 | 315 | 315 | 315 | 315 | 315 | 315 | 315 | 315 | 315 | 315 | 315 | |
| 22,390 | 22,390 | 28,086 | 29,671 | 30,954 | 33,248 | 36,328 | 38,935 | 38,935 | 38,935 | 44,387 | 50,134 | 50,134 | 50,134 | 50,134 | 50,134 | 50,134 | 50,134 | 50,134 | 50,134 | 50,134 | 50,134 | 50,134 | 50,134 | ||
| Total Passings | |||||||||||||||||||||||||
| Lubbock Totals | 14,986 | 14,986 | 14,986 | 14,986 | 14,986 | 14,986 | 14,986 | 14,986 | 14,986 | 14,989 | 14,989 | 14,989 | 14,989 | 14,989 | 14,989 | 14,989 | 14,989 | 14,989 | 14,989 | 14,989 | 14,989 | 14,989 | 14,989 | 14,989 | |
| Wolfforth Totals | 5,150 | 5,150 | 5,150 | 5,150 | 5,150 | 5,150 | 5,150 | 5,150 | 5,150 | 5,150 | 5,150 | 5,150 | 5,150 | 5,150 | 5,150 | 5,150 | 5,150 | 5,150 | 5,150 | 5,150 | 5,150 | 5,150 | 5,150 | 5,150 | |
| Misc. Bus. Fiber - Other Mkts. | |||||||||||||||||||||||||
| Levelland Totals | 5,495 | 5,495 | 5,495 | 5,495 | 5,495 | 5,495 | 5,495 | 5,495 | 5,495 | 5,495 | 5,495 | 5,495 | 5,495 | 5,495 | 5,495 | 5,495 | 5,495 | 5,495 | 5,495 | 5,495 | 5,495 | 5,495 | 5,495 | 5,495 | |
| Smyer Totals | 222 | 222 | 222 | 222 | 222 | 222 | 222 | 222 | 222 | 222 | 222 | 222 | 222 | 222 | 222 | 222 | 222 | 222 | 222 | 222 | 222 | 222 | 222 | 222 | |
| Littlefield Totals (Incl. Hockley Co.) | 0 | 0 | 1,420 | 1,420 | 1,420 | 1,420 | 1,420 | 1,420 | 1,420 | 1,420 | 1,420 | 1,420 | 1,420 | 1,420 | 1,420 | 1,420 | 1,420 | 1,420 | 1,420 | 1,420 | 1,420 | 1,420 | 1,420 | 1,420 | |
| Whitharral Res. | 0 | 0 | 0 | 84 | 84 | 84 | 84 | 84 | 84 | 84 | 84 | 84 | 84 | 84 | 84 | 84 | 84 | 84 | 84 | 84 | 84 | 84 | 84 | 84 | |
| Burkburnnet Totals | 0 | 0 | 4,712 | 4,712 | 4,712 | 4,712 | 4,712 | 4,712 | 4,712 | 4,712 | 4,712 | 4,712 | 4,712 | 4,712 | 4,712 | 4,712 | 4,712 | 4,712 | 4,712 | 4,712 | 4,712 | 4,712 | 4,712 | 4,712 | |
| Brownfield Totals | 0 | 0 | 0 | 1,679 | 1,679 | 1,679 | 1,679 | 1,679 | 1,679 | 1,679 | 1,679 | 1,679 | 1,679 | 1,679 | 1,679 | 1,679 | 1,679 | 1,679 | 1,679 | 1,679 | 1,679 | 1,679 | 1,679 | 1,679 | |
| Slaton Totals | 0 | 0 | 0 | 0 | 1,423 | 1,423 | 1,423 | 1,423 | 1,423 | 1,423 | 1,423 | 1,423 | 1,423 | 1,423 | 1,423 | 1,423 | 1,423 | 1,423 | 1,423 | 1,423 | 1,423 | 1,423 | 1,423 | 1,423 | |
| Wilson Totals | 0 | 0 | 0 | 0 | 0 | 206 | 206 | 206 | 206 | 206 | 206 | 206 | 206 | 206 | 206 | 206 | 206 | 206 | 206 | 206 | 206 | 206 | 206 | 206 | |
| Meadow Bus/Res. | 0 | 0 | 0 | 0 | 0 | 219 | 219 | 219 | 219 | 219 | 219 | 219 | 219 | 219 | 219 | 219 | 219 | 219 | 219 | 219 | 219 | 219 | 219 | 219 | |
| Lamesa Totals | 0 | 0 | 0 | 0 | 0 | 1,931 | 1,931 | 1,931 | 1,931 | 1,931 | 1,931 | 1,931 | 1,931 | 1,931 | 1,931 | 1,931 | 1,931 | 1,931 | 1,931 | 1,931 | 1,931 | 1,931 | 1,931 | 1,931 | |
| Ropesville Bus/Res. | 0 | 0 | 0 | 0 | 0 | 185 | 185 | 185 | 185 | 185 | 185 | 185 | 185 | 185 | 185 | 185 | 185 | 185 | 185 | 185 | 185 | 185 | 185 | 185 | |
| Plainview Totals | 0 | 0 | 0 | 0 | 0 | 0 | 3,627 | 3,627 | 3,627 | 3,627 | 3,627 | 3,627 | 3,627 | 3,627 | 3,627 | 3,627 | 3,627 | 3,627 | 3,627 | 3,627 | 3,627 | 3,627 | 3,627 | 3,627 | |
| Wichita Falls Bus. | 0 | 0 | 0 | 0 | 0 | 0 | 0 | 300 | 1,050 | 1,052 | 1,052 | 1,052 | 1,052 | 1,052 | 1,052 | 1,052 | 1,052 | 1,052 | 1,052 | 1,052 | 1,052 | 1,052 | 1,052 | 1,052 | |
| Iowa Park Totals | 0 | 0 | 0 | 0 | 0 | 0 | 0 | 2,787 | 2,787 | 2,787 | 2,787 | 2,787 | 2,787 | 2,787 | 2,787 | 2,787 | 2,787 | 2,787 | 2,787 | 2,787 | 2,787 | 2,787 | 2,787 | 2,787 | |
| Hammond Total | 0 | 0 | 0 | 0 | 0 | 0 | 0 | 0 | 0 | 0 | 5,376 | 5,376 | 5,376 | 5,376 | 5,376 | 5,376 | 5,376 | 5,376 | 5,376 | 5,376 | 5,376 | 5,376 | 5,376 | 5,376 | |
| Ponchatoula Total | 0 | 0 | 0 | 0 | 0 | 0 | 0 | 0 | 0 | 0 | 1,914 | 1,914 | 1,914 | 1,914 | 1,914 | 1,914 | 1,914 | 1,914 | 1,914 | 1,914 | 1,914 | 1,914 | 1,914 | 1,914 | |
| Abilene Total | 0 | 0 | 0 | 0 | 0 | 0 | 0 | 0 | 0 | 0 | 1,000 | 1,000 | 1,000 | 1,000 | 1,000 | 1,000 | 1,000 | 1,000 | 1,000 | 1,000 | 1,000 | 1,000 | 1,000 | 1,000 | |
| Hale Center Total | 0 | 0 | 0 | 0 | 0 | 0 | 0 | 0 | 0 | 0 | 859 | 859 | 859 | 859 | 859 | 859 | 859 | 859 | 859 | 859 | 859 | 859 | 859 | 859 | |
| Abernathy Total | 0 | 0 | 0 | 0 | 0 | 0 | 0 | 0 | 0 | 0 | 0 | 1,081 | 1,081 | 1,081 | 1,081 | 1,081 | 1,081 | 1,081 | 1,081 | 1,081 | 1,081 | 1,081 | 1,081 | 1,081 | |
| New Deal Total | 0 | 0 | 0 | 0 | 0 | 0 | 0 | 0 | 0 | 0 | 0 | 258 | 258 | 258 | 258 | 258 | 258 | 258 | 258 | 258 | 258 | 258 | 258 | 258 | |
| Amarillo Total | 0 | 0 | 0 | 0 | 0 | 0 | 0 | 0 | 0 | 0 | 0 | 2,000 | 2,000 | 2,000 | 2,000 | 2,000 | 2,000 | 2,000 | 2,000 | 2,000 | 2,000 | 2,000 | 2,000 | 2,000 | |
| Tickfaw Village Totals | 0 | 0 | 0 | 0 | 0 | 0 | 0 | 0 | 0 | 0 | 0 | 514 | 514 | 514 | 514 | 514 | 514 | 514 | 514 | 514 | 514 | 514 | 514 | 514 | |
| Independence Total | 0 | 0 | 0 | 0 | 0 | 0 | 0 | 0 | 0 | 0 | 0 | 557 | 557 | 557 | 557 | 557 | 557 | 557 | 557 | 557 | 557 | 557 | 557 | 557 | |
| Amite Total | 0 | 0 | 0 | 0 | 0 | 0 | 0 | 0 | 0 | 0 | 0 | 944 | 944 | 944 | 944 | 944 | 944 | 944 | 944 | 944 | 944 | 944 | 944 | 944 | |
| Pine Grove Total | 0 | 0 | 0 | 0 | 0 | 0 | 0 | 0 | 0 | 0 | 0 | 483 | 483 | 483 | 483 | 483 | 483 | 483 | 483 | 483 | 483 | 483 | 483 | 483 | |
| Montpelier Total | 0 | 0 | 0 | 0 | 0 | 0 | 0 | 0 | 0 | 0 | 0 | 777 | 777 | 777 | 777 | 777 | 777 | 777 | 777 | 777 | 777 | 777 | 777 | 777 | |
| Franklington Total | 0 | 0 | 0 | 0 | 0 | 0 | 0 | 0 | 0 | 0 | 0 | 257 | 257 | 257 | 257 | 257 | 257 | 257 | 257 | 257 | 257 | 257 | 257 | 257 | |
| Towers Totals | 0 | 0 | 0 | 0 | 0 | 0 | 0 | 0 | 0 | 0 | 0 | 983 | 983 | 983 | 983 | 983 | 983 | 983 | 983 | 983 | 983 | 983 | 983 | 983 | |
| Natalbany Totals | 0 | 0 | 0 | 0 | 0 | 0 | 0 | 0 | 0 | 0 | 0 | 340 | 340 | 340 | 340 | 340 | 340 | 340 | 340 | 340 | 340 | 340 | 340 | 340 | |
| 25,853 | 25,853 | 31,985 | 33,748 | 35,171 | 37,712 | 41,339 | 44,426 | 45,176 | 45,181 | 54,330 | 62,524 | 62,524 | 62,524 | 62,524 | 62,524 | 62,524 | 62,524 | 62,524 | 62,524 | 62,524 | 62,524 | 62,524 | 62,524 | ||
| Business Take Rate | |||||||||||||||||||||||||
| Lubbock Bus. | 50% | 50% | 50% | 50% | 51% | 52% | 52% | 52% | 53% | 54% | 54% | 54% | 54% | 54% | 55% | 55% | 55% | 55% | 56% | 56% | 56% | 56% | 56% | 57% | |
| Wolfforth Bus. | 49% | 51% | 53% | 54% | 55% | 56% | 55% | 53% | 53% | 51% | 50% | 50% | 50% | 50% | 50% | 50% | 50% | 50% | 50% | 50% | 50% | 50% | 50% | 50% | |
| Misc. Bus. Fiber - Other Mkts. | |||||||||||||||||||||||||
| Levelland Bus | 47% | 49% | 56% | 57% | 59% | 61% | 64% | 65% | 66% | 68% | 69% | 69% | 69% | 69% | 69% | 70% | 70% | 70% | 70% | 70% | 71% | 71% | 71% | 71% | |
| Smyer Bus. | 33% | 33% | 33% | 17% | 17% | 17% | 17% | 17% | 17% | 17% | 17% | 17% | 17% | 17% | 18% | 18% | 18% | 18% | 18% | 19% | 19% | 19% | 19% | 19% | |
| Littlefield Bus. (Incl. Hockley Co.) | 0% | 0% | 15% | 28% | 34% | 40% | 43% | 40% | 41% | 41% | 43% | 44% | 45% | 54% | 63% | 63% | 63% | 63% | 63% | 63% | 63% | 63% | 63% | 63% | |
| Burkburnnet Bus. | 0% | 0% | 10% | 24% | 29% | 35% | 36% | 38% | 39% | 40% | 42% | 44% | 53% | 62% | 63% | 63% | 63% | 63% | 63% | 63% | 63% | 63% | 63% | 63% | |
| Brownfield Bus. | 0% | 0% | 0% | 10% | 24% | 31% | 49% | 54% | 61% | 61% | 61% | 61% | 61% | 64% | 68% | 68% | 68% | 68% | 68% | 68% | 68% | 68% | 68% | 68% | |
| Slaton Bus. | 0% | 0% | 0% | 0% | 12% | 17% | 21% | 22% | 24% | 27% | 29% | 31% | 32% | 34% | 35% | 37% | 38% | 40% | 41% | 43% | 44% | 46% | 47% | 49% | |
| Wilson Bus. | 0% | 0% | 0% | 0% | 0% | 8% | 17% | 17% | 17% | 17% | 17% | 17% | 17% | 17% | 17% | 17% | 17% | 17% | 17% | 17% | 17% | 17% | 17% | 17% | |
| Lamesa Bus. (incl. Dawson Co) | 0% | 0% | 0% | 0% | 0% | 1% | 40% | 50% | 53% | 57% | 59% | 61% | 62% | 67% | 67% | 67% | 67% | 67% | 67% | 67% | 67% | 67% | 67% | 67% | |
| Plainview Bus. | 0% | 0% | 0% | 0% | 0% | 0% | 4% | 29% | 35% | 39% | 40% | 42% | 49% | 56% | 58% | 60% | 61% | 63% | 63% | 63% | 63% | 63% | 63% | 63% | |
| Wichita Falls Bus. | 0% | 0% | 0% | 0% | 0% | 0% | 0% | 9% | 17% | 23% | 31% | 38% | 45% | 46% | 46% | 46% | 47% | 47% | 47% | 48% | 48% | 49% | 49% | 49% | |
| Iowa Park Bus. | 0% | 0% | 0% | 0% | 0% | 0% | 0% | 0% | 7% | 12% | 15% | 17% | 20% | 31% | 42% | 44% | 45% | 47% | 48% | 50% | 51% | 53% | 54% | 56% | |
| Hammond Bus | 0% | 0% | 0% | 0% | 0% | 0% | 0% | 0% | 0% | 3% | 10% | 12% | 14% | 15% | 16% | 17% | 18% | 19% | 21% | 22% | 23% | 24% | 25% | 26% | |
| Ponchatoula Bus | 0% | 0% | 0% | 0% | 0% | 0% | 0% | 0% | 0% | 0% | 0% | 14% | 20% | 23% | 25% | 27% | 29% | 32% | 34% | 36% | 38% | 41% | 43% | 45% | |
| Abilene Bus | 0% | 0% | 0% | 0% | 0% | 0% | 0% | 0% | 0% | 0% | 3% | 16% | 27% | 38% | 39% | 39% | 39% | 40% | 40% | 41% | 41% | 41% | 42% | 42% | |
| Hale Center Bus | 0% | 0% | 0% | 0% | 0% | 0% | 0% | 0% | 0% | 0% | 5% | 9% | 13% | 19% | 27% | 32% | 35% | 37% | 42% | 43% | 44% | 46% | 48% | 48% | |
| Abernathy Bus | 0% | 0% | 0% | 0% | 0% | 0% | 0% | 0% | 0% | 0% | 0% | 9% | 13% | 19% | 27% | 32% | 35% | 37% | 42% | 43% | 44% | 46% | 48% | 48% | |
| New Deal Bus | 0% | 0% | 0% | 0% | 0% | 0% | 0% | 0% | 0% | 0% | 0% | 9% | 13% | 19% | 27% | 32% | 35% | 37% | 42% | 43% | 44% | 46% | 48% | 48% | |
| Amarillo Bus | 0% | 0% | 0% | 0% | 0% | 0% | 0% | 0% | 0% | 0% | 0% | 2% | 11% | 20% | 24% | 29% | 30% | 30% | 31% | 32% | 33% | 33% | 34% | 35% | |
| Tickfaw Village Bus | 0% | 0% | 0% | 0% | 0% | 0% | 0% | 0% | 0% | 0% | 0% | 0% | 13% | 19% | 27% | 32% | 35% | 37% | 42% | 43% | 44% | 46% | 48% | 48% | |
| Independence Bus | 0% | 0% | 0% | 0% | 0% | 0% | 0% | 0% | 0% | 0% | 0% | 0% | 13% | 19% | 27% | 32% | 35% | 37% | 42% | 43% | 44% | 46% | 48% | 48% | |
| Amite Bus | 0% | 0% | 0% | 0% | 0% | 0% | 0% | 0% | 0% | 0% | 0% | 0% | 13% | 19% | 27% | 32% | 35% | 37% | 42% | 43% | 44% | 46% | 48% | 48% | |
| Pine Grove Bus | 0% | 0% | 0% | 0% | 0% | 0% | 0% | 0% | 0% | 0% | 0% | 0% | 13% | 19% | 27% | 32% | 35% | 37% | 42% | 43% | 44% | 46% | 48% | 48% | |
| Montpelier Bus | 0% | 0% | 0% | 0% | 0% | 0% | 0% | 0% | 0% | 0% | 0% | 0% | 13% | 19% | 27% | 32% | 35% | 37% | 42% | 43% | 44% | 46% | 48% | 48% | |
| Franklinton Bus | 0% | 0% | 0% | 0% | 0% | 0% | 0% | 0% | 0% | 0% | 0% | 0% | 13% | 19% | 27% | 32% | 35% | 37% | 42% | 43% | 44% | 46% | 48% | 48% | |
| Towers Bus | 0% | 0% | 0% | 0% | 0% | 0% | 0% | 0% | 0% | 0% | 0% | 0% | 13% | 19% | 27% | 32% | 35% | 37% | 42% | 43% | 44% | 46% | 48% | 48% | |
| Natalbany Bus | 0% | 0% | 0% | 0% | 0% | 0% | 0% | 0% | 0% | 0% | 0% | 0% | 13% | 19% | 27% | 32% | 35% | 37% | 42% | 43% | 44% | 46% | 48% | 48% | |
| Residential Take Rate | |||||||||||||||||||||||||
| Lubbock Res. | 15% | 15% | 15% | 14% | 14% | 14% | 14% | 13% | 13% | 13% | 12% | 12% | 12% | 13% | 13% | 13% | 14% | 14% | 15% | 15% | 15% | 16% | 16% | 16% | |
| Wolfforth Res. | 10% | 10% | 10% | 9% | 9% | 10% | 10% | 9% | 9% | 9% | 9% | 9% | 9% | 9% | 10% | 10% | 11% | 11% | 11% | 12% | 12% | 12% | 13% | 13% | |
| Levelland Res | 37% | 38% | 37% | 38% | 38% | 38% | 39% | 38% | 39% | 38% | 38% | 38% | 38% | 39% | 39% | 39% | 40% | 40% | 40% | 41% | 41% | 42% | 42% | 42% | |
| Smyer Res. | 30% | 31% | 30% | 34% | 35% | 36% | 35% | 33% | 36% | 36% | 35% | 35% | 35% | 35% | 35% | 36% | 36% | 37% | 37% | 37% | 38% | 38% | 38% | 39% | |
| Littlefield Res. (Incl. Hockley Co.) | 0% | 0% | 18% | 28% | 35% | 36% | 38% | 39% | 43% | 41% | 41% | 41% | 41% | 41% | 42% | 42% | 42% | 43% | 43% | 43% | 43% | 43% | 43% | 43% | |
| Whitharral Res. | 0% | 0% | 0% | 5% | 13% | 12% | 11% | 12% | 18% | 18% | 21% | 22% | 23% | 24% | 24% | 25% | 26% | 27% | 27% | 28% | 29% | 30% | 30% | 31% | |
| Burkburnnet Res. | 0% | 0% | 7% | 14% | 20% | 24% | 27% | 28% | 30% | 30% | 31% | 32% | 33% | 33% | 34% | 35% | 36% | 36% | 37% | 38% | 39% | 39% | 40% | 41% | |
| Brownfield Res. | 0% | 0% | 0% | 12% | 27% | 32% | 35% | 36% | 37% | 38% | 39% | 39% | 40% | 40% | 40% | 41% | 41% | 42% | 42% | 42% | 42% | 42% | 42% | 42% | |
| Slaton Res. | 0% | 0% | 0% | 0% | 5% | 9% | 11% | 13% | 16% | 17% | 18% | 19% | 20% | 20% | 21% | 22% | 23% | 23% | 24% | 25% | 26% | 26% | 27% | 28% | |
| Wilson Res. | 0% | 0% | 0% | 0% | 0% | 11% | 18% | 20% | 23% | 23% | 25% | 26% | 27% | 28% | 28% | 29% | 30% | 31% | 31% | 32% | 33% | 34% | 34% | 35% | |
| Lamesa Res. | 0% | 0% | 0% | 0% | 0% | 4% | 14% | 19% | 22% | 26% | 27% | 29% | 30% | 32% | 33% | 35% | 36% | 38% | 39% | 40% | 40% | 40% | 40% | 40% | |
| Meadow Bus/Res. | 0% | 0% | 0% | 0% | 0% | 4% | 16% | 18% | 23% | 26% | 27% | 28% | 29% | 29% | 30% | 31% | 32% | 32% | 33% | 34% | 35% | 35% | 36% | 37% | |
| Ropesville Bus/Res. | 0% | 0% | 0% | 0% | 0% | 2% | 15% | 17% | 20% | 22% | 23% | 24% | 25% | 25% | 26% | 27% | 28% | 28% | 29% | 30% | 31% | 31% | 32% | 33% | |
| Plainview Res. | 0% | 0% | 0% | 0% | 0% | 0% | 0% | 3% | 8% | 12% | 14% | 16% | 19% | 20% | 22% | 23% | 25% | 26% | 28% | 29% | 31% | 32% | 34% | 35% | |
| Iowa Park Res. | 0% | 0% | 0% | 0% | 0% | 0% | 0% | 1% | 7% | 10% | 13% | 15% | 17% | 19% | 20% | 22% | 23% | 25% | 26% | 28% | 29% | 31% | 32% | 34% | |
| Hammond Res. | 0% | 0% | 0% | 0% | 0% | 0% | 0% | 0% | 0% | 0% | 1% | 1% | 7% | 15% | 21% | 25% | 28% | 29% | 28% | 28% | 29% | 29% | 29% | 28% | |
| Ponchatoula Res | 0% | 0% | 0% | 0% | 0% | 0% | 0% | 0% | 0% | 0% | 0% | 1% | 7% | 15% | 21% | 25% | 28% | 29% | 28% | 28% | 29% | 29% | 29% | 28% | |
| Abilene Res | 0% | 0% | 0% | 0% | 0% | 0% | 0% | 0% | 0% | 0% | 0% | 0% | 0% | 0% | 0% | 0% | 0% | 0% | 0% | 0% | 0% | 0% | 0% | 0% | |
| Hale Center Res | 0% | 0% | 0% | 0% | 0% | 0% | 0% | 0% | 0% | 0% | 10% | 15% | 21% | 25% | 28% | 29% | 28% | 28% | 29% | 29% | 29% | 28% | 29% | 29% | |
| Abernathy Res | 0% | 0% | 0% | 0% | 0% | 0% | 0% | 0% | 0% | 0% | 0% | 1% | 7% | 15% | 21% | 25% | 28% | 29% | 28% | 28% | 29% | 29% | 29% | 28% | |
| New Deal Res | 0% | 0% | 0% | 0% | 0% | 0% | 0% | 0% | 0% | 0% | 0% | 1% | 7% | 15% | 21% | 25% | 28% | 29% | 28% | 28% | 29% | 29% | 29% | 28% | |
| Amarillo Res | 0% | 0% | 0% | 0% | 0% | 0% | 0% | 0% | 0% | 0% | 0% | 0% | 0% | 0% | 0% | 0% | 0% | 0% | 0% | 0% | 0% | 0% | 0% | 0% | |
| Tickfaw Village Res | 0% | 0% | 0% | 0% | 0% | 0% | 0% | 0% | 0% | 0% | 0% | 0% | 1% | 7% | 15% | 21% | 25% | 28% | 29% | 28% | 28% | 29% | 29% | 29% | |
| Independence Res | 0% | 0% | 0% | 0% | 0% | 0% | 0% | 0% | 0% | 0% | 0% | 0% | 1% | 7% | 15% | 21% | 25% | 28% | 29% | 28% | 28% | 29% | 29% | 29% | |
| Amite Res | 0% | 0% | 0% | 0% | 0% | 0% | 0% | 0% | 0% | 0% | 0% | 0% | 1% | 7% | 15% | 21% | 25% | 28% | 29% | 28% | 28% | 29% | 29% | 29% | |
| Pine Grove Res | 0% | 0% | 0% | 0% | 0% | 0% | 0% | 0% | 0% | 0% | 0% | 0% | 1% | 7% | 15% | 21% | 25% | 28% | 29% | 28% | 28% | 29% | 29% | 29% | |
| Montpelier Res | 0% | 0% | 0% | 0% | 0% | 0% | 0% | 0% | 0% | 0% | 0% | 0% | 1% | 7% | 15% | 21% | 25% | 28% | 29% | 28% | 28% | 29% | 29% | 29% | |
| Franklinton Res | 0% | 0% | 0% | 0% | 0% | 0% | 0% | 0% | 0% | 0% | 0% | 0% | 1% | 7% | 15% | 21% | 25% | 28% | 29% | 28% | 28% | 29% | 29% | 29% | |
| Towers Res | 0% | 0% | 0% | 0% | 0% | 0% | 0% | 0% | 0% | 0% | 0% | 0% | 1% | 7% | 15% | 21% | 25% | 28% | 29% | 28% | 28% | 29% | 29% | 29% | |
| Natalbany Res | 0% | 0% | 0% | 0% | 0% | 0% | 0% | 0% | 0% | 0% | 0% | 0% | 1% | 7% | 15% | 21% | 25% | 28% | 29% | 28% | 28% | 29% | 29% | 29% | |
| Total Take Rate | |||||||||||||||||||||||||
| Lubbock Totals | 22% | 22% | 22% | 21% | 22% | 21% | 21% | 21% | 21% | 21% | 21% | 21% | 21% | 21% | 21% | 22% | 22% | 22% | 23% | 23% | 23% | 24% | 24% | 24% | |
| Wolfforth Totals | 11% | 11% | 11% | 11% | 11% | 11% | 11% | 11% | 11% | 10% | 10% | 10% | 10% | 11% | 11% | 11% | 12% | 12% | 12% | 13% | 13% | 14% | 14% | 14% | |
| Misc. Bus. Fiber - Other Mkts. | |||||||||||||||||||||||||
| Levelland Totals | 38% | 39% | 38% | 39% | 39% | 40% | 40% | 39% | 40% | 40% | 40% | 40% | 40% | 40% | 41% | 41% | 41% | 42% | 42% | 42% | 43% | 43% | 44% | 44% | |
| Smyer Totals | 30% | 31% | 30% | 34% | 35% | 35% | 35% | 33% | 36% | 36% | 34% | 34% | 34% | 35% | 35% | 35% | 36% | 36% | 36% | 37% | 37% | 38% | 38% | 38% | |
| Littlefield Totals (Incl. Hockley Co.) | 0% | 0% | 18% | 28% | 35% | 37% | 38% | 39% | 42% | 41% | 41% | 41% | 41% | 43% | 44% | 45% | 45% | 45% | 46% | 46% | 46% | 46% | 46% | 46% | |
| Whitharral Res. | 0% | 0% | 0% | 5% | 13% | 12% | 11% | 12% | 18% | 18% | 21% | 22% | 23% | 24% | 24% | 25% | 26% | 27% | 27% | 28% | 29% | 30% | 30% | 31% | |
| Burkburnnet Totals | 0% | 0% | 7% | 15% | 21% | 25% | 27% | 28% | 30% | 31% | 32% | 32% | 34% | 35% | 36% | 36% | 37% | 38% | 38% | 39% | 40% | 41% | 41% | 42% | |
| Brownfield Totals | 0% | 0% | 0% | 12% | 26% | 32% | 36% | 38% | 37% | 38% | 41% | 42% | 42% | 43% | 43% | 44% | 44% | 44% | 45% | 45% | 45% | 45% | 45% | 45% | |
| Slaton Totals | 0% | 0% | 0% | 0% | 5% | 10% | 12% | 14% | 17% | 18% | 19% | 20% | 21% | 22% | 22% | 23% | 24% | 25% | 26% | 26% | 27% | 28% | 29% | 30% | |
| Wilson Totals | 0% | 0% | 0% | 0% | 0% | 11% | 18% | 19% | 22% | 22% | 24% | 25% | 26% | 26% | 27% | 28% | 28% | 29% | 30% | 30% | 31% | 32% | 32% | 33% | |
| Meadow Bus/Res. | 0% | 0% | 0% | 0% | 0% | 4% | 17% | 22% | 26% | 29% | 31% | 32% | 34% | 36% | 37% | 38% | 40% | 41% | 42% | 43% | 43% | 43% | 43% | 43% | |
| Lamesa Totals | 0% | 0% | 0% | 0% | 0% | 4% | 16% | 18% | 23% | 26% | 27% | 28% | 29% | 29% | 30% | 31% | 32% | 32% | 33% | 34% | 35% | 35% | 36% | 37% | |
| Ropesville Bus/Res. | 0% | 0% | 0% | 0% | 0% | 2% | 15% | 17% | 20% | 22% | 23% | 24% | 25% | 25% | 26% | 27% | 28% | 28% | 29% | 30% | 31% | 31% | 32% | 33% | |
| Plainview Totals | 0% | 0% | 0% | 0% | 0% | 0% | 1% | 7% | 12% | 16% | 18% | 20% | 23% | 25% | 27% | 29% | 30% | 32% | 33% | 34% | 35% | 37% | 38% | 39% | |
| Wichita Falls Bus. | 0% | 0% | 0% | 0% | 0% | 0% | 0% | 9% | 17% | 23% | 31% | 38% | 45% | 46% | 46% | 46% | 47% | 47% | 47% | 48% | 48% | 49% | 49% | 49% | |
| Iowa Park Totals | 0% | 0% | 0% | 0% | 0% | 0% | 0% | 1% | 7% | 10% | 13% | 15% | 17% | 19% | 22% | 23% | 25% | 26% | 28% | 29% | 31% | 32% | 34% | 35% | |
| Hammond Total | 0% | 0% | 0% | 0% | 0% | 0% | 0% | 0% | 0% | 0% | 5% | 6% | 10% | 15% | 19% | 22% | 24% | 25% | 25% | 26% | 26% | 27% | 28% | 27% | |
| Ponchatoula Total | 0% | 0% | 0% | 0% | 0% | 0% | 0% | 0% | 0% | 0% | 0% | 5% | 11% | 17% | 22% | 26% | 28% | 29% | 30% | 31% | 32% | 32% | 33% | 33% | |
| Abilene Total | 0% | 0% | 0% | 0% | 0% | 0% | 0% | 0% | 0% | 0% | 3% | 16% | 27% | 38% | 39% | 39% | 39% | 40% | 40% | 41% | 41% | 41% | 42% | 42% | |
| Hale Center Total | 0% | 0% | 0% | 0% | 0% | 0% | 0% | 0% | 0% | 0% | 10% | 15% | 21% | 25% | 28% | 29% | 28% | 29% | 30% | 30% | 30% | 29% | 30% | 30% | |
| Abernathy Total | 0% | 0% | 0% | 0% | 0% | 0% | 0% | 0% | 0% | 0% | 0% | 2% | 7% | 15% | 22% | 26% | 28% | 29% | 29% | 29% | 30% | 30% | 31% | 30% | |
| New Deal Total | 0% | 0% | 0% | 0% | 0% | 0% | 0% | 0% | 0% | 0% | 0% | 2% | 7% | 15% | 22% | 26% | 28% | 29% | 29% | 29% | 30% | 30% | 31% | 30% | |
| Amarillo Total | 0% | 0% | 0% | 0% | 0% | 0% | 0% | 0% | 0% | 0% | 0% | 2% | 11% | 20% | 24% | 29% | 30% | 30% | 31% | 32% | 33% | 33% | 34% | 35% | |
| Tickfaw Village Totals | 0% | 0% | 0% | 0% | 0% | 0% | 0% | 0% | 0% | 0% | 0% | 0% | 2% | 7% | 15% | 21% | 26% | 28% | 29% | 28% | 29% | 29% | 29% | 29% | |
| Independence Total | 0% | 0% | 0% | 0% | 0% | 0% | 0% | 0% | 0% | 0% | 0% | 0% | 2% | 7% | 15% | 21% | 26% | 28% | 29% | 28% | 29% | 29% | 29% | 30% | |
| Amite Total | 0% | 0% | 0% | 0% | 0% | 0% | 0% | 0% | 0% | 0% | 0% | 0% | 3% | 8% | 16% | 22% | 26% | 29% | 30% | 29% | 30% | 30% | 31% | 31% | |
| Pine Grove Total | 0% | 0% | 0% | 0% | 0% | 0% | 0% | 0% | 0% | 0% | 0% | 0% | 2% | 7% | 15% | 21% | 25% | 28% | 29% | 28% | 28% | 29% | 29% | 29% | |
| Montpelier Total | 0% | 0% | 0% | 0% | 0% | 0% | 0% | 0% | 0% | 0% | 0% | 0% | 2% | 7% | 15% | 21% | 25% | 28% | 29% | 28% | 28% | 29% | 29% | 29% | |
| Franklington Total | 0% | 0% | 0% | 0% | 0% | 0% | 0% | 0% | 0% | 0% | 0% | 0% | 4% | 9% | 18% | 24% | 27% | 30% | 32% | 31% | 32% | 33% | 33% | 33% | |
| Towers Totals | 0% | 0% | 0% | 0% | 0% | 0% | 0% | 0% | 0% | 0% | 0% | 0% | 3% | 8% | 17% | 23% | 27% | 29% | 30% | 30% | 30% | 31% | 31% | 32% | |
| Natalbany Totals | 0% | 0% | 0% | 0% | 0% | 0% | 0% | 0% | 0% | 0% | 0% | 0% | 2% | 8% | 16% | 22% | 26% | 29% | 30% | 29% | 29% | 30% | 30% | 31% | |
| Annual Summary | |||||||||||||||||||||||||||
| 2011 | 2012 | 2013 | 2014 | 2015 | 2016 | ||||||||||||||||||||||
| Gross Fiber Business | $ | 7,770,321 | $ | 9,849,154 | $ | 12,299,581 | $ | 17,063,058 | $ | 20,930,889 | $ | 23,867,943 | |||||||||||||||
| Count | 1,696 | 1,892 | 2,452 | 3,574 | 5,072 | 5,764 | 6,177 | ||||||||||||||||||||
| ARPU | $ | 361 | $ | 378 | $ | 340 | $ | 329 | $ | 322 | $ | 333 | |||||||||||||||
| Passings | 4,077 | 5,491 | 12,390 | 12,830 | 13,466 | 13,466 | |||||||||||||||||||||
| Take Rate | 46 | % | 45 | % | 29 | % | 40 | % | 43 | % | 46 | % | |||||||||||||||
| Gross Fiber Residential | $ | 5,153,109 | $ | 7,723,077 | $ | 9,688,655 | $ | 12,872,860 | $ | 16,805,123 | $ | 18,911,249 | |||||||||||||||
| 4,164 | 5,375 | 7,008 | 8,486 | 11,920 | 13,939 | 15,028 | |||||||||||||||||||||
| $ | 90 | $ | 104 | $ | 104 | $ | 105 | $ | 108 | $ | 109 | ||||||||||||||||
| 29,671 | 38,935 | 50,134 | 50,134 | 52,677 | 52,677 | ||||||||||||||||||||||
| 18 | % | 18 | % | 17 | % | 24 | % | 26 | % | 29 | % | ||||||||||||||||
| Gross Fiber Wholesale | $ | 99,117 | $ | 647,384 | $ | 1,621,952 | $ | 2,131,612 | $ | 2,307,325 | $ | 2,497,523 | |||||||||||||||
| Gross Fiber Total | $ | 13,022,548 | $ | 18,219,615 | $ | 23,610,188 | $ | 32,067,530 | $ | 40,043,338 | $ | 45,276,715 | |||||||||||||||
| 5,860 | 7,267 | 9,460 | 12,060 | 16,993 | 19,703 | 21,206 | |||||||||||||||||||||
| $ | 165 | $ | 182 | $ | 183 | $ | 184 | $ | 182 | $ | 184 | ||||||||||||||||
| 33,748 | 44,426 | 62,524 | 62,964 | 66,143 | 66,143 | ||||||||||||||||||||||
| 22 | % | 21 | % | 19 | % | 27 | % | 30 | % | 32 | % | ||||||||||||||||
11
| Starting in Q1 2011 | |||||||||||||||||||||||||||||
| Projections in Red | |||||||||||||||||||||||||||||
| Bus Take Rates | Competitor 1 | Competitor 2 | Competitor 3 | Passinsgs # | 1 | 2 | 3 | 4 | 5 | 6 | 7 | 8 | 9 | 10 | 11 | 12 | 13 | 14 | 15 | 16 | 17 | 18 | 19 | 20 | 21 | 22 | 23 | 24 | 25 |
| Levelland | Windstream | 310 | 11.61% | 17.74% | 24.93% | 36.46% | 42.58% | 46.77% | 49.35% | 56.45% | 57.10% | 59.03% | 61.29% | 64.19% | 64.52% | 65.81% | 68.39% | 69% | 69% | 69% | 69% | 69% | 70% | 70% | 70% | 70% | 70% | ||
| Littlefield | Windstream | 173 | 15.03% | 28.32% | 33.53% | 40.46% | 42.77% | 40.46% | 41.04% | 41.04% | 43.00% | 44.13% | 45.25% | 54.25% | 63.25% | 63.25% | 63.25% | 63.25% | 63.25% | 63.25% | |||||||||
| Burkburnett | AT&T | Suddenlink | 263 | 9.51% | 24.33% | 28.52% | 34.98% | 36.12% | 37.64% | 38.78% | 39.54% | 42.00% | 44.25% | 53.25% | 62.25% | 63.00% | 63.00% | 63.00% | 63.00% | 63.00% | 63.00% | ||||||||
| Brownfield | Windstream | 178 | 9.55% | 23.60% | 31.46% | 49.44% | 54.49% | 60.67% | 60.67% | 60.92% | 60.92% | 60.92% | 63.98% | 67.73% | 67.73% | 67.73% | 67.73% | 67.73% | 67.73% | ||||||||||
| Slaton | AT&T | NTS | 140 | 12.14% | 17.14% | 20.71% | 22.14% | 24.29% | 27.14% | 29.00% | 30.50% | 32.00% | 33.50% | 35.00% | 36.50% | 38.00% | 39.50% | 41.00% | 42.50% | ||||||||||
| Lamesa | Windstream | Northland Cable | 223 | 1.35% | 39.91% | 50.22% | 52.91% | 56.50% | 59.00% | 60.50% | 62.00% | 67.25% | 67.25% | 67.25% | 67.25% | 67.25% | 67.25% | 67.25% | |||||||||||
| Plainview | AT&T | Suddenlink | 547 | 3.66% | 28.70% | 34.73% | 38.76% | 40.00% | 42.25% | 49.00% | 55.75% | 58.00% | 59.50% | 61.00% | 62.50% | 62.50% | 62.50% | ||||||||||||
| Wichita Falls | AT&T | Time Warner | Webfire | 1,052 | 8.67% | 17.14% | 22.91% | 30.50% | 37.63% | 45.13% | 45.50% | 45.88% | 46.25% | 46.63% | 47.00% | 47.38% | 47.75% | ||||||||||||
| Iowa Park | AT&T | Suddenlink | 180 | 0.00% | 6.67% | 11.67% | 15.00% | 17.25% | 19.50% | 30.75% | 42.00% | 43.50% | 45.00% | 46.50% | 48.00% | 49.50% | |||||||||||||
| Smyer | Windstream | 6 | 33% | 33% | 33% | 17% | 17% | 17% | 17% | 17% | 17% | 17% | 17% | 17% | 17% | 17% | 18% | 18% | 18% | 18% | 18% | 19% | 19% | 19% | 19% | 19% | |||
| Wilson | Windstream | 24 | 8% | 17% | 17% | 17% | 17% | 17% | 17% | 17% | 17% | 17% | 17% | 17% | 17% | 17% | 17% | 17% | 17% | 17% | 17% | ||||||||
| Hale Center | AT&T | NTS | 61 | 5% | 9% | 13% | 19% | 27% | 32% | 35% | 37% | 42% | 43% | 44% | 46% | 48% | 48% | ||||||||||||
| Abernathy | AT&T | NTS | 86 | 9% | 13% | 19% | 27% | 32% | 35% | 37% | 42% | 43% | 44% | 46% | 48% | 48% | |||||||||||||
| New Deal | AT&T | NTS | 1,081 | 9% | 13% | 19% | 27% | 32% | 35% | 37% | 42% | 43% | 44% | 46% | 48% | 48% | |||||||||||||
| Abilene | AT&T | Suddenlink | 88 | 3% | 16% | 27% | 38% | 39% | 39% | 39% | 40% | 40% | 41% | 41% | 41% | 42% | 42% | ||||||||||||
| Amarillo | AT&T | Suddenlink | AMA Techtel / Pathwayz | 2,000 | 2% | 11% | 20% | 24% | 29% | 30% | 30% | 31% | 32% | 33% | 33% | 34% | 35% | ||||||||||||
| Hammond | AT&T | Charter | Hunt Brothers | 2,074 | 3% | 10% | 12% | 14% | 15% | 16% | 17% | 18% | 19% | 21% | 22% | 23% | 24% | 25% | 26% | ||||||||||
| Ponchatoula | AT&T | Charter | Hunt Brothers | 562 | 0% | 14% | 20% | 23% | 25% | 27% | 29% | 32% | 34% | 36% | 38% | 41% | 43% | 45% | |||||||||||
| Tickfaw Village | AT&T | Charter | Hunt Brothers | 9 | 0% | 13% | 19% | 27% | 32% | 35% | 37% | 42% | 43% | 44% | 46% | 48% | 48% | ||||||||||||
| Independence | AT&T | Charter | Hunt Brothers | 11 | 0% | 13% | 19% | 27% | 32% | 35% | 37% | 42% | 43% | 44% | 46% | 48% | 48% | ||||||||||||
| Amite | AT&T | Charter | Hunt Brothers | 88 | 0% | 13% | 19% | 27% | 32% | 35% | 37% | 42% | 43% | 44% | 46% | 48% | 48% | ||||||||||||
| Pine Grove | AT&T | Charter | 7 | 0% | 13% | 19% | 27% | 32% | 35% | 37% | 42% | 43% | 44% | 46% | 48% | 48% | |||||||||||||
| Montpelier | AT&T | Charter | 12 | 0% | 13% | 19% | 27% | 32% | 35% | 37% | 42% | 43% | 44% | 46% | 48% | 48% | |||||||||||||
| Franklinton | AT&T | Charter | Hunt Brothers | 57 | 0% | 13% | 19% | 27% | 32% | 35% | 37% | 42% | 43% | 44% | 46% | 48% | 48% | ||||||||||||
| Towers | AT&T | 133 | 0% | 13% | 19% | 27% | 32% | 35% | 37% | 42% | 43% | 44% | 46% | 48% | 48% | ||||||||||||||
| Natalbany | AT&T | Charter | Hunt Brothers | 25 | 0% | 13% | 19% | 27% | 32% | 35% | 37% | 42% | 43% | 44% | 46% | 48% | 48% | ||||||||||||
| Midland | AT&T | Suddenlink | 220 | 3% | 16% | 27% | 38% | 39% | 39% | 39% | 40% | 40% | |||||||||||||||||
| Odessa | AT&T | Suddenlink | 220 | 0% | 3% | 16% | 27% | 38% | 39% | 39% | 39% | 40% | |||||||||||||||||
| Snyder | AT&T | Suddenlink | 163 | 9% | 13% | 19% | 27% | 32% | 35% | 37% | 42% | ||||||||||||||||||
| Sweetwater | AT&T | Suddenlink | 150 | 9% | 13% | 19% | 27% | 32% | 35% | 37% | 42% | ||||||||||||||||||
| Pampa | AT&T | Charter | 323 | 9% | 13% | 19% | 27% | 32% | 35% | 37% | 42% | ||||||||||||||||||
| Res Take Rate | 1 | 2 | 3 | 4 | 5 | 6 | 7 | 8 | 9 | 10 | 11 | 12 | 13 | 14 | 15 | 16 | 17 | 18 | 19 | 20 | 21 | 22 | 23 | 24 | 25 | ||||
| Levelland | Windstream | 5,185 | 2% | 9% | 20% | 28% | 34% | 37% | 38% | 37% | 38% | 38% | 38% | 39% | 38% | 39% | 38% | 38% | 38% | 38% | 39% | 39% | 39% | 40% | 40% | 40% | 41% | ||
| Littlefield | Windstream | 1,247 | 18% | 28% | 35% | 36% | 38% | 39% | 43% | 41% | 41% | 41% | 41% | 41% | 42% | 42% | 42% | 43% | 43% | 43% | |||||||||
| Burkburnett | AT&T | Suddenlink | 4,449 | 7% | 14% | 20% | 24% | 27% | 28% | 30% | 30% | 31% | 32% | 33% | 33% | 34% | 35% | 36% | 36% | 37% | 38% | ||||||||
| Brownfield | Windstream | 1,501 | 12% | 27% | 32% | 35% | 36% | 37% | 38% | 39% | 39% | 40% | 40% | 40% | 41% | 41% | 42% | 42% | 42% | ||||||||||
| Slaton | AT&T | NTS | 1,283 | 5% | 9% | 11% | 13% | 16% | 17% | 18% | 19% | 20% | 20% | 21% | 22% | 23% | 23% | 24% | 25% | ||||||||||
| Lamesa | Windstream | Northland Cable | 1,708 | 4% | 14% | 19% | 22% | 26% | 27% | 29% | 30% | 32% | 33% | 35% | 36% | 38% | 39% | 40% | |||||||||||
| Plainview | AT&T | Suddenlink | 3,080 | 0% | 3% | 8% | 12% | 14% | 16% | 19% | 20% | 22% | 23% | 25% | 26% | 28% | 29% | ||||||||||||
| Iowa Park | AT&T | Suddenlink | 180 | 1% | 7% | 10% | 13% | 15% | 17% | 19% | 20% | 22% | 23% | 25% | 26% | 28% | |||||||||||||
| Smyer | Windstream | 216 | 30% | 31% | 30% | 34% | 35% | 36% | 35% | 33% | 36% | 36% | 35% | 35% | 35% | 35% | 35% | 36% | 36% | 37% | 37% | 37% | 38% | 38% | 38% | 39% | |||
| Whitharral | Windstream | 84 | 5% | 13% | 12% | 11% | 12% | 18% | 18% | 21% | 22% | 23% | 24% | 24% | 25% | 26% | 27% | 27% | 28% | 29% | 30% | 30% | 31% | ||||||
| Brownfield | Windstream | 1,501 | 12% | 27% | 32% | 35% | 36% | 37% | 38% | 39% | 39% | 40% | 40% | 40% | 41% | 41% | 42% | 42% | 42% | 42% | 42% | 42% | 42% | ||||||
| Wilson | Repeated | 182 | 11% | 18% | 20% | 23% | 23% | 25% | 26% | 27% | 28% | 28% | 29% | 30% | 31% | 31% | 32% | 33% | 34% | 34% | 35% | ||||||||
| Meadow | Windstream | 219 | 4% | 16% | 18% | 23% | 26% | 27% | 28% | 29% | 29% | 30% | 31% | 32% | 32% | 33% | 34% | 35% | 35% | 36% | 37% | ||||||||
| Ropesville | Windstream | 185 | 2% | 15% | 17% | 20% | 22% | 23% | 24% | 25% | 25% | 26% | 27% | 28% | 28% | 29% | 30% | 31% | 31% | 32% | 33% | ||||||||
| Hale Center | Windstream | 798 | 10% | 15% | 21% | 25% | 28% | 29% | 28% | 28% | 29% | 29% | 29% | 28% | 29% | 29% | |||||||||||||
| Abernathy | AT&T | NTS | 995 | 1% | 7% | 15% | 21% | 25% | 28% | 29% | 28% | 28% | 29% | 29% | 29% | 28% | |||||||||||||
| New Deal | AT&T | NTS | 239 | 1% | 7% | 15% | 21% | 25% | 28% | 29% | 28% | 28% | 29% | 29% | 29% | 28% | |||||||||||||
| Hammond | AT&T | NTS | 3,302 | 1% | 1% | 7% | 15% | 21% | 25% | 28% | 29% | 28% | 28% | 29% | 29% | 29% | 28% | ||||||||||||
| Ponchatoula | AT&T | Charter | Hunt Brothers | 1,352 | 0% | 1% | 7% | 15% | 21% | 25% | 28% | 29% | 28% | 28% | 29% | 29% | 29% | 28% | |||||||||||
| Tickfaw Village | AT&T | Charter | Hunt Brothers | 505 | 0% | 1% | 7% | 15% | 21% | 25% | 28% | 29% | 28% | 28% | 29% | 29% | 29% | ||||||||||||
| Independence | AT&T | Charter | Hunt Brothers | 546 | 0% | 1% | 7% | 15% | 21% | 25% | 28% | 29% | 28% | 28% | 29% | 29% | 29% | ||||||||||||
| Amite | AT&T | Charter | Hunt Brothers | 856 | 0% | 1% | 7% | 15% | 21% | 25% | 28% | 29% | 28% | 28% | 29% | 29% | 29% | ||||||||||||
| Pine Grove | AT&T | Charter | Hunt Brothers | 476 | 0% | 1% | 7% | 15% | 21% | 25% | 28% | 29% | 28% | 28% | 29% | 29% | 29% | ||||||||||||
| Montpelier | AT&T | Charter | 765 | 0% | 1% | 7% | 15% | 21% | 25% | 28% | 29% | 28% | 28% | 29% | 29% | 29% | |||||||||||||
| Franklinton | AT&T | Charter | 200 | 0% | 1% | 7% | 15% | 21% | 25% | 28% | 29% | 28% | 28% | 29% | 29% | 29% | |||||||||||||
| Towers | AT&T | Charter | Hunt Brothers | 850 | 0% | 1% | 7% | 15% | 21% | 25% | 28% | 29% | 28% | 28% | 29% | 29% | 29% | ||||||||||||
| Natalbany | AT&T | 315 | 0% | 1% | 7% | 15% | 21% | 25% | 28% | 29% | 28% | 28% | 29% | 29% | 29% | ||||||||||||||
| Snyder | AT&T | Suddenlink | 653 | 1% | 7% | 15% | 21% | 25% | 28% | 29% | 28% | ||||||||||||||||||
| Sweetwater | AT&T | Suddenlink | 598 | 1% | 7% | 15% | 21% | 25% | 28% | 29% | 28% | ||||||||||||||||||
| Pampa | AT&T | Charter | 1,292 | 1% | 7% | 15% | 21% | 25% | 28% | 29% | 28% | ||||||||||||||||||
12
| Non-Fiber Summary | ||||||||||||||||||||||||||||||||||||||
| 2011 | 2012 | 2013 | 2014 | 2015 | 2016 | 2017 | 2018 | |||||||||||||||||||||||||||||||
| Q1 | Q2 | Q3 | Q4 | Year | Q1 | Q2 | Q3 | Q4 | Year | Q1 | Q2 | Q3 | Q4 | Year | Q1 | Q2 | Q3 | Q4 | Year | Q1 | Q2 | Q3 | Q4 | Year | Q1 | Q2 | Q3 | Q4 | Year | |||||||||
| Non-Fiber Revenue | ||||||||||||||||||||||||||||||||||||||
| UNE-L Revenue | ||||||||||||||||||||||||||||||||||||||
| Abilene Bus | $610,422 | $610,756 | $603,752 | $593,990 | $2,418,921 | $580,611 | $570,056 | $543,360 | $532,890 | $2,226,918 | $525,827 | $511,773 | $485,602 | $447,320 | $1,970,522 | $412,869 | $379,348 | $367,223 | $355,460 | $1,514,900 | $344,047 | $332,974 | $322,230 | $311,806 | $1,311,057 | $301,693 | $291,880 | $282,358 | $273,120 | $1,149,050 | $1,036,644 | $909,623 | ||||||
| Amarillo Bus | 576,428 | 557,581 | 545,715 | 526,336 | 2,206,061 | 535,012 | 516,424 | 457,991 | 442,952 | 1,952,380 | 434,899 | 393,639 | 368,545 | 347,819 | 1,544,902 | 313,349 | 281,406 | 259,455 | 238,644 | 1,092,854 | 225,704 | 213,404 | 201,713 | 190,601 | 831,422 | 180,041 | 170,004 | 160,467 | 151,403 | 661,915 | 537,354 | 435,328 | ||||||
| Lubbock Bus | 584,334 | 575,095 | 577,680 | 567,924 | 2,305,032 | 543,595 | 528,838 | 515,963 | 493,821 | 2,082,217 | 474,679 | 449,820 | 425,388 | 408,848 | 1,758,736 | 392,951 | 377,672 | 362,987 | 348,874 | 1,482,484 | 335,308 | 322,271 | 309,740 | 297,697 | 1,265,016 | 286,122 | 274,996 | 264,304 | 254,027 | 1,079,449 | 929,774 | 786,737 | ||||||
| Midland Bus | 434,913 | 430,825 | 454,966 | 442,666 | 1,763,370 | 416,033 | 408,165 | 395,284 | 385,022 | 1,604,504 | 383,251 | 390,270 | 375,430 | 366,377 | 1,515,328 | 357,543 | 348,922 | 340,508 | 330,938 | 1,377,911 | 317,143 | 304,334 | 291,802 | 284,592 | 1,197,872 | 277,555 | 270,686 | 263,982 | 257,438 | 1,069,661 | 991,103 | 892,598 | ||||||
| Odessa Bus | 282,598 | 278,752 | 289,654 | 278,859 | 1,129,863 | 287,725 | 279,557 | 284,009 | 276,728 | 1,128,019 | 274,385 | 254,054 | 249,242 | 245,227 | 1,022,909 | 241,278 | 237,391 | 233,568 | 229,806 | 942,043 | 224,862 | 215,941 | 207,768 | 199,708 | 848,280 | 196,334 | 193,013 | 189,745 | 186,530 | 765,622 | 727,332 | 679,120 | ||||||
| Wichita Falls Bus | 345,297 | 328,468 | 326,316 | 312,488 | 1,312,569 | 298,665 | 309,780 | 274,541 | 262,627 | 1,145,613 | 246,376 | 185,816 | 161,236 | 142,022 | 735,450 | 124,066 | 114,429 | 105,522 | 97,290 | 441,306 | 89,683 | 82,654 | 76,158 | 70,157 | 318,652 | 64,613 | 59,491 | 54,759 | 50,389 | 229,252 | 180,511 | 125,813 | ||||||
| Total Major Market Bus | 2,833,993 | 2,781,476 | 2,798,084 | 2,722,264 | 11,135,816 | 2,661,642 | 2,612,820 | 2,471,148 | 2,394,040 | 10,139,651 | 2,339,417 | 2,185,373 | 2,065,443 | 1,957,614 | 8,547,847 | 1,842,056 | 1,739,168 | 1,669,264 | 1,601,011 | 6,851,499 | 1,536,748 | 1,471,577 | 1,409,412 | 1,354,562 | 5,772,299 | 1,306,356 | 1,260,070 | 1,215,615 | 1,172,907 | 4,954,950 | 4,402,717 | 3,829,219 | ||||||
| Abilene Res | 80,107 | 75,954 | 72,949 | 68,234 | 297,243 | 62,570 | 57,366 | 52,673 | 49,479 | 222,088 | 48,935 | 45,136 | 41,078 | 38,132 | 173,281 | 35,398 | 32,860 | 30,504 | 28,317 | 127,079 | 26,286 | 24,401 | 22,652 | 21,027 | 94,367 | 19,520 | 18,120 | 16,821 | 15,615 | 70,075 | 55,535 | 41,220 | ||||||
| Amarilo Res | 239,397 | 228,285 | 214,236 | 200,004 | 881,922 | 185,444 | 169,863 | 157,292 | 150,958 | 663,557 | 146,983 | 126,075 | 111,787 | 102,826 | 487,670 | 94,583 | 87,001 | 80,027 | 73,612 | 335,224 | 67,711 | 62,283 | 57,291 | 52,698 | 239,984 | 48,474 | 44,588 | 41,014 | 37,726 | 171,802 | 129,415 | 92,647 | ||||||
| Lubbock Res | 354,463 | 341,764 | 331,564 | 311,541 | 1,339,332 | 293,442 | 275,460 | 256,165 | 240,909 | 1,065,977 | 234,906 | 216,117 | 196,873 | 184,479 | 832,374 | 172,865 | 161,982 | 151,784 | 142,228 | 628,859 | 133,274 | 124,884 | 117,022 | 109,655 | 484,834 | 102,751 | 96,282 | 90,221 | 84,541 | 373,795 | 297,803 | 224,459 | ||||||
| Midland Res | 26,046 | 23,793 | 22,607 | 20,605 | 93,051 | 19,505 | 17,387 | 16,507 | 15,559 | 68,958 | 14,874 | 13,732 | 12,251 | 11,310 | 52,167 | 10,442 | 9,641 | 8,901 | 8,218 | 37,202 | 7,587 | 7,005 | 6,467 | 5,971 | 27,030 | 5,513 | 5,090 | 4,699 | 4,338 | 19,640 | 15,103 | 10,973 | ||||||
| Odessa Res | 11,033 | 10,817 | 10,746 | 10,086 | 42,681 | 8,775 | 8,358 | 8,057 | 8,215 | 33,406 | 7,548 | 6,881 | 6,383 | 6,044 | 26,855 | 5,723 | 5,419 | 5,131 | 4,858 | 21,130 | 4,600 | 4,356 | 4,124 | 3,905 | 16,986 | 3,698 | 3,502 | 3,316 | 3,139 | 13,654 | 11,641 | 9,349 | ||||||
| Wichita Falls Res | 96,107 | 92,846 | 89,784 | 86,619 | 365,357 | 81,221 | 79,038 | 75,315 | 71,703 | 307,277 | 70,699 | 65,278 | 61,129 | 58,526 | 255,632 | 56,033 | 53,647 | 51,363 | 49,175 | 210,219 | 47,081 | 45,076 | 43,157 | 41,319 | 176,633 | 39,559 | 37,875 | 36,262 | 34,718 | 148,414 | 129,436 | 108,734 | ||||||
| Total Major Markets Res | 807,153 | 773,458 | 741,886 | 697,088 | 3,019,586 | 650,957 | 607,473 | 566,009 | 536,824 | 2,361,263 | 523,944 | 473,219 | 429,500 | 401,317 | 1,827,981 | 375,045 | 350,550 | 327,710 | 306,409 | 1,359,713 | 286,540 | 268,006 | 250,713 | 234,576 | 1,039,835 | 219,515 | 205,456 | 192,332 | 180,077 | 797,380 | 638,932 | 487,381 | ||||||
| Minor Markets Bus & Res | 457,306 | 424,630 | 388,336 | 382,764 | 1,653,037 | 369,049 | 346,603 | 373,749 | 316,756 | 1,406,157 | 312,473 | 241,445 | 214,846 | 198,393 | 967,156 | 183,200 | 169,170 | 156,215 | 144,252 | 652,838 | 133,205 | 123,004 | 113,585 | 104,886 | 474,680 | 96,854 | 89,437 | 82,588 | 76,263 | 345,142 | 255,766 | 185,790 | ||||||
| Resale Bus & Res | 501,479 | 501,985 | 503,996 | 472,821 | 1,980,281 | 467,882 | 421,943 | 413,096 | 401,755 | 1,704,676 | 385,818 | 329,330 | 305,282 | 288,807 | 1,309,236 | 273,221 | 258,476 | 244,527 | 231,331 | 1,007,556 | 218,847 | 207,037 | 195,864 | 185,294 | 807,042 | 175,294 | 165,834 | 156,885 | 148,419 | 646,432 | 548,422 | 438,927 | ||||||
| Xfone USA | 1,740,207 | 1,624,772 | 1,551,327 | 1,464,556 | 6,380,862 | 1,422,062 | 1,444,504 | 1,354,702 | 1,282,520 | 5,503,789 | 1,203,302 | 1,213,683 | 1,165,136 | 1,118,530 | 4,700,651 | 1,073,789 | 1,030,838 | 989,604 | 950,020 | 4,044,251 | 912,019 | 875,538 | 840,517 | 806,896 | 3,434,970 | 774,620 | 743,635 | 713,890 | 685,334 | 2,917,480 | 2,450,683 | 2,058,574 | ||||||
| Total CLEC Revenue | 6,340,138 | 6,106,321 | 5,983,630 | 5,739,493 | 24,169,581 | 5,571,592 | 5,433,343 | 5,178,704 | 4,931,896 | 21,115,536 | 4,764,954 | 4,443,050 | 4,180,206 | 3,964,661 | 17,352,871 | 3,747,310 | 3,548,203 | 3,387,320 | 3,233,023 | 13,915,856 | 3,087,360 | 2,945,162 | 2,810,090 | 2,686,214 | 11,528,826 | 2,572,640 | 2,464,434 | 2,361,310 | 2,263,001 | 9,661,384 | 8,296,520 | 6,999,890 | ||||||
| Other Non-Fiber Revenue | ||||||||||||||||||||||||||||||||||||||
| Business | 1,139,894 | 1,022,918 | 1,061,623 | 981,816 | 4,206,251 | 933,808 | 902,369 | 937,111 | 890,985 | 3,664,273 | 896,506 | 984,672 | 953,447 | 933,873 | 3,768,497 | 914,700 | 895,922 | 877,528 | 859,513 | 3,547,663 | 841,867 | 824,584 | 807,655 | 791,074 | 3,265,180 | 774,834 | 758,926 | 743,346 | 728,085 | 3,005,190 | 2,852,517 | 2,623,931 | ||||||
| Carrier | 2,844,888 | 2,937,663 | 2,973,746 | 2,994,592 | 11,750,889 | 2,875,911 | 2,706,897 | 2,706,989 | 2,944,299 | 11,234,096 | 2,763,634 | 2,651,233 | 2,624,720 | 2,598,473 | 10,638,061 | 2,572,488 | 2,546,764 | 2,521,296 | 2,496,083 | 10,136,631 | 2,471,122 | 2,446,411 | 2,421,947 | 2,397,727 | 9,737,207 | 2,373,750 | 2,350,013 | 2,326,512 | 2,303,247 | 9,353,523 | 8,979,382 | 8,620,206 | ||||||
| Equipment | 247,048 | 306,254 | 200,338 | 191,963 | 945,603 | 259,871 | 367,629 | 418,435 | 236,318 | 1,282,253 | 221,551 | 398,215 | 398,215 | 398,215 | 1,416,195 | 398,215 | 398,215 | 398,215 | 398,215 | 1,592,860 | 398,215 | 398,215 | 398,215 | 398,215 | 1,592,860 | 398,215 | 398,215 | 398,215 | 398,215 | 1,592,860 | 1,592,860 | 1,592,860 | ||||||
| Residential | 216,285 | 206,248 | 207,690 | 185,848 | 816,072 | 276,344 | 430,220 | 379,628 | 365,922 | 1,452,114 | 468,125 | 613,036 | 544,695 | 542,917 | 2,168,774 | 541,145 | 539,379 | 537,618 | 535,863 | 2,154,005 | 534,114 | 532,370 | 530,633 | 528,900 | 2,126,017 | 527,174 | 525,453 | 523,738 | 522,028 | 2,098,393 | 2,074,547 | 2,047,592 | ||||||
| Other | 1,169 | 1,084 | 1,043 | 1,036 | 4,331 | 897 | 846 | 757 | 3,702 | 6,202 | 621 | 670 | 574 | 574 | 2,440 | 574 | 574 | 574 | 574 | 2,297 | 574 | 574 | 574 | 574 | 2,297 | 574 | 574 | 574 | 574 | 2,297 | 2,297 | 2,297 | ||||||
| 4,449,284 | 4,474,167 | 4,444,439 | 4,355,256 | 17,723,146 | 4,346,831 | 4,407,961 | 4,442,920 | 4,441,226 | 17,638,938 | 4,350,438 | 4,647,826 | 4,521,652 | 4,474,052 | 17,993,968 | 4,427,123 | 4,380,853 | 4,335,232 | 4,290,248 | 17,433,456 | 4,245,893 | 4,202,154 | 4,159,024 | 4,116,491 | 16,723,562 | 4,074,547 | 4,033,181 | 3,992,385 | 3,952,150 | 16,052,263 | 15,501,603 | 14,886,887 | |||||||
| Carrier Access Billing | 199,319 | 223,992 | 201,387 | 188,352 | 813,050 | 190,521 | 183,103 | 171,211 | 170,674 | 715,508 | 155,264 | 176,360 | 174,561 | 172,781 | 678,966 | 171,019 | 169,275 | 167,549 | 165,840 | 673,683 | 164,149 | 162,475 | 160,818 | 159,178 | 646,620 | 157,555 | 155,948 | 154,358 | 152,784 | 620,644 | 595,327 | 571,043 | ||||||
| Rent Income | 198,615 | 186,025 | 205,806 | 214,465 | 804,910 | 186,908 | 183,328 | 194,604 | 175,940 | 740,780 | 162,877 | 165,186 | 158,579 | 152,235 | 638,877 | 146,146 | 140,300 | 134,688 | 129,301 | 550,435 | 124,129 | 119,164 | 114,397 | 109,821 | 467,510 | 105,428 | 101,211 | 97,163 | 93,276 | 397,078 | 333,546 | 280,178 | ||||||
| Cable TV Service | 0 | 0 | 360,579 | 442,937 | 803,516 | 587,243 | 527,641 | 482,864 | 450,197 | 2,047,945 | ||||||||||||||||||||||||||||
| Total Other Revenue | 4,847,218 | 4,884,184 | 5,212,211 | 5,201,010 | 20,144,623 | 5,311,503 | 5,302,033 | 5,291,598 | 5,238,037 | 21,143,170 | 4,668,578 | 4,989,372 | 4,854,792 | 4,799,069 | 19,311,811 | 4,744,288 | 4,690,428 | 4,637,469 | 4,585,389 | 18,657,574 | 4,534,170 | 4,483,793 | 4,434,239 | 4,385,490 | 17,837,692 | 4,337,530 | 4,290,340 | 4,243,906 | 4,198,210 | 17,069,986 | 16,430,475 | 15,738,108 | ||||||
| Total Non Fiber Revenue (before reconciliation) | 11,187,356 | 10,990,505 | 11,195,841 | 10,940,503 | 44,314,204 | 10,883,095 | 10,735,376 | 10,470,302 | 10,169,933 | 42,258,706 | 9,433,532 | 9,432,421 | 9,034,998 | 8,763,730 | 36,664,682 | 8,491,599 | 8,238,631 | 8,024,789 | 7,818,412 | 32,573,431 | 7,621,530 | 7,428,955 | 7,244,329 | 7,071,704 | 29,366,519 | 6,910,170 | 6,754,774 | 6,605,216 | 6,461,210 | 26,731,370 | 24,726,995 | 22,737,998 | ||||||
| Variable COGS | ||||||||||||||||||||||||||||||||||||||
| CLEC | 2,999,999 | 3,073,526 | 3,055,007 | 2,910,511 | 12,039,043 | 2,746,102 | 2,690,682 | 2,595,521 | 2,544,179 | 10,576,484 | 2,439,844 | 2,301,039 | 2,164,914 | 2,053,284 | 8,959,081 | 1,940,718 | 1,837,601 | 1,754,281 | 1,674,371 | 7,206,971 | 1,598,932 | 1,525,289 | 1,455,336 | 1,391,180 | 5,970,737 | 1,332,361 | 1,276,321 | 1,222,914 | 1,172,000 | 5,003,596 | 4,296,738 | 3,625,218 | ||||||
| Business | 284,974 | 255,730 | 265,406 | 245,454 | 1,051,563 | 233,452 | 225,592 | 234,278 | 222,746 | 916,068 | 224,127 | 246,168 | 238,362 | 233,468 | 942,124 | 228,675 | 223,980 | 219,382 | 214,878 | 886,916 | 210,467 | 206,146 | 201,914 | 197,769 | 816,295 | 193,708 | 189,732 | 185,836 | 182,021 | 751,298 | 713,129 | 655,983 | ||||||
| Carrier | 1,321,840 | 1,398,676 | 1,370,258 | 1,299,574 | 5,390,348 | 1,302,318 | 1,250,717 | 1,272,855 | 1,237,183 | 5,063,073 | 1,167,575 | 1,186,715 | 1,189,903 | 1,183,894 | 4,728,087 | 1,177,915 | 1,171,967 | 1,166,049 | 1,160,160 | 4,676,091 | 1,148,558 | 1,142,758 | 1,136,987 | 1,131,246 | 4,559,549 | 1,125,533 | 1,119,849 | 1,114,194 | 1,108,567 | 4,468,142 | 4,408,267 | 4,316,575 | ||||||
| Equipment | 244,353 | 102,763 | 157,113 | 125,780 | 630,009 | 152,716 | 145,869 | 201,706 | 135,729 | 636,020 | 80,252 | 182,537 | 205,146 | 205,146 | 673,081 | 205,146 | 205,146 | 205,146 | 205,146 | 820,584 | 205,146 | 205,146 | 205,146 | 205,146 | 820,584 | 205,146 | 205,146 | 205,146 | 205,146 | 820,584 | 820,584 | 820,584 | ||||||
| Residential | 129,771 | 123,749 | 124,614 | 111,509 | 489,643 | 165,807 | 258,132 | 227,777 | 219,553 | 871,268 | 280,875 | 367,822 | 326,817 | 325,750 | 1,301,265 | 324,687 | 323,627 | 322,571 | 321,518 | 1,292,403 | 320,468 | 319,422 | 318,380 | 317,340 | 1,275,610 | 316,304 | 315,272 | 314,243 | 313,217 | 1,259,036 | 1,244,728 | 1,228,555 | ||||||
| Cable TV Services | 0 | 0 | 156,001 | 292,784 | 448,785 | 322,977 | 295,571 | 296,015 | 262,725 | 1,177,288 | 0 | 0 | 0 | 0 | 0 | 0 | 0 | 0 | 0 | 0 | 0 | 0 | 0 | 0 | 0 | 0 | 0 | 0 | 0 | 0 | 0 | 0 | ||||||
| Total variable COGS | 4,980,937 | 4,954,444 | 5,128,398 | 4,985,612 | 20,049,391 | 4,923,372 | 4,866,563 | 4,828,151 | 4,622,115 | 19,240,202 | 4,192,673 | 4,284,281 | 4,125,142 | 4,001,542 | 16,603,638 | 3,877,142 | 3,762,322 | 3,667,428 | 3,576,073 | 14,882,965 | 3,483,572 | 3,398,761 | 3,317,762 | 3,242,681 | 13,442,776 | 3,173,052 | 3,106,319 | 3,042,333 | 2,980,951 | 12,302,655 | 11,483,446 | 10,646,915 | ||||||
| Fixed COGS | 881,573 | 826,328 | 829,302 | 817,283 | 3,354,486 | 856,756 | 750,078 | 703,359 | 702,374 | 3,012,567 | 677,258 | 640,647 | 634,241 | 627,898 | 2,580,044 | 621,619 | 615,403 | 609,249 | 603,157 | 2,449,428 | 597,125 | 591,154 | 585,242 | 579,390 | 2,352,911 | 573,596 | 567,860 | 562,181 | 556,560 | 2,260,197 | 2,169,789 | 2,082,997 | ||||||
| Total non Fiber COGS before adjustment | 5,862,510 | 5,780,771 | 5,957,700 | 5,802,895 | 23,403,877 | 5,780,127 | 5,616,641 | 5,531,510 | 5,324,489 | 22,252,768 | 4,869,931 | 4,924,928 | 4,759,382 | 4,629,441 | 19,183,682 | 4,498,761 | 4,377,725 | 4,276,677 | 4,179,229 | 17,332,393 | 4,080,697 | 3,989,915 | 3,903,004 | 3,822,071 | 15,795,687 | 3,746,648 | 3,674,179 | 3,604,514 | 3,537,510 | 14,562,852 | 13,653,235 | 12,729,912 | ||||||
| Reconciliation adjustment | 321,564 | 227,106 | 197,470 | 301,270 | 1,047,411 | 218,847 | 4,382 | 1,943 | 216,551 | 441,723 | 324,181 | 335,620 | 150,000 | 150,000 | 959,802 | 150,000 | 150,000 | 150,000 | 150,000 | 600,000 | 150,000 | 150,000 | 150,000 | 150,000 | 600,000 | 150,000 | 150,000 | 150,000 | 150,000 | 600,000 | 600,000 | 600,000 | ||||||
| Total non fiber COGS | 6,184,075 | 6,007,878 | 6,155,170 | 6,104,165 | 24,451,288 | 5,998,974 | 5,621,023 | 5,533,454 | 5,541,040 | 22,694,491 | 5,194,112 | 5,260,548 | 4,909,382 | 4,779,441 | 20,143,483 | 4,648,761 | 4,527,725 | 4,426,677 | 4,329,229 | 17,932,393 | 4,230,697 | 4,139,915 | 4,053,004 | 3,972,071 | 16,395,687 | 3,896,648 | 3,824,179 | 3,754,514 | 3,687,510 | 15,162,852 | 14,253,235 | 13,329,912 | ||||||
| Non Fiber Revenue Drivers | ||||||||||||||||||||||||||||||||||||||
| Abiline Bus | ||||||||||||||||||||||||||||||||||||||
| count | 866 | 856 | 851 | 836 | 817 | 783 | 752 | 735 | 710 | 689 | 657 | 603 | 553 | 506 | 487 | 469 | 452 | 435 | 419 | 403 | 388 | 374 | 360 | 346 | 298 | 256 | ||||||||||||
| % growth | -1.2% | -0.6% | -1.8% | -2.3% | -4.2% | -4.0% | -2.3% | -3.4% | -3.0% | -4.6% | -8.3% | -18.0% | -8.2% | -8.6% | -3.7% | -3.7% | -22.1% | -3.7% | -3.7% | -3.7% | -3.7% | -14.0% | -3.7% | -3.7% | -3.8% | -3.8% | -14.2% | -14.0% | -14.0% | |||||||||
| ARPU | $234 | $237 | $236 | $236 | $234 | $239 | $238 | $239 | $242 | $245 | $246 | $247 | $249 | $250 | $251 | $253 | $254 | $255 | $256 | $258 | $259 | $260 | $262 | $263 | $268 | $274 | ||||||||||||
| % growth | 1.2% | -0.6% | 0.1% | -0.8% | 2.0% | -0.3% | 0.6% | 1.1% | 1.2% | 0.5% | 0.5% | 0.5% | 0.5% | 0.5% | 0.5% | 0.5% | 0.5% | 0.5% | 0.5% | 0.5% | 0.5% | 0.5% | 0.5% | 2.0% | 2.0% | |||||||||||||
| Abilene Res | ||||||||||||||||||||||||||||||||||||||
| count | 671 | 621 | 576 | 536 | 499 | 453 | 416 | 387 | 365 | 350 | 322 | 296 | 273 | 251 | 231 | 212 | 195 | 180 | 165 | 152 | 140 | 129 | 118 | 109 | 78 | 56 | ||||||||||||
| % growth | -7.5% | -7.2% | -6.9% | -6.9% | -9.2% | -8.2% | -7.0% | -5.7% | -4.1% | -8.0% | -8.0% | -23.5% | -8.0% | -8.0% | -8.0% | -8.0% | -28.4% | -8.0% | -8.0% | -8.0% | -8.0% | -28.4% | -8.0% | -8.0% | -8.0% | -8.0% | -28.4% | -28.4% | -28.4% | |||||||||
| ARPU | $39 | $39 | $41 | $41 | $41 | $41 | $41 | $42 | $43 | $42 | $43 | $43 | $43 | $44 | $44 | $44 | $45 | $45 | $46 | $46 | $47 | $47 | $47 | $48 | $50 | $51 | ||||||||||||
| % growth | 1.2% | 3.9% | 1.3% | -1.8% | 1.3% | -0.6% | 1.4% | 3.7% | -2.3% | 0.9% | 0.9% | 0.9% | 0.9% | 0.9% | 0.9% | 0.9% | 0.9% | 0.9% | 0.9% | 0.9% | 0.9% | 0.9% | 0.9% | 3.6% | 3.6% | |||||||||||||
| Amarillo Bus | ||||||||||||||||||||||||||||||||||||||
| count | 1,357 | 1,303 | 1,274 | 1,240 | 1,196 | 1,151 | 1,103 | 1,073 | 1,045 | 1,005 | 965 | 919 | 835 | 757 | 704 | 653 | 623 | 595 | 567 | 541 | 515 | 491 | 468 | 445 | 374 | 314 | ||||||||||||
| % growth | -4.0% | -2.2% | -2.7% | -3.5% | -3.8% | -4.2% | -2.7% | -2.6% | -3.8% | -4.0% | -4.8% | -14.4% | -9.1% | -9.4% | -7.0% | -7.2% | -28.9% | -4.6% | -4.6% | -4.6% | -4.7% | -17.2% | -4.7% | -4.7% | -4.8% | -4.8% | -17.7% | -16.0% | -16.0% | |||||||||
| ARPU | $140 | $140 | $142 | $140 | $147 | $148 | $136 | $136 | $136 | $128 | $127 | $126 | $125 | $124 | $123 | $122 | $121 | $120 | $119 | $117 | $116 | $115 | $114 | $113 | $109 | $105 | ||||||||||||
| % growth | 0.2% | 0.8% | -1.2% | 5.4% | 0.1% | -7.8% | 0.2% | 0.2% | -5.9% | -0.9% | -0.9% | -0.9% | -0.9% | -0.9% | -0.9% | -0.9% | -0.9% | -0.9% | -0.9% | -0.9% | -0.9% | -0.9% | -0.9% | -3.6% | -3.6% | |||||||||||||
| Amarillos Res | ||||||||||||||||||||||||||||||||||||||
| count | 1,936 | 1,824 | 1,673 | 1,540 | 1,439 | 1,318 | 1,230 | 1,158 | 1,094 | 1,007 | 926 | 852 | 784 | 721 | 664 | 611 | 562 | 517 | 475 | 437 | 402 | 370 | 341 | 313 | 224 | 161 | ||||||||||||
| % growth | -5.8% | -8.3% | -7.9% | -6.6% | -8.4% | -6.7% | -5.9% | -5.5% | -8.0% | -8.0% | -8.0% | -26.4% | -8.0% | -8.0% | -8.0% | -8.0% | -28.4% | -8.0% | -8.0% | -8.0% | -8.0% | -28.4% | -8.0% | -8.0% | -8.0% | -8.0% | -28.4% | -28.4% | -28.4% | |||||||||
| ARPU | $40 | $41 | $41 | $42 | $42 | $42 | $42 | $43 | $43 | $40 | $40 | $40 | $40 | $40 | $40 | $40 | $40 | $40 | $40 | $40 | $40 | $40 | $40 | $40 | $40 | $40 | ||||||||||||
| % growth | 1.0% | 1.4% | 1.7% | -0.5% | -0.8% | 0.0% | 2.8% | 1.4% | -7.1% | 0.0% | 0.0% | 0.0% | 0.0% | 0.0% | 0.0% | 0.0% | 0.0% | 0.0% | 0.0% | 0.0% | 0.0% | 0.0% | 0.0% | -0.1% | -0.1% | |||||||||||||
| Lubbock Bus | ||||||||||||||||||||||||||||||||||||||
| count | 1,217 | 1,188 | 1,172 | 1,154 | 1,123 | 1,103 | 1,068 | 1,025 | 999 | 960 | 926 | 894 | 863 | 832 | 803 | 775 | 748 | 722 | 697 | 672 | 649 | 626 | 604 | 583 | 501 | 431 | ||||||||||||
| % growth | -2.4% | -1.3% | -1.5% | -2.7% | -1.8% | -3.2% | -4.0% | -2.5% | -3.9% | -3.5% | -3.5% | -12.8% | -3.5% | -3.5% | -3.5% | -3.5% | -13.3% | -3.5% | -3.5% | -3.5% | -3.5% | -13.3% | -3.5% | -3.5% | -3.5% | -3.5% | -13.3% | -14.0% | -14.0% | |||||||||
| ARPU | $159 | $160 | $164 | $163 | $159 | $158 | $159 | $158 | $156 | $154 | $153 | $152 | $152 | $151 | $151 | $150 | $149 | $149 | $148 | $148 | $147 | $146 | $146 | $145 | $143 | $141 | ||||||||||||
| % growth | 0.4% | 2.4% | -0.6% | -2.4% | -0.4% | 0.3% | -0.7% | -1.2% | -1.4% | -0.4% | -0.4% | -0.4% | -0.4% | -0.4% | -0.4% | -0.4% | -0.4% | -0.4% | -0.4% | -0.4% | -0.4% | -0.4% | -0.4% | -1.6% | -1.6% | |||||||||||||
| Lubbock Res | ||||||||||||||||||||||||||||||||||||||
| count | 2,803 | 2,626 | 2,490 | 2,330 | 2,181 | 2,067 | 1,924 | 1,785 | 1,694 | 1,583 | 1,472 | 1,369 | 1,273 | 1,184 | 1,101 | 1,024 | 952 | 886 | 824 | 766 | 713 | 663 | 616 | 573 | 429 | 321 | ||||||||||||
| % growth | -6.3% | -5.2% | -6.4% | -6.4% | -5.2% | -6.9% | -7.2% | -5.1% | -6.6% | -7.0% | -7.0% | -23.3% | -7.0% | -7.0% | -7.0% | -7.0% | -25.2% | -7.0% | -7.0% | -7.0% | -7.0% | -25.2% | -7.0% | -7.0% | -7.0% | -7.0% | -25.2% | -25.2% | -25.2% | |||||||||
| ARPU | $41 | $42 | $43 | $43 | $44 | $43 | $43 | $44 | $45 | $44 | $45 | $45 | $45 | $46 | $46 | $46 | $47 | $47 | $47 | $48 | $48 | $48 | $49 | $49 | $50 | $50 | ||||||||||||
| % growth | 2.7% | 2.3% | 0.1% | 0.8% | -0.9% | -0.5% | 1.5% | 2.4% | -1.6% | 0.8% | 0.8% | 0.8% | 0.8% | 0.8% | 0.8% | 0.8% | 0.8% | 0.8% | 0.8% | 0.8% | 0.8% | 0.8% | 0.8% | 0.8% | 0.8% | |||||||||||||
| Midland Bus | ` | |||||||||||||||||||||||||||||||||||||
| count | 573 | 568 | 554 | 541 | 528 | 520 | 512 | 497 | 500 | 484 | 469 | 455 | 442 | 428 | 416 | 402 | 382 | 365 | 348 | 337 | 327 | 317 | 307 | 298 | 262 | 230 | ||||||||||||
| % growth | -0.9% | -2.5% | -2.3% | -2.4% | -1.5% | -1.5% | -2.9% | 0.6% | -3.2% | -3.0% | -3.0% | -8.4% | -3.0% | -3.0% | -3.0% | -3.4% | -11.8% | -4.7% | -4.6% | -4.7% | -3.1% | -16.1% | -3.1% | -3.1% | -3.1% | -3.1% | -11.7% | -12.1% | -12.1% | |||||||||
| ARPU | $252 | $251 | $272 | $269 | $261 | $261 | $257 | $255 | $257 | $265 | $267 | $268 | $270 | $271 | $273 | $275 | $276 | $278 | $280 | $281 | $283 | $285 | $287 | $288 | $295 | $303 | ||||||||||||
| % growth | -0.2% | 8.3% | -1.0% | -3.1% | -0.1% | -1.5% | -0.6% | 0.4% | 3.3% | 0.6% | 0.6% | 0.6% | 0.6% | 0.6% | 0.6% | 0.6% | 0.6% | 0.6% | 0.6% | 0.6% | 0.6% | 0.6% | 0.6% | 2.4% | 2.4% | |||||||||||||
| Midland Res | ||||||||||||||||||||||||||||||||||||||
| count | 209 | 188 | 171 | 160 | 151 | 137 | 129 | 119 | 111 | 105 | 97 | 89 | 82 | 75 | 69 | 64 | 59 | 54 | 50 | 46 | 42 | 39 | 36 | 33 | 23 | 17 | ||||||||||||
| % growth | -10.0% | -9.0% | -6.4% | -5.6% | -9.3% | -5.8% | -7.8% | -6.7% | -5.4% | -8.0% | -8.0% | -25.3% | -8.0% | -8.0% | -8.0% | -8.0% | -28.4% | -8.0% | -8.0% | -8.0% | -8.0% | -28.4% | -8.0% | -8.0% | -8.0% | -8.0% | -28.4% | -28.4% | -28.4% | |||||||||
| ARPU | $41 | $41 | $43 | $42 | $42 | $41 | $42 | $42 | $43 | $42 | $42 | $42 | $43 | $43 | $43 | $43 | $43 | $43 | $43 | $44 | $44 | $44 | $44 | $44 | $45 | $46 | ||||||||||||
| % growth | -0.9% | 5.0% | -1.8% | 0.4% | -2.0% | 1.2% | 2.0% | 0.8% | -1.4% | 0.4% | 0.4% | 0.4% | 0.4% | 0.4% | 0.4% | 0.4% | 0.4% | 0.4% | 0.4% | 0.4% | 0.4% | 0.4% | 0.4% | 1.4% | 1.4% | |||||||||||||
| Odessa Bus | ||||||||||||||||||||||||||||||||||||||
| count | 394 | 388 | 379 | 367 | 364 | 365 | 360 | 354 | 350 | 346 | 339 | 332 | 326 | 319 | 313 | 307 | 299 | 286 | 274 | 262 | 257 | 251 | 246 | 241 | 222 | 204 | ||||||||||||
| % growth | -1.5% | -2.3% | -3.2% | -0.8% | 0.3% | -1.4% | -1.7% | -1.1% | -1.1% | -2.0% | -2.0% | -6.1% | -2.0% | -2.0% | -2.0% | -2.0% | -7.8% | -2.5% | -4.3% | -4.2% | -4.3% | -14.5% | -2.1% | -2.1% | -2.1% | -2.1% | -8.1% | -8.1% | -8.1% | |||||||||
| ARPU | $237 | $238 | $251 | $251 | $262 | $254 | $261 | $259 | $260 | $244 | $245 | $246 | $247 | $248 | $249 | $250 | $251 | $252 | $253 | $254 | $255 | $256 | $257 | $258 | $262 | $266 | ||||||||||||
| % growth | 0.6% | 5.3% | 0.0% | 4.6% | -3.0% | 2.7% | -0.8% | 0.3% | -6.0% | 0.4% | 0.4% | 0.4% | 0.4% | 0.4% | 0.4% | 0.4% | 0.4% | 0.4% | 0.4% | 0.4% | 0.4% | 0.4% | 0.4% | 1.6% | 1.6% | |||||||||||||
| Odessa Res | ||||||||||||||||||||||||||||||||||||||
| count | 86 | 85 | 81 | 72 | 64 | 61 | 59 | 56 | 51 | 48 | 45 | 42 | 39 | 37 | 34 | 32 | 30 | 28 | 26 | 25 | 23 | 21 | 20 | 19 | 14 | 11 | ||||||||||||
| % growth | -1.2% | -4.7% | -11.1% | -11.1% | -4.7% | -3.3% | -5.1% | -8.9% | -5.9% | -6.5% | -6.5% | -25.1% | -6.5% | -6.5% | -6.5% | -6.5% | -23.6% | -6.5% | -6.5% | -6.5% | -6.5% | -23.6% | -6.5% | -6.5% | -6.5% | -6.5% | -23.6% | -23.6% | -23.6% | |||||||||
| ARPU | $42 | $43 | $44 | $45 | $43 | $45 | $45 | $48 | $47 | $47 | $47 | $48 | $49 | $49 | $50 | $50 | $51 | $52 | $52 | $53 | $54 | $54 | $55 | $56 | $59 | $62 | ||||||||||||
| % growth | 1.5% | 2.2% | 3.0% | -3.1% | 4.6% | -1.5% | 6.7% | -1.8% | -0.1% | 1.3% | 1.3% | 1.3% | 1.3% | 1.3% | 1.3% | 1.3% | 1.3% | 1.3% | 1.3% | 1.3% | 1.3% | 1.3% | 1.3% | 5.1% | 5.1% | |||||||||||||
| Wichita Falls Bus | ||||||||||||||||||||||||||||||||||||||
| count | 667 | 651 | 634 | 617 | 602 | 589 | 580 | 560 | 505 | 454 | 411 | 372 | 334 | 316 | 299 | 283 | 268 | 254 | 240 | 227 | 215 | 203 | 192 | 181 | 141 | 109 | ||||||||||||
| % growth | -2.4% | -2.6% | -2.7% | -2.4% | -2.2% | -1.5% | -3.4% | -9.8% | -10.1% | -9.4% | -9.6% | -33.6% | -10.3% | -5.3% | -5.3% | -5.3% | -23.9% | -5.3% | -5.4% | -5.4% | -5.4% | -19.8% | -5.4% | -5.5% | -5.5% | -5.5% | -20.2% | -22.2% | -22.8% | |||||||||
| ARPU | $172 | $166 | $170 | $167 | $164 | $174 | $157 | $155 | $152 | $134 | $131 | $127 | $124 | $121 | $118 | $114 | $111 | $109 | $106 | $103 | $100 | $98 | $95 | $93 | $83 | $74 | ||||||||||||
| % growth | -3.4% | 2.2% | -1.6% | -2.3% | 6.1% | -9.6% | -1.1% | -2.0% | -11.8% | -2.6% | -2.6% | -2.6% | -2.6% | -2.6% | -2.6% | -2.6% | -2.6% | -2.6% | -2.6% | -2.6% | -2.6% | -2.6% | -2.6% | -10.4% | -10.4% | |||||||||||||
| Wichita Falls Res | ||||||||||||||||||||||||||||||||||||||
| count | 767 | 725 | 695 | 659 | 621 | 603 | 574 | 542 | 520 | 491 | 467 | 445 | 423 | 403 | 383 | 365 | 347 | 330 | 314 | 299 | 285 | 271 | 258 | 245 | 201 | 165 | ||||||||||||
| % growth | -5.5% | -4.1% | -5.2% | -5.8% | -2.9% | -4.8% | -5.6% | -4.1% | -5.6% | -4.8% | -4.8% | -18.0% | -4.8% | -4.8% | -4.8% | -4.8% | -18.0% | -4.8% | -4.8% | -4.8% | -4.8% | -18.0% | -4.8% | -4.8% | -4.8% | -4.8% | -18.0% | -18.0% | -18.0% | |||||||||
| ARPU | $41 | $42 | $42 | $43 | $43 | $43 | $43 | $43 | $44 | $43 | $44 | $44 | $44 | $44 | $45 | $45 | $45 | $45 | $46 | $46 | $46 | $47 | $47 | $47 | $48 | $49 | ||||||||||||
| % growth | 1.8% | 1.3% | 1.9% | -1.7% | 2.3% | -1.6% | 1.0% | 2.5% | -2.1% | 0.6% | 0.6% | 0.6% | 0.6% | 0.6% | 0.6% | 0.6% | 0.6% | 0.6% | 0.6% | 0.6% | 0.6% | 0.6% | 0.6% | 2.4% | 2.4% | |||||||||||||
| Minor Markets Bus & Res | ||||||||||||||||||||||||||||||||||||||
| count | 1,790 | 1,714 | 1,637 | 1,569 | 1,509 | 1,454 | 1,371 | 1,241 | 1,167 | 1,051 | 983 | 919 | 859 | 803 | 751 | 702 | 657 | 614 | 574 | 537 | 502 | 469 | 439 | 410 | 313 | 240 | ||||||||||||
| % growth | -4.2% | -4.5% | -4.2% | -3.8% | -3.6% | -5.7% | -9.5% | -6.0% | -9.9% | -6.5% | -6.5% | -26.0% | -6.5% | -6.5% | -6.5% | -6.5% | -23.6% | -6.5% | -6.5% | -6.5% | -6.5% | -23.6% | -6.5% | -6.5% | -6.5% | -6.5% | -23.6% | -23.6% | -23.6% | |||||||||
| ARPU | $85 | $81 | $78 | $80 | $80 | $78 | $89 | $83 | $86 | $74 | $73 | $72 | $71 | $70 | $69 | $68 | $68 | $67 | $66 | $65 | $64 | $64 | $63 | $62 | $59 | $56 | ||||||||||||
| % growth | -4.3% | -3.8% | 3.1% | 0.0% | -2.4% | 13.2% | -6.6% | 4.0% | -14.3% | -1.2% | -1.2% | -1.2% | -1.2% | -1.2% | -1.2% | -1.2% | -1.2% | -1.2% | -1.2% | -1.2% | -1.2% | -1.2% | -1.2% | -5.0% | -5.0% | |||||||||||||
| Resale | ||||||||||||||||||||||||||||||||||||||
| count | 1,396 | 1,331 | 1,254 | 1,183 | 1,097 | 1,037 | 966 | 920 | 866 | 827 | 773 | 723 | 676 | 632 | 591 | 553 | 517 | 483 | 452 | 422 | 395 | 369 | 345 | 323 | 247 | 189 | ||||||||||||
| % growth | -4.7% | -5.8% | -5.7% | -7.3% | -5.5% | -6.8% | -4.8% | -5.9% | -4.5% | -6.5% | -6.5% | -21.4% | -6.5% | -6.5% | -6.5% | -6.5% | -23.6% | -6.5% | -6.5% | -6.5% | -6.5% | -23.6% | -6.5% | -6.5% | -6.5% | -6.5% | -23.6% | -23.6% | -23.6% | |||||||||
| ARPU | $118 | $124 | $131 | $130 | $139 | $133 | $139 | $143 | $143 | $130 | $132 | $133 | $135 | $136 | $138 | $140 | $141 | $143 | $145 | $146 | $148 | $150 | $151 | $153 | $161 | $168 | ||||||||||||
| % growth | 4.6% | 5.9% | -0.6% | 6.5% | -4.5% | 4.6% | 3.3% | 0.1% | -9.2% | 1.2% | 1.2% | 1.2% | 1.2% | 1.2% | 1.2% | 1.2% | 1.2% | 1.2% | 1.2% | 1.2% | 1.2% | 1.2% | 1.2% | 4.7% | 4.7% | |||||||||||||
| Business (other) | ||||||||||||||||||||||||||||||||||||||
| count | 4,043 | 3,965 | 3,805 | 3,654 | 3,614 | 3,495 | 3,371 | 3,247 | 3,270 | 3,233 | 3,136 | 3,042 | 2,951 | 2,862 | 2,776 | 2,693 | 2,612 | 2,534 | 2,458 | 2,384 | 2,313 | 2,243 | 2,176 | 2,111 | 1,869 | 1,654 | ||||||||||||
| % growth | -1.9% | -4.0% | -4.0% | -1.1% | -3.3% | -3.5% | -3.7% | 0.7% | -1.1% | -3.0% | -3.0% | -6.3% | -3.0% | -3.0% | -3.0% | -3.0% | -11.5% | -3.0% | -3.0% | -3.0% | -3.0% | -11.5% | -3.0% | -3.0% | -3.0% | -3.0% | -11.5% | -11.5% | -11.5% | |||||||||
| ARPU | $93 | $86 | $92 | $88 | $86 | $85 | $91 | $90 | $92 | $100 | $101 | $102 | $103 | $104 | $105 | $106 | $107 | $108 | $110 | $111 | $112 | $113 | $114 | $115 | $119 | $124 | ||||||||||||
| % growth | -7.6% | 6.9% | -4.3% | -2.3% | -1.4% | 7.5% | -1.3% | 2.0% | 9.1% | 1.0% | 1.0% | 1.0% | 1.0% | 1.0% | 1.0% | 1.0% | 1.0% | 1.0% | 1.0% | 1.0% | 1.0% | 1.0% | 1.0% | 3.9% | 3.9% | |||||||||||||
| Carrier | ||||||||||||||||||||||||||||||||||||||
| % revenue growth | 3.3% | 1.2% | 0.7% | -4.0% | -5.9% | 0.0% | 8.8% | -6.1% | -4.1% | -1.0% | -1.0% | -5.3% | -1.0% | -1.0% | -1.0% | -1.0% | -4.7% | -1.0% | -1.0% | -1.0% | -1.0% | -3.9% | -1.0% | -1.0% | -1.0% | -1.0% | -3.9% | -4.0% | -4.0% | |||||||||
| Equipment | ||||||||||||||||||||||||||||||||||||||
| % revenue growth | 24.0% | -34.6% | -4.2% | 35.4% | 41.5% | 13.8% | -43.5% | -6.2% | 79.7% | 0.0% | 0.0% | 10.4% | 0.0% | 0.0% | 0.0% | 0.0% | 12.5% | 0.0% | 0.0% | 0.0% | 0.0% | 0.0% | 0.0% | 0.0% | 0.0% | 0.0% | 0.0% | 0.0% | 0.0% | |||||||||
| Residential | ||||||||||||||||||||||||||||||||||||||
| count | 5,707 | 5,402 | 4,943 | 4,611 | 5,784 | 5,594 | 5,132 | 4,783 | 5,385 | 5,274 | 5,257 | 5,240 | 5,223 | 5,205 | 5,188 | 5,172 | 5,155 | 5,138 | 5,121 | 5,104 | 5,088 | 5,071 | 5,055 | 5,038 | 4,973 | 4,908 | ||||||||||||
| % growth | -5.3% | -8.5% | -6.7% | 25.4% | -3.3% | -8.3% | -6.8% | 12.6% | -2.1% | -0.3% | -0.3% | 9.5% | -0.3% | -0.3% | -0.3% | -0.3% | -1.3% | -0.3% | -0.3% | -0.3% | -0.3% | -1.3% | -0.3% | -0.3% | -0.3% | -0.3% | -1.3% | -1.3% | -1.3% | |||||||||
| ARPU | $12 | $13 | $14 | $13 | $19 | $25 | $24 | $25 | $32 | $35 | $35 | $35 | $35 | $35 | $35 | $35 | $35 | $35 | $35 | $35 | $35 | $35 | $35 | $35 | $35 | $35 | ||||||||||||
| % growth | 2.1% | 7.7% | -2.5% | 42.9% | 32.7% | -4.6% | 4.9% | 28.3% | 7.5% | 0.0% | 0.0% | 0.0% | 0.0% | 0.0% | 0.0% | 0.0% | 0.0% | 0.0% | 0.0% | 0.0% | 0.0% | 0.0% | 0.0% | 0.0% | 0.0% | |||||||||||||
| Other | ||||||||||||||||||||||||||||||||||||||
| count | 2 | 2 | 2 | 2 | 2 | 2 | 2 | 2 | 2 | 2 | 2 | 2 | 2 | 2 | 2 | 2 | 2 | 2 | 2 | 2 | 2 | 2 | 2 | 2 | 2 | 2 | ||||||||||||
| % growth | 0.0% | 0.0% | 0.0% | 0.0% | 0.0% | 0.0% | 0.0% | 0.0% | 0.0% | 0.0% | 0.0% | 0.0% | 0.0% | 0.0% | 0.0% | 0.0% | 0.0% | 0.0% | 0.0% | 0.0% | 0.0% | 0.0% | 0.0% | 0.0% | 0.0% | 0.0% | 0.0% | 0.0% | 0.0% | |||||||||
| ARPU | $195 | $181 | $174 | $173 | $149 | $141 | $126 | $494 | $104 | $96 | $96 | $96 | $96 | $96 | $96 | $96 | $96 | $96 | $96 | $96 | $96 | $96 | $96 | $96 | $96 | $96 | ||||||||||||
| % growth | -7.3% | -3.8% | -0.7% | -13.4% | -5.7% | -10.6% | 291.4% | -79.0% | -7.5% | 0.0% | 0.0% | 0.0% | 0.0% | 0.0% | 0.0% | 0.0% | 0.0% | 0.0% | 0.0% | 0.0% | 0.0% | 0.0% | 0.0% | 0.0% | 0.0% | |||||||||||||
13
| 3Q 2013 | 4Q 2013 | 1Q 2014 | 2Q 2014 | 3Q 2014 | 4Q 2014 | 1Q 2015 | 2Q 2015 | 3Q 2015 | 4Q 2015 | 1Q 2016 | 2Q 2016 | 3Q 2016 | 4Q 2016 | 2017 | 2018 | ||
| Total Passings | 14,647 | 14,647 | 14,647 | 14,647 | 14,647 | 14,647 | 14,647 | 14,647 | 14,647 | 14,647 | 14,647 | 14,647 | 14,647 | ||||
| Total Customer count | |||||||||||||||||
| Beginning | 0 | 128 | 338 | 558 | 777 | 997 | 1,217 | 1,436 | 1,656 | 1,876 | 1,904 | 1,904 | 1,904 | ||||
| net additions | 128 | 210 | 220 | 220 | 220 | 220 | 220 | 220 | 220 | 28 | 0 | 0 | 0 | ||||
| Ending | 128 | 338 | 558 | 777 | 997 | 1,217 | 1,436 | 1,656 | 1,876 | 1,904 | 1,904 | 1,904 | 1,904 | ||||
| Total Revenue | $9,567 | $34,903 | $67,149 | $100,105 | $133,061 | $166,017 | $198,972 | $231,928 | $264,884 | $283,489 | $285,617 | $1,142,466 | $1,142,466 | ||||
| Estimated COGS | 5.0% | 478 | 1,745 | 3,357 | 5,005 | 6,653 | 8,301 | 9,949 | 11,596 | 13,244 | 14,174 | 14,281 | 57,123 | 57,123 | |||
| Marketing Costs | $50 | per new customer | 6,378 | 10,513 | 10,985 | 10,985 | 10,985 | 10,985 | 10,985 | 10,985 | 10,985 | 1,418 | 0 | 0 | 0 | ||
| Capex | |||||||||||||||||
| Beginning | $0 | 0 | 0 | 0 | 25,512 | 67,562 | 111,503 | 155,444 | 199,385 | 243,326 | 287,267 | 331,208 | 375,149 | 380,822 | 380,822 | 380,822 | |
| Capex Network | 0 | 0 | 0 | 0 | 0 | 0 | 0 | 0 | 0 | 0 | 0 | 0 | 0 | 0 | 0 | 0 | |
| Install cost /customer | $200 | 0 | 0 | 0 | 25,512 | 42,050 | 43,941 | 43,941 | 43,941 | 43,941 | 43,941 | 43,941 | 43,941 | 5,673 | 0 | 0 | 0 |
| Total capex | 0 | 0 | 0 | 25,512 | 67,562 | 111,503 | 155,444 | 199,385 | 243,326 | 287,267 | 331,208 | 375,149 | 380,822 | 380,822 | 380,822 | 380,822 | |
| Pride 1 | |||||||||||||||||
| Revenue | $9,007 | $31,524 | $58,544 | $85,564 | $112,584 | $139,605 | $166,625 | $193,645 | $220,665 | $234,176 | $234,176 | $936,702 | $936,702 | ||||
| Count | 0 | 120 | 300 | 480 | 660 | 841 | 1,021 | 1,201 | 1,381 | 1,561 | 1,561 | 1,561 | 1,561 | 1,561 | |||
| ARPU | $50 | $50 | $50 | $50 | $50 | $50 | $50 | $50 | $50 | $50 | $50 | $50 | $50 | ||||
| Passings | 12,009 | 12,009 | 12,009 | 12,009 | 12,009 | 12,009 | 12,009 | 12,009 | 12,009 | 12,009 | 12,009 | 12,009 | 12,009 | ||||
| Take Rate | 1.0% | 2.5% | 4.0% | 5.5% | 7.0% | 8.5% | 10.0% | 11.5% | 13.0% | 13.0% | 13.0% | 13.0% | 13.0% | ||||
| Pride 2 | |||||||||||||||||
| Revenue | $560 | $1,961 | $3,642 | $5,322 | $7,003 | $8,684 | $10,365 | $12,045 | $13,726 | $14,567 | $14,567 | $58,266 | $58,266 | ||||
| Count | 0 | 7 | 19 | 30 | 41 | 52 | 63 | 75 | 86 | 97 | 97 | 97 | 97 | 97 | |||
| ARPU | $50 | $50 | $50 | $50 | $50 | $50 | $50 | $50 | $50 | $50 | $50 | $50 | $50 | ||||
| Passings | 747 | 747 | 747 | 747 | 747 | 747 | 747 | 747 | 747 | 747 | 747 | 747 | 747 | ||||
| Take Rate | 1.0% | 2.5% | 4.0% | 5.5% | 7.0% | 8.5% | 10.0% | 11.5% | 13.0% | 13.0% | 13.0% | 13.0% | 13.0% | ||||
| Pride 3 | |||||||||||||||||
| Revenue | $1,418 | $4,964 | $9,219 | $13,473 | $17,728 | $21,983 | $26,238 | $30,492 | $34,747 | $36,875 | $147,498 | $147,498 | |||||
| Count | 0 | 19 | 47 | 76 | 104 | 132 | 161 | 189 | 217 | 246 | 246 | 246 | 246 | ||||
| ARPU | $50 | $50 | $50 | $50 | $50 | $50 | $50 | $50 | $50 | $50 | $50 | $50 | |||||
| Passings | 1,891 | 1,891 | 1,891 | 1,891 | 1,891 | 1,891 | 1,891 | 1,891 | 1,891 | 1,891 | 1,891 | 1,891 | 1,891 | ||||
| Take Rate | 1.0% | 2.5% | 4.0% | 5.5% | 7.0% | 8.5% | 10.0% | 11.5% | 13.0% | 13.0% | 13.0% | 13.0% | |||||
14
| Communities | Amount | Passings | Residential | Business | |||||
| Snyder | $7,773,056 | 4,079 | 3263 | 816 | |||||
| Sweetwater | $6,683,911 | 3,739 | 2991 | 748 | |||||
| Pampa | $15,111,672 | 8,075 | 6460 | 1,615 | |||||
| $29,568,639 | 15,893 | 12,714 | 3,179 | ||||||
| Equity Requirement | 10.0% | $2,956,864 | Equity needs to go in 2Q 2014 | ||||||
| Timeline | |||||||||
| Application Submitted | Oct-13 | ||||||||
| Review | 6 months | ||||||||
| Potential Approval | Apr-14 | Case 2 | |||||||
| Loan Documents | May-14 | 20%of project | |||||||
| Beginning Engineering | Jun-14 | ||||||||
| Beginning Construction | Sep-14 | ||||||||
| 1st Customer | 1Q 2015 | ||||||||
| Completed Network | 2017 | ||||||||
| 2Q 2014 | 3Q 2014 | 4Q 2014 | 1Q 2015 | 2Q 2015 | 3Q 2015 | 4Q 2015 | 1Q 2016 | 2Q 2016 | 3Q 2016 | 4Q 2016 | 2017 | 2018 | ||||
| Customer count | ||||||||||||||||
| Beginning | 0 | 93 | 259 | 501 | 712 | 847 | 933 | 964 | 981 | 991 | ||||||
| net additions | 93 | 166 | 241 | 211 | 135 | 86 | 31 | 17 | 10 | 21 | ||||||
| Ending | 93 | 259 | 501 | 712 | 847 | 933 | 964 | 981 | 991 | 1,012 | ||||||
| Capex | ||||||||||||||||
| Beginning | $0 | $277,206 | $554,412 | $1,018,386 | $1,627,569 | $2,387,470 | $3,087,271 | $3,634,895 | $4,083,484 | $4,422,083 | $4,733,132 | $6,416,498 | ||||
| Capex Network | $4,435,296 | 277,206 | 277,206 | 277,206 | 277,206 | 277,206 | 277,206 | 277,206 | 277,206 | 277,206 | 277,206 | 1,663,236 | 0 | |||
| Install cost /customer | $2,000 | 0 | 0 | 186,768 | 331,977 | 482,695 | 422,595 | 270,418 | 171,382 | 61,393 | 33,843 | 20,130 | 42,734 | |||
| Total capex | 277,206 | 554,412 | 1,018,386 | 1,627,569 | 2,387,470 | 3,087,271 | 3,634,895 | 4,083,484 | 4,422,083 | 4,733,132 | 6,416,498 | 6,459,232 | ||||
| Max | ||||||||||||||||
| New RUS Debt | $5,913,728 | |||||||||||||||
| Beginning balance | $0 | 277,206 | 554,412 | 1,018,386 | 1,627,569 | 2,383,823 | 3,052,210 | 3,343,190 | 3,575,411 | 3,803,985 | 4,028,910 | 5,636,219 | 5,492,753 | |||
| Draws for network | $4,435,296 | 277,206 | 277,206 | 277,206 | 277,206 | 277,206 | 277,206 | 277,206 | 277,206 | 277,206 | 277,206 | 1,663,236 | 0 | 0 | ||
| Draws for customer premise | $1,478,432 | 0 | 0 | 186,768 | 331,977 | 482,695 | 422,595 | 54,397 | 0 | 0 | 0 | 0 | 0 | 0 | ||
| Principals payments | 19 | 0 | 0 | 0 | 0 | (3,647) | (31,414) | (40,622) | (44,985) | (48,633) | (52,280) | (55,928) | (143,466) | (143,466) | ||
| Ending balance | 277,206 | 554,412 | 1,018,386 | 1,627,569 | 2,383,823 | 3,052,210 | 3,343,190 | 3,575,411 | 3,803,985 | 4,028,910 | 5,636,219 | 5,492,753 | 5,349,286 | |||
| Interest | 3.25% | 2,252 | 4,505 | 8,274 | 13,224 | 19,369 | 24,799 | 27,163 | 29,050 | 30,907 | 32,735 | 183,177 | 178,514 |
15
| Midland - Smart Build Project - June 2014 | |||||||
| Assumptions | |||||||
| Passings | 1100 | Project Cost | $ 2,379,042 | ||||
| Cost to Install | $ 1,435 | Network | $ 2,250,000 | ||||
| CPE/Install | $ 129,042 | ||||||
| Case 2 | |||||||
| 20% of project | |||||||
| 2Q 2014 | 3Q 2014 | 4Q 2014 | 1Q 2015 | 2Q 2015 | 3Q 2015 | 4Q 2015 | 1Q 2016 | 2Q 2016 | 3Q 2016 | 4Q 2016 | 2017 | 2018 | ||||
| Customer count | ||||||||||||||||
| Beginning | 0 | 0 | 28 | 53 | 78 | 78 | 79 | 80 | 81 | 82 | 83 | |||||
| net additions | 7 | 28 | 25 | 25 | 1 | 1 | 1 | 1 | 1 | 1 | 1 | |||||
| Ending | 7 | 28 | 53 | 78 | 78 | 79 | 80 | 81 | 82 | 83 | 83 | |||||
| Capex | ||||||||||||||||
| Beginning | $0 | $75,000 | $183,750 | $301,971 | $450,973 | $595,239 | $630,755 | $631,939 | $633,123 | $634,307 | $635,491 | $636,675 | $637,859 | |||
| Capex Network | 75,000 | 108,750 | 108,750 | 108,750 | 108,750 | 0 | 0 | 0 | 0 | 0 | 0 | 0 | 0 | |||
| Install cost /customer | $1,435 | 0 | 0 | 9,471 | 40,252 | 35,516 | 35,516 | 1,184 | 1,184 | 1,184 | 1,184 | 1,184 | 1,184 | 1,184 | ||
| Total capex | 75,000 | 183,750 | 301,971 | 450,973 | 595,239 | 630,755 | 631,939 | 633,123 | 634,307 | 635,491 | 636,675 | 637,859 | 639,042 | |||
| Additional Debt | ||||||||||||||||
| Beginning balance | $0 | 300,000 | 300,000 | 588,750 | 566,250 | 543,750 | 521,250 | 498,750 | 476,250 | 453,750 | 431,250 | 408,750 | 318,750 | |||
| Additions | $1,500,000 | 300,000 | 0 | 300,000 | 0 | 0 | 0 | 0 | 0 | 0 | 0 | 0 | 0 | 0 | ||
| Principals payments | 15.0% | 0 | 0 | (11,250) | (22,500) | (22,500) | (22,500) | (22,500) | (22,500) | (22,500) | (22,500) | (22,500) | (90,000) | (90,000) | ||
| Ending balance | 300,000 | 300,000 | 588,750 | 566,250 | 543,750 | 521,250 | 498,750 | 476,250 | 453,750 | 431,250 | 408,750 | 318,750 | 228,750 |
16
| Odessa - Smart Build Project - June 2014 | |||||||
| Assumptions | |||||||
| Passings | 1100 | Project Cost | $ 2,377,859 | ||||
| Cost to Install | $1,435 | Network | $ 2,250,000 | ||||
| CPE/Install | $ 127,859 | ||||||
| Case 2 | |||||||
| 20% of project | |||||||
| 2Q 2014 | 3Q 2014 | 4Q 2014 | 1Q 2015 | 2Q 2015 | 3Q 2015 | 4Q 2015 | 1Q 2016 | 2Q 2016 | 3Q 2016 | 4Q 2016 | 2017 | 2018 | ||||
| Customer count | ||||||||||||||||
| Beginning | 0 | 0 | 7 | 35 | 59 | 84 | 85 | 86 | 87 | 87 | 88 | |||||
| net additions | 0 | 7 | 28 | 25 | 25 | 1 | 1 | 1 | 1 | 1 | 1 | |||||
| Ending | 0 | 7 | 35 | 59 | 84 | 85 | 86 | 87 | 87 | 88 | 89 | |||||
| Capex | ||||||||||||||||
| Beginning | $0 | $75,000 | $183,750 | $301,971 | $450,973 | $595,239 | $630,755 | $631,939 | $633,123 | $634,307 | $635,491 | $636,675 | ||||
| Capex Network | 75,000 | 108,750 | 108,750 | 108,750 | 108,750 | 0 | 0 | 0 | 0 | 0 | 0 | 0 | ||||
| Install cost /customer | $1,435 | 0 | 0 | 9,471 | 40,252 | 35,516 | 35,516 | 1,184 | 1,184 | 1,184 | 1,184 | 1,184 | 1,184 | |||
| Total capex | 75,000 | 183,750 | 301,971 | 450,973 | 595,239 | 630,755 | 631,939 | 633,123 | 634,307 | 635,491 | 636,675 | 637,859 | ||||
| Additional Debt | ||||||||||||||||
| Beginning balance | $0 | 300,000 | 300,000 | 588,750 | 566,250 | 543,750 | 521,250 | 498,750 | 476,250 | 453,750 | 431,250 | 341,250 | ||||
| Additions | $1,500,000 | 300,000 | 0 | 300,000 | 0 | 0 | 0 | 0 | 0 | 0 | 0 | 0 | 0 | |||
| Principals payments | 15.0% | 0 | 0 | (11,250) | (22,500) | (22,500) | (22,500) | (22,500) | (22,500) | (22,500) | (22,500) | (90,000) | (90,000) | |||
| Ending balance | 300,000 | 300,000 | 588,750 | 566,250 | 543,750 | 521,250 | 498,750 | 476,250 | 453,750 | 431,250 | 341,250 | 251,250 |
17
| Amarillo - Smart Build Project | ||||||
| Assumptions | ||||||
| Cost to Install | $1,435 | |||||
| Project Cost | $4,222,785 | |||||
| Netowrk spend left | $1,450,000 | |||||
| 3Q 2013 | 4Q 2013 | 1Q 2014 | 2Q 2014 | 3Q 2014 | 4Q 2014 | 1Q 2015 | 2Q 2015 | 3Q 2015 | 4Q 2015 | 1Q 2016 | 2Q 2016 | 3Q 2016 | 4Q 2016 | 2017 | 2018 | |||
| Customer count | ||||||||||||||||||
| Beginning | 0 | 30 | 218 | 398 | 488 | 578 | 593 | 608 | 623 | 638 | 653 | 668 | 683 | 698 | 698 | |||
| net additions | 30 | 188 | 180 | 90 | 90 | 15 | 15 | 15 | 15 | 15 | 15 | 15 | 15 | 0 | 0 | |||
| Ending | 30 | 218 | 398 | 488 | 578 | 593 | 608 | 623 | 638 | 653 | 668 | 683 | 698 | 698 | 698 | |||
| ARPU | $200 | $202 | $201 | $209 | $216 | $224 | $231 | $239 | $246 | $254 | $261 | $269 | $276 | $276 | $276 | |||
| Capex | ||||||||||||||||||
| Beginning | $0 | 250,000 | 693,050 | 1,612,113 | 2,020,413 | 2,149,563 | 2,278,713 | 2,300,238 | 2,321,763 | 2,343,288 | 2,364,813 | 2,386,338 | 2,407,863 | 2,429,388 | 2,450,913 | 2,450,913 | ||
| Capex Network | 250,000 | 400,000 | 650,000 | 150,000 | 0 | 0 | 0 | 0 | 0 | 0 | 0 | 0 | 0 | 0 | 0 | 0 | ||
| Install cost /customer | $1,435 | 0 | 43,050 | 269,063 | 258,300 | 129,150 | 129,150 | 21,525 | 21,525 | 21,525 | 21,525 | 21,525 | 21,525 | 21,525 | 21,525 | 0 | 0 | |
| Total capex | 250,000 | 693,050 | 1,612,113 | 2,020,413 | 2,149,563 | 2,278,713 | 2,300,238 | 2,321,763 | 2,343,288 | 2,364,813 | 2,386,338 | 2,407,863 | 2,429,388 | 2,450,913 | 2,450,913 | 2,450,913 |
18
| Abilene - Smart Build Project | ||
| Assumptions | ||
| Cost to Install | $1,435 | |
| Project Cost | $2,553,804 | |
| Netowrk spend left | $850,000 | |
| 3Q 2013 | 4Q 2013 | 1Q 2014 | 2Q 2014 | 3Q 2014 | 4Q 2014 | 1Q 2015 | 2Q 2015 | 3Q 2015 | 4Q 2015 | 1Q 2016 | 2Q 2016 | 3Q 2016 | 4Q 2016 | 2017 | 2018 | |||
| Customer count | ||||||||||||||||||
| Beginning | 0 | 30 | 158 | 270 | 383 | 386 | 390 | 394 | 398 | 401 | 405 | 409 | 413 | 416 | 420 | 420 | ||
| net additions | 30 | 128 | 113 | 113 | 4 | 4 | 4 | 4 | 4 | 4 | 4 | 4 | 4 | 4 | 0 | 0 | ||
| Ending | 30 | 158 | 270 | 383 | 386 | 390 | 394 | 398 | 401 | 405 | 409 | 413 | 416 | 420 | 420 | 420 | ||
| ARPU | NM | $202 | $202 | $202 | $210 | $217 | $225 | $232 | $240 | $247 | $255 | $262 | $270 | $277 | $277 | $277 | ||
| Capex | ||||||||||||||||||
| Beginning | $0 | 450,000 | 882,963 | 1,194,400 | 1,355,838 | 1,361,219 | 1,366,600 | 1,371,981 | 1,377,363 | 1,382,744 | 1,388,125 | 1,393,506 | 1,398,888 | 1,404,269 | 1,409,650 | 1,409,650 | ||
| Capex Network | 450,000 | 250,000 | 150,000 | 0 | 0 | 0 | 0 | 0 | 0 | 0 | 0 | 0 | 0 | 0 | 0 | 0 | ||
| Install cost /customer | $1,435 | 0 | 182,963 | 161,438 | 161,438 | 5,381 | 5,381 | 5,381 | 5,381 | 5,381 | 5,381 | 5,381 | 5,381 | 5,381 | 5,381 | 0 | 0 | |
| Total capex | 450,000 | 882,963 | 1,194,400 | 1,355,838 | 1,361,219 | 1,366,600 | 1,371,981 | 1,377,363 | 1,382,744 | 1,388,125 | 1,393,506 | 1,398,888 | 1,404,269 | 1,409,650 | 1,409,650 | 1,409,650 |
19
| Summary Cost of Good Sold Analysis |
| Q1 2011 | Q2 2011 | Q3 2011 | Q4 2011 | Q1 2012 | Q2 2012 | Q3 2012 | Q4 2012 | Q1 2013 | Q2 2013 | |
| Total Fiber Revenue | $2,945,400 | $3,041,161 | $3,417,271 | $3,618,716 | $4,072,667 | $4,513,105 | $4,755,779 | $4,878,064 | $5,346,152 | $5,652,618 |
| Total Non-Fiber Revenue | 11,311,818 | 11,057,995 | 11,184,371 | 11,081,102 | 10,851,162 | 10,571,454 | 10,170,267 | 10,057,970 | 9,590,084 | 9,533,566 |
| Total Revenue | 14,257,218 | 14,099,156 | 14,601,642 | 14,699,818 | 14,923,829 | 15,084,559 | 14,926,046 | 14,936,034 | 14,936,236 | 15,186,185 |
| Fiber % | 21% | 22% | 23% | 25% | 27% | 30% | 32% | 33% | 36% | 37% |
| Non-Fiber % | 79% | 78% | 77% | 75% | 73% | 70% | 68% | 67% | 64% | 63% |
| Total | 100% | 100% | 100% | 100% | 100% | 100% | 100% | 100% | 100% | 100% |
| Fiber Revenue | ||||||||||
| Business | $1,801,965 | $1,862,533 | $2,022,291 | $2,083,533 | $2,268,515 | $2,431,899 | $2,499,819 | $2,648,921 | $2,793,006 | $2,927,366 |
| Residential | 1,143,144 | 1,177,619 | 1,314,496 | 1,517,851 | 1,734,887 | 1,893,087 | 2,002,848 | 2,092,255 | 2,285,726 | 2,374,856 |
| Private Line-Wholesale | 291 | 1,009 | 80,485 | 17,333 | 69,265 | 188,118 | 253,112 | 136,888 | 267,420 | 350,396 |
| Total Fiber Revenue | 2,945,400 | 3,041,161 | 3,417,271 | 3,618,716 | 4,072,667 | 4,513,105 | 4,755,779 | 4,878,064 | 5,346,152 | 5,652,618 |
| Non-Fiber Revenue | ||||||||||
| Local | 3,126,014 | 3,016,610 | 3,036,748 | 2,960,322 | $2,761,927 | $2,567,788 | $2,462,023 | $2,320,143 | $2,284,159 | $2,135,041 |
| LD | 1,308,269 | 1,095,505 | 1,083,197 | 925,774 | 918,424 | 926,588 | 868,200 | 847,152 | 831,173 | 854,780 |
| Data | 987,838 | 913,027 | 883,502 | 940,831 | 814,684 | 740,743 | 690,283 | 694,686 | 689,440 | 673,555 |
| Private Line | 2,844,888 | 2,937,663 | 2,973,746 | 2,994,592 | 2,875,911 | 2,706,897 | 2,706,989 | 2,944,299 | 2,763,634 | 2,651,233 |
| Equipement | 247,048 | 306,254 | 200,338 | 191,963 | 259,871 | 367,629 | 418,435 | 236,318 | 221,551 | 398,215 |
| USF | 325,883 | 324,608 | 273,930 | 307,474 | 363,566 | 363,466 | 301,659 | 358,693 | 350,321 | 398,928 |
| Cable Company (Cobridge, Reach) | 0 | 0 | 360,579 | 442,937 | 587,243 | 527,641 | 482,864 | 450,197 | 412,772 | 429,420 |
| Xfone USA | 1,740,207 | 1,624,772 | 1,551,327 | 1,464,556 | 1,422,062 | 1,444,504 | 1,354,702 | 1,282,520 | 1,203,302 | 1,213,683 |
| Total before other | 10,580,147 | 10,218,440 | 10,363,366 | 10,228,450 | 10,003,688 | 9,645,256 | 9,285,155 | 9,134,009 | 8,756,353 | 8,754,854 |
| Other | 731,671 | 839,555 | 821,005 | 852,652 | 847,474 | 926,198 | 885,112 | 923,961 | 833,731 | 778,712 |
| Total Non Fiber | 11,311,818 | 11,057,995 | 11,184,371 | 11,081,102 | 10,851,162 | 10,571,454 | 10,170,267 | 10,057,970 | 9,590,084 | 9,533,566 |
| Growth Rate | ||||||||||
| Local | -3.5% | 0.7% | -2.5% | -6.7% | -7.0% | -4.1% | -5.8% | -1.6% | -6.5% | |
| LD | -16.3% | -1.1% | -14.5% | -0.8% | 0.9% | -6.3% | -2.4% | -1.9% | 2.8% | |
| Data | -7.6% | -3.2% | 6.5% | -13.4% | -9.1% | -6.8% | 0.6% | -0.8% | -2.3% | |
| Private Line | 3.3% | 1.2% | 0.7% | -4.0% | -5.9% | 0.0% | 8.8% | -6.1% | -4.1% | |
| Equipment | 24.0% | -34.6% | -4.2% | 35.4% | 41.5% | 13.8% | -43.5% | -6.2% | 79.7% | |
| USF | -0.4% | -15.6% | 12.2% | 18.2% | 0.0% | -17.0% | 18.9% | -2.3% | 13.9% | |
| Cable Company | NA | NA | 22.8% | 32.6% | -10.1% | -8.5% | -6.8% | -8.3% | 4.0% | |
| Xfone | -6.6% | -4.5% | -5.6% | -2.9% | 1.6% | -6.2% | -5.3% | -6.2% | 0.9% | |
| Total before other | -3.4% | 1.4% | -1.3% | -2.2% | -3.6% | -3.7% | -1.6% | -4.1% | 0.0% | |
| Other | 14.7% | -2.2% | 3.9% | -0.6% | 9.3% | -4.4% | 4.4% | -9.8% | -6.6% | |
| Total | -2.2% | 1.1% | -0.9% | -2.1% | -2.6% | -3.8% | -1.1% | -4.7% | -0.6% | |
| Total COGS | ||||||||||
| Video - NTS IPTV | $487,775 | $508,719 | $561,024 | $642,781 | $704,301 | $774,648 | $776,816 | $839,191 | $967,255 | $987,881 |
| CLEC Loops /Local | 1,503,101 | 1,538,686 | 1,589,507 | 1,555,459 | 1,471,063 | 1,451,846 | 1,418,598 | 1,409,963 | 1,349,629 | 1,324,880 |
| Access Local | 975,769 | 959,985 | 957,955 | 910,574 | 770,953 | 706,123 | 665,887 | 648,433 | 649,700 | 640,118 |
| Access & Termination | 105,328 | 103,970 | 117,086 | 108,334 | 104,986 | 97,626 | 97,053 | 89,346 | 86,543 | 95,199 |
| Long Distance Charges | 11,331 | 10,948 | 12,139 | 12,075 | 11,587 | 10,646 | 10,467 | 13,939 | 20,269 | 21,379 |
| Usage | 416,179 | 376,401 | 273,572 | 231,898 | 241,880 | 240,627 | 191,930 | 176,420 | 176,770 | 158,974 |
| Transport | 996,970 | 938,454 | 991,155 | 999,239 | 1,054,490 | 977,503 | 941,611 | 956,816 | 986,971 | 960,973 |
| Private Line | 1,321,840 | 1,398,676 | 1,370,258 | 1,299,574 | 1,302,318 | 1,250,717 | 1,272,855 | 1,237,183 | 1,167,575 | 1,186,715 |
| Data Services | 601,560 | 578,251 | 582,152 | 543,756 | 537,568 | 502,958 | 496,133 | 493,309 | 450,758 | 447,352 |
| Universal Service Fund | 410,212 | 374,448 | 322,150 | 376,801 | 396,066 | 333,015 | 380,231 | 424,104 | 422,575 | 426,316 |
| Equipment | 244,353 | 102,763 | 157,113 | 125,780 | 152,716 | 145,869 | 201,706 | 135,729 | 80,252 | 182,537 |
| Cobridge | 156,001 | 268,968 | 206,824 | 188,022 | 197,774 | 179,240 | 168,029 | 142,437 | ||
| Reach | 23,816 | 116,153 | 107,549 | 98,241 | 83,485 | 81,342 | 75,156 | |||
| Other Costs / Credits | (62,944) | (41,473) | (26,264) | 1,517 | 51,748 | 33,129 | (14,719) | 125,072 | 32,749 | 80,929 |
| Total COGS | 7,011,475 | 6,849,829 | 7,063,847 | 7,100,572 | 7,122,654 | 6,820,276 | 6,734,583 | 6,812,230 | 6,640,418 | 6,730,847 |
| Growth Rate | ||||||||||
| Video - NTS IPTV | 4.3% | 10.3% | 14.6% | 9.6% | 10.0% | 0.3% | 8.0% | 15.3% | 2.1% | |
| CLEC Loops /Local | 2.4% | 3.3% | -2.1% | -5.4% | -1.3% | -2.3% | -0.6% | -4.3% | -1.8% | |
| Access Local | -1.6% | -0.2% | -4.9% | -15.3% | -8.4% | -5.7% | -2.6% | 0.2% | -1.5% | |
| Access & Termination | -1.3% | 12.6% | -7.5% | -3.1% | -7.0% | -0.6% | -7.9% | -3.1% | 10.0% | |
| Long Distance Charges | -3.4% | 10.9% | -0.5% | -4.0% | -8.1% | -1.7% | 33.2% | 45.4% | 5.5% | |
| Usage | -9.6% | -27.3% | -15.2% | 4.3% | -0.5% | -20.2% | -8.1% | 0.2% | -10.1% | |
| Transport | -5.9% | 5.6% | 0.8% | 5.5% | -7.3% | -3.7% | 1.6% | 3.2% | -2.6% | |
| Private Line | 5.8% | -2.0% | -5.2% | 0.2% | -4.0% | 1.8% | -2.8% | -5.6% | 1.6% | |
| Data Services | -3.9% | 0.7% | -6.6% | -1.1% | -6.4% | -1.4% | -0.6% | -8.6% | -0.8% | |
| Universal Service Fund | -8.7% | -14.0% | 17.0% | 5.1% | -15.9% | 14.2% | 11.5% | -0.4% | 0.9% | |
| Equipment | -57.9% | 52.9% | -19.9% | 21.4% | -4.5% | 38.3% | -32.7% | -40.9% | 127.5% | |
| Cobridge | NA | NA | NA | -23.1% | -9.1% | 5.2% | -9.4% | -6.3% | -15.2% | |
| Reach | NA | NA | NA | 387.7% | -7.4% | -8.7% | -15.0% | -2.6% | -7.6% | |
| Other Costs | -34.1% | -36.7% | -105.8% | 3311.2% | -36.0% | -144.4% | -949.7% | -73.8% | 147.1% | |
| Total COGS | -2.3% | 3.1% | 0.5% | 0.3% | -4.2% | -1.3% | 1.2% | -2.5% | 1.4% | |
| Video Cost | $487,775 | $508,719 | $561,024 | $642,781 | $704,301 | $774,648 | $776,816 | $839,191 | $967,255 | $987,881 |
| Growth Rate | 4.3% | 10.3% | 14.6% | 9.6% | 10.0% | 0.3% | 8.0% | 15.3% | 2.1% | |
| YoY Growth | 44.4% | 52.3% | 38.5% | 30.6% | 37.3% | 27.5% | ||||
| Fiber Revenue excluding wholesale | $2,945,109 | $3,040,152 | $3,336,786 | $3,601,383 | $4,003,402 | $4,324,987 | $4,502,667 | $4,741,176 | $5,078,732 | $5,302,222 |
| Growth Rate | 3.2% | 9.8% | 7.9% | 11.2% | 8.0% | 4.1% | 5.3% | 7.1% | 4.4% | |
| YoY Growth | 35.9% | 42.3% | 34.9% | 31.6% | 26.9% | 22.6% | ||||
| Video cost as a % of Fiber Revenue | 16.6% | 16.7% | 16.8% | 17.8% | 17.6% | 17.9% | 17.3% | 17.7% | 19.0% | 18.6% |
| Estimated # of residential video customers | 3,293 | 3,335 | 3,674 | 4,123 | 4,619 | 4,925 | 5,237 | 5,356 | 5,857 | 6,033 |
| Estimated # of business video customers | 268 | 273 | 300 | 320 | 354 | 370 | 412 | 429 | 482 | 498 |
| Total Video Customers | 3,561 | 3,608 | 3,973 | 4,443 | 4,973 | 5,295 | 5,649 | 5,785 | 6,339 | 6,531 |
| Estimated Monthly Video Cost per video customer | $46 | $47 | $47 | $48 | $47 | $49 | $46 | $48 | $51 | $50 |
| Total Residential Subscribers | 4,313 | 4,366 | 4,796 | 5,375 | 6,041 | 6,444 | 6,852 | 7,008 | 7,686 | 7,894 |
| Estimated % with video | 76.4% | 76.4% | 76.6% | 76.7% | 76.5% | 76.4% | 76.4% | 76.4% | 76.2% | 76.4% |
| Total Business Subscribers | 1,704 | 1,732 | 1,816 | 1,892 | 2,007 | 2,083 | 2,252 | 2,452 | 2,707 | 2,898 |
| Estimated % with video | 15.7% | 15.8% | 16.5% | 16.9% | 17.7% | 17.8% | 18.3% | 17.5% | 17.8% | 17.2% |
| Variable Cost for purchasing of content, all Fiber | ||||||||||
| CLEC Direct Cost | ||||||||||
| CLEC Loops /Local | 1,503,101 | 1,538,686 | 1,589,507 | 1,555,459 | 1,471,063 | 1,451,846 | 1,418,598 | 1,409,963 | 1,349,629 | 1,324,880 |
| Non Fiber Variable Data Costs | 487,410 | 463,122 | 490,620 | 458,815 | 413,744 | 410,163 | 405,483 | 407,104 | 382,923 | 387,827 |
| Access Local | 975,769 | 959,985 | 957,955 | 910,574 | 770,953 | 706,123 | 665,887 | 648,433 | 649,700 | 640,118 |
| Total | 2,966,281 | 2,961,792 | 3,038,082 | 2,924,848 | 2,655,760 | 2,568,132 | 2,489,968 | 2,465,500 | 2,382,253 | 2,352,825 |
| Growth Rate | -0.2% | 2.6% | -3.7% | -9.2% | -3.3% | -3.0% | -1.0% | -3.4% | -1.2% | |
| YoY Growth | -10.5% | -13.3% | -18.0% | -15.7% | -10.3% | -8.4% | ||||
| CLEC related revenue | ||||||||||
| Local | $3,126,014 | $3,016,610 | $3,036,748 | $2,960,322 | $2,761,927 | $2,567,788 | $2,462,023 | $2,320,143 | $2,284,159 | $2,135,041 |
| Data services | 987,838 | 913,027 | 883,502 | 940,831 | 814,684 | 740,743 | 690,283 | 694,686 | 689,440 | 673,555 |
| Xfone USA | 1,740,207 | 1,624,772 | 1,551,327 | 1,464,556 | 1,422,062 | 1,444,504 | 1,354,702 | 1,282,520 | 1,203,302 | 1,213,683 |
| Total CLEC related revenue | 5,854,059 | 5,554,409 | 5,471,577 | 5,365,709 | 4,998,673 | 4,753,035 | 4,507,008 | 4,297,349 | 4,176,902 | 4,022,279 |
| Growth Rate | -4.9% | -5.2% | -4.7% | -2.8% | -3.7% | |||||
| YoY Growth | -16.4% | -15.4% | ||||||||
| Cost as a % of Local and Xfone USA revenue | 50.7% | 53.3% | 55.5% | 54.5% | 53.1% | 54.0% | 55.2% | 57.4% | 57.0% | 58.5% |
| This is a variable cost associaed with providing CLEC customers connectivity to NTS central offices | ||||||||||
| All Costs attributed to Non-fiber | ||||||||||
| Long Distance Cost | ||||||||||
| Access & Termination | 105,328 | 103,970 | 117,086 | 108,334 | 104,986 | 97,626 | 97,053 | 89,346 | 86,543 | 95,199 |
| Long Distance Charges | 11,331 | 10,948 | 12,139 | 12,075 | 11,587 | 10,646 | 10,467 | 13,939 | 20,269 | 21,379 |
| Usage | 416,179 | 376,401 | 273,572 | 231,898 | 241,880 | 240,627 | 191,930 | 176,420 | 176,770 | 158,974 |
| Total long distance costs | 532,838 | 491,320 | 402,797 | 352,307 | 358,454 | 348,898 | 299,451 | 279,705 | 283,582 | 275,552 |
| Growth Rate | -7.8% | -18.0% | -12.5% | 1.7% | -2.7% | -14.2% | -6.6% | 1.4% | -2.8% | |
| YoY Growth | -32.7% | -29.0% | -25.7% | -20.6% | -20.9% | -21.0% | ||||
| Long Distance | $1,308,269 | $1,095,505 | $1,083,197 | $925,774 | $918,424 | $926,588 | $868,200 | $847,152 | $831,173 | $854,780 |
| Growth Rate | -16.3% | -1.1% | -14.5% | -0.8% | 0.9% | -6.3% | -2.4% | -1.9% | 2.8% | |
| YoY Growth | -29.8% | -15.4% | -19.8% | -8.5% | -9.5% | -7.7% | ||||
| Long distance costs as a % of LD revenue | 41% | 45% | 37% | 38% | 39% | 38% | 34% | 33% | 34% | 32% |
| This is a variable cost associaed with long distance calling, both fiber and non fiber customers | ||||||||||
| We allocate this cost based on revenue contribution for each business | ||||||||||
| Fiber Allocation | $110,079 | $105,977 | $94,268 | $86,729 | $97,821 | $104,386 | $95,412 | $91,351 | $101,503 | $102,566 |
| Non-Fiber Allocation | 422,759 | 385,343 | 308,529 | 265,578 | 260,633 | 244,512 | 204,039 | 188,354 | 182,079 | 172,986 |
| Transport | $996,970 | $938,454 | $991,155 | $999,239 | $1,054,490 | $977,503 | $941,611 | $956,816 | $986,971 | $960,973 |
| Growth Rate | -5.9% | 5.6% | 0.8% | 5.5% | -7.3% | -3.7% | 1.6% | 3.2% | -2.6% | |
| YoY Growth | 5.8% | 4.2% | -5.0% | -4.2% | -6.4% | -1.7% | ||||
| This is a fixed cost to the whole business, representing the network that is not owned by NTS. | ||||||||||
| We allocate this cost based on revenue contribution, that said, this cost remains fixed until NTS enters a new market | ||||||||||
| Fiber Allocation | $205,964 | $202,423 | $231,963 | $245,987 | $287,767 | $292,456 | $300,019 | $312,493 | $353,268 | $357,694 |
| Non-Fiber Allocation | 791,006 | 736,031 | 759,191 | 753,252 | 766,723 | 685,046 | 641,592 | 644,323 | 633,703 | 603,279 |
| Private Line Expense | $1,321,840 | $1,398,676 | $1,370,258 | $1,299,574 | $1,302,318 | $1,250,717 | $1,272,855 | $1,237,183 | $1,167,575 | $1,186,715 |
| Growth Rate | 5.8% | -2.0% | -5.2% | 0.2% | -4.0% | 1.8% | -2.8% | -5.6% | 1.6% | |
| YoY Growth | -1.5% | -10.6% | -7.1% | -4.8% | -10.3% | -5.1% | ||||
| Private Line Revenue - Fiber | $291 | $1,009 | $80,485 | $17,333 | $69,265 | $188,118 | $253,112 | $136,888 | $267,420 | $350,396 |
| Private Line Revenue - Non Fiber | 2,844,888 | 2,937,663 | 2,973,746 | 2,994,592 | 2,875,911 | 2,706,897 | 2,706,989 | 2,944,299 | 2,763,634 | 2,651,233 |
| Private Line Revenue - Total | 2,845,179 | 2,938,672 | 3,054,230 | 3,011,925 | 2,945,176 | 2,895,015 | 2,960,101 | 3,081,187 | 3,031,054 | 3,001,629 |
| Growth Rate non fiber | 3.3% | 1.2% | 0.7% | -4.0% | -5.9% | 0.0% | 8.8% | -6.1% | -4.1% | |
| YoY Growth | 1.1% | -7.9% | -9.0% | -1.7% | -3.9% | -2.1% | ||||
| Private line expenses as a % of private line revenue | 46.5% | 47.6% | 46.1% | 43.4% | 45.3% | 46.2% | 47.0% | 42.0% | 42.2% | 44.8% |
| This is a variable costs associated with private line revenue. Improved margins due to migration of circuits from third party vendors to NTS' own private network | ||||||||||
| As we continue to construct our network, we expect margins to continue to improve as we can (i) migrate more circuits from off-net to on net and | ||||||||||
| (ii) compete for business in the LA area. | ||||||||||
| Total Data Services | $601,560 | $578,251 | $582,152 | $543,756 | $537,568 | $502,958 | $496,133 | $493,309 | $450,758 | $447,352 |
| Growth Rate | -3.9% | 0.7% | -6.6% | -1.1% | -6.4% | -1.4% | -0.6% | -8.6% | -0.8% | |
| YoY Growth | -11% | -13% | -15% | -9% | -16% | -11% | ||||
| Data Service Fixed Component | $114,149 | $115,130 | $91,532 | $84,941 | $123,824 | $92,795 | $90,650 | $86,205 | $67,835 | $59,525 |
| Allocation to Fiber | 23,582 | 24,833 | 21,422 | 20,910 | 33,791 | 27,763 | 28,883 | 28,154 | 24,280 | 22,156 |
| Allocation to Non-Fiber | 90,567 | 90,296 | 70,110 | 64,031 | 90,033 | 65,032 | 61,767 | 58,051 | 43,555 | 37,369 |
| Data Service Variable Component | 487,410 | 463,122 | 490,620 | 458,815 | 413,744 | 410,163 | 405,483 | 407,104 | 382,923 | 387,827 |
| The Data service variable component is allocated to direct CLEC costs as this is where the costs to purchase internet loops (DSL, DS1, T1) from third party to provide | ||||||||||
| internt capacity to CLEC customers. | ||||||||||
| The fixed component is to provide NTS access to internet pipe in several locations. That cost is fixed and is distributed between Fiber and Non-Fiber according to revenue. | ||||||||||
| Universal Service Fund | $410,212 | $374,448 | $322,150 | $376,801 | $396,066 | $333,015 | $380,231 | $424,104 | $422,575 | $426,316 |
| Growth Rate | -8.7% | -14.0% | 17.0% | 5.1% | -15.9% | 14.2% | 11.5% | -0.4% | 0.9% | |
| Universal Service Fund Rev | $325,883 | $324,608 | $273,930 | $307,474 | $363,566 | $363,466 | $301,659 | $358,693 | $350,321 | $398,928 |
| Growth Rate | -0.4% | -15.6% | 12.2% | 18.2% | 0.0% | -17.0% | 18.9% | -2.3% | 13.9% | |
| This is a pass through cost. The difference is due to time/revenue recognition. | ||||||||||
| Equipment Cost (Toshiba) | $244,353 | $102,763 | $157,113 | $125,780 | $152,716 | $145,869 | $201,706 | $135,729 | $80,252 | $182,537 |
| Growth Rate | -57.9% | 52.9% | -19.9% | 21.4% | -4.5% | 38.3% | -32.7% | -40.9% | 127.5% | |
| Equipment Revenue | $247,048 | $306,254 | $200,338 | $191,963 | $259,871 | $367,629 | $418,435 | $236,318 | $221,551 | $398,215 |
| Growth Rate | 24.0% | -34.6% | -4.2% | 35.4% | 41.5% | 13.8% | -43.5% | -6.2% | 79.7% | |
| Cost as a % of Revenue | 99% | 34% | 78% | 66% | 59% | 40% | 48% | 57% | 36% | 46% |
| Cable | ||||||||||
| Cobridge | $156,001 | $268,968 | $206,824 | $188,022 | $197,774 | $179,240 | $168,029 | $142,437 | ||
| Reach | 0 | 23,816 | 116,153 | 107,549 | 98,241 | 83,485 | 81,342 | 75,156 | ||
| Total Cable Costs | 156,001 | 292,784 | 322,977 | 295,571 | 296,015 | 262,725 | 249,371 | 217,593 | ||
| Growth Rate | -8% | 0% | -11% | -5% | -13% | |||||
| YoY | -23% | -26% | ||||||||
| Cable Revenue | $0 | $0 | $360,579 | $442,937 | $587,243 | $527,641 | $482,864 | $450,197 | $412,772 | $429,420 |
| Growth Rate | 23% | 33% | -10% | -8% | -7% | -8% | 4% | |||
| YoY | 2% | -30% | -19% | |||||||
| Cost as a % of Revenue | 43% | 66% | 55% | 56% | 61% | 58% | 60% | 51% | ||
| Total CLEC Variable Cost Assumption for model | ||||||||||
| CLEC Variable costs | $2,966,281 | $2,961,792 | $3,038,082 | $2,924,848 | $2,655,760 | $2,568,132 | $2,489,968 | $2,465,500 | $2,382,253 | $2,352,825 |
| Long Distance variable costs | 422,759 | 385,343 | 308,529 | 265,578 | 260,633 | 244,512 | 204,039 | 188,354 | 182,079 | 172,986 |
| 3,389,040 | 3,347,135 | 3,346,611 | 3,190,426 | 2,916,393 | 2,812,644 | 2,694,007 | 2,653,854 | 2,564,332 | 2,525,811 | |
| % of CLEC and Long distance revenue | 47% | 50% | 51% | 51% | 49% | 50% | 50% | 52% | 51% | 52% |
| Fiber Variable costs | ||||||||||
| Video | $487,775 | $508,719 | $561,024 | $642,781 | $704,301 | $774,648 | $776,816 | $839,191 | $967,255 | $987,881 |
| Long Distance | 110,079 | 105,977 | 94,268 | 86,729 | 97,821 | 104,386 | 95,412 | 91,351 | 101,503 | 102,566 |
| Total | 597,854 | 614,695 | 655,292 | 729,510 | 802,122 | 879,034 | 872,228 | 930,542 | 1,068,758 | 1,090,447 |
| Variable fiber monthly cost per res customer | ||||||||||
| Video | $34.9 | $35.9 | $36.1 | $37.0 | $36.1 | $37.3 | $35.0 | $37.0 | $38.8 | $38.5 |
| Long distance | 6.1 | 5.8 | 4.8 | 4.0 | 4.1 | 4.1 | 3.5 | 3.2 | 3.3 | 3.2 |
| Total | 41.0 | 41.7 | 40.8 | 41.0 | 40.1 | 41.4 | 38.5 | 40.2 | 42.0 | 41.7 |
| Variable fiber monthly cost per bus customer | ||||||||||
| Video | $7.2 | $7.4 | $7.8 | $8.2 | $8.3 | $8.7 | $8.4 | $8.5 | $9.1 | $8.7 |
| Long distance | 6.1 | 5.8 | 4.8 | 4.0 | 4.1 | 4.1 | 3.5 | 3.2 | 3.3 | 3.2 |
| Total | 13.3 | 13.2 | 12.5 | 12.1 | 12.4 | 12.7 | 11.9 | 11.7 | 12.3 | 11.8 |
| Estimated Variable Fiber cogs | ||||||||||
| Residential | $529,970 | $546,083 | $587,084 | $660,582 | $727,551 | $799,410 | $791,911 | $844,693 | $968,802 | $987,551 |
| Business | 67,884 | 68,612 | 68,208 | 68,928 | 74,571 | 79,624 | 80,317 | 85,849 | 99,956 | 102,896 |
| Total | 597,854 | 614,695 | 655,292 | 729,510 | 802,122 | 879,034 | 872,228 | 930,542 | 1,068,758 | 1,090,447 |
| Variable COGS as a % of revenue (excluding wholesale) | ||||||||||
| Residential | 46.4% | 46.4% | 44.7% | 43.5% | 41.9% | 42.2% | 39.5% | 40.4% | 42.4% | 41.6% |
| Business | 3.8% | 3.7% | 3.4% | 3.3% | 3.3% | 3.3% | 3.2% | 3.2% | 3.6% | 3.5% |
| Total | 20.3% | 20.2% | 19.6% | 20.3% | 20.0% | 19.5% | 18.3% | 19.1% | 20.0% | 19.3% |
| Fiber Revenue (excluding wholesale) | ||||||||||
| Residential | $1,143,144 | $1,177,619 | $1,314,496 | $1,517,851 | $1,734,887 | $1,893,087 | $2,002,848 | $2,092,255 | $2,285,726 | $2,374,856 |
| Business | 1,801,965 | 1,862,533 | 2,022,291 | 2,083,533 | 2,268,515 | 2,431,899 | 2,499,819 | 2,648,921 | 2,793,006 | 2,927,366 |
| Total | 2,945,109 | 3,040,152 | 3,336,786 | 3,601,383 | 4,003,402 | 4,324,987 | 4,502,667 | 4,741,176 | 5,078,732 | 5,302,222 |
| Fiber fixed/Semi fixed cost | ||||||||||
| Transport | 205,964 | 202,423 | 231,963 | 245,987 | 287,767 | 292,456 | 300,019 | 312,493 | 353,268 | 357,694 |
| Data | 23,582 | 24,833 | 21,422 | 20,910 | 33,791 | 27,763 | 28,883 | 28,154 | 24,280 | 22,156 |
| Total fixed fiber costs | 229,546 | 227,256 | 253,385 | 266,897 | 321,558 | 320,219 | 328,902 | 340,648 | 377,549 | 379,851 |
| Growth | -1.0% | 11.5% | 5.3% | 20.5% | -0.4% | 2.7% | 3.6% | 10.8% | 0.6% | |
| Y/Y Growth | 40.1% | 40.9% | 29.8% | 27.6% | 17.4% | 18.6% | ||||
| Total Fiber COGS | ||||||||||
| Variable | 597,854 | 614,695 | 655,292 | 729,510 | 802,122 | 879,034 | 872,228 | 930,542 | 1,068,758 | 1,090,447 |
| Fixed | 229,546 | 227,256 | 253,385 | 266,897 | 321,558 | 320,219 | 328,902 | 340,648 | 377,549 | 379,851 |
| Total | 827,400 | 841,951 | 908,677 | 996,407 | 1,123,680 | 1,199,253 | 1,201,130 | 1,271,190 | 1,446,306 | 1,470,298 |
| Fiber COGS Estimate in historical financials | 1,195,271 | 1,178,515 | 1,139,683 | 1,268,980 | 1,378,067 | 1,345,926 | ||||
| Difference | 71,591 | (20,738) | (61,447) | (2,210) | (68,240) | (124,372) | ||||
| 6.0% | -1.8% | -5.4% | -0.2% | -5.0% | -9.2% | |||||
| Total Non-Fiber COGS | ||||||||||
| Variable | $5,365,445 | $5,223,023 | $5,352,132 | $5,285,365 | $5,090,470 | $4,837,816 | $4,844,814 | $4,713,595 | $4,484,105 | $4,538,972 |
| Fixed | 881,573 | 826,328 | 829,302 | 817,283 | 856,756 | 750,078 | 703,359 | 702,374 | 677,258 | 640,647 |
| Other Costs / Credits | (62,944) | (41,473) | (26,264) | 1,517 | 51,748 | 33,129 | (14,719) | 125,072 | 32,749 | 80,929 |
| Total | 6,184,075 | 6,007,878 | 6,155,170 | 6,104,165 | 5,998,974 | 5,621,023 | 5,533,454 | 5,541,040 | 5,194,112 | 5,260,548 |
| Total Non Fiber COGS | ||||||||||
| CLEC Direct Cost | $2,966,281 | $2,961,792 | $3,038,082 | $2,924,848 | $2,655,760 | $2,568,132 | $2,489,968 | $2,465,500 | $2,382,253 | $2,352,825 |
| Long Distance | 422,759 | 385,343 | 308,529 | 265,578 | 260,633 | 244,512 | 204,039 | 188,354 | 182,079 | 172,986 |
| Transport | 791,006 | 736,031 | 759,191 | 753,252 | 766,723 | 685,046 | 641,592 | 644,323 | 633,703 | 603,279 |
| Private Line | 1,321,840 | 1,398,676 | 1,370,258 | 1,299,574 | 1,302,318 | 1,250,717 | 1,272,855 | 1,237,183 | 1,167,575 | 1,186,715 |
| Data Services fixed costs | 90,567 | 90,296 | 70,110 | 64,031 | 90,033 | 65,032 | 61,767 | 58,051 | 43,555 | 37,369 |
| Universal Service Fund | 410,212 | 374,448 | 322,150 | 376,801 | 396,066 | 333,015 | 380,231 | 424,104 | 422,575 | 426,316 |
| Equipment | 244,353 | 102,763 | 157,113 | 125,780 | 152,716 | 145,869 | 201,706 | 135,729 | 80,252 | 182,537 |
| Cable | 0 | 0 | 156,001 | 292,784 | 322,977 | 295,571 | 296,015 | 262,725 | 249,371 | 217,593 |
| Other Costs / Credits | (62,944) | (41,473) | (26,264) | 1,517 | 51,748 | 33,129 | (14,719) | 125,072 | 32,749 | 80,929 |
| Total | 6,184,075 | 6,007,878 | 6,155,170 | 6,104,165 | 5,998,974 | 5,621,023 | 5,533,454 | 5,541,040 | 5,194,112 | 5,260,548 |
| Total COGS | ||||||||||
| Fiber | 827,400 | 841,951 | 908,677 | 996,407 | 1,123,680 | 1,199,253 | 1,201,130 | 1,271,190 | 1,446,306 | 1,470,298 |
| Non Fiber | 6,184,075 | 6,007,878 | 6,155,170 | 6,104,165 | 5,998,974 | 5,621,023 | 5,533,454 | 5,541,040 | 5,194,112 | 5,260,548 |
| Total | 7,011,475 | 6,849,829 | 7,063,847 | 7,100,572 | 7,122,654 | 6,820,276 | 6,734,583 | 6,812,230 | 6,640,418 | 6,730,847 |
| Fiber / Non Fiber Revenue | ||||||||||
| Fiber | 2,945,400 | 3,041,161 | 3,417,271 | 3,618,716 | 4,072,667 | 4,513,105 | 4,755,779 | 4,878,064 | 5,346,152 | 5,652,618 |
| Non Fiber | 11,311,818 | 11,057,995 | 11,184,371 | 11,081,102 | 10,851,162 | 10,571,454 | 10,170,267 | 10,057,970 | 9,590,084 | 9,533,566 |
| Total | 14,257,218 | 14,099,156 | 14,601,642 | 14,699,818 | 14,923,829 | 15,084,559 | 14,926,046 | 14,936,034 | 14,936,236 | 15,186,185 |
| Gross Margin | ||||||||||
| Fiber | 71.9% | 72.3% | 73.4% | 72.5% | 72.4% | 73.4% | 74.7% | 73.9% | 72.9% | 74.0% |
| Non-Fiber | 45.3% | 45.7% | 45.0% | 44.9% | 44.7% | 46.8% | 45.6% | 44.9% | 45.8% | 44.8% |
| Total | 50.8% | 51.4% | 51.6% | 51.7% | 52.3% | 54.8% | 54.9% | 54.4% | 55.5% | 55.7% |
20
| Description | Approx. Annual Savings | Date | Rationale | |
| Public company | IMS (Investor Relations) | $78,000 | Jan-14 | Cost associated with being a public company in USA / Israel |
| Alon / Gershon (Israel office) | $175,000 | Jan-14 | Cost associated with being a public company in USA / Israel | |
| Israel office costs (lease, etc.) | $25,000 | Jan-14 | Cost associated with being a public company in USA / Israel | |
| NYSE fees | $30,000 | Jan-14 | Cost associated with being a public company in USA / Israel | |
| Tel Aviv Stock exchange | $10,000 | Jan-14 | Cost associated with being a public company in USA / Israel | |
| SEC Lawyers (srff) | $42,000 | Jan-14 | Cost associated with being a public company in USA / Israel | |
| Auditors (going from $200K to ~$100K) | $100,000 | Jan-14 | Cost associated with being a public company in USA / Israel | |
| Security and Exchange Commission fees | $35,000 | Jan-14 | Cost associated with being a public company in USA / Israel | |
| EDGAR + Transfer Agent fees | $30,000 | Jan-14 | Cost associated with being a public company in USA / Israel | |
| Investor Relation activity (Travel, conferences etc.) | $15,000 | Jan-14 | Cost associated with being a public company in USA / Israel | |
| Tamir Fishman (options management) | $12,000 | Jan-14 | Cost associated with being a public company in USA / Israel | |
| Elimination of Board fees | $100,000 | Jan-14 | ||
| Total Savings "Going Private" | $652,000 | |||
| ADP Payroll system | ADP cost $30K, Cost reduction 90K (one individual) | $60,000 | Nov-13 | Move to an automated system / Implementation to Occur in October |
| Transport / Optimization Savings | Ongoing optimization projects for network capacity, CABS projects, and network audits | $147,000 | 2014 Vs. 2013 | Based on the following renewals/network optimization projects: Zayo core network circuits, Expired ATT Internet renewal, ATT/Verizon Business circuit renewals etc. |
| IT Projects on their way | Move OMNIA Servers To Cloud (already in model) | $9,648 | Aug-13 | Reduce physical server count by 12 with annual energy cost of $800 per server. |
| Move to Microsoft Dynamics | $37,000 | Nov-13 | Elimination of licensing fees to Infor, Infinium | |
| Move to Microsoft Dynamics | $50,752 | Nov-13 | Assumes 40 hours per week in labor cost savings @ $20/hr. due to purchase order process and inventory management efficiencies / Includes 22% Benefit Load | |
| Consolidation of Xfone & OMNIA DB | $11,712 | Dec-13 | Assumes 10 hours per week @ $20/hr. from eliminating dual DB look-up for reporting, customer care, and trouble ticketing. / 22% Benefit Load | |
| Implementation of OMNIA Tech Portal | $101,504 | Jan-14 | Assumes 80 hours per week @ $20/hr in techs calling NCC for dispatch, inventory look-up, updating, & closing tickets / 22% Benefit Load | |
| Transition to Monolith Network Monitoring | $50,000 | Jan-14 | Eliminated licensing fees to NetBoss | |
| Upgrade to OMNIA 360 | $70,272 | Mar-14 | Ability for order to go from customer web interface directly into OMNIA without re-keying data - assumes savings of 80 hours per week @$15/hr / 22% benefit Load | |
| Adding "Mariner" TR69 solution to Monolith | $135,000 | Apr-14 | Ability to monitor video solutions and trouble-shoot remotely (150 less truck rolls per month @ $75 per roll). | |
| Oasis Network Element Mediation | $101,504 | Jun-14 | Assumes 80 hours per week @$20/hr. from the ability to do "flow-thru" provisioning on all fiber orders. / 22% Benefit Load | |
| Billing Cycle Consolidation | NTS Consolidated it's billing cycles / Postage Costs savings (already in model) | $24,000 | Aug-13 | $2k per month |
| CHR Data & Switch | Network Control Center & Switch/Data Group Savings (already included in model) | $250,000 | Sep-13 | Outsourcing w/ CHR |
| Executive level changes | Org chart changes | $320,000 | Nov-13 | |
| $2,020,392 | ||||
| Headquarters New Savings | ||||
| Building Rent | $518,320 | Oct-13 | ||
| Building Insurance/Maintenance/Taxes | $176,200 | Oct-13 | ||
| Utilities | $150,000 | Oct-13 | ||
| Other / Misc. Expense | $50,000 | Oct-13 | ||
| Annual Building Expense | $894,520 | |||
| Total | $2,914,912 | |||
| Already recognized in the model | $283,648 | |||
| Added as separate cost saving lines | $2,631,264 | |||
| One time cost savings | 3Q 13 | 4Q 13 | 1Q 14 | 2Q 14 | 3Q 14 | 4Q 14 | 1Q 15 | Total | |
| General | |||||||||
| 3Q 13 (already in model) | $70,912 | $70,912 | $70,912 | $70,912 | |||||
| 4Q 13 | $85,874 | $171,748 | $257,622 | $343,496 | |||||
| 1Q14 | $23,048.50 | $46,097 | $69,146 | $92,194 | |||||
| 2Q14 | $14,781.50 | $29,563 | $44,345 | $59,126 | |||||
| Going Private | $163,000 | $163,000 | $163,000 | $163,000 | |||||
| Total | $70,912 | $156,786 | $428,709 | $552,413 | $605,205 | $299,539 | $59,126 | ||
| Accumulated cost savings | |||||||||
| General | |||||||||
| 3Q 13 - Already recognized in the model | $70,912 | $70,912 | $70,912 | $70,912 | $70,912 | $70,912 | $70,912 | ||
| 4Q 13 | $85,874 | $171,748 | $257,622 | $343,496 | $343,496 | $343,496 | |||
| 1Q14 | $23,049 | $46,097 | $69,146 | $92,194 | $92,194 | ||||
| 2Q14 | $14,782 | $29,563 | $44,345 | $59,126 | |||||
| Total General | $0 | $85,874 | $194,797 | $318,501 | $442,205 | $480,035 | $494,816 | ||
| Going Private | $163,000 | $163,000 | $163,000 | $163,000 | $163,000 | ||||
| Total savings for the model | $0 | $85,874 | $357,797 | $481,501 | $605,205 | $643,035 | $657,816 | $2,631,264 | |
| Total including cost already recognized | $70,912 | $156,786 | $428,709 | $552,413 | $676,117 | $713,947 | $728,728 | $2,914,912 |
21
| Historical Monthly COGS and SG&A | ||||||||||||||||||||||||||||||||
| 2011 | 2012 | 2013 | ||||||||||||||||||||||||||||||
| Jan-11 | Feb-11 | Mar-11 | Apr-11 | May-11 | Jun-11 | Jul-11 | Aug-11 | Sep-11 | Oct-11 | Nov-11 | Dec-11 | Jan-12 | Feb-12 | Mar-12 | Apr-12 | May-12 | Jun-12 | Jul-12 | Aug-12 | Sep-12 | Oct-12 | Nov-12 | Dec-12 | Jan-13 | Feb-13 | Mar-13 | Apr-13 | May-13 | Jun-13 | |||
| Sales & Marketing Expenses | ||||||||||||||||||||||||||||||||
| COMMISSION EXPENSE | $19,976 | $10,404 | $27,682 | $14,593 | $11,712 | $23,430 | $14,637 | ($986) | ($7,894) | ($12,549) | ($3,187) | ($23,635) | ($11,851) | ($9,155) | $35,781 | ($159,699) | $2,994 | $25,043 | ($14,790) | $8,154 | $5,583 | ($17,719) | $39,820 | $46,356 | $49,952 | $50,119 | $50,287 | $33,646 | ($4,649) | $22,327 | ||
| CONTRACT LABOR | 0 | 0 | 0 | 0 | 0 | 0 | 0 | 0 | 200 | 100 | 0 | 1,810 | 150 | 150 | 146 | (446) | 0 | 0 | 0 | 0 | 0 | 0 | 0 | 0 | 0 | 0 | 0 | 0 | 0 | 0 | ||
| EMPLOYER 401(K) EXPENSE | 1,514 | 1,402 | 1,175 | 1,141 | 1,461 | 1,161 | 1,471 | 1,337 | 1,388 | 1,131 | 1,242 | 1,196 | 1,280 | 1,269 | 1,255 | 1,310 | 1,260 | 1,038 | 1,352 | 1,400 | 1,949 | 1,761 | 1,057 | 1,062 | 1,066 | 1,071 | 1,075 | 1,056 | 1,038 | 1,022 | ||
| INSURANCE EXPENSE GROUP | 20,326 | 20,089 | 18,367 | 20,167 | 15,296 | 19,204 | 18,706 | 19,834 | 18,259 | 19,144 | 17,836 | 19,041 | 18,144 | 22,232 | 13,556 | 31,767 | 23,009 | 15,290 | 17,460 | 16,141 | 16,468 | 15,660 | 14,407 | 14,467 | 14,527 | 14,588 | 14,648 | 15,764 | 16,291 | 15,391 | ||
| SALARY EXPENSE | 220,981 | 183,776 | 169,515 | 165,636 | 194,901 | 168,602 | 192,830 | 194,723 | 223,678 | 193,732 | 202,250 | 207,459 | 168,142 | 184,517 | 147,125 | 394,693 | 199,727 | 164,388 | 193,320 | 188,055 | 224,500 | 215,843 | 142,691 | 143,286 | 143,883 | 144,482 | 145,084 | 144,263 | 140,352 | 139,150 | ||
| PAYROLL TAXES | 28,677 | 20,477 | 14,757 | 13,181 | 15,659 | 13,131 | 15,084 | 15,705 | 18,155 | 15,246 | 18,818 | 12,124 | 30,423 | 27,518 | 32,488 | 7,558 | 15,714 | 13,147 | 15,009 | 14,668 | 16,116 | 14,617 | 10,607 | 10,651 | 10,695 | 10,740 | 10,785 | 11,464 | 10,988 | 11,658 | ||
| COMMISSION WICHITA FALLS PROJECT | 0 | 0 | 0 | 0 | 0 | 0 | 0 | 0 | 0 | 0 | 0 | 0 | 0 | 0 | 0 | 0 | 0 | 0 | 0 | 0 | 0 | 0 | 0 | 0 | 0 | 0 | 0 | 0 | 0 | 0 | ||
| SELLING EXPENSES OF AMARILLO PROJECT | 0 | 0 | 0 | 0 | 0 | 0 | 0 | 0 | 0 | 0 | 0 | 0 | 0 | 0 | 0 | 0 | 0 | 0 | 0 | 0 | 0 | 0 | 0 | 0 | 0 | 0 | 0 | 0 | 0 | 0 | ||
| SELLING EXPENSES OF ABILENE PROJECT | 0 | 0 | 0 | 0 | 0 | 0 | 0 | 0 | 0 | 0 | 0 | 0 | 0 | 0 | 0 | 0 | 0 | 0 | 0 | 0 | 0 | 0 | 0 | 0 | 0 | 0 | 0 | 0 | 0 | 0 | ||
| TOTAL PAYROLL AND COMISSIONS | 291,473 | 236,147 | 231,497 | 214,718 | 239,029 | 225,530 | 242,728 | 230,613 | 253,787 | 216,804 | 236,959 | 217,995 | 206,289 | 226,531 | 230,351 | 275,182 | 242,704 | 218,906 | 212,351 | 228,418 | 264,617 | 230,163 | 208,582 | 215,821 | 220,123 | 221,000 | 221,880 | 206,193 | 164,020 | 189,548 | ||
| ADVERTISING | 24,154 | 32,013 | 24,719 | 25,436 | 14,118 | 15,488 | 4,788 | 3,567 | 23,553 | 25,520 | 7,249 | 23,971 | 28,910 | 24,210 | 32,811 | (7,003) | 26,213 | 15,553 | 12,128 | 20,669 | 23,601 | 17,204 | 13,414 | 13,470 | 13,526 | 13,582 | 13,639 | 17,489 | 12,791 | 14,843 | ||
| AUTO EXPENSE | 0 | 0 | 0 | 0 | 0 | 0 | 0 | 0 | 0 | 0 | 0 | 0 | 533 | 0 | 1,050 | (1,050) | 0 | 0 | 0 | 0 | 0 | 0 | 71 | 71 | 71 | 71 | 72 | 0 | 0 | 0 | ||
| BUSINESS MEALS | 1,665 | 1,255 | 1,035 | 943 | 846 | 203 | 253 | 156 | 345 | 258 | 558 | 1,008 | 307 | 1,852 | (1,247) | 3,023 | 1,590 | 694 | 209 | 598 | 270 | 1,650 | 1,676 | 1,683 | 1,690 | 1,697 | 1,704 | 1,757 | 604 | 1,162 | ||
| CUSTODIAL EXPENSE | 0 | 0 | 0 | 0 | 0 | 0 | 0 | 0 | 0 | 0 | 0 | 0 | 0 | 0 | 0 | 1,050 | 300 | 300 | 300 | 300 | 300 | 0 | 338 | 339 | 340 | 342 | 343 | 786 | 3,825 | 750 | ||
| DUES & SUBSCRIPTIONS | 871 | 819 | 0 | 700 | 250 | 180 | 2,550 | (440) | 139 | 885 | 0 | 1,250 | 941 | 375 | 1,481 | 426 | 555 | 400 | 730 | 560 | 625 | 375 | 375 | 377 | 378 | 380 | 381 | 750 | 350 | 411 | ||
| ENGINEERING FEES | 0 | 0 | 0 | 0 | 0 | 0 | 0 | 0 | 0 | 0 | 0 | 0 | 0 | 0 | 0 | 0 | 0 | 0 | 0 | 0 | 0 | 0 | 0 | 0 | 0 | 0 | 0 | 0 | 0 | 0 | ||
| ENTERTAINMENT & PROMO | 1,514 | 0 | 1,149 | 31 | 0 | 150 | 1,000 | 450 | 500 | 500 | 462 | 22 | 500 | 7,378 | (6,392) | 36,161 | 12,549 | 7,486 | 9,904 | 9,844 | 13,750 | 18,167 | 13,880 | 13,938 | 13,996 | 14,055 | 14,113 | 15,695 | 19,649 | 16,291 | ||
| FREIGHT EXPENSE | 631 | 209 | 423 | 465 | 126 | 108 | 166 | 226 | 160 | 453 | 268 | 395 | 319 | 169 | 461 | 274 | 50 | 198 | 124 | 97 | 164 | 599 | 519 | 521 | 523 | 525 | 527 | 801 | 757 | 801 | ||
| INTERNET EXPENSE | 475 | 475 | 475 | 475 | 475 | 475 | 475 | 475 | 475 | 475 | 475 | 475 | 475 | 475 | 462 | 488 | 2,758 | 1,440 | 1,456 | 1,539 | 839 | 4,203 | (1,265) | (1,270) | (1,276) | (1,281) | (1,286) | 784 | 783 | 783 | ||
| MISCELLANEOUS EXPENSE | 3,541 | 828 | 835 | 573 | 449 | 1,146 | 56 | 95 | 743 | 790 | 3,715 | (1,914) | 1,185 | 787 | 1,550 | 1,251 | 1,105 | 956 | 553 | 995 | 1,157 | 1,115 | 811 | 814 | 818 | 821 | 825 | 1,685 | (2,686) | 95 | ||
| MOVING EXPENSE | 0 | 0 | 0 | 0 | 0 | 0 | 0 | 0 | 0 | 0 | 0 | 0 | 0 | 0 | 0 | 0 | 0 | 0 | 0 | 0 | 0 | 0 | 0 | 0 | 0 | 0 | 0 | 0 | 0 | 0 | ||
| OFFICE SUPPLIES | 5,844 | 1,430 | 851 | 1,101 | 1,660 | 1,535 | 1,490 | 1,737 | 941 | 1,581 | 2,178 | 4,249 | 8,689 | 6,092 | 11,046 | (4,269) | 1,728 | 2,240 | 930 | 2,006 | 4,552 | 1,367 | 871 | 875 | 879 | 882 | 886 | 1,260 | 2,748 | 2,172 | ||
| POSTAGE EXPENSE | 0 | 206 | 141 | 135 | 0 | 88 | 18 | 0 | 88 | 88 | 176 | 47 | 88 | 0 | 174 | 33 | 129 | 0 | 88 | 0 | 0 | 400 | 0 | 0 | 0 | 0 | 0 | 4 | 0 | 0 | ||
| RENTAL EXP BUILDING | 24,413 | 24,966 | 20,899 | 16,576 | 21,366 | 20,690 | 19,960 | 19,478 | 16,987 | 9,430 | 6,737 | 12,364 | 10,768 | 11,059 | 10,181 | 14,955 | 11,600 | 16,845 | 14,757 | 15,906 | (17,410) | 8,714 | 9,815 | 9,856 | 9,897 | 9,938 | 9,980 | 9,235 | 8,760 | 9,081 | ||
| UTILITIES | 4,443 | 4,461 | 4,480 | 4,499 | 4,445 | 4,816 | 5,673 | |||||||||||||||||||||||||
| RENTAL EXPENSE EQUIP | 1,313 | 1,075 | 1,138 | 1,159 | 1,149 | 1,145 | 1,027 | 1,277 | 1,242 | 1,321 | 1,424 | 1,009 | 1,174 | 1,195 | 1,121 | 1,839 | 1,538 | 2,670 | 2,549 | 3,229 | 2,621 | 2,623 | 2,642 | 2,653 | 2,664 | 2,675 | 2,686 | 2,140 | 4,240 | 2,148 | ||
| TELEPHONE EXPENSE | 7,381 | 6,983 | 6,737 | 9,905 | 3,409 | 4,896 | 4,242 | 4,723 | 3,717 | 4,917 | 4,145 | 4,428 | 4,787 | 4,417 | 5,024 | 3,145 | 3,256 | 4,448 | 3,754 | 3,338 | 3,417 | 2,220 | 3,713 | 3,729 | 3,744 | 3,760 | 3,775 | 1,021 | 2,370 | 3,326 | ||
| TRAINING EXPENSE | 0 | 0 | 0 | 0 | 0 | 0 | 0 | 0 | 0 | 0 | 3,753 | (3,503) | 0 | 21 | (21) | 521 | 110 | 0 | 470 | 0 | 0 | 0 | 0 | 0 | 0 | 0 | 0 | 0 | 0 | 0 | ||
| TRAVEL | 13,789 | 11,616 | 10,591 | 8,875 | 13,649 | 8,117 | 8,733 | 9,562 | 12,919 | 12,286 | 13,420 | 11,359 | 6,232 | 7,147 | 5,069 | 20,203 | 13,737 | 11,523 | 8,614 | 10,515 | 8,889 | 10,100 | 16,920 | 16,990 | 17,061 | 17,132 | 17,204 | 29,898 | 3,263 | 18,780 | ||
| TOTAL OTHER EXPENSES | 85,590 | 81,874 | 68,992 | 66,374 | 57,498 | 54,221 | 44,757 | 41,308 | 61,808 | 58,503 | 44,560 | 55,159 | 64,907 | 65,177 | 62,770 | 71,048 | 77,218 | 64,753 | 56,566 | 69,597 | 42,775 | 68,737 | 63,780 | 68,488 | 68,773 | 69,060 | 69,348 | 87,751 | 62,270 | 76,317 | ||
| TOTAL SALES & MARKETING | 377,063 | 318,021 | 300,489 | 281,092 | 296,526 | 279,751 | 287,485 | 271,921 | 315,594 | 275,308 | 281,519 | 273,154 | 271,196 | 291,708 | 293,120 | 346,231 | 319,923 | 283,659 | 268,918 | 298,016 | 307,391 | 298,899 | 272,361 | 284,309 | 288,897 | 290,060 | 291,228 | 293,944 | 226,289 | 265,865 | ||
| GENRAL & ADMINISTRATIVE | ||||||||||||||||||||||||||||||||
| CONTRACT LABOR | 18,700 | 18,700 | 16,700 | 21,626 | 27,626 | 21,626 | 20,639 | 20,639 | 20,639 | 19,277 | 33,968 | 4,585 | 6,820 | 7,394 | 5,242 | 9,968 | 8,243 | 10,430 | 7,644 | 8,887 | 12,765 | 8,845 | 8,705 | 8,734 | 8,765 | 8,795 | 8,825 | 22,202 | 12,564 | 4,619 | ||
| EMPLOYER 401(K) EXPENSE | 4,339 | 4,272 | 4,191 | 5,121 | 4,195 | 4,249 | 3,967 | 3,971 | 4,785 | 3,880 | 3,792 | 3,693 | 3,813 | 3,658 | 3,329 | 4,667 | 3,512 | 3,424 | 3,321 | 3,818 | 2,876 | 2,730 | 2,765 | 2,777 | 2,788 | 2,800 | 2,812 | 2,434 | 2,384 | 2,139 | ||
| INSURANCE EXPENSE GROUP | 68,894 | 73,790 | 51,498 | 70,840 | 73,743 | 64,466 | 65,874 | 70,274 | 64,090 | 69,858 | 64,436 | 68,600 | 67,283 | 69,001 | 54,298 | 68,372 | 101,491 | 73,859 | 62,258 | 56,502 | 61,254 | 52,036 | 51,846 | 52,062 | 52,279 | 52,497 | 52,716 | 63,759 | 70,032 | 59,592 | ||
| SALARY EXPENSE | 733,191 | 715,844 | 724,919 | 599,477 | 683,131 | 738,274 | 697,388 | 729,766 | 663,806 | 712,195 | 732,098 | 660,617 | 723,126 | 659,607 | 667,513 | 714,479 | 777,562 | 620,422 | 654,088 | 641,746 | 598,353 | 626,338 | 598,979 | 551,407 | 565,638 | 567,928 | 570,227 | 582,347 | 559,825 | 693,085 | ||
| PAYROLL TAXES | 81,506 | 75,335 | (4,374) | 76,440 | 48,610 | 44,344 | 40,933 | 41,774 | 58,763 | 43,597 | 42,473 | 43,263 | 86,212 | 77,019 | 80,966 | (40,337) | 57,677 | 86,296 | 41,020 | 51,175 | 77,266 | 37,073 | 37,253 | 37,409 | 37,565 | 37,721 | 37,878 | 51,918 | 65,312 | 42,583 | ||
| TOTAL PAYROLL | 906,630 | 887,940 | 792,934 | 773,504 | 837,305 | 872,958 | 828,801 | 866,424 | 812,083 | 848,807 | 876,767 | 780,759 | 887,254 | 816,679 | 811,346 | 757,149 | 948,485 | 794,431 | 768,331 | 762,128 | 752,515 | 727,022 | 699,548 | 652,390 | 667,035 | 669,741 | 672,458 | 722,659 | 710,117 | 802,018 | ||
| INS EXP CAS & LIABILITY | 35,397 | 31,078 | 33,642 | 43,950 | 41,369 | 44,964 | 31,286 | 20,069 | 37,622 | 43,844 | 13,085 | 48,027 | 43,340 | 43,406 | 37,308 | 50,755 | 44,549 | 42,658 | 42,677 | 33,718 | 42,913 | 39,795 | 38,737 | 38,870 | 39,003 | 39,136 | 39,270 | 40,285 | 40,054 | 55,763 | ||
| UTILITIES | 38,103 | 52,785 | 41,964 | 46,125 | 55,868 | 45,921 | 65,999 | 42,937 | 43,163 | 50,732 | 43,422 | 43,883 | 66,087 | 52,932 | 68,184 | 40,028 | 56,261 | 66,535 | 69,006 | 58,878 | 67,182 | 55,995 | 50,929 | 51,141 | 51,355 | 51,569 | 51,783 | 51,803 | 56,454 | 73,529 | ||
| REPAIR & MAINTENANCE | 19,720 | 18,031 | 18,890 | 24,021 | 41,206 | 31,325 | 15,292 | 14,759 | 15,965 | 14,214 | 15,737 | 36,558 | 21,477 | 39,363 | 72 | 46,784 | 20,423 | 13,613 | 19,222 | 24,084 | 26,718 | 23,278 | 12,591 | 12,644 | 10,196 | 10,239 | 10,281 | 16,632 | 15,836 | 12,654 | ||
| TOTAL UTILITIES & INSURANCE | 93,220 | 101,894 | 94,495 | 114,096 | 138,443 | 122,210 | 112,577 | 77,764 | 96,750 | 108,790 | 72,245 | 128,469 | 130,904 | 135,700 | 105,564 | 137,567 | 121,233 | 122,806 | 130,905 | 116,681 | 136,812 | 119,068 | 102,258 | 102,655 | 100,553 | 100,943 | 101,335 | 108,720 | 112,344 | 141,946 | ||
| RENT EXPENSE - PARKING | 500 | 500 | 500 | 500 | 500 | 500 | 500 | 500 | 500 | 500 | 500 | 500 | 500 | 500 | 416 | 584 | 500 | 500 | 500 | 500 | 500 | 500 | 500 | 502 | 504 | 506 | 508 | 500 | 500 | 500 | ||
| RENTAL - BUILDING | 111,518 | 104,317 | 102,763 | 102,682 | 102,535 | 102,874 | 103,994 | 108,103 | 108,763 | 107,998 | 108,466 | 108,491 | 103,176 | 103,812 | 85,260 | 107,502 | 133,271 | 101,401 | 109,052 | 106,025 | 107,037 | 106,700 | 107,706 | 108,155 | 108,605 | 109,058 | 109,512 | 121,665 | 111,687 | 81,716 | ||
| RENTAL EXP EQUIPMENT | 80,282 | 85,222 | 75,638 | 75,075 | 86,403 | 67,835 | 69,178 | 89,349 | 110,228 | 71,057 | 81,487 | 82,815 | 85,589 | 94,224 | 62,619 | 112,059 | 111,504 | 94,551 | 94,575 | 106,653 | 96,862 | 79,321 | 85,302 | 85,657 | 86,014 | 86,373 | 86,732 | 69,625 | 75,195 | 111,831 | ||
| TOTAL RENTAL & LEASES | 192,300 | 190,039 | 178,902 | 178,257 | 189,438 | 171,209 | 173,672 | 197,952 | 219,491 | 179,555 | 190,453 | 191,807 | 189,265 | 198,536 | 148,296 | 220,145 | 245,275 | 196,451 | 204,126 | 213,178 | 204,399 | 186,521 | 193,508 | 194,314 | 195,124 | 195,937 | 196,753 | 191,789 | 187,382 | 194,047 | ||
| LEGAL & ACCOUNTING | 49,633 | 18,095 | 38,481 | 44,007 | 37,045 | 38,265 | 29,951 | 36,302 | 45,552 | 26,983 | 18,727 | 31,406 | 40,456 | 21,778 | 53,481 | 11,985 | 41,736 | 44,224 | 21,618 | 27,689 | 34,507 | 22,371 | 66,257 | 66,495 | 66,735 | 66,975 | 67,217 | 14,439 | 80,477 | 69,936 | ||
| BAD DEBT EXPENSE | 48,498 | 37,076 | 27,189 | 72,151 | 73,520 | 14,636 | 44,111 | 84,582 | 13,958 | 59,954 | 67,475 | 38,417 | 44,699 | 77,713 | 4,199 | 74,829 | 79,185 | (24,807) | 154,185 | 51,495 | (94,774) | 56,743 | 71,733 | 66,993 | 66,873 | 66,768 | 66,769 | 50,505 | 70,043 | 1,038,596 | ||
| ADVERTISING | 10,045 | 3,312 | 1,042 | 666 | 3,036 | 5,710 | 824 | 599 | 54 | 103 | 244 | 224 | 494 | 164 | 742 | 1,355 | (2,459) | 44 | 52 | 44 | 44 | 77 | 27 | 28 | 28 | 28 | 28 | (319) | 44 | 44 | ||
| AUTO EXPENSE | 26,389 | 12,465 | 18,300 | 17,328 | 19,592 | 18,323 | 19,433 | 12,722 | 45,654 | 26,489 | 27,849 | 26,437 | 21,182 | 24,894 | 13,923 | 21,849 | 46,030 | 19,060 | 16,341 | 22,755 | 20,746 | 18,867 | 19,678 | 19,760 | 19,843 | 19,925 | 20,008 | 22,157 | 22,390 | 13,587 | ||
| COLLECTION FEES | (32) | 1,004 | 330 | 397 | 170 | 399 | 335 | 592 | (8) | 4,445 | 75 | 488 | 7,696 | 2,471 | 11,632 | (5,509) | 2,246 | 2,637 | 5,025 | 2,721 | 2,947 | 3,560 | 7,418 | 3,724 | 3,740 | 3,755 | 3,771 | 3,798 | 4,212 | 2,884 | ||
| BUSINESS MEALS | 2,623 | 2,761 | 4,390 | 1,072 | 1,790 | (212) | 3,243 | 3,420 | 2,143 | 73 | 4,110 | 2,804 | 5 | 23 | (13) | 721 | 317 | (1,095) | 10 | 187 | 54 | 190 | 88 | 88 | 89 | 89 | 89 | 9 | 125 | 53 | ||
| COMPUTER EXPENSE | 48,735 | 50,128 | 52,445 | 51,496 | 50,457 | 50,479 | 49,933 | 49,471 | 50,539 | 48,076 | 42,694 | 47,422 | 48,911 | 49,031 | 40,601 | 49,107 | 65,441 | 49,458 | 55,988 | 55,586 | 133,732 | 108,310 | 90,750 | 91,128 | 91,508 | 91,889 | 131,278 | 140,262 | 128,192 | 187,927 | ||
| CUSTODIAL SERVICES | 6,267 | 6,170 | 6,359 | 6,170 | 6,075 | 6,273 | 6,174 | 6,273 | 6,359 | 6,108 | 6,488 | 7,250 | 6,297 | 5,359 | 6,180 | 6,015 | 6,145 | 5,909 | 6,119 | 5,643 | 5,705 | 3,860 | 5,293 | 5,315 | 5,337 | 5,360 | 5,382 | 5,053 | 4,958 | 5,014 | ||
| BANK CHARGES | 0 | 0 | 0 | 0 | 0 | 0 | 0 | 0 | 0 | 0 | 0 | 0 | 303 | 303 | 303 | (136) | (136) | (136) | 39 | 39 | 39 | 39 | 0 | 0 | 0 | 0 | 0 | 0 | 0 | 0 | ||
| PROVISION FOR DISPUTES | 0 | 0 | 0 | 0 | 0 | 0 | 0 | 0 | 0 | 0 | 0 | 0 | 0 | 0 | 0 | 0 | 0 | 0 | 0 | 0 | 0 | 0 | 0 | 0 | 0 | 0 | 0 | 0 | 0 | 0 | ||
| DIRECTOR FEES & EXPENSE | 9,000 | 9,000 | 9,000 | (3,700) | (3,700) | (3,700) | 10,041 | 10,041 | 10,041 | 4,129 | 4,129 | 4,129 | 45 | 45 | 45 | 2,000 | 2,000 | 2,000 | 4,622 | 4,622 | 4,622 | 4,622 | 4,622 | 4,622 | 4,622 | 4,622 | 4,622 | 10,000 | 10,000 | (8,478) | ||
| DUES & SUBSCRIPTIONS | 2,096 | 4,794 | 1,835 | 1,835 | 1,835 | 3,868 | 3,236 | 2,736 | 1,681 | (1,624) | 3,290 | 1,136 | 1,382 | 1,616 | 917 | 7,401 | 2,053 | 2,711 | 2,430 | 1,319 | 1,488 | 1,115 | 1,996 | 2,005 | 2,013 | 2,021 | 2,030 | 2,290 | 2,436 | 1,666 | ||
| ENGINEERING FEES | 480 | 0 | 0 | 2,128 | 760 | 0 | 1,992 | 920 | 0 | 656 | 2,544 | 42 | 1,376 | 392 | 2,130 | (810) | 0 | 664 | 432 | 608 | 632 | 680 | 808 | 811 | 815 | 818 | 822 | 0 | 0 | 608 | ||
| ENTERTAINMENT & PROMO | 1,126 | 2,340 | 416 | 2,176 | 0 | 1,200 | 218 | 892 | 1,499 | 815 | 4,241 | 4,167 | 3,120 | 514 | 5,203 | (5,217) | 423 | 3,025 | 0 | 3,352 | 0 | 4,771 | 2,852 | 2,864 | 2,876 | 2,888 | 2,900 | 6,955 | 673 | 3,079 | ||
| FREIGHT EXPENSE | 1,999 | 2,279 | 2,596 | 2,571 | 3,210 | 2,854 | 3,120 | 3,572 | 7,078 | 3,070 | 2,682 | 2,993 | 3,264 | 2,014 | 3,967 | 1,920 | 2,803 | 2,435 | 2,702 | 1,988 | 2,096 | 2,224 | 1,531 | 1,537 | 1,543 | 1,550 | 1,556 | 3,371 | 4,791 | 3,323 | ||
| INTERNET EXPENSE | 500 | 500 | 500 | 500 | 500 | 500 | 500 | 500 | 500 | 500 | 500 | 500 | 500 | 500 | 416 | 584 | 1,799 | 1,615 | 1,611 | 1,571 | 2,059 | 4,268 | 3,829 | 3,845 | 3,861 | 3,877 | 3,893 | 5,002 | 3,787 | 4,406 | ||
| LICENSES & FEES | 10,221 | 14,403 | 10,673 | 8,506 | 9,043 | 11,105 | 4,984 | 14,549 | 13,224 | 12,416 | 16,980 | 13,376 | 12,268 | 13,465 | 9,017 | 13,960 | 13,308 | 11,823 | 13,514 | 20,480 | 18,561 | 14,509 | 16,931 | 14,408 | 14,468 | 14,529 | 14,589 | 22,614 | 7,821 | 33,857 | ||
| MANAGEMENT SERVICE FEE | 2,696 | 3,063 | 3,087 | 2,701 | 2,667 | 3,780 | 572 | 3,141 | 2,740 | 3,166 | 3,019 | 3,555 | 2,930 | 2,886 | 2,483 | 3,342 | 3,004 | 3,646 | 3,054 | 3,272 | 2,958 | 3,003 | 3,294 | 3,308 | 3,321 | 3,335 | 3,349 | 2,736 | 3,226 | 2,697 | ||
| MISCELLANEOUS EXPENSE | 15,729 | 9,710 | 10,373 | 46,624 | 42,904 | 43,877 | 26,680 | 26,496 | 27,525 | 22,172 | 20,509 | 21,442 | 16,711 | 21,543 | 10,821 | 18,353 | 41,278 | 24,930 | 21,078 | 20,097 | 23,565 | 30,221 | 26,225 | 21,526 | 21,585 | 21,643 | 21,702 | 18,862 | 19,902 | 92,131 | ||
| MOVING EXPENSES | 0 | 0 | 0 | 0 | 0 | 0 | 0 | 0 | 0 | 3,747 | 64 | 0 | 0 | 0 | 0 | 726 | 423 | 0 | 0 | 0 | 0 | 0 | 0 | 0 | 0 | 0 | 0 | 0 | 0 | 0 | ||
| OFFICE SUPPL & POSTAGE | 37,963 | 30,087 | 27,578 | 27,850 | 31,969 | 33,992 | 29,069 | 30,813 | 32,758 | 29,444 | 29,003 | 22,559 | 32,173 | 35,696 | 23,551 | 40,523 | 39,560 | 27,640 | 32,199 | 37,568 | 16,388 | (14,014) | 11,375 | 11,417 | 11,458 | 11,500 | 11,542 | 6,652 | 9,936 | 8,578 | ||
| OFFICE RELOCATION EXP | 0 | 497 | 6,600 | 973 | 0 | 268 | 0 | 0 | 0 | 0 | 0 | 0 | 0 | 0 | 0 | 0 | 0 | 0 | 0 | 0 | 0 | 0 | 0 | 0 | 0 | 0 | 0 | 0 | 0 | 0 | ||
| SUPPLIES | 4,391 | 3,561 | 3,704 | 1,758 | 811 | 1,442 | 2,746 | 5,675 | 35,294 | 6,806 | 6,691 | 16,076 | 12,410 | 14,403 | 8,338 | 12,466 | 6,009 | 8,723 | 12,812 | 6,739 | (4,018) | 8,098 | 8,895 | 8,932 | 8,969 | 9,006 | 9,044 | 10,888 | 10,803 | 24,430 | ||
| TAXES OTHER | 0 | 0 | 0 | 6,447 | 7,442 | 8,858 | 6,684 | 13,041 | 2,108 | 7,778 | 9,924 | 7,859 | 6,755 | 6,756 | 5,622 | 7,810 | 6,267 | 8,302 | 6,194 | 11,633 | 7,546 | 11,333 | 19,213 | 8,894 | 8,931 | 8,969 | 9,006 | 4,893 | 9,779 | 6,910 | ||
| TAXES PROPERTY | 0 | 0 | 0 | 0 | 0 | 0 | 0 | 0 | 0 | 0 | 0 | 0 | 0 | 0 | 0 | 0 | 0 | 0 | 0 | 0 | 0 | 0 | 0 | 0 | 0 | 0 | 0 | 0 | 0 | 0 | ||
| TAXES FRANCHISE | 6,797 | 6,717 | 7,603 | 0 | 0 | 0 | 0 | 0 | 0 | 0 | 0 | 1,395 | (573) | 0 | (1,050) | 1,050 | 0 | 0 | 0 | 0 | 0 | 0 | 0 | 0 | 0 | 0 | 0 | 0 | 0 | 0 | ||
| TELEPHONE EXPENSE | 9,521 | 9,356 | 8,684 | 9,151 | 7,161 | 6,775 | 7,964 | 10,115 | 9,035 | 7,912 | 9,433 | 9,700 | 10,393 | 9,536 | 9,510 | 10,248 | 11,171 | 10,501 | 11,148 | 11,178 | 10,515 | 9,558 | 13,084 | 10,666 | 10,711 | 10,755 | 10,800 | 8,468 | 10,793 | 15,384 | ||
| TRAINING EXPENSE | 275 | 70 | 670 | 0 | 0 | 0 | 0 | 786 | 275 | 526 | 5,491 | 481 | 23 | 275 | (1,143) | 508 | (40,344) | 36,284 | 9,986 | 8,868 | 8,868 | 0 | 8,868 | 8,868 | 8,868 | 8,868 | 8,868 | 8,868 | 9,026 | 2,313 | ||
| TRAVEL | 14,517 | 9,557 | 12,257 | 11,364 | 15,142 | 22,812 | 15,280 | 12,597 | 12,852 | 12,247 | 16,994 | 14,765 | 14,039 | 19,774 | 7,781 | 24,219 | 11,770 | 25,632 | 22,783 | 18,725 | 17,000 | 20,399 | 16,957 | 17,012 | 15,734 | 15,784 | 15,834 | 18,462 | 15,130 | 21,172 | ||
| STOCK OPTION COMP | 27,665 | 27,665 | 27,665 | 19,544 | 19,544 | 19,544 | 8,189 | 8,189 | 8,189 | 78,064 | 78,064 | 78,064 | 13,510 | 13,510 | 13,510 | 12,872 | 12,872 | 12,872 | 21,463 | 21,463 | 21,463 | 46,633 | 46,633 | 46,633 | 17,695 | 17,695 | 17,695 | 7,462 | 7,462 | 104,293 | ||
| ADMIN EXPENSES OF AMARILLO PROJECT | 0 | 0 | 0 | 0 | 0 | 0 | 0 | 0 | 0 | 0 | 0 | 0 | 0 | 0 | 0 | 0 | 0 | 0 | 0 | 0 | 0 | 0 | 0 | 0 | 0 | 0 | 0 | 0 | 0 | 0 | ||
| ADMIN EXPENSES OF ABILENE PROJECT | 0 | 0 | 0 | 0 | 0 | 0 | 0 | 0 | 0 | 0 | 0 | 0 | 0 | 0 | 0 | 0 | 0 | 0 | 0 | 0 | 0 | 0 | 0 | 0 | 0 | 0 | 0 | 0 | 0 | 0 | ||
| TOTAL OTHER EXPENSES | 239,004 | 209,439 | 216,107 | 217,556 | 220,405 | 238,146 | 201,217 | 217,139 | 269,540 | 277,116 | 295,017 | 286,866 | 215,212 | 225,168 | 174,485 | 225,355 | 231,979 | 258,681 | 249,601 | 260,460 | 297,010 | 282,324 | 310,368 | 287,392 | 258,015 | 258,908 | 298,810 | 308,485 | 285,486 | 525,877 | ||
| TOTAL G&A | 1,529,285 | 1,444,483 | 1,348,107 | 1,399,570 | 1,496,156 | 1,457,424 | 1,390,329 | 1,480,162 | 1,457,374 | 1,501,205 | 1,520,684 | 1,457,723 | 1,507,791 | 1,475,574 | 1,297,371 | 1,427,031 | 1,667,892 | 1,391,787 | 1,528,766 | 1,431,631 | 1,330,469 | 1,394,049 | 1,443,671 | 1,370,239 | 1,354,335 | 1,359,271 | 1,403,342 | 1,396,597 | 1,445,847 | 2,772,421 | ||
| TOTAL SG&A | 1,906,348 | 1,762,504 | 1,648,596 | 1,680,662 | 1,792,682 | 1,737,175 | 1,677,814 | 1,752,083 | 1,772,968 | 1,776,513 | 1,802,203 | 1,730,877 | 1,778,987 | 1,767,282 | 1,590,491 | 1,773,262 | 1,987,815 | 1,675,445 | 1,797,684 | 1,729,646 | 1,637,860 | 1,692,948 | 1,716,032 | 1,654,548 | 1,643,232 | 1,649,331 | 1,694,570 | 1,690,541 | 1,672,137 | 3,038,286 | ||
22
| Graph Data - Take Rate by Calendar Quarter | |||||||||||||||||||||||||
| Smart Build | 1 | 2 | 3 | 4 | 5 | 6 | 7 | 8 | 9 | 10 | 11 | 12 | 13 | 14 | 15 | 16 | 17 | 18 | 19 | 20 | 21 | 22 | 23 | 24 | 25 |
| Wichita Falls | 9% | 17% | 23% | 31% | |||||||||||||||||||||
| 31% | 38% | 45% | 46% | 46% | 46% | 47% | 47% | 47% | 48% | 48% | 49% | 49% | 49% | ||||||||||||
| Abilene | 3% | ||||||||||||||||||||||||
| 3% | 16% | 27% | 38% | 39% | 39% | 39% | 40% | 40% | 41% | 41% | 41% | 42% | 42% | ||||||||||||
| Amarillo | 2% | ||||||||||||||||||||||||
| 2% | 11% | 20% | 24% | 29% | 30% | 30% | 31% | 32% | 33% | 33% | 34% | 35% | |||||||||||||
| Bus: Pride 1 and Levelland | 1 | 2 | 3 | 4 | 5 | 6 | 7 | 8 | 9 | 10 | 11 | 12 | 13 | 14 | 15 | 16 | 17 | 18 | 19 | 20 | 21 | 22 | 23 | 24 | 25 |
| Levelland | 12% | 18% | 25% | 36% | 43% | 47% | 49% | 56% | 57% | 59% | 61% | 64% | 65% | 66% | 68% | 69% | |||||||||
| 69% | 69% | 69% | 69% | 69% | 70% | 70% | 70% | 70% | 70% | ||||||||||||||||
| Littlefield | 15% | 28% | 34% | 40% | 43% | 40% | 41% | 41% | 43% | ||||||||||||||||
| 43% | 44% | 45% | 54% | 63% | 63% | 63% | 63% | 63% | 63% | 63% | 63% | 63% | 63% | ||||||||||||
| Brownfield | 10% | 24% | 31% | 49% | 54% | 61% | 61% | 61% | |||||||||||||||||
| 61% | 61% | 61% | 64% | 68% | 68% | 68% | 68% | 68% | 68% | 68% | 68% | 68% | 68% | ||||||||||||
| Slaton | 12% | 17% | 21% | 22% | 24% | 27% | 29% | ||||||||||||||||||
| 29% | 31% | 32% | 34% | 35% | 37% | 38% | 40% | 41% | 43% | 44% | 46% | 47% | 49% | ||||||||||||
| Wilson | 8% | 17% | 17% | 17% | 17% | 17% | |||||||||||||||||||
| 17% | 17% | 17% | 17% | 17% | 17% | 17% | 17% | 17% | 17% | 17% | 17% | 17% | 17% | ||||||||||||
| Lamesa | 1% | 40% | 50% | 53% | 57% | 59% | |||||||||||||||||||
| 59% | 61% | 62% | 67% | 67% | 67% | 67% | 67% | 67% | 67% | 67% | 67% | 67% | 67% | ||||||||||||
| Plainview | 4% | 29% | 35% | 39% | 40% | ||||||||||||||||||||
| 40% | 42% | 49% | 56% | 58% | 60% | 61% | 63% | 63% | 63% | 63% | 63% | 63% | 63% | ||||||||||||
| Res: Pride 1 and Levelland | 1 | 2 | 3 | 4 | 5 | 6 | 7 | 8 | 9 | 10 | 11 | 12 | 13 | 14 | 15 | 16 | 17 | 18 | 19 | 20 | 21 | 22 | 23 | 24 | 25 |
| Levelland | 1.99% | 9.16% | 20.02% | 28.22% | 33.78% | 37% | 38% | 37% | 38% | 38% | 38% | 39% | 38% | 39% | 38% | 38% | |||||||||
| 38% | 38% | 38% | 39% | 39% | 39% | 40% | 40% | 40% | 41% | ||||||||||||||||
| Littlefield | 18% | 28% | 35% | 36% | 38% | 39% | 43% | 41% | 41% | ||||||||||||||||
| 41% | 41% | 41% | 41% | 42% | 42% | 42% | 43% | 43% | 43% | 43% | 43% | 43% | 43% | ||||||||||||
| Whitharral | 5% | 13% | 12% | 11% | 12% | 18% | 18% | 21% | |||||||||||||||||
| 21% | 22% | 23% | 24% | 24% | 25% | 26% | 27% | 27% | 28% | 29% | 30% | 30% | 31% | ||||||||||||
| Brownfield | 12% | 27% | 32% | 35% | 36% | 37% | 38% | 39% | |||||||||||||||||
| 39% | 39% | 40% | 40% | 40% | 41% | 41% | 42% | 42% | 42% | 42% | 42% | 42% | 42% | ||||||||||||
| Slaton | 5% | 9% | 11% | 13% | 16% | 17% | 18% | ||||||||||||||||||
| 18% | 19% | 20% | 20% | 21% | 22% | 23% | 23% | 24% | 25% | 26% | 26% | 27% | 28% | ||||||||||||
| Wilson | 11% | 18% | 20% | 23% | 23% | 25% | |||||||||||||||||||
| 25% | 26% | 27% | 28% | 28% | 29% | 30% | 31% | 31% | 32% | 33% | 34% | 34% | 35% | ||||||||||||
| Lamesa | 4% | 14% | 19% | 22% | 26% | 27% | |||||||||||||||||||
| 27% | 29% | 30% | 32% | 33% | 35% | 36% | 38% | 39% | 40% | 40% | 40% | 40% | 40% | ||||||||||||
| Meadow | 4% | 16% | 18% | 23% | 26% | 27% | |||||||||||||||||||
| 27% | 28% | 29% | 29% | 30% | 31% | 32% | 32% | 33% | 34% | 35% | 35% | 36% | 37% | ||||||||||||
| Ropesville | 2% | 15% | 17% | 20% | 22% | 23% | |||||||||||||||||||
| 23% | 24% | 25% | 25% | 26% | 27% | 28% | 28% | 29% | 30% | 31% | 31% | 32% | 33% | ||||||||||||
| Plainview | 0% | 3% | 8% | 12% | 14% | ||||||||||||||||||||
| 14% | 16% | 19% | 20% | 22% | 23% | 25% | 26% | 28% | 29% | 31% | 32% | 34% | 35% | ||||||||||||
| Bus: Pride 2 and Levelland | 1 | 2 | 3 | 4 | 5 | 6 | 7 | 8 | 9 | 10 | 11 | 12 | 13 | 14 | 15 | 16 | 17 | 18 | 19 | 20 | 21 | 22 | 23 | 24 | 25 |
| Levelland | 11.61% | 17.74% | 24.93% | 36.46% | 42.58% | 47% | 49% | 56% | 57% | 59% | 61% | 64% | 65% | 66% | 68% | 69% | |||||||||
| 69% | 69% | 69% | 69% | 69% | 70% | 70% | 70% | 70% | 70% | ||||||||||||||||
| Burkburnnet | 10% | 24% | 29% | 35% | 36% | 38% | 39% | 40% | 42% | ||||||||||||||||
| 42% | 44% | 53% | 62% | 63% | 63% | 63% | 63% | 63% | 63% | 63% | 63% | 63% | 63% | ||||||||||||
| Iowa Park | 7% | 12% | 15% | ||||||||||||||||||||||
| 15% | 17% | 20% | 31% | 42% | 44% | 45% | 47% | 48% | 50% | 51% | 53% | 54% | 56% | ||||||||||||
| Res: Pride 2, Levelland and Smyer | 1 | 2 | 3 | 4 | 5 | 6 | 7 | 8 | 9 | 10 | 11 | 12 | 13 | 14 | 15 | 16 | 17 | 18 | 19 | 20 | 21 | 22 | 23 | 24 | 25 |
| Levelland | 1.99% | 9.16% | 20.02% | 28.22% | 33.78% | 37% | 38% | 37% | 38% | 38% | 38% | 39% | 38% | 39% | 38% | 38% | |||||||||
| 38% | 38% | 38% | 39% | 39% | 39% | 40% | 40% | 40% | 41% | ||||||||||||||||
| Burkburnnet | 7% | 14% | 20% | 24% | 27% | 28% | 30% | 30% | 31% | ||||||||||||||||
| 31% | 32% | 33% | 33% | 34% | 35% | 36% | 36% | 37% | 38% | 39% | 39% | 40% | 41% | ||||||||||||
| Iowa Park | 1% | 7% | 10% | 13% | |||||||||||||||||||||
| 13% | 15% | 17% | 19% | 20% | 22% | 23% | 25% | 26% | 28% | 29% | 31% | 32% | 34% | ||||||||||||
| Bus: Pride 3 and Levelland | 1 | 2 | 3 | 4 | 5 | 6 | 7 | 8 | 9 | 10 | 11 | 12 | 13 | 14 | 15 | 16 | 17 | 18 | 19 | 20 | 21 | 22 | 23 | 24 | 25 |
| Levelland | 11.61% | 17.74% | 24.93% | 36.46% | 42.58% | 47% | 49% | 56% | 57% | 59% | 61% | 64% | 65% | 66% | 68% | 69% | |||||||||
| 69% | 69% | 69% | 69% | 69% | 70% | 70% | 70% | 70% | 70% | ||||||||||||||||
| Hammond | 3% | 10% | |||||||||||||||||||||||
| 10% | 12% | 14% | 15% | 16% | 17% | 18% | 19% | 21% | 22% | 23% | 24% | 25% | 26% | ||||||||||||
| Ponchatoula | 14% | ||||||||||||||||||||||||
| 14% | 20% | 23% | 25% | 27% | 29% | 32% | 34% | 36% | 38% | 41% | 43% | 45% | |||||||||||||
| Tickfaw Village | 13% | ||||||||||||||||||||||||
| 13% | 19% | 27% | 32% | 35% | 37% | 42% | 43% | 44% | 46% | 48% | 48% | ||||||||||||||
| Independence | 13% | ||||||||||||||||||||||||
| 13% | 19% | 27% | 32% | 35% | 37% | 42% | 43% | 44% | 46% | 48% | 48% | ||||||||||||||
| Amite | 13% | ||||||||||||||||||||||||
| 13% | 19% | 27% | 32% | 35% | 37% | 42% | 43% | 44% | 46% | 48% | 48% | ||||||||||||||
| Pine Grove | 13% | ||||||||||||||||||||||||
| 13% | 19% | 27% | 32% | 35% | 37% | 42% | 43% | 44% | 46% | 48% | 48% | ||||||||||||||
| Montpelier | 13% | ||||||||||||||||||||||||
| 13% | 19% | 27% | 32% | 35% | 37% | 42% | 43% | 44% | 46% | 48% | 48% | ||||||||||||||
| Franklinton | 13% | ||||||||||||||||||||||||
| 13% | 19% | 27% | 32% | 35% | 37% | 42% | 43% | 44% | 46% | 48% | 48% | ||||||||||||||
| Towers | 13% | ||||||||||||||||||||||||
| 13% | 19% | 27% | 32% | 35% | 37% | 42% | 43% | 44% | 46% | 48% | 48% | ||||||||||||||
| Natalbany | 13% | ||||||||||||||||||||||||
| 13% | 19% | 27% | 32% | 35% | 37% | 42% | 43% | 44% | 46% | 48% | 48% | ||||||||||||||
| Res: Pride 3 and Levelland | 1 | 2 | 3 | 4 | 5 | 6 | 7 | 8 | 9 | 10 | 11 | 12 | 13 | 14 | 15 | 16 | 17 | 18 | 19 | 20 | 21 | 22 | 23 | 24 | 25 |
| Levelland | 1.99% | 9.16% | 20.02% | 28.22% | 33.78% | 37% | 38% | 37% | 38% | 38% | 38% | 39% | 38% | 39% | 38% | 38% | |||||||||
| 38% | 38% | 38% | 39% | 39% | 39% | 40% | 40% | 40% | 41% | ||||||||||||||||
| Hammond | 1% | ||||||||||||||||||||||||
| 1% | 1% | 7% | 15% | 21% | 25% | 28% | 29% | 28% | 28% | 29% | 29% | 29% | 28% | ||||||||||||
| Ponchatoula | 1% | ||||||||||||||||||||||||
| 1% | 7% | 15% | 21% | 25% | 28% | 29% | 28% | 28% | 29% | 29% | 29% | 28% | |||||||||||||
| Tickfaw Village | 1% | ||||||||||||||||||||||||
| 1% | 7% | 15% | 21% | 25% | 28% | 29% | 28% | 28% | 29% | 29% | 29% | ||||||||||||||
| Independence | 1% | ||||||||||||||||||||||||
| 1% | 7% | 15% | 21% | 25% | 28% | 29% | 28% | 28% | 29% | 29% | 29% | ||||||||||||||
| Amite | 1% | ||||||||||||||||||||||||
| 1% | 7% | 15% | 21% | 25% | 28% | 29% | 28% | 28% | 29% | 29% | 29% | ||||||||||||||
| Pine Grove | 1% | ||||||||||||||||||||||||
| 1% | 7% | 15% | 21% | 25% | 28% | 29% | 28% | 28% | 29% | 29% | 29% | ||||||||||||||
| Montpelier | 1% | ||||||||||||||||||||||||
| 1% | 7% | 15% | 21% | 25% | 28% | 29% | 28% | 28% | 29% | 29% | 29% | ||||||||||||||
| Franklinton | 1% | ||||||||||||||||||||||||
| 1% | 7% | 15% | 21% | 25% | 28% | 29% | 28% | 28% | 29% | 29% | 29% | ||||||||||||||
| Towers | 1% | ||||||||||||||||||||||||
| 1% | 7% | 15% | 21% | 25% | 28% | 29% | 28% | 28% | 29% | 29% | 29% | ||||||||||||||
| Natalbany | 1% | ||||||||||||||||||||||||
| 1% | 7% | 15% | 21% | 25% | 28% | 29% | 28% | 28% | 29% | 29% | 29% | ||||||||||||||
23
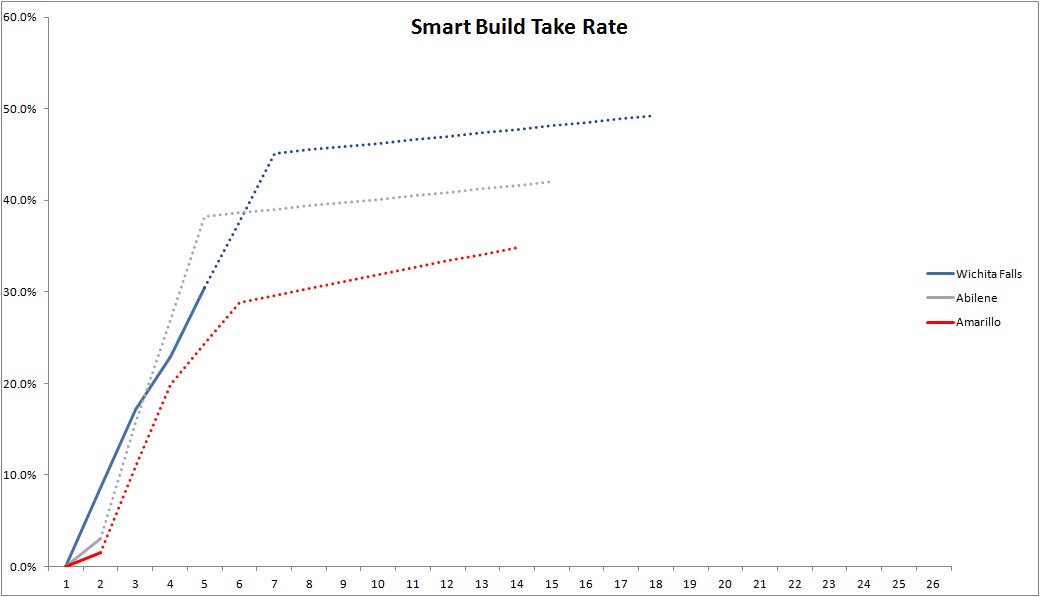
24
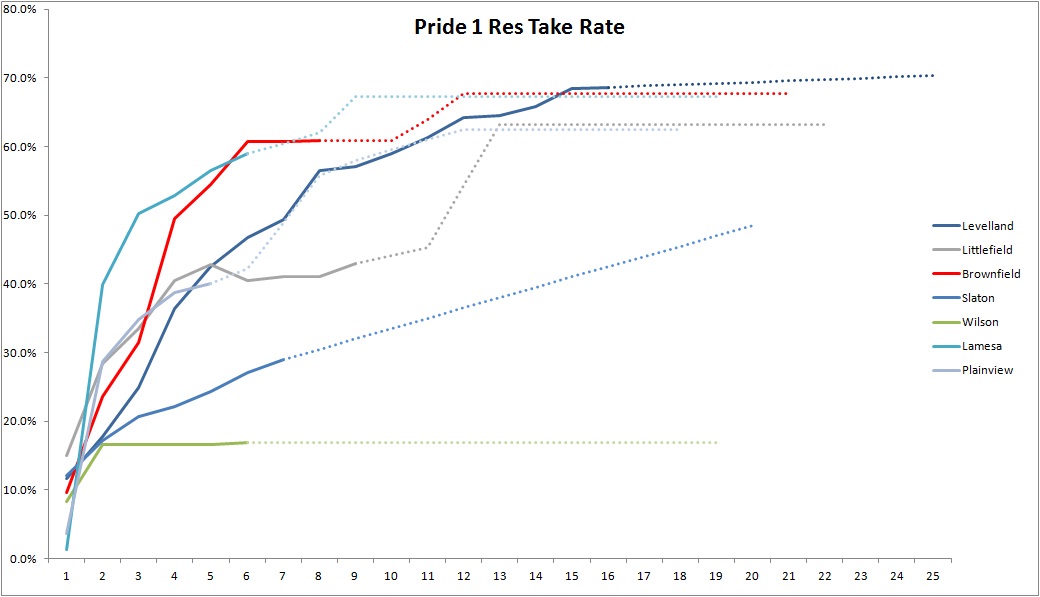
25
26
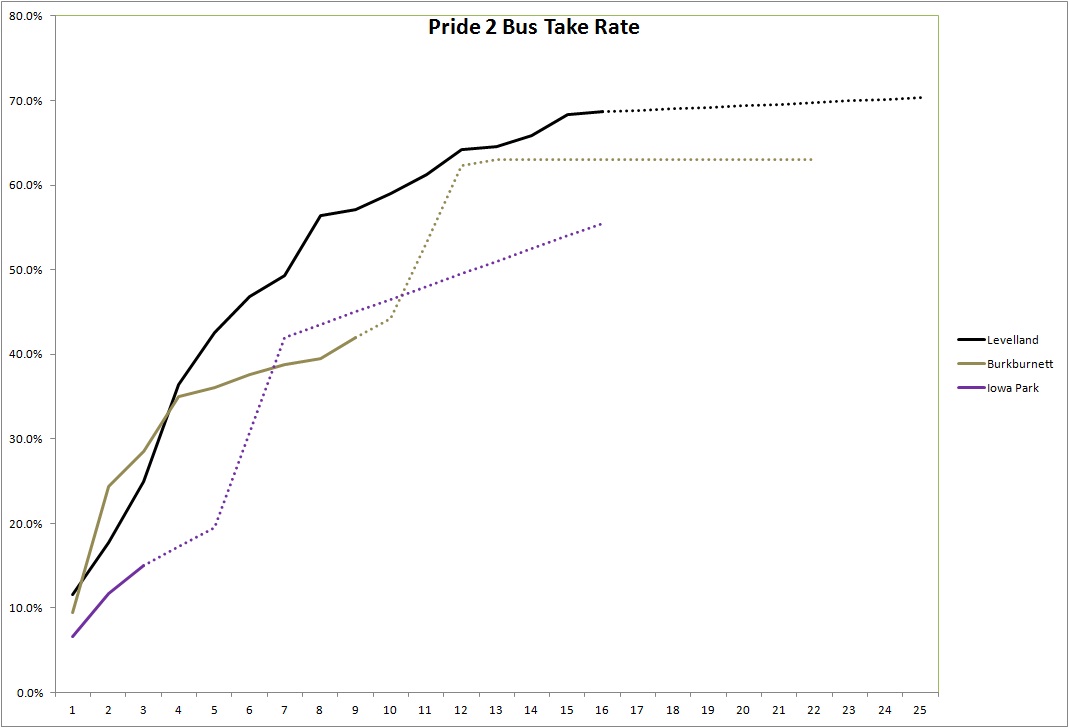
27
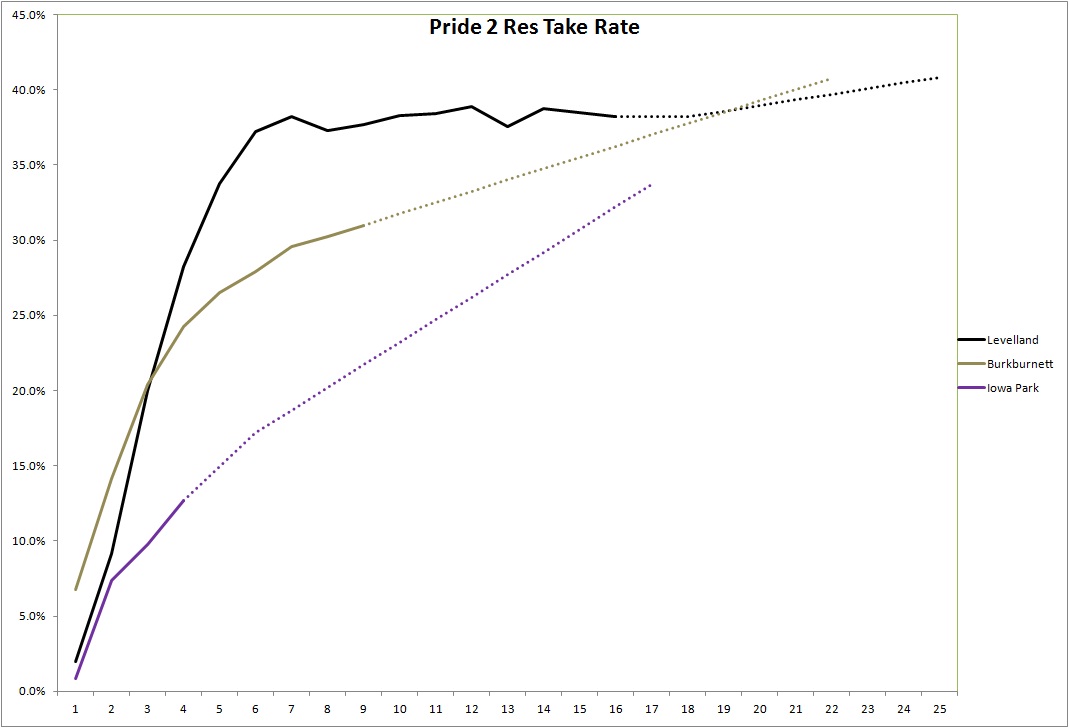
28

29
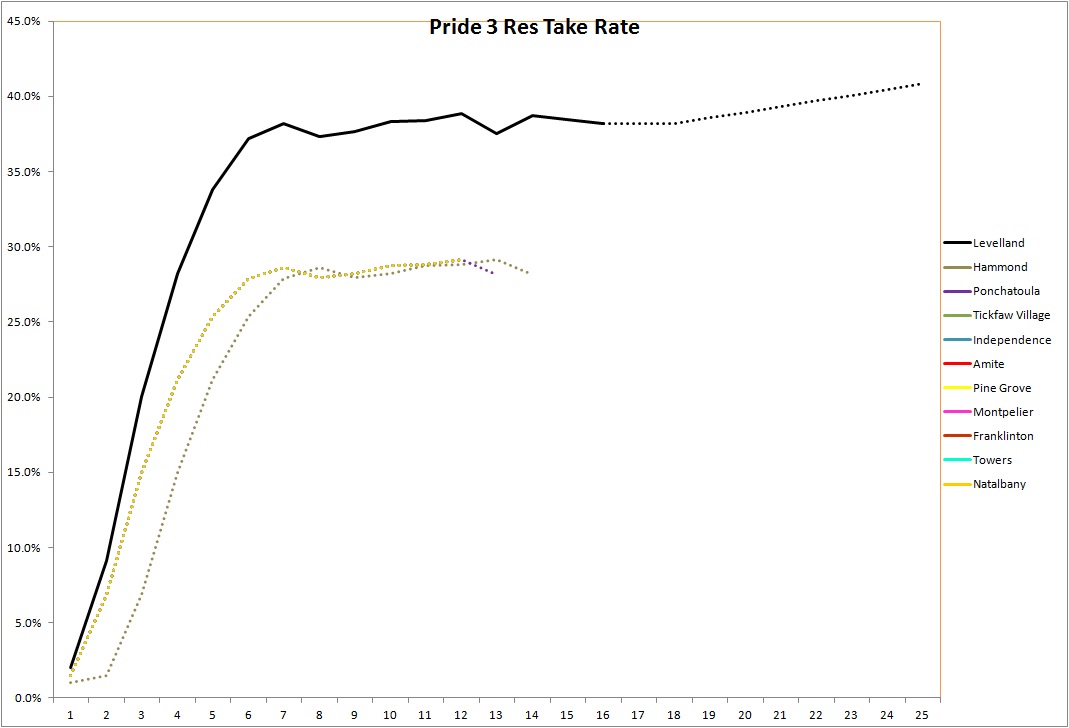
30
EXHIBIT (d)(3)
ROLLOVER AGREEMENT
This ROLLOVER AGREEMENT (this “Agreement”) is made and entered into as of October 20, 2013, by and between T3 North Holdings, LLC, a Delaware limited liability company (“Holdings”), and the undersigned (the “Stockholder Party”). Capitalized terms used but not otherwise defined herein shall have the meaning given to them in the Merger Agreement (as defined below).
RECITALS
WHEREAS, pursuant to that certain Agreement and Plan of Merger (the “Merger Agreement”), dated as of October 20, 2013, by and among T3 North Intermediate Holdings, LLC, a Nevada limited liability company (“Parent”), North Merger Sub, Inc., a Nevada corporation and a wholly owned Subsidiary of Parent (“Merger Sub”), and NTS, Inc., a Nevada corporation (the “Company”), Merger Sub will merge with and into the Company, with the Company surviving as a wholly-owned subsidiary of Parent (the “Merger”);
WHEREAS, prior to and without giving effect to the consummation of the transactions contemplated by the Merger Agreement, the Stockholder Party owns shares of common stock, par value $0.001 per share, of the Company (the “Company Common Stock”);
WHEREAS, in connection with and immediately prior to the consummation of the transactions contemplated by the Merger Agreement, the Stockholder Party desires to exchange certain shares of Company Common Stock held by the Stockholder Party for limited liability company units of Holdings (“Holdings Equity”); and
WHEREAS, effective prior to the Closing, Holdings shall have elected to be treated as an association taxable as a corporation for U.S. federal income tax purposes, and thus the exchange of Company Common Stock for Holdings Equity contemplated hereby is intended to be treated as part of an exchange governed by Section 351(a) of the Internal Revenue Code, as amended.
NOW, THEREFORE, in consideration of the mutual covenants and agreements hereinafter set forth and for other good and valuable consideration, the receipt and adequacy of which are hereby acknowledged, the parties hereto agree as follows:
AGREEMENT
1. Identification of Rollover Shares. The Stockholder Party hereby agrees that 1,390,871 shares of Company Common Stock (the “Rollover Shares”) will be exchanged for Holdings Equity in accordance with the terms and conditions set forth in this Agreement.
2. Exchange. Immediately prior to the consummation of the transactions contemplated by the Merger Agreement and without further action by the Stockholder Party, all of the Stockholder Party’s right, title and interest in and to the Rollover Shares will be automatically assigned, transferred and delivered to Holdings free and clear of all mortgages, liens, pledges, security interests, charges, claims, restrictions and encumbrances of any nature whatsoever other than those arising under applicable securities laws (collectively, “Liens”).
3. Issuance of Holdings Equity. As consideration for the assignment, transfer and delivery of the Rollover Shares pursuant to Section 2, but subject to the Stockholder Party’s compliance with the requirements of Section 4, Holdings will issue in the name of the Stockholder Party that number of units of Holdings Equity at the same price per unit paid by Holdings’ other members which, for the avoidance of doubt, will have a value equal to the aggregate value of the Rollover Shares (to be calculated using the Merger Consideration as the value of each Rollover Share). The Stockholder Party hereby acknowledges and agrees that the issuance of the Holdings Equity pursuant to this Section 3 shall constitute complete satisfaction of all obligations or any other sums due to the Stockholder Party with respect to the Rollover Shares.
4. Closing. The closing of the exchange of Company Common Stock for Holdings Equity contemplated hereby (the “Closing”) shall take place following the satisfaction or waiver of the conditions set forth in Article VI of the Merger Agreement and immediately prior to the Effective Time. At the Closing, as a condition precedent to the obligation of Holdings to issue to the Stockholder Party any shares of Holdings Equity pursuant to Section 3, the Stockholder Party shall deliver to Holdings:
a. one or more original certificates representing shares of Company Common Stock and/or agent’s message reflecting transfer in the case of non-certificated shares of Company Common Stock represented only by book entry, which together represent all of the Rollover Shares;
b. a duly executed Stock Power in the form attached hereto as Exhibit A with respect to any certificated the Rollover Shares endorsed in blank; and
c. a joinder agreement, duly executed by the Stockholder Party, to the limited liability company agreement among Holdings and the members party thereto (the “Holdings Equityholders Agreement”), such Holdings Equityholders Agreement to contain terms not inconsistent with those set forth on Exhibit B hereto.
5. Representations and Warranties of the Stockholder Party. To induce Holdings to receive the Rollover Shares and issue the Holdings Equity as herein provided, the Stockholder Party makes the following representations and warranties to Holdings, each and all of which shall be true and correct as of the date of this Agreement and as of the Closing, and shall survive the execution and delivery of this Agreement:
a. Title to Shares. The Stockholder Party is the lawful record and beneficial owner of the Rollover Shares and has good and valid title to such Rollover Shares, free and clear of all Liens. Upon transfer of the Rollover Shares as contemplated hereunder, Holdings will acquire good and valid title to such Rollover Shares, free and clear of all Liens. Other than as contemplated by this Agreement, there is no subscription, option, warrant, call, right, agreement or commitment relating to the issuance, sale, delivery, repurchase or transfer by the Stockholder Party of such Rollover Shares, and the Stockholder Party is not party to, and is not aware of, any voting trusts, proxies or any other agreements or understandings with respect to the voting of the Rollover Shares.
b. Authority; Binding Effect. The Stockholder Party has all requisite power and authority or legal capacity to execute and deliver this Agreement and any other agreements or instruments executed by him, her or it in connection herewith and to consummate the transactions contemplated herein or therein. The Stockholder Party has duly executed and delivered this Agreement and the other agreements or instruments executed in connection herewith, and this Agreement and such other agreements and instruments are (assuming the due authorization, execution and delivery of this Agreement by Holdings) valid and binding obligations of the Stockholder Party enforceable in accordance with their respective terms, except as enforcement thereof may be limited by bankruptcy, insolvency, reorganization, fraudulent conveyance, moratorium or other similar laws relating to or affecting enforcement of creditors’ rights generally and except as enforcement thereof is subject to general principles of equity (regardless of whether enforcement is considered in a proceeding in equity or at law). If the Stockholder Party is a trust, then the trust is revocable.
c. No Violation. Neither the execution and delivery of this Agreement or any other agreement or instrument in connection herewith by the Stockholder Party, nor the exchange of the Rollover Shares owned by the Stockholder Party pursuant to this Agreement, will (i) violate, conflict with or result in a default (or give rise to any right of termination, cancellation or acceleration) under any of the terms, conditions or provisions of any agreement, lease or other instrument or obligation to which the Stockholder Party is a party or by which any of the Stockholder Party’s assets is bound, except for such defaults (or rights of termination, cancellation or acceleration) as to which requisite waivers or consents have been obtained and are in full force and effect, or (ii) violate any law, order, writ, injunction or decree applicable to the Stockholder Party or any of the Stockholder Party’s assets.
d. No Brokers or Finders. The Stockholder Party has not incurred or become liable for any broker’s commission or finder’s fee relating to the transactions contemplated by this Agreement.
e. Investment Intent. The Holdings Equity to be acquired by the Stockholder Party pursuant to this Agreement is being acquired for his, her or its own account, not as a nominee or agent for any other person and without a view to the distribution of such Holdings Equity or any interest therein in violation of the Securities Act of 1933, as amended (the “Securities Act”), or any state securities laws.
f. Eligibility. The Stockholder Party or, if the Stockholder Party is a trust, the grantor of the trust, is one of the following as indicated on the signature page hereto:
(i) an “accredited investor” within the meaning of Rule 501(a) under Regulation D of the Securities Act, and has (or, in the case of a trust, the trustee has) such knowledge and experience in financial and business matters so as to be capable of evaluating the merits and risks of his, her or its investment in the Holdings Equity, and the Stockholder Party is capable of bearing the economic risks of such investment and is able to bear the complete loss of his, her or its investment in the Holdings Equity, or
(ii) a non-accredited investor, and has (or, in the case of a trust, the trustee has), by itself or through a “personal representative” within the meaning of Rule 501(h) under Regulation D of the Securities Act, such knowledge and experience in financial and business matters so as to be capable of evaluating the merits and risks of his, her or its investment in the Holdings Equity, and the Stockholder Party is capable of bearing the economic risks of such investment and is able to bear the complete loss of his, her or its investment in the Holdings Equity.
g. Residence. The Stockholder Party’s principal place of residence is in the state so designated below his, her or its name on the signature page hereto.
h. Receipt of Information. The Stockholder Party has been afforded the opportunity to ask such questions as he, she or it has deemed necessary of, and to receive answers from, representatives of Holdings concerning the terms and conditions of the offering of the Holdings Equity and the merits and risks of investing in the Holdings Equity. The Stockholder Party and its advisors, if any, have been furnished with all materials relating to the business, properties, finances, prospects and operations of Holdings and all other materials relating to the offer and sale of the Holdings Equity that have been requested by the Stockholder Party as it has deemed necessary or appropriate to conduct its due diligence investigation. The Stockholder Party has sufficient knowledge and experience in investing in the securities of companies similar to Holdings so as to be able to evaluate the risks and merits of its investment in Holdings. The Stockholder Party has sought such accounting, legal and tax advice as it has considered necessary to make an informed investment decision with respect to the exchange of the Company Common Stock and the acquisition of the Holdings Equity hereunder.
i. Prohibited Investment. The proposed investment in Holdings by the Stockholder Party will not result in a violation by the Stockholder Party of any United States federal, state, foreign or other laws, rules or regulations (including, without limitation, anti-money laundering laws, rules and regulations) applicable to such Stockholder Party.
6. Representations and Warranties of Holdings. Holdings makes the following representations and warranties to the Stockholder Party, each and all of which shall be true and correct as of the date of this Agreement and, subject to the transaction contemplated by Section 7(b), as of the Closing, and shall survive the execution and delivery of this Agreement:
a. Organization and Good Standing. Holdings is duly organized, validly existing and in good standing under the laws of the State of Delaware. Holdings has delivered to the Stockholder Party true and complete copies of its certificate of formation and limited liability company agreement as in effect on the date hereof. Such documents will be in effect in such form on the Closing Date. Holdings has the power and authority necessary to carry on its business as now being conducted (subject to subsection (e) below) and as proposed to be conducted immediately after the Merger.
b. Authority; Binding Effect. Holdings has full legal capacity and power to execute and deliver this Agreement and any other agreements or instruments executed by it in connection herewith and to consummate the transactions contemplated herein or therein. This Agreement and the other agreements and instruments executed by Holdings in connection herewith have been duly authorized by all necessary company action and (assuming the execution and delivery of this Agreement by the Stockholder Party) are valid and binding obligations of Holdings enforceable in accordance with their respective terms, except as enforcement thereof may be limited by bankruptcy, insolvency, reorganization, fraudulent conveyance, moratorium or other similar laws relating to or affecting enforcement of creditors’ rights generally and except as enforcement thereof is subject to general principles of equity (regardless of whether enforcement is considered in a proceeding in equity or at law).
c. No Violation. Except for waivers or consents that have been obtained or are in full force and effect, the execution and delivery of this Agreement by Holdings and the issuance of the Holdings Equity contemplated herein will not conflict with, or result in any violation of, or default (with or without notice or lapse of time, or both) under (i) the certificate of formation or limited liability company agreement of Holdings, (ii) any law, order or agreement applicable to Holdings or by which any property or asset of Holdings is bound or affected or (iii) any agreement, lease or other instrument or obligation to which Holdings is a party.
d. Issuance of the Holdings Equity. The Holdings Equity to be issued hereunder will be duly authorized, validly issued, fully paid and nonassessable, and free and clear of all Liens, preemptive rights, rights of first refusal, subscription and similar rights (other than those arising under the agreements entered into at the Closing by the Stockholder Party, including the Holdings Equityholders Agreement).
e. No Prior Operations. Neither Holdings, Parent nor Merger Sub has conducted any material business or entered into any material transactions or incurred any material liability other than in connection with the formation of Holdings, Parent and Merger Sub, the Merger Agreement, the transactions contemplated hereby and thereby and the financing thereof.
7. Miscellaneous.
a. Amendments and Waivers. Any term of this Agreement may be amended or waived with the written consent of the parties or their respective successors and assigns. Any amendment or waiver effected in accordance with this Section 7(a) shall be binding upon the parties and their respective successors and assigns.
b. Check-the-Box Election. At or prior to the Closing, Holdings shall file a properly completed and executed Internal Revenue Service Form 8832 (Entity Classification Election), effective on the later of (i) the date that is seventy-five (75) days prior to the date of filing or (ii) the date of formation of Holdings, electing to be treated as an association taxable as a corporation.
c. Conversion to Corporation. The Parties expressly agree that, prior to the Closing, Holdings shall be permitted to convert into, or, in Holdings’ sole discretion, merge with and into, a Delaware corporation, subject to Holdings and the Stockholder Party entering into a stockholders’ agreement (the effectiveness thereof being contingent upon the completion of such conversion or merger) in form and substance analogous to the terms and conditions of the Holdings Equityholders Agreement (except with such changes as are necessary or appropriate to reflect Holdings’ conversion to or merger with and into a Delaware corporation). Thereafter, all references in this agreement to a certificate of formation, limited liability company agreement and units of Holdings Equity shall be deemed to be references to Holdings’ certificate of incorporation, bylaws and stockholders agreement, as applicable, and shares of Holdings common stock, par value $.0001.
d. Further Assurances. From time to time, as and when requested by Holdings, the Stockholder Party will execute and deliver, or cause to be executed and delivered, all such documents and instruments as may be reasonably necessary to consummate the transactions contemplated by this Agreement.
e. Transfer Restrictions. The Stockholder Party acknowledges and agrees that:
(i) the offering and sale of the Holdings Equity is intended to be exempt from registration under the Securities Act, by virtue of the provisions of Rule 506 of Regulation D promulgated under the Securities Act by the Securities and Exchange Commission;
(ii) none of the Holdings Equity has been registered under the Securities Act or any securities or “blue sky” laws of any state;
(iii) there is no existing public or other market for the Holdings Equity and there can be no assurance that the Stockholder Party will be able to sell or dispose of the Holdings Equity being acquired by the Stockholder Party hereunder;
(iv) none of the Holdings Equity may be offered, sold, transferred, pledged, hypothecated or otherwise assigned unless (A) such shares are registered under the Securities Act or an exemption from such registration is available, in each case in accordance with any applicable securities or “blue sky” laws of any state and (B) such actions are not prohibited by, and are otherwise taken in accordance with, the Holdings Equityholders Agreement; and
(v) in addition to any legends required pursuant to any other agreement (including the Holdings Equityholders Agreement), any certificate(s) representing the Holdings Equity and any certificate issued to any subsequent transferee of the Holdings Equity) shall bear a legend in substantially the following form (unless transferred in the manner described in the following legend):
“THIS SECURITY HAS NOT BEEN REGISTERED UNDER THE SECURITIES ACT OF 1933, AS AMENDED (THE “ACT”), OR THE APPLICABLE SECURITIES LAWS OF ANY STATE, AND MAY NOT BE PLEDGED, SOLD, ASSIGNED OR OTHERWISE TRANSFERRED UNLESS REGISTERED UNDER THE ACT AND UNDER APPLICABLE STATE SECURITIES LAWS, OR UNLESS SUCH PLEDGE, SALE, ASSIGNMENT OR TRANSFER IS EXEMPT FROM THE REGISTRATION REQUIREMENTS OF THE ACT AND SUCH STATE SECURITIES LAWS.”
The foregoing legend (and the restrictions imposed thereby) shall cease and terminate as to any particular unit of Holdings Equity (A) when, in the reasonable opinion of Weil, Gotshal & Manges LLP or other counsel reasonably acceptable to Holdings, such restrictions are no longer required in order to assure compliance with the Securities Act, or (B) when such units of Holdings Equity have been registered under the Securities Act or transferred pursuant to Rule 144 thereunder. Whenever such restrictions cease and terminate as to any units of Holdings Equity, or such units of Holdings Equity are freely transferable under Rule 144 without timing or volume limitations, the holder thereof will be entitled to receive from Holdings, without expense, new certificates (to the extent such units are certificated) not bearing the foregoing legend.
f. Notices. All notices and other communications hereunder shall be in writing and shall be deemed given upon the earlier of delivery thereof if by hand or upon receipt if sent by mail (registered or certified mail, postage prepaid, return receipt requested) or on the second day (not including a Saturday, Sunday or other day on which banking institutions in the City of New York, New York shall be permitted or required by law or executive order to be closed) after deposit if sent by a recognized overnight delivery service or upon transmission if sent by facsimile transmission or email (with request of assurance of receipt in a manner customary for communication of such type) as follows:
If to Holdings:
c/o Tower Three Partners
Two Sound View Drive
Greenwich, Connecticut 06830
Attention: Michael Nold and Dan Bellissimo
Facsimile: (203) 485-5885
Email: mnold@towerthreepartners.com and dbellissimo@towerthreepartners.com
with a copy (which shall not constitute notice) to:
Weil, Gotshal & Manges LLP
100 Federal Street, Floor 34
Boston, Massachusetts 02110
Attention: Kevin J. Sullivan
Facsimile: (617) 772-8333
Email: kevin.sullivan@weil.com
If to the Stockholder Party:
To the address set forth on the signature page hereto.
g. Governing Law. This Agreement, and all claims or causes of action (whether in contract or tort) that may be based upon, arise out of or relate to this Agreement, or the negotiation, execution, termination, validity, interpretation, construction, enforcement, performance or nonperformance of this Agreement, or otherwise arising from the relationship between the parties (including, without limitation, any claim or cause of action based upon, arising out of or related to any covenant, representation or warranty made in or in connection with this Agreement) (all such claims or causes of action, a “Cause of Action”), shall be governed by the internal laws of the State of Delaware (including its laws regarding statutes of limitations), without giving effect to any choice or conflict of law provision or rules (whether of the State of Delaware or otherwise) that would cause the application of laws of any other jurisdiction
h. Jurisdiction. All actions and proceedings that may be based upon, arise out of or relate to a Cause of Action shall be exclusively heard and determined in the Chancery Court of the State of Delaware (unless the Chancery Court of the State of Delaware shall decline to accept jurisdiction over a particular matter, in which case, any federal court sitting in the State of Delaware), and the parties hereto hereby irrevocably submit to the exclusive jurisdiction of such courts (and, in the case of appeals, appropriate appellate courts therefrom) in any such action or proceeding and irrevocably waive, to the fullest extent permitted by applicable law, any objection which they may now or hereafter have to the laying of venue of any such Cause of Action brought in such court or any defense of inconvenient forum for the maintenance of such dispute. The consents to jurisdiction set forth in this paragraph shall not constitute general consents to service of process in the State of Delaware and shall have no effect for any purpose except as provided in this paragraph and shall not be deemed to confer rights on any Person other than the parties hereto. Each of the parties hereby agrees that service of any process, summons, notice or document by U.S. registered mail to the respective addresses set forth in Section 7(e) or the signature pages hereto, as applicable, shall be effective service of process for any suit or proceeding in connection with this Agreement or the transaction contemplated hereby. The parties hereto agree that a final judgment in any such action or proceeding shall be conclusive and may be enforced in other jurisdictions by suit on the judgment or in any other manner provided by applicable law; provided, however, that nothing in the foregoing shall restrict any party’s right to seek any post-judgment relief regarding, or any appeal from, such final judgment
i. Assignment. This Agreement shall be binding upon Holdings, the Stockholder Party and each of their respective successors and permitted assigns. This Agreement shall not be assignable by either party without the prior written consent of the other party, except that Holdings may assign this Agreement without the Stockholder Party’s consent to any person to whom Holdings validly has assigned its rights and obligations under the Merger Agreement.
j. Counterparts. This Agreement may be executed in two or more counterparts (any of which may be delivered by facsimile transmission or email), each of which shall be deemed an original, but all of which together shall constitute one and the same agreement.
k. Headings. The article and section headings contained in this Agreement are solely for the purpose of reference, are not part of the agreement of the parties and shall not affect in any way the meaning or interpretation of this Agreement.
l. Severability. In case any provision in this Agreement shall be held invalid, illegal or unenforceable in any respect for any reason, the validity, legality and enforceability of any such provision in every other respect and the remaining provisions shall not in any way be affected or impaired thereby.
m. Waiver of Compliance. Any failure of Holdings or the Stockholder Party to comply with any obligation, covenant, agreement or condition contained herein may be waived in writing by Holdings and the Stockholder Party, respectively, but such waiver or failure to insist upon strict compliance with such obligation, covenant, agreement or condition shall not operate as a waiver of, or estoppel with respect to, any other failure.
n. Termination. This Agreement shall automatically, and without further actions of the parties, terminate and shall be null and void and of no force or effect if (i) the closing of the transactions contemplated by the Merger Agreement does not occur or (ii) the Merger Agreement is validly terminated in accordance with its terms.
[The Remainder of This Page Is Intentionally Left Blank.]
IN WITNESS WHEREOF, the parties have executed this Agreement as of the date first written above.
T3 NORTH HOLDINGS, LLC
By:/s/ William D. Forrest
Name: William D. Forrest
Title: President
Signature Page to Rollover Agreement
STOCKHOLDER PARTY
/s/ Guy Nissenson
Name: Guy Nissenson
Address:
4711 106th Street
Lubbock, Texas 79424
Facsimile:
Email: guy@ntscom.com
Rollover Amount:
1,390,871 shares of Company Common Stock
Value of Holdings Equity to be Issued Pursuant hereto:
$2,781,742
The Stockholder Party referenced above hereby certifies that he, she or it is (check one):
| x | an “accredited investor” (as defined in Rule 501(a) under the Securities Act) |
| o | not an “accredited investor” |
Signature Page to Rollover Agreement
| EXHIBIT A |
| STOCK POWER |
FOR VALUE RECEIVED, Guy Nissenson does hereby sell, assign and transfer to T3 North Holdings, LLC, a Delaware limited liability company, the shares of stock of North, Inc., a Nevada corporation (the “Company”), listed below and represented by the Certificate Numbers listed below (such shares, the “Stock”) standing in the name of the undersigned on the books of the Company and does hereby irrevocably constitute and appoint _______________________ as the undersigned’s true and lawful attorney, for it and in its name and stead, to sell, assign and transfer all or any of the Stock, and for that purpose to make and execute all necessary acts of assignment and transfer thereof; and to substitute one or more persons with like full power, hereby ratifying and confirming that said attorney or substitute or substitutes shall lawfully do by virtue hereof.
Please list the following information regarding the Stock.
| Class of Stock | Certificate No. | No. of Shares |
Date: _________________
Sign Name: _____________________
Print Name: _____________________
| EXHIBIT B |
TERM SHEET FOR HOLDINGS EQUITYHOLDER AGREEMENT
The following sets forth a summary of the principal terms of the Holdings Equityholder Agreement to be entered into between Holdings and the Stockholder Party. The parties acknowledge that the final Holdings Equityholder Agreement will contain representations, warranties, covenants and agreements customary for agreements of this type.
| Voting Rights: | All Holdings Equity shall be voting and shall entitle the holder thereof to one vote per limited liability company unit or share, as applicable. |
| Board of Managers/Directors: | For so long as the Stockholder Party owns at least 75% of the Holdings Equity held by the Stockholder Party as of Closing, the Stockholder Party shall be entitled to sit on the board of managers/directors of Holdings. |
| Pre-emptive Rights: | The Stockholder Party shall have pre-emptive rights with respect to any issuances by Holdings to maintain its pro rata ownership, subject to customary exceptions (incentive plans, IPO issuances, etc.). |
| Prohibition on Transfer: | Until the earlier of (i) Tower Three Partners LLC, or one of its affiliated investment funds (collectively, “Sponsor”), no longer owning more than 50% of Holdings’ outstanding equity securities or the occurrence of other specified change of control transactions and (ii) a qualified public offering of Holdings’ equity securities, the Stockholder Party shall not be permitted to, directly or indirectly, sell or transfer any Holdings Equity without Sponsor’s prior written consent, except for transfers to affiliates of Stockholder Party and transfers for estate planning purposes. |
| Tag Along Rights: | The Stockholder Party shall have customary tag along rights with respect to any transfer by Sponsor in excess of 10% of its equity securities as of the date of the calculation (other than with respect to transfers by Sponsor to affiliated parties). |
| Drag Along Rights: | Sponsor will have the right to require all holders of Holdings’ equity securities to approve (including waiving an dissenter or similar rights) and/or sell their equity securities in any sale of Holdings (whether by merger, sale of shares or assets or otherwise), provided that the holders of each class of equity securities receive the same amount of consideration (vis-à-vis other holders of the same class) in respect of their equity securities and take all other action necessary to effect such transactions. This provision will have customary limitations on representations and warranties, indemnities, etc. for dragged-along parties. |
| Registration Rights: | The Stockholder Party will have customary piggyback registration rights. |
| Miscellaneous: | To include provisions for confidentiality and other customary matters (including a requirement to obtain and maintain D&O insurance). Generally, agreement will not allow Stockholder Party to be treated with respect to his Holdings equity securities differently than any other holder of the same class of Holdings equity securities without Stockholder Party’s prior consent. |