Exhibit 99
2013 INVESTOR DAY The Principal Financial Group® |
INTRODUCTION JOHN EGAN |
Use of Non-GAAP Financial Measures A non-GAAP financial measure is a numerical measure of performance, financial position, or cash flows that includes adjustments from a comparable financial measure presented in accordance with U.S. GAAP. The company uses a number of non-GAAP financial measures that management believes are useful to investors because they illustrate the performance of the company’s normal, ongoing operations which is important in understanding and evaluating the company’s financial condition and results of operations. While such measures are also consistent with measures utilized by investors to evaluate performance, they are not, however, a substitute for U.S. GAAP financial measures. Therefore, at the end of the presentation, the company has provided reconciliations of the non-GAAP financial measures to the most directly comparable U.S. GAAP financial measure. The company adjusts U.S. GAAP financial measures for items not directly related to ongoing operations. However, it is possible these adjusting items have occurred in the past and could recur in future reporting periods. Management also uses non-GAAP financial measures for goal setting, as a basis for determining employee and senior management awards and compensation, and evaluating performance on a basis comparable to that used by investors and securities analysts. The company also uses a variety of other operational measures that do not have U.S. GAAP counterparts, and therefore do not fit the definition of non-GAAP financial measures. Assets under management is an example of an operational measure that is not considered a non-GAAP financial measure. 2 |
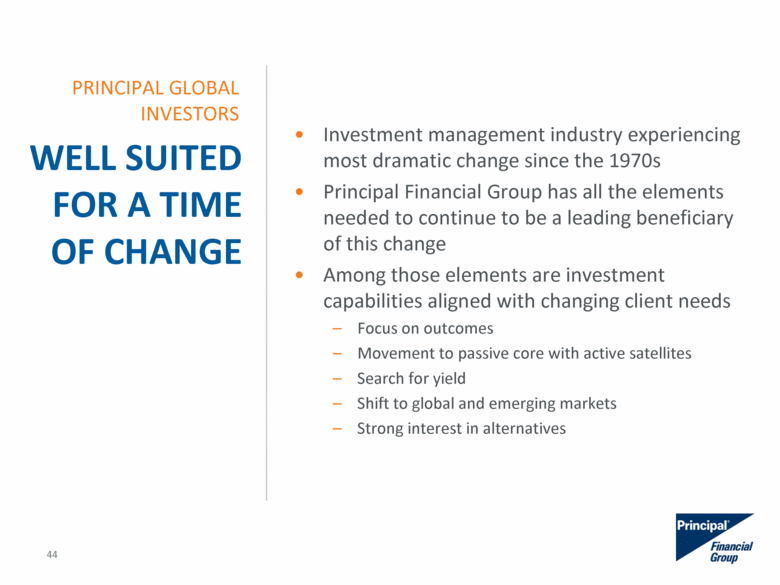
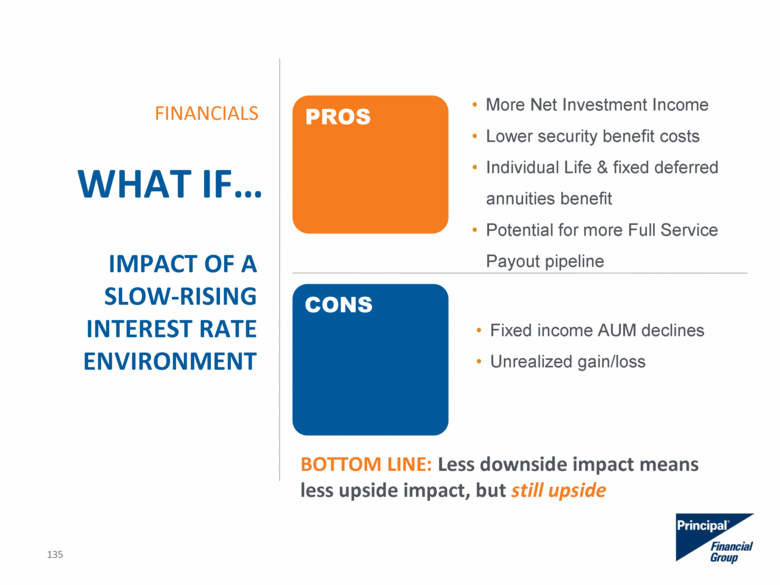
Forward Looking Statements Certain statements made by the company which are not historical facts may be considered forward-looking statements, including, without limitation, statements as to operating earnings, net income available to common stockholders, net cash flows, realized and unrealized gains and losses, capital and liquidity positions, sales and earnings trends, and management's beliefs, expectations, goals and opinions. The company does not undertake to update these statements, which are based on a number of assumptions concerning future conditions that may ultimately prove to be inaccurate. Future events and their effects on the company may not be those anticipated, and actual results may differ materially from the results anticipated in these forward-looking statements. The risks, uncertainties and factors that could cause or contribute to such material differences are discussed in the company's annual report on Form 10-K for the year ended Dec. 31, 2012, and in the company’s quarterly report on Form 10-Q for the quarter ended June 30, 2013, filed by the company with the Securities and Exchange Commission, as updated or supplemented from time to time in subsequent filings. These risks and uncertainties include, without limitation: adverse capital and credit market conditions may significantly affect the company’s ability to meet liquidity needs, access to capital and cost of capital; continued difficult conditions in the global capital markets and the economy generally; continued volatility or declines in the equity markets; changes in interest rates or credit spreads; the company’s investment portfolio is subject to several risks that may diminish the value of its invested assets and the investment returns credited to customers; the company’s valuation of securities may include methodologies, estimations and assumptions that are subject to differing interpretations; the determination of the amount of allowances and impairments taken on the company’s investments requires estimations and assumptions that are subject to differing interpretations; gross unrealized losses may be realized or result in future impairments; competition from companies that may have greater financial resources, broader arrays of products, higher ratings and stronger financial performance; a downgrade in the company’s financial strength or credit ratings; inability to attract and retain sales representatives and develop new distribution sources; international business risks; the company’s actual experience could differ significantly from its pricing and reserving assumptions; the company’s ability to pay stockholder dividends and meet its obligations may be constrained by the limitations on dividends or distributions Iowa insurance laws impose on Principal Life; the pattern of amortizing the company’s DPAC and other actuarial balances on its universal life-type insurance contracts, participating life insurance policies and certain investment contracts may change; the company may need to fund deficiencies in its “Closed Block” assets that support participating ordinary life insurance policies that had a dividend scale in force at the time of Principal Life’s 1998 conversion into a stock life insurance company; the company’s reinsurers could default on their obligations or increase their rates; risks arising from acquisitions of businesses; changes in laws, regulations or accounting standards; a computer system failure or security breach could disrupt the company’s business, and damage its reputation; results of litigation and regulatory investigations; from time to time the company may become subject to tax audits, tax litigation or similar proceedings, and as a result it may owe additional taxes, interest and penalties in amounts that may be material; fluctuations in foreign currency exchange rates; and applicable laws and the company’s certificate of incorporation and by-laws may discourage takeovers and business combinations that some stockholders might consider in their best interests. 3 |
Time Topic Presenter 9:00 am Welcome John Egan 9:05 am Company Strategy Larry Zimpleman 9:40 am Principal Global Investors Q&A with McCaughan & Biosse Duplan Jim McCaughan & Rafael Biosse Duplan 10:25 am U.S. Businesses Q&A with Houston & Everett Dan Houston & Nora Everett 11:10 am Principal International Q&A with Valdes & Burmeister Luis Valdes & Ned Burmeister 11:55 am Break/Lunch 12:25 pm Investments Tim Dunbar 12:40 pm Financials Terry Lillis 1:00 pm Panel Q&A All presenters 1:30 pm Investor reception AGENDA 4 |
GROWTH FOR THE LONG TERM LARRY ZIMPLEMAN |
INVESTMENT MANAGEMENT PLUS Right time Right markets Right strategy INVESTOR DAY FOCUS 7 |
RIGHT TIME: Unprecedented demand for financial services U.S. Baby & Echo Boomers Growing global middle class Institutional markets 8 |
The Principal operates in countries that account for more than 50% of world’s population. Select emerging markets with fast-growing middle class RIGHT MARKETS: 9 |
RIGHT STRATEGY: Business synergies multiply growth opportunities 10 |
RIGHT STRATEGY: Business synergies multiply growth opportunities 11 Global investment capabilities Collaborating on best practices (e.g. QDII & QFII) QDII = Qualified Domestic Institutional Investment. QFII = Qualified Foreign Institutional Investment. |
RIGHT STRATEGY: Business synergies multiply growth opportunities 12 Lifetime funds Outcome-oriented retail products Alliance relationships |
Investment management Global growth Capital management OUR APPROACH: DISCIPLINED AND ACCELERATED EXECUTION 13 |
RIGHT EXECUTION AT THE RIGHT TIME 14 JV – Joint Venture IPO – Initial Public Offering PI companies in ORANGE PGI companies in RED |
CRISIS CREATES OPPORTUNITIES Diversified model weathered macroeconomic pressures and enabled continued strategic execution. Strategic deals deploying $2.0B Cumulative dividend payout totaling: $1.1B since January 2008* 7 * Includes 3Q13 announced dividend. 15 |
BUILDING FOR THE FUTURE ONBOARDING SUCCESS DEMONSTRATES OUR EXPERTISE & DISCIPLINE Chilean pension regulator continues to acknowledge Cuprum as an industry leader Ranked #1 in customer service Top investment performance Viewed as good strategic fit by rating agencies Already significant contributor to earnings Synergies with voluntary savings 16 |
$100 BILLION MARK PROVEN RESULTS: Assets Under Management (in Billions) Businesses that were once aspirational are now drivers of growth Principal Funds Complex Unaffiliated PGI Principal International 2018E $28B $302B $650B CAGR15% CAGR25% 2Q 2013 17 Total Principal Funds complex includes Principal Funds and a portion of our retirement platform. |
PROVEN OPERATING EARNINGS GROWTH POTENTIAL $448M1 $1,030M2 U.S.-focused Global-focused3 Percentage of earnings from our U.S. and global-based businesses. CAGR 7.5% 1After-tax. Results exclude Corporate and discontinued operations. 2Trailing twelve month total. After-tax. Results exclude Corporate. 3Principal Global Investors, Principal International During 2001 to 1H13, U.S. Equity market grew 3.0% CAGR 10-12% 18 Power of our global strategy 2001 2Q 2013 2018E |
RETIREMENT & INVESTOR SERVICES Double digit Full Service Accumulation annualized new sales revenue growth 10 straight quarters of positive net cash flow STRONG BUSINESS MOMENTUM PRINCIPAL GLOBAL INVESTORS PRINCIPAL INTERNATIONAL U.S. INSURANCE SOLUTIONS Scale leading to expanding margins $101B unaffiliated AUM Net cash flows of $4.7B Record $103B AUM USIS sales up 22% from same period 2012 Stable Specialty Benefits loss ratio of 67% Robust growth through both strategic acquisitions and organic initiatives Results through first 6 months of 2013. 19 |
THE RIGHT STRATEGY WELL EXECUTED Results exclude Corporate. 20 Operating Earnings |
STRONG CAPITAL POSITION 2012 Committed $2.1B of capital for deployment Moved to quarterly dividend 2013 Expect to deploy $400-$600M Higher dividend payout ratios, currently at low-to-mid 30s Enables strategic flexibility Quarterly dividend Strategic acquisitions Opportunistic share buybacks 21 |
15% ROE IS AGAIN WITHIN REACH 11.3%* 50-80 bps average annual ROE improvement *Adjustment represents 3Q12 actuarial assumption review. OCI = Other Comprehensive Income. As Reported 2007 Adjusted* TTM as of 2Q13 Operating earnings $1.1B $1.0B Average equity (x-OCI) $6.5B $8.5B Return on equity (x-OCI) 16.4% 11.3% 22 |
RESULTS DEMONSTRATE RELATIVE STRENGTH OF OUR BUSINESS MODEL 2001 2Q13 TTM* CAGR (2001-2Q13) Operating Earnings(1) ($M) $433 $967 7% Earnings Per Share(2) $1.20 $3.26 9% Assets Under Management ($B) $98 $451 14% ROE (TTM)(3) 6.9% 11.3% +440 bps Book Value Per Share (x-OCI) $17.81 $29.81 5% S&P 500 1,148 1,606 3% * Adjusted for the 3Q12 actuarial assumption review. (1) Excludes discontinued operations. (2) Diluted. (3) Operating return on average equity excluding other comprehensive income, based on trailing 12 month period. 23 |
ACCOLADES: Best Places to Work in Money Management - #1 among companies with more than 1,000 employees (Pensions and Investments 12/12) PGI – Top Non-U.S. Equity Value manager (Institutional Investor 5/13) PGI Europe – 2013 Pension Fund Perception Programme Awards (Investments & Pension Europe 4/13) Principal Funds – 4 Lipper Awards (3/13) CIMB-PIAM – Best Islamic Financial Institutions Awards 2013 - Best Asset Management company (Global Finance 4/13); Best Overall Islamic Asset Management Company and Best Islamic Asset Management Company in Asia (Islamic Finance News 8/13) AFP rankings (Chile) – #1 in customer service (18 of 22 consecutive quarters) RIS – PLANSPONSOR Top 20 Retirement Leader (3/13) 2013 Best Places to Work in IT – IDG Computerworld (6/13 - 12th consecutive year) EXTERNAL RECOGNITION Evolution from transaction company to talent company The core of The Principal is our Employees 24 |
Principal Financial Group WELL POSITIONED FOR CONTINUED LONG-TERM GROWTH: Right time. Right markets. Right strategy. Investment management leadership Unprecedented global opportunity Fee based earnings growth gives flexibility Disciplined and accelerated execution Relevant. Opportunistic. Visionary. 25 |
PRINCIPAL GLOBAL INVESTORS JIM MCCAUGHAN |
at a glance PRINCIPAL GLOBAL INVESTORS Serve clients in over 60 countries, including several major central banks and sovereign wealth funds Manages assets for 12 of the 25 largest U.S. retirement plans1 and 8 of the 25 largest world retirement funds2 Manages: 60% of Full Service Accumulation assets 77% of Principal Funds assets 100% of Principal Life general account assets Office locations in major financial markets worldwide Long-standing commitment to corporate stewardship As of 6/30/13. 1This list is derived from the Pensions & Investments “P & I 1,000” dated 2/04/13 compared to our internal records as of 6/30/13. 2This list is derived from the “P&I/Towers Watson World 300: The Largest Retirement Funds” report on the largest pension plans dated 9/03/12 compared to our internal records as of 6/30/13. Principal Global Investors Assets Under Management $271B By Asset Class 27 |
STEADY AUM & REVENUE GROWTH AUM ($ Billions) PRINCIPAL GLOBAL INVESTORS Operating Revenue ($ Millions) 28 |
EARNINGS GROWTH, IMPROVING MARGINS 2010 2011 2012 1H13 Operating earnings $59M $74M $81M $49M TTM Pre-tax margin 20.2% 21.4% 22.8% 25.3% Pre-tax margins continue to approach targeted levels PRINCIPAL GLOBAL INVESTORS Our goal: 30+% 29 |
OUR GROWTH DRIVERS Top-tier manager for retirement and other long-term strategies Serve all businesses of The Principal with suitable investment capabilities Proven multi-boutique operating approach Capabilities well-aligned with where investor needs continue to move Strong global presence supports all boutiques PRINCIPAL GLOBAL INVESTORS 30 |
STRONG INSTITUTIONAL PERFORMANCE PRINCIPAL GLOBAL INVESTORS ACROSS A WIDE RANGE OF STRATEGIES 1st Quartile 2nd Quartile 3rd Quartile 4th Quartile Global/Int’l Equities Fixed Income 1- year Ranking 3-year Annualized Ranking Real Estate (U.S. & Global REIT) (14 Strategies) 7 8 4 2 4 10 3 6 5 2 3 7 3 1 1 1 U.S. Equities 3 4 3 3 3 3 6 (13 Strategies) (13 Strategies) (12 Strategies) (19 Strategies) (17 Strategies) (2 Strategies) (2 Strategies) As of 6/30/2013. All asset classes and strategies are ranked against eVestment peer groups. Highly competitive range of Alternative options 31 |
STRONG PERFORMANCE ON FUND PLATFORMS PRINCIPAL GLOBAL INVESTORS 1st Quartile 2nd Quartile 3rd Quartile 4th Quartile 7 4 3 8 5 1 25 10 4 11 16 10 5 PGI Dublin Funds (Dublin UCITS) U.S. CITs (Collective Investment Trusts) 1-year Ranking 3-year Annualized Ranking (14 CITs) (14 CITs) (11 Funds) (10 Funds) 7 3 5 3 2 1 (39 Funds) (42 Funds) Principal Funds (Sub-advised by PGI) As of 6/30/2013. Principal Fund performance is ranked against Morningstar peer groups. PGI Dublin Fund performance is ranked against Lipper peer groups. UCITS = Undertakings for Collective Investment in Transferable Securities. For CITs, single asset mandate performance is ranked against eVestment peer groups, whereas Morningstar is used for target date products. 32 |
ASSET MANAGEMENT EXPERTISE WINS MANDATES Principal Global Investors Unaffiliated AUM (in billions) Winner of the Non-U.S. Equity Value Award(1) Principal Global Real Estate Securities Fund - Class I received a 2013 Lipper Fund Award for best performing global real estate fund over the 5-year period (2) Top 10 Manager of Real Estate(3) Top 10 Manager of High Yield(4) PFG ranked No.1 company among the Best Places to Work in Money Management(5) PRINCIPAL GLOBAL INVESTORS See APPENDIX for sources 33 |
WHY IT WORKS PROVEN MULTI-BOUTIQUE APPROACH Shared vision, culture and values Strong leadership team and oversight Independent investment processes Strategic alignment of products Leverages Principal global platform Distribution Compliance Reputation Strong succession planning PRINCIPAL GLOBAL INVESTORS 34 |
1 Responsible for allocation decision-making and implementation across a range of products and client portfolios, and for providing macro economic perspectives to guide allocations. 2 $726M is sub-advised by Principal Global Investors Equities and included within the $63.1B Equities AUM shown above. OUR CURRENT BOUTIQUES (AUM as of 6/30/13) PRINCIPAL GLOBAL INVESTORS Principal Global Equities $63.1B Principal Global Fixed Income $68.1B Private Real Estate $31.5B CMBS $6.7B Origin Asset Management $2.4B Edge Asset Management $16.1B Fixed Income Equities REITs $5.0B Principal Enterprise Capital $4.4B CIMB – Principal Islamic Asset Mgmt. $870M 2 Morley Financial Services $17.4B Spectrum Asset Management $17.8B Macro Currency Group $7.7B Post Advisory Group $11.7B Multi-Asset Advisors $146M1 Real Estate Asset Allocation/ Alternatives Finisterre Capital $1.8B Columbus Circle Investors $15.4B Liongate Capital Management $1.4B = Represented at Investor Day 35 |
Founded in 1939; acquired in 2007 Offices in Seattle, Washington 21 investment professionals Equity, fixed income and asset allocation Innovation -- one of the first mutual funds and target risk funds in the industry Income-oriented strategies PRINCIPAL GLOBAL INVESTORS Boutique Close-Up 1 Includes Strategic Asset Management (SAM) assets in other PGI boutique funds. 36 |
EDGE INVESTMENT STRATEGIES EQUITY FIXED INCOME ASSET ALLOCATION Large Cap Value /Equity Income* Small Mid Cap Value/Dividend Income* All Cap/Equity Income* Capital Appreciation Core Plus* Mortgage Securities* Short-Term Income* Investment Grade* High Yield* Flexible Income* Conservative Balanced Balanced Conservative Growth Strategic Growth Emphasis on income-oriented strategies *Income-oriented strategies PRINCIPAL GLOBAL INVESTORS Boutique Close-Up 37 |
EDGE BENEFITS FROM SYNERGIES ACROSS THE PRINCIPAL 38 $23.0B in AUM* as of 6/30/13, up $7.9B from midst of financial crisis Over 95% of assets sourced by The Principal Revenue of $19.5M in 2012 Edge’s growth story – strong investment performance and working effectively across Principal distribution channels * Includes Strategic Asset Management (SAM) assets in other PGI boutique funds. PRINCIPAL GLOBAL INVESTORS Boutique Close-Up |
FINISTERRE CAPITAL RAFAEL BIOSSE DUPLAN |
Founded in 2002; acquired by Principal in 2011 36 professionals based in the U.S., U.K., Malta and Hong Kong Experienced emerging markets specialists managing hedge funds and regulated products Delivering risk-controlled, total return investment strategies Diversified institutional investor base $1.8B of AUM as of 6/30/13 2012 revenue of $47M 40 PRINCIPAL GLOBAL INVESTORS Boutique Close-Up |
DELIVERING RISK CONTROLLED STRATEGIES FINISTERRE SOVEREIGN DEBT EM sovereign debt markets FINISTERRE GLOBAL OPPORTUNITY Top-down macro EM FINISTERRE CREDIT Fundamental EM credit 41 PRINCIPAL GLOBAL INVESTORS Boutique Close-Up * Annual returns and volatility shown are since each strategy’s respective inception. |
DIVERSIFIED INSTITUTIONAL INVESTORS 42 PRINCIPAL GLOBAL INVESTORS Boutique Close-Up Scandinavia 19% Switzerland 16% Pensions & Institutions 70% Family Offices 13% Fund of Funds 13% Partners & Employees 4% AUM (in $ Millions) AUM BY COUNTRY as of 6/30/13 AUM BY TYPE as of 6/30/13 |
A PARTNERSHIP ACROSS BUSINESS LINES Leveraging PGI distribution in Asia Principal Funds selects Finisterre for the EM Credit sleeve in a Global Multi-Strategy product Principal provides platforms to Finisterre products: SDF Feeder Fund for a ERISA Client UCITS platform for a European client Principal Life General Account invests directly into Finisterre Credit Fund 43 PRINCIPAL GLOBAL INVESTORS Boutique Close-Up SDF = Sovereign Debt Fund. UCITS = Undertakings for Collective Investment in Transferable Securities. |
WELL SUITED FOR A TIME OF CHANGE Investment management industry experiencing most dramatic change since the 1970s Principal Financial Group has all the elements needed to continue to be a leading beneficiary of this change Among those elements are investment capabilities aligned with changing client needs Focus on outcomes Movement to passive core with active satellites Search for yield Shift to global and emerging markets Strong interest in alternatives PRINCIPAL GLOBAL INVESTORS 44 |
U.S. PRODUCTS PGI Global Opportunities PGI Blue Chip Equity PGI Opportunistic Municipal Bond Principal Real Estate Debt Finisterre EM Credit for Global Multi-Strategy* CAPABILITIES SERVE ALL PRINCIPAL BUSINESSES NEW PRODUCTS IN 2012 NON-U.S. PRODUCTS GENERAL ACCOUNT MCG 10% Volatility Currency Edge Equity Income Global Small Cap Islamic Global EM & Asia Pacific Ex Japan China Equity QFII Corporate Plus Post Intermediate Term High Yield PGI Global Opportunities Equity Finisterre Credit * Approved in 2012, launched in 2013 PRINCIPAL GLOBAL INVESTORS 45 |
PRINCIPAL GLOBAL INVESTORS RIGHT PRODUCTS AT RIGHT TIME U.S. Products PGI Ultra Short Fixed Income Spectrum Preferreds Principal Real Estate CMBS PGI Fixed Income Global Credit Opportunities Principal Green Property Principal Real Estate Income Closed End Fund (NYSE:PGZ) Global Products PGI Emerging Markets Opportunistic Equity PGI Fixed Income Global Credit Alpha PGI Equity Global Equity Long/Short Finisterre Emerging Markets Debt Long/Short Origin – Existing Global Funds Transition to PGI Dublin UCITS Platform Recent & upcoming launches 46 |
CLOSE TO MARKETS AND CLIENTS PRINCIPAL GLOBAL INVESTORS Principal Financial Group Worldwide Locations 47 |
STRONG MULTI-CHANNEL DISTRIBUTION DRIVES BOUTIQUE SUCCESS U.S. – Separately Managed Accounts, Alternatives International – Dublin Funds, Australian Funds Banco do Brasil CCB (China) CIMB (Malaysia) Integra (Canada) Nippon Life (Japan) STRATEGIC ALLIANCES PGI THIRD PARTY DISTRIBUTION Support Retirement and Investor Services through affiliate distribution team Collaborate with Principal International distribution PRINCIPAL DISTRIBUTION (Sales, relationship management, consultant relations) U.S. – Corporate, Public, Foundations & Endowments International – Corporate, Sovereign Funds, Central Banks PGI INSTITUTIONAL DISTRIBUTION 48 |
5 YEAR OUTLOOK Starting to see margin expansion Remain on track to deliver 30+% margin PRINCIPAL GLOBAL INVESTORS 2011 2012 6/30/13 TTM 5 Year Outlook Investment boutiques 14 16 17 20+ AUM $227.8B $263.2B $271.2B (26% Non-U.S.) $400B (50% Non-U.S.) Revenue growth rate 13% 8% 12% 14-17% Pre-tax margin 21.4% 22.8% 25.3% 30+% 49 |
Exceptionally strong and diverse array of investment capabilities that meet changing client needs. High quality investment management underpins all Principal Financial Group businesses. Global distribution and operating capabilities enhance the business of our boutique asset managers. KEY TAKEAWAYS PRINCIPAL GLOBAL INVESTORS 50 |
Q&A WITH JIM MCCAUGHAN & RAFAEL BIOSSE DUPLAN |
U.S. BUSINESSES DAN HOUSTON |
OVERVIEW RETIREMENT & INVESTOR SERVICES U.S. INSURANCE SOLUTIONS STATE OF U.S. BUSINESSES Solid underlying growth Industry competitive margins Continued strong sales & retention Compelling growth opportunities: Retirement Readiness Retirement Income Voluntary Benefits Highlighting Principal Funds STRATEGY UPDATE Accelerating growth Outlook for U.S. businesses 53 |
U.S. INSURANCE SOLUTIONS (USIS) 2010 2011 2012* 1H13 Premium & fees $847M $873M $890M $466M Operating earnings $107M $110M $112M $36M Pre-tax margin 18.0% 17.9% 17.4% 10.8% 2010 2011 2012 1H13 Premium & fees $1,296M $1,377M $1,444M $739M Operating earnings $91M $94M $89M $47M Pre-tax margin 10.8% 10.4% 9.4% 9.7% Loss ratio 69% 69% 68% 67% Individual Life Specialty Benefits SMB = Small and medium-sized businesses. * Adjusted for 3Q13 actuarial assumption review. 54 Earnings diversification Enhances SMB leadership Interest rate pressures Focus on profitable growth |
INDIVIDUAL LIFE Non-Qualified Plans 12.4% #2 Total Life New Sales Premium 1.4% #18 SPECIALTY BENEFITS Total Group In-Force Contracts 7.1% #5 - Life 8.6% #4 - Disability 6.4% #5 - Dental 6.3% #7 Individual Disability In-force Premium 7.9% #5 Individual Disability New Sales Premium 15.8% #3 U.S. INSURANCE SOLUTIONS SUCCESS REFLECTS EXPERTISE SERVING SMB MARKET 2012 Industry Rank 2012 Market Share 55 See Appendix for sources |
52% of 2009 premium 45% of 2012 premium Term strategy impact Individual Solutions 25% of 2009 premium 36% of 2012 premium Business Owner and Executive Solutions (BOES) Non-Qualified 24% of 2009 premium 19% of 2012 premium U.S. INSURANCE SOLUTIONS Individual Life STRONG GROWTH ACROSS LINES 56 Focus on business market and enhanced product diversification |
3.4% 3.2% 5.6% 2.0% 2.7% 2.8% Group Dental Group Life Group Disability The Principal Industry Dental/ Vision 48% Group Life 28% BALANCED PORTFOLIO plus ABOVE INDUSTRY PREMIUM GROWTH 2012 Total Premium & Fees 2012 Premium Growth Group Benefits 84% Individual Disability 16% Group Disability 24% U.S. INSURANCE SOLUTIONS Specialty Benefits 57 |
*Operating revenue less benefits, claims & settlement expenses less dividends to policyholders. Solid underlying growth Strong expense management Spread improvement Benefitting from strong equity markets RETIREMENT & INVESTOR SERVICES (RIS) RIS Accumulation 2010 2011 2012 1H13 Net revenue* $1,820M $1,917M $2,044M $1,138M Operating earnings $449M $473M $488M $286M Pre-tax return on net revenue 30.8% 31.4% 29.5% 31.7% RIS Guaranteed 2010 2011 2012 1H13 Net revenue* $178M $161M $155M $97M Operating earnings $94M $90M $87M $56M Pre-tax return on net revenue 73.2% 77.9% 78.3% 82.5% 58 |
STRATEGIC PLATFORM FOR GROWTH Wealth Accumulation Retirement Income RETIREMENT & INVESTOR SERVICES INDIVIDUAL EMPLOYER INVESTMENT MANAGEMENT PLATFORM CONTINUUM Across markets | Across life stages Full Service Accumulation Principal Funds Investment Only Bank Annuities Full Service Payout 59 |
Multiple Investment Approaches Across Asset Classes Multiple Distribution Channels RETIREMENT INVESTMENT PLATFORM RETAIL INVESTMENT PLATFORM Alternatives | Asset Allocation Equities | Fixed Income RETIREMENT & INVESTOR SERVICES PLATFORM DIFFERENTIATION DRIVES SUCCESS 60 |
CONTINUOUS PLATFORM ENHANCEMENT RETIREMENT & INVESTOR SERVICES Fund Year Fund Was Created Global Diversified Income Fund 2008 Core Plus Bond I Fund 2008 International Equity Index Fund 2009 Bond Market Index Fund 2009 Diversified Real Asset Fund 2010 Small-MidCap Dividend Income Fund 2011 Global Multi-Strategy Fund 2011 Opportunistic Municipal Fund 2012 Blue Chip Fund 2012 Global Opportunities Fund 2012 Liability-Driven Investing Separate Accounts 2012 Diversified Real Asset CIT 2013 Principal Trust To Retirement CIT Series 2013 LifeTime 2060 2013 More than $10.6B in sales from new investment options since 2008* 61 *Includes both retail and retirement share classes. |
Full Service Accumulation (FSA) Net cash flows as % of beginning of year assets 2009-2012. Sources of industry data: 401(k) industry – Department of Labor & Cerulli Associates 2012 (for 2012, industry 401(k) is an estimate); Funds – Strategic Insight Mutual Fund Industry Review (long-term funds). Principal Funds net flows represent long-term funds only. RESULTING NET CASH FLOW CONSISTENTLY OUTPACES INDUSTRY RETIREMENT & INVESTOR SERVICES Principal Funds 62 |
FULL SERVICE ACCUMULATION. STILL RESONATING. STILL GAINING TRACTION. ACCELERATING GROWTH Principal Total Retirement SuiteSM Retirement Readiness Plan Design Small to medium business focus leads to revenue growth Drives revenue growth across complex RETIREMENT & INVESTOR SERVICES 63 |
PRINCIPAL TOTAL RETIREMENT SUITESM STILL A DIFFERENTIATOR See Appendix for sources. RETIREMENT & INVESTOR SERVICES Full Service Accumulation Defined Benefit #1 DB provider (by # of clients) Defined Contribution #2 DC plan recordkeeper (by # of plans) Employee Stock Ownership Plan #1 ESOP plan recordkeeper (by # of plans) Nonqualified Plans #2 Deferred Comp provider (by # of clients) 64 |
RETIREMENT READINESS IMPACTING RECURRING DEPOSITS in Billions * 2Q13 compared to 4Q10. CONVERTING OPPORTUNITY INTO GROWTH People making a deferral +18%* Avg deferral per member +10%* People receiving a match +34%* Employment rates have not fully recovered – UPSIDE EXISTS RETIREMENT & INVESTOR SERVICES Full Service Accumulation 65 |
More proprietary assets WHY DOES SMB FOCUS MATTER? Higher annualized revenue on new sales Double Digit growth on a lower asset base 1H13 compared to 1H12 Nearly 4,000 plans sold in 2012 vs. 2,700 in 2011 More plans sold Higher plan count 2,000+ net new plans with <500 employees from 6/30/12 to 6/30/13 RETIREMENT & INVESTOR SERVICES Full Service Accumulation 66 |
Revenue sourced from FSA platform MULTIPLE BUSINESSES LEVERAGE FSA SUCCESS Principal Funds, PGI, Bank & Trust, Individual Annuities, Individual Life and Full Service Payout are all beneficiaries $500 MILLION $350 MILLION $0 $2B RETIREMENT & INVESTOR SERVICES Full Service Accumulation 67 |
READY TO RETIRE INDIVIDUAL INVESTOR STRATEGY Portfolio allocation Participant education RETIREMENT INCOME SOLUTIONS Education and guidance Portfolio construction strategies Income annuities ENROLLMENT OPTIMIZATION Simplify process Improve experience Maximize participation and influence behavior RETIREMENT & INVESTOR SERVICES 68 |
INDIVIDUAL INVESTOR STRATEGY CAPTURES ADDITIONAL ASSETS RETIREMENT & INVESTOR SERVICES 22% CAGR 69 |
PRINCIPAL FUNDS NORA EVERETT |
KEY GROWTH DRIVER FOR THE PRINCIPAL Measure1 2009 2010 2011 2012 1H13 Sales $7.7B $9.4B $11.2B $15.8B $11.0B Net cash flow ($0.2B) $1.6B $2.2B $6.6B $4.7B Account values2 $30.8B $36.3B $38.6B $50.4B $57.8B Return on adjusted revenue3 16.2% 24.3% 27.2% 25.7% 29.7% Operating earnings $23M $40M $48M $50M $36M PRINCIPAL FUNDS 1Includes retail mutual funds and defined contribution investment only. 2Total Principal Funds complex AUM is $98B at 6/30/13. AUM is $102B as of 7/31/13. 3Adjusted revenue is defined as operating revenue minus commissions. 71 |
STRONG NET CASH FLOW SALES AND FLOWS OUTPACE THE INDUSTRY with continued gains in market share 4x industry average 19TH LARGEST MANAGER OF INTERMEDIARY SOLD FUNDS Up 5 spots from 2010 INDUSTRY LEADING SALES GROWTH 12x industry sales growth PRINCIPAL FUNDS Comparisons based on year-end 2012. See Appendix for sources. 72 |
3 KEY GROWTH DRIVERS PRINCIPAL FUNDS Global Investment Management | Asset Allocation Expertise | Retirement Leadership 73 |
A DIVERSIFIED FAMILY OF MUTUAL FUNDS PRINCIPAL FUNDS Net Cash Flow Assets Under Management 74 |
LEADING ASSET ALLOCATION POSITIONS #5 #5 #4 LifeCycle AUM Target Risk AUM Target Date AUM PRINCIPAL FUNDS Source: Strategic Insight 6/30/13 Lifecycle Report 75 |
$23B INCOME ORIENTED MUTUAL FUND SALES* (2010 to 6/30/13) INCOME ORIENTED MUTUAL FUNDS ADDED TO >30 THIRD PARTY PLATFORMS** DEMONSTRATED SUCCESS IN RETIREMENT INCOME MARKET * Equity Income, GDI, High Yield, Income, Preferred Securities, Short-term Income, and Small-MidCap Dividend Income **Added to Recommended List, Platform or Model, 2010 to 6/30/13 PRINCIPAL FUNDS 76 |
OUTCOME-BASED PORTFOLIO CONSTRUCTION Resonates with advisors and investors PRINCIPAL FUNDS Investor Outcomes Principal Funds Multi-asset, Multi-manager Strategies Investor Needs Growth Potential Protect Purchasing Power Manage Volatility Generate Income 77 |
INVESTMENT PLATFORM SUCCESS 5 YEARS 11 NEW FUNDS $10 BILLION SALES PRINCIPAL FUNDS OVER THE LAST 78 Generated 50% of our NCF |
STRONG INVESTMENT PERFORMANCE Represents $100 billion AUM of which >75% managed by PGI boutiques Morningstar Rankings Percentage of Principal Funds in the top two quartiles PRINCIPAL FUNDS Principal Funds Class I 79 |
DRIVING INDUSTRY RECOGNITION AND ADVISOR ENGAGEMENT Hottest Fund Firms of 2012 Top 10 DC Fund Manager Best Mixed-Asset Large Fund Group 2013 PRINCIPAL FUNDS 80 |
Account Values – Then & Now MULTIPLE DISTRIBUTION CHANNELS PRINCIPAL FUNDS SALES – Then & Now 2006 $3.8B 6/30/13 $11.0B 2006 $14.7B 6/30/13 $57.8B 81 DCIO = Defined Contribution Investment Only. RIA = Registered Investment Advisor |
CONTINUING TO DRIVE ADVISOR GROWTH # of Top Advisors selling Principal Funds (>$500k)* +77% # of Advisors selling Principal Funds* +17% PRINCIPAL FUNDS * 6/30/13 vs. 6/30/12 300,000+ 100,000+ 45,000+ Advisors selling Principal Funds today Average top fund family advisor count Total FINRA Licensed advisors 82 |
From savings to consumption Investment performance redefined Defined Contribution Investment Only GROWTH + = PRINCIPAL FUNDS DRIVING FUTURE GROWTH TRENDS STRATEGY PRINCIPAL FUNDS 83 |
ALLIANCES IN 2013: 67% of FSA Sales 85% of Funds Sales DISTRIBUTION UPDATE RETIREMENT & INVESTOR SERVICES Firms w/$1B sales 7 84 |
DISTRIBUTION EVOLUTION RETIREMENT & INVESTOR SERVICES Collaborative approach to capture more Principal branded funds 2018 2006 2012 Accumulation Model FSA Focus NQ VA Principal Funds Worksite/ Connection FSA PRINCIPAL BRANDED FUNDS 85 |
2010 2011 2012 1H13 RIS Accumulation $17.7B $21.2B $29.2B $16.7B Individual Life $164M $186M $227M $119M Specialty Benefits $241M $285M $256M $158M RIS & USIS SALES REMAIN STRONG DISTRIBUTION UPDATE 86 |
5 YEAR OUTLOOK Near-term premium and fee growth impacted by economic headwinds Stable loss ratios continue Maintaining margins is a key focus U.S. INSURANCE SOLUTIONS: *Adjusted for 1Q12 change in amortization basis and 3Q12 actuarial assumption review. Reported numbers can be found in financial supplement. 87 |
5 YEAR OUTLOOK Market returns are helping recent revenue growth Maintaining return on revenue margin is a key focus RETIREMENT & INVESTOR SERVICES 88 |
Competitive investment performance paired with continuous product innovation leads to success. SMB focus continues to be a differentiator and is a driver of future growth. Principal Funds is a key contributor to the company’s growth with its success in outcome-based products and advisor growth. Multi-channel distribution approach creates many ways to win. KEY TAKEAWAYS U.S. BUSINESSES 89 |
Q&A WITH DAN HOUSTON & NORA EVERETT |
PRINCIPAL INTERNATIONAL LUIS VALDES |
PRINCIPAL INTERNATIONAL OVERVIEW Our Strategy 2013 Spotlight: Chile AGENDA BUILDING A SUCCESSFUL FRANCHISE Latin America Asia 92 |
OUR STRATEGY PRINCIPAL INTERNATIONAL Brazil Chile Mexico China Hong Kong India Indonesia Malaysia Singapore Thailand Capitalize on large and growing middle class in key emerging Latin American and Asian markets by delivering mutual fund, asset management, and pension expertise and solutions. 93 |
STRONG GROWTH ACROSS KEY MEASURES PRINCIPAL INTERNATIONAL 2010 2011 2012 1H13 Net Cash Flow $4.7B $5.5B $9.3B $4.7B AUM $45.8B $52.8B $69.3B $102.9B Combined* Net Revenue $813M $1,096M $1,116M $657M Combined* pre-tax RONR 49% 53% 56% 56% Operating Earnings $122M $135M $154M $103M *Combined basis includes all Principal International companies at 100%. 94 |
2013 SPOTLIGHT ON CHILE PRINCIPAL INTERNATIONAL 95 |
CREATING A “ONE-STOP SHOP” PRINCIPAL INTERNATIONAL Chile 96 ERM = Enterprise Risk Management |
EXECUTING OUR GROWTH STRATEGY We are maximizing synergies Between PI Chile and Cuprum. Creating a cohesive team for sales and service of our full menu of Principal solutions: Mandatory pension Voluntary/complementary pension Voluntary NQ long term savings Retirement income solutions Strengthening Cuprum’s focus on voluntary opportunities Focusing on cross-selling, customer experience and retention PRINCIPAL INTERNATIONAL Chile 97 |
OFFERING A FULL SET OF SOLUTIONS Savings & Pension Retirement Income INVESTMENT MANAGEMENT PLATFORM CONTINUUM Across markets | Across life stages Retail Mutual Funds APV APVC/G Life Accumulation Mandatory Accumulation Programmed Withdrawals Mandatory Payout Annuities Voluntary Payout Annuities Retail Mutual Funds PRINCIPAL INTERNATIONAL Chile 98 APV = Ahorro Previsional Voluntario; APVC/G = Ahorro Previsional Voluntario Colectiveo |
OPPORTUNITY: Long-Term Savings A large affluent and high-affluent customer base Customers are not saving enough Low replacement ratios Complete product offering is a winning proposition for customers Investment options and tax benefits Integrated product offering improves our competitiveness Education and advice to our customers Alignment with The Principal as a pension expert PRINCIPAL INTERNATIONAL Chile 99 |
PRINCIPAL INTERNATIONAL NED BURMEISTER |
PRINCIPAL INTERNATIONAL BUILDING A SUCCESSFUL FRANCHISE Mutual Funds Asset Management Pensions 101 |
Economic growth and emergence of affluent and middle classes Government acknowledgement of its inability to fund public pension plans Laws and structure to encourage individual participation (tax-advantaged savings) Incentives for private sector involvement Emergence of long-term individual investing behavior ACCELERATING RETIREMENT AND LONG-TERM SAVINGS GROWTH 102 PRINCIPAL INTERNATIONAL |
COMPLETE OFFERING Pensions Mutual Funds Asset Management Payout Solutions Brazil Chile Mexico = New in past 18 months Claritas in Brazil Cuprum in Chile PRINCIPAL INTERNATIONAL Latin America 103 |
DIFFERENTIATORS OUR RETIREMENT FRANCHISE Proven Partnerships Strong Distribution Global Asset Management Expertise Global Pension Focus PRINCIPAL INTERNATIONAL Latin America 104 |
BRAZIL MEXICO CHILE Brasilprev: #1 in net deposits 37% market share 5th largest AFORE (by AUM) #3 in net AUM transfers #1 APV: PI Chile and Cuprum 25% market share PRINCIPAL IS 2ND LARGEST PENSION PROVIDER IN LATIN AMERICA PROVEN STRENGTH & SUCCESS PRINCIPAL INTERNATIONAL Latin America 105 See APPENDIX for sources |
OUR OFFERINGS Pensions Mutual Funds Asset Management China Hong Kong India Malaysia/ SE Asia = New in past 12 months Pension Retirement Scheme (PRS) in Malaysia PRINCIPAL INTERNATIONAL Asia 106 |
CURRENT STATE OF PENSION SYSTEM IN OUR ASIAN MARKETS Private Pension Hong Kong Malaysia Mainland China India PRINCIPAL INTERNATIONAL Asia 107 |
DIFFERENTIATORS Proven Partnerships Strong Distribution Global Asset Management Expertise Advisory Based Selling OUR LONG-TERM SAVINGS FRANCHISE PRINCIPAL INTERNATIONAL Asia 108 |
HONG KONG Among Top Ten MPF* Providers BUILDING A STRONG FOUNDATION MALAYSIA #2 in Asset Management CHINA Top Ten for Mutual Funds INDIA 1st mover in advisory services business PRINCIPAL INTERNATIONAL Asia 109 *Mandatory Provident Fund. See APPENDIX for sources. |
BUILDING UPON OUR SUCCESS We are actively: Focusing on advisory sales of mutual funds Strengthening distribution Deepening our understanding of local markets and customers Shaping regulatory change As pension privatization evolves, we are: Well-positioned to be a fast mover We will continue to build momentum, by: Growing our profitable business Leveraging our expertise --- globally PRINCIPAL INTERNATIONAL Asia 110 |
5 YEAR OUTLOOK 2011 2012 6/30/13 TTM 5 Year Outlook Combined1 net revenue growth rate 35% 2% 8% 15-20% Combined1 pre-tax RONR 53% 56% 56% 55-60% AUM $52.8B $69.3B $102.9B $160B Net cash flow2 12% 18% 16% 8-10% % of Principal operating earnings 14% 16% 18% 25-30% 1Combined basis includes all Principal International companies at 100% 2Net cash flow as a percent of beginning of year assets under management Continues to be a strong growth engine for The Principal PRINCIPAL INTERNATIONAL 111 |
Built a leading retirement franchise in Latin America and a solid long term savings foundation in Asia. Emerging pension and long-term savings market opportunities will continue to unfold. Successful onboarding of Cuprum allows us to focus on maximizing value across multiple products. KEY TAKEAWAYS PRINCIPAL INTERNATIONAL 112 |
Q&A WITH LUIS VALDES & NED BURMEISTER |
INVESTMENTS TIM DUNBAR |
REMAINS THE SAME Liability-driven investment approach Active asset/liability management Optimized risk adjusted yields and returns High quality, well-diversified portfolio Global collaboration and best practices Portfolio responsibility remains at local country INVESTMENT PHILOSOPHY AND STRATEGY INVESTMENTS 115 |
DIVERSIFIED PORTFOLIO Principal Financial Group $68.9 Billion * Other includes Equity Securities, Residential Mortgages, Real Estate, Policy Loans, Investment in Equity Method subs, Direct Finance Leases and Other Investments INVESTMENTS 116 Invested Assets & Cash As of 6/30/13 GAAP carrying value |
INVESTED ASSETS & CASH As of 6/30/13 GAAP carrying value U.S. $62.7 Billion International $6.2 Billion ** Other includes Equity Securities, Real Estate, and Other Investments * Other includes Equity Securities, Residential Mortgages, Real Estate, Policy Loans, and Other Investments INVESTMENTS Corporate Public Bonds 28% Corporate Private Bonds 20% 117 |
ASSETS & LIABILITIES PERFORMED AS EXPECTED INVESTMENTS 118 |
Majority of unrealized losses were never realized because we were not forced sellers CMBS CONTINUES TO BE WELL SUITED FOR OUR LIABILITIES INVESTMENTS * Cumulative CMBS Credit Losses represent 2008 to present losses due to credit impairments, sales or trust write-downs. ** Cumulative actual losses since 2008 from sales or trust write-downs. *** Potential future credit losses based on a moderate stress scenario of actively held CMBS bonds as of current reporting period presented. 119 |
Losses over the next three years are expected to be below pricing assumptions. This assumes no material downturn of the U.S. or Global economy. INVESTMENT LOSS PROJECTION This is one possible loss scenario shown for Principal Life Insurance Company and consolidated subsidiaries. Portfolio sizes reflect Principal Financial Group U.S. invested assets, excluding the Principal Global Investors segment. Years 2008-2012 reflect actual losses for Principal Financial Group, excluding Principal Global Investors segment. Losses are after-tax. *Loss projections are based on the bond and commercial mortgage portfolio only. Size of Portfolio (Amortized Cost) as of 12/31/12 INVESTMENTS 120 |
FIXED INCOME SECURITIES PORTFOLIO Principal Financial Group U.S. Invested Assets GAAP Carrying Value PORTFOLIO STABLE AND IMPROVED NAIC Class 2010 2011 2012 6/30/13 1 59.3% 60.2% 60.4% 61.3% 2 32.4 32.5 32.6 31.7 3 5.3 5.2 4.9 4.9 4 1.6 1.3 1.3 1.1 5 1.0 0.5 0.5 0.7 6 0.4 0.3 0.3 0.3 100.0% 100.0% 100.0% 100.0% Total $46.3B $46.7B $47.9B $46.4B Investment grade (Class 1&2) 91.7% 92.7% 93.0% 93.0% BIG as % of total fixed income portfolio 8.3% 7.3% 7.0% 7.0% BIG as a % of total U.S. invested assets 6.3% 5.6% 5.3% 5.3% % of Fixed Income Securities Portfolio unless otherwise indicated. BIG = below investment grade INVESTMENTS 121 |
Reflects high quality attributes. Collateral values have rebounded from the low point in the recession through improved market fundamentals. COMMERCIAL MORTGAGES CONTINUE TO IMPROVE 12/31/2010 12/31/2011 12/31/2012 6/30/2013 Portfolio size* $9.0B $8.8B $9.6B $10.4B Current loan-to-value (LTV) 66% 60% 54% 52% Current debt service coverage (DSC) 1.8X 2.0X 2.2X 2.4X Current occupancy 89% 90% 92% 92% Loans with LTV above 80% and DSC below 1.0X $317M (30 loans) $198M (23 loans) $109M (10 loans) $52M (9 loans) Average loan size $10.6M $11.0M $11.7M $12.2M INVESTMENTS * Excludes credit tenant loans and commercial mortgages held in the Principal Global Investors segment. 122 |
Shorter duration portfolio works well in rising rate environment Modest increase in private asset classes Allocations to PGI boutiques Expertise and relative value in real estate Use of 3rd party managers to round out alternative capabilities PORTFOLIO PERFORMANCE LEADS TO VALUE ADDED STRATEGIES INVESTMENTS 123 |
KEY TAKEAWAYS Continue to invest in assets that match our liabilities. Diversified high-quality portfolio. Invest in assets with the best risk-adjusted yields. Commercial real estate continues to improve and is an area of expertise. INVESTMENTS 124 |
FINANCIALS TERRY LILLIS |
POWER OF OUR FEE-BASED MODEL FINANCIALS OPERATING EARNINGS Continual shift in mix of business leading to a higher ROE and more free cash flow Fee Spread Risk 126 Fee includes Full Service Accumulation, Mutual Funds, Principal Global Investors, Principal International. Spread includes Individual Annuities, Bank and Trust Services, Investment Only, Full Service Payout. Risk includes U.S. Insurance Solutions. |
RETURN ON EQUITY (ROE) As Reported 2007 Adjusted* TTM as of 2Q13 Operating earnings $1.1B $1.0B Average equity (x-OCI) $6.5B $8.5B Return on equity (x-OCI) 16.4% 11.3% Replaced approximately $150M of risk/spread operating earnings with fee-based operating earnings Increased the mean equity base by ~30% Expect ROE to increase 50 to 80 bps annually * Adjusted for the 3Q12 Actuarial Assumption Review By year end, earnings will be near pre-crisis levels FINANCIALS 127 |
ACHIEVING 10-12% ANNUAL OPERATING EARNINGS GROWTH ROE expansion driven by focusing on the numerator EARNINGS EQUITY 4-5% for market performance 4-5% for growth from sales/NCF 1-2% operational efficiency 128 FINANCIALS ROE Expansion |
EQUITY GROWS AT A SLOWER RATE and by managing the denominator EQUITY EARNINGS Fee-based growth Dividend growth Opportunistic share repurchases AVERAGE EQUITY (x-OCI) GROWTH RATES 129 FINANCIALS ROE Expansion |
ACHIEVING A 15% ROE IN 5 YEARS 8% 10% 12% 14% EARNINGS GROWTH* EQUITY GROWTH* 3.0% 5.0% 6.5% 8.5% 130 * 5 year CAGR FINANCIALS ROE Expansion |
RETURNING CAPITAL TO SHAREHOLDERS 2007 Current 2018E Less capital needed to support organic growth Moving to higher dividend payout ratio Diligently pursuing active acquisition pipeline Opportunistically buying back shares Net Income of $2.0B (2010-2012) Announced capital deployment of $3.2B (2011-2012) ($1.7B without Cuprum) 131 FINANCIALS Capital Management (Acquisitions & share buybacks) Organic Growth Dividends Available Capital |
WE’VE PLAYED OFFENSE SINCE RECESSION Emerged from financial crisis in a position of strength and flexibility Executing on our strategy to increase our global footprint and fee-based earnings 7 DIVIDEND INCREASES SINCE 2008 STRATEGIC PLAY RATIONALE 2013 Expand alternative asset class capabilities DIVIDEND INCREASE 2012 Complete offering in Chile with marquee pension and savings franchise Entry into Brazil mutual funds and asset management market ANNUAL DIVIDEND: $0.78 2011 Enhance global equity investment capabilities Establish leadership in emerging markets fixed income investing AFORE Solidify position as a leader in Mexican Afore market ANNUAL DIVIDEND: $0.70 2010 BrasilPrev extension 23 year extension of successful JV with Banco do Brasil Health exit Limited scale to compete ANNUAL DIVIDEND: $0.55 2009 ANNUAL DIVIDEND: $0.50 2008 CMBS securitization cessation Inactivity in CMBS market ANNUAL DIVIDEND: $0.45 132 FINANCIALS Capital Management |
MERGER & ACQUISITION CRITERIA Mid-teens IRR More accretive than buyback over time 1 2 3 STRATEGIC ABILITY TO ONBOARD DISCIPLINED PRICING Aligns with our core competencies Blend local talent with Principal expertise Synergies with multiple lines of business preferred Adds scale or a new niche Have a diligent M&A process that optimizes long-term results 133 FINANCIALS Capital Management IRR = Internal Rate of Return. |
2013 CAPITAL DEPLOYMENT Still expect to deploy $400M-600M $405M already allocated for the year $211M (23 cents in 1Q & 2Q, 26 cents in 3Q) in common stock dividends $150M share repurchases ($117M left*) $44M Liongate acquisition Any buybacks in 2H13 would be mostly anti-dilutive in nature 134 FINANCIALS Capital Management *as of 6/30/13. |
WHAT IF IMPACT OF A SLOW-RISING INTEREST RATE ENVIRONMENT PROS CONS Fixed income AUM declines Unrealized gain/loss BOTTOM LINE: Less downside impact means less upside impact, but still upside More Net Investment Income Lower security benefit costs Individual Life & fixed deferred annuities benefit Potential for more Full Service Payout pipeline 135 FINANCIALS |
ACCUMULATION Net revenue growth 6-8% Pre-tax RONR 28-32% GUARANTEED Net revenue growth 6-8% Pre-tax RONR 75-80% LIFE Premium & fee growth 4-8% Pre-tax operating margin 16-21% SBD Premium & fee growth 8-10% Pre-tax operating margin 8-12% Loss Ratio 65-71% KEY BUSINESS DRIVERS 5 Year Outlook – Hasn’t Changed Revenue growth 14-17% Pre-tax margin 30%+ Combined* net revenue growth 15-20% Combined* pre-tax RONR 55-60% RONR = Return on Net Revenue *Combined basis includes all Principal International companies at 100% Retirement & Investor Services Principal Global Investors Principal International U.S. Insurance Solutions 136 |
KEY TAKEAWAYS Fee-based growth leads to ROE expansion and more free cash flow. On track to again reach a 15% ROE. Capital deployment strategy shifting to higher dividend payout ratio while making strategic acquisitions and opportunistic buybacks. 137 FINANCIALS |
Q&A WITH ALL PRESENTERS |
139 |
140 Slide 33: Sources: (1) Principal Global Investors announced as winner in the non-US Equity Value excluding emerging markets category by Institutional Investor in their U.S. Investment Management Awards, March 2013. (2) The Principal Real Estate Investors portfolio management team sub-advises the Principal Global Real Estate Securities Fund-Class I, which recently received a 2013 Lipper Fund Award for being the best performing global real estate fund over the 5-year period. (3) Managers ranked by U.S. institutional, tax-exempt domestic real estate equity assets (net of leverage) managed internally. “Largest Money Managers”, Pensions & Investments, May 27, 2013, data as of 12/31/12. (4) Managers ranked by U.S. institutional, tax-exempt assets managed internally, as of 12/31/12. “Largest Money Managers” Pensions & Investments, Online Research Center. (5) Recognition was for firms with 1,000 or more employees. Pensions & Investments, December 10, 2012. (6) Managers ranked by total assets under management. America’s Top 300 Money Manager, Institutional Investor, July 2013, data as of 12/31/2012. Slide 55: Nonqualified Plans ranking from Plan Sponsor Survey 2012 (NQ). All other rankings are from LIMRA 2012. Slide 64: All rankings sourced from PLAN SPONSOR magazine as follows – Defined Benefit: DB Administration Survey 04/13; Defined Contribution and ESOP: Recordkeeping Survey 06/13; Nonqualified: Deferred Compensation Buyer’s Guide 12/12 Slide 72: Sales growth from ICI. Cash flow and intermediary sold funds from Strategic Insight, largest manager of intermediary sold funds. Slide 105: Brazil source: Quantum. 12/12. Mexico source: CONSAR & PROCESAR. 5/13. Chile source: SP (Superintendencia de Pensiones) 12/12. Principal is 2nd largest pension provider in Latin America by AUM among multi-country pension providers. Slide 109: Malaysia source: Lipper. Percentage of market share as of 7/13. Hong Kong source: Lipper. Based on AUM as of 3/13. China source: Z-Ben Advisors. Based on AUM as of 1/13. India source: Company data/media tracking. At launch 11/12 FOOTNOTES & SOURCES |
Thank You! |