Table of Contents
Exhibit 99.1
Table of Contents
Energy is everywhere at Emera. It is our focus and at the core of our people. We are using this energy to transform our company from high to low carbon generation. By doing so, we are expanding our business, listening to our customers and creating a more sustainable tomorrow.
LEADING A RENEWABLE
TRANSFORMATION
| Table of Contents | ||||
| 1 | ||||
| 4 | ||||
| 11 | ||||
| 16 | ||||
| 24 | ||||
| 28 | ||||
| 29 | ||||
| 50 | ||||
| 51 | ||||
| 52 | ||||
| 57 | ||||
| 106 | ||||
| 108 | ||||
| 109 | ||||
Table of Contents

DEAR FELLOW SHAREHOLDERS,
2010 marked a year of transformation for Emera. Our business achieved record earnings, record shareholder returns and we made significant progress on our strategy. We’ve diversified our earnings, increased our clean generation and set the stage for future growth.
Emera’s success has been the result of five years of solid progress, with more than eight per cent annualized growth between 2006 and 2009. Following a comprehensive strategic review with our Board of Directors in 2009, it was determined that, to continue to achieve our target growth rate, we needed to change the way we approach our business development activities.
By late 2009 we had increased the business development capacity in our subsidiary companies. Today we have stand-alone units, fully governed with development capacity in various levels of the business. As a result of this structure, in 2010 Nova Scotia Power conducted the largest capital program in its history. Bangor Hydro acquired Maine & Maritimes Corporation, and the Caribbean has gone from a small investment to a business of scale. Emera’s business development activities resulted in the signing of an historic agreement with Nalcor Energy to bring energy from the Lower Churchill projects to Newfoundland and Labrador, as well as to consumers in the Maritime Provinces and New England. Emera continues to provide an important level of governance and oversight at the corporate level, and we are seeing positive outcomes thanks to this shift in our strategy.
Looking forward, Emera’s strategy focuses on maintaining a long-term sustainable growth rate of four to six per cent. While we have seen annualized growth of more than eight per cent over the last five years, we know that targeting a higher long-term growth rate could change Emera’s risk profile. We understand that maintaining our risk profile is important to you, our shareholders, and we will continue to apply our stringent, disciplined process as we grow our business.
To achieve our growth targets, we focused our strategy in 2010 in four key areas: renewables, transmission, natural gas and utility investments. We are reducing the carbon intensity of our energy portfolio through wind, biomass, tidal, solar and hydro generation. We are connecting new renewables to the electricity grid and investing in natural gas as back-up generation for intermittent renewables. Finally, we are using our core skills and strengths to increase our portfolio by acquiring utilities as opportunities present themselves.

We apply this same strategy in every region where we do business. We continue to see unprecedented opportunities in northeastern North America, where there is a great need for renewable energy and lower emissions. Because significant renewable generation is found in northern New England and Atlantic Canada, there is an increased need to build transmission to bring that energy to the larger customer base in southern New England.
Since 2006 Emera has been working on the Northeast Energy Link project, a transmission line that would supply renewable energy from Northern Maine and the Maritime Provinces to the southern New England markets. That project has continued to move forward, but it required a greater supply of low emission energy to become economically viable for customers in New England. Emera’s recently signed agreement with Nalcor Energy on the Lower Churchill projects will provide that supply and result in more renewable investments in Nova Scotia and New Brunswick, and ultimately transmission investments for New England – exactly what we had originally envisioned back in 2006.
1
Table of Contents
Our agreement with Nalcor Energy supports our vision to develop Atlantic Canada and New England into a regional powerhouse of secure, affordable, renewable energy. Moving forward on the first phase of the project not only brings to life Newfoundland’s ambitions for Lower Churchill, it creates new opportunities for other renewable energy development throughout our region. And it means a better-connected, more robust, more reliable and more flexible electricity grid. The reduction of emissions, the addition of new renewable energy, and the development of transmission infrastructure required to bring this energy to customers in all of our businesses will result in a significant increase in capital spending over the next decade. We expect to invest up to $1 billion in new capital throughout Emera in each of the next five years.
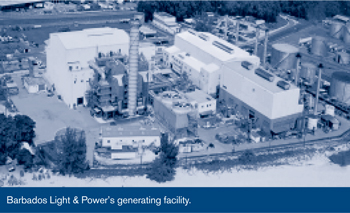
The same strategy applies to Emera’s Caribbean business. The islands in the Caribbean are highly carbon dependent, with little to no fuel diversification. They have a need for cleaner and more affordable electricity. Island by island, Emera is applying the same strategy – increased renewables, transmission, alternate fuels and utility investments. This year we grew our Caribbean business by increasing our investment in Grand Bahama Power Company and taking a majority ownership in Light & Power Holdings, parent company to Barbados Light & Power.
2010 also saw Emera move into the western US area with our decision to partner with Algonquin Power to see if this could be another source of growth for Emera. Initially, we made a small investment in Algonquin Power, and we continue to work at aligning both company strategies. If we can achieve strategic alignment, this investment could be another platform for growth in Emera’s future.
Many of our businesses had record earnings in 2010, including Nova Scotia Power, Bangor Hydro, Brunswick Pipeline, Emera Utility Services, Emera Energy and its Bayside Power plant.
In Nova Scotia, the provincial government released its Renewable Electricity Plan in early 2010. In addition to the requirement to have five per cent new renewables on-line by 2011, Nova Scotia Power is now required to have an additional five per cent by 2013, and 25 per cent renewable energy in total by 2015. These goals have been anticipated by Nova Scotia Power and we have a plan in place to meet these targets.

In addition to wind development, biomass will be a key component of our 2013 compliance. Nova Scotia Power announced early in the year its intention to develop a 60 megawatt biomass co-generating facility with its largest customer, NewPage Port Hawkesbury in Cape Breton. Biomass plays a critical role in renewable energy strategies around the world, and we believe it will play an important role here in Nova Scotia, where we can displace foreign fossil fuels with local renewable energy.
Lower Churchill hydroelectric power, transmitted through the proposed Maritime Link, will also provide a significant contribution to the 2020 target, and we continue to see tidal energy as a promising source of renewable energy.
2 EMERA INC. 2010 ANNUAL FINANCIAL REPORT
Table of Contents
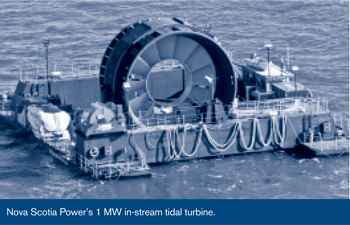
As we transform from high to low carbon fuel sources, we continue to invest in emerging renewable technologies. In 2009, a one megawatt in-stream tidal turbine was deployed in the Bay of Fundy. We had set out to accomplish three goals: first, we wanted to see if we could successfully deploy and recover the tidal turbine. Second, we wanted to understand how this technology might impact the Bay of Fundy, and finally, how the Bay of Fundy would impact the technology. In late 2010 we successfully recovered the tidal unit, and have certainly made progress on understanding the effects of tidal energy. We’ve learned that there is more energy potential than we anticipated, and as a result, the tidal technology was overcome. Although the turbine was impacted, the deployment and recovery provide us with a level of success and the opportunity for improvement. If we can harness the tremendous energy of the tides, then the likelihood of commercial technology is much greater. We see 2010 as a successful year for such an early-stage project, and are optimistic about the opportunities that lie ahead.
As a result of our strategic progress and resulting momentum this year, we are pleased that the Board of Directors increased our dividend by 17 cents in September, and continue to be committed to a 70 to 75 per cent payout ratio. This 15 per cent increase brought our dividend growth in line with our earnings per share growth over the last five years.
In late 2009, we made changes to our Dividend Reinvestment Plan (DRIP) to enable shareholders to buy Emera shares through the DRIP at a five per cent discount. There has been significant shareholder interest in this plan. As of November 2010, 27 per cent of our shares have been reinvested through participation in the DRIP. Raising equity through increased participation in our DRIP is an important element of our long-term financing plan and we are pleased that so many of our shareholders have chosen to participate.
Excellent corporate governance underlies everything we do. We demand transparency, accountability and the highest level of ethical conduct in all of our activities. We are proud to report that Emera placed 13th out of 187 companies ranked byThe Globe and Mail’s 2010 corporate governance survey. This independent survey uses a rigorous process to rank each company’s governance. This ranking confirms our attention to this essential fiduciary responsibility.
We thank our Board of Directors for their significant contribution to our success. Our Board plays an integral role in setting our strategy, overseeing our operating performance and implementing strong corporate governance. Each member brings a wealth of experience and expertise to their role on our Board. We are also pleased to welcome two new Board members this year. Richard Sergel, former President and Chief Executive Officer of the North American Electric Reliability Corporation (NERC), and Sylvia Chrominska, Group Head of Global Human Resources and Communications for The Bank of Nova Scotia, were appointed to the Board in September. Both are tremendous additions to the Emera Board and will provide invaluable guidance as we continue to grow.
Finally, we must thank our 3,600 employees for their commitment and dedication to Emera. They play an integral role in the success of our company.
Sincerely,
 |
| |
| Christopher G. Huskilson | John T. McLennan | |
President and Chief Executive Officer | Chairman of the Board of Directors | |

3
Table of Contents
AND ANALYSISAS AT FEBRUARY 11, 2011
Management’s Discussion and Analysis (“MD&A”) provides a review of the results of operations of Emera Inc. and its primary subsidiaries and investments during the fourth quarter of 2010 relative to 2009, and the full year 2010 relative to 2009 and to 2008; and its financial position at December 31, 2010 relative to 2009. To enhance shareholders’ understanding, certain multi-year historical financial and statistical information is presented.
This discussion and analysis should be read in conjunction with the Emera Inc. annual audited consolidated financial statements and supporting notes. Emera Inc. follows Canadian Generally Accepted Accounting Principles (“CGAAP”), including the application of rate-regulated accounting policies for Emera Inc.’s rate-regulated subsidiaries. Emera Inc.’s wholly owned subsidiaries – Nova Scotia Power Inc. (“NSPI”), Bangor Hydro Electric Company (“Bangor Hydro”), Maine Public Service Company (“MPS”) and Emera Brunswick Pipeline Company Ltd. (“Brunswick Pipeline”) – are subject to rate regulation, and the accounting policies used by these entities may differ in regard to the timing of recognition of certain assets, liabilities, revenue and expenses from those used by Emera Inc.’s non-rate-regulated companies. NSPI’s accounting policies are subject to examination and approval by the Nova Scotia Utility and Review Board (“UARB”). Bangor Hydro’s and MPS’s accounting policies are subject to examination and approval by the Maine Public Utilities Commission (“MPUC”) and the Federal Energy Regulatory Commission (“FERC”).
Throughout this discussion, “Emera Inc.”, “Emera” and “company” refer to Emera Inc. and all of its consolidated subsidiaries and affiliates.
All amounts are in Canadian dollars (“CAD”) except for the Bangor Hydro section of the MD&A, which is reported in US dollars (“USD”) unless otherwise stated.
Additional information related to Emera, including the company’s Annual Information Form, can be found on SEDAR at www.sedar.com.
Forward-Looking Information
This MD&A contains forward-looking information and forward-looking statements, which reflect the current view with respect to the company’s objectives, plans, financial and operating performance, business prospects and opportunities. Certain factors that may affect future operations and financial performance are discussed, including information in the Outlook section of the MD&A. Wherever used, the words “may”, “will”, “intend”, “estimate”, “plan”, “believe”, “anticipate”, “expect”, “project” and similar expressions are intended to identify such forward-looking statements and should not be read as guarantees of future events, performance or results, and will not necessarily be accurate indications of whether, or the times at which, such events, performance or results will be achieved.
Although Emera believes such statements are based on reasonable assumptions, such statements are subject to certain risks, uncertainties and assumptions pertaining to, but not limited to, operating performance, regulatory requirements, weather, general economic conditions, commodity prices, interest rates and foreign exchange rates. Should one or more of these risks or uncertainties materialize, or should underlying assumptions prove incorrect, actual results may vary significantly from those expected. Emera disclaims any intention or obligation to update or revise any forward-looking information or forward-looking statements, whether as a result of new information, future events or otherwise, except as required under applicable securities laws.
Structure of MD&A
This MD&A begins with an Introduction and Strategic Overview, followed by a Consolidated Financial Review, including Consolidated Statements of Earnings, Balance Sheets and Cash Flow Highlights, and Outstanding Share Data; then presents information on NSPI, Bangor Hydro (includes Maine & Maritimes Corporation (“MAM”)) and Pipelines (includes Brunswick Pipeline and Maritimes & Northeast Pipeline). All other operations are grouped and discussed under Other, Including Corporate Costs, and include Emera Energy (includes Emera Energy Services, Bayside Power Limited Partnership (“Bayside Power”) and Bear Swamp Power Company LLC. (“Bear Swamp”)); Emera Utility Services (“EUS”); Caribbean (includes Grand Bahama Power Company Limited (“GBPC”), Light and Power Holdings (“LPH”), the parent company of Barbados Light and Power Company Limited (“BLPC”), St. Lucia Electricity Services (“Lucelec”) and ICD Utilities Limited (“ICDU”)); and corporate activities. Outlook, Liquidity and Capital Resources, Pension Funding, Off-Balance Sheet Arrangements, Transactions with Related Parties, Dividends and Payout Ratios, Risk Management and Financial Instruments, Disclosure and Internal Controls, Significant Accounting Policies and Critical Accounting Estimates, Changes in Accounting Policies and Summary of Quarterly Results are presented on a consolidated basis.
4 EMERA INC. 2010 ANNUAL FINANCIAL REPORT
Table of Contents
MANAGEMENT’S DISCUSSION AND ANALYSIS
INTRODUCTION AND STRATEGIC OVERVIEW
Emera Inc. is an energy and services company with $6.3 billion in assets. The company invests in electricity generation, transmission and distribution as well as gas transmission and utility energy services. Emera’s strategy is focused on the transformation of the electricity industry to cleaner generation and the delivery of that clean energy to market. Emera has interests throughout northeastern North America, in three Caribbean countries and in California.
Emera’s goal is to deliver annual consolidated earnings growth of four per cent to six per cent, and to build and diversify its earnings base with a focus on cleaner energy in its markets. Emera will continue to seek growth from its existing businesses and will leverage its core strength in the electricity business as it pursues both acquisitions and greenfield development opportunities in regulated electricity transmission and distribution and low risk generation.
Over 90 per cent of Emera’s revenues are earned by regulated entities – NSPI, Bangor Hydro and Brunswick Pipeline. NSPI is a wholly owned, fully integrated regulated utility with $4.0 billion of assets, which provides electricity generation, transmission and distribution services to approximately 489,000 customers in the province of Nova Scotia. Bangor Hydro is an electric transmission and distribution company with $730.4 million of assets serving approximately 118,000 customers in eastern Maine. In December 2010, Emera purchased all of the outstanding shares of Maine and Maritimes Corporation (“MAM”), the parent company of MPS, a regulated electric transmission and distribution utility serving approximately 36,000 electricity customers in northern Maine. At December 31, 2010, MAM’s assets and liabilities have been included on Emera’s consolidated balance sheet. These businesses operate as monopolies in their service territories. Brunswick Pipeline is a 145-kilometre pipeline carrying re-gasified liquefied natural gas (“LNG”) from the Canaport™ LNG terminal in Saint John, New Brunswick to the United States border. This regulated pipeline operates under a 25-year firm service agreement with Repsol Energy Canada.
The success of Emera’s primary businesses is integral to the creation of shareholder value, providing strong, predictable earnings and growing cash flows to fund dividends and reinvestment.
Although markets in Nova Scotia and Maine are otherwise mature, the transformation of energy supply to lower emission sources has created the opportunity for organic growth within NSPI and Bangor Hydro. Both companies expect earnings growth of three per cent to five per cent annually over the next five years as new investments are made in renewable generation and transmission.
Emera also has interests in three Caribbean countries. In December 2010, Emera purchased an additional 55.4 per cent direct and indirect interest in GBPC, bringing total ownership to 80.4 per cent. At December 31, 2010, GBPC’s assets and liabilities have been included on Emera’s consolidated balance sheet. Emera also has a 38 per cent interest in LPH, the parent company of BLPC, and a 19 per cent interest in Lucelec, a vertically integrated electric utility on the Caribbean island of St. Lucia.
Emera’s remaining revenues are earned by a growing group of strategic investments that are expected to contribute more significantly to Emera’s earnings in the coming years. These are described in more detail in the relevant sections of the MD&A.
Non-GAAP Measures
Emera uses financial measures that do not have a standardized meaning under CGAAP.
EMERA ENERGY – BEAR SWAMP
“Earnings per common share – basic, absent the Bear Swamp after-tax mark-to-market adjustment”, “Contribution to consolidated net earnings, absent the Bear Swamp after-tax mark-to-market adjustment” and “Contribution to consolidated net earnings per common share, absent the Bear Swamp after-tax mark-to-market adjustment” are non-GAAP financial measures used by Emera. Management discloses these financial measures as it believes the inclusion of the mark-to-market adjustment in Emera Energy’s financial results does not accurately reflect its operational performance. Many investors use this financial measure to assess Emera’s overall financial performance. The adjustment is discussed further in the Significant Item section and Other, Including Corporate Costs.
NSPI
“Electric margin”, defined as “Electric revenue” less “Fuel for generation and purchased power”, net of the “Fuel adjustment” and fuel related foreign exchange losses or gains, is a non-GAAP financial measure used by NSPI. This measure is disclosed as management believes it provides further information regarding the impact of the fuel adjustment mechanism (“FAM”) on NSPI’s operations. Electric margin is discussed further in the NSPI Review of 2010 section.
5
Table of Contents
CONSOLIDATED FINANCIAL REVIEW
Consolidated Financial Highlights
| Three Months Ended December 31 | Year Ended December 31 | |||||||||||||||||||
MILLIONS OF DOLLARS (EXCEPT EARNINGS PER COMMON SHARE)
| 2010
| 2009
| 2010
| 2009
| 2008
| |||||||||||||||
Revenues | $ | 392.7 | $ | 406.5 | $ | 1,553.7 | $ | 1,483.5 | $ | 1,331.9 | ||||||||||
Net earnings applicable to common shares | 39.6 | 37.5 | 191.1 | 175.7 | 144.1 | |||||||||||||||
Earnings per common share – basic | 0.35 | 0.33 | 1.68 | 1.56 | 1.29 | |||||||||||||||
Earnings per common share – diluted | 0.34 | 0.33 | 1.65 | 1.52 | 1.26 | |||||||||||||||
Cash dividends declared per share | – | 0.2725 | 1.16 | 1.03 | 0.97 | |||||||||||||||
| Three Months Ended December 31 | Year Ended December 31 | |||||||||||||||||||
OPERATING UNIT CONTRIBUTIONS
| 2010
| 2009
| 2010
| 2009
| 2008
| |||||||||||||||
NSPI | $ | 20.7 | $ | 17.4 | $ | 121.3 | $ | 109.3 | $ | 105.6 | ||||||||||
Bangor Hydro | 7.8 | 7.0 | 31.9 | 27.5 | 23.1 | |||||||||||||||
Pipelines | 8.8 | 8.4 | 35.0 | 24.2 | 15.4 | |||||||||||||||
Other | 3.3 | 8.9 | 16.1 | 14.3 | 3.5 | |||||||||||||||
Corporate (costs) recovery and other | (1.0 | ) | (4.2 | ) | (13.2 | ) | 0.4 | (3.5 | ) | |||||||||||
Net earnings applicable to common shares | $ | 39.6 | $ | 37.5 | $ | 191.1 | $ | 175.7 | $ | 144.1 | ||||||||||
Net earnings applicable to common shares, absent the Bear Swamp after-tax mark-to-market adjustment | $ | 42.2 | $ | 34.3 | $ | 199.7 | $ | 175.0 | $ | 148.9 | ||||||||||
Earnings per common share – basic | $ | 0.35 | $ | 0.33 | $ | 1.68 | $ | 1.56 | $ | 1.29 | ||||||||||
Earnings per common share – basic, absent the Bear Swamp after-tax mark-to-market adjustment | $ | 0.38 | $ | 0.30 | $ | 1.76 | $ | 1.55 | $ | 1.33 | ||||||||||
As at December 31 | ||||||||||||||||||||
2010
| 2009
| 2008
| ||||||||||||||||||
Total assets | $ | 6,329.1 | $ | 5,284.5 | $ | 5,269.4 | ||||||||||||||
Total liabilities | $ | 4,555.5 | $ | 3,778.6 | $ | 3,723.2 | ||||||||||||||
6 EMERA INC. 2010 ANNUAL FINANCIAL REPORT
Table of Contents
MANAGEMENT’S DISCUSSION AND ANALYSIS
Developments
Emera
AGREEMENT WITH NALCOR ENERGY ON LOWER CHURCHILL PROJECTS
On November 18, 2010, Emera and Nalcor Energy (“Nalcor”), with the endorsement of the governments of Nova Scotia and Newfoundland and Labrador, signed a term sheet which includes the obligation to negotiate and conclude final agreements for an estimated $6.2 billion hydroelectric development that would bring energy from a new hydroelectric generating facility at Muskrat Falls on the Lower Churchill River in Labrador to consumers in Newfoundland and Labrador, Nova Scotia, other Maritime provinces and New England. This development is expected to result in a strong regional system that enhances the ability to move energy among provinces, improve reliability of the system and is consistent with Emera’s focus on cleaner, affordable electricity.
The proposed agreement between Emera and Nalcor would see:
| • | Nalcor construct and own an estimated $2.9 billion, 824 megawatt (“MW”) hydroelectric generating facility at Muskrat Falls on the Lower Churchill River in Labrador, with a planned in-service date of 2017. |
| • | Emera and Nalcor together develop an estimated $2.1 billion electricity transmission project in Newfoundland and Labrador to enable the movement of the Muskrat Falls energy between Labrador and the island of Newfoundland (the “Island Link”). Emera invest approximately $600 million in the Island Link. |
| • | Emera build and own an estimated $1.2 billion transmission project between the island of Newfoundland and Nova Scotia, including a 180-kilometre subsea cable, in return for 20 per cent of the energy output from Muskrat Falls for 35 years (the “Maritime Link”). |
Agreements resulting from this term sheet will be subject to a number of conditions, including final approval of the Boards of Directors of Emera and Nalcor, approval of regulators in the provinces of Nova Scotia and Newfoundland and Labrador and all environmental approvals.
Effective January 24, 2011, Rick Janega, previously the Executive Vice President and Chief Operating Officer of Nova Scotia Power Inc., assumed the role of President, Emera, Newfoundland and Labrador. In this role, he will report to Nancy Tower when she assumes her role as CEO, Emera, Newfoundland and Labrador, effective May 1, 2011.
ADDITIONAL INVESTMENT IN GRAND BAHAMA POWER COMPANY LIMITED
On December 22, 2010, Emera purchased an additional 55.4 per cent direct and indirect interest in GBPC for $88.1 million USD ($87.7 million CAD), bringing total ownership to 80.4 per cent. GBPC is an integrated utility with 19,000 customers and 137 MW of installed oil-fired capacity. The Grand Bahama Port Authority regulates GBPC and has granted the utility a licensed, regulated and exclusive franchise to produce, transmit and distribute electricity on the island until 2054. There is a fuel pass-through mechanism and flexible tariff adjustment policies to ensure that costs are recovered and a reasonable return earned. The purchase was funded with existing credit facilities.
MAINE & MARITIMES CORPORATION
On December 21, 2010, Emera purchased all of the outstanding shares of MAM for $80.4 million USD ($81.9 million CAD). MAM is the parent company of MPS, a regulated electric transmission and distribution utility serving approximately 36,000 electricity customers in northern Maine. The purchase was funded with existing credit facilities.
7
Table of Contents
STRATEGIC PARTNERSHIP WITH ALGONQUIN POWER & UTILITIES CORP.
On January 1, 2011, Emera and Algonquin Power & Utilities Corp. (“APUC”) closed their acquisition of the California-based electricity distribution and related generation assets of NV Energy, Inc. for total consideration of $131.8 million USD ($134.2 million CAD), subject to final adjustments. Emera and APUC own and operate these assets through a newly formed utility company, California Pacific Electric Company, LLC (“California Pacific”). APUC and Emera own respectively a 50.001 per cent and 49.999 per cent interest in California Pacific Utility Ventures, LLC (“CPUV”), which wholly owns California Pacific. The amount paid by Emera for its 49.999 per cent equity investment in the common shares of CPUV is $30.9 million USD ($31.5 million CAD).
In April 2009, Emera entered into a subscription agreement with APUC, giving Emera the right to acquire 8.523 million APUC common shares, which represented a 9.9 per cent interest in APUC at that time, upon the closing of the California Pacific transaction. Upon the January 1, 2011 closing of the California Pacific transaction, Emera exchanged the subscription receipts it acquired under the April 2009 subscription agreement into 8.523 million APUC common shares, issued at $3.25 per share. As a result of this transaction, Emera owns an approximate 8.2 per cent equity interest in APUC. Under the April 2009 subscription agreement, Emera is entitled to purchase additional APUC common equity to bring its interest to 15 per cent.
On December 9, 2010, Emera announced its intention to purchase 12 million subscription receipts from APUC at an issue price of $5.00 each for a total purchase price of $60 million. Emera will issue a promissory note to APUC in the principal amount of $60 million in exchange for the subscription receipts. The subscription receipts will be convertible to 12 million APUC common shares upon the acquisition by APUC’s regulated subsidiary, Liberty Energy Utilities Co., of all issued and outstanding shares of Granite State Electric Company and Energy North Natural Gas Inc., two regulated electric utilities, currently owned by National Grid USA. On the closing of the National Grid transaction and following the exercise of Emera’s anti-dilution rights, Emera’s percentage ownership interest in APUC will be approximately 15 per cent. Proceeds from the subscription receipts will be used by APUC to finance a portion of this acquisition, which is expected to close in late 2011. The purchase of the subscription receipts has received conditional Toronto Stock Exchange approval.
BARBADOS LIGHT & POWER COMPANY LIMITED
On December 20, 2010, Emera offered to purchase all issued and outstanding common shares from LPH shareholders at a cash price of $25.70 Barbadian dollars. This offer closed on January 24, 2011. On January 25, 2011, Emera purchased 7.2 million shares of LPH at a cash price per share of $25.70 Barbadian dollars, representing an additional interest of 41.9 per cent. With this additional investment of $91.9 million, Emera became the majority shareholder of LPH, with a total interest of 79.9 per cent.
Previously, on May 11, 2010, Emera acquired a 38 per cent interest in LPH, the parent company of BLPC, for $85 million USD. BLPC is the sole utility operator on the island of Barbados, serving 120,000 customers. BLPC has three power generation stations with 239 MW of installed capacity. A fuel pass-through mechanism ensures costs are recovered and a cost-of-service regulation provides for an approved 12.75 per cent return on equity. This transaction was immediately accretive and was financed with existing credit facilities.
DIVIDENDS
In February 2010, the Board of Directors approved a quarterly dividend increase, effective May 3, 2010, to $0.2825 per common share, and in September 2010 approved a further increase to $0.3250 effective November 1, 2010, reflecting an increase on an annualized basis to $1.30 per common share.
APPOINTMENTS
Effective May 1, 2011, Nancy Tower, presently the Executive Vice President and Chief Financial Officer of Emera and Nova Scotia Power Inc., will assume the role of Executive Vice President, Business Development for Emera Inc. In addition to overall responsibility for business development as previously noted, Ms. Tower will also oversee the Emera partnership with Nalcor, including the execution of the Lower Churchill projects as the CEO, Emera, Newfoundland and Labrador.
On September 24, 2010, Sylvia Chrominska and Richard Sergel joined the Emera Board of Directors.
8 EMERA INC. 2010 ANNUAL FINANCIAL REPORT
Table of Contents
MANAGEMENT’S DISCUSSION AND ANALYSIS
NSPI
DEFERRAL OF CERTAIN TAX BENEFITS RELATED TO RENEWABLE ENERGY PROJECTS FOR FISCAL 2010
On December 23, 2010, the UARB granted NSPI approval to defer certain tax benefits related to renewable energy projects arising in 2010. Accordingly, effective December 31, 2010, NSPI recognized a deferral of $14.5 million through an increase in regulatory amortization. The UARB will convene a proceeding in 2011 to discuss how this deferral will be applied.
UARB DECISION ON FUEL ADJUSTMENT MECHANISM
On December 8, 2010, the UARB approved NSPI’s setting of the 2011 base cost of fuel and its recovery of all unrecovered fuel related costs as submitted in NSPI’s November 2010 filing. The recovery of these costs will begin January 1, 2011. The UARB approved the recovery of these costs by NSPI over three years, with 50 per cent of the rate increase to be recovered in 2011, 30 per cent in 2012 and 20 per cent in 2013. The decision results in an average rate increase of approximately 4.5 per cent for customers in 2011. Pursuant to the FAM Plan of Administration, NSPI is entitled to earn a return on the unrecovered balance of fuel related costs.
RENEWABLE ENERGY PROJECTS
PORT HAWKESBURY BIOMASS PROJECT
On October 14, 2010, the UARB approved NSPI’s $208.6 million capital work order request for the Port Hawkesbury biomass project. NSPI will develop this 60 MW co-generating facility at the NewPage Port Hawkesbury Corporation (“NewPage”) site. NSPI will own the facility while NewPage will construct and operate the plant as well as supply the fuel. This project is expected to be commissioned in 2013 and supply approximately three per cent of the province of Nova Scotia’s total electricity needs.
POINT TUPPER WIND DEVELOPMENT PROJECT
On June 14, 2010, the UARB approved NSPI’s $27.8 million capital work order for the Point Tupper Wind Development Project. The Project went into service in August 2010.
DIGBY WIND PROJECT
On May 28, 2010, NSPI purchased $30.1 million in wind generation assets under development related to the Digby Wind Project from a subsidiary of Emera. NSPI has requested UARB approval of this project through the submission of a capital work order. The Project was completed and went into service in December 2010 at a total cost of approximately $80.0 million. The UARB hearing took place in January 2011, and a decision is pending.
NOVA SCOTIA PROVINCIAL ENVIRONMENTAL REGULATIONS
RENEWABLE ELECTRICITY PLAN
On October 15, 2010, the Nova Scotia Government enacted regulations under the Electricity Act related to the Province’s Renewable Electricity Plan. These regulations establish the requirement that 25 per cent of electricity be supplied from renewable sources by 2015. These regulations build on the previously legislated requirements for 2011 and 2013 by adding an additional five per cent for 2015. Recent amendments to the Electricity Act, and the new regulations, provide for the appointment, by spring 2011, of a new, independent renewable electricity administrator to conduct the procurement of at least 300 gigawatt hours (“GWh”) of energy from independent power producers (“IPPs”) to meet the 2015 standard. NSPI is also provided the opportunity to develop 300 GWh of renewable energy.
MERCURY EMISSIONS
On July 22, 2010, the province of Nova Scotia announced, for the years 2010 through 2013, allowable mercury emissions would be increased from the previous cap of 65 kg per year. NSPI was requested to develop a plan of staged mercury emission reductions, for its generation facilities, for the period of 2010 to 2020 and meet an annual cap of 35 kg beginning in 2020.
9
Table of Contents
CANADIAN FEDERAL ENVIRONMENTAL REGULATIONS
GREENHOUSE GAS
On June 23, 2010, the Federal Department of Environment announced its intentions for a new national greenhouse gas (“GHG”) framework for the electricity sector. This federal framework, if developed further into regulations, would require thermal coal units to meet GHG emission levels equal to, or better than, a natural gas combined cycle generating unit at a future date. Nova Scotia’s existing GHG regulations require reductions in NSPI’s emissions similar to the intentions of the federal framework. NSPI is reviewing the implications of this federal framework and its alignment with NSPI’s current operating plans under existing Nova Scotia regulations.
US SECURITIES AND EXCHANGE COMMISSION REGISTRATION
On July 15, 2010, NSPI registered debt securities with the US Securities and Exchange Commission (“SEC”) under the US Securities Act of 1933.
APPOINTMENTS
On May 3, 2010, Elaine Sibson and Lee Bragg joined the NSPI Board of Directors.
Bangor Hydro
COLLECTIVE AGREEMENT
In July 2010, Bangor Hydro reached an agreement with its unionized employees, which will expire in July 2015.
KEENE ROAD 345 KV SUBSTATION PROJECT
In December 2010, Bangor Hydro’s Keene Road 345 kilovolt (“kV”) Substation Project was completed at a total cost of approximately $33.0 million USD.
Significant Item
BEAR SWAMP MARK-TO-MARKET ADJUSTMENT
As part of its long-term energy and capacity supply agreement, expiring in 2021, with the Long Island Power Authority (“LIPA”), Bear Swamp has contracted with its joint venture partner to provide the power necessary to produce the requirements of the LIPA contract. One of the contracts between Bear Swamp and Emera’s joint venture partner is marked-to-market through earnings, as it does not meet the stringent accounting requirements of hedge accounting.
As at December 31, 2010, the fair value of the derivative was a net liability of $8.2 million (December 31, 2009 – $6.2 million net asset). The fair value of this derivative is subject to market volatility of power prices and will reverse over the life of the agreement.
The mark-to-market adjustment relating to this position was as follows:
| Three Months Ended December 31 | Year Ended December 31 | |||||||||||||||||||
MILLIONS OF DOLLARS (EXCEPT EARNINGS PER COMMON SHARE)
| 2010
| 2009
| 2010
| 2009
| 2008
| |||||||||||||||
Mark-to-market (loss) gain | $ | (4.4 | ) | $ | 5.5 | $ | (14.4 | ) | $ | 1.2 | $ | (8.1 | ) | |||||||
After-tax mark-to-market (loss) gain | $ | (2.6 | ) | $ | 3.2 | $ | (8.6 | ) | $ | 0.7 | $ | (4.8 | ) | |||||||
Earnings per common share – basic | $ | 0.35 | $ | 0.33 | $ | 1.68 | $ | 1.56 | $ | 1.29 | ||||||||||
Earnings per common share – basic, absent the Bear Swamp after-tax mark-to-market adjustment | $ | 0.38 | $ | 0.30 | $ | 1.76 | $ | 1.55 | $ | 1.33 | ||||||||||
10 EMERA INC. 2010 ANNUAL FINANCIAL REPORT
Table of Contents
MANAGEMENT’S DISCUSSION AND ANALYSIS
Review of 2010
Emera Consolidated Statements of Earnings
| Three Months Ended December 31 | Year Ended December 31 | |||||||||||||||||||
MILLIONS OF DOLLARS (EXCEPT EARNINGS PER COMMON SHARE)
| 2010
| 2009
| 2010
| 2009
| 2008
| |||||||||||||||
Electric revenue | $ | 362.1 | $ | 368.1 | $ | 1,436.1 | $ | 1,402.0 | $ | 1,280.8 | ||||||||||
Finance income from direct financing lease | 13.7 | 15.2 | 56.5 | 25.3 | – | |||||||||||||||
Other revenue | 16.9 | 23.2 | 61.1 | 56.2 | 51.1 | |||||||||||||||
| 392.7 | 406.5 | 1,553.7 | 1,483.5 | 1,331.9 | ||||||||||||||||
Fuel for generation and purchased power | 176.8 | 168.8 | 718.7 | 583.5 | 525.1 | |||||||||||||||
Fuel adjustment | (24.0 | ) | (10.6 | ) | (99.0 | ) | 8.5 | – | ||||||||||||
Operating, maintenance and general | 92.0 | 84.5 | 336.1 | 294.4 | 266.8 | |||||||||||||||
Provincial, state and municipal taxes | 12.3 | 12.4 | 49.1 | 49.9 | 49.4 | |||||||||||||||
Depreciation and amortization | 45.7 | 42.2 | 173.6 | 164.9 | 151.3 | |||||||||||||||
Regulatory amortization | 24.6 | 16.4 | 41.3 | 35.7 | 28.5 | |||||||||||||||
| 65.3 | 92.8 | 333.9 | 346.6 | 310.8 | ||||||||||||||||
Equity earnings | 2.3 | 2.0 | 13.6 | 14.0 | 15.2 | |||||||||||||||
Financing charges | 43.8 | 45.1 | 168.4 | 135.3 | 123.2 | |||||||||||||||
| 23.8 | 49.7 | 179.1 | 225.3 | 202.8 | ||||||||||||||||
Income taxes | (13.4 | ) | 12.4 | (12.8 | ) | 48.9 | 58.1 | |||||||||||||
Net earnings before non-controlling interest | 37.2 | 37.3 | 191.9 | 176.4 | 144.7 | |||||||||||||||
Non-controlling interest | (2.4 | ) | (0.2 | ) | (2.3 | ) | 0.7 | 0.6 | ||||||||||||
Net earnings | 39.6 | 37.5 | 194.2 | 175.7 | 144.1 | |||||||||||||||
Preferred share dividends | – | – | 3.1 | – | – | |||||||||||||||
Net earnings applicable to common shares | $ | 39.6 | $ | 37.5 | $ | 191.1 | $ | 175.7 | $ | 144.1 | ||||||||||
Earnings per common share – basic |
$ |
0.35 |
|
$ |
0.33 |
|
$ |
1.68 |
|
$ |
1.56 |
|
$ |
1.29 |
| |||||
Earnings per common share – diluted |
$ |
0.34 |
|
$ |
0.33 |
|
$ |
1.65 |
|
$ |
1.52 |
|
$ |
1.26 |
| |||||
Emera Inc.’s consolidated net earnings applicable to common shares increased $2.1 million to $39.6 million in Q4 2010 compared to $37.5 million for the same period in 2009. Emera’s annual consolidated net earnings applicable to common shares increased $15.4 million to $191.1 million in 2010 compared to $175.7 million in 2009, and $144.1 million in 2008.
11
Table of Contents
Highlights of the changes are summarized in the following table:
MILLIONS OF DOLLARS
| Three Months Ended
| Year Ended
| ||||||
Consolidated net earnings applicable to common shares – 2008 | $ | 144.1 | ||||||
NSPI – Increased net earnings due to an electricity price increase, partially offset by increased fuel expense; operating, maintenance and general (“OM&G”) expense and depreciation and amortization | 3.7 | |||||||
Bangor Hydro – Increased net earnings due mainly to a transmission rate increase and a weaker average CAD in 2009 | 4.4 | |||||||
Pipelines – Increased net earnings from Brunswick Pipeline due to allowance for funds used during construction (“AFUDC”) on construction of the pipeline in the first half of the year and financing income from commencement of pipeline operations in July 2009, partially offset by increased intercompany financing charges related to the financing of the pipeline | 8.8 | |||||||
Other – Increased net earnings primarily related to the after-tax mark-to-market adjustments on the favourable commodity price positions in Bear Swamp and Emera Energy | 10.8 | |||||||
Corporate costs and other – Decreased due to increased income tax recovery and intercompany financing revenues | 3.9 | |||||||
Consolidated net earnings applicable to common shares – 2009 | $ | 37.5 | $ | 175.7 | ||||
NSPI – Increased net earnings primarily due to decreased income taxes resulting from decreased earnings before income taxes, deductions related to renewable investments and a change in the expected benefit from other accelerated tax deductions | 3.3 | 12.0 | ||||||
Bangor Hydro – Increased net earnings primarily due to transmission rate increases and increased transmission pool revenue related to recovery of regionally funded transmission investments, partially offset by a stronger average CAD in 2010 | 0.8 | 4.4 | ||||||
Pipelines – Increased net earnings primarily due to Brunswick Pipeline’s service commencement in July 2009 as compared to a full year in 2010 | 0.4 | 10.8 | ||||||
Other – Decreased net earnings in the quarter due primarily to Bear Swamp‘s mark-to-market loss, operational issues at GBPC, partially offset by improved energy marketing results. Year over year increase is due to increased EUS earnings and improved energy marketing results, partially offset by Bear Swamp’s mark-to-market loss | (5.6 | ) | 1.8 | |||||
Corporate costs and other – Decreased in the quarter due to deferral of business development costs. Year over year increase is primarily due to increased financing charges | 3.2 | (13.6 | ) | |||||
Consolidated net earnings applicable to common shares – 2010 | $ | 39.6 | $ | 191.1 | ||||
Q4 basic earnings per share were $0.35 in 2010 compared to $0.33 in 2009; and $1.68 for the full year 2010 compared to $1.56 in 2009 and $1.29 in 2008.
Consolidated Net Earnings History
MILLIONS OF DOLLARS
| 2010
| 2009
| 2008
| 2007
| 2006
| 2005
| ||||||||||||||||||
Net earnings applicable to common shares | $ | 191.1 | $ | 175.7 | $ | 144.1 | $ | 151.3 | $ | 125.8 | $ | 121.2 | ||||||||||||
Net earnings applicable to common shares, absent the Bear Swamp after-tax mark-to-market adjustment | $ | 199.7 | $ | 175.0 | $ | 148.9 | $ | 141.9 | $ | 125.8 | $ | 121.2 | ||||||||||||
Earnings Per Share History
DOLLARS
| 2010
| 2009
| 2008
| 2007
| 2006
| 2005
| ||||||||||||||||||
Earnings per share | $ | 1.68 | $ | 1.56 | $ | 1.29 | $ | 1.36 | $ | 1.14 | $ | 1.11 | ||||||||||||
Earnings per share, absent the Bear Swamp after-tax mark-to-market adjustment | $ | 1.76 | $ | 1.55 | $ | 1.33 | $ | 1.28 | $ | 1.14 | $ | 1.11 | ||||||||||||
12 EMERA INC. 2010 ANNUAL FINANCIAL REPORT
Table of Contents
MANAGEMENT’S DISCUSSION AND ANALYSIS
Consolidated Balance Sheets Highlights
Significant changes in the consolidated balance sheets between December 31, 2010 and December 31, 2009 include:
MILLIONS OF DOLLARS
| Increase (Decrease)
| Explanation
| ||||
Assets | ||||||
Cash and cash equivalents | $ | (12.4 | ) | See consolidated cash flow highlights section. | ||
Restricted cash | 58.6 | Cash in trust related to purchase of APUC subscription receipts. | ||||
Accounts receivable | (16.6 | ) | Settlement of a receivable from a natural gas supplier, partially offset by higher posted margin to counterparties and acquisition of MAM and increased investment in GBPC. | |||
Income tax receivable | 39.7 | Recovery of income taxes due to deductions related to renewable investments and a change in the expected benefit from other accelerated tax deductions. | ||||
Other Assets | 224.7 | Increased future income tax (“FIT”) regulatory asset, recognition of the FAM regulatory asset in 2010 and acquisition of MAM, partially offset by regulatory amortization and decreased regulatory assets related to financial instruments. | ||||
Future income tax assets (including long-term portion) | (10.0 | ) | Decreased FIT asset related primarily to derivatives recognized in accumulated other comprehensive loss (“AOCI”) partially offset by increased US mark-to-market losses on held-for-trading derivatives. | |||
Goodwill | 91.3 | Goodwill on acquisition of MAM and increased investment in GBPC. | ||||
Intangibles | 11.4 | Software and land rights acquisitions in NSPI and acquisition of MAM. | ||||
Investments subject to significant influence | 20.5 | Primarily the acquisition of a 38% interest in LPH, offset by the consolidation of GBPC since acquiring a controlling interest. | ||||
Net investment in direct financing lease | 11.3 | Costs related to direct financing lease of Brunswick Pipeline. | ||||
Property, plant and equipment | 517.0 | Capital spending, primarily in NSPI, acquisition of MAM and further investment in GBPC. | ||||
Construction work in progress | 112.8 | Capital spending, primarily in NSPI, and a further investment in GBPC. | ||||
Liabilities and Shareholders’ Equity | ||||||
Accounts payable and accrued charges | 93.7 | Timing of payments largely associated with capital projects and increased amount of business activity. | ||||
Derivatives in a valid hedging relationship (including long-term portion) | (56.8 | ) | Favourable commodity price and USD price positions and natural gas derivatives reclassified to “Held-for-trading”. The effective portion of the change is recognized in AOCI. | |||
Held-for-trading derivatives (including long-term portion) | 14.7 | Unfavourable commodity price positions in Emera Energy. | ||||
Future income tax liabilities | 165.7 | Increased FIT liability on property, plant and equipment, including renewable investments, FAM regulatory asset and FIT in MAM, partially offset by increased FIT asset on asset retirement obligations. The portion expected to be recovered from customers in future rates is recognized in “Other assets”. | ||||
Asset retirement obligations | 37.3 | Recognition of asset retirement obligations in NSPI. | ||||
Other liabilities | 13.6 | Acquisitions of MAM and further investment in GBPC. | ||||
Short-term debt and long-term debt (including current portion) | 520.9 | Increased debt levels to fund significant capital programs, acquisition of MAM, further investment in GBPC and investment in LPH. | ||||
Non-controlling interest | (11.4 | ) | Increased investment in GBPC. | |||
Common shares | 39.8 | Issuance of common shares. | ||||
Preferred shares | 146.7 | Issuance of preferred shares. | ||||
Accumulated other comprehensive loss | 22.0 | Primarily represents the effective portion of favourable commodity price positions, partially offset by the unfavourable effect of the CAD on Emera’s investment in Bangor Hydro. | ||||
Retained earnings | 59.1 | Net earnings in excess of dividends declared. | ||||
13
Table of Contents
Consolidated Cash Flow Highlights
Significant changes in the consolidated cash flow statements between December 31, 2010 and December 31, 2009 include:
| Three Months Ended December 31 | ||||||||||
MILLIONS OF DOLLARS
| 2010
| 2009
| Explanation
| |||||||
Cash and cash equivalents, beginning of period | $ | 47.5 | $ | 27.7 | ||||||
Provided by (used in): | ||||||||||
Operating activities | 185.5 | 94.7 | In 2010 and 2009, cash earnings and favourable non-cash operating working capital. | |||||||
Investing activities | (442.8 | ) | (163.9 | ) | In 2010, capital spending, including multi-year projects and renewable investments in NSPI and acquisition of further interest in GBPC and purchase of MAM. | |||||
In 2009, capital spending, including multi-year projects in NSPI and the completion of Brunswick Pipeline. | ||||||||||
Financing activities | 219.0 | 63.8 | In 2010, increased debt levels, partially offset by dividends on common and preferred shares. | |||||||
In 2009, increased debt levels, partially offset by dividends on common shares. | ||||||||||
Foreign currency impact on cash balances | 0.2 | (0.5 | ) | |||||||
Cash and cash equivalents, end of year | $ | 9.4 | $ | 21.8 | ||||||
| Year Ended December 31 | ||||||||||
MILLIONS OF DOLLARS
| 2010
| 2009
| Explanation
| |||||||
Cash and cash equivalents, beginning of period | $ | 21.8 | $ | 12.2 | ||||||
Provided by (used in): | ||||||||||
Operating activities | 416.4 | 310.2 | In 2010, cash earnings and favourable non-cash operating working capital. | |||||||
In 2009, cash earnings partially offset by unfavourable non-cash working capital. | ||||||||||
Investing activities | (894.8 | ) | (367.2 | ) | In 2010, capital spending, including multi-year projects and renewable investments in NSPI, investment in LPH, an additional investment in GBPC and purchase of MAM. | |||||
In 2009, capital spending including multi-year projects in NSPI, Brunswick Pipeline, and acquisition of Bayside, partially offset by a return of capital from M&NP. | ||||||||||
Financing activities | 466.2 | 70.5 | In 2010, increased debt levels and the issuance of preferred shares, partially offset by dividends on common and preferred shares. | |||||||
In 2009, increased long-term debt, partially offset by decreased short-term debt, dividends on common shares and redemption of NSPI’s preferred shares. | ||||||||||
Foreign currency impact on cash balances | (0.2 | ) | (3.9 | ) | ||||||
Cash and cash equivalents, end of year | $ | 9.4 | $ | 21.8 | ||||||
Operating activities increased $106.2 million to $416.4 million for the year ended December 31, 2010 compared to $310.2 million in 2009, primarily due to lower accounts receivable and the settlement of a contract receivable from a natural gas supplier, higher accounts payable and accrued charges, offset by income tax receivable in 2010 compared to income tax payable in 2009.
14 EMERA INC. 2010 ANNUAL FINANCIAL REPORT
Table of Contents
MANAGEMENT’S DISCUSSION AND ANALYSIS
Outstanding Share Data
ISSUED AND OUTSTANDING:
| Millions of
| Common Share Capital
| ||||||
December 31, 2008 | 112.21 | $ 1,081.4 | ||||||
Issued for cash under purchase plans | 0.45 | 8.7 | ||||||
Options exercised under senior management share option plan | 0.32 | 5.8 | ||||||
Share-based compensation | – | 0.8 | ||||||
December 31, 2009 | 112.98 | $ 1,096.7 | ||||||
Issued for cash under purchase plans | 1.32 | 32.8 | ||||||
Options exercised under senior management share option plan | 0.32 | 6.0 | ||||||
Share-based compensation | – | 1.0 | ||||||
December 31, 2010 | 114.62 | $ 1,136.5 | ||||||
As at January 31, 2011, the number of issued and outstanding common shares was 114.69 million.
15
Table of Contents
POWER INC.
Overview
NSPI, created through the privatization in 1992 of the crown corporation Nova Scotia Power Corporation, is a fully integrated regulated electric utility and the primary electricity supplier in Nova Scotia. NSPI has $4.0 billion of assets and provides electricity generation, transmission and distribution services to approximately 489,000 customers. The company owns 2,368 MW of generating capacity, of which approximately 53 per cent is coal-fired; natural gas and/or oil comprise another 27 per cent of capacity; and hydro and wind production total 20 per cent. In addition, NSPI has contracts to purchase renewable energy from IPPs. These IPPs own 186 MW, increasing to 226 MW in 2011, of wind and biomass fuelled generation capacity. A further 85 MW of renewable capacity is being built directly or purchased under long-term contract by NSPI and is expected to be in service by the end of 2012. NSPI also owns approximately 5,000 kilometres of transmission facilities and 29,000 kilometres of distribution facilities. NSPI has a workforce of approximately 1,900 people.
NSPI is a public utility as defined in the Public Utilities Act (Nova Scotia) (“Act”) and is subject to regulation under the Act by the UARB. The Act gives the UARB supervisory powers over NSPI’s operations and expenditures. Electricity rates for NSPI’s customers are also subject to UARB approval. NSPI is not subject to a general annual rate review process, but rather participates in hearings from time to time at NSPI’s or the UARB’s request.
NSPI is regulated under a cost-of-service model, with rates set to recover prudently-incurred costs of providing electricity service to customers, and provide an appropriate return to investors. NSPI’s regulated return on equity (“ROE”) range for 2010 was 9.1 per cent to 9.6 per cent, on an actual regulated common equity component of up to 40 per cent of average regulated capitalization.
In 2009, the UARB approved a FAM, allowing NSPI to recover fluctuating fuel expenses from customers through annual fuel rate adjustments. In 2010, revenue associated with fuel comprised approximately 45 per cent of total revenue. As the FAM mitigates NSPI’s net earnings’ exposure to fuel volatility, it facilitates longer planning cycles. This enables NSPI to increase its focus on the impact that non-fuel components of the business have on net earnings, while retaining focus on managing fuel costs for customers. In 2010, tax benefits associated with renewable energy investments reduced costs, and thus NSPI did not seek a general rate adjustment with the UARB.
Review of 2010
| NSPI | Three Months Ended December 31 | Year Ended December 31 | ||||||||||||||||||
MILLIONS OF DOLLARS (EXCEPT EARNINGS PER COMMON SHARE)
| 2010
| 2009
| 2010
| 2009
| 2008
| |||||||||||||||
Electric revenue | $ | 296.4 | $ | 302.9 | $ | 1,167.3 | $ | 1,188.1 | $ | 1,111.1 | ||||||||||
Fuel for generation and purchased power | 146.2 | 138.5 | 586.7 | 500.7 | 471.4 | |||||||||||||||
Fuel adjustment | (24.0 | ) | (10.6 | ) | (99.0 | ) | 8.5 | – | ||||||||||||
Operating, maintenance and general | 65.0 | 58.4 | 237.5 | 215.1 | 203.7 | |||||||||||||||
Provincial grants and taxes | 10.1 | 10.0 | 40.1 | 40.5 | 41.2 | |||||||||||||||
Depreciation and amortization | 39.9 | 36.8 | 150.8 | 143.9 | 133.6 | |||||||||||||||
Regulatory amortization | 23.7 | 14.7 | 36.9 | 27.2 | 17.7 | |||||||||||||||
Other revenue | (4.7 | ) | (4.0 | ) | (15.4 | ) | (14.0 | ) | (15.5 | ) | ||||||||||
Earnings before financing charges and income taxes | 40.2 | 59.1 | 229.7 | 266.2 | 259.0 | |||||||||||||||
Financing charges | 32.8 | 33.3 | 125.8 | 114.7 | 106.8 | |||||||||||||||
Earnings before income taxes | 7.4 | 25.8 | 103.9 | 151.5 | 152.2 | |||||||||||||||
Income taxes | (13.3 | ) | 8.4 | (17.4 | ) | 42.2 | 46.6 | |||||||||||||
Contribution to consolidated net earnings applicable to common shares | $ | 20.7 | $ | 17.4 | $ | 121.3 | $ | 109.3 | $ | 105.6 | ||||||||||
Contribution to consolidated earnings per common share |
$ |
0.18 |
|
$ |
0.15 |
|
$ |
1.07 |
|
$ |
0.97 |
|
$ |
0.94 |
| |||||
NSPI’s contribution to consolidated net earnings applicable to common shares increased $3.3 million to $20.7 million in Q4 2010 compared to $17.4 million in Q4 2009. Annual contribution to consolidated net earnings applicable to common shares increased $12.0 million to $121.3 million in 2010 compared to $109.3 million in 2009 and $105.6 million in 2008.
16 EMERA INC. 2010 ANNUAL FINANCIAL REPORT
Table of Contents
MANAGEMENT’S DISCUSSION AND ANALYSIS
Highlights of the contribution to consolidated earnings changes are summarized in the following table:
MILLIONS OF DOLLARS
| Three Months Ended
| Year Ended
| ||||||
Contribution to consolidated net earnings applicable to common shares – 2008 | $ | 105.6 | ||||||
Increased electric revenue due to an electricity price increase on January 1, 2009, partially offset by decreased industrial sales in the year | 77.0 | |||||||
Increased fuel for generation and purchased power | (29.3 | ) | ||||||
Fuel adjustment related to implementation of the FAM | (8.5 | ) | ||||||
Increased OM&G expenses primarily due to increased storm and reliability costs as well as customer service initiatives, partially offset by decreased pension expense | (11.4 | ) | ||||||
Increased depreciation and amortization primarily due to increased depreciation rates in 2009 as part of the phase-in of year-three rates as approved by the UARB | (10.3 | ) | ||||||
Increased financing charges | (7.9 | ) | ||||||
Increased regulatory amortization due to additional amortization of pre-2003 income tax regulatory asset | (9.5 | ) | ||||||
Decreased income taxes due to decreased taxable income and lower statutory rate, partially offset by recovery of income taxes in 2008 relating to a prior year | 4.4 | |||||||
Other | (0.8 | ) | ||||||
Contribution to consolidated net earnings applicable to common shares – 2009 | $ | 17.4 | $ | 109.3 | ||||
Decreased electric margin (see Electric Margin for explanation) | (2.0 | ) | (11.6 | ) | ||||
Increased OM&G expenses primarily due to increased pension and storm costs. Year-to-date also reflects increased spending on customer service initiatives | (6.6 | ) | (22.4 | ) | ||||
Increased depreciation and amortization primarily due to increased property, plant and equipment | (3.1 | ) | (6.9 | ) | ||||
Increased regulatory amortization due to a deferral of certain tax benefits arising in 2010, partially offset by decreased amortization of the pre-2003 income tax regulatory asset | (9.0 | ) | (9.7 | ) | ||||
Decreased income taxes due to decreased earnings before income taxes, deductions related to renewable investments and a change in the expected benefit from other accelerated tax deductions | 21.7 | 59.6 | ||||||
Other | 2.3 | 3.0 | ||||||
Contribution to consolidated net earnings applicable to common shares – 2010 | $ | 20.7 | $ | 121.3 | ||||
Financing charges decreased $0.5 million in the quarter and increased $11.1 million for the year ended December 31, 2010. Foreign exchange gain and losses recovered through the FAM as fuel costs are included in the change in electric margin in the table above. See Electric Margin section for additional explanation.
17
Table of Contents
Electric Revenue
NSPI’s electricity rates are set based on a forecast of fuel and non-fuel costs plus a reasonable return to investors. Consequently, the company’s electric revenue is comprised of revenue related to the recovery of fuel costs (“fuel electric revenue”) and revenue related to the recovery of non-fuel costs (“non-fuel electric revenue”).
With the introduction of the FAM, on January 1, 2009, NSPI is able to seek full recovery of fuel costs through regularly scheduled rate adjustments, thus reducing the impact of volatile fuel markets on NSPI’s earnings. As a result, fuel electric revenue does not have a material impact on net earnings.
NSPI’s customer classes contribute differently to the NSPI’s non-fuel electric revenue. Changes in volume of residential and commercial customers, largely due to weather, have the largest impact on non-fuel electric revenue. Changes in industrial load, which are generally due to economic conditions, do not have a significant impact on non-fuel electric revenue.
The fuel electric revenue is comprised of the recovery of fuel costs incurred in the current year and the over- or under-recovery of fuel costs from the prior year. Since fuel costs are recovered through the FAM, the electric margin is solely influenced by revenues relating to non-fuel costs and the FAM incentive expense or recovery.
Electric revenue is summarized in the following table:
Three Months Ended December 31 | Year Ended December 31 | |||||||||||||||||||
MILLIONS OF DOLLARS
| 2010
| 2009
| 2010
| 2009
| 2008
| |||||||||||||||
Fuel electric revenue current year | $ | 129.0 | $ | 131.4 | $ | 515.7 | $ | 511.2 | * | |||||||||||
Fuel electric revenue prior year rebate | (5.7 | ) | – | (22.4 | ) | – | * | |||||||||||||
Non-fuel electric revenue | 173.1 | 171.5 | 674.0 | 676.9 | * | |||||||||||||||
Total electric revenue | $ | 296.4 | $ | 302.9 | $ | 1,167.3 | $ | 1,188.1 | $ | 1,111.1 | ||||||||||
* Prior to the introduction of the FAM on January 1, 2009, electric revenue was not broken into the components above.
Electric revenue decreased $6.5 million to $296.4 million in Q4 2010 compared to $302.9 million in Q4 2009. For the year ended December 31, 2010, NSPI’s electric revenue decreased $20.8 million to $1,167.3 million compared to $1,188.1 million in 2009 and $1,111.1 million in 2008.
Highlights of the changes are summarized in the following table:
MILLIONS OF DOLLARS
| Three Months Ended
| Year Ended
| ||||||
Electric revenue – 2008 | $ | 1,111.1 | ||||||
Increased electricity pricing effective January 1, 2009 | 102.1 | |||||||
Net change in residential and commercial sales volumes | 4.2 | |||||||
Decreased industrial sales to several large industrial customers | (28.3 | ) | ||||||
Decreased export sales | (1.0 | ) | ||||||
Electric revenue – 2009 | $ | 302.9 | $ | 1,188.1 | ||||
Decreased electricity pricing effective January 1, 2010 related to the FAM rebate (fuel-electric revenue) to customers of over-recovered fuel costs in 2009 | (5.7 | ) | (22.4 | ) | ||||
Change in residential and commercial sales volumes due primarily to warmer weather | (1.7 | ) | (10.7 | ) | ||||
Increased industrial sales volume from several large industrial customers | 0.6 | 13.2 | ||||||
Other | 0.3 | (0.9 | ) | |||||
Electric revenue – 2010 | $ | 296.4 | $ | 1,167.3 | ||||
18 EMERA INC. 2010 ANNUAL FINANCIAL REPORT
Table of Contents
MANAGEMENT’S DISCUSSION AND ANALYSIS
Electric Sales Volumes
Q4 Electric Sales Volumes
Gigawatt hours (“GWh”)

Year-to-Date (“YTD”) Electric Sales Volumes
Gigawatt hours (“GWh”)
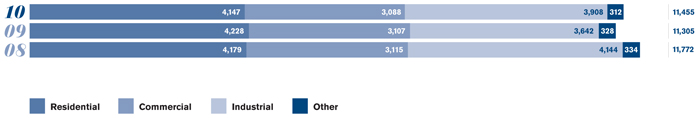
Electric sales volume is primarily driven by general economic conditions, population and weather. Residential and commercial electricity sales are seasonal, with Q1 and Q4 the strongest periods, reflecting colder weather, and fewer daylight hours in the winter season.
NSPI’s residential load generally comprises individual homes, apartments and condominiums. Commercial customers include small retail operations, large office and commercial complexes, and the province’s universities and hospitals. Industrial customers include manufacturing facilities and other large-volume operations. Other electric consists of export sales, sales to municipal electric utilities and revenues from street lighting.
Electric Margin
As noted above, all fuel costs are recoverable from customers through the FAM. Differences between actual fuel costs and amounts recovered from customers through electricity rates in a period are deferred to a FAM regulatory asset or liability and recovered from or returned to customers in a subsequent period. The only effect on net earnings in relation to the recovery of fuel costs is the incentive component of the FAM, with NSPI retaining or absorbing 10 per cent of the over- or under-recovered amount less the difference between the incentive threshold and the base amount, to a maximum of $5 million.
NSPI’s electric margin is influenced by non-fuel revenues and the FAM incentive. NSPI’s electric margin is summarized in the following table:
| Three Months Ended December 31 | Year Ended December 31 | |||||||||||||||||||
MILLIONS OF DOLLARS
| 2010
| 2009
| 2010
| 2009
| 2008
| |||||||||||||||
Electric revenue | $ | 296.4 | $ | 302.9 | $ | 1,167.3 | $ | 1,188.1 | * | |||||||||||
Fuel for generation and purchased power | 146.2 | 138.5 | 586.7 | 500.7 | * | |||||||||||||||
Fuel adjustment | (24.0 | ) | (10.6 | ) | (99.0 | ) | 8.5 | * | ||||||||||||
Fuel related foreign exchange (losses) gains | (3.4 | ) | (2.2 | ) | (9.3 | ) | 3.0 | * | ||||||||||||
Electric margin | $ | 170.8 | $ | 172.8 | $ | 670.3 | $ | 681.9 | * | |||||||||||
* Prior to the introduction of the FAM on January 1, 2009, electric margin was not broken into the components above.
NSPI’s electric margin decreased $2.0 million to $170.8 million in Q4 2010 compared to $172.8 million in Q4 2009 primarily due to the recognition of a FAM incentive expense compared to a recovery in 2009. For the year ended December 31, 2010, NSPI’s electric margin decreased $11.6 million to $670.3 million in 2010 compared to $681.9 million in 2009 due to lower residential load related to warmer weather and the recognition of a FAM incentive expense compared to a recovery in 2009.
19
Table of Contents
Q4 Electric Margin | YTD Electric Margin | |||||||||||||||||||||||
MWh
| 2010
| 2009
| 2008
| 2010
| 2009
| 2008
| ||||||||||||||||||
Dollars per MWh | $ | 59 | $ | 59 | * | $ | 59 | $ | 60 | * | ||||||||||||||
* Prior to the introduction of the FAM on January 1, 2009, electric margin was not broken into the components above.
The change in average electric margin per MWh in 2010 compared to 2009 reflects a change in sales volume mix and recognition of a FAM incentive expense compared to a recovery in 2009.
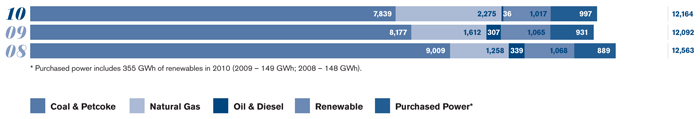
Fuel for Generation and Purchased Power
CAPACITY
To ensure reliability of service, NSPI maintains a generating capacity greater than firm peak demand. The total NSPI-owned generation capacity is 2,368 MW, which is supplemented by 186 MW contracted with IPPs. NSPI meets the planning criteria for reserve capacity established by the Maritime Control Area and the Northeast Power Coordinating Council.
NSPI facilities continue to rank among the best in Canada on capacity-related performance indicators. The high availability and capability of low cost thermal generating stations provide lower cost energy to customers. In 2010, thermal plant availability was 87 per cent compared to 82 per cent in 2009. The increase in availability from 2009 reflects decreased maintenance outages. Sustained high availability and low forced outage rates on low-cost facilities are good indicators of sound maintenance and investment practices.
FUEL EXPENSE
Q4 Production Volumes
Gigawatt hours (“GWh”)
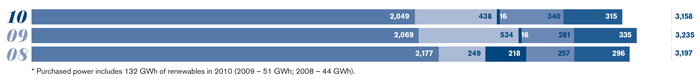
Year-to-Date (“YTD”) Production Volumes
Gigawatt hours (“GWh”)
Q4 Average Unit Fuel Costs | YTD Average Unit Fuel Costs | |||||||||||||||||||||||
MWh
| 2010
| 2009
| 2008
| 2010
| 2009
| 2008
| ||||||||||||||||||
Dollars per MWh | $ | 46 | $ | 43 | $ | 44 | $ | 48 | $ | 41 | $ | 38 | ||||||||||||
20 EMERA INC. 2010 ANNUAL FINANCIAL REPORT
Table of Contents
MANAGEMENT’S DISCUSSION AND ANALYSIS
Solid fuel is NSPI’s dominant fuel source, supplying approximately 64 per cent (2009 – 68 per cent) of NSPI’s annual energy. Historically, solid fuels have had the lowest per unit fuel cost, after hydro and NSPI-owned wind production, which have no fuel cost component. Natural gas, oil and purchased power are next, depending on the relative pricing of each. Economic dispatch of the generating fleet brings the lowest cost options on stream first, with the result that the incremental cost of production increases as sales volume increases.
The average unit fuel costs increased in 2010 compared to 2009 mainly as a result of higher priced import coal and solid fuel commodity mix related to emission compliance.
The average unit fuel costs increased in 2009 compared to 2008 mainly as a result of higher priced commodity contracts for coal and natural gas.
A substantial amount of NSPI’s fuel supply comes from international suppliers, and is subject to commodity price and foreign exchange risk. NSPI manages exposure to commodity price risk utilizing a portfolio strategy, combining physical fixed-price fuel contracts and financial instruments providing fixed or maximum prices. Foreign exchange risk is managed through forward and option contracts. Further details on NSPI’s fuel cost risk management strategies are included in the Business Risks section. Fuel contracts may be exposed to broader global conditions, which may include impacts on delivery reliability and price, despite contracted terms.
For the three months ended December 31, 2010, fuel for generation and purchased power increased $7.7 million to $146.2 million compared to $138.5 million in Q4 2009. For the year ended December 31, 2010, fuel for generation and purchased power increased $86.0 million to $586.7 million compared to $500.7 million in 2009 and $471.4 million in 2008.
Highlights of the changes are summarized in the following table:
MILLIONS OF DOLLARS
| Three Months Ended
| Year Ended
| ||||||
Fuel for generation and purchased power – 2008 | $ | 471.4 | ||||||
Commodity price increases | 36.2 | |||||||
Decreased proceeds from the resale of natural gas | 10.3 | |||||||
Valuation of contract receivable (see discussion below) | 4.5 | |||||||
Decreased sales volume | (22.2 | ) | ||||||
Mark-to-market on natural gas hedges not required in 2009 primarily due to decreased production volumes | (0.7 | ) | ||||||
Changes in generation mix and plant performance | (10.2 | ) | ||||||
Decreased hydro production | 1.8 | |||||||
Primarily solid fuel handling costs previously included in OM&G expenses | 10.7 | |||||||
Other | (1.1 | ) | ||||||
Fuel for generation and purchased power – 2009 | $ | 138.5 | $ | 500.7 | ||||
Commodity price and volume increases | 0.4 | 34.5 | ||||||
Changes in generation mix and plant performance | 12.6 | 24.3 | ||||||
Solid fuel commodity mix and additives related to emission compliance | 0.8 | 25.3 | ||||||
Increased proceeds from the resale of natural gas | (0.8 | ) | (9.8 | ) | ||||
Valuation of contract receivable (see discussion below) | 6.6 | 8.7 | ||||||
(Decreased) increased sales volume | (5.1 | ) | 2.7 | |||||
Increased hydro production | (6.2 | ) | (1.1 | ) | ||||
Mark-to-market on natural gas hedges recognized in 2009 as they were no longer required due to decreased 2009 production volumes | 1.5 | 2.2 | ||||||
Other | (2.1 | ) | (0.8 | ) | ||||
Fuel for generation and purchased power – 2010 | $ | 146.2 | $ | 586.7 | ||||
The valuation of the contract receivable from a natural gas supplier required NSPI to utilize a combination of historical and future natural gas prices. NSPI uses market-based forward indices when determining future prices. Future prices can change from period to period, which will cause a corresponding change in the value of the contract receivable. The natural gas supply contract settled in November 2010.
21
Table of Contents
Fuel Adjustment
The fuel adjustment related to the FAM includes the effect of fuel costs in both the current period and the preceding year. The difference between actual fuel costs and amounts recovered from customers in the current period is included in the fuel adjustment. This amount, less the incentive component, is deferred to a FAM regulatory asset in “Other assets” or a FAM regulatory liability in “Other liabilities”. The FAM regulatory asset or liability includes amounts recognized as a fuel adjustment and associated interest included in “Financing charges”. Also included in the 2010 fuel adjustment is the rebate to customers of over-recovered fuel costs from 2009.
Details of the fuel adjustment deferral related to the FAM are summarized in the following table:
| Year Ended December 31 | ||||||||||||
MILLIONS OF DOLLARS
| 2010
| 2009
| 2008
| |||||||||
FAM payable – Balance at January 1 | $ | (9.9 | ) | * | * | |||||||
Under (over) recovery of current period fuel costs | 80.3 | $ | (9.9 | ) | * | |||||||
Rebate to customers from prior year | 22.5 | – | * | |||||||||
FAM receivable (payable) – Balance at December 31 | $ | 92.9 | $ | (9.9 | ) | * | ||||||
*The fuel adjustment mechanism came into effect on January 1, 2009.
In December 2010, as part of the FAM regulatory process, the UARB directed NSPI to recover the rate increase approved by the UARB for the reset of 2011 fuel costs and the projected under-recovery from prior years from customers over three years, with 50 per cent of the rate increase to be recovered in 2011, 30 per cent in 2012 and 20 per cent in 2013.
NSPI has recognized a future income tax expense related to the fuel adjustment based on its applicable statutory income tax rate. The FAM regulatory asset or liability includes amounts recognized as a fuel adjustment and associated interest included in “Financing charges”. As at December 31, 2010, NSPI’s future income tax liability related to the FAM was $29.2 million (2009 – asset of $3.4 million).
Operating, Maintenance and General
OM&G expenses increased $6.6 million to $65.0 million in Q4 2010 compared to $58.4 million in Q4 2009 and increased $22.4 million to $237.5 million for the year ended December 31, 2010 compared to $215.1 million in 2009 primarily due to increased pension and storm costs as well as customer service initiatives.
OM&G expenses increased $11.4 million to $215.1 million for the year ended December 31, 2009 compared to $203.7 million in 2008 primarily due to increased storm costs, system reliability spending and program costs associated with customer and new business initiatives, partially offset by lower pension expense.
Provincial Grants and Taxes
NSPI pays annual grants to the Province of Nova Scotia in lieu of municipal taxation other than deed transfer tax.
Depreciation and Amortization
Depreciation and amortization expense increased $3.1 million to $39.9 in Q4 2010 compared to $36.8 million in Q4 2009 and increased $6.9 million to $150.8 for the year ended December 31, 2010 compared to $143.9 million in 2009 primarily due to increased property, plant and equipment.
Depreciation and amortization expense increased $10.3 million to $143.9 for the year ended December 31, 2009 compared to $133.6 million in 2008 primarily due to the inclusion of year-three depreciation rates commencing on January 1, 2009 as approved by the UARB in its November 5, 2008 decision.
22 EMERA INC. 2010 ANNUAL FINANCIAL REPORT
Table of Contents
MANAGEMENT’S DISCUSSION AND ANALYSIS
Regulatory Amortization
Regulatory amortization increased $9.0 million to $23.7 million in Q4 2010 compared to $14.7 million in Q4 2009 and increased $9.7 million to $36.9 million for the year ended December 31, 2010 compared to $27.2 million in 2009. This increase is due primarily to a $14.5 million deferral of certain tax benefits arising in 2010 related to renewable energy projects, as approved by the UARB, partially offset by a reduction in amortization of the pre-2003 income tax regulatory asset resulting from the UARB’s 2009 ROE decision of $4.8 million in 2010 (2009 – $10.0 million). The 2009 ROE decision allows NSPI to recognize additional amortization amounts in current periods and to reduce amortization in future periods to provide flexibility relating to customer rate requirements.
Regulatory amortization increased $9.5 million to $27.2 million for the year ended December 31, 2009 compared to $17.7 million in 2008 due primarily to additional amortization of the pre-2003 income tax regulatory asset resulting from the UARB’s ROE decision noted above.
Other Revenue
Other revenue, which consists of miscellaneous revenues and commercial settlements, has remained relatively unchanged for the quarter and year ended December 31, 2010 compared to 2009 and 2008.
Financing Charges
Financing charges decreased $0.5 million to $32.8 million in Q4 2010 compared to $33.3 million in Q4 2009 and increased $11.1 million to $125.8 million for the year ended December 31, 2010 compared to $114.7 million in 2009 primarily due to higher foreign exchange costs, recovered through the FAM, and increased borrowing costs, partially offset by increased AFUDC related to increased capital spending.
Financing charges increased $7.9 million to $114.7 million for the year ended December 31, 2009 compared to $106.8 million in 2008 primarily due to lower foreign exchange gains in 2009 compared to 2008. In 2009, NSPI recorded income tax refund interest of $3.0 million, which was received as a result of NSPI amending its 1999 to 2003 corporate income tax returns. This refund interest was recorded as a reduction of “Financing charges”.
Income Taxes
NSPI uses the future income tax method of accounting for income taxes. In accordance with NSPI’s rate-regulated accounting policy as approved by the UARB, NSPI defers any future income taxes to a regulatory asset or liability where the future income taxes are expected to be included in future rates.
In 2010, NSPI was subject to provincial capital tax (0.125 per cent), corporate income tax (34 per cent) and Part VI.1 tax relating to preferred dividends (40 per cent). NSPI also receives a reduction in its corporate income tax otherwise payable related to the Part VI.1 tax deduction (41 per cent of preferred dividends).
Income taxes decreased $21.7 million to a $13.3 million income tax recovery in Q4 2010 compared to $8.4 million income tax expense in Q4 2009 and decreased $59.6 million to a $17.4 million recovery for the year ended December 31, 2010 compared to $42.2 million income tax expense in 2009 primarily due to decreased earnings before income taxes, deductions related to renewable investments and a change in the expected benefit from other accelerated tax deductions.
Income taxes decreased $4.4 million to $42.2 million for the year ended December 31, 2009 compared to $46.6 million in 2008 primarily due to decreased taxable income and a lower statutory rate in 2009 compared to 2008, partially offset by a recovery of income taxes in 2008 relating to a prior year.
In 2010, NSPI revised its estimate of the expected benefit from accelerated tax deductions. The impact for the three months and twelve months ended December 31, 2010 was to reduce income tax expense by approximately $8.0 million and $14.0 million respectively. In accordance with rate-regulated accounting, the future income tax implications of this change in estimate have been deferred to a regulatory asset in “Other assets”. This change in accounting estimate has been accounted for on a prospective basis.
23
Table of Contents
ALL AMOUNTS IN THE BANGOR HYDRO SECTION
ARE REPORTED IN USD UNLESS OTHERWISE STATED.
Overview
Bangor Hydro’s core business is the transmission and distribution of electricity. Bangor Hydro is the second largest electric utility in Maine. Electricity generation is deregulated in Maine, and several suppliers compete to provide customers with the commodity that is delivered through the Bangor Hydro T&D network. Bangor Hydro owns and operates approximately 1,000 kilometres of transmission facilities, and 7,200 kilometres of distribution facilities. Bangor Hydro currently has approximately $150 million of additional transmission development in progress. Bangor Hydro’s workforce is approximately 290 people.
In addition to T&D assets, Bangor Hydro has net regulatory assets (stranded costs), which arose through the restructuring of the electricity industry in the state in the late 1990s, and as a result of rate and accounting orders issued by its regulator. Bangor Hydro’s net regulatory assets primarily include the costs associated with the restructuring of an above-market power purchase contract, and the unamortized portion on its loss on the sale of its investment in the Seabrook nuclear facility. Unlike T&D operational assets, which are generally sustained with new investment, the net stranded cost regulatory asset pool diminishes over time as elements are amortized through charges to earnings and recovered through rates. These net regulatory assets total approximately $77.5 million at December 31, 2010 (2009 – $76.6 million) or ten per cent of Bangor Hydro’s net asset base (2009 – 11 per cent).
Approximately 44 per cent of Bangor Hydro’s electric revenue represents distribution service, 45 per cent is associated with transmission service and 11 per cent relates to stranded cost recoveries. The rates for each element are established in distinct regulatory proceedings. Bangor Hydro’s distribution operations and stranded costs are regulated by the MPUC. The transmission operations are regulated by the FERC.
Bangor Hydro operates under a traditional cost-of-service regulatory structure. In December 2007, the MPUC approved an increase of approximately two per cent in distribution rates effective January 1, 2008. The allowed ROE used in setting these distribution rates was 10.2 per cent, with a common equity component of 50 per cent.
Transmission rates are set by the FERC annually on June 1, based upon a formula that utilizes prior year actual transmission investments and expenses, adjusted for current year forecasted transmission investments and expenses. In 2009, Bangor Hydro implemented this forward-looking rate formula for its local transmission investments, replacing an approach which had resulted in a lag in the recovery of transmission investments and costs. The allowed ROE for transmission operations ranges from 11.14 per cent for low voltage local transmission up to 12.64 per cent for high voltage regionally funded transmission developed as a result of the regional system plan.
In December 2007, the MPUC issued an order approving an approximate 39 per cent reduction in stranded cost rates for the three-year period beginning March 1, 2008. The reduced stranded cost revenues are offset for the most part by decreased regulatory amortizations, decreased purchased power costs, and increased resale of purchased power. The allowed ROE used in setting the new stranded cost rates was 8.5 per cent. Prior to that, stranded cost rates provided for an allowed ROE of ten per cent. On June 1, 2009, Bangor Hydro further reduced its stranded cost rates for a one year period by approximately 15 per cent to reflect an over-collection of certain stranded cost revenues and expenses under a full reconciliation rate mechanism.
24 EMERA INC. 2010 ANNUAL FINANCIAL REPORT
Table of Contents
MANAGEMENT’S DISCUSSION AND ANALYSIS
Review of 2010
| BANGOR HYDRO | Three Months Ended December 31 | Year Ended December 31 | ||||||||||||||||||
MILLIONS OF USD (EXCEPT EARNINGS PER COMMON SHARE)
| 2010 | 2009 | 2010 | 2009 | 2008 | |||||||||||||||
T&D electric revenues | $ | 28.7 | $ | 25.9 | $ | 109.0 | $ | 102.8 | $ | 97.6 | ||||||||||
Resale of purchased power | 4.6 | 4.9 | 18.3 | 18.9 | 20.4 | |||||||||||||||
Transmission pool revenue | 4.6 | 3.0 | 21.5 | 14.0 | 16.5 | |||||||||||||||
Total revenue | 37.9 | 33.8 | 148.8 | 135.7 | 134.5 | |||||||||||||||
Fuel for generation and purchased power | 7.9 | 7.6 | 31.0 | 29.4 | 32.2 | |||||||||||||||
Operating, maintenance and general | 10.2 | 7.4 | 36.3 | 30.9 | 28.8 | |||||||||||||||
Property taxes | 1.6 | 1.7 | 6.8 | 6.3 | 5.4 | |||||||||||||||
Depreciation | 4.3 | 4.0 | 16.7 | 16.0 | 15.3 | |||||||||||||||
Regulatory amortization | 0.9 | 1.6 | 4.2 | 7.4 | 10.1 | |||||||||||||||
Other | (0.5 | ) | (0.5 | ) | (2.3 | ) | (2.6 | ) | (3.8 | ) | ||||||||||
Earnings before financing charges and income taxes | 13.5 | 12.0 | 56.1 | 48.3 | 46.5 | |||||||||||||||
Financing charges | 1.6 | 2.2 | 7.0 | 10.4 | 11.1 | |||||||||||||||
Earnings before income taxes | 11.9 | 9.8 | 49.1 | 37.9 | 35.4 | |||||||||||||||
Income taxes | 4.3 | 3.3 | 18.2 | 13.5 | 13.9 | |||||||||||||||
Contribution to consolidated net earnings applicable to common shares – USD | $ | 7.6 | $ | 6.5 | $ | 30.9 | $ | 24.4 | $ | 21.5 | ||||||||||
Contribution to consolidated net earnings applicable to common shares – CAD |
$ |
7.8 |
|
$ |
7.0 |
|
$ |
31.9 |
|
$ |
27.5 |
|
$ |
23.1 |
| |||||
Contribution to consolidated earnings per common share – CAD |
$ |
0.07 |
|
$ |
0.06 |
|
$ |
0.28 |
|
$ |
0.24 |
|
$ |
0.21 |
| |||||
Net earnings weighted average foreign exchange rate – CAD/USD |
$ |
1.03 |
|
$ |
1.08 |
|
$ |
1.03 |
|
$ |
1.13 |
|
$ |
1.07 |
| |||||
Bangor Hydro’s contribution to consolidated net earnings applicable to common shares increased by $1.1 million to $7.6 million in Q4 2010 compared to $6.5 million in Q4 2009. Annual contribution to consolidated net earnings applicable to common shares increased by $6.5 million to $30.9 million compared to $24.4 million in 2009 and $21.5 million in 2008.
Highlights of the earnings changes are summarized in the following table:
MILLIONS OF DOLLARS
| Three Months Ended December 31
| Year Ended December 31
| ||||||
Contribution to consolidated net earnings applicable to common shares – 2008 | $ | 21.5 | ||||||
Increased T&D electric revenues due to transmission rate increases and additional transmission revenues from wind generation | 5.2 | |||||||
Lower net transmission pool revenue due to increased regional charges | (2.5 | ) | ||||||
Increased OM&G expenses due to increased storm, regulatory and labour costs | (2.1 | ) | ||||||
Decreased financing charges primarily due to lower short-term interest rates | 0.7 | |||||||
Other | 1.6 | |||||||
Contribution to consolidated net earnings applicable to common shares – 2009 | $ | 6.5 | $ | 24.4 | ||||
Increased electric operating revenues due primarily to transmission rate increases in 2009 and 2010 | 2.8 | 6.2 | ||||||
Higher transmission pool revenue due to the recovery of the increase in regionally funded transmission investments | 1.6 | 7.5 | ||||||
Increased OM&G expenses due to higher pension, post-retirement benefits and payroll costs as well as lower capitalized overheads | (2.8 | ) | (5.4 | ) | ||||
Decreased financing charges due to higher AFUDC related to capital investment | 0.6 | 3.4 | ||||||
Increased income taxes due to higher earnings in 2010 | (1.0 | ) | (4.7 | ) | ||||
Other | (0.1 | ) | (0.5 | ) | ||||
Contribution to consolidated net earnings applicable to common shares – 2010 | $ | 7.6 | $ | 30.9 | ||||
Bangor Hydro’s contribution to consolidated net earnings applicable to common shares – CAD decreased $0.4 million in Q4 2010 compared to Q4 2009 and $3.1 million in 2010 compared to 2009 due to the impact of the stronger CAD.
25
Table of Contents
Electric Revenue
Q4 Electric Sales Volumes
Gigawatt hours (“GWh”)
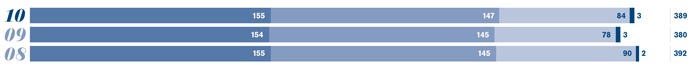
Year-to-Date (“YTD”) Electric Sales Volumes
Gigawatt hours (“GWh”)
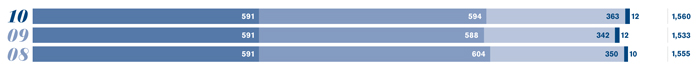
Q4 Electric Revenues
Millions of dollars

Year-to-Date (“YTD”) Electric Revenues
Millions of dollars
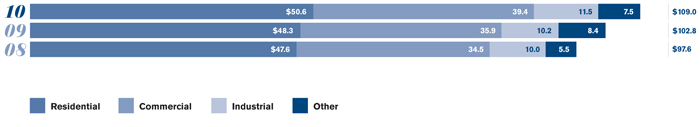
Q4 Electric Average Revenue | YTD Electric Average Revenue | |||||||||||||||||||||||
MWh
| 2010
| 2009
| 2008
| 2010
| 2009
| 2008
| ||||||||||||||||||
Dollars per MWh | $ | 74 | $ | 68 | $ | 66 | $ | 70 | $ | 67 | $ | 63 | ||||||||||||
26 EMERA INC. 2010 ANNUAL FINANCIAL REPORT
Table of Contents
MANAGEMENT’S DISCUSSION AND ANALYSIS
The changes in average revenue per MWh in 2010 compared to 2009 reflect increases in transmission rates on June 1, 2010, November 1, 2009 and June 1, 2009, partially offset by the impact of a stranded cost rate decrease on June 1, 2009.
Electric sales volume is primarily driven by general economic conditions, population and weather. Electric sales pricing in Maine is regulated, and therefore changes in accordance with regulatory decisions.
Electric revenues increased by $2.8 million to $28.7 million in Q4 2010 compared to $25.9 million in Q4 2009 and increased $6.2 million to $109.0 million for the year ended December 31, 2010 compared to $102.8 million for 2009 due to increased transmission rates, including the impact of moving to a forward-looking rate formula, and increased commercial and industrial load, partially offset by a reduction in stranded cost rates.
Electric revenues increased $5.2 million to $102.8 million for the year ended December 31, 2009 compared to $97.6 million for 2008 due to increased transmission rates, including the impact of moving to a forward-looking rate formula in 2009, partially offset by a reduction in stranded cost rates.
Resale of Purchased Power, and Fuel for Generation and Purchased Power
Bangor Hydro has several above-market purchase power contracts pre-dating the Maine market restructuring. Power purchased under these arrangements is resold to a third party at market rates as determined through a bid process administered and approved by the MPUC. The difference between the cost of the power purchased under these arrangements and the revenue collected from the third party is recovered through stranded cost rates under a full reconciliation rate mechanism.
Transmission Pool Revenue
Bangor Hydro recovers the cost of its regionally funded transmission infrastructure investment through transmission pool revenue based on a regional formula that is updated on June 1 of each year. Transmission pool revenue, less transmission infrastructure investment charges, is recovered from the customers of member utilities of the New England Power Pool (“NEPOOL“).
Transmission pool revenue increased by $1.6 million to $4.6 million in Q4 2010 compared to $3.0 million in Q4 2009 and increased $7.5 million to $21.5 million for the year ended December 31, 2010 compared to $14.0 million for 2009 due primarily to increased revenue received associated with an increase in Bangor Hydro’s regionally funded transmission investments in 2010.
Transmission pool revenue decreased $2.5 million to $14.0 million for the year ended December 31, 2009 compared to $16.5 million for 2008 due to greater regional charges related to increased regional transmission investments.
Regulatory Amortization
Regulatory amortization has a minimal impact on earnings as a result of the stranded cost regulatory reconciliation mechanism as provided for by a MPUC ruling as noted previously.
Financing Charges
Financing charges decreased $0.6 million to $1.6 million in Q4 2010 compared to $2.2 million in Q4 2009 and decreased $3.4 million to $7.0 million for the year ended December 31, 2010, compared to $10.4 million in 2009 primarily due to lower short-term interest rates in 2010 and increased AFUDC.
Financing charges decreased $0.7 million to $10.4 million for the year ended December 31, 2009 compared to $11.1 million in 2008 primarily due to lower short-term interest rates in 2009.
Income Taxes
Bangor Hydro uses the future income tax method of accounting for income taxes.
Bangor Hydro is subject to corporate income tax at the statutory rate of 40.8 per cent (combined federal and state income tax rate).
27
Table of Contents
Overview
Pipelines is composed of the company’s investments in Brunswick Pipeline, a wholly owned subsidiary, along with its 12.9 per cent interest in M&NP.
Brunswick Pipeline is a 145-kilometre pipeline delivering natural gas from the Canaport™ LNG import terminal near Saint John, New Brunswick to markets in the northeastern United States. The pipeline, which received National Energy Board (“NEB”) approval for shipping gas in January 2009 and went into service on July 16, 2009, transports re-gasified LNG for Repsol Energy Canada under a 25-year firm service agreement. The NEB, which regulates Brunswick Pipeline, has classified it as a Group 2 pipeline.
The company acquired a 12.9 per cent interest in M&NP in 1999. M&NP is a $2 billion, 1,400-kilometre pipeline which transports natural gas from offshore Nova Scotia to markets in Maritime Canada and the northeastern United States.
Review of 2010
| PIPELINES | Three Months Ended December 31 | Year Ended December 31 | ||||||||||||||||||
MILLIONS OF DOLLARS
| 2010
| 2009
| 2010
| 2009
| 2008
| |||||||||||||||
Brunswick Pipeline | ||||||||||||||||||||
Finance income from direct financing lease | $ | 13.7 | $ | 15.2 | $ | 56.5 | $ | 25.3 | – | |||||||||||
AFUDC | – | – | – | 18.8 | $ | 15.6 | ||||||||||||||
Financing charges | 7.8 | 8.8 | 30.7 | 30.1 | 12.4 | |||||||||||||||
Brunswick Pipeline net earnings | 5.9 | 6.4 | 25.8 | 14.0 | 3.2 | |||||||||||||||
M&NP net earnings | 2.9 | 2.0 | 9.2 | 10.2 | 12.2 | |||||||||||||||
Contribution to consolidated net earnings applicable to common shares | $ | 8.8 | $ | 8.4 | $ | 35.0 | $ | 24.2 | $ | 15.4 | ||||||||||
Contribution to consolidated earnings per common share | $ | 0.08 | $ | 0.07 | $ | 0.31 | $ | 0.22 | $ | 0.14 | ||||||||||
Pipelines’ contribution to consolidated net earnings applicable to common shares increased $0.4 million to $8.8 million in Q4 2010 compared to $8.4 million in Q4 2009. Annual contribution to consolidated net earnings applicable to common shares increased $10.8 million to $35.0 million in 2010 compared to $24.2 million in 2009 and $15.4 million in 2008.
Highlights of the earnings changes are summarized in the following table:
MILLIONS OF DOLLARS
| Three Months Ended December 31
| Year Ended December 31
| ||||||
Contribution to consolidated net earnings applicable to common shares – 2008 | $ | 15.4 | ||||||
Brunswick Pipeline – Financing income from the pipeline as it became operational in July 2009 | 25.3 | |||||||
Brunswick Pipeline – Increased AFUDC on construction of the pipeline prior to the pipeline commencing service | 3.2 | |||||||
Brunswick Pipeline – Increased intercompany financing charges related to capital spending | (17.7 | ) | ||||||
M&NP – Net earnings decrease | (2.0 | ) | ||||||
Contribution to consolidated net earnings applicable to common shares – 2009 | $ | 8.4 | $ | 24.2 | ||||
Brunswick Pipeline – Financing income from the pipeline as it became operational in July 2009 | (1.5 | ) | 31.2 | |||||
Brunswick Pipeline – Cessation of AFUDC as the pipeline became operational | – | (18.8 | ) | |||||
M&NP – Net earnings increase (decrease) | 0.9 | (1.0 | ) | |||||
Other | 1.0 | (0.6 | ) | |||||
Contribution to consolidated net earnings applicable to common shares – 2010 | $ | 8.8 | $ | 35.0 | ||||
Maritimes & Northeast Pipeline
Equity earnings for M&NP increased by $0.9 million to $2.9 million in Q4 2010 compared to $2.0 million in Q4 2009. For the year ended December 31, 2010, equity earnings decreased $1.0 million to $9.2 million compared to $10.2 million in 2009 due to increased financing charges on the US portion of the pipeline as a result of debt recapitalization and the recognition of a portion of the EnCana Marketing (USA) Inc. (“Encana”) settlement in the first half of 2009, combined with a stronger Canadian dollar in 2010 compared to 2009.
In May 2009, M&NP recapitalized the US portion of the pipeline by issuing a $500 million USD long-term debt. The net proceeds of the debt issuance were distributed to the partners. Emera’s portion of the net proceeds was $64.2 million USD ($73.8 million CAD), and was recorded as a return of capital from M&NP.
Income Taxes
Brunswick Pipeline uses the future income tax method of accounting for income taxes. In accordance with rate-regulated accounting, Brunswick Pipeline defers any future income taxes to a regulatory asset or liability where the future income taxes are expected to be included in the future tolls. M&NP equity earnings are recorded net of tax.
28 EMERA INC. 2010 ANNUAL FINANCIAL REPORT
Table of Contents
MANAGEMENT’S DISCUSSION AND ANALYSIS
INCLUDING CORPORATE COSTS
Other, Including Corporate Costs, includes Emera Energy; Emera Utility Services; Caribbean investments; and corporate costs and other.
Emera Energy includes:
| • | Emera Energy Services Inc., a physical energy business which purchases and sells natural gas and electricity and provides related energy asset management services. |
| • | Bayside Power, a 260 MW gas-fired merchant electricity generating facility in Saint John, New Brunswick. |
| • | Emera’s 50 per cent joint venture ownership of Bear Swamp, a 600 MW pumped storage hydroelectric facility in northern Massachusetts. |
Emera Utility Services is a utility services contractor.
Caribbean Investments include:
| • | An effective direct interest of 50 per cent in GBPC, a vertically integrated electric utility on Grand Bahama Island and a 30.4 per cent indirect interest in GBPC through ICD Utilities Limited. |
| • | A 38 per cent interest in LPH, the parent company of BLPC, the electric utility on the island of Barbados. In January 2011, Emera’s interest in LPH increased to 79.9 per cent. |
| • | A 19 per cent interest in Lucelec, a vertically-integrated electric utility on the island of St. Lucia. |
Corporate and other costs pertain to certain Emera-wide functions such as executive management, strategic planning, treasury services, financial reporting, tax planning, business development, corporate governance. Corporate and other costs also include financing charges and income taxes associated with corporate activities.
Review of 2010
Emera Energy and Emera Utility Services’ operations are reported on earnings before financing charges and income taxes (“EBIT”). Caribbean operations, which include GBPC, LPH and Lucelec, are reported on an equity earnings basis.
| OTHER | Three Months Ended December 31 | Year Ended December 31 | ||||||||||||||||||
MILLIONS OF DOLLARS (EXCEPT EARNINGS PER COMMON SHARE)
| 2010
| 2009
| 2010
| 2009
| 2008
| |||||||||||||||
Emera Energy | $ | (1.0 | ) | $ | 14.8 | $ | 5.7 | $ | 20.7 | $ | 15.0 | |||||||||
Emera Utility Services | 2.9 | 0.3 | 7.0 | 1.8 | 3.1 | |||||||||||||||
Caribbean | 1.7 | 0.2 | 7.0 | 2.9 | 2.4 | |||||||||||||||
| 3.6 | 15.3 | 19.7 | 25.4 | 20.5 | ||||||||||||||||
Financing charges | 1.1 | 0.8 | 3.2 | 5.2 | 10.3 | |||||||||||||||
Income taxes | (0.8 | ) | 5.6 | 0.4 | 5.9 | 6.7 | ||||||||||||||
Contribution to consolidated net earnings applicable to common shares | $ | 3.3 | $ | 8.9 | $ | 16.1 | $ | 14.3 | $ | 3.5 | ||||||||||
Bear Swamp after-tax mark-to-market adjustment | (2.6 | ) | 3.2 | (8.6 | ) | 0.7 | (4.8 | ) | ||||||||||||
Contribution to consolidated net earnings, absent the Bear Swamp after-tax mark-to-market adjustment | $ | 5.9 | $ | 5.7 | $ | 24.7 | $ | 13.6 | $ | 8.3 | ||||||||||
Contribution to consolidated net earnings per common share | $ | 0.03 | $ | 0.07 | $ | 0.14 | $ | 0.11 | $ | 0.01 | ||||||||||
Contribution to consolidated net earnings per common share, absent the Bear Swamp after-tax mark-to-market adjustment | $ | 0.06 | $ | 0.04 | $ | 0.22 | $ | 0.10 | $ | 0.06 | ||||||||||
The total contribution of Other to consolidated net earnings applicable to common shares decreased $5.6 million to $3.3 million in Q4 2010 compared to $8.9 million in Q4 2009. Annual contribution to consolidated net earnings applicable to common shares increased $1.8 million to $16.1 million in 2010 compared to $14.3 million in 2009 and $3.5 million in 2008.
29
Table of Contents
Highlights of the earnings changes are summarized in the following table:
MILLIONS OF DOLLARS
| Three Months Ended December 31
| Year Ended December 31
| ||||||
Contribution to consolidated net earnings applicable to common shares – 2008 | $ | 3.5 | ||||||
Emera Energy – Increased earnings primarily due to favourable changes in Bear Swamp’s mark-to-market, and the acquisition of Bayside in September 2009, partially offset by higher power costs in Bear Swamp and reduced transportation mitigation opportunities in Energy Services | 5.7 | |||||||
Emera Utility Services – Decreased earnings reflecting project start dates being delayed into 2010 and unfavourable market conditions | (1.3 | ) | ||||||
Decreased financing charges primarily due to lower interest rates in Bear Swamp and decreased average external debt | 5.1 | |||||||
Other | 1.3 | |||||||
Contribution to consolidated net earnings applicable to common shares – 2009 | $ | 8.9 | $ | 14.3 | ||||
Emera Energy – Decreased earnings due primarily to Bear Swamp’s mark-to-market loss, its lower earnings and the stronger CAD, partially offset by improved Emera Energy Services Inc. results | (15.8 | ) | (15.0 | ) | ||||
Emera Utility Services – Increased earnings due primarily to the successful completion of large construction projects and the expansion of the communications business | 2.6 | 5.2 | ||||||
Caribbean – Increased equity earnings due primarily to LPH acquisition in May 2010 | 1.5 | 4.1 | ||||||
Decreased financing charges year-to-date due primarily to lower interest expense due to lower LIBOR rates in 2010 and higher foreign exchange losses in 2009 | (0.3 | ) | 2.0 | |||||
Decreased income taxes due primarily to decreased earnings in Emera Energy | 6.4 | 5.5 | ||||||
Contribution to consolidated net earnings applicable to common shares – 2010 | $ | 3.3 | $ | 16.1 | ||||
Bear Swamp Mark-to-Market Adjustment
Bear Swamp has an agreement to supply energy and capacity to the Long Island Power Authority (“LIPA”) through to 2021. Bear Swamp has contracted with its joint venture partner to provide the power necessary to produce the requirements of the LIPA contract. One of the contracts between Bear Swamp and Emera is marked-to-market through earnings, as it does not meet the stringent accounting requirements for hedge accounting.
As at December 31, 2010, the fair value of the contract was a net liability of $8.2 million (December 31, 2009 – $6.2 million net asset). The fair value of this derivative is subject to market volatility of power prices and will reverse over the life of the agreement.
Income Taxes
GBPC, LPH and Lucelec’s equity earnings are recorded net of tax. Variations in income tax expense are largely affected by earnings and foreign exchange fluctuations, along with changes in the statutory tax rate.
Income taxes decreased $6.4 million to a $0.8 million income tax recovery in Q4 2010 compared to $5.6 million income tax expense in Q4 2009 and decreased $5.5 million to $0.4 million income tax expense for the year ended December 31, 2010 compared to a $5.9 million income tax expense in 2009 primarily due to a decrease in earnings in Emera Energy.
Income taxes decreased $0.8 million to $5.9 million for the year ended December 31, 2009 compared to $6.7 million in 2008.
30 EMERA INC. 2010 ANNUAL FINANCIAL REPORT
Table of Contents
MANAGEMENT’S DISCUSSION AND ANALYSIS
| CORPORATE COSTS AND OTHER | Three Months Ended December 31 | Year Ended December 31 | ||||||||||||||||||
MILLIONS OF DOLLARS (EXCEPT EARNINGS PER COMMON SHARE)
| 2010
| 2009
| 2010
| 2009
| 2008
| |||||||||||||||
Revenue | $ | 7.7 | $ | 8.7 | $ | 30.6 | $ | 30.0 | $ | 12.4 | ||||||||||
Corporate costs | 3.8 | 9.2 | 22.9 | 21.8 | 15.4 | |||||||||||||||
Financing charges | 8.3 | 8.8 | 32.2 | 22.3 | 10.5 | |||||||||||||||
Income taxes | (3.4 | ) | (5.1 | ) | (14.4 | ) | (14.5 | ) | (10.0 | ) | ||||||||||
Preferred shares dividends | – | – | 3.1 | – | – | |||||||||||||||
Total corporate (costs) recovery and other | $ | (1.0 | ) | $ | (4.2 | ) | $ | (13.2 | ) | $ | 0.4 | $ | (3.5 | ) | ||||||
Revenue
Revenue, which consists of intercompany interest from Brunswick Pipeline, has remained relatively unchanged for Q4 2010 compared to Q4 2009 and for the year ended December 31, 2010 compared to 2009.
Revenue increased $17.6 million to $30.0 million for the year ended December 31, 2009 compared to $12.4 million in 2008 due to the financing of Brunswick Pipeline.
Corporate Costs
Corporate costs decreased by $5.4 million to $3.8 million in Q4 2010 compared to $9.2 million in Q4 2009 due primarily to deferral of business development costs, partially offset by an increase in deferred compensation costs. For the year ended December 31, 2010, corporate costs have remained relatively unchanged compared to 2009.
Corporate costs increased $6.4 million to $21.8 million for the year ended December 31, 2009 compared to $15.4 million in 2008 due primarily to an increase in business development and deferred compensation costs.
Financing Charges
Financing charges decreased $0.5 million to $8.3 million in Q4 2010 compared to $8.8 million in Q4 2009 and increased $9.9 million to $32.2 million for the year ended December 31, 2010 compared to $22.3 million in 2009 due primarily to higher interest rates and higher debt levels to finance acquisitions.
Financing charges increased $11.8 million to $22.3 million for the year ended December 31, 2009 compared to $10.5 million in 2008 due primarily to increased debt to finance the construction of Brunswick Pipeline.
Income Taxes
All businesses included in Other follow the future income taxes method of accounting for income taxes. Taxes are recognized on pre-tax income.
Income taxes recovery decreased $1.7 million to $3.4 million in Q4 2010 compared to $5.1 million in Q4 2009 primarily due to decreased corporate costs and remained relatively unchanged for the year ended December 31, 2010 compared to 2009.
Income taxes recovery increased $4.5 million to $14.5 million for the year ended December 31, 2009 compared to $10.0 million in 2008 due to increased corporate costs and financing charges for the year.
OUTLOOK
Business Environment
ECONOMIC ENVIRONMENT
Emera will continue to pursue investment opportunities related to the transformation of the energy industry to lower emissions and has embarked on a significant capital plan to increase the company’s generation from renewable sources, to improve the transmission connections within its service territories, and to expand access to natural gas as Emera transitions to a cleaner, greener company.
ENVIRONMENTAL REGULATIONS
NSPI is subject to environmental regulations as set by both the Province of Nova Scotia and the Government of Canada. NSPI continues to work with officials at both levels of government so as to comply with these regulations in an integrated way.
31
Table of Contents
Operating Unit Outlook
NSPI
NSPI anticipates earning a regulated ROE within its allowed range in 2011. NSPI continues to implement its strategy, which is focused on regulated investments in renewable energy and system reliability projects, with a total capital program budget of approximately $350 million in 2011. NSPI expects to finance its capital expenditures with funds from operations, debt and equity.
BANGOR HYDRO
Bangor Hydro’s USD earnings are expected to be slightly higher in 2011 due to the recovery of investments in new transmission assets. Bangor Hydro continues to execute on its transmission development plan, with approximately $150 million USD of large transmission projects in various stages of development. These projects, recoverable through regional transmission rates, are expected to provide returns on equity of 11.64 per cent. In 2011, Bangor Hydro expects to invest approximately $87 million USD, including approximately $54 million USD for major transmission projects. Bangor Hydro expects to finance its capital expenditures with funds from operations and debt.
PIPELINES
Pipelines earnings are expected to be lower in 2011 as a result of less favourable USD hedged exchange rates in 2011 compared to 2010 and as a result of capital lease accounting, which yields declining earnings over the life of the asset.
OTHER, INCLUDING CORPORATE COSTS
Earnings from Other, Including Corporate Costs, are expected to be higher in 2011 due to increased scale of business, offset by higher financing costs. Emera Newfoundland and Labrador plans to invest approximately $25 million in the Maritime Link and the Island Link Transmission Projects.
Emera expects to invest $115 million in the capital programs of its Caribbean companies.
LIQUIDITY AND CAPITAL RESOURCES
The company generated cash in 2010 mainly through the operations of NSPI and Bangor Hydro, its two primary regulated utilities involved in the generation, transmission and distribution of electricity and Brunswick Pipeline. NSPI’s and Bangor Hydro’s customer bases are diversified by both sales volumes and revenues among residential, commercial, industrial and other customers. Circumstances that could affect the company’s ability to generate cash include general economic downturns in its markets, the loss of one or more large customers, regulatory decisions affecting customer rates and changes in environmental legislation. NSPI and Bangor Hydro are each capable of paying dividends to Emera provided they do not breach their debt to capitalization ratios after giving effect to the dividend payment.
In addition to internally generated funds, Emera and NSPI have in aggregate access to $1.2 billion committed syndicated revolving bank lines of credit, of which $505 million is undrawn and available as at December 31, 2010. Emera and NSPI each have access to $600 million of this credit. NSPI has an active commercial paper program for up to $400 million, of which outstanding amounts are 100 per cent backed by its bank lines and this results in an equal amount of credit being considered drawn and unavailable.
In June 2010, Emera’s and NSPI’s revolving bank lines were each renewed for $600 million, for a three-year term maturing in June 2013. NSPI’s bank line was increased by $100 million to $600 million as part of this renewal process.
As at December 31, 2010, the outstanding short-term debt is as follows:
MILLIONS OF DOLLARS
| Maturity
| Credit Line
| Utilized
| Undrawn and
| ||||||||||||
Emera – Operating and acquisition credit facility | June 2013 – Revolver | $ | 600 | $ | 406 | $ | 194 | |||||||||
NSPI – Operating credit facility | June 2013 – Revolver | 600 | 289 | 311 | ||||||||||||
Bangor Hydro – in USD – Operating credit facility | September 2013 – Revolver | 80 | 42 | 38 | ||||||||||||
Other – in USD – Operating credit facilities | Various | 18 | 3 | 15 | ||||||||||||
Emera and its subsidiaries have debt covenants associated with their credit facilities. These covenants are tested regularly, and the company is in compliance with the covenant requirements.
32 EMERA INC. 2010 ANNUAL FINANCIAL REPORT
Table of Contents
MANAGEMENT’S DISCUSSION AND ANALYSIS
Debt Management
EMERA
In May 2010, Emera filed a $500 million debt and preferred equity shelf prospectus, providing the company with access to long-term debt and equity.
In June 2010, Emera issued six million 4.40 per cent Cumulative Five-Year Rate Reset First Preferred Shares, Series A (“First Preferred Shares, Series A”). The $150 million First Preferred Shares, Series A were issued at $25.00 per share for net after-tax proceeds of $146.7 million.
The weighted average coupon rate of Emera’s outstanding medium-term notes at December 31, 2010 was 4.45 per cent (2009 – 4.45 per cent). All of the outstanding debt matures within the next ten years. The quoted market weighted average interest rate for the same or similar issues of the same remaining maturities was 3.73 per cent as at December 31, 2010 (2009 – 4.43 per cent).
Emera’s credit ratings issued by Dominion Bond Rating Service (“DBRS”) and Standard & Poor’s (“S&P”) are as follows:
DBRS
| S&P
| |||||||
Long-term corporate | BBB (high) | BBB+ | ||||||
Preferred stock | Pfd-3 (high) | P-2 (low) | ||||||
NSPI
In May 2010, NSPI redeemed $100 million medium-term notes using short-term credit facilities.
In May 2010, NSPI filed a $500 million debt shelf prospectus, providing NSPI with access to long-term debt.
In June 2010, NSPI completed a $300 million medium-term note issue, proceeds of which were used to pay down outstanding short-term debt. These notes bear interest at the rate of 5.61 per cent and yield 5.616 per cent per annum until June 15, 2040.
The weighted average coupon rate on NSPI’s outstanding medium-term and debenture notes at December 31, 2010 was 6.74 per cent (2009 – 6.80 per cent). Approximately 27 per cent of the debt matures over the next ten years, 70 per cent matures between 2021 and 2040 and $50 million, or 3 per cent, matures in 2097. The quoted market weighted average interest rate for the same or similar issues of the same remaining maturities was 4.50 per cent as at December 31, 2010 (2009 – 4.87 per cent).
NSPI’s credit ratings issued by DBRS and S&P’s are as follows:
DBRS
| S&P
| |||||||
Corporate | N/A | BBB+ | ||||||
Senior unsecured debt | A (low) | BBB+ | ||||||
Preferred stock | Pfd-2 (low) | P-2 (low) | ||||||
Commercial paper | R-1 (low) | A-1 (low) | ||||||
BANGOR HYDRO
In June 2010, Bangor Hydro increased its revolving bank line by $20 million, and renewed it through September 2013.
The weighted-average coupon rate on Bangor Hydro’s outstanding long-term debt at December 31, 2010, was 6.96 per cent (2009 – 6.92 per cent). Approximately 87 per cent of the debt matures over the next ten years; the remaining issue matures in 2022. The quoted market weighted average interest rate for the same or similar issues of the same remaining maturities was 3.81 per cent as of December 31, 2010 (2009 – 5.57 per cent).
Bangor Hydro has no public debt, and accordingly has no requirement for public credit ratings. Bangor Hydro believes that its credit facility provides adequate access to capital to support current operations and a base level of capital expenditures. For additional capital needs, Bangor Hydro expects to have sufficient access to competitively priced funds in the unsecured debt market.
33
Table of Contents
Contractual Obligations
The consolidated contractual obligations over the next five years and thereafter include:
Payments Due by Period After | ||||||||||||||||||||||||||||||||
MILLIONS OF DOLLARS
| Total
| 3-year
| 2011
| 2012
| 2013
| 2014
| 2015
| 2015
| ||||||||||||||||||||||||
Long-term debt | $ | 3,037.8 | $ | 530.3 | $ | 12.7 | $ | 83.6 | $ | 305.0 | $ | 304.9 | $ | 74.7 | $ | 1,726.6 | ||||||||||||||||
Preferred shares issued by subsidiary | 135.0 | – | – | – | – | – | 135.0 | – | ||||||||||||||||||||||||
Operating leases | 7.0 | – | 2.7 | 1.1 | 0.6 | 0.6 | 0.6 | 1.4 | ||||||||||||||||||||||||
Purchase obligations | 4,247.5 | – | 388.4 | 385.6 | 306.8 | 243.1 | 191.6 | 2,732.0 | ||||||||||||||||||||||||
Capital obligations | 111.5 | – | 76.1 | 33.9 | 1.5 | – | – | – | ||||||||||||||||||||||||
Asset retirement obligations | 451.3 | – | 1.7 | 2.0 | 1.3 | 1.3 | 1.4 | 443.6 | ||||||||||||||||||||||||
Total contractual obligations | $ | 7,990.1 | $ | 530.3 | $ | 481.6 | $ | 506.2 | $ | 615.2 | $ | 549.9 | $ | 403.3 | $ | 4,903.6 | ||||||||||||||||
(1) Short-term discount notes utilized against a $600 million operating credit facility which matures in June 2013 are included in long-term debt as the company has the intention and the unencumbered ability to refinance the obligations for a period greater than one year.
Operating lease obligations: The company’s operating lease obligations consist of operating lease agreements for office space, rail cars, telecommunications services and certain other equipment.
Purchase obligations: The company has purchasing commitments for electricity from IPPs, transportation of coal, natural gas, fuel and transportation capacity on the Maritimes & Northeast Pipeline.
Capital obligations:The company has commitments to third parties for construction on capital projects and other goods and services.
Asset retirement obligations:The company has asset retirement obligations for its generation, transmission and distribution assets and its pipeline.
The company expects to be able to meet its obligations with cash from operations.
Capital Resources
Capital expenditures for 2010, including AFUDC, were approximately $591 million and included:
• $527 million in NSPI;
• $46 million in Bangor Hydro;
• $13 million in Brunswick Pipeline; and
• $5 million in Other.
PENSION FUNDING
For funding purposes, Emera determines required contributions to its defined-benefit pension plans based on smoothed asset values. This reduces volatility in the cash funding requirement as the impact of investment gains and losses are recognized over a three year period. The cash required in 2011 for defined-benefit pension plans will be approximately $39.5 million (2010 – $34.7 million actual). All pension plan contributions are tax deductible and will be funded with cash from operations.
Emera’s defined-benefit pension plans are managed with a diversified portfolio of asset classes, investment managers and geographic investments. Emera reviews the investment managers on a regular basis, and the plans’ asset mixes from time to time.
Emera’s projected contributions to defined contribution pension plans are $2.7 million for 2011 (2010 – $1.4 million actual).
34 EMERA INC. 2010 ANNUAL FINANCIAL REPORT
Table of Contents
MANAGEMENT’S DISCUSSION AND ANALYSIS
OFF-BALANCE SHEET ARRANGEMENTS
Upon privatization of the former provincially owned Nova Scotia Power Corporation (“NSPC”) in 1992, NSPI became responsible for managing a portfolio of defeasance securities, which at December 31, 2010, totalled $1.0 billion. The securities are held in trust for Nova Scotia Power Finance Corporation (“NSPFC”), an affiliate of the Province of Nova Scotia. NSPI is responsible for ensuring the defeasance securities provide the principal and interest streams to match the related defeased NSPC debt. Approximately 73 per cent of the defeasance portfolio consists of investments in the related debt, eliminating all risk associated with this portion of the portfolio; the remaining defeasance portfolio has a market value higher than the related debt, reducing the future risk of this portion of the portfolio.
TRANSACTIONS WITH RELATED PARTIES
In the ordinary course of business, Emera purchased natural gas transportation capacity totalling $12.8 million (2009 – $12.5 million) during the three months ended December 31, 2010, and $55.1 million (2009 – $47.4 million) during the year ended December 31, 2010, from the Maritimes & Northeast Pipeline, an investment under significant influence of the company. The amount is recognized in “Fuel for generation and purchased power” or netted against energy marketing margin in “Other revenue”, and is measured at the exchange amount. At December 31, 2010, the amount payable to the related party was $3.9 million (2009 – $4.6 million), is non-interest bearing and is under normal credit terms.
DIVIDENDS AND PAYOUT RATIOS
In February 2010, the Board of Directors approved a quarterly dividend increase, effective May 3, 2010, to $0.2825 per common share, and in September 2010, approved a further increase to $0.3250 effective November 1, 2010, reflecting an increase on an annualized basis to $1.30 per common share.
Emera Inc.’s common dividend rate was $1.21 ($0.2725 in Q1, $0.2825 in Q2; and $0.3250 per quarter in Q3 and Q4) per common share in 2010 and $1.03 ($0.2525 per quarter in Q1, Q2 and Q3; and $0.2725 in Q4) for 2009, representing a payout ratio of approximately 70.1 per cent in 2010 and 65.9 per cent in 2009.
Effective September 25, 2009, Emera changed its Common Shareholders Dividend Reinvestment and Share Purchase Plan to provide for a discount of up to five per cent from the average market price of Emera’s common shares for common shares purchased in connection with the reinvestment of cash dividends under this Plan. The Board of Directors of Emera also decided on September 25, 2009 that the discount would be five per cent effective on and after the quarterly dividend payment on November 16, 2009 to shareholders of record on November 2, 2009.
RISK MANAGEMENT AND FINANCIAL INSTRUMENTS
Financial Risks and Financial Instruments
The company manages its exposure to foreign exchange, interest rate and commodity risks in accordance with established risk management policies and procedures. The company uses financial instruments consisting mainly of foreign exchange forward contracts, and coal, oil and gas options and swaps. In addition, the company has contracts for the physical purchase and sale of natural gas, and physical and financial contracts held-for-trading (“HFT”). Collectively these contracts are referred to as derivatives.
The company recognizes the fair value of all its derivatives on its balance sheet, except for non-financial derivatives that qualify and are designated as contracts held for normal purchase or sale.
Derivatives that meet stringent documentation requirements, and can be proven to be effective both at the inception and over the term of the derivative, qualify for hedge accounting. Specifically, for cash flow hedges, the change in the fair value of the effective portion of hedging derivatives is deferred to “AOCI” and recognized in earnings in the same period that the related hedged item is realized. Any ineffective portion of the change in the fair value of derivatives is recognized in net earnings in the reporting period.
Where the documentation or effectiveness requirements are not met, the derivative instruments are recognized at fair value with any changes in fair value recognized in net earnings in the reporting period, unless deferred as a result of regulatory accounting.
For fair value hedges, the change in fair value of the hedging derivatives and the hedged item are recorded in net earnings. Therefore, the change in fair value of the ineffective portion of hedging derivatives will impact net earnings in the reporting period.
35
Table of Contents
The company’s HFT derivatives are recorded on the balance sheet at fair value, with changes recorded in net earnings in the reporting period, unless deferred as a result of regulatory accounting. The company has not designated any derivatives to be included in the HFT category.
NSPI has contracts for the purchase and sale of natural gas at its Tufts Cove generating station (“TUC”) that are considered HFT derivatives and accordingly are recognized on the balance sheet at fair value. This reflects NSPI’s history of buying and reselling any natural gas not used in the production of electricity at TUC. Changes in fair value of HFT derivatives are normally recognized in net earnings. In accordance with NSPI’s accounting policy for financial instruments and hedges relating to TUC fuel, NSPI has deferred any changes in fair value to a regulatory asset or liability. In 2009, the UARB approved an amendment to NSPI’s accounting practice to include all TUC financial commodity hedges which are no longer required. This change in practice has impacted the timing of recognition between “Fuel for generation and purchased power” and “Fuel adjustment” as a result of the FAM implemented in 2009. The change in accounting practice was applied prospectively, beginning in 2009, as required by the UARB.
HEDGING ITEMS RECOGNIZED ON THE BALANCE SHEET
The company has the following categories on the balance sheet related to derivatives in valid hedging relationships:
| December 31 | December 31 | |||||||
MILLIONS OF DOLLARS
| 2010
| 2009
| ||||||
Inventory | $ | 4.7 | $ | 22.2 | ||||
Derivatives in a valid hedging relationship | 24.6 | (29.5 | ) | |||||
Long-term debt | – | 0.1 | ||||||
| $ | 29.3 | $ | (7.2 | ) | ||||
HEDGING IMPACT RECOGNIZED IN EARNINGS
The company recognized in net earnings the following gains (losses) related to the effective portion of hedging relationships under the following categories:
| Three Months Ended | Year Ended | |||||||||||||||
| December 31 | December 31 | |||||||||||||||
MILLIONS OF DOLLARS
| 2010
| 2009
| 2010
| 2009
| ||||||||||||
Finance income from direct financing lease increase | $ | 1.7 | $ | 2.2 | $ | 7.7 | $ | 2.8 | ||||||||
Fuel and purchased power increase | (11.8 | ) | (27.1 | ) | (73.3 | ) | (46.3 | ) | ||||||||
Financing charges decrease | 1.2 | 1.0 | 1.8 | 6.9 | ||||||||||||
Effectiveness losses | $ | (8.9 | ) | $ | (23.9 | ) | $ | (63.8 | ) | $ | (36.6 | ) | ||||
The effectiveness gains (losses) reflected in the above table are offset in net earnings by the change in the fair value of the hedged item realized in the period.
The company recognized in net earnings the following gains (losses) related to the ineffective portion of hedging relationships under the following categories:
| Three Months Ended | Year Ended | |||||||||||||||
| December 31 | December 31 | |||||||||||||||
MILLIONS OF DOLLARS
| 2010
| 2009
| 2010
| 2009
| ||||||||||||
Fuel and purchased power increase | $ | (0.7 | ) | $ | (1.0 | ) | $ | (1.6 | ) | $ | (14.2 | ) | ||||
Financing charges (increase) decrease | (0.1 | ) | 0.3 | (0.3 | ) | (0.5 | ) | |||||||||
Ineffectiveness losses | $ | (0.8 | ) | $ | (0.7 | ) | $ | (1.9 | ) | $ | (14.7 | ) | ||||
| 36 | EMERA INC. 2010 ANNUAL FINANCIAL REPORT |
Table of Contents
MANAGEMENT’S DISCUSSION AND ANALYSIS
HFT ITEMS RECOGNIZED ON THE BALANCE SHEET
The company has recognized on the balance sheet a net HFT derivatives liability of $11.7 million as at December 31, 2010 (2009 – $9.4 million asset).
HFT DERIVATIVES RECOGNIZED IN EARNINGS
The company has recognized the following realized and unrealized gains (losses) with respect to HFT derivatives in earnings:
| Three Months Ended | Year Ended | |||||||||||||||
| December 31 | December 31 | |||||||||||||||
MILLIONS OF DOLLARS
| 2010
| 2009
| 2010
| 2009
| ||||||||||||
Electric revenue | $ | (1.9 | ) | – | $ | 4.4 | $ | 0.6 | ||||||||
Other revenue | 3.8 | – | 1.8 | (5.7 | ) | |||||||||||
Fuel and purchased power | (1.3 | ) | $ | 1.4 | (1.3 | ) | 12.4 | |||||||||
Financing charges | (0.1 | ) | (0.1 | ) | – | – | ||||||||||
Held-for-trading derivatives gains (losses) | $ | 0.5 | $ | 1.3 | $ | 4.9 | $ | 7.3 | ||||||||
As discussed in note 29 of Emera’s financial statements at the reporting date, various valuation techniques are used to determine the fair value of derivative instruments. These may include quoted market prices or internal models using observable or non-observable market information.
The company has a derivative contract, as discussed in Significant Item, where no observable market exists, therefore modelling techniques are employed using assumptions reflective of current market rates, yield curves and forward prices, as applicable, to interpolate certain prices.
Business Risks
MEASUREMENT OF RISK
Significant risk management activities for Emera are overseen by the Enterprise Risk Management Committee to ensure risks are appropriately assessed, monitored and controlled within predetermined risk tolerances established through approved policies.
The company’s risk management activities are focused on those areas that most significantly impact profitability, quality of earnings and cash flow. These risks include, but are not limited to, exposure to commodity prices, foreign exchange, interest rates, credit risk and regulatory risk.
The UARB approved the implementation of a FAM for NSPI effective January 1, 2009, reducing the utility’s exposure to fuel price volatility by providing a mechanism for NSPI to recover actual fuel costs. The FAM mitigates the risk to NSPI’s net earnings associated with fluctuations in commodity prices and foreign exchange.
COMMODITY PRICE RISK
Substantially all of the company’s annual fuel requirement is subject to fluctuation in commodity market prices, prior to any commodity risk management activities. The company utilizes a portfolio strategy for fuel procurement with a combination of long-, medium-, and short-term supply agreements. It also provides for supply and supplier diversification. The strategy is designed to reduce the effects from market volatility through agreements with staggered expiration dates, volume options and varied pricing mechanisms.
Coal/Petroleum Coke
A substantial portion of NSPI’s coal and petroleum coke (“petcoke”) supply comes from international suppliers, which was contracted at or near the market prices prevailing at the time of contract. The company has entered into fixed-price and index price contractual arrangements with several suppliers as part of the fuel procurement portfolio strategy. All index-priced contractual arrangements are matched with a corresponding financial instrument to fix the price.
The approximate percentage of coal and petcoke requirements contracted at December 31, 2010 is as follows:
| • | 2011 – 77% |
| • | 2012 – 39% |
| • | 2013 – 24% |
37
Table of Contents
Heavy Fuel Oil
NSPI manages exposure to changes in the market price of heavy fuel oil through the use of swaps, options and forward contracts. For 2011 and 2012, NSPI currently does not have heavy fuel oil hedging requirements.
Natural Gas
NSPI has entered into multi-year contracts to purchase approximately 47,600 mmbtu of natural gas per day in 2011, and 39,300 mmbtu of natural gas per day in 2012. Volumes exposed to market prices are managed using financial instruments where the fuel is required for NSPI’s generation; and the balance is sold against market prices when available for resale. Gas volumes not required for generation will be resold into the gas market with the margin hedged using financial instruments. As at December 31, 2010, amounts of natural gas volumes that have been economically and/or financially hedged and contracted are approximately as follows:
| • | 2011 – 87% |
| • | 2012 – 35% |
Purchased Power
Emera, along with its joint venture partner, have entered into a contract with Bear Swamp to fix the price of power necessary to produce the energy requirements of the LIPA contract. As at December 31, 2010, amounts of purchased power Emera has financially hedged are approximately as follows:
| • | 2011 – 103% |
| • | 2012 – 95% |
| • | 2013 – 95% |
| • | 2014 – 95% |
| • | 2015 – 94% |
FOREIGN EXCHANGE RISK
The company enters into foreign exchange forward and swap contracts to limit exposure on foreign currency transactions such as fuel purchases, revenue streams and capital expenditures.
The risk due to fluctuation of the CAD against the USD for fuel purchases in NSPI is measured and managed. In 2011, NSPI expects approximately 60 per cent of its anticipated net fuel costs to be denominated in USD. USD from sales of surplus natural gas will provide a natural hedge against a portion of USD fuel costs. Forward contracts to buy $225.5 million USD were in place at December 31, 2010 at a weighted average rate of $0.99, representing 70 per cent of 2011’s anticipated USD requirements. Forward contracts to buy $443.0 million USD in 2012 through 2015 at a weighted average rate of $1.03 were in place at December 31, 2010. These contracts cover 31 per cent of anticipated USD requirements in these years. As at December 31, 2010, there were no fuel-related foreign exchange swaps outstanding.
NSPI uses foreign exchange forward contracts to hedge the currency risk for capital projects and receivables denominated in foreign currencies. Forward contracts to buy€1.8 million were in place at December 31, 2010 at a weighted average rate of $1.56 (versus CAD) for capital projects in 2011.
Brunswick Pipeline uses forward contracts to hedge the currency risk associated with revenue streams denominated in foreign currencies. Forward contracts to sell $52 million USD in 2011 were in place at December 31, 2010 at an average rate of $1.07 and sell $63 million USD in 2012 through 2015 at a weighted average rate of $1.07. These contracts cover 91 per cent of anticipated USD revenue inflows in 2011 and 27 per cent of anticipated USD revenue inflows in 2012 through 2015.
INTEREST RATE RISK
Emera manages interest rate risk through a combination of fixed and floating borrowing and a hedging program. Floating-rate debt is estimated to represent approximately 20 per cent of total debt in 2011. The company has two interest rate hedging contracts outstanding as at December 31, 2010, fixing the variable interest rates on $22.6 million USD of Maine Public Utilities Financing Bank bonds at MPS.
CREDIT RISK
Credit risk arising as a result of contractual obligations between the company and other counterparties is managed by assessing the counterparties’ financial creditworthiness prior to assigning credit limits based on the Board of Directors’ approved credit policies. The company frequently uses collateral agreements within its negotiated master agreements to further mitigate credit exposure.
38 EMERA INC. 2010 ANNUAL FINANCIAL REPORT
Table of Contents
MANAGEMENT’S DISCUSSION AND ANALYSIS
LABOUR RISK
NSPI has a contract with its union, which will expire in April 2012. Bangor Hydro entered into a new collective bargaining agreement in July 2010, which will expire in July 2015. MPS also has a contract with its union, which will expire in October 2013.
REGULATORY RISK
NSPI
NSPI faces risk with respect to the timeliness and certainty of full recovery of costs. The adoption and implementation of the FAM, effective January 1, 2009, has helped NSPI manage that risk. The UARB oversees the FAM, including review of fuel costs, contracts and transactions. The FAM will help ensure customer rates reflect the actual price of the fuel used to make electricity. Concurrent with the implementation of the FAM in 2009, NSPI’s regulated ROE range was reduced by 0.2 per cent, changing its regulated ROE range to 9.1 per cent to 9.6 per cent, with rates set at 9.35 per cent.
The first rate adjustment under the FAM, effective on January 1, 2010, was approved by the UARB on December 9, 2009. On December 8, 2010, the UARB approved NSPI’s setting of the 2011 base cost of fuel and its recovery of all unrecovered fuel related costs as submitted in NSPI’s November 2010 filing. The recovery of these costs will begin January 1, 2011. The UARB approved NSPI’s recovery of these costs over three years, with 50 per cent of the rate increase to be recovered in 2011, 30 per cent in 2012 and 20 per cent in 2013.
In December 2010, the UARB granted NSPI approval to defer certain tax benefits related to renewable energy projects arising in 2010. The UARB will convene a proceeding in 2011 to discuss how this deferral will be applied.
Bangor Hydro
Bangor Hydro’s business consists of three primary components which are each governed by their own regulatory structure. The components include distribution, transmission and stranded costs.
Bangor Hydro’s distribution business operates under the regulation of the MPUC and operates under a traditional cost-of-service regulatory structure. In late 2007, the MPUC approved a modest increase in distribution rates under the traditional cost-of-service regulatory structure. In the event that costs rise faster than revenues, Bangor Hydro has the ability to return to the MPUC to request a further increase in rates.
Bangor Hydro’s transmission business is primarily regulated by the FERC. The rates charged are determined by formula and are adjusted on an annual basis. Bangor Hydro is a participating transmission owner within the Regional Transmission Organization for New England, and its operations are therefore linked with the transmission operations of all of New England. Bangor Hydro’s ROE on its transmission assets, along with added incentives, is determined by the FERC, along with the regional transmission owners.
Bangor Hydro also has the ability to recover stranded costs of both regulatory assets and purchasing power at above-market prices under a full reconciliation mechanism. This ability eliminates the commodity risk involved with fixed-price purchase power contracts.
Metering, billing and settlement services for power suppliers are provided directly by Bangor Hydro within its service territory, and Bangor Hydro is permitted to recover all prudently incurred costs for these services.
MPS
Similar to Bangor Hydro, MPS’s business consists of three primary components, which are each governed by their own regulatory structure. The components are distribution, transmission and stranded costs.
MPS’s distribution business operates under the regulation of the MPUC and operates under a traditional cost-of-service regulatory structure. In July 2006, the MPUC approved an increase of approximately 11 per cent in distribution rates, effective July 15, 2006. The allowed ROE used in setting these distribution rates was 10.2 per cent, with a common equity component of 50 per cent. In the event that costs rise faster than revenues, MPS has the ability to return to the MPUC to request a further increase in rates on January 1, 2012 or any time thereafter.
The transmission business of MPS is primarily regulated by the FERC. Transmission rates are set annually through the Open Access Transmission Tariff (“OATT”). Rates derived from the previous calendar year’s results go into effect June 1 for wholesale customers and July 1 for retail customers. The allowed ROE for transmission operations is 10.5 per cent, and is based on the actual common equity. The allowed ROE is determined by negotiation with customers in the formula change years of the OATT, which occur every three years. The last OATT formula change year was 2009.
MPS also has the ability to recover stranded costs of regulatory assets.
Metering, billing and settlement services for power suppliers are provided directly by MPS within its service territory and MPS is permitted to recover all prudently incurred costs for these services.
39
Table of Contents
ENVIRONMENT
Corporate Environmental Governance
Emera is committed to operating in a manner that is respectful and protective of the environment, and in full compliance with legal requirements and company policy. Emera and its wholly owned subsidiaries have implemented this policy through development and application of environmental management systems (“EMS”).
Implementation of EMS has provided a systematic focus on environmental issues so risks are identified and managed proactively. All areas of Emera undertook initiatives in 2010 to reduce potential environmental risks and associated costs. Activities included, but were not limited to, reducing air emissions, protecting water resources, and continued management of PCB contaminated electrical equipment.
Conformance with legislative and company requirements is verified through a comprehensive environmental audit program. There were no significant environmental or regulatory compliance issues identified during the 2010 audits. Plans are in place to promptly address any audit findings and continually improve the environmental management of the company’s operations.
Oversight of environmental matters is carried out by the Board of Directors of all Emera operating companies or committees of the Board of Directors with specific environmental responsibilities. In addition, an Environmental Council, made up of senior Emera employees, with working accountability for environmental matters, continues to guide the implementation of programs that address key environmental issues. In addition to programs for employees, the EMS procedures of all wholly owned subsidiaries include planning, implementing and monitoring of contractors’ performance.
NSPI completed an Integrated Resource Plan in 2007 and refreshed it in 2009. The Integrated Resource Plan includes current environmental requirements and assumptions on future regulations as constraints on possible generation plans. This allows for better generation planning for the future. NSPI stakeholders were engaged in the assumptions and the scenarios to be modelled. The results of these planning exercises can be found on the NSPI website.
In 2007, NSPI was audited by the Canadian Electricity Association (“CEA”) to verify the quality of its environmental reporting and management systems. The auditor from the CEA concluded that NSPI had “robust programs, environmental leadership and a strong, mature EMS.”
Regulatory
NSPI produces its electrical energy approximately 64 per cent from coal and 19 per cent from natural gas and/or oil. As such, it is subject to regulation with respect to air pollutants and greenhouse gas emissions. NSPI operates under a cost-of-service regulation model. Accordingly, all prudently incurred costs, including those capital and operating costs associated with meeting present and future environmental liabilities, can be recovered in rates collected from customers.
NSPI is subject to environmental regulation as set by both Canadian federal and Nova Scotia provincial governments. NSPI is in material compliance with current environmental regulations. All required permits are in place for NSPI’s generating stations. These permits are generally for a ten-year period but can be subject to review, variation or suspension by the Minister of Environment of Nova Scotia.
Bangor Hydro and MPS are regulated by the United States Environmental Protection Agency as to compliance with the Federal Water Pollution Control Act, the Clean Air Act, and other US federal statutes governing the treatment and disposal of hazardous wastes. Bangor Hydro and MPS are also regulated by the Maine Department of Environmental Protection.
Brunswick Pipeline is a federally regulated undertaking and must operate in accordance with the NEB Act, the Onshore Pipeline Regulations, 1999, and the Canada Labour Code Part II, the Canadian Environmental Protection Act and any applicable provincial environmental regulations.
40 EMERA INC. 2010 ANNUAL FINANCIAL REPORT
Table of Contents
MANAGEMENT’S DISCUSSION AND ANALYSIS
CLIMATE CHANGE AND AIR EMISSIONS
Renewable Energy
On October 15, 2010, the Nova Scotia Government enacted regulations under the Electricity Act related to the province’s Renewable Electricity Plan. These regulations establish the requirement that 25 per cent of electricity be supplied from renewable sources by 2015. These regulations build on the previously legislated requirements for 2011 and 2013. Recent amendments to the Electricity Act, and the new regulations, provide for the appointment, by spring 2011, of a new, independent renewable electricity administrator to conduct the procurement of at least 300 GWh of energy from IPPs to meet the 2015 standard. NSPI is also provided the opportunity to develop 300 GWh of renewable energy.
In January 2007, the Nova Scotia Government approved the Renewable Energy Standard Regulation (“RES”) to increase the percentage of renewable energy in the generation mix. In October 2009, the RES was amended. The target date for five per cent of electricity to be supplied from post-2001 sources of renewable energy, owned by independent power producers, was extended to 2011 from 2010. The target for 2013, which requires an additional five per cent of renewable energy, is unchanged.
Greenhouse Gas Emissions
NSPI has stabilized and, in recent years, reduced greenhouse gas emissions. This has been achieved by energy efficiency and conservation programs, increased use of natural gas, improved efficiency of converting natural gas to electricity and adding and contracting for new renewable energy sources to the generation portfolio.
Greenhouse gas emissions from NSPI facilities are capped beginning in 2010 through to 2020. The 2010 to 2015 caps will be achieved by the continued success of energy efficiency and conservation programs and the addition of renewable energy to meet the 2011, 2013 and 2015 provincial renewable energy standards. The regulations also include a transmission incentive compliance mechanism recognizing expenditures on transmission, which facilitates additional renewable energy sources. Up to three per cent of the annual cap can be offset in this way to 2019. Further, the 2010 to 2020 period years are combined to form multi-year compliance periods recognizing the variability in electricity supply sources and demand.
Beyond 2015, reduced greenhouse gas emissions will be achieved through a combination of additional renewable energy, co-firing of biomass in existing coal power plants, import of non-emitting energy and energy efficiency and conservation as per the 2007/2009 Integrated Resource Plan.
On June 23, 2010, Environment Canada announced its intentions for a new national GHG framework for the electricity sector. This federal framework, if developed further into regulations, would require thermal coal units to meet GHG emission levels equal to, or better than, a natural gas combined cycle generating unit at a specific anniversary. Nova Scotia’s existing GHG regulations require reductions in NSPI’s emissions similar to the intentions of the federal framework. NSPI is reviewing the implications of this federal framework and its alignment with NSPI’s current operating plans under existing Nova Scotia regulations.
Mercury
On July 22, 2010, the Province of Nova Scotia announced, for the years 2010 through 2013, allowable mercury emissions would be increased from the previous cap of 65 kg per year. NSPI was requested to develop a plan of staged mercury emission reductions for its generation facilities for the period of 2010 to 2020 and to meet an annual cap of 35 kg beginning in 2020.
In 2008, NSPI carried out extensive testing on mercury abatement technology in its coal power plants. A capital program to add sorbent injection to each of the seven pulverized fuel coal units was completed in 2009. This allowed NSPI to meet the 2010 mercury emission cap of 65 kg established by the Province.
Compared to historical levels, NSPI has reduced mercury emissions by 60 per cent.
Nitrogen Oxide and Sulphur Dioxide Emissions
NSPI has completed in 2009 its capital program of retrofitting low nitrogen oxide combustion firing systems on six of its seven pulverized fuel coal units. NSPI now meets the 2009 nitrogen oxide emission cap of 21,365 tonnes per year established by the province.
NSPI continues to meet its emission cap on sulphur dioxide emissions by the use of compliant fuel.
Compared to historical levels, NSPI has reduced emissions of nitrogen oxide by 40 per cent and sulphur dioxide by 50 per cent.
41
Table of Contents
Obligations
The company recognizes asset retirement obligations (“ARO”) for property, plant and equipment in the period in which they are incurred if a reasonable estimate of fair value can be determined. Using the company’s credit-adjusted risk-free rate, the fair value is determined by discounting the company’s estimated future cash flows necessary to discharge legal obligations related to reclamation of land at the company’s thermal, hydro, combustion turbine sites, pipelines and disposal of polychlorinated biphenyls (“PCBs”) in its transmission and distribution equipment. Estimated future cash flows are based on the company’s completed depreciation studies, prior experience, estimated useful lives of assets, governmental regulatory requirements and the costs of activities such as demolition, restoration and remedial work based on present-day methods and technologies. Actual results may differ from these estimates.
The UARB included the amount of future expenditures associated with the removal of generation facilities in the 2003 NSPI depreciation settlement discussed under Property, Plant and Equipment in the Significant Accounting Policies and Critical Accounting Estimates section. NSPI believes that it will continue to be able to recover ARO through rates. Accordingly, changes to the ARO, or cost recognition attributable to changes in the factors discussed above, should not impact the results of the company’s operations.
Some of the company’s hydro, transmission and distribution assets may have additional ARO. As the company expects to use the majority of its installed assets for an indefinite period, no removal date can be determined and consequently a reasonable estimate of the fair value of any related ARO cannot be made at this time. Additionally, some of the company’s transmission and distribution assets may have conditional ARO, the fair value of which cannot be reasonably estimated as sufficient information does not exist to estimate the obligations. A liability will be recognized in the period in which sufficient information becomes available.
The key assumptions used to determine the ARO are as follows:
| Credit-Adjusted Risk-Free Rate | Estimated Undiscounted Future Obligation (Millions of Dollars) | Expected Settlement Date | ||||||||||||||||||||||
ASSET
| 2010
| 2009
| 2010
| 2009
| 2010
| 2009
| ||||||||||||||||||
Thermal | 5.30% | 5.31% | $ | 258.9 | $ | 242.3 | 10 – 29 | 11 –30 | ||||||||||||||||
Hydro | 5.27% | 5.31% | 101.4 | 60.8 | 21 – 51 | 22 –52 | ||||||||||||||||||
Wind | 5.21% | – | 45.5 | – | 13 – 20 | – | ||||||||||||||||||
Combustion turbines | 5.25% | 5.31% | 12.9 | 5.1 | 1 – 14 | 1 – 14 | ||||||||||||||||||
Transmission and distribution | 5.74% | 5.74% | 21.6 | 18.1 | 1 – 15 | 1 – 16 | ||||||||||||||||||
Pipeline | 3.80% | 3.80% | 11.0 | 11.0 | 39 | 40 | ||||||||||||||||||
| $ | 451.3 | $ | 337.3 | |||||||||||||||||||||
As at December 31, 2010, the asset retirement obligations recorded on the balance sheet were $141.8 million (2009 – $104.5 million). The company estimates the undiscounted amount of cash flow required to settle the obligations is approximately $451.3 million, which will be incurred between 2011 and 2061. The majority of these costs will be incurred between 2020 and 2041.
DISCLOSURE AND INTERNAL CONTROLS
Emera’s management is responsible for establishing and maintaining disclosure controls and procedures (“DC&P”) and internal controls over financial reporting (“ICFR”), as those terms are defined in National Instrument 52-109 Certification of Disclosure in Issuers’ Annual and Interim Filings. The objective of this instrument is to improve the quality, reliability and transparency of information that is filed or submitted under securities legislation.
The President and Chief Executive Officer and the Chief Financial Officer have designed, with the assistance of company employees, DC&P and ICFR to provide reasonable assurance that material information is reported to them on a timely basis; financial reporting is reliable; and financial statements prepared for external purposes are in accordance with CGAAP.
The President and Chief Executive Officer and the Chief Financial Officer have evaluated, with the assistance of company employees, the effectiveness of Emera and its consolidated subsidiaries’ DC&P and ICFR, and based on that evaluation, have concluded DC&P and ICFR were effective at December 31, 2010.
There have been no changes in Emera or its consolidated subsidiaries’ ICFR during the period beginning on January 1, 2010 and ending on December 31, 2010, which have materially affected, or are reasonably likely to materially affect ICFR.
42 EMERA INC. 2010 ANNUAL FINANCIAL REPORT
Table of Contents
MANAGEMENT’S DISCUSSION AND ANALYSIS
SIGNIFICANT ACCOUNTING POLICIES AND CRITICAL ACCOUNTING ESTIMATES
The preparation of consolidated financial statements requires management to make estimates and assumptions that affect the reported amounts of assets and liabilities, related amounts of revenues and expenses, and disclosure of contingent assets and liabilities. Significant areas requiring the use of management estimates relate to rate regulation, the determination of post-retirement employee benefits, unbilled revenue, contract receivable, income taxes, asset retirement obligations, useful lives for depreciable assets, and goodwill impairment assessments. Actual results may differ from these estimates.
RATE REGULATION
The rate-regulated accounting policies of NSPI, Bangor Hydro, MPS and Brunswick Pipeline may differ from accounting policies for non-rate-regulated companies. NSPI, Bangor Hydro and MPS accounting policies are subject to examination and approval by their respective regulators. These accounting policy differences occur when the regulators render their decisions on rate applications or other matters and generally involve a difference in the timing of revenue and expense recognition. The accounting for these items is based on the expectation of the future actions of the regulators.
If the regulators’ future actions are different from their previous rulings, the timing and amount of the recovery of liabilities and refund of assets, recorded or unrecorded, could be significantly different from that reflected in the financial statements.
PENSION AND OTHER POST-RETIREMENT EMPLOYEE BENEFITS
The company provides post-retirement benefits to employees, including defined-benefit pension plans. The cost of providing these benefits is dependent upon many factors that result from actual plan experience and assumptions of future experience.
The benefit cost and accrued benefit obligation for employee future benefits included in annual compensation expenses are affected by employee demographics, including age, compensation levels, employment periods, contribution levels and earnings on plan assets.
Changes to the provision of the plan may also affect current and future pension costs. Benefit costs may also be affected by changes in key actuarial assumptions, including anticipated rates of return on plan assets and discount rates used in determining the accrued benefit obligation and benefit costs.
The pension plan assets are comprised primarily of equity and fixed-income investments. Fluctuations in actual equity market returns and changes in interest rates may result in increased or decreased pension costs in future periods.
Consistent with CGAAP and Emera’s accounting policy, the company amortizes the net actuarial gain or loss, which exceeds ten per cent of the greater of the accrued benefit obligation (“ABO”) and the market-related value of assets, over active plan members’ average remaining service period, which is currently nine years. Emera’s use of smoothed asset values further reduces the volatility related to the amortization of actuarial investment experience. As a result, the main cause of volatility in reported pension cost is the discount rate used to determine the ABO.
The discount rate used to determine benefit costs is based on high-quality long-term Canadian corporate bonds for NSPI’s pension plan and US corporate bonds for Bangor Hydro’s pension plan. The discount rate is determined with reference to bonds, which have the same duration as the ABO as at January 1 of the fiscal year rounded to the nearest 25 basis points. For benefit cost purposes, NSPI’s rate was 6.50 per cent for 2010 (2009 – 7.50 per cent) and Bangor Hydro’s rate was 6.00 per cent for 2010 (2009 – 6.75 per cent). MPS’s rate for 2010 was 5.75 per cent for pension plans and 5.85 per cent for non-pension plans and GBPC’s rate was 6.00 per cent.
The expected return on plan assets is based on management’s best estimate of future returns, considering economic and consensus forecasts. The benefit cost calculations assumed that plan assets would earn a rate of return of 7.25 per cent for 2010 and 2009 for NSPI and 8.00 per cent for 2010 (2009 – 8.00 per cent) for Bangor Hydro. The assumed rate of return on plan assets for 2010 was 8.5 per cent for MPS and 6.00 per cent for GBPC.
The reported benefit cost for 2010, based on management’s best estimate assumptions, is $34.1 million. While there are numerous assumptions which are used to determine the benefit cost, the discount rate and asset return assumptions have an impact on the calculations.
The following shows the impact on 2010 benefit cost of a 25 basis point change (0.25 per cent) in the discount rate and asset return assumptions:
| 0.25% Increase | 0.25% Decrease | |||||||||||||||
MILLIONS OF DOLLARS
| 2010
| 2009
| 2010
| 2009
| ||||||||||||
Discount rate assumption | $ | (3.5 | ) | $ | (1.3 | ) | $ | 3.6 | $ | 1.4 | ||||||
Asset return assumption | $ | (1.8 | ) | $ | (1.9 | ) | $ | 1.8 | $ | 1.9 | ||||||
The sensitivity to the discount rate assumption was significantly higher for 2010 benefit cost than in 2009 because, in 2010, the existing net unamortized gains and losses subject to amortization fell outside the ten per cent corridor and any additional change impacts the amortization and expense calculations.
43
Table of Contents
UNBILLED REVENUE
Electric revenues are billed on a systematic basis over a one- or two-month period for NSPI and a one-month period for Bangor Hydro, MPS and GBPC. At the end of each month, the company must make an estimate of energy delivered to customers since the date their meter was last read and of related revenues earned but not yet billed. The unbilled revenue is estimated based on several factors, including current month’s generation, estimated customer usage by class, weather, line losses and applicable customer rates. Brunswick Pipeline also makes an estimate of toll revenues at the end of each month. Based on the extent of the estimates included in the determination of unbilled revenue, actual results may differ from the estimate. As at December 31, 2010, unbilled revenues amount to $102.7 million (2009 – $98.4 million) on a base of annual electric revenues of approximately $1.4 billion (2009 – $1.4 billion).
CONTRACT RECEIVABLE
NSPI’s natural gas purchase agreement expired in October 2010. The agreement included a price adjustment clause covering three years of natural gas purchases. The clause stated that NSPI would pay for all gas purchases at the agreed contract price, but would be entitled to a price rebate on a portion of the volumes. The first settlement took place in November 2007 for purchases to the end of October 2007 and the final settlement took place in November 2010.
PROPERTY, PLANT AND EQUIPMENT
Property, plant and equipment represents 54.5 per cent of total assets recognized on the company’s balance sheet. Included in “Property, plant and equipment” are the generation, transmission and distribution and other assets of the company. Due to the magnitude of the company’s property, plant and equipment, changes in estimated depreciation rates can have a material impact on depreciation expense.
Depreciation is calculated on a straight-line basis over the estimated service life of the asset. The estimated useful lives of the assets are largely based on formal depreciation studies, which are conducted from time to time.
In 2002, NSPI commissioned a depreciation study by an external consultant. The study was filed with the UARB in 2003. A settlement agreement on the matter was reached with all interveners, which recommended a four-year phase-in of new depreciation rates, which, based on assets in service in the study, would reach an overall increase in depreciation expense of $20 million by 2007. The UARB approved the settlement. NSPI began phasing in the new rates in 2004. In its rate decision for 2005, the UARB deferred the scheduled phase-in for 2005. In the rate decision for 2006, the UARB included the phase-in of year-two in rates. In its February 5, 2007 decision, the UARB postponed the phase-in of year-three rates until the next rate application. In its November 5, 2008 decision, the UARB approved year-three phase-in rates effective January 1, 2009. On October 29, 2010, NSPI filed a depreciation study with the UARB.
INCOME TAXES
Income taxes are determined based on the expected tax treatment of transactions recorded in the consolidated financial statements. In determining income taxes, tax legislation is interpreted in a variety of jurisdictions, the likelihood that future tax assets will be recovered from future taxable income is assessed and assumptions about the expected timing of the reversal of future tax assets and liabilities are made. If interpretations differ from those of tax authorities or if the recovery of future tax assets or timing of reversals is not as anticipated, the provision for income taxes could increase or decrease in future periods. The amount of any such increase or decrease cannot be reasonably estimated.
ASSET RETIREMENT OBLIGATIONS
The company recognizes AROs for property, plant and equipment in the period in which they are incurred if a reasonable estimate of fair value can be determined. The fair value of the liability is described as the amount at which the liability could be settled in a current transaction between willing parties. Expected values are discounted at the risk-free interest rate adjusted to reflect the market’s evaluation of the company’s credit standing. Determining AROs requires estimating the life of the related asset and the costs of activities such as demolition, restoration and remedial work based on present-day methods and technologies. Actual results may differ from these estimates.
GOODWILL IMPAIRMENT ASSESSMENTS
Goodwill represents the excess of the acquisition purchase price for Bangor Hydro, GBPC, ICDU and MAM over the fair values assigned to individual assets acquired and liabilities assumed. Emera is required to perform an impairment assessment annually, or in the interim if an event occurs that indicates the fair value of Bangor Hydro, GBPC, ICDU or MAM may be below its carrying value. Emera performs its annual impairment test as at March 31.
Impairment assessments are based on fair market value assessments. Fair market value is determined by use of net present value financial models that incorporate management’s assumptions about future profitability. There was no impairment provision required in 2010 or 2009.
44 EMERA INC. 2010 ANNUAL FINANCIAL REPORT
Table of Contents
MANAGEMENT’S DISCUSSION AND ANALYSIS
CHANGES IN ACCOUNTING POLICIES
Future Accounting Policy Changes
CHANGEOVER TO UNITED STATES GENERALLY ACCEPTED ACCOUNTING PRINCIPLES
In February 2008, the Canadian Institute of Chartered Accountants (“CICA”) announced CGAAP for publicly accountable enterprises will be replaced by International Financial Reporting Standards (“IFRS”) for fiscal years beginning on or after January 1, 2011. The company began planning its transition to IFRS in 2008 and transition activities progressed on schedule through 2009. In Q4 2009, due primarily to the continued uncertainty around the timing and eventual adoption of a rate-regulated accounting (“RRA”) standard under IFRS, management began reviewing the option of adopting United States Generally Accepted Accounting Principles (“US GAAP”) instead of IFRS. In Q1 2010, Emera’s Board of Directors approved the transition to US GAAP financial reporting standards beginning Q1 2011.
The adoption of US GAAP in Q1 2011 is expected to result in fewer significant changes in the company’s accounting policies than would have been experienced with the adoption of IFRS. Management believes this will result in financial information that is more comparable to the company’s prior years’ financial statements prepared under CGAAP, making them easier for readers to understand.
US GAAP reporting is permitted by Canadian securities laws and the Toronto Stock Exchange (“TSX”) for companies subject to reporting obligations under US securities laws. Emera Inc. plans to file registration statements with the SEC prior to releasing its Q1 2011 financial results. On July 15, 2010, NSPI registered debt securities with the SEC under the US Securities Act of 1933, thereby becoming subject to US reporting obligations. Registration with the SEC will enhance the company’s ability to access US capital markets in the future.
The company’s application of CGAAP currently relies on US GAAP for guidance on the application of RRA. RRA allows the economic impact of regulatory activities to be recognized consistent with the timing that amounts are included in customer rates. The company believes continued recognition of its regulatory assets and liabilities under US GAAP best reflects the effect regulatory activities have on the company’s financial position. More than 90 per cent of the company’s revenues are earned by its wholly owned regulated subsidiaries NSPI, Bangor Hydro and Brunswick Pipeline. Without a RRA standard, a transition to IFRS would likely result in the accounting write-off of the company’s significant regulatory assets and liabilities, and net earnings could be subject to greater volatility on an ongoing basis.
TRANSITION ACTIVITIES
A formal project was established to transition to US GAAP for 2011, register securities of Emera and NSPI with the SEC and prepare both companies to comply with the ongoing reporting requirements of the SEC and requirements of the Sarbanes-Oxley Act (“SOX”). A four-phased project approach was adopted to manage project activities. The project is proceeding on schedule to achieve its required milestones. The following is a brief overview of the activities of each phase and current status. An update on the project’s status and achievement of its key milestones are provided to the company’s Audit Committee on a quarterly basis.
PHASE ONE: PRELIMINARY ASSESSMENT AND PLANNING – COMPLETED
Phase One was substantially completed in May 2010. It involved assessment and planning activities required to develop the initial project plan and identify resource requirements for the project. Internal resources were dedicated to the project to ensure its completion within the required timeline. KPMG LLP, who was assisting with the company’s changeover to IFRS, was engaged to continue providing technical advisory services during the company’s transition to US GAAP. In addition to resourcing activities, the Project Charter, Governance Structure and a Project Management Office were established to support the subsequent phases of the project.
Two key assessments were performed in this phase:
| • | The first assessment compared the most significant differences between US GAAP and CGAAP to determine which areas were most likely to impact the company’s accounting policies and financial reporting. The purpose of this assessment was to highlight areas where detailed analysis of GAAP differences was needed to determine and conclude on the nature and extent of impact. Detailed analysis activities and conclusions on the impact of US GAAP on the company’s accounting policies are discussed under Phase Two. |
| • | The second assessment compared the requirements of the National Instrument 52-109 “Certification of Disclosure in Issuers’ Annual and Interim Filings” (“NI 52-109”) and those of Sections 302 (“SOX 302”) and 404 (“SOX 404”) of the Sarbanes-Oxley Act. The purpose of this assessment was to identify the impact of SOX 302 and SOX 404 on the company’s current NI 52-109 program over disclosure controls and procedures (“DC&P”) and internal control over financial reporting (“ICFR”). |
45
Table of Contents
Consistent with NI 52-109, SOX 302 requires certification by the certifying officers of all publicly traded companies that they have established, maintained and designed DC&P and ICFR and evaluated DC&P. SOX 302 requires a quarterly evaluation of DC&P while NI 52-109 requires an annual evaluation; however, NSPI and Emera are not required to file quarterly 302 certificates with the SEC. Also consistent with NI 52-109, SOX 404 requires that all publicly traded companies must establish ICFR; document, test and maintain those controls and procedures to ensure their effectiveness; and management must report on their evaluation of the effectiveness of ICFR.
Under SOX 404, the company is required to obtain an external audit opinion annually on the design and effectiveness of the company’s ICFR, which is not required under NI 52-109. This was the only significant difference identified between the requirements of NI 52-109 and SOX 404. The first external audit on ICFR is required as of December 31, 2011 for NSPI and as of December 31, 2012 for Emera. Activities being performed to prepare the company for SOX 404 attestation are described below.
PHASE TWO: DETAILED ASSESSMENT, DEVELOPMENT AND SEC REGISTRATION – SUBSTANTIALLY COMPLETED
Phase Two commenced in April 2010. This phase involves registering securities of Emera and NSPI with the SEC and addressing all new requirements related to complying with US GAAP, SOX and SEC reporting obligations.
Detailed analysis was performed on those areas identified in Phase One where significant differences between US GAAP and CGAAP were most likely to impact the company’s accounting policies, financial statements, information systems, internal controls and other business activities. Areas examined included revenue recognition, hedge accounting, RRA, pension and other post-retirement benefits, income taxes, preferred shares and foreign currency. Where differences were identified, prior period financial information is being restated to US GAAP for comparative purposes in 2011. Restatement activities are part of Phase Three.
The company’s financial statements were drafted or “mocked-up” in accordance with US GAAP to identify the financial statement and disclosure impact of transitioning to US GAAP.
NSPI’s regulated accounting policies were updated to reflect the transition to US GAAP. These were approved by the UARB in December 2010.
Based on the work completed in this phase and the company’s conclusion that it is able to continue with its application of RRA under US GAAP, material adjustments to the company’s reported post-transition net earnings were not identified. The ongoing impact of the differences identified between CGAAP and US GAAP are mostly limited to changes in classification and presentation within the financial statements and in the extent of disclosure requirements.
Areas where the financial impact of transitioning to US GAAP is more significant are outlined below. These areas do not represent a complete list of expected changes. The net impact of all adjustments required to restate retained earnings on January 1, 2010 to US GAAP is not expected to be material. However, the net impact of all adjustments required to restate AOCI on January 1, 2010 to US GAAP will be material. The amount of any significant adjustments to retained earnings and AOCI are identified below under the financial statement item to which the adjustments relate.
Pension and other post-employment benefits
Under US GAAP, the company will recognize its unfunded pension obligation as a liability in its financial statements and will need to recognize unamortized gains and losses associated with pension and other post-retirement benefits in AOCI in shareholders’ equity. Currently, under CGAAP, the unamortized amounts together with their impact on the funded status of the pension liability or asset, are disclosed but not recognized.
Financial impact: Restating the amounts under US GAAP results in a $283 million after-tax unamortized loss recorded in AOCI, a $308 million increase to pension liability, an $18 million increase to FIT assets, and a $7 million reduction to retained earnings on January 1, 2010.
Hedge accounting
The company has determined that certain hedging strategies that qualify for hedge accounting under CGAAP do not qualify for the same treatment under US GAAP primarily due to differences in effectiveness testing requirements. Effective for hedges put in place beginning in 2010, the company changed its strategies to ensure compliance with US GAAP prospectively.
Prior to the company’s decision to transition to US GAAP, NSPI, in consultation with interveners and consultants for the UARB, discussed deferral accounting for all of its economic hedges. Based on these discussions and the company’s decision to adopt US GAAP, NSPI filed an amended accounting policy with the UARB requesting deferral accounting for all of its economic hedges. The UARB approved the amended regulatory accounting policy in December 2010, resulting in the deferral of the periodic changes in the fair value of these derivatives so that they impact NSPI’s net earnings in a manner consistent with that achieved if hedge accounting had been applied.
46 EMERA INC. 2010 ANNUAL FINANCIAL REPORT
Table of Contents
MANAGEMENT’S DISCUSSION AND ANALYSIS
Financial impact: NSPI’s amended accounting policy results in a $44 million increase in AOCI and net regulatory assets to restate its economic hedges on January 1, 2010 to US GAAP. The impact of derecognizing hedge accounting on certain economic hedges under US GAAP related to Emera’s other affiliates requires a $7 million decrease to AOCI, an $11 million increase to retained earnings and a $4 million increase to investment in direct finance lease on January 1, 2010.
INCOME TAXES
Enacted tax rates
US GAAP requires that the enacted tax rate be used in measuring current taxes and FIT. Under CGAAP, the tax impact of the Part VI.1 tax deduction related to preferred share dividends is recorded at the substantively enacted tax rates, which is consistent with Canada Revenue Agency’s assessing practice. Under US GAAP, the company will recognize an income tax liability for the difference between the enacted tax rates and the substantively enacted tax rates for the Part VI.1 tax deduction.
Financial impact:Restating the amounts under US GAAP results in a $9 million increase to income tax payable and decrease to retained earnings on January 1, 2010.
Investment tax credits
Under CGAAP, certain investment tax credits related to qualifying scientific research and development expenditures are recorded as a reduction to property, plant and equipment. Under US GAAP, the company will recognize the investment tax credit as a reduction in tax expense.
Financial impact:Restating the amounts under US GAAP results in a $4 million increase to property, plant and equipment and retained earnings on January 1, 2010.
Uncertain tax positions
During 2010, the company revised its estimate of the expected benefit from accelerated tax deductions under CGAAP. A portion of the impact of the 2010 revised estimate is related to the US GAAP guidance for determining the unit of account and resulting expected benefit. As a result, for US GAAP, the company will recognize a portion of the 2010 change in estimate in years prior to January 1, 2010.
Financial impact:Restating the amounts under US GAAP results in a $4 million decrease in income tax payable and increase retained earnings on January 1, 2010.
US GAAP transition adjustments
Under US GAAP, the company will recognize the FIT impact on the US GAAP adjustments for pension and other post-employment benefits and hedge accounting as noted above, and on other US GAAP adjustments to the balance sheet.
Financial impact:As noted above, an $18 million increase to FIT assets is expected as a result of the $301 million ($283 million after-tax) increase in AOCI for pension and post-employment benefits. Other material adjustments are expected to restate FIT assets and liabilities on January 1, 2010 to US GAAP. The amount of these adjustments is still being determined; however, the impact of a change in FIT expense (recoveries) will be deferred to a regulatory asset or liability where the FIT is expected to be included in future rates of regulated subsidiaries. Other than the adjustment noted above, the net impact of income tax adjustments under US GAAP required to restate retained earnings and AOCI on January 1, 2010 is not expected to be material due to rate-regulated accounting.
The company has various agreements with external parties that reference CGAAP as the basis for satisfying financial reporting requirements, including covenant calculations. Emera and NSPI renegotiated their revolving credit facilities with their banking syndicates in June 2010 and in Q4 2010, and both Emera and NSPI reached an agreement with their trustee to bilaterally amend their respective trust indentures by way of supplemental indentures. These amended agreements each allow for US GAAP as the basis for satisfying financial reporting requirements.
The impact of the transition to US GAAP on information systems is minimal.
All Phase Two activities are complete, with the exception of Emera’s registration with the SEC, which is planned for Q1 2011. NSPI’s registration with the SEC was completed in July 2010.
47
Table of Contents
PHASE THREE: IMPLEMENTATION – IN PROGRESS
Phase Three began in July 2010 and involves implementing the changes identified and planned in Phase Two that are necessary to comply with US GAAP in 2011, along with SOX and SEC reporting obligations as they become effective.
2009 and 2010 financial information prepared under CGAAP is being restated to US GAAP for comparative purposes in 2011, with most adjustments now complete and the remainder to be completed in Q1 2011, including restatement of Q4 2010. Reconciliation of prior period financial information from CGAAP to US GAAP, along with other significant transitional disclosure, will be presented in the 2011 financial statements.
The company’s financial reporting processes and consolidation software are being reconfigured to support the preparation of US GAAP financial statements in 2011 and the consolidation of prior period restatements. The required changes are not significant and will be ongoing through Q1 2011.
As of July 15, 2010, NSPI is an SEC registrant and subject to SEC reporting obligations. NSPI is now required to furnish all filings made with the Canadian securities regulatory authorities concurrently with the SEC.
Changes are being implemented to business processes and ICFR to help ensure an efficient SOX 404 attestation process. Changes will be completed in Q1 and Q2 2011 for NSPI and Emera, respectively.
Education and training activities have occurred throughout all project phases. In this phase, education activities are focused on ensuring all personnel and senior management impacted by the transition understand the new requirements and have the skills and expertise necessary to ensure the organization’s on-going ability to report under US GAAP, fulfill its reporting obligations to the SEC and comply with SOX. Members of the company’s Board of Directors participated in education sessions in Q4 2010. Additional education sessions are planned in Q1 2011, including one for members of the company’s Audit Committee to review the financial impact of the transition, prior period restatements and the company’s transitional disclosure.
With the exception of the Q4 2010 restatements, the activities of this phase were originally planned to be substantially completed in December 2010 however, certain implementation activities identified above will be completed in February 2011. These delays do not jeopardize the project’s ability to meet its key milestones, nor the company’s ability to meet its Q1 2011 reporting obligations.
PHASE FOUR: OPERATIONAL SUPPORT – IN PROGRESS
Phase Four began January 2011 and is scheduled to be completed by the end of Q2 2011. The impact of transitioning to US GAAP and complying with SEC reporting obligations and SOX requirements will be fully integrated into the company’s financial reporting processes at that time.
Final transitional activities will be completed in this phase.
Following release of the company’s Q1 2011 financial statements, the project will be formally closed and internal resources currently dedicated to the project will resume responsibility for financial reporting activities within the business.
RECENTLY ISSUED US GAAP ACCOUNTING STANDARDS
As indicated above, beginning with its external reporting in Q1 2011, the company will retrospectively adopt US GAAP as its accounting framework and will no longer prepare its consolidated financial statements under CGAAP. In evaluating the impact of adopting US GAAP, the company has considered US GAAP accounting standards currently in effect through December 31, 2010. In 2011, additional US GAAP standards will become effective and the company will adopt them in accordance with their individual transition guidelines. The identified issued standards that have effective dates in 2011 and may be relevant to the company are set out below.
Revenue recognition
In October 2009, the Financial Accounting Standards Board (“FASB”) issued Accounting Standard Update (“ASU”) 2009-13,Revenue Recognition (Topic 605): Multiple Deliverable Revenue Arrangements. ASU 2009-13 amends existing US GAAP revenue recognition guidance to eliminate the requirement that all undelivered elements have vendor specific objective evidence of selling price (“VSOE”) or third-party evidence of selling price (“TPE”) before an entity can recognize the portion of an overall arrangement fee that is attributable to items that already have been delivered. In the absence of VSOE and TPE for one or more delivered or undelivered elements in a multiple-element arrangement, entities will be required to estimate the selling prices of those elements. The overall arrangement fee will be allocated to each element (both delivered and undelivered items) based on their relative selling prices, regardless of whether those selling prices are evidenced by VSOE or TPE or are based on the entity’s estimated selling price. Application of the “residual method” of allocating an overall arrangement fee between delivered and undelivered elements will no longer be permitted upon adoption of ASU 2009-13. Additionally, the new guidance will require entities to disclose more information about their multiple element revenue arrangements. ASU 2009-13 is effective prospectively for revenue arrangements entered into or materially modified in fiscal years beginning on or after June 15, 2010. The company will adopt ASU 2009-13 effective January 1, 2011 but does not expect that its adoption will have a material impact on its consolidated financial statements.
48 EMERA INC. 2010 ANNUAL FINANCIAL REPORT
Table of Contents
MANAGEMENT’S DISCUSSION AND ANALYSIS
Fair value measurements
In January 2010, the FASB issued ASU 2010-06,Improving Disclosures about Fair Value Measurements. ASU 2010-06 amends FASB Accounting Standards Codification (“ASC”) Topic 820,Fair Value Measurements and Disclosures, to require reporting entities to make new disclosures about recurring or non-recurring fair-value measurements, including significant transfers into and out of Level 1 and Level 2 fair-value measurements and information about purchases, sales, issuances and settlements on a gross basis in the reconciliation of Level 3 fair-value measurements. The ASU also clarifies existing fair-value measurement disclosure guidance about the level of disaggregation, inputs and valuation techniques. Except for the detailed Level 3 roll-forward disclosures, the guidance in the ASU was effective for interim and annual reporting periods beginning after December 15, 2009. The new disclosures about purchases, sales, issuances and settlements in the roll-forward activity for Level 3 fair-value measurements are effective for fiscal years beginning after December 15, 2010. The company will adopt the disclosure requirements of ASU 2010-06 in its 2011 US GAAP financial reporting but does not expect they will have a material impact on its consolidated financial statements.
Goodwill impairment
In December 2010, the FASB issued ASU 2010-28 Intangibles – Goodwill and Other (Topic 350):When to Perform Step 2 of the Goodwill Impairment Test for Reporting Units with Zero or Negative Carrying Amounts. ASU 2010-28 amends ASC 350-20 to modify Step 1 of the goodwill impairment test for reporting units with zero or negative carrying amounts. For those reporting units, an entity is required to perform Step 2 of the goodwill impairment test if it is more likely than not that a goodwill impairment exists. In determining whether it is more likely than not that a goodwill impairment exists, an entity should consider whether there are any adverse qualitative factors indicating that an impairment may exist consistent with the existing guidance in US GAAP. ASU 2010-28 is effective for interim periods and fiscal years beginning on or after December 15, 2010. The company will adopt ASU 2010-28 effective January 1, 2011 but does not expect that its adoption will have a material impact on its consolidated financial statements.
SUMMARY OF QUARTERLY RESULTS
FOR THE QUARTER ENDED MILLIONS OF DOLLARS (EXCEPT EARNINGS PER COMMON SHARE)
| Q4 2010
| Q3 2010
| Q2 2010
| Q1 2010
| Q4 2009
| Q3 2009
| Q2 2009
| Q1 2009
| ||||||||||||||||||||||||
Total revenues | $ | 392.7 | $ | 373.5 | $ | 357.4 | $ | 430.1 | $ | 389.1 | $ | 339.1 | $ | 333.8 | $ | 404.1 | ||||||||||||||||
Net earnings applicable to common shares | 39.6 | 44.8 | 29.6 | 77.1 | 37.5 | 37.3 | 38.1 | 62.8 | ||||||||||||||||||||||||
Earnings per common share – basic | 0.35 | 0.39 | 0.26 | 0.68 | 0.33 | 0.33 | 0.34 | 0.56 | ||||||||||||||||||||||||
Earnings per common share – diluted | 0.34 | 0.39 | 0.26 | 0.66 | 0.33 | 0.33 | 0.33 | 0.53 | ||||||||||||||||||||||||
Quarterly total revenues and net earnings applicable to common shares are affected by seasonality, with Q1 and Q4 the strongest periods, reflecting colder weather and fewer daylight hours at those times of year.
49
Table of Contents
REPORT
MANAGEMENT’S RESPONSIBILITY FOR FINANCIAL REPORTING
The accompanying consolidated financial statements of Emera Inc. and the information in this annual report are the responsibility of management and have been approved by the Board of Directors (“Board”).
The consolidated financial statements have been prepared by management in accordance with Canadian generally accepted accounting principles. When alternative accounting methods exist, management has chosen those it deems most appropriate in the circumstances. Nova Scotia Power Inc., one of Emera’s wholly owned electric utilities and principal subsidiary, is regulated by the Nova Scotia Utility and Review Board, which also examines and approves NSPI’s accounting policies and practices. Emera’s other wholly owned electric utility and subsidiaries, Bangor Hydro Electric Company and Maine Public Service Company, are regulated by the Federal Energy Regulatory Commission and the Maine Public Utilities Commission, which also examine and approve Bangor Hydro Electric Company and Maine Public Service Company’s accounting policies and practices. Emera Brunswick Pipeline Company Ltd., which is wholly owned, is regulated by the National Energy Board.
In preparation of these consolidated financial statements, estimates are sometimes necessary when transactions affecting the current accounting period cannot be finalized with certainty until future periods. Management believes that such estimates, which have been properly reflected in the accompanying consolidated financial statements, are based on careful judgements and are within reasonable limits of materiality. Management has determined such amounts on a reasonable basis in order to ensure that the consolidated financial statements are presented fairly in all material respects. Management has prepared the financial information presented elsewhere in the annual report and has ensured that it is consistent with that in the consolidated financial statements.
Emera Inc. maintains effective systems of internal accounting and administrative controls, consistent with reasonable cost. Such systems are designed to provide reasonable assurance that the financial information is relevant, reliable and accurate, and that Emera Inc.’s assets are appropriately accounted for and adequately safeguarded.
The Board is responsible for ensuring that management fulfils its responsibilities for financial reporting and is ultimately responsible for reviewing and approving the consolidated financial statements. The Board carries out this responsibility principally through its Audit Committee.
The Audit Committee is appointed by the Board, and its members are directors who are not officers or employees of Emera Inc. The Audit Committee meets periodically with management, as well as with the internal auditors and with the external auditors, to discuss internal controls over the financial reporting process, auditing matters and financial reporting issues, to satisfy itself that each party is properly discharging its responsibilities, and to review the annual report, the consolidated financial statements and the external auditors’ report. The Audit Committee reports its findings to the Board for consideration when approving the consolidated financial statements for issuance to the shareholders. The Audit Committee also considers, for review by the Board and approval by the shareholders, the appointment of the external auditors.
The consolidated financial statements have been audited by Ernst & Young LLP, the external auditors, in accordance with Canadian generally accepted auditing standards. Ernst & Young LLP has full and free access to the Audit Committee.
February 11, 2011
|
| |
| “Christopher Huskilson” | “Nancy Tower”, FCA | |
President and Chief Executive Officer | Chief Financial Officer | |


50 EMERA INC. 2010 ANNUAL FINANCIAL REPORT
Table of Contents
AUDITORS’ REPORT
TO THE SHAREHOLDERS OF EMERA INC.
We have audited the accompanying consolidated financial statements of Emera Inc., which comprise the consolidated statement of financial position as at December 31, 2010 and 2009, and the consolidated statement of comprehensive income, consolidated statement of changes in equity and consolidated statement of cash flows for the years then ended, and a summary of significant accounting policies and other explanatory information.
Management’s Responsibility for the Financial Statements
Management is responsible for the preparation and fair presentation of these financial statements in accordance with Canadian generally accepted accounting principles, and for such internal control as management determines is necessary to enable the preparation of financial statements that are free from material misstatement, whether due to fraud or error.
Auditors’ Responsibility
Our responsibility is to express an opinion on these consolidated financial statements based on our audits. We conducted our audits in accordance with Canadian generally accepted auditing standards. Those standards require that we comply with ethical requirements and plan and perform the audits to obtain reasonable assurance about whether the financial statements are free from material misstatement.
An audit involves performing procedures to obtain audit evidence about the amounts and disclosures in the financial statements. The procedures selected depend on the auditors’ judgment, including the assessment of the risks of material misstatement of the financial statements, whether due to fraud or error. In making those risk assessments, the auditor considers internal controls relevant to the entity’s preparation and fair presentation of the financial statements in order to design audit procedures that are appropriate in the circumstances, but not for the purpose of expressing an opinion on the effectiveness of the entity’s internal controls. An audit also includes evaluating the appropriateness of accounting policies used and the reasonableness of accounting estimates made by management, as well as evaluating the overall presentation of the financial statements.
We believe that the audit evidence we have obtained is sufficient and appropriate to provide a basis for our audit opinion.
Opinion
In our opinion, the consolidated financial statements present fairly, in all material respects, the financial position of Emera Inc. as at December 31, 2010 and 2009, and the results of its operations and its cash flows for the years then ended in accordance with Canadian generally accepted accounting principles.
Halifax, Canada |
February 11, 2011 |
|
| “Ernst & Young LLP” |
Chartered Accountants |
51
Table of Contents
EMERA INC.
STATEMENTS OF EARNINGS
YEAR ENDED DECEMBER 31
MILLIONS OF DOLLARS (EXCEPT EARNINGS PER COMMON SHARE)
| 2010
| 2009
| ||||||
Revenue | ||||||||
Electric | $ | 1,436.1 | $ | 1,402.0 | ||||
Finance income from direct financing lease (note 16) | 56.5 | 25.3 | ||||||
Other | 61.1 | 56.2 | ||||||
| 1,553.7 | 1,483.5 | |||||||
Cost of operations | ||||||||
Fuel for generation and purchased power | 718.7 | 583.5 | ||||||
Fuel adjustment (note 5) | (99.0 | ) | 8.5 | |||||
Operating, maintenance and general | 336.1 | 294.4 | ||||||
Provincial, state and municipal taxes | 49.1 | 49.9 | ||||||
Depreciation and amortization | 173.6 | 164.9 | ||||||
Regulatory amortization | 41.3 | 35.7 | ||||||
| 1,219.8 | 1,136.9 | |||||||
| 333.9 | 346.6 | |||||||
Equity earnings (note 7) | 13.6 | 14.0 | ||||||
Financing charges (note 8) | 168.4 | 135.3 | ||||||
Earnings before income taxes and non-controlling interest | 179.1 | 225.3 | ||||||
Income taxes (note 9) | (12.8 | ) | 48.9 | |||||
Net earnings before non-controlling interest | 191.9 | 176.4 | ||||||
Non-controlling interest (note 18) | (2.3 | ) | 0.7 | |||||
Net earnings | 194.2 | 175.7 | ||||||
Preferred share dividends | 3.1 | – | ||||||
Net earnings applicable to common shares | $ | 191.1 | $ | 175.7 | ||||
Earnings per common share – basic (note 11) | $ | 1.68 | $ | 1.56 | ||||
Earnings per common share – diluted (note 11) | $ | 1.65 | $ | 1.52 | ||||
See accompanying notes to the consolidated financial statements.
52 EMERA INC. 2010 ANNUAL FINANCIAL REPORT
Table of Contents
| EMERA INC. | CONSOLIDATED FINANCIAL STATEMENTS |
CONSOLIDATED
BALANCE SHEETS
AS AT DECEMBER 31
MILLIONS OF DOLLARS
| 2010
| 2009
| ||||||
Assets | ||||||||
Current assets | ||||||||
Cash and cash equivalents | $ | 9.4 | $ | 21.8 | ||||
Restricted cash | 59.6 | 1.0 | ||||||
Accounts receivable (note 12) | 396.5 | 413.1 | ||||||
Income tax receivable | 50.7 | 11.0 | ||||||
Inventory (note 13) | 177.8 | 174.5 | ||||||
Prepaid expenses | 9.8 | 7.4 | ||||||
Future income tax assets (note 9) | 28.2 | 46.7 | ||||||
Derivatives in a valid hedging relationship | 28.4 | 26.3 | ||||||
Held-for-trading derivatives | 22.1 | 13.1 | ||||||
| 782.5 | 714.9 | |||||||
Derivatives in a valid hedging relationship | 26.1 | 30.9 | ||||||
Held-for-trading derivatives | 15.3 | 30.7 | ||||||
Other assets (note 14) | 652.1 | 427.4 | ||||||
Future income tax assets (note 9) | 12.9 | 4.4 | ||||||
Goodwill (note 21) | 178.9 | 87.6 | ||||||
Intangibles (note 15) | 103.5 | 92.1 | ||||||
Investments subject to significant influence (note 7) | 238.9 | 218.4 | ||||||
Available-for-sale investments (note 29) | 47.0 | 47.3 | ||||||
Net investment in direct financing lease (note 16) | 488.2 | 476.9 | ||||||
Property, plant and equipment (note 17) | 3,450.7 | 2,933.7 | ||||||
Construction work in progress | 333.0 | 220.2 | ||||||
| 3,783.7 | 3,153.9 | |||||||
| $ | 6,329.1 | $ | 5,284.5 | |||||
53
Table of Contents
EMERA INC.
CONSOLIDATED
BALANCE SHEETS(CONTINUED)
AS AT DECEMBER 31
MILLIONS OF DOLLARS
| 2010
| 2009
| ||||||
Liabilities and Shareholders’ Equity | ||||||||
Current liabilities | ||||||||
Current portion of long-term debt (note 24) | $ | 12.7 | $ | 108.1 | ||||
Short-term debt (note 23) | 228.1 | 300.3 | ||||||
Accounts payable and accrued charges | 399.6 | 305.9 | ||||||
Income tax payable | 8.4 | 9.3 | ||||||
Dividends payable | 1.8 | 1.7 | ||||||
Derivatives in a valid hedging relationship | 8.6 | 61.0 | ||||||
Held-for-trading derivatives | 31.1 | 18.6 | ||||||
| 690.3 | 804.9 | |||||||
Derivatives in a valid hedging relationship | 21.3 | 25.7 | ||||||
Held-for-trading derivatives | 18.0 | 15.8 | ||||||
Future income tax liabilities (note 9) | 359.8 | 194.1 | ||||||
Asset retirement obligations (note 22) | 141.8 | 104.5 | ||||||
Other liabilities (note 14) | 161.7 | 148.1 | ||||||
Long-term debt (note 24) | 3,006.9 | 2,318.4 | ||||||
Preferred shares issued by subsidiary (note 10) | 135.0 | 135.0 | ||||||
Non-controlling interest (note 18) | 20.7 | 32.1 | ||||||
Shareholders’ equity | ||||||||
Common shares (note 25) | 1,136.5 | 1,096.7 | ||||||
Preferred shares (note 26) | 146.7 | – | ||||||
Contributed surplus | 3.7 | 3.6 | ||||||
Accumulated other comprehensive loss | (164.7 | ) | (186.7 | ) | ||||
Retained earnings | 651.4 | 592.3 | ||||||
| 1,773.6 | 1,505.9 | |||||||
| $ | 6,329.1 | $ | 5,284.5 | |||||
Change in accounting estimate (note 2), Contingencies (note 31), Commitments (notes 6, 29 and 32), Guarantees (note 33), Subsequent events (note 35)
See accompanying notes to the consolidated financial statements.
Approved on behalf of the Board of Directors
|
| |
| “Christopher Huskilson” | “John McLennan” | |
President and Chief Executive Officer | Chairman | |

54 EMERA INC. 2010 ANNUAL FINANCIAL REPORT
Table of Contents
| EMERA INC. | CONSOLIDATED FINANCIAL STATEMENTS |
CONSOLIDATED
STATEMENTS OF CASH FLOWS
YEAR ENDED DECEMBER 31
MILLIONS OF DOLLARS
| 2010
| 2009
| ||||||
Operating activities | ||||||||
Net earnings | $ | 194.2 | $ | 175.7 | ||||
Non-cash items: | ||||||||
Depreciation and amortization | 173.6 | 164.9 | ||||||
Amortization of other assets | 16.9 | 18.8 | ||||||
Equity earnings | (13.6 | ) | (14.0 | ) | ||||
Fuel adjustment (note 5) | (99.0 | ) | 8.5 | |||||
Regulatory amortization | 41.3 | 35.7 | ||||||
Allowance for funds used during construction | (22.2 | ) | (28.9 | ) | ||||
Interest (recovery) expense on deferral of FAM | (3.8 | ) | 1.4 | |||||
Future income taxes (note 9) | 34.7 | (2.1 | ) | |||||
Post-retirement benefits | (11.4 | ) | (16.4 | ) | ||||
Non-controlling interest | (2.3 | ) | 0.7 | |||||
Changes in fair value of derivatives instruments | 26.0 | (19.8 | ) | |||||
Other non-cash operating items | (6.1 | ) | 3.4 | |||||
Other cash operating items | 7.8 | 8.0 | ||||||
| 336.1 | 335.9 | |||||||
Change in non-cash operating working capital (note 27) | 80.3 | (25.7 | ) | |||||
Net cash provided by operating activities | 416.4 | 310.2 | ||||||
Investing activities | ||||||||
Property, plant and equipment | (527.2 | ) | (326.6 | ) | ||||
Intangibles | (14.2 | ) | (12.5 | ) | ||||
Increase in restricted cash | (58.4 | ) | (0.3 | ) | ||||
Retirement spending net of salvage | (16.3 | ) | (8.9 | ) | ||||
Acquisitions (note 18) | (267.0 | ) | (36.7 | ) | ||||
Net investment in direct financing lease | (10.8 | ) | (53.4 | ) | ||||
Investments | (0.9 | ) | 71.2 | |||||
Net cash used in investing activities | (894.8 | ) | (367.2 | ) | ||||
Financing activities | ||||||||
Retirements of long-term debt | (346.8 | ) | (130.0 | ) | ||||
Issuance of long-term debt | 542.3 | 725.0 | ||||||
Increase (decrease) in short-term debt | 232.5 | (279.6 | ) | |||||
Issuance of common shares | 39.3 | 14.9 | ||||||
Issuance of preferred shares | 145.2 | – | ||||||
Dividends on common shares | (132.0 | ) | (115.8 | ) | ||||
Dividends on preferred shares | (3.0 | ) | – | |||||
Redemption of preferred shares issued by a subsidiary | – | (125.0 | ) | |||||
Other financing activities | (11.3 | ) | (19.0 | ) | ||||
Net cash provided by financing activities | 466.2 | 70.5 | ||||||
Effect of exchange rate changes on cash and cash equivalents | (0.2 | ) | (3.9 | ) | ||||
(Decrease) increase in cash and cash equivalents | (12.4 | ) | 9.6 | |||||
Cash and cash equivalents, beginning of year | 21.8 | 12.2 | ||||||
Cash and cash equivalents, end of year | $ | 9.4 | $ | 21.8 | ||||
Cash and cash equivalents consists of | ||||||||
Cash | $ | 9.4 | $ | 21.5 | ||||
Short-term investments | – | 0.3 | ||||||
Cash and cash equivalents, end of year | $ | 9.4 | $ | 21.8 | ||||
Supplemental disclosure of cash paid (recovered) | ||||||||
Interest | $ | 149.7 | $ | 127.4 | ||||
Income and capital taxes | $ | (2.1 | ) | $ | 49.0 | |||
See accompanying notes to the consolidated financial statements.
55
Table of Contents
EMERA INC.
CONSOLIDATED STATEMENTS OF
CHANGES IN SHAREHOLDERS’ EQUITY
FOR THE YEAR ENDED DECEMBER 31, 2010 MILLIONS OF DOLLARS
| Common Shares
| Preferred Shares
| Contributed Surplus
| Accumulated Other Comprehensive (Loss) Income (“AOCI”)
| Retained Earnings
| Total AOCI and Retained Earnings
| ||||||||||||||||||
Balance, December 31, 2009 | $ | 1,096.7 | – | $ | 3.6 | $ | (186.7 | ) | $ | 592.3 | $ | 405.6 | ||||||||||||
Comprehensive income: | ||||||||||||||||||||||||
Net earnings | – | – | – | – | 194.2 | 194.2 | ||||||||||||||||||
Net gains on derivatives in a valid hedging relationship | – | – | – | 10.7 | – | 10.7 | ||||||||||||||||||
Reclassification of hedging losses included in income | – | – | – | 61.5 | – | 61.5 | ||||||||||||||||||
Reclassification of hedging gains included in inventory | – | – | – | (17.5 | ) | – | (17.5 | ) | ||||||||||||||||
Unrealized foreign exchange loss on translation of self-sustaining foreign operations | – | – | – | (32.7 | ) | – | (32.7 | ) | ||||||||||||||||
Total comprehensive income | – | – | – | 22.0 | 194.2 | 216.2 | ||||||||||||||||||
Issuance of preferred shares (note 26) | – | $ | 146.7 | – | – | – | – | |||||||||||||||||
Dividends declared on common shares | – | – | – | – | (132.0 | ) | (132.0 | ) | ||||||||||||||||
Dividends declared on preferred shares | – | – | – | – | (3.1 | ) | (3.1 | ) | ||||||||||||||||
Dividends paid by subsidiaries to non-controlling interest | – | – | – | – | – | – | ||||||||||||||||||
Common shares issued under purchase plans | 32.8 | – | – | – | – | – | ||||||||||||||||||
Senior management stock options exercised | 6.0 | – | (0.5 | ) | – | – | – | |||||||||||||||||
Stock option expense | – | – | 0.6 | – | – | – | ||||||||||||||||||
Other share-based compensation | 1.0 | – | – | – | – | – | ||||||||||||||||||
Balance, December 31, 2010 | $ | 1,136.5 | $ | 146.7 | $ | 3.7 | $ | (164.7 | ) | $ | 651.4 | $ | 486.7 | |||||||||||
FOR THE YEAR ENDED DECEMBER 31, 2009 MILLIONS OF DOLLARS
| Common Shares
| Contributed Surplus
| AOCI
| Retained Earnings
| Total AOCI and Retained Earnings
| |||||||||||||||||||
Balance, December 31, 2008 | $ | 1,081.4 | $ | 3.4 | $ | (69.2 | ) | $ | 532.4 | $ | 463.2 | |||||||||||||
Comprehensive income: | ||||||||||||||||||||||||
Net earnings | – | – | – | 175.7 | 175.7 | |||||||||||||||||||
Net losses on derivatives in a valid hedging relationship | – | – | (99.9 | ) | – | (99.9 | ) | |||||||||||||||||
Reclassification of hedging losses included in income | – | – | 33.2 | – | 33.2 | |||||||||||||||||||
Reclassification of hedging losses included in inventory | – | – | 29.3 | – | 29.3 | |||||||||||||||||||
Unrealized foreign exchange loss on translation of self-sustaining foreign operations | – | – | (80.4 | ) | – | (80.4 | ) | |||||||||||||||||
Other | – | – | 0.3 | – | 0.3 | |||||||||||||||||||
Total comprehensive (loss) income | – | – | (117.5 | ) | 175.7 | 58.2 | ||||||||||||||||||
Dividends declared on common shares | – | – | – | (115.8 | ) | (115.8 | ) | |||||||||||||||||
Dividends paid by subsidiaries to non-controlling interest | – | – | – | – | – | |||||||||||||||||||
Common shares issued under purchase plans | 8.7 | – | – | – | – | |||||||||||||||||||
Senior management stock options exercised | 5.8 | (0.4 | ) | – | – | – | ||||||||||||||||||
Stock option expense | – | 0.6 | – | – | – | |||||||||||||||||||
Other share-based compensation | 0.8 | – | – | – | – | |||||||||||||||||||
Balance, December 31, 2009 | $ | 1,096.7 | $ | 3.6 | $ | (186.7 | ) | $ | 592.3 | $ | 405.6 | |||||||||||||
See accompanying notes to the consolidated financial statements.
| 56 | EMERA INC. 2010 ANNUAL FINANCIAL REPORT |
Table of Contents
EMERA INC.
FINANCIAL STATEMENTS
December 31, 2010 and 2009
1. SUMMARY OF SIGNIFICANT ACCOUNTING POLICIES
Emera Inc. (“Emera” or “the Company”), incorporated in the Province of Nova Scotia, is engaged in the production and sale of electric energy and transportation of natural gas through its principal subsidiaries, Nova Scotia Power Inc. (“NSPI”), Bangor Hydro Electric Company (“Bangor Hydro”), Maine Public Service Company (“MPS”), Grand Bahama Power Company Limited (“GBPC”) and Emera Brunswick Pipeline Company Ltd. (“Brunswick Pipeline”).
NSPI, created through the privatization in 1992 of the crown corporation Nova Scotia Power Corporation, is a fully integrated regulated electric utility and the primary electricity supplier in Nova Scotia. NSPI is a public utility as defined under the Public Utilities Act of Nova Scotia (“Act”) and is subject to regulation under the Act by the Utility and Review Board (“UARB”). The Act gives the UARB authority over NSPI’s operations and expenditures. Electricity rates for NSPI’s customers are subject to UARB approval. NSPI is not subject to an annual rate review process, but rather participates in hearings from time to time at NSPI’s or the regulator’s request.
NSPI’s accounting policies are subject to examination and approval by the UARB.
NSPI is regulated under a cost-of-service model, with rates set to cover prudently incurred costs of providing electricity service to customers, and provide a reasonable return to investors. NSPI’s regulated return on equity (“ROE”) range for 2010 was 9.1 per cent to 9.6 per cent on an allowed common equity component up to 40 per cent of NSPI’s total regulated capitalization. Beginning January 1, 2009, NSPI implemented a Fuel Adjustment mechanism which allows NSPI to recover all prudent fuel cost from customers. This allows NSPI risk profile to be reduced as the timeliness and certainty of full fuel recovery is managed. The reduction of the risk due to less fuel volatility has allowed NSPI to manage the non-fuel rate requirement more strategically.
In January 2010, NSPI reached an agreement with stakeholders on its calculation of regulated ROE. The agreement establishes that NSPI will continue to use actual capital structure, actual equity and actual net earnings to calculate actual annual regulated ROE. The agreement was approved by the UARB. The UARB has set, as a condition, that NSPI will maintain its average actual regulated annual common equity at a level no higher than 40 per cent beginning in 2010 and until the next general rate case.
Bangor Hydro’s core business is the transmission and distribution (“T&D”) of electricity. Electricity is deregulated in Maine, and several suppliers compete to provide customers with the commodity that is delivered through the Bangor Hydro T&D network. In addition to the T&D network, Bangor Hydro has certain regulatory assets (stranded costs), which arose through the electricity industry restructuring, and as a result of rate and accounting orders issued by its regulators. Approximately 44 per cent of Bangor Hydro’s electric rates represent distribution services, 11 per cent relate to stranded costs recoveries, and 45 per cent to transmission service. The rates for each element are established in distinct regulatory proceedings. The transmission operations are regulated by the Federal Energy Regulatory Commission (“FERC”), and the distribution operations and stranded costs are regulated by the Maine Public Utilities Commission (“MPUC”). Bangor Hydro’s accounting policies are subject to examination and approval by the FERC and the MPUC.
Bangor Hydro operates under a traditional cost-of-service regulatory structure. In December 2007, the MPUC approved an increase of approximately two per cent in distribution rates effective January 1, 2008. The allowed ROE used in setting these distribution rates was 10.2 per cent, with a common equity component of 50 per cent.
In December 2007, the MPUC issued an order approving an approximately 39 per cent reduction in stranded cost rates for the three-year period beginning March 1, 2008. The allowed ROE used in setting the new stranded cost rates is 8.5 per cent. Prior to that, stranded cost rates provided for an allowed ROE of ten per cent. Transmission rates are set by the FERC annually on June 1, based upon a formula that utilizes prior year actual transmission investments and expenses, adjusted for current year forecasted transmission investments and expenses. The allowed ROE for transmission operations ranges from 11.14 per cent for low voltage local transmission up to 12.64 per cent for high voltage regionally funded transmission developed as a result of the regional system plan.
Maine & Maritimes Corporation (“MAM”) was acquired on December 21, 2010. Located in northern Maine, MAM’s core business is also the transmission and distribution of electricity through its regulated electric utility, MPS. Similar to Bangor Hydro, in addition to its T&D network, MPS has net regulatory assets (stranded costs). Approximately 57 per cent of MPS’s electric rates represent distribution services, 34 per cent relate to stranded cost recoveries, and nine per cent to transmission services. The rates for each element are established in distinct regulatory proceedings. The transmission operations are regulated by the FERC, and the distribution operations and stranded costs are regulated by the MPUC. MPS’s accounting policies are subject to examination and approval by the FERC and the MPUC.
MPS operates under a traditional cost-of-service regulatory structure. In July 2006, the MPUC approved an increase of approximately 11 per cent in distribution rates, effective July 15, 2006. The allowed ROE used in setting these distribution rates was 10.2 per cent, with a common equity component of 50 per cent.
In March 2010, the MPUC issued an order approving a continuation of the levelized stranded cost rates established in rate orders in 2003 and 2006. These rates are in effect for the two-year rate effective period January 1, 2010 through December 31, 2011. The allowed ROE used in setting the new stranded costs was 9.4 per cent in 2010 and 8.6 per cent in 2011, down from the 10.2 per cent ROE allowed in the 2006 stranded cost rate order.
57
Table of Contents
Transmission rates are set annually through the Open Access Transmission Tariff (“OATT”). Rates derived from the previous calendar year’s results go into effect June 1 for wholesale customers and July 1 for retail customers. The allowed ROE for transmission operations is 10.5 per cent, and is based on the actual common equity. The rates under the 2010 OATT went into effect June 1, 2010 for wholesale customers and July 1, 2010 for retail customers. However, the 2010 OATT has not yet been settled, and accordingly the actual rates allowed for the 2010–2011 rate effective period could differ from the rates currently being charged.
On December 22, 2010, Emera purchased a 50 per cent interest in GBPC and an additional 10.7 per cent interest in ICD Utilities Limited (“ICDU”), owner of the remaining 50 per cent interest in GBPC, bringing Emera’s total ownership of GBPC to 80.4 per cent. Emera has determined it has control of GBPC through the combination of both direct and indirect interests. GBPC is an integrated utility with 19,000 customers on Grand Bahama Island and has 137 megawatts (“MW”) of installed oil-fired capacity. The Grand Bahama Port Authority regulates the utility and has granted GBPC a licensed, regulated and exclusive franchise to produce, transmit and distribute electricity on the island until 2054. There is a fuel pass-through mechanism and flexible tariff adjustment policies to ensure that costs are recovered and a reasonable return earned. GBPC is authorized by the Port Authority to adjust fuel costs included in its rates to the extent the weighted average cost of fuel delivered into GBPC’s power plant storage facilities exceeds or is less than $20 Bahamian dollars per barrel.
Brunswick Pipeline, a $485 million, 145-kilometre pipeline carrying re-gasified liquefied natural gas (“LNG”), delivers natural gas from the Canaport™ LNG import terminal near Saint John, New Brunswick to markets in the northeastern United States. The pipeline went into service on July 16, 2009. The pipeline travels through southwest New Brunswick and connects with the Maritimes and Northeast Pipeline (“M&NP”) at the Canada/US border near Baileyville, Maine.
Canaport™ LNG is a partnership of Repsol YPF, S.A. (“Repsol”) and Irving Oil Limited. Emera has negotiated a 25-year firm service agreement with Repsol Energy Canada to transport natural gas through the Brunswick Pipeline. Toll rates were negotiated to achieve a return on project equity in the range of 11 per cent to 14 per cent. The National Energy Board (”NEB”), which regulates Brunswick Pipeline, has classified it as a Group 2 pipeline.
Emera follows Canadian generally accepted accounting principles (“CGAAP”). The accounting policies approved by the regulators of NSPI, Bangor Hydro, MPS and Brunswick Pipeline may differ from CGAAP for non-rate-regulated companies in that the timing of recognition of certain revenues and expenses in these operations may differ from that otherwise expected under CGAAP. Where the differences between CGAAP and CGAAP for rate-regulated companies are considered significant, disclosure of the policy has been made in these notes to the consolidated financial statements.
A. CONSOLIDATION
The consolidated financial statements include the accounts of Emera Inc. and its subsidiaries. Intercompany transactions and accounts have been eliminated.
B. MEASUREMENT UNCERTAINTY
The preparation of financial statements in accordance with CGAAP requires management to make estimates and assumptions that affect the reported amounts of assets and liabilities at the date of the financial statements and the reported amounts of revenues and expenses during the reporting periods. Estimates and assumptions are based upon historical experience, current conditions and assumptions believed to be reasonable at the time the estimate is made. Due to changing circumstances and the inherent uncertainty in making estimates, actual results may differ significantly from current estimates. Estimates are reviewed periodically, with any resulting adjustments reported in earnings in the period they arise.
The most significant estimates include: measurement of property, plant and equipment depreciation rates (note 1f), intangible assets amortization rates (note 1g), post-employment benefits (note 4), income taxes (note 9), accounts receivable (note 12), of regulatory assets and liabilities (note 14), asset retirement obligations (note 22) financial instruments (note 29) and contingencies (note 31). Actual results may differ from these estimates.
58 EMERA INC. 2010 ANNUAL FINANCIAL REPORT
Table of Contents
NOTES TO THE CONSOLIDATED FINANCIAL STATEMENTS
C. REVENUE RECOGNITION
The Company’s revenue recognition policy is as follows:
| • | Electric: Revenues are recognized on the accrual basis, which includes an estimate of electricity consumed by customers in the year but billed subsequent to year-end. |
| • | Finance income from direct financing lease: Under the direct financing lease method, the Company records the net investment in a lease, which consists of the sum of the minimum lease payments, estimated executory costs less the unearned income. The difference between the gross investment and the cost of the leased item for direct financing lease is recorded as unearned income at the inception of the lease. The unearned income is recognized in income over the life of the lease using a constant rate of interest equal to the internal rate of return on the lease. |
| • | Energy Marketing: Derivatives that are not entered into for hedging purposes are recognized at fair market value at year-end. |
| • | Other: Revenues are recognized on the accrual basis, which includes an estimate for services performed and goods delivered during the year but billed subsequent to year-end. |
| • | Unearned revenue is recognized as “Other liabilities”. |
Electric revenues generated by NSPI, Bangor Hydro and MPS are recognized at rates set by their respective regulators. The Company is unable to determine the effect the absence of rate regulation would have on electric revenue.
D. ALLOWANCE FOR FUNDS USED DURING CONSTRUCTION
Accounting for the impact of rate regulation:
In accordance with their rate-regulated accounting policies, NSPI, Bangor Hydro, MPS and Brunswick Pipeline provide for the cost of financing construction work in progress by including an allowance for funds used during construction (“AFUDC”) as an addition to the cost of property constructed, using a weighted average cost-of-capital. AFUDC is included in “Property, plant and equipment”, “Intangibles”, “Construction work in progress” and “Net investment in direct financing lease” for financial reporting purposes and is charged to operations through depreciation over the service life of the related assets and recovered through future revenues and through financing income from direct financing lease. Since AFUDC includes not only an interest component, but also an equity component, it exceeds the amount that could be capitalized in the absence of rate-regulated accounting policies.
E. REGULATORY AMORTIZATION
Accounting for the impact of rate regulation:
In December 2010, the UARB granted NSPI approval to defer certain tax benefits related to renewable energy projects arising in 2010 through an increase in regulatory amortization. The UARB will convene a proceeding in 2011 to discuss how this deferral will be applied. In the absence of UARB approval, 2010 earnings would have been $14.5 million higher.
NSPI has a regulatory asset related to pre-2003 income taxes that have been paid, but not yet recovered from customers. This circumstance arose when NSPI claimed capital cost allowance (“CCA”) deductions in its income tax returns that were ultimately disallowed by a decision of the Supreme Court of Canada. NSPI applied to the regulator to include recovery of these costs in customer rates. The UARB approved recovery of this regulatory asset over eight years, commencing April 1, 2007.
In January 2010, NSPI reached an agreement with stakeholders on its calculation of regulated ROE. The agreement includes a provision which provides the Company with flexibility in its amortization of the pre-2003 income taxes to accelerate additional amortization amounts in current periods and subsequently reduce amounts in future periods. In the absence of UARB approved recovery, the liability would have been expensed when incurred. More details are provided in note 14.
The UARB agreed to allow NSPI to defer taxes not reflected in rates for the period January 1, 2005 until April 1, 2005, the date when new rates became effective. The UARB approved recovery of this regulatory asset over eight years, commencing April 1, 2007.
The UARB agreed to allow NSPI to defer demand side management program expenses for the period January 1, 2008 until December 31, 2009. The UARB approved recovery of this regulatory asset over six years commencing January 1, 2009.
The UARB agreed to allow NSPI to defer vegetation management spending of $2.0 million in 2008 to be recovered in rates in a future period. The period of recovery of this asset will be determined during the next general rate case.
In the absence of UARB approved deferrals for taxes, demand side management and vegetation management expenses would have been expensed as incurred. More details are provided in note 14.
In accordance with rate and accounting orders issued by the MPUC, Bangor Hydro and MPS have recorded regulatory assets and liabilities on their balance sheets. These regulatory assets and liabilities are being amortized over varying lives expiring through to 2018 through charges to earnings. These regulatory assets and liabilities are included in “Other assets” and “Other liabilities” and include costs related to restructuring of purchased power contracts, the Seabrook nuclear project, decommissioning costs for Maine Yankee, obligations to Hydro-Québec, and the stranded cost revenue requirement levelizer, and are described in more detail in note 14.
59
Table of Contents
F. PROPERTY, PLANT AND EQUIPMENT
Property, plant and equipment are recorded at original cost, net of contributions in aid of construction, including energy tax credits.
Depreciation is determined by the straight-line method, based on the estimated remaining service lives of the depreciable assets in each category. The service lives of regulated assets are determined based on formal depreciation studies, which require UARB approval or FERC and MPUC approvals. The estimated weighted average service life for the Company’s unregulated general assets is seven years (2009 –9 years). Unregulated generation assets have an estimated weighted average service life of 35 years (2009 – 33 years).
When indicators of impairment exist, the Company determines whether the net carrying amount of property, plant and equipment is recoverable from future undiscounted cash flows. Factors which could indicate impairment include significant changes in regulation, a change in the Company’s strategy or underperformance relative to projected future operating results.
Accounting for the impact of rate regulation:
During 2003, following completion of a depreciation study and a negotiated agreement with stakeholders, NSPI’s regulator approved new depreciation rates which were to be phased in over four years beginning in 2004. In the decision on NSPI’s 2005 rate application, the UARB delayed the phase-in of year-two rates for one year. In the decision on NSPI’s 2006 rate application, the UARB approved restarting of the phase-in including year-two in 2006 rates. In its February 2007 decision, the UARB postponed the scheduled year-three phase-in of increased depreciation rates until the next rate application. In its November 2008 decision, the UARB approved the year-three phase-in effective January 1, 2009.
Absent consideration of growth in plant-in-service, the phase-in of new depreciation rates will increase depreciation expense by a cumulative increase of $20 million over the phase-in period. In the absence of UARB approval of depreciation rates, NSPI would be required to set rates based on management’s best estimates of useful lives.
The average rates for the major categories of plant-in-service are summarized as follows:
FUNCTION
| 2010
| 2009
| ||||||
Generation | ||||||||
Thermal | 2.50% | 2.50% | ||||||
Gas turbines | 2.47% | 2.47% | ||||||
Combustion turbines | 3.33% | 3.33% | ||||||
Hydroelectric | 1.51% | 1.51% | ||||||
Wind turbines | 5.00% | 5.00% | ||||||
Transmission | 2.76% | 2.76% | ||||||
Distribution | 4.15% | 4.15% | ||||||
General plant | 7.07% | 7.07% | ||||||
General plant under capital lease | 13.18% | 14.25% | ||||||
Weighted average depreciation rate | 3.00% | 3.13% | ||||||
Bangor Hydro’s depreciation is determined by the straight-line method, based on the estimated service lives of the depreciable assets in each category. In 2004, Bangor Hydro implemented the results of a depreciation study that was approved by its regulators.
The estimated average service lives in years for the major categories of plant-in-service are summarized as follows:
FUNCTION
| 2010
| 2009
| ||||||
Transmission | 44 | 45 | ||||||
Distribution | 35 | 35 | ||||||
Other | 17 | 16 | ||||||
Weighted average service life | 38 | 36 | ||||||
60 EMERA INC. 2010 ANNUAL FINANCIAL REPORT
Table of Contents
NOTES TO THE CONSOLIDATED FINANCIAL STATEMENTS
MPS’s depreciation is determined by the straight-line method, based on the estimated service lives of the depreciable assets in each category. In 2007, MPS implemented the results of a depreciation study approved by its regulators.
The estimated average service lives in years for the major categories of plant-in-service are summarized as follows:
FUNCTION
| 2010
| |||
Transmission | 46 | |||
Distribution | 31 | |||
Other | 28 | |||
Weighted average service life | 33 | |||
In accordance with regulator-approved accounting policies, when depreciable property, plant and equipment of NSPI, Bangor Hydro and MPS are replaced or retired, the original cost plus any removal costs incurred (net of salvage) are charged to accumulated depreciation with no gain or loss reflected in results of operations. Gains and losses will be charged to results of operation in the future through adjustments to depreciation expense. In the absence of regulator-approved accounting policies, gains and losses on the disposition of property, plant and equipment would be charged to net earnings as incurred.
G. INTANGIBLE ASSETS
Intangible assets consist primarily of land rights and computer software. Amortization is determined by the straight-line method, based on the estimated remaining service lives of the depreciable assets in each category. The service lives of regulated assets are determined based on formal depreciation studies, which require the appropriate regulator’s approval as discussed in property, plant and equipment in note 1f. The estimated weighted average service life for the Company’s intangible assets is 54 years (2009 – 57 years).
When indicators of impairment exist, the Company determines whether the net carrying amount of the intangible assets is recoverable from future undiscounted cash flows. Factors which could indicate impairment exists include significant changes in regulation, a change in the Company’s strategy or underperformance relative to projected future operating results.
Accounting for the impact of rate regulation:
In the absence of UARB approval of amortization rates, NSPI would be required to set rates based on management’s best estimates of useful lives. The average rates for the major categories are summarized as follows:
FUNCTION
| 2010
| 2009
| ||||||
Transmission | 1.21% | 1.21% | ||||||
Distribution | 1.57% | 1.57% | ||||||
Other | 12.16% | 12.03% | ||||||
Weighted average amortization rate | 4.67% | 3.66% | ||||||
In the absence of the MPUC’s approval of amortization rates, Bangor Hydro would be required to set rates based on management’s best estimates of useful lives. The average rates for the major categories are summarized as follows:
FUNCTION
| 2010
| 2009
| ||||||
Distribution | 1.43% | 1.41% | ||||||
Other | 14.10% | 12.36% | ||||||
Weighted average amortization rate | 9.30% | 8.81% | ||||||
61
Table of Contents
In the absence of the MPUC’s approval of amortization rates, MPS would also be required to set rates based on management’s best estimates of useful lives.
The average rates for the major categories are summarized as follows:
FUNCTION
| 2010
| |||
Transmission | 1.20% | |||
Distribution | 0.70% | |||
Other | 21.76% | |||
Weighted average amortization rate | 14.72% | |||
H. CAPITALIZATION POLICY
Capital assets of the Company include labour, materials and other non-labour costs directly attributable to the capital activity. In addition, overhead costs that contribute to the capital program are allocated to capital projects. These costs include corporate costs such as finance, information technology, management and other support functions, employee benefits, insurance, inventory costs, and fleet operating and maintenance costs. The Company calculates an application rate and only eligible operating expenditures are used in the calculation. The Company applies overhead costs based on direct labour costs. The application rate varies depending on the type of capital expenditure. In addition, Bangor Hydro and MPS apply inventory overhead based on inventory issued to the project, and Bangor Hydro applies general and administrative overhead based upon non-labour charges.
I. LEASES
Leases that substantially transfer all the benefits and risks of ownership of property, plant and equipment to the Company, or otherwise meet the criteria for capitalizing a lease under CGAAP, are accounted for as capital leases. An asset is recognized at the time a capital lease is entered into together with its related long-term obligation. Property, plant and equipment recognized under capital leases are depreciated on the same basis as described in note 1f. Payments on operating leases are expensed as incurred.
J. INCOME TAXES AND INVESTMENT TAX CREDITS
Emera follows the future income tax method of accounting for income taxes. The difference between the tax basis of assets and liabilities and their carrying value on the balance sheet is used to calculate future tax assets and liabilities. The future tax assets and liabilities have been measured using substantively enacted tax rates that will be in effect when the differences are expected to reverse.
Investment tax credits arise as a result of incurring qualifying scientific research and development expenditures and are recorded in the year as a reduction from the related expenditures where there is reasonable assurance of collection.
Accounting for the impact of rate regulation:
In accordance with rate-regulated accounting, NSPI and Brunswick Pipeline defer any future income taxes from the statements of earnings and AOCI to a regulatory asset or liability where the future income taxes are expected to be included in future rates and tolls respectively. Bangor Hydro and MPS use the future income tax method where allowed for ratemaking purposes. NSPI, Bangor Hydro, MPS and Brunswick Pipeline would be required to recognize all future income tax expense and recovery in the absence of their regulator-approved accounting policies. More details are provided in note 9.
62 EMERA INC. 2010 ANNUAL FINANCIAL REPORT
Table of Contents
NOTES TO THE CONSOLIDATED FINANCIAL STATEMENTS
K. EMPLOYEE FUTURE BENEFITS
Pension obligations, and obligations associated with non-pension post-retirement benefits, such as health benefits to retirees and retirement awards, are actuarially determined using the projected benefit method pro-rated on services and management’s best estimate assumptions. The accrued benefit obligation is valued based on market interest rates at the valuation date.
Pension fund asset values are calculated using market values at year-end. The expected return on pension assets is determined based on market-related values. The market-related values are determined in a rational and systematic manner so as to recognize investment gains and losses, relative to the assumed rate of return, over a five-year period.
Adjustments to the accrued benefit obligation arising from plan amendments are amortized on a straight-line basis over the expected years of future service to the full eligibility date for active employees.
For any given year, when the net actuarial gain (loss), less the actuarial gain (loss) not yet included in the market-related value of plan assets, exceeds ten per cent of the greater of the accrued benefit obligation and the market-related value of the plan assets, an amount equal to the excess divided by the average remaining service period (“ARSP”) is amortized on a straight-line basis. For NSPI, the ARSP of the active employees is nine years as at December 31, 2010 and 2009. For Bangor Hydro, this excess is amortized on a straight-line basis over the expected ARSP, in accordance with ratemaking purposes, which is 11 years as at December 31, 2010 and 2009. At December 31, 2010, MPS has no actuarial gains or losses not yet included in the market-related value of the plan assets. For Emera Inc., the ARSP of the active employees is ten years as at December 31, 2010 (2009 – 11 years).
On January 1, 2000, Emera adopted the accounting standard on employee future benefits using the prospective application method. The transitional obligation (asset) resulting from the initial application is amortized on a linear basis over 13 years, which was the expected ARSP of active employees at the transition date.
The difference between benefit cost and pension funding is recorded as “Other assets” or “Other liabilities” on the balance sheet.
L. SHARE-BASED COMPENSATION
The Company has several share-based compensation plans: a common share option plan for senior management, an employee common share purchase plan, a deferred share unit plan, and a performance share unit plan (formerly called restricted share unit plan). The Company accounts for its plans in accordance with the fair-value-based method of accounting for share-based compensation.
M. CASH AND CASH EQUIVALENTS
Short-term investments, which consist of money market instruments with maturities of three months or less, are considered to be cash equivalents and are recorded at cost, which approximates current market value. There were no short-term investments outstanding at December 31, 2010. The 2009 effective interest rate was 0.55 per cent.
N. INVENTORY
Inventories are measured at the lower of cost and net realizable value. The Company uses the weighted average method to determine the cost of inventory.
O. DEBT FINANCING COSTS
Financing costs pertaining to debt issues are amortized over the life of the related debt using the effective interest method.
63
Table of Contents
P. DERIVATIVE FINANCIAL AND COMMODITY INSTRUMENTS
The Company classifies financial assets and financial liabilities as held-for-trading, available-for-sale, loans and receivables, other financial liabilities or derivatives in valid hedging relationships. All financial instruments are initially recorded at fair value on the consolidated statement of financial position. Subsequent measurements of the financial instruments are based on their classification.
Held-for-trading (“HFT”) derivative financial assets and liabilities consist mainly of foreign exchange forward contracts, interest caps and collars, coal, oil and gas options; swaps; and natural gas contracts. The Company has not designated any non-derivative financial assets or liabilities as held-for-trading. HFT financial instruments are initially recorded at their fair value. The Company has classified its derivatives not in valid hedging relationships as held-for-trading and recognizes changes in fair value of its HFT derivatives in earnings of the reporting period.
The available-for-sale investments are recognized at fair value, with changes in those fair values recorded in “Other comprehensive income” unless actively quoted prices are not available for fair value measurement, in which case available-for-sale investments are measured at cost.
Loans and receivables include cash and cash equivalents and accounts receivable and are measured at amortized cost using the effective interest method. Gains and losses are included in earnings and recorded in “Operating, maintenance and general expenses”.
Other financial liabilities, which include accounts payable and accrued charges, preferred shares issued by a subsidiary, short-term debt and long-term debt, are recognized at amortized cost. Preferred share dividends paid by a subsidiary are recognized using the effective interest method. Interest expense and debt financing expenses related to the Company’s long-term debt and short-term debt are recognized using the effective interest method.
Derivatives in valid hedging relationships are categorized as cash flow hedges and fair value hedges. The Company uses cash flow hedges to manage changes in commodity prices, foreign exchange rates and interest rates. The Company uses fair value hedges to hedge the fair value of commodity positions.
The Company uses various financial instruments to hedge its exposure to foreign exchange, interest rate and commodity price risks. In addition, the Company has contracts for the physical purchase and sale of natural gas, and physical and financial contracts that are held-for-trading. Collectively, these contracts are referred to as derivatives.
The Company recognizes the fair value of all its hedges on its balance sheet.
Hedging relationships that meet stringent documentation requirements, and can be proven to be effective both at the inception and over the term of the relationship, qualify for hedge accounting. Specifically, in a cash flow hedge, the effective portion of the change in the fair value of hedging derivatives is recorded in AOCI and reclassified to earnings, inventory or construction work in progress in the same period the related hedged item is realized. Any ineffective portion of the change in fair value of hedging derivatives is recognized in net earnings in the reporting period.
For fair value hedges, the change in fair value of the hedging derivatives and the hedged item are recorded in net earnings. Any ineffective portion of the change in fair value is recognized in net earnings in the reporting period.
Where documentation and effectiveness requirements are not met, the change in fair value of the derivative is recognized in earnings in the reporting period.
If a cash flow hedge is terminated, the effective portion of the change in fair value of the hedging derivative up until the date of termination remains in AOCI and is recognized in earnings, inventory or construction work in progress in the same period the related hedged risk is realized. The change in fair value of the derivative, if retained, would then be recognized in earnings from the termination date onward.
Amounts received or paid related to derivatives used to hedge foreign exchange and commodity price risks on fuel purchases are recognized in “Fuel for generation and purchased power” or “Inventory”. Amounts received or paid related to derivatives used to hedge foreign exchange on capital purchases are recognized in “Construction work in progress”. Amounts received or paid related to derivatives used to hedge interest rate risks are recognized over the term of the hedged item in “Financing charges”.
Cash flows related to HFT derivatives and derivatives in valid hedging relationships are reflected in “Operating activities” on the statement of cash flows.
64 EMERA INC. 2010 ANNUAL FINANCIAL REPORT
Table of Contents
NOTES TO THE CONSOLIDATED FINANCIAL STATEMENTS
Accounting for the impact of rate regulation:
In accordance with Handbook Standard 3865 Hedges, NSPI determined that it cannot meet the probability requirement of the standard for its derivatives in place to hedge natural gas and heavy fuel oil for its Tufts Cove generating station (“TUC”). This is due to the generating station’s ability to fuel switch and NSPI’s economic dispatch based on the cost of these two fuels. The UARB has allowed NSPI to apply hedge accounting to these derivatives as long as the other requirements of the Handbook are met. In 2009, the UARB approved an amendment to NSPI’s accounting practice to include all TUC derivatives which are no longer required. Absent UARB approval, NSPI would be required to recognize the changes in fair value of these derivatives in net earnings of the period.
NSPI has contracts for the purchase and sale of natural gas at TUC that are considered HFT derivatives and accordingly are recognized on the balance sheet at fair value. This reflects NSPI’s history of buying and reselling any natural gas not used in the production of electricity at TUC. Changes in fair value of HFT derivatives are normally recognized in net earnings. In accordance with NSPI’s accounting policy for financial instruments and hedges relating to TUC fuel, NSPI has deferred any changes in fair value to a regulatory asset or liability.
MPS has two cash flow hedges used to fix the interest rates on two variable-rate debt issues. The MPUC has allowed MPS recovery of the fixed interest costs in MPS’s rates. The fair value of the interest rate hedges is recognized in “Derivatives in a valid hedging relationship”.
Further details on the regulatory assets and liabilities recognized as a result of the above can be found in note 14.
Q. GOODWILL
Goodwill represents the excess of the purchase price of an acquired business over the net amount of the fair values assigned to its assets and liabilities and is not subject to amortization. The Company evaluates the carrying value of goodwill for potential impairment through an annual review and analysis of fair market value. Goodwill is also evaluated for potential impairment between annual tests if events or circumstances occur that more likely than not reduces the fair value of a business below its carrying value. Fair market value is determined by use of net present value financial models, which incorporate management’s assumptions of future profitability.
R. LONG-TERM INVESTMENTS
The Company accounts for certain investments, over which it has joint control, using the proportionate consolidation method, whereby the Company recognizes its pro-rata share of the jointly controlled assets and the liabilities jointly incurred in the Company’s balance sheet; recognizes its pro-rata share of any revenue and expenses in the Company’s statement of earnings; and recognizes its pro-rata share of cash flows on the Company’s statement of cash flows. Emera accounts for its investment in Bear Swamp using proportionate consolidation.
The Company accounts for certain investments, over which it maintains significant influence, but not control, using the equity method, whereby the amount of the investment is adjusted annually for the Company’s pro-rata share of the net earnings of the investment and reduced by the amount of any dividends received. Emera accounts for its investments in Maritimes & Northeast Pipeline, Light and Power Holdings, St. Lucia Electricity Services Ltd., Atlantic Hydrogen Inc., Maine Electric Power Company Inc. and Maine Yankee Atomic Power Company using the equity method.
S. FOREIGN CURRENCY TRANSLATION
Monetary assets and liabilities denominated in foreign currencies are converted to Canadian dollars at rates of exchange prevailing at the balance sheet date. The resulting differences between the translation at the original transaction date and the balance sheet date are charged to earnings.
Assets and liabilities of self-sustaining foreign operations are translated using the exchange rates in effect at the balance sheet date and the results of operations at the average rates for the period. The resulting exchange gains and losses on the assets and liabilities are deferred and included in “AOCI”.
T. RESEARCH AND DEVELOPMENT COSTS
All research and development costs are expensed in the year incurred unless they qualify for deferral as a part of property, plant and equipment or intangible assets.
65
Table of Contents
2. CHANGE IN ACCOUNTING ESTIMATE
In 2010, NSPI revised its estimate of the expected benefit from accelerated tax deductions. The impact for the three months and twelve months ended December 31, 2010 was to reduce income tax expense by approximately $8.0 million and $14.0 million respectively. In accordance with rate-regulated accounting, the future income tax implications of this change in estimate have been deferred to a regulatory asset in “Other assets”. This change in accounting estimate has been accounted for on a prospective basis.
3. SEGMENT INFORMATION
The Company has three reportable segments, which are determined based on Emera’s operating activities: NSPI, engaged in the production and sale of electric energy in Nova Scotia; Bangor Hydro, engaged in the transmission and distribution of electric energy in central Maine; Brunswick Pipeline, engaged in the transportation of natural gas through its pipeline for Repsol; and Other, including MPS, GBPC, revenue generated from energy marketing margin and electric revenue from the Company’s investment in Bear Swamp. The Company evaluates performance based on contribution to consolidated net earnings applicable to common shareholders. The accounting policies of the reported segments are the same as those described in the summary of significant accounting policies.
MILLIONS OF DOLLARS
| NPSI
| Bangor Hydro
| Brunswick Pipeline
| Other*
| Total
| |||||||||||||||
Year ended December 31, 2010 | ||||||||||||||||||||
Revenues from external customers | $ | 1,182.6 | $ | 155.7 | $ | 56.5 | $ | 158.9 | $ | 1,553.7 | ||||||||||
Depreciation and amortization | 150.8 | 17.2 | 0.1 | 5.5 | 173.6 | |||||||||||||||
Cost of operations, including depreciation | 953.0 | 97.8 | 0.1 | 168.9 | 1,219.8 | |||||||||||||||
Equity earnings | – | – | – | 13.6 | 13.6 | |||||||||||||||
Interest expense | 110.6 | 11.5 | – | 29.1 | 151.2 | |||||||||||||||
Income taxes | (17.4 | ) | 18.8 | – | (14.2 | ) | (12.8 | ) | ||||||||||||
Net earnings applicable to common shareholders | 121.3 | 31.9 | 25.8 | 12.1 | 191.1 | |||||||||||||||
Net inter-segment (expenses) revenues | (47.6 | ) | (1.6 | ) | (31.5 | ) | 80.7 | – | ||||||||||||
Capital expenditures | 510.5 | 40.6 | 12.7 | 4.6 | 568.4 | |||||||||||||||
As at December 31, 2010 | ||||||||||||||||||||
Total assets | 3,991.3 | 730.4 | 502.7 | 1,104.7 | 6,329.1 | |||||||||||||||
Investments subject to significant influence | – | 0.7 | – | 238.2 | 238.9 | |||||||||||||||
Goodwill | – | 82.9 | – | 96.0 | 178.9 | |||||||||||||||
MILLIONS OF DOLLARS
| NPSI
| Bangor Hydro
| Brunswick Pipeline
| Other*
| Total
| |||||||||||||||
Year ended December 31, 2009 | ||||||||||||||||||||
Revenues from external customers | $ | 1,201.9 | $ | 157.7 | $ | 25.3 | $ | 98.6 | $ | 1,483.5 | ||||||||||
Depreciation and amortization | 143.9 | 18.3 | 0.1 | 2.6 | 164.9 | |||||||||||||||
Cost of operations, including depreciation | 935.9 | 103.0 | 0.1 | 97.9 | 1,136.9 | |||||||||||||||
Equity earnings | – | – | – | 14.0 | 14.0 | |||||||||||||||
Interest expense | 99.2 | 13.0 | – | 21.8 | 134.0 | |||||||||||||||
Income taxes | 42.2 | 15.3 | – | (8.6 | ) | 48.9 | ||||||||||||||
Net earnings applicable to common shareholders | 109.3 | 27.5 | 14.0 | 24.9 | 175.7 | |||||||||||||||
Net inter-segment revenues (expenses) | 16.2 | (0.9 | ) | (30.5 | ) | 15.2 | – | |||||||||||||
Capital expenditures | 263.7 | 55.9 | 50.8 | 22.1 | 392.5 | |||||||||||||||
As at December 31, 2009 | ||||||||||||||||||||
Total assets | 3,465.3 | 738.0 | 447.7 | 633.5 | 5,284.5 | |||||||||||||||
Investments subject to significant influence | – | 2.2 | – | 216.2 | 218.4 | |||||||||||||||
Goodwill | – | 87.2 | – | 0.4 | 87.6 | |||||||||||||||
*Other includes corporate activities and adjustments to reconcile to consolidated balances.
66 EMERA INC. 2010 ANNUAL FINANCIAL REPORT
Table of Contents
NOTES TO THE CONSOLIDATED FINANCIAL STATEMENTS
4. EMPLOYEE FUTURE BENEFITS
Nova Scotia Power Plans
NSPI maintains contributory defined-benefit and defined-contribution pension plans, which cover substantially all of its employees, and plans providing non-pension benefits for its retirees. Certain of Emera’s corporate employees participate in these plans and Emera Inc. is charged accordingly.
Defined-benefit pension plans are based on the years of service and average salary at the time the employee terminates employment and provide annual post-retirement indexing equal to the change in the Consumer Price Index up to a maximum increase of six per cent per year.
Other retirement benefit plans include: unfunded pension arrangements (with the same indexing formula as the funded pension arrangements), unfunded long service award (which is impacted by expected future salary levels) and contributory health care plan. The unfunded long service award was closed to new entrants effective August 1, 2007.
The measurement date for the assets and obligations of each benefit plan is December 31, 2010.
VALUATION DATE FOR DEFINED-BENEFIT PLANS
NSPI has a December 31 valuation date for accounting purposes. The most recent and the next required actuarial valuation dates for funding purposes are as follows:
Most Recent Actuarial Valuation
| Next Required Actuarial Valuation
| |||||||
Employee pension plan | December 31, 2010 | December 31, 2011 | ||||||
Acquired companies pension plan | December 31, 2010 | December 31, 2011 | ||||||
TOTAL CASH AMOUNT
Total cash amount for 2010, made up of contributions to its funded defined-benefit pension plans, contributions to its defined-contribution pension plan, employer paid premiums for its post-retirement health care plan, and amounts paid directly to retirees and beneficiaries in other plans, was $40.4 million (2009 – $32.5 million) for NSPI and Emera.
67
Table of Contents
ACCRUED PENSION AND NON-PENSION BENEFIT ASSET (LIABILITY)
| 2010 | 2009 | |||||||||||||||
MILLIONS OF DOLLARS
| Defined-Benefit Pension Plans
| Non-Pension Benefits Plans
| Defined-Benefit Pension Plans
| Non-Pension Benefits Plans
| ||||||||||||
Assumptions (weighted average) | ||||||||||||||||
Accrued benefit obligation – December 31: | ||||||||||||||||
Discount rate | 5.50% | 5.50% | 6.50% | 6.50% | ||||||||||||
Rate of compensation increase | 3% to 5.5% | 3% to 5.5% | 3% to 5.5% | 3% to 5.5% | ||||||||||||
Health care trend – initial (next year) | – | 4.00% | – | 5.00% | ||||||||||||
– ultimate | – | 4.00% | – | 4.00% | ||||||||||||
– year ultimate reached | – | 2011 | – | 2011 | ||||||||||||
Benefit cost for year ending December 31: | ||||||||||||||||
Discount rate | 6.50% | 6.50% | 7.50% | 7.50% | ||||||||||||
Expected long-term return on plan assets | 7.25% | 7.25% | 7.25% | – | ||||||||||||
Rate of compensation increase | 3% to 5.5% | 3% to 5.5% | 3% to 5.5% | 3% to 5.5% | ||||||||||||
Health care trend – initial (current year) | – | 5.00% | – | 6.00% | ||||||||||||
– ultimate | – | 4.00% | – | 4.00% | ||||||||||||
– year ultimate reached | – | 2011 | – | 2011 | ||||||||||||
Accrued benefit obligations | ||||||||||||||||
Balance, January 1 | $ | 787.8 | $ | 36.3 | $ | 669.5 | $ | 36.1 | ||||||||
Employer current service cost | 9.5 | 1.5 | 6.8 | 1.4 | ||||||||||||
Employee contributions | 5.7 | – | 5.4 | – | ||||||||||||
Interest cost | 50.2 | 2.3 | 49.1 | 2.6 | ||||||||||||
Past service adjustment | (1.0 | ) | – | – | – | |||||||||||
Actuarial losses | 122.4 | 4.1 | 95.1 | 0.4 | ||||||||||||
Benefits paid | (39.5 | ) | (4.3 | ) | (38.1 | ) | (4.2 | ) | ||||||||
Balance, December 31 | 935.1 | 39.9 | 787.8 | 36.3 | ||||||||||||
Fair value of plan assets | ||||||||||||||||
Balance, January 1 | 593.1 | – | 509.2 | – | ||||||||||||
Employer contributions | 34.7 | 4.3 | 27.2 | 4.2 | ||||||||||||
Employee contributions | 5.7 | – | 5.4 | – | ||||||||||||
Actual return on plan assets | 55.6 | – | 89.4 | – | ||||||||||||
Benefits paid | (39.5 | ) | (4.3 | ) | (38.1 | ) | (4.2 | ) | ||||||||
Balance, December 31 | 649.6 | – | 593.1 | – | ||||||||||||
Reconciliation of financial status to accrued benefit asset, December 31 | ||||||||||||||||
Fair value of plan assets | 649.6 | – | 593.1 | – | ||||||||||||
Accrued benefit obligations | 935.1 | 39.9 | 787.8 | 36.3 | ||||||||||||
Plan deficit | (285.5 | ) | (39.9 | ) | (194.7 | ) | (36.3 | ) | ||||||||
Unamortized past service (gains) costs | (0.3 | ) | 1.4 | (0.4 | ) | 1.6 | ||||||||||
Unamortized actuarial losses (gains) | 364.5 | 2.1 | 257.8 | (2.2 | ) | |||||||||||
Unamortized transitional obligation | (0.9 | ) | 4.5 | 0.1 | 6.7 | |||||||||||
Accrued benefit asset (liability) | $ | 77.8 | $ | (31.9 | ) | $ | 62.8 | $ | (30.2 | ) | ||||||
68 EMERA INC. 2010 ANNUAL FINANCIAL REPORT
Table of Contents
NOTES TO THE CONSOLIDATED FINANCIAL STATEMENTS
The amounts recognized in “Other assets” and “Other liabilities” are as follows:
| 2010 | 2009 | |||||||||||||||
MILLIONS OF DOLLARS
| Defined-Benefit Pension Plans
| Non-Pension Benefits Plans
| Defined-Benefit Pension Plans
| Non-Pension Benefits Plans
| ||||||||||||
Accrued benefit asset | $ | 110.7 | – | $ | 94.4 | – | ||||||||||
Accrued benefit liability | (32.9 | ) | $ | (31.9 | ) | (31.6 | ) | $ | (30.2 | ) | ||||||
Net accrued benefit asset (liability) | $ | 77.8 | $ | (31.9 | ) | $ | 62.8 | $ | (30.2 | ) | ||||||
| DEFINED-BENEFIT PLANS ASSET ALLOCATION (% OF PLAN ASSETS) | ||||||||||||||||
| 2010 | 2009 | |||||||||||||||
Employee Pension Plan
| Acquired Companies Pension Plan
| Employee Pension Plan
| Acquired Companies Pension Plan
| |||||||||||||
Equity securities | 65% | 64% | 64% | 62% | ||||||||||||
Debt securities | 34% | 36% | 36% | 37% | ||||||||||||
Cash | 1% | – | – | 1% | ||||||||||||
Total | 100% | 100% | 100% | 100% | ||||||||||||
As at December 31, 2010, the pension funds do not hold any material investments in Emera Inc. or Nova Scotia Power Inc. securities.
PLANS WITH ACCRUED BENEFIT OBLIGATIONS IN EXCESS OF ASSETS
As at December 31, 2010, all post-retirement benefit plans have accrued benefit obligations in excess of assets.
BENEFITS COST COMPONENTS
| 2010 | 2009 | |||||||||||||||
MILLIONS OF DOLLARS
| Defined -Benefit Pension Plans
| Non-Pension Benefits Plans
| Defined-Benefit Pension Plans
| Non-Pension Benefits Plans
| ||||||||||||
Defined-benefit plan | ||||||||||||||||
Costs arising from events during the year: | ||||||||||||||||
Current service costs | $ | 9.5 | $ | 1.5 | $ | 6.8 | $ | 1.4 | ||||||||
Interest on accrued benefits | 50.2 | 2.3 | 49.1 | 2.6 | ||||||||||||
Less: actual return on plan assets | (55.6 | ) | – | (89.4 | ) | – | ||||||||||
Actuarial losses on accrued benefit obligation | 122.4 | 4.1 | 95.1 | 0.5 | ||||||||||||
Past service gains | (1.0 | ) | – | – | – | |||||||||||
Future benefit costs before adjustments | 125.5 | 7.9 | 61.6 | 4.5 | ||||||||||||
Adjustments to recognize long-term nature of costs: | ||||||||||||||||
Difference between expected return on assets and actual return | 6.0 | – | 41.0 | – | ||||||||||||
Amortization of transitional obligation | – | 2.2 | – | 2.2 | ||||||||||||
Difference between amortization of actuarial gains and actual actuarial gains on accrued benefit obligations | (112.8 | ) | (4.3 | ) | (94.6 | ) | (0.8 | ) | ||||||||
Difference between amortization of past service costs and past service costs for the year | 1.0 | 0.2 | – | 0.2 | ||||||||||||
Total cost recognized | $ | 19.7 | $ | 6.0 | $ | 8.0 | $ | 6.1 | ||||||||
Defined contribution plan | ||||||||||||||||
Employer cost | $ | 1.4 | – | $ | 1.1 | – | ||||||||||
The expected return on plan assets is determined based on the market-related value of plan assets of $685.6 million at January 1, 2010 (2009 – $671.1 million), adjusted for interest on certain cash flows during the year.
69
Table of Contents
SENSITIVITY ANALYSIS FOR NON-PENSION BENEFITS PLANS
The health care cost trend significantly influences the amounts presented for health care plans. An increase or decrease of one percentage point of the assumed health care cost trend would have had the following impact in 2010:
MILLIONS OF DOLLARS
| Increase
| Decrease
| ||||||
Current service cost and interest cost | – | – | ||||||
Accrued benefit obligation, December 31 | $ | 1.5 | $ | (1.4 | ) | |||
Bangor Hydro Plans
Bangor Hydro maintains a non-contributory defined-benefit and a contributory defined-contribution pension plan, which cover substantially all of its employees, and a health care plan for its retirees. The defined-benefit pension is based on the years of service and average salary at the time the employee terminates employment and provides no post-employment indexing. The defined-benefit pension plan was closed to new entrants effective February 2006. Employees hired after January 1, 2006 are not eligible for the retiree health care plan.
Other retirement benefit plans include an unfunded pension arrangement and a retiree life insurance plan.
The measurement date for the assets and obligations of each benefit plan is December 31, 2010.
VALUATION DATE FOR DEFINED-BENEFIT PLANS
Bangor Hydro has a December 31 valuation date for accounting purposes. The most recent and the next required actuarial valuation dates for funding purposes are the following:
Most Recent Actuarial Valuation
| Next Required Actuarial Valuation
| |||||||
Employee pension plan | December 31, 2009 | December 31, 2010 | ||||||
TOTAL CASH AMOUNT
Total cash amount for 2010, made up of Bangor Hydro contributions to its funded defined-benefit pension plan, contributions to its defined contribution pension plan, employer paid premiums for its post-retirement health care plan, and amounts paid directly to retirees and beneficiaries in other plans, was $5.0 million (2009 – $5.2 million).
70 EMERA INC. 2010 ANNUAL FINANCIAL REPORT
Table of Contents
NOTES TO THE CONSOLIDATED FINANCIAL STATEMENTS
ACCRUED PENSION AND NON-PENSION BENEFIT LIABILITY
| 2010 | 2009 | |||||||||||||||
MILLIONS OF DOLLARS
| Defined-Benefit Pension Plans
| Non-Pension Benefits Plans
| Defined-Benefit Pension Plans
| Non-Pension Benefits Plans
| ||||||||||||
Assumptions (weighted average) | ||||||||||||||||
Accrued benefit obligation – December 31: | ||||||||||||||||
Discount rate | 5.60% | 5.60% | 6.00% | 6.00% | ||||||||||||
Rate of compensation increase | 3.75% | N/A | 3.75% | N/A | ||||||||||||
Health care trend – initial (next year) | – | 9.25% | – | 10.00% | ||||||||||||
– ultimate | – | 5.00% | – | 5.00% | ||||||||||||
– year ultimate reached | – | 2017 | – | 2017 | ||||||||||||
Benefit cost for year ending December 31: | ||||||||||||||||
Discount rate | 6.00% | 6.00% | 6.75% | 6.75% | ||||||||||||
Expected long-term return on plan assets | 8.00% | 5.00% | 8.00% | 5.00% | ||||||||||||
Rate of compensation increase | 3.75% | N/A | 3.75% | N/A | ||||||||||||
Health care trend – initial (current year) | – | 10.00% | – | 7.60% | ||||||||||||
– ultimate | – | 5.00% | – | 5.00% | ||||||||||||
– year ultimate reached | – | 2017 | – | 2015 | ||||||||||||
Accrued benefit obligations | ||||||||||||||||
Balance, January 1 | $ | 81.8 | $ | 41.8 | $ | 84.6 | $ | 53.6 | ||||||||
Employer current service cost | 1.4 | 0.7 | 1.3 | 0.6 | ||||||||||||
Interest cost | 4.7 | 2.3 | 5.1 | 2.3 | ||||||||||||
Past service amendments | – | – | – | (14.5 | ) | |||||||||||
Actuarial losses (gains) | 4.7 | (0.2 | ) | 8.3 | 8.4 | |||||||||||
Benefits paid | (3.7 | ) | (1.4 | ) | (4.2 | ) | (1.1 | ) | ||||||||
Foreign currency translation adjustment | (4.2 | ) | (2.1 | ) | (13.3 | ) | (7.5 | ) | ||||||||
Balance, December 31 | 84.7 | 41.1 | 81.8 | 41.8 | ||||||||||||
Fair value of plan assets | ||||||||||||||||
Balance, January 1 | 49.8 | 1.0 | 47.9 | 1.2 | ||||||||||||
Employer contributions | 3.6 | 1.4 | 3.5 | 1.3 | ||||||||||||
Actual return on plan assets | 5.8 | – | 10.5 | (0.1 | ) | |||||||||||
Benefits paid | (3.7 | ) | (1.4 | ) | (4.2 | ) | (1.1 | ) | ||||||||
Foreign currency translation adjustment | (2.7 | ) | (0.1 | ) | (7.9 | ) | (0.3 | ) | ||||||||
Balance, December 31 | 52.8 | 0.9 | 49.8 | 1.0 | ||||||||||||
Reconciliation of financial status to accrued benefit asset, December 31 | ||||||||||||||||
Fair value of plan assets | 52.8 | 0.9 | 49.8 | 1.0 | ||||||||||||
Accrued benefit obligations | 84.7 | 41.1 | 81.8 | 41.8 | ||||||||||||
Plan deficit | (31.9 | ) | (40.2 | ) | (32.0 | ) | (40.8 | ) | ||||||||
Unamortized past service costs (gains) | 0.5 | (11.2 | ) | 0.7 | (14.8 | ) | ||||||||||
Unamortized actuarial losses | 33.2 | 21.0 | 33.0 | 24.2 | ||||||||||||
Unamortized transitional obligation | – | – | – | 1.6 | ||||||||||||
Accrued benefit asset (liability) | $ | 1.8 | $ | (30.4 | ) | $ | 1.7 | $ | (29.8 | ) | ||||||
71
Table of Contents
DEFINED-BENEFIT PLANS ASSET ALLOCATION (% OF PLAN ASSETS)
| 2010 | 2009 | |||||||
Employee Pension Plan
| Employee Pension Plan
| |||||||
Equity securities | 65% | 65% | ||||||
Debt securities | 34% | 34% | ||||||
Other | 1% | 1% | ||||||
Total | 100% | 100% | ||||||
As at December 31, 2010, the pension fund does not directly hold any investments in Emera or Bangor Hydro securities. However, as a significant portion of assets for the benefit plans are held in mutual funds, there may be indirect investments in these securities.
PLANS WITH ACCRUED BENEFIT OBLIGATION IN EXCESS OF ASSETS
As at December 31, 2010, all post-retirement benefit plans have accrued pension obligations in excess of assets.
BENEFITS COST COMPONENTS
| 2010 | 2009 | |||||||||||||||
MILLIONS OF DOLLARS
| Defined-Benefit Pension Plans
| Non-Pension Benefits Plans
| Defined-Benefit Pension Plans
| Non-Pension Benefits Plans
| ||||||||||||
Defined-benefit plan | ||||||||||||||||
Costs arising from events during the year: | ||||||||||||||||
Current service costs | $ | 1.4 | $ | 0.7 | $ | 1.3 | $ | 0.6 | ||||||||
Interest on accrued benefits | 4.7 | 2.3 | 5.1 | 2.3 | ||||||||||||
Less: actual (loss) on plan assets | (5.8 | ) | – | (10.5 | ) | – | ||||||||||
Actuarial losses (gains) on accrued benefit obligation | 4.7 | (0.2 | ) | 8.3 | 8.4 | |||||||||||
Past service amendment | – | – | – | (14.5 | ) | |||||||||||
Future benefit costs before adjustments | 5.0 | 2.8 | 4.2 | (3.2 | ) | |||||||||||
Adjustments to recognize long-term nature of costs: | ||||||||||||||||
Difference between expected return on assets and actual return | 1.1 | (0.1 | ) | 5.5 | (0.2 | ) | ||||||||||
Amortization of transitional obligation | – | – | – | 0.6 | ||||||||||||
Difference between amortization of actuarial (gains) losses and actual actuarial (gains) losses on accrued benefit obligations | (3.1 | ) | 2.1 | (7.5 | ) | (7.1 | ) | |||||||||
Difference between amortization of past service costs and past service costs for the year | 0.2 | (1.3 | ) | 0.2 | 12.7 | |||||||||||
Total cost recognized | $ | 3.2 | $ | 3.5 | $ | 2.4 | $ | 2.8 | ||||||||
Defined contribution plan | ||||||||||||||||
Employer cost | $ | 0.4 | – | $ | 0.3 | – | ||||||||||
For the defined-benefit pension plan, the expected return on plan assets is determined on the market-related value of plan assets of $53.4 million at January 1, 2010 (2009 – $58.6 million), adjusted for interest on certain cash flows during the year.
72 EMERA INC. 2010 ANNUAL FINANCIAL REPORT
Table of Contents
NOTES TO THE CONSOLIDATED FINANCIAL STATEMENTS
SENSITIVITY ANALYSIS FOR NON-PENSION PLANS
The health care cost trend significantly influences the amounts presented for health care plans. An increase or decrease of one percentage point of the assumed health care cost trend would have had the following impact in 2010:
Increase
| Decrease
| |||||||
Current service cost and interest cost | $ | 0.5 | $ | (0.4 | ) | |||
Accrued benefit obligation, December 31 | $ | 7.0 | $ | (5.6 | ) | |||
Accounting for the impact of rate regulation:
When Bangor Hydro was purchased by Emera, Bangor Hydro received regulatory approval to continue amortizing certain existing balances over a period of 10 years. Under CGAAP, as a result of the purchase, these unamortized balances would have been recognized immediately in the year Bangor Hydro was purchased. In the absence of the regulatory policy, Bangor Hydro’s total accrued benefit liability would be $34.9 million (2009 – $38.5 million) and the total defined-benefits expense for 2010 would be $5.0 million (2009 – $3.3 million).
Maine & Maritimes Plans
MAM’s subsidiary, MPS, maintains a non-contributory defined-benefit pension plan, and a contributory defined-contribution plan, which cover substantially all of its employees, and a health care plan for its retirees. The defined-benefit pension is based on the years of service and average salary at the time the employee terminates employment and post-employment indexing from time to time, subject to approval by the MPS Board of Directors. Employees hired after January 1, 2006, are not eligible for participation in the defined-benefit pension plan. Effective December 31, 2006, future salary and service accruals ceased. Employees hired after October 1, 2005, are not eligible for the retiree health care plan.
Other retirement benefit plans include an unfunded supplemental executive plan and an unfunded defined-benefit agreement. The estimated liabilities for these plans are approximately $0.2 million.
The measurement date for the assets and obligations of each benefit plan is December 31, 2010.
VALUATION DATE FOR DEFINED-BENEFIT PLANS
MPS has a December 31 valuation date for accounting purposes. The most recent and the next required actuarial valuation dates for funding purposes are the following:
Most Recent Actuarial Valuation
| Next Required Actuarial Valuation
| |||||||
Employee pension plan | December 31, 2009 | December 31, 2010 | ||||||
TOTAL CASH AMOUNT
Total cash amount for 2010, made up of MPS contributions to its funded defined-benefit pension plan, contributions to its defined contribution pension plan, employer paid premiums for its post-retirement health care plan, and amounts paid directly to retirees and beneficiaries in other plans, was $2.1 million.
73
Table of Contents
ACCRUED PENSION AND NON-PENSION BENEFIT LIABILITY
2010
| ||||||||
MILLIONS OF DOLLARS
|
Defined-Benefit
|
Non-Pension
| ||||||
Assumptions (weighted average) | ||||||||
Accrued benefit obligation – December 31: | ||||||||
Discount rate | 5.40% | 5.40% | ||||||
Rate of compensation increase | – | N/A | ||||||
Health care trend – initial (next year) | – | 9.00% | ||||||
– ultimate | – | 4.50% | ||||||
– year ultimate reached | – | 2070 | ||||||
Benefit cost for year ending December 31: | ||||||||
Discount rate | 5.75% | 5.85% | ||||||
Expected long-term return on plan assets | 8.50% | 8.50% | ||||||
Rate of compensation increase | – | N/A | ||||||
Health care trend – initial (current year) | – | 10.00% | ||||||
– ultimate | – | 5.00% | ||||||
– year ultimate reached | – | 2070 | ||||||
Accrued benefit obligations | ||||||||
Balance, January 1 | $ | 20.0 | $ | 3.1 | ||||
Employer current service cost | – | 0.1 | ||||||
Interest cost | 1.0 | 0.2 | ||||||
Past service amendments | – | – | ||||||
Actuarial losses | 1.0 | 2.3 | ||||||
Benefits paid | (1.1 | ) | (0.3 | ) | ||||
Foreign currency translation adjustment | (1.0 | ) | (0.2 | ) | ||||
Balance, December 31 | 19.9 | 5.2 | ||||||
Fair value of plan assets | ||||||||
Balance, January 1 | 14.7 | 2.2 | ||||||
Employer contributions | 1.0 | 0.1 | ||||||
Actual return on plan assets | 2.2 | 0.3 | ||||||
Benefits paid | (1.1 | ) | (0.2 | ) | ||||
Foreign currency translation adjustment | (0.9 | ) | (0.1 | ) | ||||
Balance, December 31 | 15.9 | 2.3 | ||||||
Reconciliation of financial status to accrued benefit asset, December 31 | ||||||||
Fair value of plan assets | 15.9 | 2.3 | ||||||
Accrued benefit obligations | 19.9 | 5.2 | ||||||
Plan deficit | (4.0 | ) | (2.9 | ) | ||||
Unamortized past service gains | – | (6.2 | ) | |||||
Unamortized actuarial losses | 5.1 | 5.6 | ||||||
Unamortized transitional obligation | – | – | ||||||
Accrued benefit asset (liability) | $ | 1.1 | $ | (3.5 | ) | |||
74 EMERA INC. 2010 ANNUAL FINANCIAL REPORT
Table of Contents
NOTES TO THE CONSOLIDATED FINANCIAL STATEMENTS
DEFINED-BENEFIT PLANS ASSET ALLOCATION (% OF PLAN ASSETS)
2010
| ||||
Employee
| ||||
Equity securities | 68% | |||
Debt securities | 24% | |||
Other | 8% | |||
Total | 100% | |||
For the defined-benefit pension plan, the expected rate of return on plan assets is determined on the market-related value of plan assets of $14.5 million at January 1, 2010, adjusted for interest on certain cash flows during the year.
As at December 31, 2010, the pension fund does not directly hold any investments in Emera, Bangor Hydro or MAM securities. However, as a significant portion of assets for the benefit plans are held in mutual funds, there may be indirect investments in these securities.
SENSITIVITY ANALYSIS FOR NON-PENSION PLANS
The health care cost trend significantly influences the amounts presented for health care plans. An increase or decrease of one percentage point of the assumed health care cost trend would have had the following impact in 2010:
| 000000000 | 000000000 | |||||||
Increase
| Decrease
| |||||||
Current service cost and interest cost | – | – | ||||||
Accrued benefit obligation, December 31 | $ | 0.8 | $ | (0.6 | ) | |||
Accounting for the impact of rate regulation:
When MAM was purchased by Emera, MPS recorded a regulatory asset to continue amortizing certain existing balances over a period of 13 years. Under CGAAP, as a result of the purchase, these unamortized balances would have been recognized immediately in the year MAM was purchased. In the absence of the regulatory policy, MAM’s total accrued benefit liability would be $6.9 million.
Grand Bahama Power Company Limited Plans
GBPC maintains a non-contributory defined-benefit pension plan for unionized employees and a separate non-contributory defined-benefit pension plan for non-union employees. The defined-benefit pension plans are based on the years of service and average salary at the time the employee retires.
The Company also has gratuity plans for its employees, payable upon retirement. Employees get two weeks pay for every year worked, capped at 52 weeks.
The measurement date for the assets and obligations of each benefit plan is December 31, 2010.
VALUATION DATE FOR DEFINED-BENEFIT PLANS
GBPC has a December 31 valuation date for accounting purposes. The most recent and the next required actuarial valuation dates for funding purposes are the following:
Most Recent
| Next Required
| |||||||
Employee pension plan | December 31, 2009 | December 31, 2010 | ||||||
TOTAL CASH AMOUNT
Total cash amount for 2010, made up of GBPC contributions to its funded defined-benefit pension plan, was $0.4 million.
75
Table of Contents
ACCRUED PENSION AND NON-PENSION BENEFIT LIABILITY
2010
| ||||||||
MILLIONS OF DOLLARS
|
Defined-Benefit
|
Non-Pension
| ||||||
Assumptions (weighted average) | ||||||||
Accrued benefit obligation – December 31: | ||||||||
Discount rate | 6.00% | 6.00% | ||||||
Rate of compensation increase | ||||||||
– Union plan | 4.00% | 2.00% | ||||||
– Non-union plan | 5.00% | 2.00% | ||||||
Benefit cost for year ending December 31: | ||||||||
Discount rate | 6.00% | 6.00% | ||||||
Expected long-term return on plan assets | 6.00% | – | ||||||
Rate of compensation increase | 4.00% | – | ||||||
– Union plan | 4.00% | 2.00% | ||||||
– Non-union plan | 5.00% | 2.00% | ||||||
Accrued benefit obligations | ||||||||
Balance, January 1 | $ | 8.4 | $ | 2.8 | ||||
Employer current service cost | 0.3 | – | ||||||
Interest cost | 0.5 | – | ||||||
Actuarial losses | (0.1 | ) | – | |||||
Benefits paid | (0.2 | ) | – | |||||
Foreign currency translation adjustment | (0.4 | ) | (0.1 | ) | ||||
Balance, December 31 | 8.5 | 2.7 | ||||||
Fair value of plan assets | ||||||||
Balance, January 1 | 5.5 | – | ||||||
Employer contributions | 0.4 | – | ||||||
Actual return on plan assets | 0.1 | – | ||||||
Benefits paid | (0.2 | ) | – | |||||
Foreign currency translation adjustment | (0.2 | ) | – | |||||
Balance, December 31 | 5.6 | – | ||||||
Reconciliation of financial status to accrued benefit asset, December 31 | ||||||||
Fair value of plan assets | 5.6 | – | ||||||
Accrued benefit obligations | 8.5 | 2.7 | ||||||
Plan deficit | (2.9 | ) | (2.7 | ) | ||||
Unamortized actuarial losses | 1.5 | – | ||||||
Accrued benefit liability | $ | (1.4 | ) | $ | (2.7 | ) | ||
DEFINED-BENEFIT PLANS ASSET ALLOCATION (UNION PLAN) (% OF PLAN ASSETS)
| 0000000000 | ||||
2010
| ||||
Employee
| ||||
Equity securities | 29% | |||
Debt securities | 54% | |||
Other | 17% | |||
Total | 100% | |||
76 EMERA INC. 2010 ANNUAL FINANCIAL REPORT
Table of Contents
NOTES TO THE CONSOLIDATED FINANCIAL STATEMENTS
DEFINED-BENEFIT PLANS ASSET ALLOCATION (NON-UNION PLAN) (% OF PLAN ASSETS)
2010
| ||||
Employee
| ||||
Equity securities | 55% | |||
Debt securities | 39% | |||
Other | 6% | |||
Total | 100% | |||
5. FUEL ADJUSTMENT
The UARB approved the implementation of a Fuel Adjustment Mechanism (“FAM”) for NSPI in the 2009 General Rate Decision effective January 1, 2009. The fuel adjustment related to the FAM includes the effect of fuel costs in both the current period and the preceding year. The difference between actual fuel costs and amounts recovered from customers in the current period is included in the fuel adjustment. This amount, less the incentive component, is deferred to a FAM regulatory asset in “Other assets” or a FAM regulatory liability in “Other liabilities”. Also included in the 2010 fuel adjustment is the rebate to customers of over-recovered fuel costs from 2009.
Details of the fuel adjustment related to the FAM are summarized in the following table:
| 00000000000 | 00000000000 | |||||||
MILLIONS OF DOLLARS
| 2010
| 2009
| ||||||
(Under) over recovery of current period fuel costs | $ | (76.6 | ) | $ | 8.5 | |||
Rebate to customers from prior year | (22.4 | ) | – | |||||
Fuel adjustment | $ | (99.0 | ) | $ | 8.5 | |||
The Company has recognized a future income tax expense related to the fuel adjustment based on NSPI’s applicable statutory income tax rate. The FAM regulatory asset or liability includes amounts recognized as a fuel adjustment and associated interest included in “Financing charges”. As at December 31, 2010, NSPI’s FAM regulatory asset was $92.9 million (2009 – liability of $9.9 million), and future income tax liability related to the FAM was $29.2 million (2009 – asset of $3.4 million).
In the absence of UARB approval, the fuel adjustment would not have been recognized and earnings for the year ended December 31, 2010 would be $80.4 million ($56.3 million after-tax) lower (2009 – $9.9 million or $6.5 million after-tax higher).
6. OPERATING LEASES
The Company has entered into operating lease agreements for office space, rail cars, telecommunication services and certain other equipment, which expire in 2011 to 2020. Future minimum annual lease payments under the leases are as follows:
| 0000000000 | ||||
MILLIONS OF DOLLARS
| ||||
2011 | $ | 2.7 | ||
2012 | 1.1 | |||
2013 | 0.6 | |||
2014 | 0.6 | |||
2015 | 0.6 | |||
Thereafter | 1.4 | |||
| $ | 7.0 | |||
For the year ended December 31, 2010, the Company recognized $10.1 million (2009 – $9.9 million) of operating leases in “Operating, maintenance and general expense”.
77
Table of Contents
7. INVESTMENTS SUBJECT TO SIGNIFICANT INFLUENCE AND EQUITY EARNINGS
Investments subject to significant influence are comprised of the following:
| 0000000000 | 0000000000 | 0000000000 | 0000000000 | |||||||||||||
2010
| 2009
| |||||||||||||||
MILLIONS OF DOLLARS
|
Carrying
| Equity
| Carrying
| Equity
| ||||||||||||
Maritimes & Northeast Pipeline | $ | 118.8 | $ | 9.1 | $ | 116.8 | $ | 10.2 | ||||||||
Light and Power Holdings | 90.2 | 5.4 | – | – | ||||||||||||
St. Lucia Electricity Services Ltd. | 25.0 | 2.1 | 25.5 | 2.4 | ||||||||||||
Atlantic Hydrogen Inc. | 3.6 | (0.4 | ) | – | – | |||||||||||
Maine Electric Power Company Inc. | 0.9 | – | 2.0 | – | ||||||||||||
Maine Yankee Atomic Power Company | 0.2 | – | 0.2 | – | ||||||||||||
Grand Bahama Power Company Limited (1) | – | (2.6 | ) | 73.9 | 1.4 | |||||||||||
Other | 0.2 | – | – | – | ||||||||||||
| $ | 238.9 | $ | 13.6 | $ | 218.4 | $ | 14.0 | |||||||||
(1) As discussed under note 18 Acquisitions, Emera purchased in December 2010 an additional 55.4 per cent of direct and indirect interest in GBPC. The acquisition has been accounted for under the purchase method of accounting as Emera determined it has control of GBPC. For the quarter and the year ended December 31, 2010 and 2009, equity earnings included Emera’s 25 per cent interest in GBPC.
Equity investments include a $14.5 million difference between the cost and the underlying net book value of the investees’ assets as at the date of acquisition. The excess is attributable to goodwill and is therefore not subject to amortization.
8. FINANCING CHARGES
Financing charges consist of the following:
| 0000000000 | 0000000000 | |||||||
MILLIONS OF DOLLARS
| 2010
| 2009
| ||||||
Interest – long-term debt | $ | 142.0 | $ | 115.6 | ||||
– short-term debt | 9.2 | 18.4 | ||||||
Preferred share dividends paid by subsidiary (note 10) | 8.0 | 9.5 | ||||||
Amortization of defeasance cost | 12.1 | 12.1 | ||||||
Amortization of debt financing costs | 3.6 | 5.4 | ||||||
Allowance for funds used during construction | (22.2 | ) | (28.9 | ) | ||||
Interest (recovery) expense on deferral of FAM | (3.8 | ) | 1.4 | |||||
Foreign exchange losses | 0.9 | 0.5 | ||||||
Foreign exchange losses (gains) recovered through the FAM | 9.3 | (3.0 | ) | |||||
Banking fees and other | 9.3 | 4.3 | ||||||
| $ | 168.4 | $ | 135.3 | |||||
78 EMERA INC. 2010 ANNUAL FINANCIAL REPORT
Table of Contents
NOTES TO THE CONSOLIDATED FINANCIAL STATEMENTS
9. INCOME TAXES
The income tax provision differs from that computed using the statutory rates for the following reasons:
MILLIONS OF DOLLARS
| 2010
| 2009
| ||||||||||||||
Earnings before income taxes | $ | 179.1 | – | $ | 225.3 | – | ||||||||||
Income taxes, at statutory rates | 60.9 | 34.0 | % | 78.9 | 35.0 | % | ||||||||||
Future income taxes on regulated earnings deferred to regulatory assets (note 14) | (67.5 | ) | (37.7 | ) | (33.5 | ) | (14.9 | ) | ||||||||
Equity earnings not subject to tax | (5.9 | ) | (3.3 | ) | (5.8 | ) | (2.6 | ) | ||||||||
Change in estimate of prior year expected benefit of tax deductions | (4.7 | ) | (2.6 | ) | – | – | ||||||||||
Recovery of prior year income taxes | (4.4 | ) | (2.5 | ) | – | – | ||||||||||
Non-deductible preferred share dividends | 2.7 | 1.5 | 3.3 | 1.5 | ||||||||||||
Non-deductible regulatory amortization (note 14) | 11.8 | 6.7 | 9.3 | 4.1 | ||||||||||||
Other | (5.7 | ) | (3.2 | ) | (3.3 | ) | (1.4 | ) | ||||||||
| (12.8 | ) | (7.1 | )% | 48.9 | 21.7 | % | ||||||||||
Income taxes – current | (47.5 | ) | – | 51.0 | – | |||||||||||
Income taxes – future (note 5) | $ | 34.7 | – | $ | (2.1 | ) | – | |||||||||
The future income tax assets and liabilities comprise the following: | ||||||||||||||||
| Current Portion | Long-Term Portion | |||||||||||||||
MILLIONS OF DOLLARS
| 2010
| 2009
| 2010
| 2009
| ||||||||||||
Future income tax assets: | ||||||||||||||||
Derivatives | $ | 7.6 | $ | 25.8 | – | – | ||||||||||
Tax loss carry forwards | 7.6 | 13.3 | $ | 9.2 | $ | 2.4 | ||||||||||
Property, plant and equipment | – | – | 1.1 | 0.8 | ||||||||||||
Other | 13.0 | 7.6 | 2.6 | 1.2 | ||||||||||||
| $ | 28.2 | $ | 46.7 | $ | 12.9 | $ | 4.4 | |||||||||
Future income tax liabilities: | ||||||||||||||||
Property, plant and equipment | – | – | $ | 353.7 | $ | 233.7 | ||||||||||
Net investment in direct financing lease | – | – | 32.0 | 18.8 | ||||||||||||
Tax loss carry forwards | – | – | (24.9 | ) | (27.8 | ) | ||||||||||
Derivatives | – | – | 3.7 | 3.4 | ||||||||||||
Asset retirement obligations | – | – | (63.2 | ) | (45.9 | ) | ||||||||||
Pension | – | – | 9.8 | 14.9 | ||||||||||||
Defeasance costs | – | – | 19.2 | 20.0 | ||||||||||||
Intangibles | – | – | (26.9 | ) | (26.4 | ) | ||||||||||
Deferral of FAM | – | – | 29.2 | (3.4 | ) | |||||||||||
Other | – | – | 27.2 | 6.8 | ||||||||||||
| – | – | $ | 359.8 | $ | 194.1 | |||||||||||
As at December 31, 2010, the Company has tax losses of $128.2 million (2009 – $131.9 million), which are reflected in future income tax assets or netted against future income tax liabilities as appropriate, and begin to expire in 2014. The Company has recognized a future tax asset for the amount more likely than not to be realized.
Accounting for the impact of rate regulation:
In the absence of rate-regulated accounting, future income tax expenses would have been recorded against net earnings and net earnings would be $73.4 million lower in 2010 (2009 – $20.2 million).
79
Table of Contents
10. PREFERRED SHARES ISSUED BY SUBSIDIARY
Preferred shares issued by subsidiary consist of NSPI’s preferred shares and are classified as a financial liability on the balance sheet.
AUTHORIZED:
Unlimited number of First Preferred Shares, issuable in series.
Unlimited number of Second Preferred Shares, issuable in series.
ISSUED AND OUTSTANDING:
| Millions
| Preferred Share Capital
| ||||||
December 31, 2008 | 10.4 | $ | 260.0 | |||||
Redemption of Series C First Preferred Shares | (5.0 | ) | (125.0 | ) | ||||
December 31, 2009 | 5.4 | 135.0 | ||||||
December 31, 2010 | 5.4 | $ | 135.0 | |||||
As at December 31, 2010 and 2009, the Company had 5.4 million 5.9 per cent Series D preferred shares with the following redemption features:
SERIES D FIRST PREFERRED SHARES:
Each Series D First Preferred Share is entitled to a $1.475 per share per annum fixed cumulative preferential dividend, as and when declared by the Board of Directors, accruing from the date of issue and payable quarterly on the fifteenth day of January, April, July and October of each year.
On and after October 15, 2015, Series D First Preferred Shares are redeemable by NSPI, in whole at any time or in part from time to time at $25 per share plus accrued and unpaid dividends. NSPI also has the option, commencing October 15, 2015, to exchange the Series D First Preferred Shares into Emera Inc. common shares, determined by dividing $25 by the greater of $2 and the market price of the Emera Inc. common shares.
Commencing on and after January 15, 2016, with prior notice and prior to any dividend payment date, each Series D First Preferred Share will be exchangeable at the option of the holder into fully paid and freely tradable Emera Inc. common shares, determined by dividing $25 by the greater of $2 and the market price of the Emera Inc. common shares, subject to the right of NSPI to redeem such shares for cash or to cause the holders of such shares to sell on the exchange date all or any part of such shares to substitute purchasers found by NSPI. NSPI will pay all accrued and unpaid dividends to the exchange date.
SERIES C FIRST PREFERRED SHARES:
On April 1, 2009, NSPI redeemed its outstanding Cumulative Redeemable First Preferred Shares, Series C for a redemption price of $25 per share for a total of $125 million. Each share was entitled to a $1.225 per share per annum fixed cumulative preferential dividend, as and when declared by the Board of Directors, accruing from the date of issue and payable quarterly on the first day of January, April, July and October of each year.
11. EARNINGS PER SHARE
Earnings per share for 2010 are as follows:
| 000000 | 000000 | 000000 | 000000 | |||||||||||||
2010
| ||||||||||||||||
Net Earnings
|
Weighted Average
|
EPS ($)
| ||||||||||||||
Basic EPS | $ | 191.1 | 113.7 | $ | 1.68 | |||||||||||
Series D preferred shares of NSPI | 7.5 | 5.1 | (0.01 | ) | ||||||||||||
Performance share units and deferred share units | – | 0.8 | (0.01 | ) | ||||||||||||
Other share-based compensation | – | 0.7 | (0.01 | ) | ||||||||||||
Diluted EPS | $ | 198.6 | 120.3 | $ | 1.65 | |||||||||||
80 EMERA INC. 2010 ANNUAL FINANCIAL REPORT
Table of Contents
NOTES TO THE CONSOLIDATED FINANCIAL STATEMENTS
Earnings per share for 2009 are as follows:
| �� | 2009
| |||||||||||||||
Net Earnings
| Weighted Average
|
EPS ($)
| ||||||||||||||
Basic EPS | $ | 175.7 | 112.5 | $ | 1.56 | |||||||||||
Series C preferred shares of NSPI | 1.5 | 1.5 | (0.01 | ) | ||||||||||||
Series D preferred shares of NSPI | 7.8 | 6.3 | (0.02 | ) | ||||||||||||
Performance share units and deferred share units | – | 0.7 | (0.01 | ) | ||||||||||||
Other share-based compensation | – | 0.3 | – | |||||||||||||
Diluted EPS | $ | 185.0 | 121.3 | $ | 1.52 | |||||||||||
Where the exercise price exceeded the average price for the period, senior management share options were excluded from the above calculation because they did not dilute earnings per share.
12. ACCOUNTS RECEIVABLE
At December 31, 2010, the Company had unbilled revenue included in accounts receivable in the amount of $102.7 million (2009 – $98.4 million). The unbilled revenue for NSPI, Bangor, MPS and GBPC is an estimate of the amount of revenue related to energy delivered to customers since the date their meters were last read. The unbilled revenue related to Brunswick Pipeline is an estimate of toll revenue at the end of each month. Actual results may differ from these estimates.
NSPI had a natural gas purchase agreement, which settled in November 2010, which included a price adjustment clause covering three years of natural gas purchases. The clause stated NSPI would pay for all gas purchases at the agreed contract price, but would be entitled to a price rebate on a portion of the volumes, settled in November 2007 and November 2010. At December 31, 2009, the receivable was $82.1 million.
13. INVENTORY
The change in inventory is due to the following:
| 00000000 | 00000000 | 00000000 | 00000000 | |||||||||||||
FOR THE YEAR ENDED MILLIONS OF DOLLARS
| Fuel Inventory December 31 | Materials Inventory December 31 | ||||||||||||||
2010
| 2009
| 2010
| 2009
| |||||||||||||
Inventory, beginning of period | $ | 144.5 | $ | 101.7 | $ | 30.0 | $ | 29.5 | ||||||||
Purchases | 327.9 | 362.0 | 45.7 | 39.3 | ||||||||||||
Write-down of inventory to net realizable value | – | – | (1.2 | ) | (0.7 | ) | ||||||||||
Inventories expensed | (346.4 | ) | (319.2 | ) | (22.5 | ) | (22.1 | ) | ||||||||
Inventories capitalized | – | – | (26.5 | ) | (23.2 | ) | ||||||||||
Increase in inventory resulting from acquisitions | 3.1 | – | 14.2 | – | ||||||||||||
Other | – | – | 9.0 | 7.2 | ||||||||||||
Inventory, end of period | $ | 129.1 | $ | 144.5 | $ | 48.7 | $ | 30.0 | ||||||||
The Company has not pledged inventory as security for liabilities.
81
Table of Contents
14. OTHER ASSETS AND LIABILITIES
Other assets and liabilities, including the impact of rate-regulated accounting policies, include the following:
| 000000000 | 000000000 | |||||||
MILLIONS OF DOLLARS
| 2010
| 2009
| ||||||
Other assets: | ||||||||
Regulatory assets: | ||||||||
Future income tax regulatory asset | $ | 199.6 | $ | 63.6 | ||||
Unamortized defeasance costs | 94.6 | 106.7 | ||||||
Deferral of FAM | 92.9 | – | ||||||
Pre-2003 income tax and related interest | 56.9 | 75.2 | ||||||
Costs to restructure purchased power contracts | 24.3 | 15.4 | ||||||
Seabrook nuclear project | 14.3 | 10.4 | ||||||
Deferral of income and capital taxes not included in Q1 2005 rates | 10.0 | 11.9 | ||||||
Deferral of demand side management | 7.5 | 9.7 | ||||||
Hydro-Québec obligation | 5.7 | 6.3 | ||||||
Maine Yankee decommissioning costs | 3.8 | 3.5 | ||||||
Deferral of vegetation management | 2.0 | 2.0 | ||||||
Deferred restructuring costs | 1.8 | 2.9 | ||||||
Stranded cost revenue requirement levelizers | 1.4 | 3.5 | ||||||
Deferral of Tufts Cove derivatives | 1.3 | 9.6 | ||||||
Held-for-trading natural gas contracts | – | 3.9 | ||||||
Other | 13.9 | 3.6 | ||||||
| 530.0 | 328.2 | |||||||
Non-regulatory assets: | ||||||||
Accrued pension asset – NSPI plan (note 4) | 110.7 | 94.4 | ||||||
Accrued pension asset – Bangor Hydro plan (note 4) | 1.8 | 1.7 | ||||||
Accrued pension asset – MPS plan (note 4) | 1.1 | – | ||||||
Other | 8.5 | 3.1 | ||||||
| 122.1 | 99.2 | |||||||
| $ | 652.1 | $ | 427.4 | |||||
MILLIONS OF DOLLARS
| 2010
| 2009
| ||||||
Other liabilities: | ||||||||
Regulatory liabilities: | ||||||||
2010 renewable tax benefits deferral | $ | 14.5 | – | |||||
Held-for-trading natural gas contracts | 12.3 | $ | 4.7 | |||||
Deferral of Tufts Cove derivatives | 2.0 | 10.4 | ||||||
Deferral of FAM | – | 9.9 | ||||||
Other | 4.9 | 6.6 | ||||||
| 33.7 | 31.6 | |||||||
Non-regulatory liabilities: | ||||||||
Accrued pension and non-pension benefit liability – NSPI plan (note 4) | 64.8 | 61.8 | ||||||
Accrued non-pension benefit liability – Bangor Hydro plan (note 4) | 30.4 | 29.8 | ||||||
Accrued non-pension benefit liability – MPS plan (note 4) | 3.5 | – | ||||||
Accrued non-pension benefit liability – GBPC plan (note 4) | 4.1 | – | ||||||
Hydro-Québec obligation | 5.7 | 6.3 | ||||||
Maine Yankee decommissioning liability | 3.8 | 3.5 | ||||||
Unearned revenue | 1.1 | 1.7 | ||||||
Other | 14.6 | 13.4 | ||||||
| 128.0 | 116.5 | |||||||
| $ | 161.7 | $ | 148.1 | |||||
82 EMERA INC. 2010 ANNUAL FINANCIAL REPORT
Table of Contents
NOTES TO THE CONSOLIDATED FINANCIAL STATEMENTS
Regulatory assets consist of:
FUTURE INCOME TAX REGULATORY ASSET
In accordance with the Company’s rate-regulated accounting policies covering income taxes, Emera deferred any future income taxes to a regulatory asset where the future income taxes are expected to be included in future rates. Absent this accounting policy, Emera’s 2010 net earnings would be $73.4 million lower (2009 – $20.2 million).
UNAMORTIZED DEFEASANCE COSTS
Upon privatization in 1992, NSPI became responsible for managing a portfolio of defeasance securities held in trust, which as at December 31, 2010 and 2009, totalled $1.0 billion. The excess of the cost of defeasance investments over the face value of the related debt is deferred on the balance sheet and amortized over the life of the defeased debt as permitted by the UARB. In the absence of UARB approval, the losses would have been expensed as incurred and net earnings would be $12.1 million higher in 2010 and 2009.
DEFERRAL OF FUEL ADJUSTMENT MECHANISM
As discussed in Note 5, the UARB approved the implementation of a FAM in NSPI’s 2009 General Rate Decision effective January 1, 2009.
In the absence of UARB approval, the fuel adjustment would not have been recognized and net earnings for the year ended December 31, 2010 would be $80.4 million ($56.3 million after-tax) lower (2009 – $9.9 million or $6.5 million after-tax higher).
PRE-2003 INCOME TAX AND RELATED INTEREST
NSPI has a regulatory asset related to pre-2003 income taxes that have been paid, but not yet recovered from customers. This circumstance arose when NSPI claimed capital cost allowance (“CCA”) deductions in its corporate income tax returns that were ultimately disallowed by a decision of the Supreme Court of Canada. NSPI applied to the regulator to include recovery of these costs in customer rates. In its February 5, 2007 decision, the UARB approved recovery of this regulatory asset over eight years, commencing April 1, 2007.
In January 2010, NSPI reached an agreement with stakeholders on its calculation of regulated ROE. The agreement provides the Company with flexibility in amortizing the pre-2003 income tax regulatory asset, allowing the Company to recognize additional amortization in current periods and reducing amounts in future periods. Accordingly, to allow flexibility relating to future customer rate requirements, NSPI recorded an additional discretionary $4.8 million of regulatory amortization expense for the year ended December 31, 2010 (December 31, 2009 – $10.0 million). In the absence of UARB approved recovery, the liability would have been expensed when incurred, therefore net earnings would be $18.3 million higher in 2010 (2009 – $24.6 million).
In 2009, NSPI recorded an income tax recovery of $5.5 million relating to manufacturing and processing deductions claimed for its 1999–2003 amended corporate income tax returns, which reduced the regulatory asset.
COSTS TO RESTRUCTURE POWER PURCHASE CONTRACTS
Bangor Hydro has power purchase contracts, which it was required to negotiate when oil prices were high, with several independent power producers known as small power production facilities. The cost of power from these facilities is more than Bangor Hydro would incur from other sources if it were not obligated under these contracts. Bangor Hydro attempted to alleviate the adverse impact of these high-cost contracts and in doing so incurred costs to restructure certain of the contracts. The MPUC has allowed Bangor Hydro to defer these costs and recover them in stranded cost rates. The contract restructuring costs are being recovered over a 20-year period ending in June 2018. The annual amortization is approximately $2.0 million. In the absence of the MPUC’s approval, these BHE costs would have been expensed as incurred and net earnings would have been $1.8 million ($1.0 million after-tax) higher in 2010 (2009 – $1.9 million or $1.1 million after-tax).
MPS also had a similar power purchase contract, which expired December 31, 2006. The MPUC allowed MPS to defer the cost of the purchased power in excess of the market price at which MPS was able to sell the power. MPS is in the process of recovering this regulatory asset in stranded costs. Recovery of this regulatory asset varies each year, in accordance with the approved stranded cost rates, in order to maintain levelized stranded cost rates.
SEABROOK NUCLEAR PROJECT
Bangor Hydro and MPS were participants in the Seabrook nuclear project in Seabrook, New Hampshire. On December 31, 1984, Bangor Hydro had almost $87 million invested in Seabrook, but because the uncertainties arising out of the Seabrook Project were having an adverse impact on Bangor Hydro’s financial condition, an agreement for the sale of Seabrook was reached in mid-1985 and was finalized in November 1986. In 1985, the MPUC issued an order disallowing recovery of certain Seabrook costs, but provided for the recovery through customer rates of 70 per cent of Bangor Hydro’s year-end 1984 investment in Seabrook Unit 1 over 30 years ending in October 2015. For BHE, in the absence of MPUC approval, the loss on sale would have been recognized when incurred and net earnings would have been $1.8 million ($1.0 million after-tax) higher in 2010 (2009 – $1.9 million or $1.1 million after-tax). MPS deferred $43.1 million of costs associated with Seabrook, scheduled for recovery through 2016.
83
Table of Contents
DEFERRAL OF INCOME AND CAPITAL TAXES NOT INCLUDED IN Q1 2005 RATES
The UARB agreed to allow NSPI to defer taxes not reflected in rates for the period January 1, 2005 until April 1, 2005, the date when new rates became effective. In 2005, NSPI deferred $16.7 million, consisting of $4.5 million of provincial and federal grants and $12.2 million in income taxes, reflecting increases in these taxes since rates were last set in 2002. In its February 2007 decision, the UARB approved recovery of this regulatory asset over eight years, commencing April 1, 2007. In the absence of UARB approval, these taxes would not have been deferred and net earnings for 2010 would be $1.9 million higher (2009 – $1.9 million).
DEFERRAL OF DEMAND SIDE MANAGEMENT
The UARB agreed to allow NSPI to defer up to $12.8 million of demand side management expenditures for the period January 1, 2008, through December 31, 2009, to be recovered in rates over six years commencing January 1, 2009. In the absence of the UARB’s approval, these costs would not have been deferred and net earnings for 2010 would be $2.2 million higher (2009 – $9.4 million lower).
HYDRO-QUÉBEC OBLIGATION
The obligation associated with Hydro-Québec represents the estimated present value of Bangor Hydro’s estimated future payments for net costs associated with ownership and operation of the Hydro-Québec intertie between the New England utilities and Hydro-Québec. The obligation has been recognized in “Other liabilities” and the MPUC has permitted recovery of this obligation. The regulatory asset and obligation are being reduced as expenses are incurred with the reduction of the regulatory asset amortized to purchase power expense. In the absence of regulatory approval, 2010 net earnings would be $0.2 million ($0.1 million after-tax) higher (2009 – $0.4 million or $0.2 million after-tax).
MAINE YANKEE DECOMMISSIONING COSTS
Bangor Hydro owns seven per cent of the common stock of Maine Yankee and MPS owns five per cent of the common stock of Maine Yankee. In 1997, Maine Yankee permanently shut down its nuclear generating plant. Pursuant to a contract with Maine Yankee, Bangor Hydro and MPS are required to pay their pro-rata shares of Maine Yankee’s decommissioning costs. Bangor Hydro’s share of the estimated decommissioning costs were approximately $2.4 million in 2010 (2009 – $3.8 million). Maine Yankee expense recovery is included in Bangor Hydro’s stranded cost revenues, and along with all stranded cost revenues, purchased power, and Hydro-Québec costs, are fully recoverable. For any variance between the actual amount of these items and the amounts used in setting rates, a regulatory deferral is recorded with a credit or charge to regulatory amortizations at both Bangor Hydro and MPS. Any over- or under-recovery will be reviewed at future rate proceedings with the MPUC. For BHE, in the absence of regulatory approval, the Maine Yankee decommissioning costs would have been expensed when incurred and net earnings would have been $1.0 million ($0.6 million after-tax) higher in 2010 (2009 – $0.4 million or $0.2 million after-tax).
DEFERRAL OF VEGETATION MANAGEMENT
The UARB agreed to allow NSPI to defer up to $2.0 million of vegetation management spending in 2008 to be recovered in rates in a future period. The investment in vegetation management spending was part of a specific initiative to improve the reliability of service provided to customers. In the absence of UARB approval, these costs would have been expensed as incurred.
DEFERRED RESTRUCTURING COSTS
In conjunction with Bangor Hydro’s Alternative Rate Plan, Bangor Hydro was provided with accounting orders from the MPUC to defer and amortize over ten years certain employee transition costs. Eligible for deferral were the 2002 and 2003 employee transition costs related to reductions in the cost of operations and employee transition costs associated with Bangor Hydro’s automated meter reading project and the outsourcing of information technology support in 2004 and 2005. In the absence of regulatory approval, these costs would have been expensed as incurred and 2010 net earnings would have been $1.0 million ($0.6 million after-tax) higher (2009 – $1.1 million or $0.7 million after-tax).
STRANDED COST REVENUE REQUIREMENT LEVELIZER
Bangor Hydro’s stranded cost rates are reset every three years and are designed to recover Bangor Hydro’s cumulative stranded cost revenue requirements over the three-year period. The most recently approved stranded cost rates are in effect from March 2008 to February 2011. While the stranded cost revenue requirements differ throughout the period due to changes in stranded cost revenues and expenses, the annual stranded cost revenues are the same during the period. To levelize the impact of the varying revenue requirements, cost or revenue deferrals are recognized. This levelizer is recognized only as a result of regulatory accounting and the stranded cost ratemaking process. Absent regulatory accounting, the levelizer mechanism would not exist, and the methodology for determining Bangor Hydro’s rates associated with stranded costs is not known. In the absence of regulatory approval, net earnings for 2010 would be $2.0 million ($1.2 million after-tax) higher (2009 – $0.2 million or $0.1 million after-tax).
84 EMERA INC. 2010 ANNUAL FINANCIAL REPORT
Table of Contents
NOTES TO THE CONSOLIDATED FINANCIAL STATEMENTS
DEFERRAL OF TUFTS COVE DERIVATIVES
In accordance with Handbook Standard 3865 Hedges, NSPI determined that it could not meet the probability requirement of the standard for its derivatives in place to hedge natural gas and heavy fuel oil for TUC. This is due to the generating station’s ability to fuel switch and NSPI’s economic dispatch based on the relative cost of these two fuels. The UARB has allowed NSPI to apply hedge accounting to these derivatives as long as the other requirements of the Handbook are met. This accounting policy permits NSPI to defer the fair value of hedges that are no longer required because of fuel switching.
In 2009, the UARB approved an amendment to NSPI’s accounting practice to include all Tufts Cove financial commodity hedges which are no longer required. This change in practice will impact the timing of recognition between “Fuel for generation and purchased power” and “Fuel adjustment” as a result of the FAM implemented in 2009. The change in accounting practice has been applied prospectively, beginning January 1, 2009, as required by the UARB.
Absent UARB approval, NSPI would be required to recognize the change in fair value of these derivatives in “Fuel for generation and purchased power” with an offset to “Fuel adjustment”. However, with the approval of FAM, there would be no material earnings impact.
HELD-FOR-TRADING NATURAL GAS CONTRACTS
In accordance with implementing Standard 3855 Financial Instruments – Recognition and Measurement, the Company has contracts for the purchase and sale of natural gas at TUC that are considered HFT derivatives and accordingly are recognized on the balance sheet at fair value. This reflects NSPI’s history of buying and reselling any natural gas not used in the production of electricity at TUC. Changes in fair value of HFT derivatives are normally recognized in net earnings. In accordance with NSPI’s rate-regulated accounting policy for financial instruments and hedges relating to TUC fuel, NSPI has deferred any changes in fair value to a regulatory asset or liability. Absent UARB approval, NSPI would be required to recognize the changes in fair value of these derivatives in earnings. However, with the approval of FAM, there would be no material earnings impact.
OTHER
Bangor Hydro and MPS have other regulatory assets, which are being amortized to net earnings over varying lives. These deferred costs would have been expensed as incurred in the absence of approval from one of its regulators, and BHE net earnings would have been $7.1 million ($4.2 million after-tax) higher in 2010 (2009 – $2.6 million or $1.6 million after-tax).
Regulatory liabilities consist of:
2010 RENEWABLE TAX BENEFIT DEFERRAL
In 2010, the UARB granted NSPI approval to defer certain tax benefits related to renewable energy projects arising in 2010. The UARB will convene a proceeding in 2011 to discuss how this deferral will be applied. Absent UARB approval, these benefits would not have been deferred and net earnings would be $14.5 million higher.
HELD-FOR-TRADING NATURAL GAS CONTRACTS
As discussed above, in accordance with NSPI’s accounting policy for financial instruments and hedges relating to TUC fuel, NSPI has deferred any changes in fair value of its natural gas contracts to a regulatory asset or liability. Absent UARB approval, NSPI would be required to recognize the changes in fair value of these derivatives in earnings. However, with the approval of FAM, there would be no material earnings impact.
DEFERRAL OF TUFTS COVE DERIVATIVES
As discussed above, NSPI has an accounting policy that permits NSPI to defer the fair value of any TUC financial commodity hedges that are no longer required. Absent UARB approval, NSPI would be required to recognize the changes in fair value of these derivatives in earnings. However, with the approval of FAM, there would be no material earnings impact.
OTHER
Bangor Hydro and MPS have other regulatory liabilities, which are being amortized to net earnings over varying lives. These deferred gains would have been expensed as incurred in the absence of approval from one of its regulators, and net earnings would have been $1.7 million ($1.0 million after-tax) higher in 2010 (2009 – $0.3 million or $0.1 million after-tax).
85
Table of Contents
15. INTANGIBLES
Intangibles are comprised of the following:
| 00000000 | 00000000 | 00000000 | ||||||||||
2010
| ||||||||||||
MILLIONS OF DOLLARS
| Cost
|
Accumulated
| Net
| |||||||||
Transmission | $ | 74.1 | $ | 16.8 | $ | 57.3 | ||||||
Distribution | 26.1 | 6.9 | 19.2 | |||||||||
Other | 41.5 | 14.5 | 27.0 | |||||||||
| $ | 141.7 | $ | 38.2 | $ | 103.5 | |||||||
2009
| ||||||||||||
MILLIONS OF DOLLARS
| Cost
| Accumulated
|
Net Book
| |||||||||
Transmission | $ | 69.4 | $ | 15.7 | $ | 53.7 | ||||||
Distribution | 23.4 | 6.6 | 16.8 | |||||||||
Other | 41.7 | 20.1 | 21.6 | |||||||||
| $ | 134.5 | $ | 42.4 | $ | 92.1 | |||||||
Amortization expense for the year ended December 31, 2010 is $5.4 million (2009 – $4.6 million).
16. NET INVESTMENT IN DIRECT FINANCING LEASE
Brunswick Pipeline commenced service on July 16, 2009, transporting re-gasified LNG for Repsol Energy Canada under a 25-year firm service agreement. The agreement meets the definition of a direct financing capital lease for accounting purposes. The net investment in direct financing lease is the sum of the expected toll revenues, less the estimated operating costs on the pipeline shown net of unearned finance income. The unearned income is recognized in income over the life of the lease using a constant rate of interest equal to the internal rate of return on the lease.
| 00000000 | 00000000 | 00000000 | 00000000 | 00000000 | ||||||||||||||||
MILLIONS OF DOLLARS
| 2010
| 2009
| ||||||||||||||||||
Total minimum lease payments to be received | $ | 1,678.1 | $ | 1,746.9 | ||||||||||||||||
Less: amounts representing estimated executory costs | (258.7 | ) | (252.2 | ) | ||||||||||||||||
Minimum lease payments receivable | 1,419.4 | 1,494.7 | ||||||||||||||||||
Less: unearned finance lease income | (931.2 | ) | (1,017.8 | ) | ||||||||||||||||
Total net investment in direct financing lease | $ | 488.2 | $ | 476.9 | ||||||||||||||||
Future minimum lease payments to be received for the next five years: | ||||||||||||||||||||
| For the year ended December 31 | ||||||||||||||||||||
MILLIONS OF DOLLARS
| 2011
| 2012
| 2013
| 2014
| 2015
| |||||||||||||||
Minimum lease payments to be received | $ | 57.9 | $ | 58.8 | $ | 58.8 | $ | 60.0 | $ | 61.6 | ||||||||||
Less: amounts representing estimated executory costs | 8.9 | 9.1 | 9.3 | 9.4 | 9.6 | |||||||||||||||
Minimum lease payments receivable | $ | 49.0 | $ | 49.7 | $ | 49.5 | $ | 50.6 | $ | 52.0 | ||||||||||
86 EMERA INC. 2010 ANNUAL FINANCIAL REPORT
Table of Contents
NOTES TO THE CONSOLIDATED FINANCIAL STATEMENTS
17. PROPERTY, PLANT AND EQUIPMENT
Property, plant and equipment is comprised of the following:
| 00000000 | 00000000 | 00000000 | ||||||||||
2010
| ||||||||||||
MILLIONS OF DOLLARS
| Cost
| Accumulated
|
Net Book Value
| |||||||||
Generation | ||||||||||||
Thermal | $ | 1,965.1 | $ | 827.5 | $ | 1,137.6 | ||||||
Diesel and steam | 126.9 | 52.4 | 74.5 | |||||||||
Gas turbines | 89.3 | 29.8 | 59.5 | |||||||||
Combustion turbines | 83.5 | 17.6 | 65.9 | |||||||||
Hydroelectric | 474.0 | 154.4 | 319.6 | |||||||||
Wind turbines | 219.7 | 2.5 | 217.2 | |||||||||
Transmission | 922.6 | 359.6 | 563.0 | |||||||||
Distribution | 1,601.2 | 800.2 | 801.0 | |||||||||
Other | 430.4 | 222.7 | 207.7 | |||||||||
Other, under capital lease | 6.8 | 2.1 | 4.7 | |||||||||
| $ | 5,919.5 | $ | 2,468.8 | $ | 3,450.7 | |||||||
2009
| ||||||||||||
MILLIONS OF DOLLARS
| Cost
| Accumulated
|
Net Book Value
| |||||||||
Generation | ||||||||||||
Thermal | $ | 1,902.6 | $ | 796.4 | $ | 1,106.2 | ||||||
Gas turbines | 85.9 | 25.0 | 60.9 | |||||||||
Combustion turbines | 78.8 | 20.4 | 58.4 | |||||||||
Hydroelectric | 454.8 | 148.9 | 305.9 | |||||||||
Wind turbines | 2.1 | 0.7 | 1.4 | |||||||||
Transmission | 811.6 | 338.1 | 473.5 | |||||||||
Distribution | 1,418.0 | 714.8 | 703.2 | |||||||||
Other | 396.6 | 181.6 | 215.0 | |||||||||
Other, under capital lease | 10.7 | 1.5 | 9.2 | |||||||||
| $ | 5,161.1 | $ | 2,227.4 | $ | 2,933.7 | |||||||
87
Table of Contents
18. ACQUISITIONS
Grand Bahama Power Company Limited
On December 22, 2010, Emera purchased a 50 per cent interest in GBPC and an additional 10.7 per cent interest in ICDU, owner of the remaining 50 per cent interest in GBPC, for $88.1 million USD ($87.7 million CAD), bringing Emera’s total ownership of GBPC to 80.4 per cent. GBPC is an integrated utility with 19,000 customers and has 137 megawatts (“MW”) of installed oil-fired capacity. The Grand Bahama Port Authority regulates the utility and has granted GBPC a licensed, regulated and exclusive franchise to produce, transmit and distribute electricity on the island until 2054. There is a fuel pass-through mechanism and flexible tariff adjustment policies to ensure that costs are recovered and a reasonable return earned.
The acquisition has been accounted for under the purchase method of accounting as Emera has determined it has control of GBPC through the combination of both direct and indirect interests. At December 31, 2010, the assets and liabilities of GBPC have been consolidated on Emera’s balance sheet and there was no material earnings impact in 2010 related to this transaction. GBPC is included in the segments “Other” in Note 3 Segment Information.
The following summarizes the transaction:
PRELIMINARY PURCHASE PRICE ALLOCATION:
| Millions of Dollars
| |||
Net working capital | $ | 4.0 | ||
Property, plant and equipment | 96.8 | |||
Goodwill | 34.2 | |||
Long-term debt | (47.3 | ) | ||
Total net assets | $ | 87.7 | ||
When Emera purchased its 50 per cent interest in ICDU in September 2008, the transaction included goodwill of $15.2 million CAD. Also included in ICDU was inherent goodwill of $11.5 million CAD from when ICDU purchased its 50 per cent interest in GBPC. As Emera now controls both companies and consolidates both GBPC’s and ICDU’s assets and liabilities, all of the goodwill is now recognized in Emera.
The purchase price allocation has not yet been finalized as the Company has not completed the valuation of property, plant and equipment in GBPC and therefore the allocation of the purchase price has been estimated, and is subject to change.
The purchase price was funded with existing credit facilities.
Maine & Maritimes Corporation
On December 21, 2010, Emera purchased all of the outstanding shares of MAM for $80.4 million USD ($81.9 million CAD). MAM is the parent company of MPS, a regulated electric transmission and distribution utility serving approximately 36,000 electricity customers in northern Maine.
The acquisition has been accounted for under the purchase method of accounting as Emera has determined it has control of MAM. There was no material earnings impact in 2010 related to this transaction. MAM is included in the segments “Other” in Note 3 Segment Information.
The following summarizes the transaction:
PURCHASE PRICE ALLOCATION:
| Millions of Dollars
| |||
Net working capital | $ | 1.3 | ||
Property, plant and equipment | 69.4 | |||
Regulatory and other assets | 34.5 | |||
Goodwill | 35.9 | |||
Regulatory and other liabilities | (36.2 | ) | ||
Long-term debt | (23.0 | ) | ||
Total net assets | $ | 81.9 | ||
The purchase price allocation has not been finalized. A third-party valuation of the assets was not performed because the fair value of the regulated assets is equal to their rate base, since a regulated utility can only recover its cost/book value (i.e. rate base) plus a fair return.
The purchase price was funded with existing credit facilities.
88 EMERA INC. 2010 ANNUAL FINANCIAL REPORT
Table of Contents
NOTES TO THE CONSOLIDATED FINANCIAL STATEMENTS
Barbados Light & Power Company Limited
On May 11, 2010, Emera acquired a 38 per cent interest in Light & Power Holdings Ltd. (“LPH”), the parent company of Barbados Light & Power Company Limited (“BLPC”), for $85 million USD. BLPC is the sole utility operator on the island of Barbados, serving approximately 120,000 customers. BLPC has three power generation stations with 239 MW of installed capacity. There is a fuel pass-through mechanism to ensure costs are recovered and a reasonable return earned.
The acquisition has been accounted for as an equity investment, and accordingly, the investment was initially recorded at cost. Emera’s pro-rata share of the results since acquisition have been included in the carrying value of the investment and consolidated statements of earnings. Any dividends received or receivable reduces the carrying value of the investment. The carrying value of the investment and equity earnings related to the investment as at December 31, 2010 were $90.2 million and $5.4 million respectively. LPH is included in the segment “Other” in Note 3 Segment Information. The purchase was financed with existing credit facilities.
Bayside Power LP
On September 1, 2009, Emera’s subsidiary, Emera Energy Inc., purchased 100 per cent interest in the Bayside Power Limited Partnership (“Bayside”) for a $32.9 million cash consideration. Bayside owns a 260-megawatt gas-fired combined cycle electricity generating facility, built in 1999 and located in Saint John, New Brunswick. Bayside has a contract to 2021 to supply electricity for the months of November through March; and operates as a merchant facility, selling into the Maritimes and northeastern United States markets, for the balance of the year. Bayside can, at its sole option, extend the winter supply contract for an additional five years, through to March 31, 2026.
The acquisition has been accounted for under the purchase method of accounting as Emera Energy Inc. controls Bayside. Accordingly, the results of operations since the date of acquisition have been included in the consolidated statement of earnings. Bayside is included in the segment “Other” in Note 3 Segment Information.
The final fair value based on the purchase price allocation was as follows:
PRELIMINARY PURCHASE PRICE ALLOCATION:
| Millions of Dollars
| |||
Net working capital | $ | 2.6 | ||
Property, plant and equipment | 46.9 | |||
Mark-to-market on long-term gas supply purchase contracts liability | (10.7 | ) | ||
Future income taxes liability | (5.9 | ) | ||
Total net assets | $ | 32.9 | ||
The purchase price was funded with existing credit facilities.
19. INTEREST IN JOINT VENTURES
The following amounts represent the Company’s proportionate interest in its joint ventures’ financial position, operating results and cash flows included in the consolidated financial statements:
| 00000000 | 00000000 | |||||||
MILLIONS OF DOLLARS
| 2010
| 2009
| ||||||
Current assets | $ | 10.6 | $ | 7.8 | ||||
Non-current assets | 52.8 | 67.2 | ||||||
| $ | 63.4 | $ | 75.0 | |||||
Current liabilities | $ | 8.6 | $ | 13.5 | ||||
Non-current liabilities | 76.1 | 78.5 | ||||||
| $ | 84.7 | $ | 92.0 | |||||
Revenues | $ | 28.1 | $ | 53.4 | ||||
Expenses | (27.2 | ) | (39.0 | ) | ||||
Net earnings | $ | 0.9 | $ | 14.4 | ||||
Cash provided by operations | $ | 14.7 | $ | 17.3 | ||||
Cash used in investing activities | (1.6 | ) | (0.5 | ) | ||||
Cash used in financing activities | (12.6 | ) | (16.1 | ) | ||||
Increase in cash | $ | 0.5 | $ | 0.7 | ||||
89
Table of Contents
20. INTEREST IN JOINTLY CONTROLLED PROJECTS
In November 2009, NSPI signed a 20-year operating agreement with Renewable Energy Services Ltd. (“RESL”) for operation of a 23.3 MW wind energy project at Point Tupper, Nova Scotia. NSPI will acquire and retain title to specific property, plant and equipment, which is less than 50 per cent of the total project combined assets. Each company is entitled to its proportionate share of the net operating revenues based on the relative value of their assets.
NSPI has provided a guarantee for the indebtedness of RESL in connection with the project. The guarantee is up to a maximum of $25.4 million. NSPI holds a security interest in the assets of RESL, including the project assets.
Beginning August 2010, following the commencement of service, NSPI has recorded its share of the net operating revenues of the project. As at December 31, 2010, $25.4 million was included in “Property, plant and equipment” for NSPI’s portion of the Point Tupper wind energy project. NSPI’s share of the cash flows and the net earnings was immaterial for the year.
MPS is a party to a collaborative arrangement with Central Maine Power (“CMP”) to develop the Maine Power Connection Project. The terms of the arrangement were established in the Joint Development Agreement, dated October 1, 2008. The cost of development activities, including acquisition of land in the transmission corridor and acquisition of necessary governmental and regulatory permits and approvals, are shared between MPS and CMP, with MPS paying ten per cent of such costs, and CMP 90 per cent. MPS has deferred in “Other assets” $0.9 million of costs associated with the MPC project as of December 31, 2010.
21. GOODWILL
The change in goodwill is due to the following:
MILLIONS OF DOLLARS
| 2010
| 2009
| ||||||
Balance, beginning of year | $ | 87.6 | $ | 102.0 | ||||
Acquisitions | 95.6 | – | ||||||
Change in foreign exchange rate | (4.3 | ) | (14.4 | ) | ||||
Balance, end of year | $ | 178.9 | $ | 87.6 | ||||
22. ASSET RETIREMENT OBLIGATIONS
Asset retirement obligations (“ARO”) are recognized when incurred and represent the fair value, using the Company’s credit-adjusted risk-free rate, of the Company’s estimated future cash flows necessary to discharge legal obligations related to reclamation of land at the Company’s thermal, hydro and combustion turbine sites, pipelines, and disposal of polychlorinated biphenyls (“PCBs”) in its transmission and distribution equipment. Estimated future cash flows are based on the Company’s completed depreciation studies, prior experience, estimated useful lives, and governmental regulatory requirements, and the costs of activities such as demolition, restoration and remedial work based on present-day methods and technologies. Actual results may differ from these estimates.
The change in ARO is due to the following:
MILLIONS OF DOLLARS
| 2010
| 2009
| ||||||
Balance, beginning of year | $ | 104.5 | $ | 88.0 | ||||
Accretion included in depreciation expense | 3.6 | 3.4 | ||||||
Accretion deferred to regulatory asset | 2.1 | 1.5 | ||||||
Liabilities settled | (1.2 | ) | (1.2 | ) | ||||
Additions | 32.8 | 12.8 | ||||||
Balance, end of year | $ | 141.8 | $ | 104.5 | ||||
90 EMERA INC. 2010 ANNUAL FINANCIAL REPORT
Table of Contents
NOTES TO THE CONSOLIDATED FINANCIAL STATEMENTS
The key assumptions used to determine the ARO are as follows:
ASSET
| Credit-Adjusted
| Estimated
| Expected
| |||||||||
Thermal | 5.30% | $ | 258.9 | 10 – 29 years | ||||||||
Hydro | 5.27% | 101.4 | 21 – 51 years | |||||||||
Wind | 5.21% | 45.5 | 13 – 20 years | |||||||||
Combustion turbines | 5.25% | 12.9 | 1 – 14 years | |||||||||
Transmission and distribution | 5.74% | 21.6 | 1 – 15 years | |||||||||
Pipeline | 3.80% | 11.0 | 39 years | |||||||||
| $ | 451.3 | |||||||||||
Some of the Company’s hydro, transmission and distribution assets may have additional ARO. As the Company expects to use the majority of its installed assets for an indefinite period, no removal date can be determined and, consequently, a reasonable estimate of the fair value of any related ARO cannot be made at this time.
Additionally, some of the Company’s transmission and distribution assets may have conditional ARO, the fair value of which cannot be reasonably estimated as sufficient information does not exist to estimate the obligation. A liability will be recognized in the period in which sufficient information becomes available.
Accounting for the impact of rate regulation:
Any difference between the amount approved by the regulator of NSPI as depreciation expense and the amount that would have been calculated under the accounting standard for ARO is recognized as a regulatory asset in “Property, plant and equipment”. In the absence of this deferral, net earnings for 2010 would be $2.1 million lower (2009 – $1.5 million).
23. SHORT-TERM DEBT
For the year ended December 31, short-term debt consists of:
| 00000000 | ||||
MILLIONS OF DOLLARS
| 2010
| |||
Short-term discount notes bearing interest at prevailing market rates plus applicable fees, which on December 31, 2010 averaged 2.20%. | $ | 176.3 | ||
LIBOR loans bearing interest at prevailing market rates plus applicable fees, which on December 31, 2010 averaged 2.01%. | 19.1 | |||
Advances, which when drawn upon against operating lines of credit, bear interest at the prime rate plus a bank spread, which on December 31, 2010 was 3.00% in Canada, 3.25% in the US and Bahamian prime of 5.50%. | 5.0 | |||
Promissory note issued to Algonquin Power & Utilities Corp. | 27.7 | |||
| $ | 228.1 | |||
MILLIONS OF DOLLARS
| 2009
| |||
Short-term discount notes bearing interest at prevailing market rates plus applicable fees, which on December 31, 2009 averaged 0.35%. | $ | 193.3 | ||
LIBOR loans bearing interest at prevailing market rates plus applicable fees, which on December 31, 2009 averaged 0.88%. | 49.4 | |||
Advances, which when drawn upon against operating lines of credit, bear interest at the prime rate plus a bank spread, which on December 31, 2009 was 2.25% in Canada and 3.25% in the US. | 29.9 | |||
Promissory note issued to Algonquin Power & Utilities Corp. | 27.7 | |||
| $ | 300.3 | |||
This short-term debt is unsecured.
91
Table of Contents
24. LONG-TERM DEBT
Long-term debt includes the issuances detailed below. Medium-term notes and debentures are issued under trust indentures at fixed interest rates, and are unsecured unless noted below. Also included are certain bankers’ acceptances and commercial paper where the Company has the intention and the unencumbered ability to refinance the obligations for a period greater than one year.
Effective Average Interest Rate % | Amount Outstanding | |||||||||||||||||||
MILLIONS OF DOLLARS
| 2010
| 2009
| Years of Maturity
| 2010
| 2009
| |||||||||||||||
Emera | ||||||||||||||||||||
Bankers acceptances, LIBOR loans and advances (1) | 2.82 | 2.77 | 3 year renewal | $ | 250.0 | $ | 221.6 | |||||||||||||
Medium-term notes | 4.45 | 4.45 | 2014 – 2019 | 475.1 | 475.0 | |||||||||||||||
Capital lease obligations | 4.85 | 4.84 | Various | 2.5 | 3.6 | |||||||||||||||
NSPI | ||||||||||||||||||||
Medium-term notes (2) | 6.56 | 6.60 | 2011 – 2097 | 1,610.0 | 1,410.0 | |||||||||||||||
Debentures | 9.75 | 9.75 | 2019 | 95.0 | 95.0 | |||||||||||||||
Short-term discount notes (3) | 1.07 | – | 3 year renewal | 241.7 | – | |||||||||||||||
Capital lease obligations | 6.30 | 3.89 | Various | 0.1 | 3.7 | |||||||||||||||
Bangor Hydro | ||||||||||||||||||||
(issued and payable in USD) | ||||||||||||||||||||
LIBOR loans and demand loans (1) | 2.26 | – | 3 year renewal | 38.6 | – | |||||||||||||||
General and refunding mortgage bonds – secured by property, plant and equipment | 9.74 | 9.74 | 2020 – 2022 | 49.7 | 52.3 | |||||||||||||||
Senior unsecured notes | 5.66 | 5.64 | 2011 – 2017 | 105.8 | 116.1 | |||||||||||||||
Bear Swamp | ||||||||||||||||||||
(issued and payable in USD) | ||||||||||||||||||||
Senior non-revolving credit facility secured by the assets of Bear Swamp | 1.44 | 1.00 | 2012 | 60.6 | 65.4 | |||||||||||||||
Maine and Maritimes | ||||||||||||||||||||
(issued and payable in USD) | ||||||||||||||||||||
Maine Public Utility Financing Bank Bonds (4) | 0.32 | – | 2021 – 2025 | 22.4 | – | |||||||||||||||
LIBOR loans | 1.38 | – | 2011 | 1.0 | – | |||||||||||||||
Capital lease obligations | 7.85 | – | 2011 – 2012 | 0.1 | – | |||||||||||||||
GBPC | ||||||||||||||||||||
(issued and payable in Bahamian dollars) | ||||||||||||||||||||
LIBOR loans | 5.96 | – | 2014 | 35.5 | – | |||||||||||||||
Medium-term notes | 7.07 | – | 2020 – 2032 | 49.7 | – | |||||||||||||||
| 3,037.8 | 2,442.7 | |||||||||||||||||||
Amount due within one year | (12.7 | ) | (108.1 | ) | ||||||||||||||||
Unamortized debt financing costs | (18.2 | ) | (16.2 | ) | ||||||||||||||||
| $ | 3,006.9 | $ | 2,318.4 | |||||||||||||||||
(1) Bankers acceptances, LIBOR loans and advances are drawn against operating credit facilities which mature in 2013. (2) Included in the medium-term notes above is an NSPI medium-term note of $40.0 million bearing interest at 8.50 per cent, maturing in 2026, and is extendable until 2056 at the option of the holders. (3) Short-term discount notes are backed by an operating credit facility which matures in 2013. (4) The interest on these USD variable rate bonds is fixed through the MPS interest rate swaps. The 1996 Series bonds of $13.6 million, due in 2021, are fixed at 4.42 per cent, while the 2000 Series bonds of $9.0 million, due in 2025, are fixed at 4.53 per cent.
As at December 31, 2010, long-term debt and obligations under a capital lease are due as follows:
MILLIONS OF DOLLARS
| ||||
Year of Maturity | ||||
Three-year renewable | $ | 530.3 | ||
2011 | 12.7 | |||
2012 | 83.6 | |||
2013 | 305.0 | |||
2014 | 304.9 | |||
2015 | 74.7 | |||
Greater than five years | 1,726.6 | |||
| $ | 3,037.8 | |||
92 EMERA INC. 2010 ANNUAL FINANCIAL REPORT
Table of Contents
NOTES TO THE CONSOLIDATED FINANCIAL STATEMENTS
25. COMMON SHARES
Authorized:Unlimited number of non-par value common shares.
ISSUED AND OUTSTANDING:
| Millions of Shares
| |||
December 31, 2008 | 112.21 | |||
Issued for cash under purchase plans | 0.45 | |||
Options exercised under senior management share option plan | 0.32 | |||
December 31, 2009 | 112.98 | |||
Issued for cash under purchase plans | 1.32 | |||
Options exercised under senior management share option plan | 0.32 | |||
December 31, 2010 | 114.62 | |||
As at December 31, 2010, there were 3.8 million (2009 – 4.1 million) common shares reserved for issuance under the senior management common share option plan, and 0.5 million (2009 – 0.7 million) common shares reserved for issuance under the employee common share purchase plan.
In February 2010, the Board of Directors approved a quarterly dividend increase to $0.2825 per common share effective May 3, 2010 and in September 2010 approved a further increase to $0.3250 effective November 1, 2010, reflecting an increase on an annualized basis to $1.30 per common share.
Dividend Reinvestment and Employee Common Share Purchase Plans
The Company has a Common Shareholder Dividend Reinvestment Plan, which provides an opportunity for shareholders to reinvest dividends and to make cash contributions for the purpose of purchasing common shares. The Company also has an Employee Common Share Purchase Plan to which the Company and employees make cash contributions for the purpose of purchasing common shares and which allows reinvestment of dividends.
Effective September 25, 2009, Emera changed its Common Shareholders Dividend Reinvestment and Share Purchase Plan (“the Plan”) to provide for a discount of up to five per cent from the average market price of Emera’s common shares for common shares purchased in connection with the reinvestment of cash dividends under the Plan. The Board of Directors of Emera also decided that the discount would be five per cent effective on and after the quarterly dividend payment on November 16, 2009, to shareholders of record on November 2, 2009.
Share-Based Compensation Plan
COMMON SHARE OPTION PLAN
The Company has a common share option plan that grants options to senior management of the Company for a maximum term of ten years. The option price for these shares is the closing market price of the shares on the day before the option is granted.
All options granted to date are exercisable on a graduated basis with up to 25 per cent of options exercisable on the first anniversary date and in further 25 per cent increments on each of the second, third and fourth anniversaries of the grant. If an option is not exercised within ten years, it expires and the optionee loses all rights thereunder. The holder of the option has no rights as a shareholder until the option is exercised and shares have been issued. The total number of shares to be optioned to any optionee shall not exceed five per cent of the issued and outstanding common shares on the date the option is granted.
If, before the expiry of an option in accordance with its terms, the optionee ceases to be an eligible person due to retirement or termination for other than just cause, such option may, subject to the terms thereof and any other terms of the plan, be exercised at any time within the 24 months following the date the optionee retires, but in any case prior to the expiry of the option in accordance with its terms.
If, before the expiry of an option in accordance with its terms, the optionee ceases to be an eligible person due to employment termination for just cause, resignation or death, such option may, subject to the terms thereof and any other terms of the plan, be exercised at any time within the six months following the date the optionee is terminated, resigns or dies, as applicable, but in any case prior to the expiry of the option in accordance with its terms.
93
Table of Contents
2010
| 2009
| |||||||||||||||
Shares Under Option
|
Weighted Average Exercise Price
| Shares Under Option
|
Weighted Average Exercise Price
| |||||||||||||
Outstanding, beginning of year | 2,082,150 | $ | 19.99 | 2,197,725 | $ | 19.39 | ||||||||||
Granted | 389,378 | 24.49 | 375,000 | 21.99 | ||||||||||||
Exercised | (325,450 | ) | 19.29 | (322,075 | ) | 20.44 | ||||||||||
Expired | – | – | (168,500 | ) | 17.34 | |||||||||||
Outstanding, end of year | 2,146,078 | $ | 21.02 | 2,082,150 | $ | 19.99 | ||||||||||
Exercisable, end of year |
|
1,256,550 |
| $ | 19.72 | 1,216,175 | $ | 19.08 | ||||||||
The weighted average contractual life of options outstanding at December 31, 2010 is 6.7 years (2009 – 6.6 years). The range of exercise prices for the options outstanding at December 31, 2010 is $13.70 to $31.02 (2009 – $13.70 to $22.59).
The fair value of each option is estimated on the date of grant using the Black-Scholes option pricing model with the following weighted average assumptions used for the grants:
2010
| 2009
| |||||||
Expected dividend yield | 4.55% | 4.92% | ||||||
Expected volatility | 14.00% | 13.90% | ||||||
Risk-free interest rate | 3.91% | 4.00% | ||||||
Expected life | 7 years | 7 years | ||||||
Weighted average grant date fair value | $ | 2.25 | $ | 1.49 | ||||
DEFERRED SHARE UNIT PLAN AND PERFORMANCE SHARE UNIT PLAN
The Company has deferred share unit (“DSU”) and performance share unit (“PSU”) (formerly restricted share unit) plans.
Under the Directors’ DSU plan, Directors of the Company may elect to receive all or any portion of their compensation in DSUs in lieu of cash compensation. Directors’ fees are paid on a quarterly basis and, at the time of each payment of fees, the applicable amount is converted to DSUs. A DSU has a value equal to one Emera common share. When a dividend is paid on Emera’s common shares, the Director’s DSU account is credited with additional DSUs. DSUs cannot be redeemed for cash until the Director retires, resigns or otherwise leaves the Board. The cash redemption value of a DSU equals the market value of a common share at the time of redemption, pursuant to the plan.
Under the executive and senior management DSU plan, each participant may elect to defer all or a percentage of their annual incentive award in the form of DSUs, with the provision that for participants who are subject to executive share ownership guidelines, a minimum of 50 per cent of the value of their actual annual incentive award (25 per cent in the first year of the program) will be payable in DSUs until the applicable guidelines are met.
When incentive awards are determined, the amount elected is converted to DSUs, which have a value equal to the average 50-day year-end stock closing share price of an Emera common share. When a dividend is paid on Emera’s common shares, each participant’s DSU account is allocated additional DSUs equal in value to the dividends paid on an equivalent number of Emera common shares. Following termination of employment or retirement, and by December 15 of the calendar year after termination or retirement, the value of the DSUs credited to the participant’s account is calculated by multiplying the number of DSUs in the participant’s account by the then average 50-day stock closing share price of an Emera common share. Payments are usually made in cash. At the sole discretion of the Management Resources and Compensation Committee (“MRCC”), payments may be made in the form of actual shares. Any participant who is a United States taxpayer shall receive payment on the first business day following the six-month anniversary of their termination.
Under the Directors’ DSU plan on or after January 1, 2010, a United States taxpayer may elect one of several dates as the payment date for DSUs recorded in the participant’s account, provided such elections are made in accordance with the deadlines under the plan for deferral elections and provided the payment dated elected shall not be a date that falls after December 31 of the calendar year that begins immediately following the termination date.
94 EMERA INC. 2010 ANNUAL FINANCIAL REPORT
Table of Contents
NOTES TO THE CONSOLIDATED FINANCIAL STATEMENTS
In addition, special DSU awards may be made from time to time by the MRCC to selected executives and senior management to recognize singular achievements or to achieve certain corporate objectives.
PSUs are granted annually for three-year overlapping performance cycles. The 2010 PSUs were granted based on the average of Emera’s stock closing price for the 50 trading days prior to December 31 of the prior year and multiplied by a dividend ratio factor of 1.15 and a discount factor of 1.191 for share price appreciation. Dividend equivalents are awarded and are used to purchase additional PSUs. The PSU value varies according to the Company’s common share market price and corporate performance.
PSUs vest at the end of the three-year cycle and will be calculated and approved by the MRCC early in the following year. The value of the payout considers actual service over the performance cycle and will be pro-rated in the case of retirement, disability or death.
Employee
| Employee
| Director
| ||||||||||
December 31, 2008 | 280,249 | 283,347 | 87,202 | |||||||||
Granted | 59,792 | 132,916 | 33,257 | |||||||||
Retirement, termination, disability and death | (53,987 | ) | (4,620 | ) | – | |||||||
Payout | – | (73,925 | ) | – | ||||||||
December 31, 2009 | 286,054 | 337,718 | 120,459 | |||||||||
Granted | 52,267 | 112,573 | 35,605 | |||||||||
Retirement, termination, disability and death | – | (4,370 | ) | – | ||||||||
Payout | – | (83,660 | ) | (20,668 | ) | |||||||
December 31, 2010 | 338,321 | 362,261 | 135,396 | |||||||||
The Company is using the fair-value-based method to measure the compensation expense related to its share-based compensation and employee purchase plan and recognizes the expense over the vesting period on a straight-line basis. The DSU and PSU liabilities are marked-to-market at the end of each period based on the common share price at the end of the period. For the year ended December 31, 2010, $12.2 million (2009 – $7.3 million) of compensation expense related to options granted, units issued and shares purchased by employees was recognized in “Operating, maintenance and general expense”.
26. PREFERRED SHARES
Authorized:Unlimited number of First Preferred Shares, issuable in series.
ISSUED AND OUTSTANDING:
| Millions of Shares
| Preferred Share Capital (Millions of Dollars)
| ||||||
December 31, 2009 | – | – | ||||||
Issuance of First Preferred Shares, Series A | 6.0 | $ | 146.7 | |||||
December 31, 2010 | 6.0 | $ | 146.7 | |||||
In June 2010, Emera issued six million 4.40 per cent Cumulative Five-Year Rate Reset First Preferred Shares, Series A (“First Preferred Shares, Series A”). The $150 million First Preferred Shares, Series A were issued at $25.00 per share for net after-tax and transaction costs proceeds of $146.7 million.
As the First Preferred Shares, Series A are neither redeemable at the option of the shareholder nor have a mandatory redemption date, they are classified as equity and the associated dividends will be deducted on the consolidated statements of earnings immediately before arriving at “Net earnings applicable to common shares” and will be shown on the consolidated statement of equity as a deduction from retained earnings.
The First Preferred Shares, Series A are entitled to receive fixed cumulative preferred cash dividends in the amount of $1.10 per share per annum for each year up to and including May 15, 2015. For each five-year period after this date, the holders of First Preferred Shares, Series A are entitled to receive reset fixed cumulative preferred cash dividends. The reset annual dividends per share will be determined by multiplying the $25.00 per share by the annual fixed dividend rate, which is the sum of the five-year Government of Canada Bond Yield on the applicable reset date plus 1.84 per cent.
95
Table of Contents
The holders of First Preferred Shares, Series A will have the right, at their option, to convert their shares into an equal number of Cumulative Floating Rate First Preferred Shares, Series B of the Company on August 15, 2015 and every five years thereafter.
The First Preferred Shares, Series B have the same characteristics as the Series A shares, with the exception of the calculation of the floating dividend rate for the Series B shares being the sum of the T-bill rate plus 1.84 per cent.
The holders of the First Preferred Shares, Series B will have the right, at their option, to convert their shares into an equal number of Series A shares of the Company on August 15, 2020 and every five years thereafter.
On August 15, 2015 and August 15, 2020 respectively and on August 15 every five years thereafter, the Company has the right to redeem for cash the outstanding First Preferred Shares, Series A or B in whole or in part at a price of $25 per share plus all accrued and unpaid dividends up to but excluding the date fixed for redemption.
27. SUPPLEMENTAL CASH FLOW INFORMATION
The change in non-cash operating working capital consists of the following:
MILLIONS OF DOLLARS
| 2010
| 2009
| ||||||
Decrease (increase) in accounts receivable | $ | 25.7 | $ | (95.6 | ) | |||
Decrease (increase) in inventory | 12.4 | (43.9 | ) | |||||
Increase in prepaid expenses | (2.0 | ) | (8.4 | ) | ||||
Decrease in contract receivable | – | 56.4 | ||||||
Change in posted margin included in accounts receivable | 15.6 | 56.9 | ||||||
Increase in other accounts payable and accrued charges | 65.1 | 7.1 | ||||||
Change in heavy fuel oil hedging balance in AOCI | 3.1 | (4.3 | ) | |||||
Change in income tax payable/receivable | (39.6 | ) | 6.1 | |||||
| $ | 80.3 | $ | (25.7 | ) | ||||
28. CAPITAL MANAGEMENT
The Company includes shareholders’ equity (excluding AOCI), short-term and long-term debt, preferred shares issued by subsidiary, non-controlling interest related to Bangor Hydro and ICDU, and cash and cash equivalents in the definition of capital as follows:
MILLIONS OF DOLLARS
| 2010
| 2009
| ||||||
Shareholders’ equity, excluding AOCI | $ | 1,938.3 | $ | 1,692.6 | ||||
Debt | 3,247.7 | 2,726.8 | ||||||
Preferred shares issued by subsidiary | 135.0 | 135.0 | ||||||
Non-controlling interest related to Bangor Hydro | 0.5 | 0.5 | ||||||
Non-controlling interest related to ICDU | 20.2 | 31.6 | ||||||
Cash and cash equivalents | (9.4 | ) | (21.8 | ) | ||||
| $ | 5,332.3 | $ | 4,564.7 | |||||
The Company’s objective when managing capital is to ensure sufficient liquidity exists by maintaining access to capital markets in order to allow the Company to acquire, build and maintain its regulated electric utilities, low-risk unregulated generation and energy infrastructure businesses. The Company has a strategy of managing its capital structure through its various wholly owned subsidiaries, while ensuring it is in compliance with its debt covenants. This strategy is managed by the Company through the issuance from time to time of common and preferred shares, bonds, medium-term notes or other indebtedness.
Each of the Company’s regulated utilities maintains a capital structure based on the structure that is approved by each utility’s regulator and the capital structure is reflected in customer rates.
The Company’s short- and long-term debt agreements provide that the Company’s consolidated debt cannot exceed 70 per cent of the Company’s capitalization.
96 EMERA INC. 2010 ANNUAL FINANCIAL REPORT
Table of Contents
NOTES TO THE CONSOLIDATED FINANCIAL STATEMENTS
29. FINANCIAL INSTRUMENTS
The Company manages its exposure to foreign exchange, interest rate and commodity risks in accordance with established risk management policies and procedures. Derivative financial instruments, consisting mainly of foreign exchange forward contracts, interest caps and collars, and oil and gas options and swaps, are used to hedge cash flows. Derivative financial instruments, consisting of foreign exchange forward contracts, are also used to hedge fair values.
Derivative financial instruments involve credit and market risks. Credit risks arise from the possibility a counterparty will default on its contractual obligations and is limited to those contracts where the Company would incur a loss in replacing the instrument.
Financial instruments include the following:
2010
| 2009
| |||||||||||||||
MILLIONS OF DOLLARS
|
Carrying Amount
|
Fair Value
|
Carrying Amount
|
Fair Value
| ||||||||||||
Cash and cash equivalents | $ | 9.4 | $ | 9.4 | $ | 21.8 | $ | 21.8 | ||||||||
Restricted cash | 59.6 | 59.6 | 1.0 | 1.0 | ||||||||||||
Accounts receivable | 396.5 | 396.5 | 413.1 | 413.1 | ||||||||||||
Derivatives held in a valid hedging relationship (current and long-term portion) | ||||||||||||||||
Cash flow hedges | 54.5 | 54.5 | 49.2 | 49.2 | ||||||||||||
Fair value hedges | – | – | 8.0 | 8.0 | ||||||||||||
Held-for-trading derivatives (current and long-term portion) | 37.4 | 37.4 | 43.8 | 43.8 | ||||||||||||
Total financial assets | $ | 557.4 | $ | 557.4 | $ | 536.9 | $ | 536.9 | ||||||||
Accounts payable and accrued charges |
$ |
399.6 |
| $ | 399.6 | $ | 305.9 | $ | 305.9 | |||||||
Short-term debt | 228.1 | 228.1 | 300.3 | 300.3 | ||||||||||||
Derivatives held in a valid hedging relationship (current and long-term portion) | ||||||||||||||||
Cash flow hedges | 29.9 | 29.9 | 86.7 | 86.7 | ||||||||||||
Held-for-trading derivatives (current and long-term portion) | 49.1 | 49.1 | 34.4 | 34.4 | ||||||||||||
Long-term debt (including current portion) | 3,019.6 | 3,434.5 | 2,426.5 | 2,661.3 | ||||||||||||
Preferred shares issued by a subsidiary | 135.0 | 152.3 | 135.0 | 151.2 | ||||||||||||
Total financial liabilities | $ | 3,861.3 | $ | 4,293.5 | $ | 3,288.8 | $ | 3,539.8 | ||||||||
97
Table of Contents
Fair Value Hierarchy
A fair value hierarchy is used to categorize valuation techniques used in the determination of fair value. Quoted market prices are Level 1, internal models using observable market information as inputs are Level 2, and internal models without observable market information as inputs are Level 3.
The fair value hierarchy of financial assets and liabilities accounted for at fair value at December 31, 2010 is as follows:
MILLIONS OF DOLLARS
| Level 1
| Level 2
| Level 3
| Total
| ||||||||||||
Financial assets: | ||||||||||||||||
Cash and cash equivalents | $ | 9.4 | – | – | $ | 9.4 | ||||||||||
Restricted cash | 59.6 | – | – | 59.6 | ||||||||||||
Derivatives in a valid hedging relationship (current and long-term portion) | ||||||||||||||||
Cash flow hedges | 41.7 | $ | 12.8 | – | 54.5 | |||||||||||
Held-for-trading derivatives | ||||||||||||||||
(current and long-term portion) | 1.5 | 14.6 | �� | $ | 21.3 | 37.4 | ||||||||||
Total financial assets | $ | 112.2 | $ | 27.4 | $ | 21.3 | $ | 160.9 | ||||||||
Financial liabilities: | ||||||||||||||||
Derivatives in a valid hedging relationship (current and long-term portion) | ||||||||||||||||
Cash flow hedges | $ | 15.8 | $ | 14.1 | – | $ | 29.9 | |||||||||
Held-for-trading derivatives (current and long-term portion) | (0.4 | ) | 10.5 | $ | 39.0 | 49.1 | ||||||||||
Preferred shares issued by subsidiary | – | 152.3 | – | 152.3 | ||||||||||||
Total financial liabilities | $ | 15.4 | $ | 176.9 | $ | 39.0 | $ | 231.3 | ||||||||
Changes in the fair value of financial assets classified as Level 3 in fair value hierarchy of $108.5 million during the year ended December 31, 2010 were as follows:
MILLIONS OF DOLLARS
| Accounts
| Derivatives in a Valid
| Held-for-Trading
| Total
| ||||||||||||
Balance at January 1, 2010 | $ | 82.1 | $ | 1.5 | $ | 46.2 | $ | 129.8 | ||||||||
Total (loss) gain realized and unrealized | ||||||||||||||||
Included in earnings | (5.8 | ) | – | (22.4 | ) | (28.2 | ) | |||||||||
Included in AOCI | – | – | – | – | ||||||||||||
Purchases, issuances, settlements | (76.3 | ) | (1.5 | ) | (0.7 | ) | (78.5 | ) | ||||||||
Transfer to Level 2 | – | – | (1.9 | ) | (1.9 | ) | ||||||||||
Transfer to held-for-trading | – | – | 0.1 | 0.1 | ||||||||||||
Balance at December 31, 2010 | – | – | $ | 21.3 | $ | 21.3 | ||||||||||
Changes in the fair value of financial liabilities classified as Level 3 in fair value hierarchy of $7.8 million during the year ended December 31, 2010 were as follows:
MILLIONS OF DOLLARS
| Derivatives in a Valid
| Held-for-Trading
| Total
| |||||||||
Balance at January 1, 2010 | $ | (2.1 | ) | $ | (29.1 | ) | $ | (31.2 | ) | |||
Total (loss) gain realized and unrealized | ||||||||||||
Included in earnings | (0.8 | ) | 2.2 | 1.4 | ||||||||
Included in AOCI | 11.3 | – | 11.3 | |||||||||
Purchases, issuances, settlements | (28.3 | ) | 6.5 | (21.8 | ) | |||||||
Transfer from Level 2 | – | 1.3 | 1.3 | |||||||||
Transfer to held-for-trading | 19.9 | (19.9 | ) | – | ||||||||
Balance at December 31, 2010 | – | $ | (39.0 | ) | $ | (39.0 | ) | |||||
98 EMERA INC. 2010 ANNUAL FINANCIAL REPORT
Table of Contents
NOTES TO THE CONSOLIDATED FINANCIAL STATEMENTS
Accounts Receivable and Accounts Payable and Accrued Charges
The carrying value of accounts receivable, accounts payable and accrued charges is a reasonable approximation of fair value. Losses included in earnings and recorded in “Operating, maintenance and general expenses” are $3.8 million (2009 – $6.1 million).
The allowance for doubtful accounts was $5.6 million as at January 1, 2010 (2009 – $4.5 million) and $6.9 million as at December 31, 2010 (2009 – $5.6 million). Changes in the allowance were due to changes in the provision related to specific customers and to changes in mix and volume of accounts receivable.
Preferred Shares Issued by a Subsidiary, Long-Term Debt and Short-Term Debt
The fair value of preferred shares issued by a subsidiary is based on market rates.
The fair value of the Company’s long-term and short-term debt is estimated based on the quoted market prices for the same or similar issues, or on the current rates offered to the Company, for debt of the same remaining maturities.
Derivatives in Valid Hedging Relationships
The fair value of derivative financial instruments is estimated by obtaining prevailing market rates from investment dealers.
Gains and losses included in net earnings with respect to derivatives in valid hedging relationships include the following:
MILLIONS OF DOLLARS
| 2010
| 2009
| ||||||
Financing income increase | $ | 7.7 | $ | 2.8 | ||||
Fuel and purchased power increase | (73.3 | ) | (46.3 | ) | ||||
Financing charges decrease | 1.8 | 6.9 | ||||||
Total losses | $ | (63.8 | ) | $ | (36.6 | ) | ||
The Company recognized total ineffectiveness in net earnings related to cash flow hedges as follows: | ||||||||
MILLIONS OF DOLLARS
| 2010
| 2009
| ||||||
Fuel and purchased power increase | $ | (1.6 | ) | $ | (14.2 | ) | ||
Financing charges increase | (0.1 | ) | – | |||||
Total losses | $ | (1.7 | ) | $ | (14.2 | ) | ||
The Company recognized total ineffectiveness in net earnings related to fair value hedges as follows: | ||||||||
MILLIONS OF DOLLARS
| 2010
| 2009
| ||||||
Financing charges increase | $ | (0.2 | ) | $ | 0.5 | |||
Total losses | $ | (0.2 | ) | $ | 0.5 | |||
The Company expects to reclassify $4.7 million of losses currently included in AOCI to net earnings over the next 12 months related to hedged items realized in net earnings.
99
Table of Contents
INTEREST RATES
The Company maintains a portfolio of debt instruments which includes short-term instruments and long-term instruments with staggered maturities. The Company uses diversification as a risk management strategy and deals with several counterparties so as to mitigate concentration risk.
The Company may enter into interest rate hedging contracts to limit exposure to fluctuations in floating and fixed interest rates on its short-term and long-term debt.
The Company has two interest rate hedging contracts outstanding as at December 31, 2010. These interest rate hedging contracts are used to fix the variable interest rates on the two issues of Maine Public Utilities Financing Bank bonds at MPS. MPS’s obligation under these bonds totals $22.6 million USD, $13.6 million USD of which is fixed at 4.42%, and $9.0 million USD of which is fixed at 4.53%.
COMMODITY PRICES
A substantial amount of NSPI’s fuel supply comes from international suppliers and is subject to commodity price risk. As part of its fuel management strategy, NSPI manages exposure to commodity price risk utilizing financial instruments providing fixed or maximum prices.
The Company enters into natural gas swap contracts to limit exposure to fluctuations in natural gas prices. As at December 31, 2010, the Company had hedged approximately 87% of all natural gas purchases and sales associated with its forecasted natural gas burn and resale for 2011, and 35% for 2012.
The Company enters into oil swap contracts to limit exposure to fluctuations in world prices of heavy fuel oil. For 2011 and 2012, NSPI currently does not have heavy fuel oil hedging requirements.
The Company enters into solid fuel swap contracts to limit exposure to fluctuations in world prices of solid fuel. As at December 31, 2010, the Company had hedged approximately 77% of all solid fuel purchases for 2011, 39% for 2012, 24% for 2013 and 9% for 2014.
The Company enters into power swaps to limit exposure to fluctuations in power prices. At December 31, 2010, the Company has hedged 103% of 2011 requirements, 95% of 2012 requirements, 95% of 2013 requirements and approximately 95% of the requirements for 2014.
FOREIGN EXCHANGE
The Company enters into foreign exchange forward and swap contracts to limit exposure on foreign currency transactions such as fuel purchases, revenue streams and capital expenditures.
The risk due to fluctuation of the CAD against the USD for fuel purchases in NSPI is measured and managed. In 2011, NSPI expects approximately 60% of its anticipated net fuel costs to be denominated in USD. USD from sales of surplus natural gas will provide a natural hedge against a portion of USD fuel costs. Forward contracts to buy $225.5 million USD were in place at a weighted average rate of $0.99, representing 70% of 2011 anticipated USD requirements. Forward contracts to buy $443.0 million USD in 2012 through 2015 at a weighted average rate of $1.03 were in place at December 31, 2010. These contracts cover 31% of anticipated USD requirements in these years. As at December 31, 2010, there were no fuel-related foreign exchange swaps outstanding.
NSPI may use foreign exchange forward contracts to hedge the currency risk for capital projects and receivables denominated in foreign currencies. Forward contracts to buy€1.8 million are in place at a weighted average rate of $1.56 (versus CAD) for capital projects in 2011.
Brunswick Pipeline uses forward contracts to hedge the currency risk associated with revenue streams denominated in foreign currencies. Forward contracts to sell $52 million USD were in place in 2011 at an average rate of $1.07 and sell $63 million USD in 2012 through 2015 at a weighted average rate of $1.07. These contracts cover 91% of anticipated USD revenue inflows in 2011 and 27% of anticipated USD revenue inflows in 2012 through 2015.
Held-for-Trading Derivatives
Derivatives included in held-for-trading assets and liabilities are required to be included in this classification in accordance with CGAAP. The Company has not designated any financial instruments to be included in the held-for-trading category.
The fair value of derivatives is estimated by obtaining prevailing market rates from investment dealers. The Company has a derivative, a power swap, where no observable market exists, therefore modelling techniques are employed using assumptions reflective of current market rates, yield curves and forward prices as applicable, to interpolate certain prices.
100 EMERA INC. 2010 ANNUAL FINANCIAL REPORT
Table of Contents
NOTES TO THE CONSOLIDATED FINANCIAL STATEMENTS
The Company has recognized the following realized and unrealized gains and losses with respect to HFT derivatives in earnings:
MILLIONS OF DOLLARS
| 2010
| 2009
| ||||||
Electric revenue | $ | 4.4 | $ | 0.6 | ||||
Other revenue | 1.8 | (5.7 | ) | |||||
Fuel and purchased power | (1.3 | ) | 12.4 | |||||
Financing charges | – | – | ||||||
Held-for-trading derivative gains | $ | 4.9 | $ | 7.3 | ||||
ENERGY MARKETING ASSETS AND LIABILITIES
On December 31, 2010, the Company held derivative financial and commodity instruments within its trading group.
NATURAL GAS CONTRACTS
Nova Scotia Power has contracts for the purchase and sale of natural gas at TUC that are considered HFT derivatives and accordingly are recognized on the balance sheet at fair value. This reflects NSPI’s history of buying and reselling any natural gas not used in the production of electricity at TUC.
DERIVATIVES NOT IN VALID HEDGING RELATIONSHIPS
On December 31, 2010, the Company held natural gas, power and oil derivatives, which were not in valid hedging relationships. This includes a certain swap in place to economically hedge the power necessary to produce the energy requirements of the long-term power supply agreement with the Long Island Power Authority, which is marked-to-market through earnings as it does not meet the stringent accounting requirements of hedge accounting.
Risk Management
MARKET RISK
The Company uses value-at-risk limits to manage its exposure to energy commodities from commercial activities on behalf of third parties, such as the purchase and sale of natural gas and electricity and related energy management services. These commercial activities are monitored on a daily basis by the Company’s risk management group such that the value-at-risk is not material.
Market risks associated with derivatives, which include the Company’s hedges and HFT derivatives, are related to movement in commodity prices and foreign exchange rates. Market risk associated with short-term debt is related to movement in interest rates.
As at December 31, 2010, the Company determined that market risk exposure associated with its financial instruments would affect the Company’s financial results as follows:
MILLIONS OF DOLLARS
| Net Earnings
| AOCI
| ||||||
$1 per one million British Thermal Unit increase in the price of natural gas* | $ | 4.4 | – | |||||
$5 per barrel increase in the price of heavy fuel oil | – | – | ||||||
$15 per metric tonne increase in the price of coal | – | $ | 29.8 | |||||
$0.01 decrease in the strength of the Canadian relative to the US dollar | – | 6.1 | ||||||
100 basis point increase in the central bank interest rates | 0.1 | – | ||||||
$1 per megawatt hour increase in the price of power | (0.1 | ) | 0.8 | |||||
*NSPI fuel costs are recoverable through the FAM, thus the above amount is the impact on earnings not related to NSPI. |
| |||||||
The above table illustrates the effect on the Company’s financial results due to a certain fixed-price change on the entire portfolio of financial instruments as at the end of the quarter. The results disclosed in the above table cannot be extrapolated linearly to determine the effect on the Company’s financial results due to varying price changes.
101
Table of Contents
INTEREST RATE RISK
Emera manages interest rate risk through a combination of fixed and floating borrowing and a hedging program. Floating-rate debt is estimated to represent approximately 20 per cent of total debt in 2011 (2010 – 24 per cent). The company had two interest rate hedging contracts outstanding as at December 31, 2010 (2009 – nil), fixing the variable interest rates on $22.6 million USD of Maine Public Utilities Financing Bank bonds at MPS.
CREDIT RISK
The Company is exposed to credit risk with respect to amounts receivable from customers. Credit assessments are conducted on all new customers and deposits are requested on any high-risk accounts. The Company also maintains provisions for potential credit losses, which are assessed on a regular basis. With respect to customers other than electric customers, counterparty creditworthiness is assessed through reports of credit rating agencies or other available financial information.
As at December 31, 2010, the maximum exposure the Company has to credit risk is $488.4 million, which includes accounts receivable, assets related to derivatives in a valid hedging relationship, and held-for-trading derivatives.
The Company transacts with counterparties as part of its risk management strategy for managing commodity price, foreign exchange and interest rate risk. Counterparties that exceed established credit limits can provide a cash deposit or letter of credit to the Company for the value in excess of the credit limit where contractually required. The Company also obtains cash deposits from electric customers. The total cash deposits and letters of credit on hand as at December 31, 2010 was $17.5 million (2009 – $30.3 million), which mitigates the Company’s maximum credit risk exposure. The Company uses the cash as payment for the amount receivable or returns the cash deposit to the counterparty where the credit limit is no longer exceeded or where the customer is no longer considered a high-risk account.
The Company generally considers the credit quality of financial assets that are neither past due nor impaired to be good. The Company monitors collection performance to ensure payments are received on a timely basis.
The Company does not have any financial assets that would be considered to be impaired.
As at December 31, 2010, the Company had $32.3 million (2009 – $34.6 million) in financial assets considered to be past due, which have been outstanding for an average of 70 days. The fair value of these financial assets is $29.8 million (2009 – $30.8 million), the difference of which is included in the allowance for doubtful accounts. These assets primarily relate to accounts receivable from electric revenue.
CONCENTRATION RISK
The Company’s concentration of risks as at December 31, 2010, is as follows:
Millions of Dollars
| % of Total Exposure
| |||||||
Accounts receivable | ||||||||
Regulated utilities | ||||||||
Residential | $ | 121.2 | 24.8% | |||||
Commercial | 62.8 | 12.9 | ||||||
Industrial | 38.8 | 8.0 | ||||||
Other | 16.2 | 3.3 | ||||||
| 239.0 | 49.0 | |||||||
Trading group | ||||||||
Credit rating of A- or above | – | – | ||||||
Credit rating of BBB- to BBB+ | 10.2 | 2.0 | ||||||
Not rated | 28.1 | 5.8 | ||||||
Fully collateralized | 82.4 | 16.9 | ||||||
| 120.7 | 24.7 | |||||||
Other accounts receivable | 36.8 | 7.5 | ||||||
| 396.5 | 81.2 | |||||||
Derivatives(in a valid hedging relationship and held-for-trading; current and long-term portions) | ||||||||
Credit rating of A- or above | 56.5 | 11.6 | ||||||
Credit rating of BBB- to BBB+ | 11.8 | 2.4 | ||||||
Not rated | 23.6 | 4.8 | ||||||
| 91.9 | 18.8 | |||||||
| $ | 488.4 | 100.0% | ||||||
102 EMERA INC. 2010 ANNUAL FINANCIAL REPORT
Table of Contents
NOTES TO THE CONSOLIDATED FINANCIAL STATEMENTS
LIQUIDITY RISK
Liquidity risk encompasses the risk that the Company cannot meet its financial obligations.
Emera’s main sources of liquidity are its cash flows from operations, short-term and long-term debt. Funds are primarily used to finance capital transactions. Some of these instruments are subject to market risks that the Company may hedge with interest rate swaps, caps, floors, futures and options.
Emera manages its liquidity by holding adequate volumes of liquid assets and maintaining credit facilities in addition to the cash flow generated by its operating businesses. The liquid assets consist of cash and cash equivalents.
The Company’s financial instrument liabilities mature as follows:
3 Year
| 2011
| 2012
| 2013
| 2014
| >2014
| Total
| ||||||||||||||||||||||
Accounts payable and accrued charges | – | $ | 399.6 | – | – | – | – | $ | 399.6 | |||||||||||||||||||
Short-term debt | – | 228.1 | – | – | – | – | 228.1 | |||||||||||||||||||||
Long-term debt | $ | 530.3 | 12.7 | $ | 83.6 | $ | 305.0 | $ | 304.9 | $ | 1,801.3 | 3,037.8 | ||||||||||||||||
Preferred shares issued by subsidiary | – | – | – | – | – | 135.0 | 135.0 | |||||||||||||||||||||
Derivatives held in a valid hedging relationship | ||||||||||||||||||||||||||||
Cash flow hedge | – | 8.6 | 3.7 | 8.9 | 3.4 | 5.3 | 29.9 | |||||||||||||||||||||
Held-for-trading derivatives | – | 30.7 | 6.8 | 3.9 | 3.1 | 4.6 | 49.1 | |||||||||||||||||||||
Total financial liabilities | $ | 530.3 | $ | 679.7 | $ | 94.1 | $ | 317.8 | $ | 311.4 | $ | 1,946.2 | $ | 3,879.5 | ||||||||||||||
(1) Bankers acceptances, LIBOR loans and advances are drawn against operating credit facilities which mature in 2013.
The Company has available the following credit facilities as at December 31, 2009, for the management of liquidity risk:
MILLIONS OF DOLLARS
| Maturity
| Credit Line
| Utilized
| Undrawn and
| ||||||||||||
Emera – Operating and acquisition credit facility | June 2013 – Revolver | $ | 600 | $ | 406 | $ | 194 | |||||||||
NSPI – Operating credit facility | June 2013 – Revolver | 600 | 289 | 311 | ||||||||||||
Bangor Hydro – in USD – Operating credit facility | September 2013 – Revolver | 80 | 42 | 38 | ||||||||||||
Other – in USD – Operating credit facilities | Various | 18 | 3 | 15 | ||||||||||||
Available-for-Sale Investments
Available-for-sale investments include the Company’s investment in OpenHydro Group Limited (“OpenHydro”) and Algonquin Power & Utilities Corp. The investments are recognized at their cost of $47.0 million. The fair value of these investments have not been recognized or disclosed because the shares and subscription receipts are not actively traded in an open market. The Company does not intend to dispose of the investment in OpenHydro in the near term. The market for any disposition of OpenHydro shares would be with an existing shareholder or a new private investor.
30. RELATED PARTY TRANSACTIONS
In the ordinary course of business, Emera purchased natural gas transportation capacity totalling $55.1 million (2009 – $47.4 million) during the year ended December 31, 2010, from the Maritimes & Northeast Pipeline, an investment under significant influence of the Company. The amount is recognized in “Fuel for generation and purchased power” or netted against energy marketing margin in “Other revenue”, and is measured at the exchange amount. At December 31, 2010, the amount payable to the related party is $3.9 million (2009 – $4.6 million), is non-interest bearing and is under normal credit terms.
103
Table of Contents
31. CONTINGENCIES
A number of individuals who live in proximity to NSPI’s Trenton generating station have filed a statement of claim against NSPI in respect of emissions from the operation of the plant for the period 2001 forward. The Company has filed a defence to the claim. The plaintiffs claim unspecified damages as a result of interference with enjoyment of, or damage to, their property and adverse health effects they allege were caused by such emissions. The outcome, and therefore an estimate of any contingent loss, of this litigation are not determinable.
Bangor Hydro has a potential liability to Great Lake Hydro America LLC for headwater benefits on the Penobscot River in connection with hydro assets sold to PPL Generation, LLC in 1999. On May 25, 2010, a FERC Administrative Law Judge issued an initial decision ruling that a May 7, 1999 Release was a valid and enforceable release of liability for headwater benefits received by Bangor Hydro prior to May 7, 1999. The initial decision became final on July 7, 2010, by operation of FERC rules. Any liability of Bangor Hydro for pre-May 1999 headwater benefits that may not be covered by the Release and for the period after the Release, but prior to the PPL sale, is immaterial.
In addition, the Company may, from time to time, be involved in legal proceedings, claims and litigations that arise in the ordinary course of business which the Company believes would not reasonably be expected to have a material adverse effect on the financial condition of the Company.
32. COMMITMENTS
In addition to commitments outlined elsewhere in these notes, the Company had the following significant commitments at December 31, 2010:
Emera
| • | The Company has a commitment to purchase approximately 43,000 mmbtu per day of transportation capacity on the US portion of the Maritimes & Northeast Pipeline, a related party, for the next two years, at an approximate average cost of $9 million per year. |
| • | The Company has a commitment to purchase 10,000 mmbtu per day of transportation capacity on the US portion of the Maritimes & Northeast Pipeline, a related party, from Q2 2013 until Q1 2016, at an approximate average cost of $2 million per year. |
| • | Bayside has a commitment to purchase approximately 36,500 mmbtu of natural gas per day until November 2015 and an additional 7,000 mmbtu per day until December 2012. |
| • | Bayside has a commitment to March 31, 2021 to supply approximately 900 GWh of electricity annually for the months of November through March. |
| • | Bayside has a commitment to purchase approximately 43,500 mmbtu per day of transportation capacity on the Canadian portion of the Maritimes & Northeast Pipeline, a related party, until 2015, at an approximate average cost of $12 million per year. |
NSPI
| • | NSPI has an annual requirement to purchase approximately 650 GWh of electricity from independent power producers over varying contract lengths up to 40 years. |
| • | NSPI has requirements to purchase approximately 15,000 mmbtu of natural gas per day for 22 months; an average of 13,000 mmbtu per day for 28 months; 14,000 mmbtu per day for 10 months and 20,000 mmbtu for two years starting in November 2011. |
| • | NSPI has commitments to purchase 4,000 mmbtu per day of transportation capacity on the Maritimes and Northeast Pipeline, a related party, for 10 months, 15,000 mmbtu for 22 months, and an average of 13,000 mmbtu for 28 months. These have an approximate cost of $17.6 million through 2013. |
| • | NSPI has the responsibility for managing a portfolio of approximately $1.0 billion of defeasance securities held in trust. The defeasance securities must provide the principal and interest payment streams of the related defeased debt. Approximately 73% or $726 million of the defeasance portfolio consists of investments in the related debt, eliminating all risk associated with this portion of the portfolio. |
| • | NSPI has a commitment to a third party for the unloading and transportation of solid fuel for ten years beginning in late 2002 at an approximate cost of $16.0 million per year. |
| • | NSPI has commitments to third parties for the handling and transportation of solid fuel for $7 million in 2011 and $4 million per year from 2012 to 2014. |
| • | NSPI has commitments to third parties for 2011 to 2014, to purchase and transport 3.8 million metric tons (“mts”) of import coal, 1.7 million mts of domestic coal and 3.2 million mts of marine freight. |
| • | NSPI has commitments to third parties for construction on capital project in 2011 and 2012 at an approximate cost of $91 million and to purchase other goods and services in 2011 and 2012 at an approximate cost of $19 million. |
104 EMERA INC. 2010 ANNUAL FINANCIAL REPORT
Table of Contents
NOTES TO THE CONSOLIDATED FINANCIAL STATEMENTS
Bangor Hydro
| • | Bangor Hydro has various contract commitments to purchase annually, net of resale revenues, approximately $10 million USD to $12 million USD of electricity for the period from 2011 to 2018 from independent power producers. These commitments are reduced to less than $2 million USD each year from 2019 to 2026. |
33. GUARANTEES
Emera had the following guarantees at December 31, 2010:
| • | The Company issued letters of credit totalling $55.7 million, which generally expire annually unless renewed. These letters of credit secure payment to various vendors, the obligations of NSPI and Bangor Hydro under their unfunded pension plans, and in the case of MPS, secure the Maine Public Utility Financing Bank bonds principal and interest. |
| • | NSPI has provided a guarantee for the indebtedness of a third party, up to a maximum of $23.5 million, related to future purchased power. NSPI holds a security interest in the assets of the third party. |
34. ECONOMIC DEPENDENCE
One of the company’s subsidiaries, Brunswick Pipeline, has an agreement through 2034 for the sale of its product to one customer. For the year ended December 31, 2010, this customer accounted for 13.7% of the consolidated net earnings (2009 – 8.0%).
35. SUBSEQUENT EVENTS
On January 1, 2011, Emera and APUC announced the closing of their acquisition of the California-based electricity distribution and related generation assets of NV Energy, Inc. Total consideration for this transaction is $131.8 million USD, subject to final adjustments. APUC and Emera own respectively a 50.001% and 49.999% interest in California Pacific Utility Ventures, LLC (“CPUV”), which wholly owns the California-based assets. Also, as an element of the transaction, Emera exchanged certain previously announced subscription receipts into 8.523 million APUC common shares.
On January 25, 2011, subsequent to the offer made on December 20, 2010 to purchase all issued and outstanding common shares from LPH shareholders, Emera purchased 7.2 million shares of LPH at a cash price per share of $25.70 Barbadian dollars, representing an additional interest of 41.6%. With this additional investment of $91.9 million CAD, Emera became the majority shareholder of LPH, with a total interest of 79.9%.
36. COMPARATIVE INFORMATION
Certain of the comparative figures have been reclassified to conform to the financial statement presentation adopted for 2010.
105
Table of Contents
OPERATING STATISTICS (UNAUDITED)
FIVE-YEAR SUMMARY
YEAR ENDED DECEMBER 31
|
2010
|
2009
|
2008
|
2007
|
2006
| |||||||||||||||
Electric energy sales (GWh) | ||||||||||||||||||||
Residential | 4,738.2 | 4,819.2 | 4,769.6 | 4,738.5 | 4,516.0 | |||||||||||||||
Commercial | 5,584.4 | 3,694.4 | 3,721.1 | 3,768.5 | 3,621.1 | |||||||||||||||
Industrial | 4,268.2 | 3,985.3 | 4,491.5 | 4,568.4 | 3,246.7 | |||||||||||||||
Other | 1,117.1 | 1,636.9 | 1,115.2 | 1,320.4 | 1,550.8 | |||||||||||||||
Total electric energy sales | 15,707.9 | 14,135.8 | 14,097.4 | 14,395.8 | 12,934.6 | |||||||||||||||
Sources of energy (GWh) | ||||||||||||||||||||
Thermal – coal | 7,838.7 | 8,177.3 | 9,008.9 | 9,561.4 | 9,128.1 | |||||||||||||||
– oil | 36.1 | 306.9 | 340.7 | 516.6 | 431.9 | |||||||||||||||
– natural gas | 4,183.0 | 2,141.4 | 1,257.9 | 1,057.1 | 390.3 | |||||||||||||||
Hydro | 1,023.5 | 1,101.4 | 1,102.3 | 936.8 | 1,034.7 | |||||||||||||||
Wind | 25.3 | 1.8 | 2.4 | 2.4 | 2.4 | |||||||||||||||
Purchases | 3,633.4 | 3,444.1 | 3,493.2 | 3,534.7 | 3,144.7 | |||||||||||||||
Total generation and purchases | 16,740.0 | 15,172.9 | 15,205.4 | 15,609.0 | 14,132.1 | |||||||||||||||
Losses and internal use | 1,032.1 | 1,037.1 | 1,108.0 | 1,213.2 | 1,197.5 | |||||||||||||||
Total electric energy sold | 15,707.9 | 14,135.8 | 14,097.4 | 14,395.8 | 12,934.6 | |||||||||||||||
Electric customers | ||||||||||||||||||||
Residential | 588,935 | 539,333 | 535,494 | 530,955 | 526,014 | |||||||||||||||
Commercial | 61,620 | 51,768 | 54,461 | 51,083 | 50,780 | |||||||||||||||
Industrial | 2,558 | 2,543 | 2,541 | 2,543 | 2,526 | |||||||||||||||
Other | 9,422 | 9,155 | 9,064 | 9,574 | 9,378 | |||||||||||||||
Total electric customers | 662,535 | 602,799 | 601,560 | 594,155 | 588,698 | |||||||||||||||
Capacity | ||||||||||||||||||||
Generating nameplate capacity (MW) | ||||||||||||||||||||
Coal-fired | 1,243 | 1,243 | 1,243 | 1,243 | 1,243 | |||||||||||||||
Dual-fired | 350 | 350 | 365 | 350 | 350 | |||||||||||||||
Gas turbines | 614 | 579 | 304 | 319 | 323 | |||||||||||||||
Hydroelectric | 995 | 995 | 1,005 | 1,005 | 1,005 | |||||||||||||||
Wind turbines | 76 | 1 | 1 | 1 | 1 | |||||||||||||||
Diesel | 46 | – | – | – | – | |||||||||||||||
Steam | 51 | – | – | – | – | |||||||||||||||
Independent power producers | 347 | 172 | 120 | 120 | 120 | |||||||||||||||
| 3,722 | 3,340 | 3,038 | 3,038 | 3,042 | ||||||||||||||||
Total number of employees | 2,972 | 2,350 | 2,215 | 2,194 | 2,149 | |||||||||||||||
Km of transmission lines | 6,700 | 6,300 | 6,100 | 6,200 | 6,100 | |||||||||||||||
Km of distribution lines | 40,900 | 33,800 | 33,000 | 32,000 | 32,000 | |||||||||||||||
106 EMERA INC. 2010 ANNUAL FINANCIAL REPORT
Table of Contents
FIVE-YEAR
SUMMARY
YEAR ENDED DECEMBER 31 (MILLIONS OF DOLLARS)
|
2010
|
2009
|
2008
|
2007
|
2006
| |||||||||||||||
Statements of earnings information | ||||||||||||||||||||
Revenue | $ | 1,553.7 | $ | 1,483.5 | $ | 1,331.9 | $ | 1,339.5 | $ | 1,166.0 | ||||||||||
Cost of operations | ||||||||||||||||||||
Fuel for generation and purchased power | 718.7 | 583.5 | 525.1 | 494.5 | 347.7 | |||||||||||||||
Fuel adjustment | (99.0 | ) | 8.5 | – | – | – | ||||||||||||||
Operating, maintenance and general | 336.1 | 294.4 | 266.8 | 264.8 | 255.6 | |||||||||||||||
Provincial, state and municipal taxes | 49.1 | 49.9 | 49.4 | 47.5 | 48.0 | |||||||||||||||
Depreciation and amortization | 173.6 | 164.9 | 151.3 | 149.3 | 145.2 | |||||||||||||||
Regulatory amortization | 41.3 | 35.7 | 28.5 | 31.4 | 22.8 | |||||||||||||||
| 1,219.8 | 1,136.9 | 1,021.1 | 987.5 | 819.3 | ||||||||||||||||
| 333.9 | 346.6 | 310.8 | 352.0 | 346.7 | ||||||||||||||||
Equity earnings | 13.6 | 14.0 | 15.2 | 12.8 | 4.9 | |||||||||||||||
Other income | – | – | – | – | 8.9 | |||||||||||||||
Financing charges | 168.4 | 135.3 | 123.2 | 133.2 | 148.1 | |||||||||||||||
Earnings before income taxes | 179.1 | 225.3 | 202.8 | 231.6 | 212.4 | |||||||||||||||
Income taxes | (12.8 | ) | 48.9 | 58.1 | 80.3 | 86.6 | ||||||||||||||
Net earnings before non-controlling interest | 191.9 | 176.4 | 144.7 | 151.3 | 125.8 | |||||||||||||||
Non-controlling interest | (2.3 | ) | 0.7 | 0.6 | – | – | ||||||||||||||
Net earnings | 194.2 | 175.7 | 144.1 | 151.3 | 125.8 | |||||||||||||||
Preferred share dividends | 3.1 | – | – | – | – | |||||||||||||||
Net earnings applicable to common shares | 191.1 | 175.7 | 144.1 | 151.3 | 125.8 | |||||||||||||||
Dividends on common and preferred shares | 135.1 | 115.8 | 107.9 | 99.9 | 98.3 | |||||||||||||||
Dividends paid by subsidiaries to non-controlling interest | – | – | 1.9 | – | – | |||||||||||||||
Earnings retained for use in the Company | $ | 56.0 | $ | 59.9 | $ | 34.3 | $ | 51.4 | $ | 27.5 | ||||||||||
Cost of fuel for generation – coal | $ | 327.0 | $ | 293.9 | $ | 282.1 | $ | 276.0 | $ | 266.2 | ||||||||||
– oil | 12.2 | 5.4 | 17.7 | 49.7 | 34.3 | |||||||||||||||
– natural gas | 169.3 | 138.5 | 92.5 | 52.0 | (41.6 | ) | ||||||||||||||
Purchased power | 210.2 | 127.7 | 132.8 | 116.8 | 88.8 | |||||||||||||||
Total cost of fuel for generation and purchased power | $ | 718.7 | $ | 583.5 | $ | 525.1 | $ | 494.5 | $ | 347.7 | ||||||||||
Balance sheets information | ||||||||||||||||||||
Current assets | $ | 782.5 | $ | 714.9 | $ | 681.8 | $ | 567.0 | $ | 491.3 | ||||||||||
Other assets* | 932.3 | 628.3 | 793.8 | 600.4 | 577.3 | |||||||||||||||
Intangibles | 103.5 | 92.1 | 101.8 | 83.8 | 92.1 | |||||||||||||||
Investments subject to significant influence | 238.9 | 218.4 | 317.6 | 124.5 | 98.5 | |||||||||||||||
Net investment in direct financing lease | 488.2 | 476.9 | – | – | – | |||||||||||||||
Property, plant and equipment and construction work in progress | 3,783.7 | 3,153.9 | 3,374.4 | 2,845.4 | 2,789.8 | |||||||||||||||
Total assets | $ | 6,329.1 | $ | 5,284.5 | $ | 5,269.4 | $ | 4,221.1 | $ | 4,049.0 | ||||||||||
Current liabilities | $ | 690.3 | $ | 804.9 | $ | 880.1 | $ | 506.6 | $ | 491.0 | ||||||||||
Other liabilities* | 702.6 | 488.2 | 509.3 | 417.7 | 231.8 | |||||||||||||||
Long-term debt | 3,006.9 | 2,318.4 | 2,159.2 | 1,676.4 | 1,657.4 | |||||||||||||||
Preferred shares issued by subsidiary | 135.0 | 135.0 | 135.0 | 260.0 | 260.0 | |||||||||||||||
Non-controlling interest | 20.7 | 32.1 | 39.6 | 0.6 | 0.7 | |||||||||||||||
Common shares | 1,136.5 | 1,096.7 | 1,081.4 | 1,066.2 | 1,055.2 | |||||||||||||||
Preferred shares | 146.7 | – | – | – | – | |||||||||||||||
Contributed surplus | 3.7 | 3.6 | 3.4 | 3.0 | 2.2 | |||||||||||||||
Accumulated other comprehensive loss | (164.7 | ) | (186.7 | ) | (69.2 | ) | (209.0 | ) | (100.2 | ) | ||||||||||
Retained earnings | 651.4 | 592.3 | 530.6 | 499.6 | 450.9 | |||||||||||||||
Total equity and liabilities | $ | 6,329.1 | $ | 5,284.5 | $ | 5,269.4 | $ | 4,221.1 | $ | 4,049.0 | ||||||||||
Statements of cash flow information | ||||||||||||||||||||
Cash provided by operating activities | $ | 416.4 | $ | 310.2 | $ | 237.2 | $ | 351.4 | $ | 332.5 | ||||||||||
Cash used in investing activities | $ | 894.8 | $ | 367.2 | $ | 671.6 | $ | 288.9 | $ | 196.9 | ||||||||||
Cash provided by (used in) financing activities | $ | 466.2 | $ | 70.5 | $ | 420.2 | $ | (55.6 | ) | $ | (143.4 | ) | ||||||||
Financial ratios ($ per common share) | ||||||||||||||||||||
Earnings per common share | $ | 1.68 | $ | 1.56 | $ | 1.29 | $ | 1.36 | $ | 1.14 | ||||||||||
| * Other assets and liabilities restated to December 31, 2007 only. | 107 |
Table of Contents
JOHN T. MCLENNAN
CHAIRMAN, EMERA INC.
FORMER VICE-CHAIR AND
CHIEF EXECUTIVE OFFICER
ALLSTREAM INC.
MAHONE BAY, NOVA SCOTIA
CHRISTOPHER G. HUSKILSON
PRESIDENT AND
CHIEF EXECUTIVE OFFICER
EMERA INC.
WELLINGTON, NOVA SCOTIA
ROBERT S. BRIGGS
COMPANY DIRECTOR
FORMER PRESIDENT AND
CHIEF EXECUTIVE OFFICER
BANGOR HYDRO ELECTRIC COMPANY
CARRABASETT VALLEY, MAINE
THOMAS W. BUCHANAN, FCA
CHAIRMAN AND
CHIEF EXECUTIVE OFFICER
CHARGER ENERGY CORPORATION
CALGARY, ALBERTA
GEORGE A. CAINES, Q.C.
PARTNER
STEWART MCKELVEY
HALIFAX, NOVA SCOTIA
DR. GAIL COOK-BENNETT, C.M.
CHAIR
MANULIFE FINANCIAL
TORONTO, ONTARIO
SYLVIA D. CHROMINSKA
GROUP HEAD
GLOBAL HUMAN RESOURCES
AND COMMUNICATIONS
THE BANK OF NOVA SCOTIA
TORONTO, ONTARIO
ALLAN L. EDGEWORTH
PRESIDENT
ALE ENERGY INC.
CALGARY, ALBERTA
DONALD A. PETHER
COMPANY DIRECTOR
FORMER CHAIR OF THE BOARD
AND CHIEF EXECUTIVE OFFICER
DOFASCO, INC.
DUNDAS, ONTARIO
ANDREA S. ROSEN
COMPANY DIRECTOR
FORMER VICE-CHAIR
TD BANK FINANCIAL GROUP
AND PRESIDENT
TD CANADA TRUST
TORONTO, ONTARIO
RICHARD P. SERGEL
COMPANY DIRECTOR
FORMER CHIEF EXECUTIVE OFFICER
NORTH AMERICAN ELECTRIC
RELIABILITY CORPORATION
WELLESLEY, MASSACHUSETTS
M. JACQUELINE SHEPPARD, Q.C.
COMPANY DIRECTOR
FORMER EXECUTIVE VICE-PRESIDENT
CORPORATE AND LEGAL
TALISMAN ENERGY INC.
CALGARY, ALBERTA
COMMITTEES
Emera Inc. Audit Committee:
ANDREA S. ROSEN
(COMMITTEE CHAIR)
ROBERT S. BRIGGS
THOMAS W. BUCHANAN, FCA
ALLAN L. EDGEWORTH
M. JACQUELINE SHEPPARD, Q.C.
RICHARD P. SERGEL
Emera Inc.
Management Resources and
Compensation Committee:
ALLAN L. EDGEWORTH
(COMMITTEE CHAIR)
DONALD A. PETHER
M. JACQUELINE SHEPPARD, Q.C.
SYLVIA D. CHROMINSKA
Emera Inc.
Nominating and Corporate
Governance Committee:
DR. GAIL COOK-BENNETT, C.M.
(COMMITTEE CHAIR)
THOMAS W. BUCHANAN, FCA
DONALD A. PETHER
RICHARD P. SERGEL
Emera Inc.
Technology and
Development Committee:
CHRISTOPHER G. HUSKILSON
(COMMITTEE CHAIR)
THOMAS W. BUCHANAN, FCA
ALLAN L. EDGEWORTH
RICHARD P. SERGEL
M. JACQUELINE SHEPPARD, Q.C.
| 108 EMERA INC. 2010 ANNUAL FINANCIAL REPORT |
Table of Contents
DIVIDEND PAYMENTS IN 2011 Subject to approval by the Board of Directors, dividends for Emera Inc. are payable on or about the 15th of February, May, August and November. A first quarter common share dividend of $0.3250 and a preferred share of $0.2750 was declared and paid February 15, 2011.
DIVIDEND REINVESTMENT AND SHARE PURCHASE PLAN Emera’s Dividend Reinvestment and Share Purchase Plan is available to shareholders resident in Canada. The plan provides shareholders with a convenient and economical means of acquiring additional common shares through the reinvestment of dividends. Plan participants may also contribute cash payments of up to $5,000 per quarter. Participants of the plan pay no commissions, service charges or brokerage fees for shares purchased under the Plan. Please contact Investor Services if you have questions or wish to receive a copy of the plan brochure and enrollment form.
DIRECT DEPOSIT SERVICE Shareholders may have dividends deposited directly into accounts held at financial institutions that are members of the Canadian Payments Association. To arrange this service, please contact Investor Services.
QUARTERLY EARNINGS Quarterly earnings are expected to be announced May 3, August 5 and November 4, 2011. Year-end results for 2010 were released in February 2011.
ANNUAL GENERAL MEETING The Annual General Meeting is scheduled to be held May 4, 2011 at 2:00 p.m. (Atlantic Time) at the Cunard Centre, 961 Marginal Road, Halifax, Nova Scotia. | INFORMATION
For general inquiries about our company, please contact our corporate office:
EMERA INC.
1894 BARRINGTON STREET BARRINGTON TOWER HALIFAX, NOVA SCOTIA B3J 2A8 T: 902.450.0507
INFORMATION REGARDING COMPANY NEWS AND INITIATIVES, INCLUDING OUR 2010 ANNUAL FINANCIAL REPORT, IS ALSO AVAILABLE ON OUR WEBSITE:EMERA.COM
TRANSFER AGENT
COMPUTERSHARE TRUST COMPANY OF CANADA PURDY’S WHARF TOWER II 1969 UPPER WATER STREET SUITE 2008 HALIFAX, NOVA SCOTIA B3J 3R7 T: 1.800.564.6253 F: 902.420.2764
INVESTOR SERVICES
T: 902.428.6060 OR 1.800.358.1995 F: 902.428.6181 E: INVESTORS@EMERA.COM
FINANCIAL ANALYSTS, PORTFOLIO MANAGERS AND INSTITUTIONAL INVESTORS MANAGER, INVESTOR RELATIONS JILL MACDONALD, CA T: 902.428.6486 F: 902.428.6680 E: JILL.MACDONALD@EMERA.COM
SHARE LISTINGS
TORONTO STOCK EXCHANGE (TSX) COMMON SHARES: EMA PREFERRED SHARES: EMA.PR.A
SHARES OUTSTANDING
COMMON SHARES: 114,623,271 (AS OF DECEMBER 31, 2010)
DIVIDENDS PAID IN 2010
EMERA INC. PAID COMMON SHARE DIVIDENDS OF $0.2725 PER COMMON SHARE IN Q1, $0.2825 IN Q2, AND $0.3250 PER QUARTER IN Q3 AND Q4, FOR AN EFFECTIVE ANNUAL COMMON SHARE DIVIDEND RATE OF $1.21 PER COMMON SHARE. |
Table of Contents
