
Investor Presentation Piper Sandler Western Financial Services Conference March 7-8, 2022 James Kim Pres. & CEO Dave Kinross EVP CFO

Forward-Looking Statements 2 Certain matters discussed in this report constitute forward-looking statements within the meaning of the Private Securities Litigation Reform Act of 1995. All statements contained herein that are not historical facts, such as statements regarding the Company’s current business strategy and the Company’s plans for future development and operations, are based upon current expectations. These statements are forward-looking in nature and involve a number of risks and uncertainties. Such risks and uncertainties include, but are not limited to (1) significant increases in competitive pressure in the banking industry; (2) the impact of changes in interest rates; (3) a decline in economic conditions in the Central Valley and the Greater Sacramento Region; (4) the Company’s ability to continue its internal growth at historical rates; (5) the Company’s ability to maintain its net interest margin; (6) the decline in quality of the Company’s earning assets; (7) a decline in credit quality; (8) changes in the regulatory environment; (9) fluctuations in the real estate market; (10) changes in business conditions and inflation; (11) changes in securities markets (12) risks associated with acquisitions, relating to difficulty in integrating combined operations and related negative impact on earnings, and incurrence of substantial expenses; (13) political developments, uncertainties or instability, catastrophic events, acts of war or terrorism, or natural disasters, such as earthquakes, drought, pandemic diseases or extreme weather events, any of which may affect services we use or affect our customers, employees or third parties with which we conduct business; and (14) the rapidly changing uncertainties related to the Covid-19 pandemic including, but not limited to, the potential adverse effect of the pandemic on the economy, our employees and customers, and our financial performance. Therefore, the information set forth in such forward-looking statements should be carefully considered when evaluating the business prospects of the Company. When the Company uses in this presentation the words “anticipate,” “estimate,” “expect,” “project,” “intend,” “commit,” “believe,” and similar expressions, the Company intends to identify forward-looking statements. Such statements are not guarantees of performance and are subject to certain risks, uncertainties and assumptions, including those described in this presentation. Should one or more of these risks or uncertainties materialize, or should underlying assumptions prove incorrect, actual results may vary materially from those anticipated, estimated, expected, projected, intended, committed or believed. The future results and shareholder values of the Company may differ materially from those expressed in these forward-looking statements. Many of the factors that will determine these results and values are beyond the Company’s ability to control or predict. For those statements, the Company claims the protection of the safe harbor for forward-looking statements contained in the Private Securities Litigation Reform Act of 1995. Central Valley Community Bancorp will undertake no obligation to revise or publically release any revision or update to the forward looking statements to reflect events or circumstances that occur after the date on which statements were made.
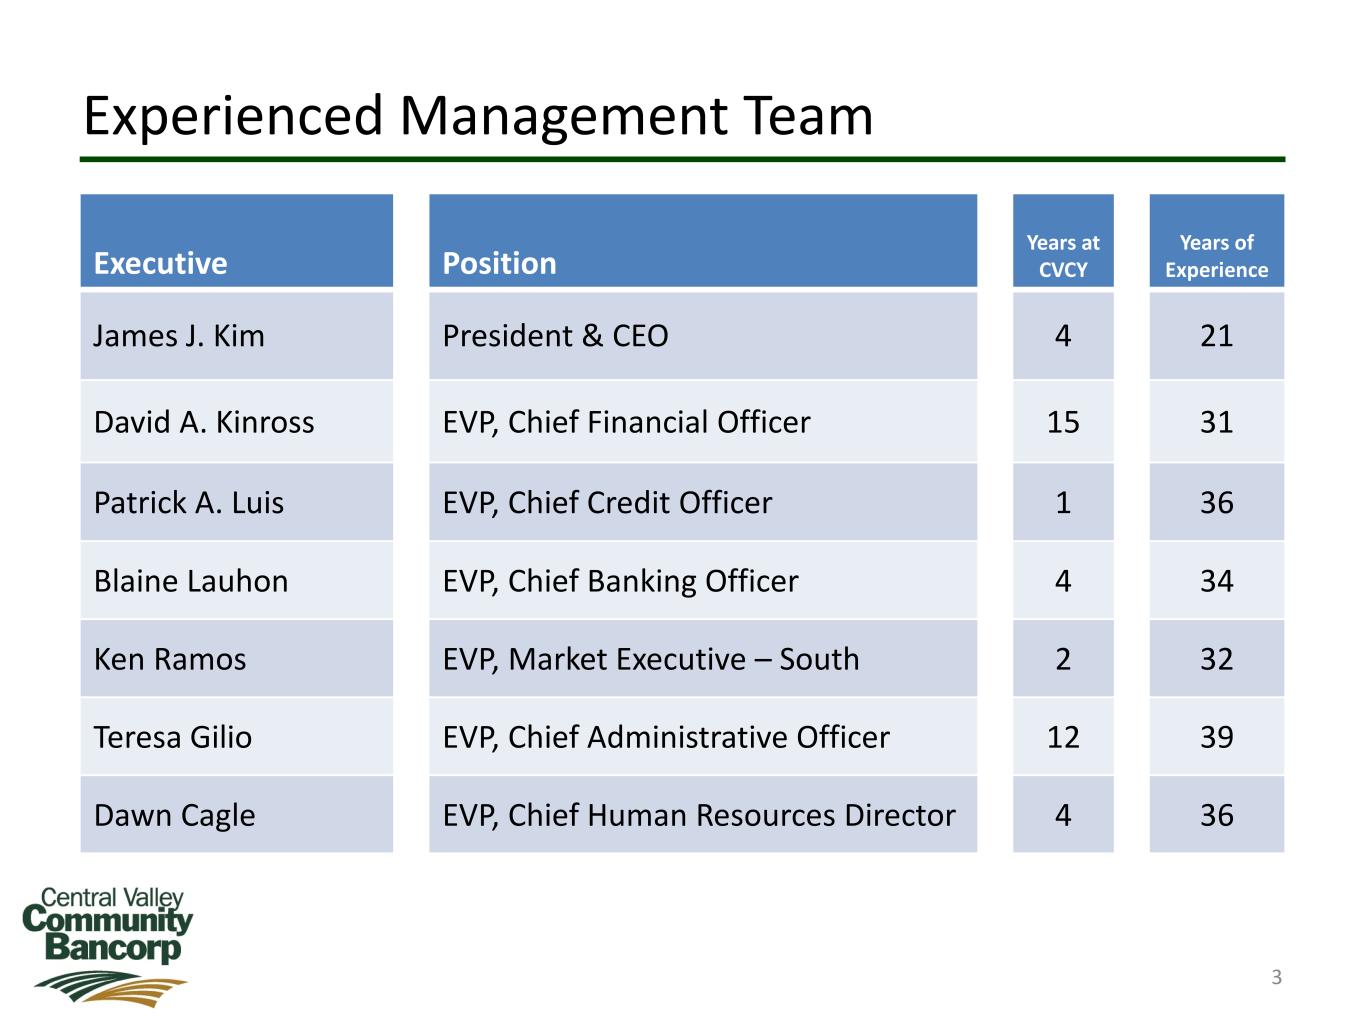
Experienced Management Team 3 Executive Position Years at CVCY Years of Experience James J. Kim President & CEO 4 21 David A. Kinross EVP, Chief Financial Officer 15 31 Patrick A. Luis EVP, Chief Credit Officer 1 36 Blaine Lauhon EVP, Chief Banking Officer 4 34 Ken Ramos EVP, Market Executive – South 2 32 Teresa Gilio EVP, Chief Administrative Officer 12 39 Dawn Cagle EVP, Chief Human Resources Director 4 36

Overview 4 NASDAQ Symbol CVCY Market Capitalization $248 Million Institutional Ownership 48% Insider Ownership 13% Total Assets $2.45 Billion Headquarters Fresno, CA Number of Branches 20 Year Established 1980 Strategic Footprint Bakersfield to Sacramento 20 Branches in 9 Contiguous Counties As of Dec. 31, 2021
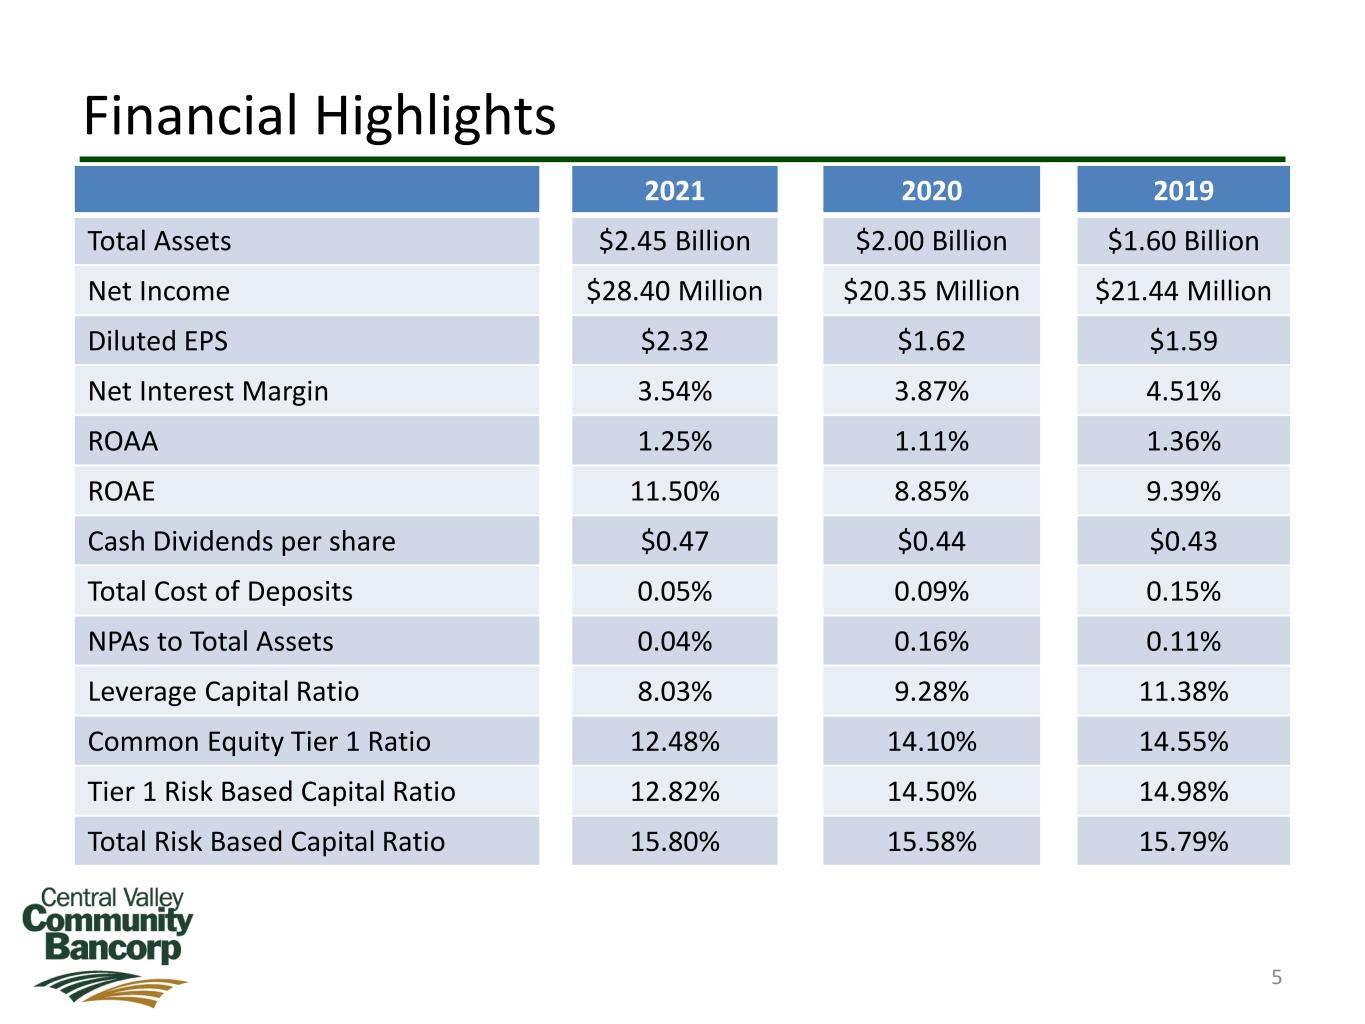
Financial Highlights 5 2021 2020 2019 Total Assets $2.45 Billion $2.00 Billion $1.60 Billion Net Income $28.40 Million $20.35 Million $21.44 Million Diluted EPS $2.32 $1.62 $1.59 Net Interest Margin 3.54% 3.87% 4.51% ROAA 1.25% 1.11% 1.36% ROAE 11.50% 8.85% 9.39% Cash Dividends per share $0.47 $0.44 $0.43 Total Cost of Deposits 0.05% 0.09% 0.15% NPAs to Total Assets 0.04% 0.16% 0.11% Leverage Capital Ratio 8.03% 9.28% 11.38% Common Equity Tier 1 Ratio 12.48% 14.10% 14.55% Tier 1 Risk Based Capital Ratio 12.82% 14.50% 14.98% Total Risk Based Capital Ratio 15.80% 15.58% 15.79%
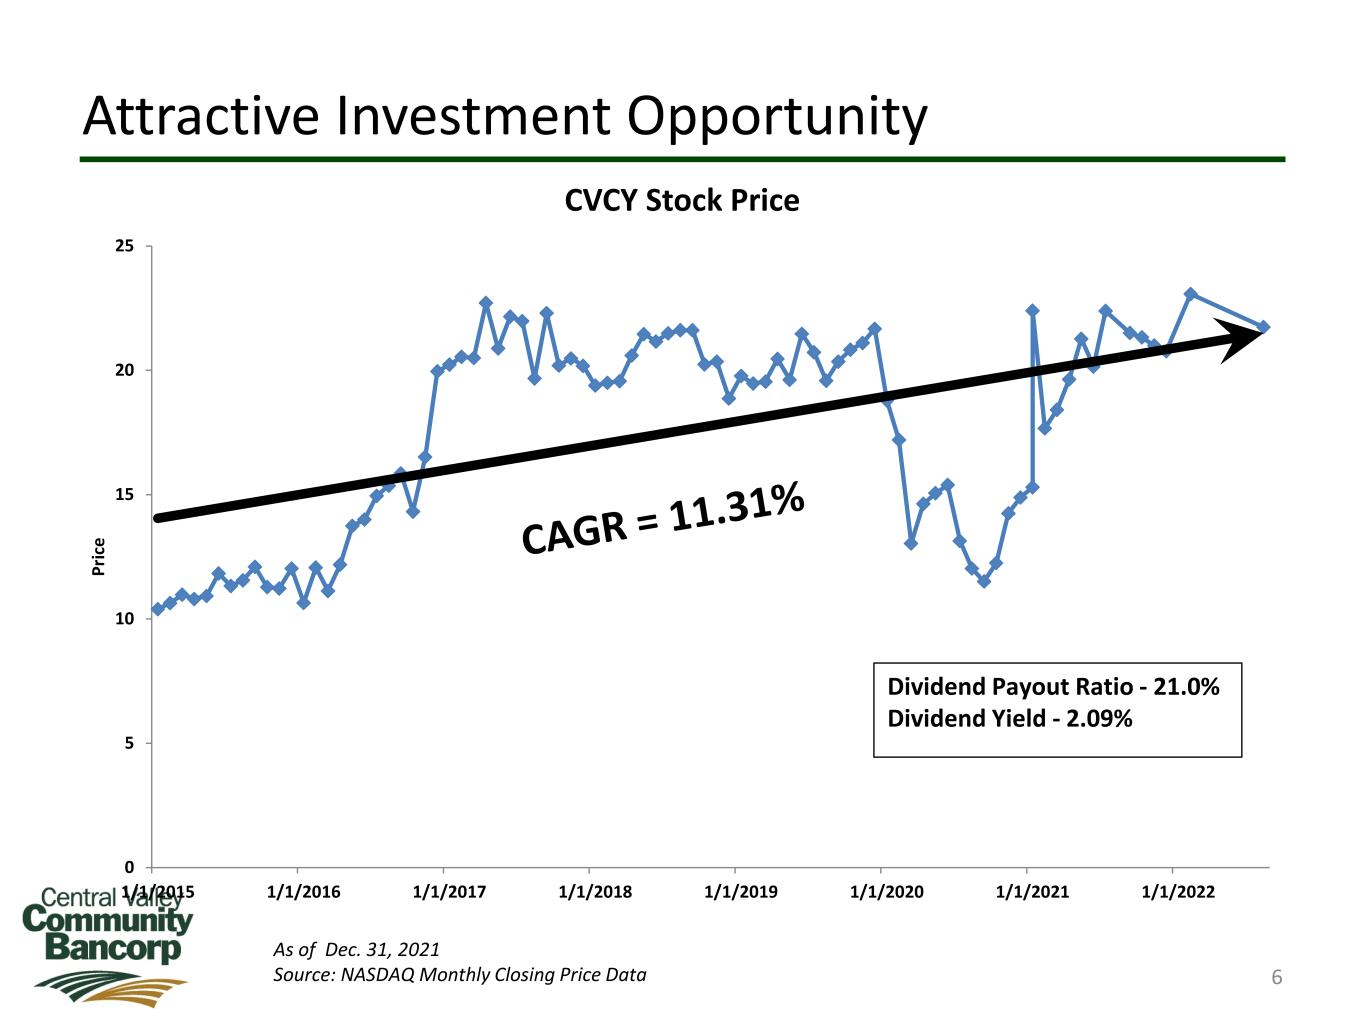
Attractive Investment Opportunity 6 As of Dec. 31, 2021 Source: NASDAQ Monthly Closing Price Data 0 5 10 15 20 25 1/1/2015 1/1/2016 1/1/2017 1/1/2018 1/1/2019 1/1/2020 1/1/2021 1/1/2022 Pr ic e CVCY Stock Price Dividend Payout Ratio - 21.0% Dividend Yield - 2.09%
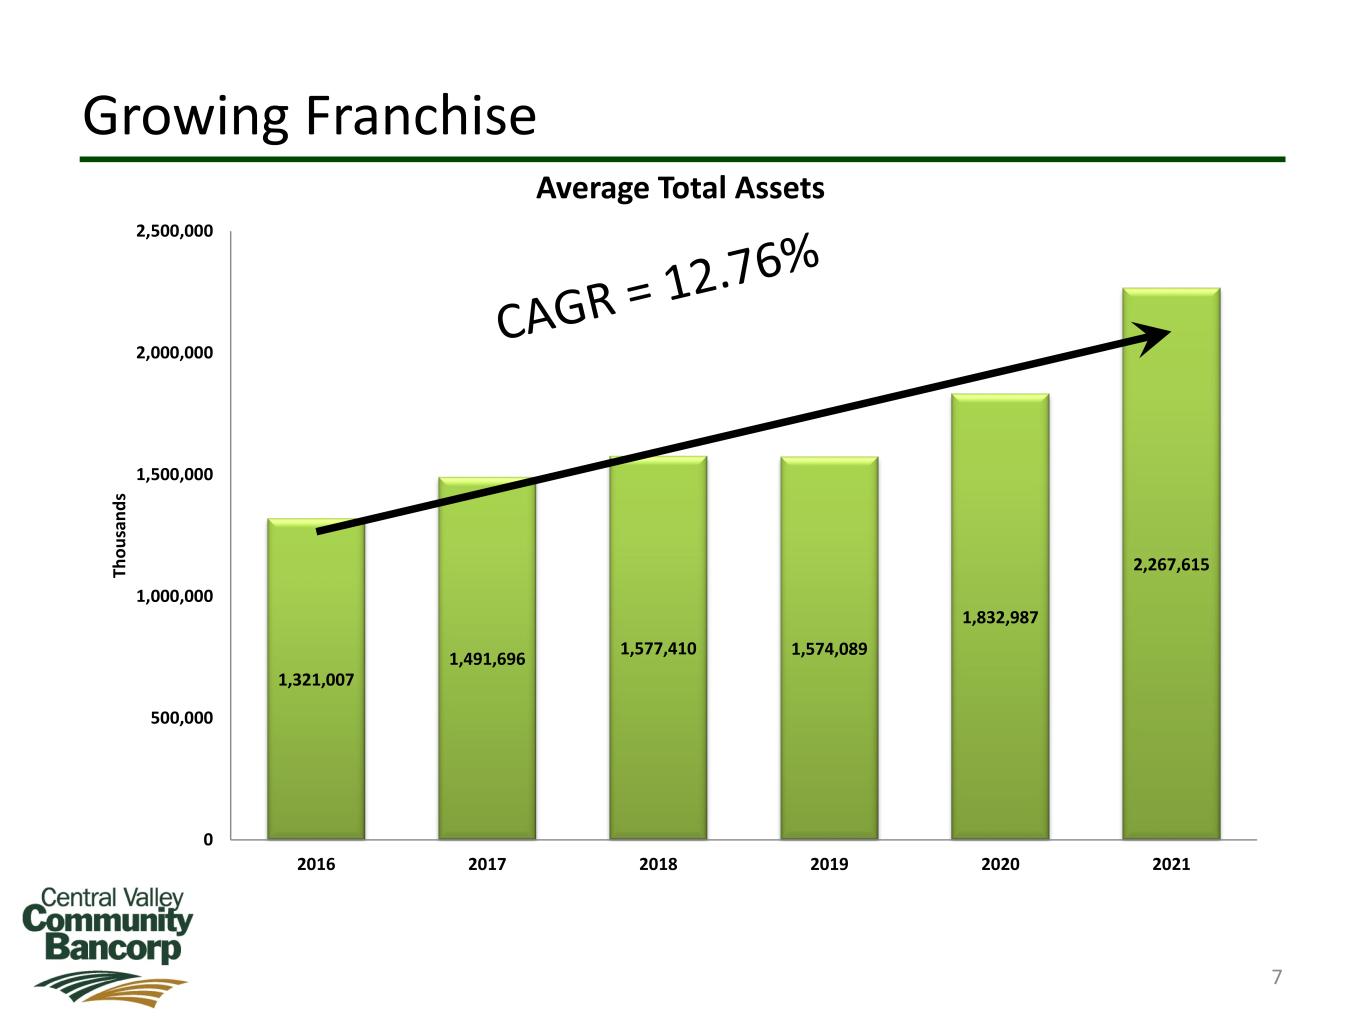
Growing Franchise 7 1,321,007 1,491,696 1,577,410 1,574,089 1,832,987 2,267,615 0 500,000 1,000,000 1,500,000 2,000,000 2,500,000 2016 2017 2018 2019 2020 2021 Th ou sa nd s Average Total Assets
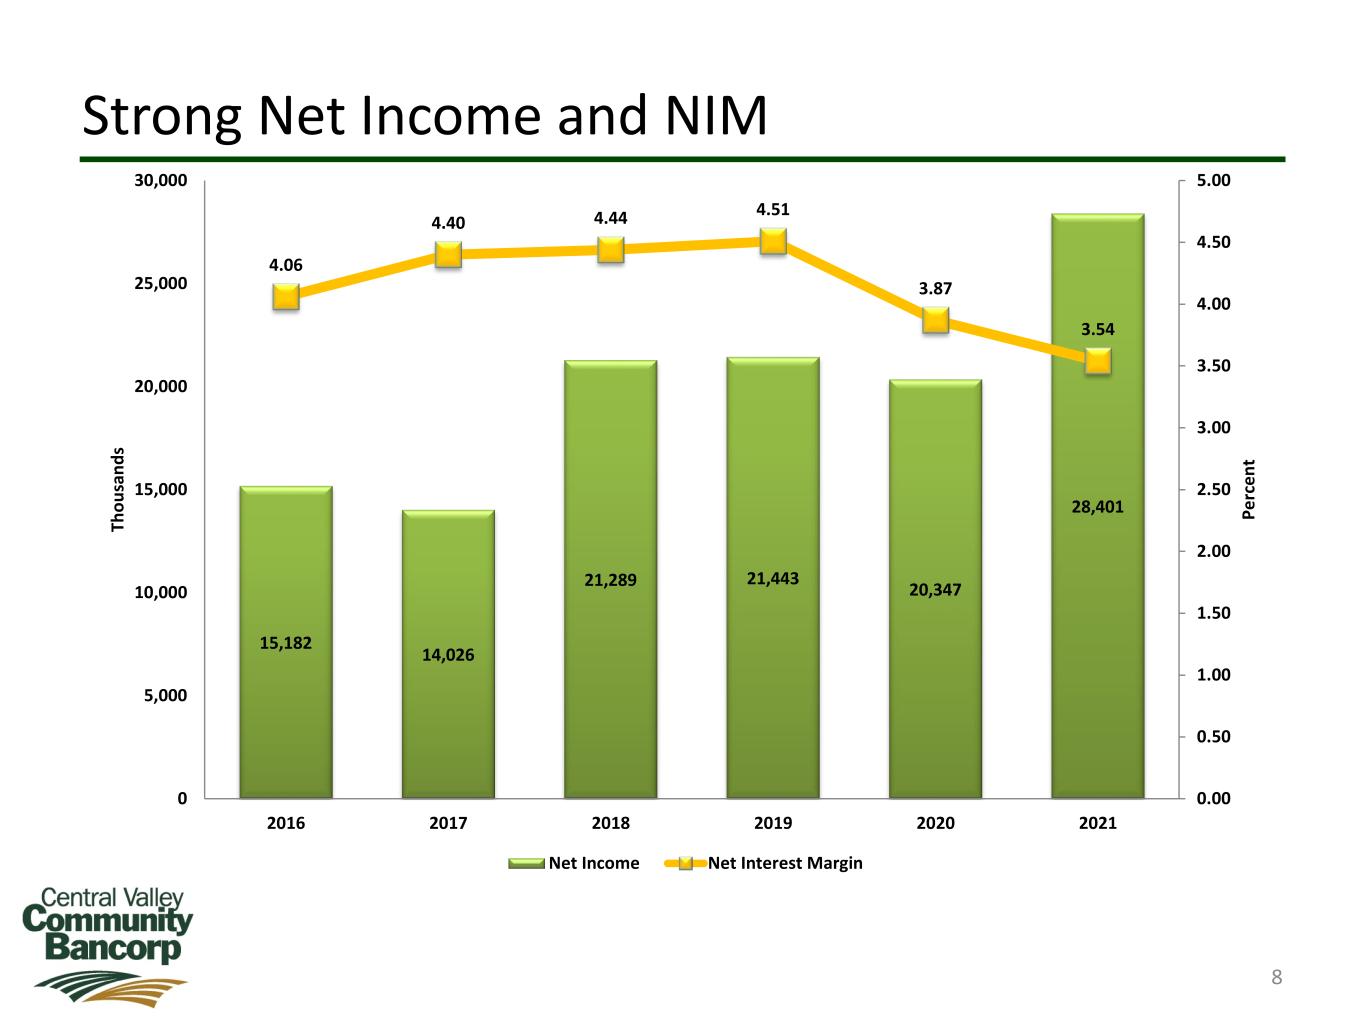
Strong Net Income and NIM 8 15,182 14,026 21,289 21,443 20,347 28,401 4.06 4.40 4.44 4.51 3.87 3.54 0.00 0.50 1.00 1.50 2.00 2.50 3.00 3.50 4.00 4.50 5.00 0 5,000 10,000 15,000 20,000 25,000 30,000 2016 2017 2018 2019 2020 2021 Pe rc en t Th ou sa nd s Net Income Net Interest Margin
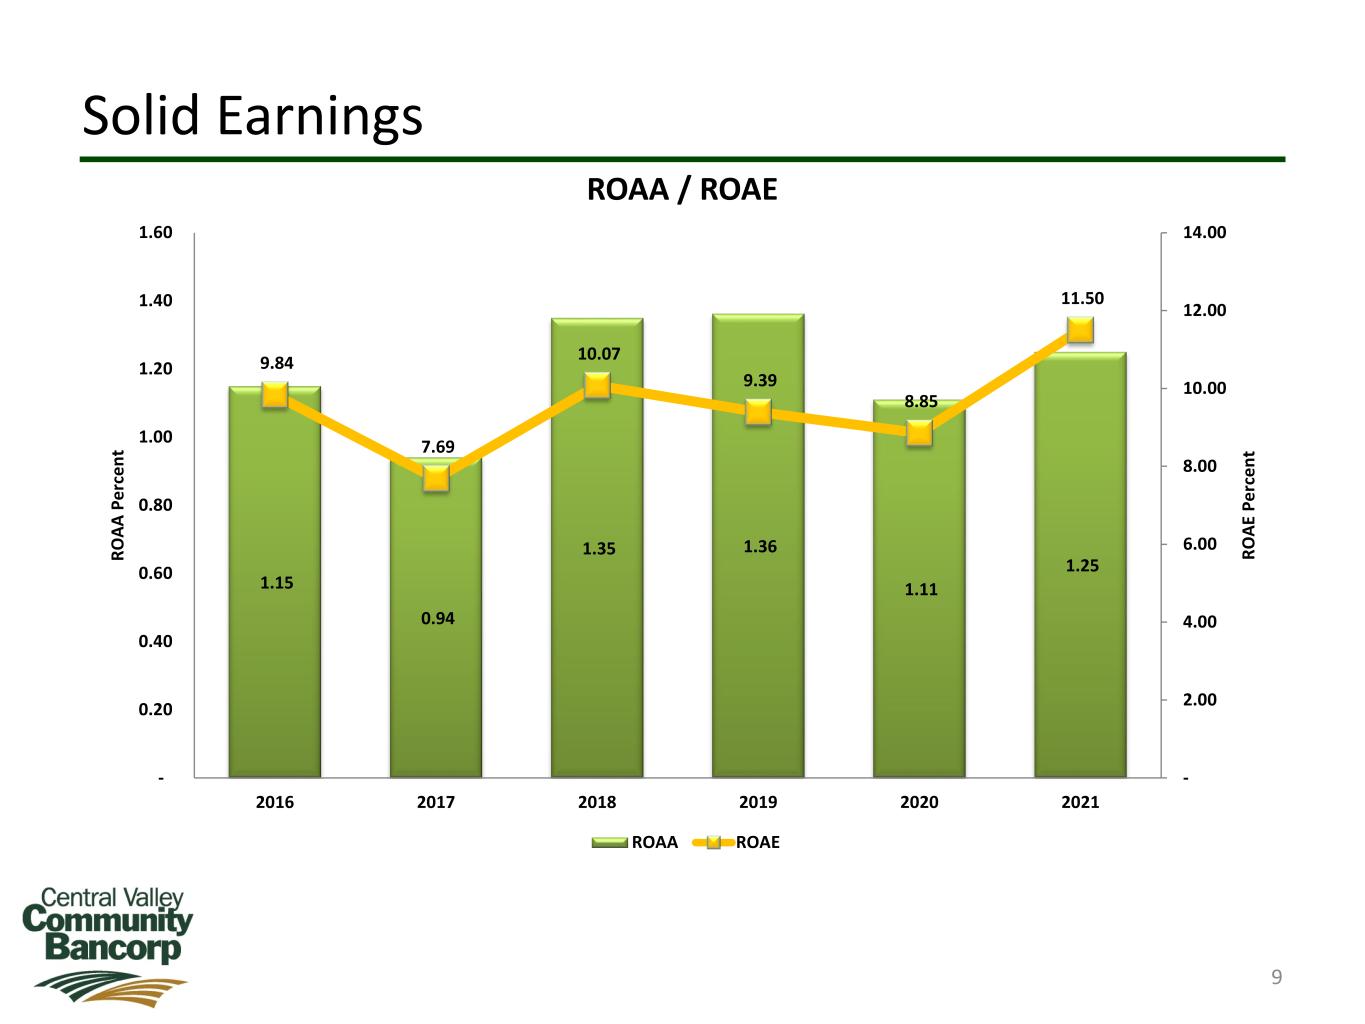
Solid Earnings 9 1.15 0.94 1.35 1.36 1.11 1.25 9.84 7.69 10.07 9.39 8.85 11.50 - 2.00 4.00 6.00 8.00 10.00 12.00 14.00 - 0.20 0.40 0.60 0.80 1.00 1.20 1.40 1.60 2016 2017 2018 2019 2020 2021 RO AE P er ce nt RO AA P er ce nt ROAA / ROAE ROAA ROAE
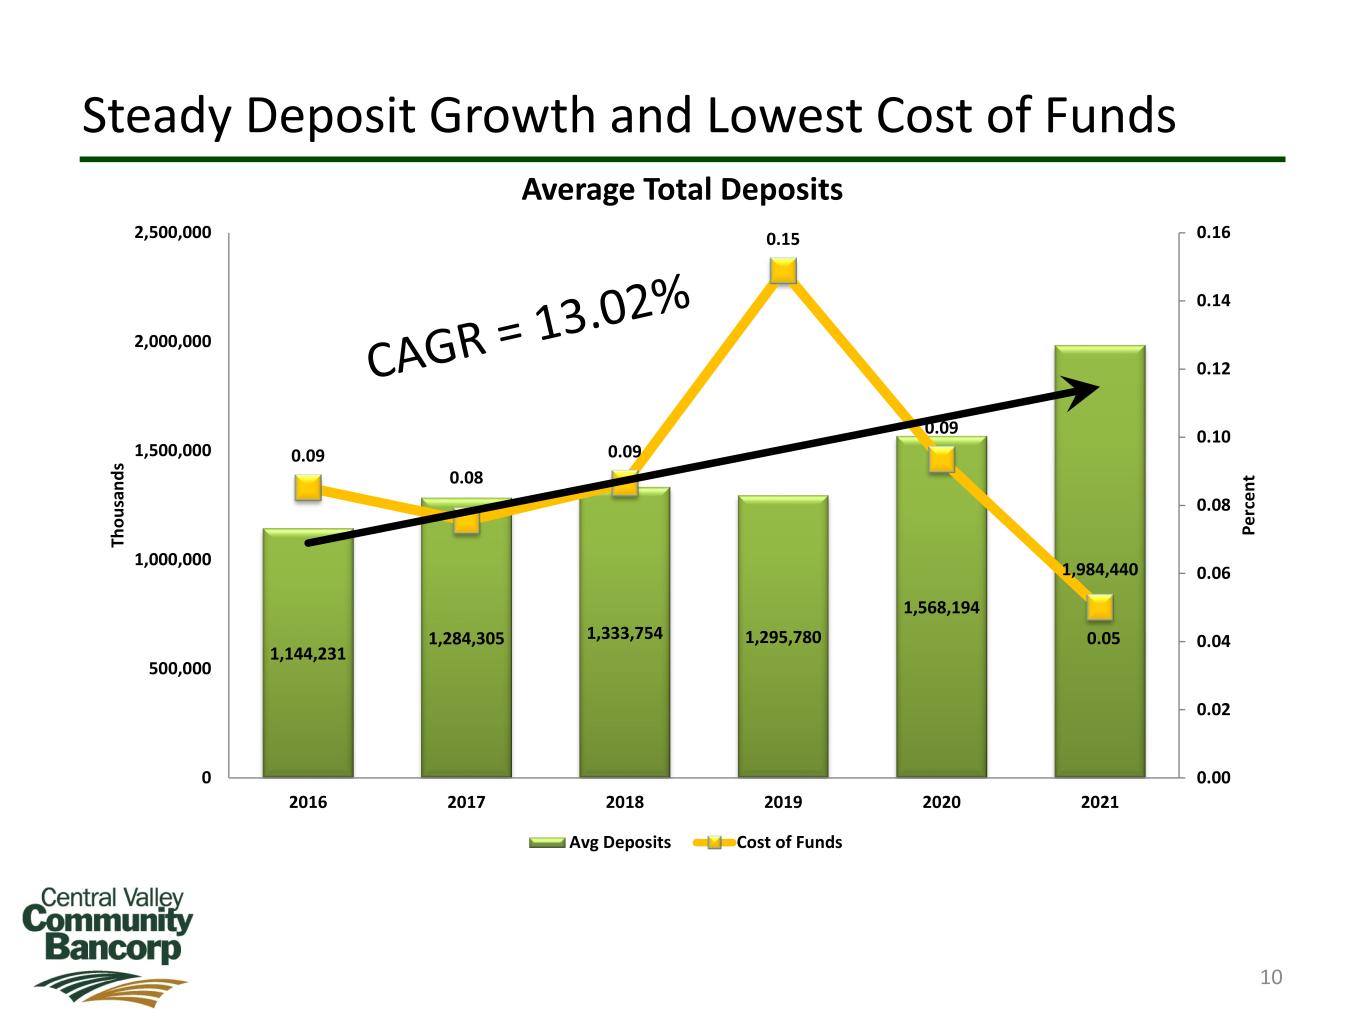
Steady Deposit Growth and Lowest Cost of Funds 10 1,144,231 1,284,305 1,333,754 1,295,780 1,568,194 1,984,440 0.09 0.08 0.09 0.15 0.09 0.05 0.00 0.02 0.04 0.06 0.08 0.10 0.12 0.14 0.16 0 500,000 1,000,000 1,500,000 2,000,000 2,500,000 2016 2017 2018 2019 2020 2021 Pe rc en t Th ou sa nd s Average Total Deposits Avg Deposits Cost of Funds

Attractive Deposit Mix 11 Non-Interest Bearing 46% Now/Savings 26% Money Market 24% TCDs 4% As of Dec. 31, 2021 Total Deposits = $2.12 Billion
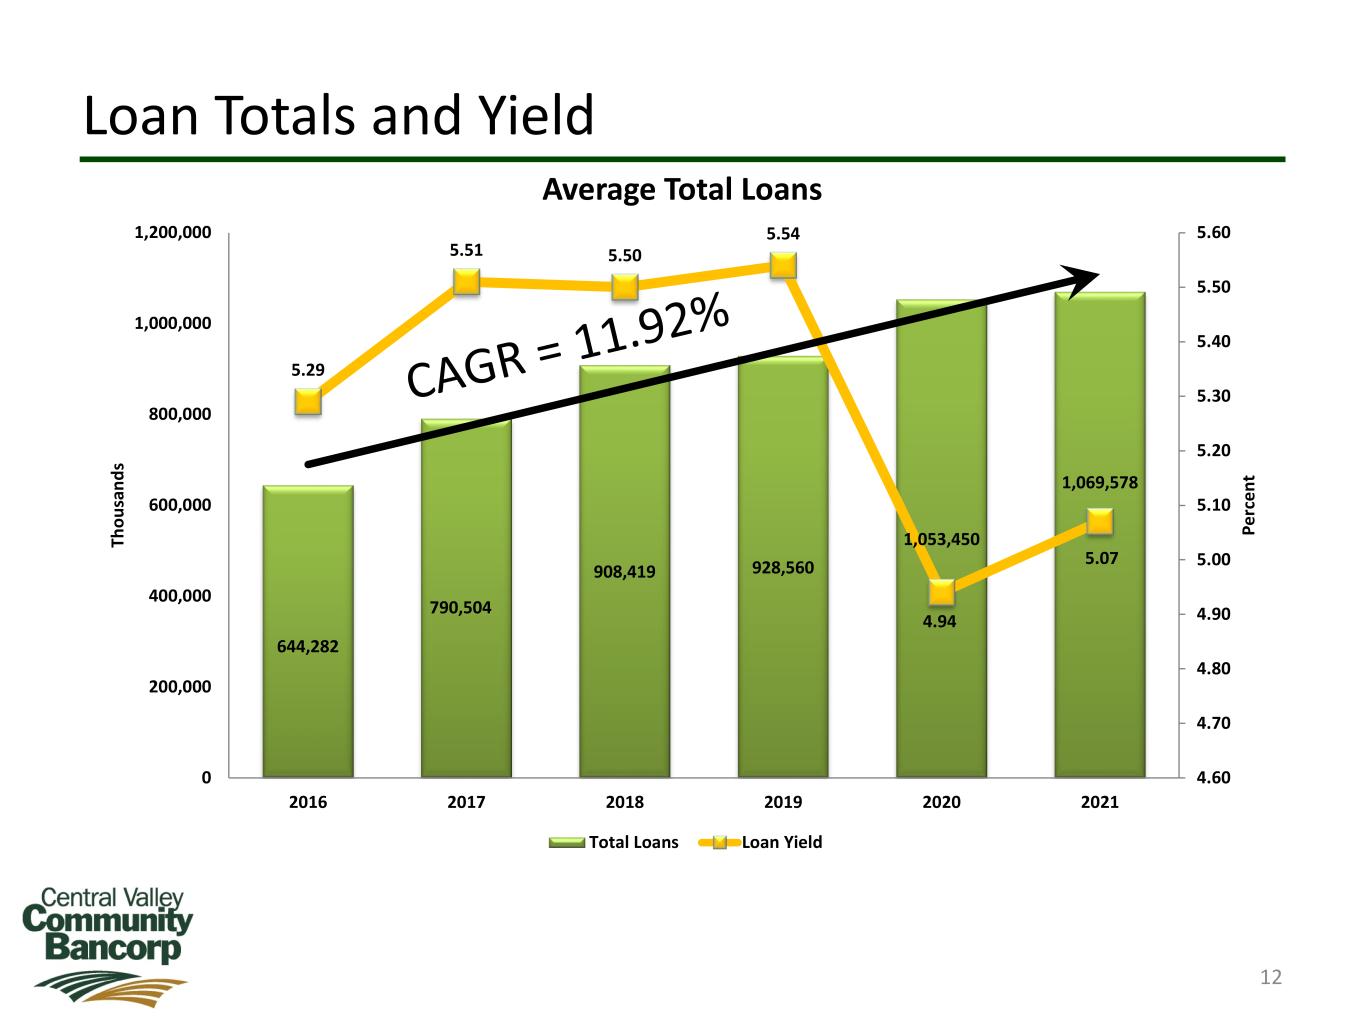
Loan Totals and Yield 12 644,282 790,504 908,419 928,560 1,053,450 1,069,578 5.29 5.51 5.50 5.54 4.94 5.07 4.60 4.70 4.80 4.90 5.00 5.10 5.20 5.30 5.40 5.50 5.60 0 200,000 400,000 600,000 800,000 1,000,000 1,200,000 2016 2017 2018 2019 2020 2021 Pe rc en t Th ou sa nd s Average Total Loans Total Loans Loan Yield

Well Diversified Loan Portfolio 13 Commercial & Industrial, 13% Agriculture Production & Land, 13% Owner Occupied Real Estate, 20% R/E Construction & Land, 6% Commercial Real Estate, 36% Other Real Estate, 3% Equity Loans and Lines, 5% Consumer & Installment, 4% As of Dec. 31, 2021 Excludes Deferred Loan Fees Total Loans = $1.04 Billion

Agricultural Loan Commitments 14 Almonds 27% Table Grapes 2% Open Land 10% Walnuts 3% Wine Grapes 2% Other 14% Row Crops 2% Tomatoes 9% Raisins 4% Cherries 2% Cotton 3% Tree Fruit 10% Pistachios 7% Citrus 5% As of Dec. 31, 2021 Total Ag Line Committments $177.0 Million
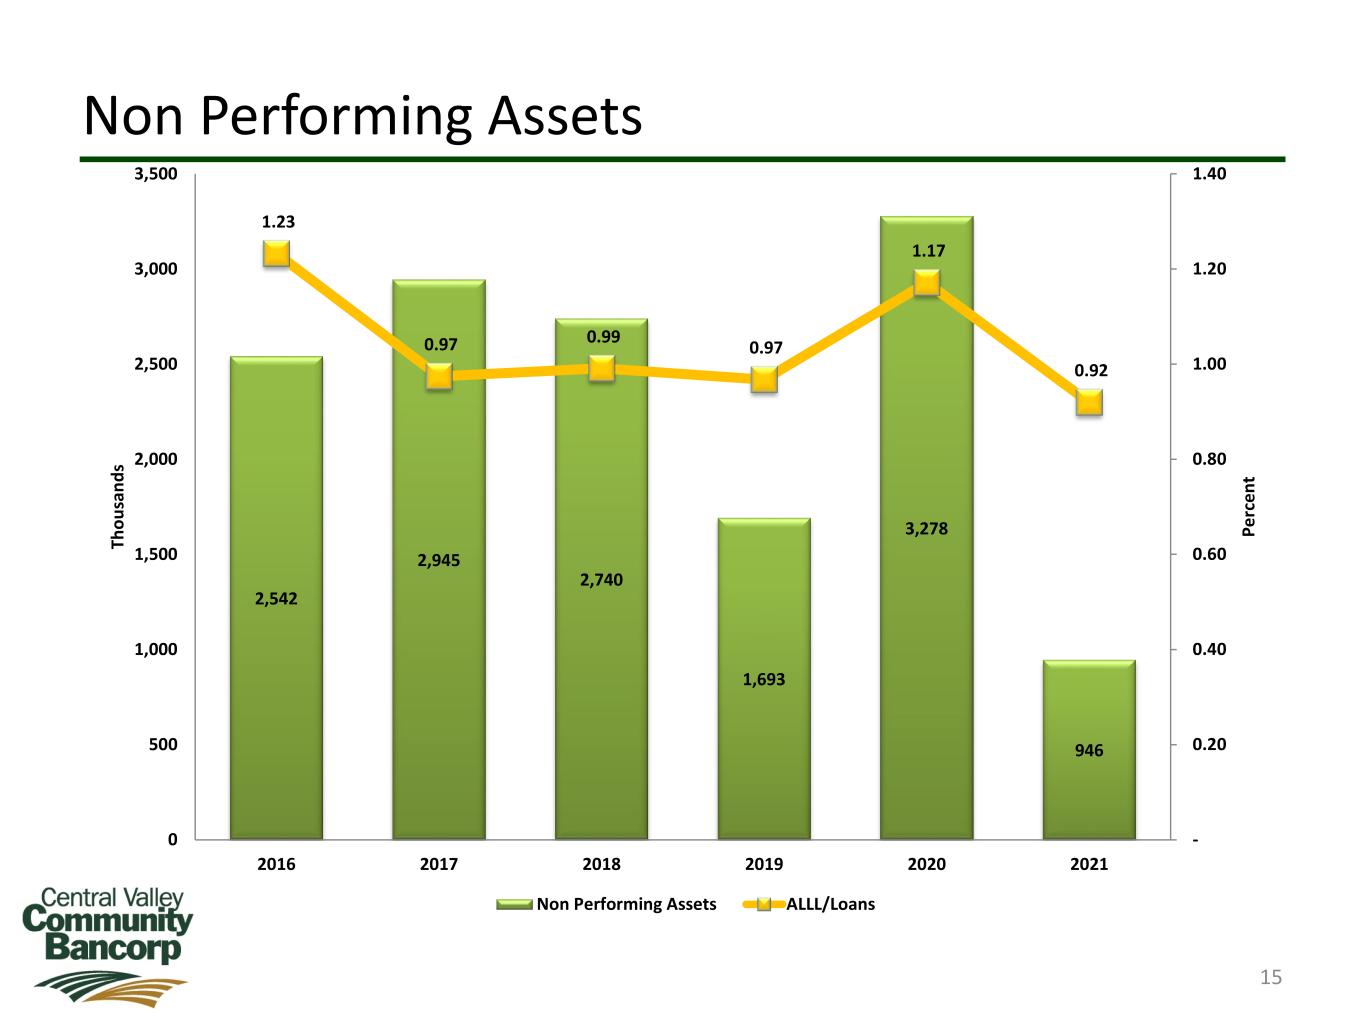
Non Performing Assets 15 2,542 2,945 2,740 1,693 3,278 946 1.23 0.97 0.99 0.97 1.17 0.92 - 0.20 0.40 0.60 0.80 1.00 1.20 1.40 0 500 1,000 1,500 2,000 2,500 3,000 3,500 2016 2017 2018 2019 2020 2021 Pe rc en t Th ou sa nd s Non Performing Assets ALLL/Loans
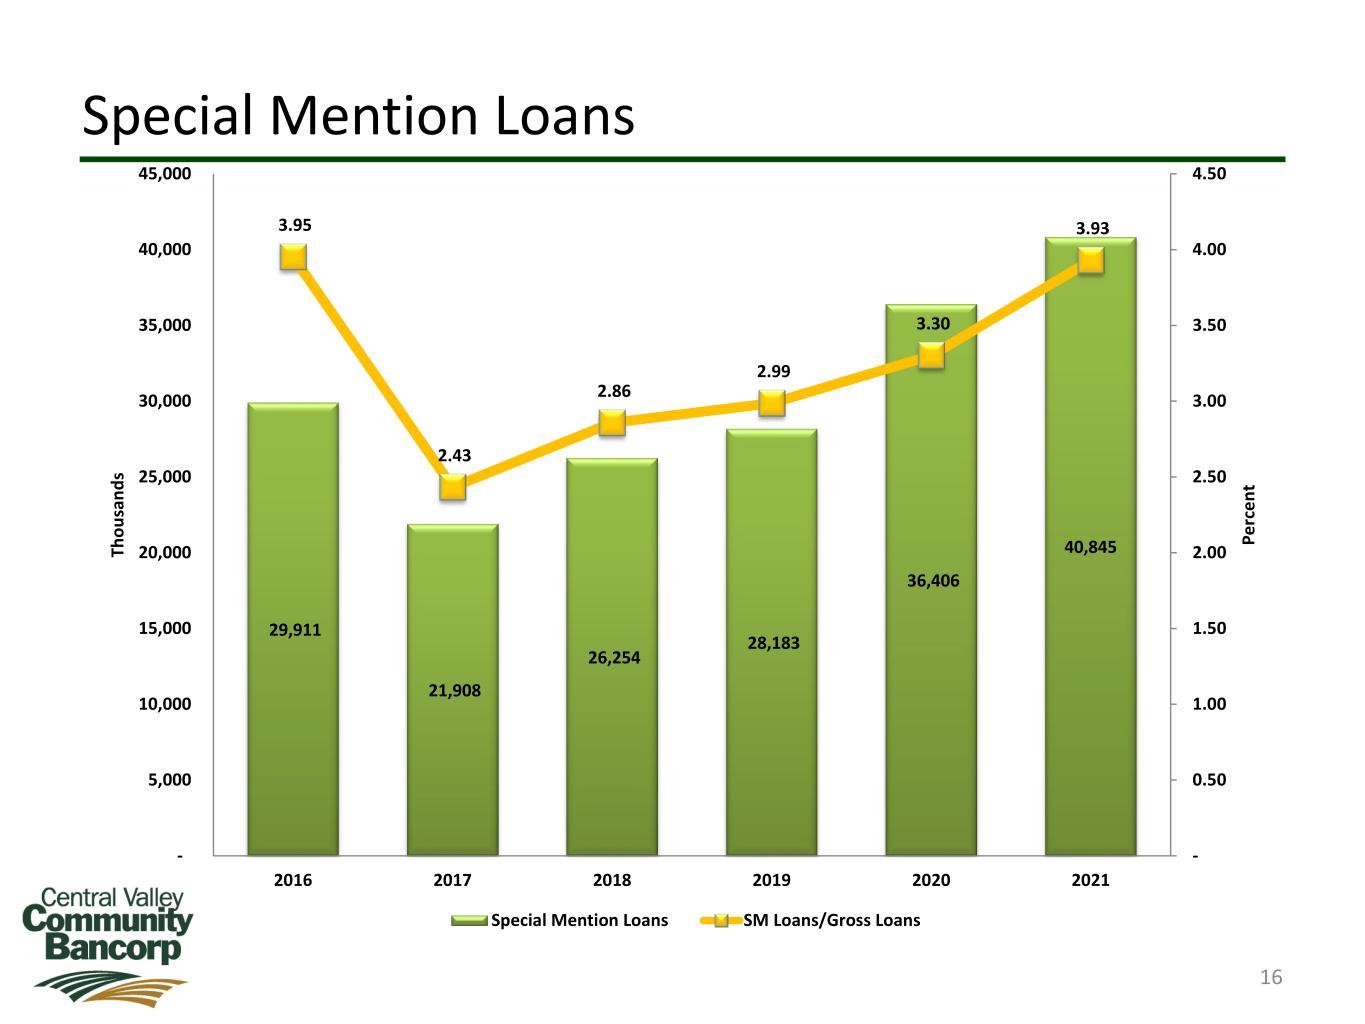
Special Mention Loans 16 29,911 21,908 26,254 28,183 36,406 40,845 3.95 2.43 2.86 2.99 3.30 3.93 - 0.50 1.00 1.50 2.00 2.50 3.00 3.50 4.00 4.50 - 5,000 10,000 15,000 20,000 25,000 30,000 35,000 40,000 45,000 2016 2017 2018 2019 2020 2021 Pe rc en t Th ou sa nd s Special Mention Loans SM Loans/Gross Loans

Substandard Loans 17 49,464 49,998 28,394 33,838 36,136 8,540 6.54 5.55 3.09 3.59 3.28 0.82 - 1.00 2.00 3.00 4.00 5.00 6.00 7.00 - 10,000 20,000 30,000 40,000 50,000 60,000 2016 2017 2018 2019 2020 2021 Pe rc en t Th ou sa nd s Substandard Loans Sub Loans/Gross Loans

Conservative Investment Portfolio 18 US Government Agencies 0%US Treasury Securities 1% Private Label Mortgage & Asset Backed 25% Municipal Securities 42% Agency CMO, MBS & Other Securities 17% Fed Funds Sold 8% Corporate Debt 5% Equity Mutual Funds 1% As of Dec. 31, 2021 Total = $1.12 Billion Yield = 2.02% Effective Duration 4.86

19 Investing in Relationships


