UNITED STATES
SECURITIES AND EXCHANGE COMMISSION
WASHINGTON, D.C. 20549
FORM N-CSR
CERTIFIED SHAREHOLDER REPORT OF REGISTERED MANAGEMENT
INVESTMENT COMPANIES
Investment Company Act file number 811-10201
The Appleton Funds
(Exact name of registrant as specified in charter)
45 Milk Street, Boston, Massachusetts 02109
(Address of principal executive offices) (Zip code)
James I. Ladge, 45 Milk Street, Boston, Massachusetts 02109
(Name and address of agent for service)
Registrant's telephone number, including area code: (513) 878-4000
Date of fiscal year end: 12/31
Date of reporting period: 12/31/08
Form N-CSR is to be used by management investment companies to file reports with the Commission not later than 10 days after the transmission to stockholders of any report that is required to be transmitted to stockholders under Rule 30e-1 under the Investment Company Act of 1940 (17 CFR 270.30e-1). The Commission may use the information provided on Form N-CSR in its regulatory, disclosure review, inspection and policymaking roles.
A registrant is required to disclose the information specified by Form N-CSR, and the Commission will make this information public. A registrant is not required to respond to the collection of information contained in Form N-CSR unless the Form displays a currently valid Office of Management and Budget ("OMB") control number. Please direct comments concerning the accuracy of the information collection burden estimate and any suggestions for reducing the burden to Secretary, Securities and Exchange Commission, 450 Fifth Street, NW, Washington, DC 20549-0609. The OMB has reviewed this collection of information under the clearance requirements of 44 U.S.C. § 3507.
Item 1. Reports to Stockholders.
Annual Report for Appleton Equity Growth Fund
| | | | | | | | | | | | |
| | | | | | | | | | | | |
| | | | | | | | | | | | |
| | | | | | | | | | | | |
| | | | | | | | | | | | |
| | | | | | | | | | | | |
| | | | | | | | | | | | |
| | | APPLETON EQUITY GROWTH FUND | | |
| | | | | | | | | | | | |
| | | | | | | | | | | | |
| | | | | | | | | | | | |
| | | | | | | | | | | | |
| | | | | | | | | | | | |
| | | | | | | | | | | | |
| | | | | | | | | | | | |
| | | | | | | | | | | | |
| | | | | | | | | | | | |
| | | | | | | | | | | | |
| | | | | | | | | | | | |
| | | Annual Report | | |
| | | December 31, 2008 | | |
| | | | | |
| | | | | | | | | | | | |
| | | | | |
| | | | | | | | | | | | |
| | | | | | | | | | | | |
| | | | | | | | | | | | |
| | | | | | | | | | | | |
| | | | | | | | | | | | |
| | | | | | | | | | | | |
| | | | | | | | | | | | |
| | | | | | | | | | | | |
| | | | | |
| | | | | |
| | | | | |
| | | | | |
| | | | | | | | | | | | |
| | | | | | | | | | | | |
| | | Investment Adviser | | | Administrator | | |
| | | Appleton Partners, Inc. | | | JPMorgan | | |
| | | 45 Milk Street, Eighth Floor | | | 303 Broadway | | |
| | | Boston, MA 02109 | | | Suite 900 | | |
| | | | | | | | Cincinnati, OH 45202 | | |
| | | | | | | | 1-877-712-7753 | | |
| | | | | | | | | | | | |
| | | | | | | | | | | | |
| | | | | | | | | | |
| | | | | | | | | | |
| | | | | | | | | | | | |
| | | | | | | | | | | | |
Dear Shareholder,
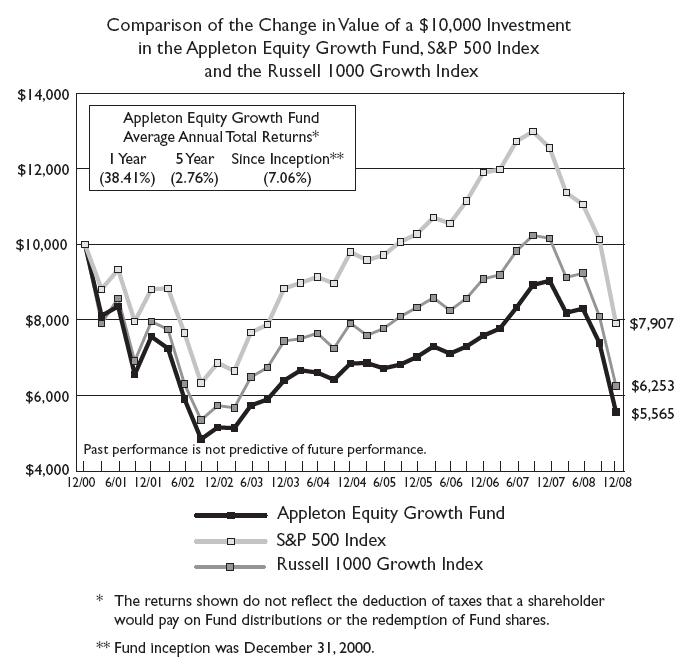
The second half of 2008 finished as one of the most challenging in history as investors had to digest the near-collapse of the global financial system, the introduction of the TARP program, the undeniable reality that a global recession was imminent, and the announcement of potentially the largest Ponzi scheme in history. As in the first half, volatility continued to clutch the markets while essentially all stock price indices, domestic or global, showed sharp declines. For the year, the S&P 500 finished down 37.00% with the Fund ending down 38.41%. Our higher than normal level of cash did provide some protection during this period, while also providing funds for future redeployment in the months ahead as the stock market ultimately finds firmer footing and the new leadership evolves. Below we offer our thoughts about this past year and the months ahead.
On December 1, 2008, the National Bureau of Economic Research (NBER) announced that its Business Cycle Dating Committee determined that the US economy had entered into a recession in December of 2007. As usual, the NBER was late in making its announcement, probably by design due to the fact that it does not like to revise. In our view, the announcement forced a subtle shift from discussions over whether there will be a recession to discussions about its potential duration and severity.
There are many major themes that will have substantial impact on these discussions. Among them will be the efficacy and timeliness of policy initiatives already taken, or to be taken, by just about all countries of the world; the speed and degree to which the new Administration initiates and implements its desired changes as it takes control of the Federal government, and; the short-term and long-term impact of the deleveraging of our economy.
There has been at least one uniquely positive phenomenon that we have observed during this recession which is the concerted effort by all major nations to undertake substantial programs of monetary ease and fiscal stimulus. This has never occurred before, although none of these efforts to date have yet gained traction in moving the global economy toward recovery. Although there had been much discussion in recent years about how the United States’ role of lead locomotive to global train of economic growth had diminished sharply, evidence of that diminished role is less forthcoming. Actually, evidence to the contrary is increasingly manifest, as we witness Toyota’s recent decision to close its Japanese plants for a period of time.
As easy as it is to get wrapped up in the concept of change with the election of the new president, it is important to remember that not everything will change, nor will every change necessarily happen exactly in the manner, or within the timeframe desired, by its advocates. Thus, we as investors should expect further bumps in the road ahead as some changes may take longer than desired but no longer than one should have expected.
As example, there has been much talk about monies needing to be spent towards rebuilding our nation’s infrastructure, be it for highways or public transportation. Simply remembering, however, how long it took for the Interstate Highway System (originally called The National Defense Highway System) to be built, should give us pause as to just how long it takes to put infrastructure programs in place. These are long-term, multi-year programs, rather than short-term ones. It is also worth noting that there will be much political jousting as to which federally-funded programs and geographic regions will capture increased share of the available dollars. With a decennial census due next year in 2010, Congressional seats and some Congressional power may shift further, as certain states lose seats while others gain.
The housing decline continues unabated with housing starts at the lowest levels since WWII; annual rates of house price declines are at the steepest levels seen in the years for which we have good data; used home sales are also down sharply while inventories of unsold homes remain unusually high. Fortunately, mortgage rates are now down along with house prices. Although the topic receives little discussion, there seems to be a tussle between the now positive forces that make housing affordable for its utilitarian purpose versus the now negative desirability of housing as an investment asset. With housing prices continuing a sharp decline, the decreased desirability as an investment vehicle, along with a diminished wealth effect, seems to be overpowering its increased affordability.
Although we have not yet seen any of the early signs of economic recovery, the $100 per barrel decline in the price of oil since July is not without its substantial benefit in helping to nudge the economic cycle toward recovery. With daily U.S. consumption of oil at around 20 million barrels per day, the $100 per barrel decline in price seen in recent months, if sustained, could equate to a massive stimulus program, equivalent to about 5% of our GDP. This translates to a stimulus program that would benefit all sectors of the economy. For now, much of that reduction in oil consumption is being saved and not spent. Again, this is a step in the right direction for the foundation of a good future economy, but not a lot of help in getting us out of recession in the months immediately ahead.
What may be most important over the longer term, after our recovery has started, is the deleveraging of the American economy. We have noted a number of times in the past, that for years, the American consumer had been substituting house price appreciation for savings. With the decline in house prices now the trend, the greater emphasis by all lenders on creditworthiness, and the essential elimination of vehicle leasing by American manufacturers, it would seem that the decades-long credit expansion tide has turned. The result is likely to be a period of recession followed by slower economic growth, accompanied by a period of low Consumer Price Inflation.
We are following these events closely and will continue to diligently monitor, review and assess the evolving landscape, taking appropriate action when necessary. During the second half of the year, all of the stock market’s major sectors showed declines. Best performing were Utilities, Healthcare, and Consumer Staples while worst performing were Financial and Materials stocks.
In spite of the unusually high levels of economic uncertainly which continue to warrant higher than normal levels of cash in portfolios, we continue focusing our portfolios and research on securities showing above average profit gains that are reasonably priced relative to the market and their historic trends. As we have noted in the past, as problem stocks suffer, other stocks with better prospects gain visibility, forcing evolution of portfolios to those equities showing the most improvement in profitability and the best prospects for future profit growth.
Best wishes for a peaceful and healthy New Year.
Sincerely,
James I. Ladge, CFA
President
| Tabular Presentation of Portfolio |
| As of December 31, 2008 |
| Sector | (% of Net Assets) |
| Consumer, Cyclical | 8.8% |
| Consumer, Non-Cyclical | 11.5% |
| Energy | 11.7% |
| Financial Services | 5.2% |
| Healthcare | 16.6% |
| Industrial | 15.0% |
| Materials | 8.6% |
| Technology | 19.3% |
| Money Markets | 3.6% |
| Liabilities in Excess of Other Assets | (0.3%) |
| | 100.0% |
APPLETON EQUITY GROWTH FUND
PORTFOLIO OF INVESTMENTS
December 31, 2008
| | | | | Market |
| Shares | | | | Value |
| | | COMMON STOCKS — 96.7% | | |
| | | CONSUMER, CYCLICAL — 8.8% | | |
| 1,400 | | Apollo Group, Inc. - Class A* | $ | 107,268 |
| 6,200 | | McDonald’s Corp. | | 385,578 |
| 8,000 | | The Walt Disney Co. | | 181,520 |
| | | | | 674,366 |
| | | | | |
| | | CONSUMER, NON-CYCLICAL — 11.5% | | |
| 7,500 | | CVS Caremark Corp. | | 215,550 |
| 4,850 | | Kellogg Co. | | 212,673 |
| 3,285 | | PepsiCo, Inc. | | 179,919 |
| 4,362 | | Procter & Gamble Co. | | 269,659 |
| | | | | 877,801 |
| | | | | |
| | | ENERGY — 11.7% | | |
| 2,250 | | Apache Corp. | | 167,693 |
| 4,400 | | Exxon Mobil Corp. | | 351,251 |
| 3,500 | | Schlumberger Ltd. | | 148,155 |
| 4,400 | | Smith International, Inc. | | 100,716 |
| 2,750 | | Transocean Ltd.* | | 129,938 |
| | | | | 897,753 |
| | | | | |
| | | FINANCIAL SERVICES — 5.2% | | |
| 4,500 | | T. Rowe Price Group, Inc. | | 159,480 |
| 8,000 | | Wells Fargo & Co. | | 235,840 |
| | | | | 395,320 |
| | | | | |
| | | HEALTHCARE — 16.6% | | |
| 4,675 | | Baxter International, Inc. | | 250,533 |
| 3,400 | | Becton, Dickinson & Co. | | 232,526 |
| 4,300 | | Express Scripts, Inc.* | | 236,414 |
| 7,000 | | Gilead Sciences, Inc.* | | 357,980 |
| 4,700 | | Stryker Corp. | | 187,765 |
| | | | | 1,265,218 |
| | | | | |
| | | INDUSTRIAL — 15.0% | | |
| 7,800 | | AMETEK, Inc. | | 235,638 |
| 3,750 | | Caterpillar, Inc. | | 167,513 |
| 3,300 | | Deere & Co. | | 126,456 |
| 8,850 | | General Electric Co. | | 143,370 |
| 3,500 | | Norfolk Southern Corp. | | 164,675 |
| 2,600 | | Precision Castparts Corp. | | 154,648 |
APPLETON EQUITY GROWTH FUND
PORTFOLIO OF INVESTMENTS, Continued
December 31, 2008
| Shares | | | | Market |
| | | | | Value |
| | | COMMON STOCKS — 96.7% | | |
| | | INDUSTRIAL — 15.0% | | |
| | | | | |
| | | | | |
| 4,000 | | Wabtec Corp. | $ | 159,000 |
| | | | | 1,151,300 |
| | | | | |
| | | MATERIALS — 8.6% | | |
| 3,450 | | Agrium, Inc. | | 117,749 |
| 5,950 | | Ecolab, Inc. | | 209,143 |
| 4,700 | | Praxair, Inc. | | 278,991 |
| 800 | | Vulcan Materials Co. | | 55,664 |
| | | | | 661,547 |
| | | | | |
| | | TECHNOLOGY — 19.3% | | |
| 16,150 | | Activision Blizzard, Inc.* | | 139,536 |
| 8,925 | | Amphenol Corp. | | 214,022 |
| 8,500 | | ANSYS, Inc.* | | 237,064 |
| 1,550 | | Apple, Inc.* | | 132,293 |
| 10,000 | | Cisco Systems, Inc.* | | 163,000 |
| 2,925 | | International Business Machines Corp. | | 246,167 |
| 6,000 | | Microsoft Corp. | | 116,640 |
| 12,500 | | Oracle Corp.* | | 221,625 |
| | | | | 1,470,347 |
| | | | | |
| | | TOTAL COMMON STOCKS | $ | 7,393,652 |
| | | | | |
| | | MONEY MARKETS — 3.6% | | |
| 278,440 | | Fidelity Money Market Fund | | 278,440 |
| | | | | |
| | | TOTAL INVESTMENT SECURITIES — 100.3% (Cost $9,236,575) | $ | 7,672,092 |
| | | | | |
| | | LIABILITIES IN EXCESS OF OTHER ASSETS — (0.3%) | | (21,452) |
| | | | | |
| | | NET ASSETS — 100.0% | $ | 7,650,640 |
*Non-income producing security
See accompanying notes to financial statements.
APPLETON EQUITY GROWTH FUND
STATEMENT OF ASSETS AND LIABILITIES
December 31, 2008
| | | | |
| ASSETS | | | |
| Investment securities: | | | |
| At acquisition cost | | $ | 9,236,575 | |
| At market value | | $ | 7,672,092 | |
| Dividends receivable | | | 15,649 | |
| Receivable from Adviser | | | 27,454 | |
| TOTAL ASSETS | | | 7,715,195 | |
| | | | | |
| LIABILITIES | | | | |
| Distributions payable to shareholders | | | 4,078 | |
| Payable to other affiliates | | | 16,993 | |
| Payable to Trustees | | | 4,500 | |
| Other accrued expenses | | | 38,984 | |
| TOTAL LIABILITIES | | | 64,555 | |
| | | | | |
| NET ASSETS | | $ | 7,650,640 | |
| | | | | |
| NET ASSETS CONSIST OF | | | | |
| Paid-in capital | | $ | 11,529,469 | |
| Accumulated net realized losses from security transactions | | | (2,314,346 | ) |
| Net unrealized depreciation on investments | | | (1,564,483 | ) |
| NET ASSETS | | $ | 7,650,640 | |
| | | | | |
| Shares of beneficial interest outstanding (unlimited number of shares authorized, no par value) | | | 1,386,109 | |
| | | | | |
| | | | | |
| Net asset value, offering price and redemption price per share | | $ | 5.52 | |
| | | | | |
See accompanying notes to financial statements.
APPLETON EQUITY GROWTH FUND
STATEMENT OF OPERATIONS
For the Year Ended December 31, 2008
| | | | |
| INVESTMENT INCOME | | | |
| Dividends | | $ | 164,887 | |
| | | | | |
| EXPENSES | | | | |
| Investment advisory fees | | | 105,945 | |
| Accounting services fees | | | 30,000 | |
| Professional fees | | | 28,000 | |
| Administration fees | | | 24,000 | |
| Transfer agent fees | | | 24,000 | |
| Distribution expenses | | | 18,406 | |
| Custodian fees | | | 17,335 | |
| Trustees' fees and expenses | | | 15,780 | |
| Compliance fees and expenses | | | 15,000 | |
| Reports to shareholders | | | 4,132 | |
| Insurance expense | | | 2,536 | |
| Postage and supplies | | | 2,522 | |
| Registration fees | | | 1,810 | |
| Pricing expense | | | 955 | |
| TOTAL EXPENSES | | | 290,421 | |
| Fees waived and expenses reimbursed by Adviser | | | (131,997 | ) |
| NET EXPENSES | | | 158,424 | |
| | | | | |
| NET INVESTMENT INCOME | | | 6,463 | |
| | | | | |
| REALIZED AND UNREALIZED LOSS ON INVESTMENTS | | | | |
| Net realized loss from security transactions | | | (420,641 | ) |
| Net change in unrealized appreciation/depreciation on investments | | | (4,379,691 | ) |
| | | | | |
| NET REALIZED AND UNREALIZED LOSS ON INVESTMENTS | | | (4,800,332 | ) |
| | | | | |
| NET DECREASE IN NET ASSETS FROM OPERATIONS | | $ | (4,793,869 | ) |
| | | | | |
| | | | | |
See accompanying notes to financial statements.
STATEMENTS OF CHANGES IN NET ASSETS
| | | For the | | | For the | |
| | | Year Ended | | | Year Ended | |
| | | December 31, | | | December 31, | |
| | | 2008 | | | 2007 | |
| FROM OPERATIONS | | | | | | |
| Net investment income | | $ | 6,463 | | | $ | 49,877 | |
| Net realized gains (losses) from security transactions | | | (420,641 | ) | | | 317,877 | |
| Net change in unrealized appreciation/depreciation on investments | | | (4,379,691 | ) | | | 1,360,795 | |
| Net increase (decrease) in net assets from operations | | | (4,793,869 | ) | | | 1,728,549 | |
| | | | | | | | | |
| DISTRIBUTIONS TO SHAREHOLDERS | | | | | | | | |
| From investment income | | | (6,463 | ) | | | (49,877 | ) |
| | | | | | | | | |
| FROM CAPITAL SHARE TRANSACTIONS | | | | | | | | |
| Proceeds from shares sold | | | 1,360,211 | | | | 2,717,575 | |
| Reinvestment of distributions | | | 2,385 | | | | 19,533 | |
| Payments for shares redeemed | | | (753,566 | ) | | | (997,175 | ) |
| Net increase in net assets from capital share transactions | | | 609,030 | | | | 1,739,933 | |
| | | | | | | | | |
| TOTAL INCREASE (DECREASE) IN NET ASSETS | | | (4,191,302 | ) | | | 3,418,605 | |
| | | | | | | | | |
| NET ASSETS | | | | | | | | |
| Beginning of year | | | 11,841,942 | | | | 8,423,337 | |
| End of year | | $ | 7,650,640 | | | $ | 11,841,942 | |
| | | | | | | | | |
| ACCUMULATED NET INVESTMENT INCOME | | $ | - | | | $ | - | |
| | | | | | | | | |
| CAPITAL SHARE ACTIVITY | | | | | | | | |
| Sold | | | 171,711 | | | | 326,730 | |
| Reinvested | | | 432 | | | | 2,178 | |
| Redeemed | | | (106,606 | ) | | | (122,190 | ) |
| Net increase in shares outstanding | | | 65,537 | | | | 206,718 | |
| Shares outstanding, beginning of year | | | 1,320,572 | | | | 1,113,854 | |
| Shares outstanding, end of year | | | 1,386,109 | | | | 1,320,572 | |
| | | | | | | | | |
| | | | | | | | | |
See accompanying notes to financial statements.
APPLETON EQUITY GROWTH FUND
FINANCIAL HIGHLIGHTS
Selected Per Share Data and Ratios for a Share Outstanding Throughout Each Year
| | | | For the | | For the | | For the | | For the | | For the |
| | | | Year Ended | | Year Ended | | Year Ended | | Year Ended | | Year Ended |
| | | | December 31, | | December 31, | | December 31, | | December 31, | | December 31, |
| | | | 2008 | | 2007 | | 2006 | | 2005 | | 2004 |
| | | | | | | | | | | | |
| Net asset value at beginning of year | | $ 8.97 | | $ 7.56 | | $ 7.00 | | $ 6.83 | | $ 6.40 |
| | | | | | | | | | | | |
| Income (loss) from investment operations: | | | | | | | | | | |
| | Net investment income (loss) | | 0.00 | (a) | 0.04 | | (0.00) | (a) | (0.01) | | 0.02 |
| | Net realized and unrealized gains (losses) on investments | | (3.45) | | 1.41 | | 0.56 | | 0.18 | | 0.43 |
| Total from investment operations | | (3.45) | | 1.45 | | 0.56 | | 0.17 | | 0.45 |
| | | | | | | | | | | | |
| Less distributions: | | | | | | | | | | |
| | Dividends from net investment income | | 0.00 | (a) | (0.04) | | - | | - | | (0.02) |
| | | | | | | | | | | | |
| Net asset value at end of year | | $ 5.52 | | $ 8.97 | | $ 7.56 | | $ 7.00 | | $ 6.83 |
| | | | | | | | | | | | |
| Total return | | (38.41%) | | 19.15% | | 8.00% | | 2.49% | | 7.04% |
| | | | | | | | | | | | |
| Net assets at end of year | | $ 7,650,640 | | $ 11,841,942 | | $ 8,423,337 | | $ 6,863,687 | | $ 6,625,594 |
| | | | | | | | | | | | |
| | | | | | | | | | | | |
| Ratio of net expenses to average net assets | | 1.50% | | 1.50% | | 1.50% | | 1.50% | | 1.50% |
| | | | | | | | | | | | |
| Ratio of net investment income (loss) to average net assets | | 0.06% | | 0.50% | | (0.06%) | | (0.11%) | | 0.33% |
| | | | | | | | | | | | |
| Portfolio turnover rate | | 40% | | 36% | | 50% | | 85% | | 40% |
| | | | | | | | | | | | |
| | | | | | | | | | | | |
| (a) | Amount rounds to less than $0.01. | | | | | | | | | | |
| | | | | | | | | | | | |
| See accompanying notes to financial statements. | | | | | | | | | | |
APPLETON EQUITY GROWTH FUND
NOTES TO FINANCIAL STATEMENTS
December 31, 2008
1. Significant Accounting Policies
The Appleton Funds (the Trust) is registered under the Investment Company Act of 1940, as amended, (the 1940 Act), as a diversified, no-load, open-end management investment company. The Trust was organized as an Ohio business trust on October 31, 2000. The Trust currently offers one series of shares to investors: the Appleton Equity Growth Fund (the Fund). The Trust was capitalized on December 29, 2000, when the initial shares of the Fund were purchased at $10 per share. The Fund commenced operations on December 31, 2000.
The Fund seeks long-term growth of capital by investing primarily in common stocks.
The following is a summary of the Fund's significant accounting policies:
Securities valuation – The Fund's portfolio securities are valued as of the close of business of the regular session of the New York Stock Exchange (normally 4:00 p.m., Eastern time). Portfolio securities traded on stock exchanges are valued at their last sales price as of the close of the regular session of trading on the day the securities are being valued. Securities quoted by NASDAQ are valued at the NASDAQ Official Closing Price. Securities for which market quotations are not readily available are valued at their fair value as determined in good faith in accordance with consistently applied procedures established by and under the general supervision of the Board of Trustees. Money market instruments are valued at amortized cost, which approximates market value.
In September 2006, the Financial Accounting Standards Board (FASB) issued Statement on Financial Accounting Standards (SFAS) No. 157, “Fair Value Measurements.” This standard establishes a single authoritative definition of fair value, sets out a framework for measuring fair value and requires additional disclosures about fair value measurements. SFAS No. 157 applies to fair value measurements already required or permitted by existing standards. SFAS No. 157 is effective for financial statements issued for fiscal years beginning after November 15, 2007 and interim periods within those fiscal years. The changes to current generally accepted accounting principles from the application of this Statement relate to the definition of fair value, the methods used to measure fair value, and the expanded disclosures about fair value measurements.
Various inputs are used in determining the value of the Fund’s investments. These inputs are summarized in the three broad levels listed below:
| | · | Level 1 – quoted prices in active markets for identical securities |
| | · | Level 2 – other significant observable inputs (including quoted prices for similar securities, interest rates, prepayment speeds, credit risk, etc.) |
| | · | Level 3 – significant unobservable inputs (including the Fund’s own assumptions in determining the fair value of investments) |
The inputs or methodology used for valuing securities are not necessarily an indication of the risk associated with investing in those securities.
The following is a summary of the inputs used to value the Fund’s net assets as of December 31, 2008:
| | | Level 1 – Quoted Prices | | Level 2 – Other Significant Observable Inputs | | Level 3 – Significant Unobservable Inputs |
| Investments in Securities | $ | 7,672,092 | $ | - | $ | - |
Share valuation – The net asset value per share of the Fund is calculated daily by dividing the total value of the Fund's assets, less liabilities, by the number of shares outstanding, rounded to the nearest cent. The offering and redemption price per share are equal to the net asset value per share.
Investment income and distributions to shareholders – Interest income is accrued as earned. Dividend income is recorded on the ex-dividend date. Dividends arising from net investment income are declared and paid annually. Net realized short-term capital gains, if any, may be distributed throughout the year and net realized long-term capital gains, if any, are distributed at least once each year. Income dividends and capital gain distributions are determined in accordance with income tax regulations. Differences between book and tax distributions are considered temporary or permanent in nature. To the extent these differences are permanent in nature, such amounts are reclassified within the composition of net assets based on their federal tax basis treatment; temporary differences do not require reclassifications.
Security transactions – Security transactions are accounted for on trade date. Securities sold are determined on a specific identification basis.
Estimates – The preparation of financial statements in conformity with U.S. generally accepted accounting principles requires management to make estimates and assumptions that affect the reported amounts of assets and liabilities and disclosure of contingent assets and liabilities at the date of the financial statements and the reported amounts of income and expenses during the reporting period. Actual results could differ from those estimates.
Federal income tax – It is the Fund's policy to continue to comply with the special provisions of the Internal Revenue Code applicable to regulated investment companies. As provided therein, in any fiscal year in which the Fund so qualifies and distributes at least 90% of its taxable net income, the Fund (but not the shareholders) will be relieved of federal income tax on the income distributed. Accordingly, no provision for income taxes has been made.
In order to avoid imposition of the excise tax applicable to regulated investment companies, it is also the Fund's intention to declare and pay as dividends in each calendar year at least 98% of its net investment income (earned during the calendar year) and 98% of its net realized capital gains (earned during the twelve months ended October 31) plus undistributed amounts from prior years.
The tax character of distributions paid for the years ended December 31, 2008 and 2007 was as follows:
| | | 2008 | | | 2007 | |
| From ordinary income | | $ | 6,463 | | | $ | 49,877 | |
The following information is computed on a tax basis as of December 31, 2008:
| Tax cost of portfolio investments | | $ | 9,236,575 | |
| Gross unrealized appreciation on investments | | $ | 525,448 | |
| Gross unrealized depreciation on investments | | | (2,089,931 | ) |
| Net unrealized depreciation on investments | | | (1,564,483 | ) |
| Post-October losses | | | (379,507 | ) |
| Capital loss carryforwards | | | (1,934,839 | ) |
| Total accumulated deficit | | $ | (3,878,829 | ) |
The capital loss carryforwards in the above table expire as follows:
| | | Amount | | December 31, | |
| | | $1,438,233 | | 2010 | |
| | | 367,121 | | 2011 | |
| | | 129,485 | | 2016 | |
| | | $1,934,839 | | | |
These capital loss carryforwards may be utilized in future years to offset gains, if any, prior to distributing such gains to shareholders.
On July 13, 2006, the Financial Accounting Standards Board (FASB) released FASB Interpretation No. 48 “Accounting for Uncertainty in Income Taxes” (FIN 48). FIN 48 provides guidance for how uncertain tax positions should be recognized, measured, presented and disclosed in the financial statements. FIN 48 requires the evaluation of tax positions taken or expected to be taken in the course of preparing the Fund’s tax returns to determine whether the tax positions are “more-likely-than-not” of being sustained by the applicable tax authority. Tax positions not deemed to meet the more-likely-than-not threshold would be recorded as a tax benefit or expense in the current year. Adoption of FIN 48 was required for fiscal years beginning after December 15, 2006 and was to be applied to all open tax years as of the effective date. The Fund has analyzed its tax positions taken on Federal income tax returns for all open tax years (tax years ended December 31, 2006 through 2008) for purposes of implementing FIN 48 and has concluded that no provision for income tax is required in the financial statements.
2. Investment Transactions
For the year ended December 31, 2008, the cost of purchases and proceeds from sales of portfolio securities, other than short-term investments, amounted to $5,172,442 and $3,834,448, respectively.
3. Transactions with Affiliates
Certain trustees and officers of the Trust are also officers of Appleton Partners, Inc. (the Adviser), JPMorgan Chase Bank, N.A. (JPMorgan) the administrative services agent, shareholder servicing and transfer agent, and accounting services agent for the Trust, and/or of IFS Fund Distributors, Inc. (the Distributor), the Trust’s principal underwriter.
Investment Advisory Agreement
Pursuant to an Investment Advisory Agreement between the Trust and the Adviser, the Adviser manages the Fund’s investments. For these services, the Fund pays the Adviser an advisory fee, which is computed and accrued daily and paid monthly, at an annual rate of 1.00% of its average daily net assets.
Pursuant to a written contract between the Adviser and the Fund, the Adviser has agreed to waive a portion of its advisory fees and/or assume certain expenses of the Fund, other than brokerage commissions, extraordinary items, interest and taxes, to the extent annual Fund operating expenses exceed 1.50% of the Fund’s average daily net assets. The Adviser has agreed to maintain these expense limitations with regard to the Fund through December 31, 2009. For the year ended December 31, 2008, the Adviser waived $105,945 of advisory fees and reimbursed $7,646 of other operating expenses.
Administration, Accounting And Transfer Agency Agreement
Under the terms of an Administration, Accounting and Transfer Agency Agreement between the Trust and JPMorgan, JPMorgan supplies non-investment related statistical and research data, internal regulatory compliance services and executive and administrative services for the Fund. JPMorgan supervises the preparation of tax returns, reports to shareholders of the Fund, reports to and filings with the Securities and Exchange Commission and state securities commissions, and materials for meetings of the Board of Trustees. For these administrative services, JPMorgan receives a monthly fee based on the Fund's average daily net assets, subject to a monthly minimum fee.
JPMorgan maintains the records of each shareholder's account, answers shareholders' inquiries concerning their accounts, processes purchases and redemptions of the Fund's shares, acts as dividend and distribution disbursing agent and performs other shareholder service functions. For these transfer agency and shareholder services, JPMorgan receives a monthly fee per shareholder account, subject to a monthly minimum fee. In addition, the Fund pays JPMorgan out-of-pocket expenses including, but not limited to, postage and supplies.
JPMorgan also calculates the daily net asset value per share and maintains the financial books and records of the Fund. For these accounting services, JPMorgan receives a monthly fee, based on average daily net assets, from the Fund. In addition, the Fund pays JPMorgan certain out-of-pocket expenses incurred by JPMorgan in obtaining valuations of the Fund's portfolio securities.
Distribution Plan
The Fund has adopted a plan of distribution (the Plan) pursuant to Rule 12b-1 under the 1940 Act. The Plan permits the Fund to pay for expenses incurred in the distribution and promotion of the Fund’s shares including but not limited to, the printing of prospectuses, statements of additional information and reports used for sales purposes, advertisements, expenses of preparation and printing of sales literature, promotion, marketing and sales expenses and other distribution-related expenses, including any distribution fees paid to securities dealers or other firms who have executed a distribution or service agreement with the Trust.
The Plan limits payment of distribution expenses in any fiscal year to a maximum of 0.25% of the Fund’s average daily net assets. For the year ended December 31, 2008, the Fund accrued and the Adviser subsequently reimbursed $18,406 of distribution expenses under the Plan.
Underwriting Agreement
The Trust has entered into an Underwriting Agreement on behalf of the Fund with the Distributor. Pursuant to the Underwriting Agreement, the Distributor acts as principal underwriter and, as such, is the exclusive agent for distribution of shares of the Fund. The Distributor receives no compensation for its services.
Compliance Services Agreement
Under the terms of the Compliance Services Agreement between the Trust and JPMorgan, JPMorgan provides certain compliance services to the Trust, including developing and assisting in implementing a compliance program for JPMorgan on behalf of the Fund and providing administrative support services to the Fund’s Compliance Program and Chief Compliance Officer.
In addition, the Trust has contracted with JPMorgan to provide certain compliance services on behalf of the Trust. Subject to the direction of the Trustees of the Trust, JPMorgan developed and assisted in implementing a compliance program for JPMorgan on behalf of the Fund and; provides administrative support services to the Fund’s Compliance Program and Chief Compliance Officer. For these services, JPMorgan receives a quarterly fee from the Trust.
4. Commitments and Contingencies
The Fund indemnifies the Trust’s officers and Trustees for certain liabilities that might arise from the performance of their duties to the Fund. Additionally, in the normal course of business, the Fund enters into contracts that contain a variety of representations and warranties and which provide general indemnifications. The Fund’s maximum exposure under these arrangements is unknown, as this would involve future claims that may be made against the Fund that have not yet occurred. However, based on experience, the Fund expects the risks of loss to be remote.
Report of Independent Registered Public Accounting Firm
To the Shareholders and Board of Trustees
of the Appleton Funds
We have audited the accompanying statement of assets and liabilities, including the portfolio of investments, of the Appleton Equity Growth Fund (the “Fund”) of the Appleton Funds, as of December 31, 2008, and the related statement of operations for the year then ended, the statements of changes in net assets for each of the two years in the period then ended, and the financial highlights for each of the five years in the period then ended. These financial statements and financial highlights are the responsibility of the Fund’s management. Our responsibility is to express an opinion on these financial statements and financial highlights based on our audit.
We conducted our audit in accordance with the standards of the Public Company Accounting Oversight Board (United States). Those standards require that we plan and perform the audit to obtain reasonable assurance about whether the financial statements are free of material misstatement. We were not engaged to perform an audit of the Fund’s internal control over financial reporting. Our audit included consideration of internal control over financial reporting as a basis for designing audit procedures that are appropriate in the circumstances, but not for the purpose of expressing an opinion on the effectiveness of the Fund’s internal control over financial reporting. Accordingly, we express no such opinion. An audit also includes examining, on a test basis, evidence supporting the amounts and disclosures in the financial statements, assessing the accounting principles used and significant estimates made by management, and evaluating the overall financial statement presentation. Our procedures included confirmation of securities owned as of December 31, 2008, by correspondence with the custodian. We believe that our audit provides a reasonable basis for our opinion.
In our opinion, the financial statements and financial highlights referred to above present fairly, in all material respects, the financial position of the Appleton Equity Growth Fund of the Appleton Funds at December 31, 2008, the results of its operations for the year then ended, the changes in its net assets for each of the two years in the period then ended, and its financial highlights for each of the five years in the period then ended, in conformity with U.S. generally accepted accounting principles.
/s/ Ernst and Young LLP
Cincinnati, Ohio
February 12, 2009
APPLETON EQUITY GROWTH FUND
OTHER ITEMS
December 31, 2008 (Unaudited)
DIVIDENDS RECEIVED DEDUCTION
For corporate shareholders, 100% of ordinary dividends paid during the year ended December 31, 2008 qualify for the corporate dividends received deduction.
PROXY VOTING POLICIES AND PROCEDURES
The Adviser is responsible for exercising the voting rights associated with the securities purchased and held by the Fund. A description of the policies and procedures the Adviser uses in fulfilling this responsibility and information regarding how those proxies were voted during the twelve month period ended June 30 are available without charge, upon request, by calling 1-617-338-0700. They are also available on the Securities and Exchange Commission's website at http://www.sec.gov.
QUARTERLY PORTFOLIO DISCLOSURE
The Trust files a complete listing of portfolio holdings for the Fund as of the end of the first and third quarters of each fiscal year on Form N-Q. The complete listing (i) is available on the Commission’s website; (ii) may be reviewed and copied at the Commission's Public Reference Room in Washington, DC; and (iii) will be made available to shareholders upon request by calling 1-800-543-0407. Information on the operation of the Public Reference Room may be obtained by calling 1-800-SEC-0330.
SCHEDULE OF SHAREHOLDER EXPENSES
As a shareholder of the Fund, you incur ongoing costs, including investment advisory fees; distribution (12b-1) fees; and other Fund expenses. This example is intended to help you understand your ongoing costs (in dollars) of investing in the Fund and to compare these costs with the ongoing costs of investing in other mutual funds.
The example is based on an investment of $1,000 invested at the beginning of the period and held for the entire period (July 1, 2008 through December 31, 2008).
Actual Expenses
The first line of the table below provides information about actual account values and actual expenses. You may use the information in this line, together with the amount you invested, to estimate the expenses that you paid over the period. Simply divide your account value by $1,000 (for example, an $8,600 account value divided by $1,000 = 8.6), then multiply the result by the number in the first line under the heading entitled "Expenses Paid During the Six Months Ended December 31, 2008" to estimate the expenses you paid on your account during this period.
Hypothetical Example for Comparison Purposes
The second line of the table below provides information about hypothetical account values and hypothetical expenses based on the Fund's actual expense ratio and an assumed rate of return of 5% per year before expenses, which is not the Fund's actual return. The hypothetical account values and expenses may not be used to estimate the actual ending account balance or expenses you paid for the period. You may use this information to compare the ongoing costs of investing in the Fund's and other funds. To do so, compare this 5% hypothetical example with the 5% hypothetical examples that appear in the shareholder reports of the other funds.
| | Net Expense Ratio Annualized December 31, 2008 | Beginning Account Value July 1, 2008 | Ending Account Value December 31, 2008 | Expenses Paid During the Six Months Ended December 31, 2008 * |
| | | | | |
| Actual | 1.50% | $ 1,000.00 | $ 670.50 | $ 6.30 |
| Hypothetical | 1.50% | $ 1,000.00 | $ 1,017.61 | $ 7.61 |
* Expenses are equal to the Fund's annualized expense ratio, multiplied by the average account value over the period, multiplied by [number of days in most recent fiscal half-year/366] (to reflect the one-half year period).
APPLETON EQUITY GROWTH FUND
ADVISORY AGREEMENT APPROVAL (unaudited)
December 31, 2008
The Board of Trustees of the Fund, including a majority of the Trustees who are not interested persons of the Trust (the “Independent Trustees”), reviewed and approved the Trust’s Investment Advisory Agreement with the Adviser at a meeting held on December 15, 2008.
The Adviser made a presentation to the Board with information requested by the Independent Trustees. Such information included (i) information confirming the financial condition of the Adviser and the Investment Adviser’s profitability derived from its relationship with the Fund; (ii) a description of the personnel and services provided by the Adviser; (iii) comparative information on fees and investment performance; and (iv) information regarding brokerage and portfolio transactions. Comparative fee and performance information was provided through an independent third party.
The Board reviewed and discussed financial information provided by the Adviser. The Board reviewed and considered the Adviser’s profitability derived from its relationship with the Fund and it was noted that the potential profitability was within ranges generally determined to be reasonable, given the services rendered and the Fund’s performance and services provided. The Board determined that the Adviser is solvent and sufficiently well capitalized to perform the ongoing responsibilities to the Fund and to satisfy its obligations under the Act and the advisory agreement.
The Board reviewed the advisory fee and the effective investment advisory fee rate paid by the Fund and the appropriateness of such advisory fee. The Board reviewed and considered any economies of scale which could be realized by the Fund and how the current advisory fee for the Fund reflects the economies of scale for the benefit of the shareholders of the Fund, noting that at this stage of the Fund in view of its relatively small size, no such economies of scale had been realized.
The Board also reviewed and considered the fees or other payments received by the Adviser. Specifically, the Board reviewed and considered comparison of fees charged by investment advisers to fund peers of the Fund, noting that the Adviser’s fees were generally in line with fund peers. The Board also considered and reviewed information regarding brokerage, observing that the Fund, in light of its size, generates relatively little in brokerage fees.
The Board reviewed and considered the qualifications of the portfolio management team to manage the portfolio of the Fund, including the members’ history managing equity investments generally and their experience with the types of securities included in the Fund’s portfolio, as well as the members’ backgrounds and expertise and the amount of time each would be able to devote to the affairs of the Fund. The Board concluded, in light of the particular requirements of the Fund and its investment program, that it was satisfied with the professional qualifications and overall commitment to the Fund of the portfolio management team.
The Board considered the nature, extent and quality of services rendered to the Fund by the Adviser and the investment performance of the Fund based on the data provided which included comparisons with the public markets as represented by indices and with peer funds. The Board determined that in light of the data taken as a whole and the nature of the investment program of the Fund, the investment performance was reasonable and acceptable. The Board concluded that the Fund’s fees paid to the Adviser were reasonable in light of comparative performance and advisory fee information, costs of the services provided and profits to be realized and benefits derived by the Adviser from its relationship with the Fund.
Based on this review, which included an executive session of the Trustees, it was the consensus of the Independent Trustees that the continuation of the Investment Advisory Agreement is in the best interest of the Fund and its shareholders.
APPLETON EQUITY GROWTH FUND
MANAGEMENT OF THE TRUST (UNAUDITED)
December 31, 2008
Listed in the charts below is basic information regarding the Trustees and officers of the Trust.
| | | | | | | | | |
| | | | | | | Number of | | Other |
| | | | | | | Portfolios in | | Directorships |
| | | | | | | Fund Complex | | Held by Trustee |
| | | Current Position with Trust | | Principal Occupation(s) | | Overseen by | | Outside the Fund |
| Name/Address/Age | | and Length of Time Served | | During Last 5 yrs | | Trustee | | Complex |
| | | | | | | | | |
| INTERESTED TRUSTEES*: | | | | | | | | |
| | | | | | | | | |
James I. Ladge, CFA45 Milk Street, 8th Floor | | President, Trustee(December 2000 - Present) | | Senior Vice President, Appleton Partners, Inc. | | 1 | | Director, CambridgeAppleton Trust N.A. |
| | Treasurer (December 2003 - Present) | | (1993 - Present) | | | | |
| | | | | | | | | |
| Douglas C. Chamberlain, CFA | | Trustee(December 2000 - Present) | | President and CEO, Appleton Partners, Inc.(1998 - Present) | | 1 | | Director, CambridgeAppleton Trust N.A. |
45 Milk Street, 8th FloorBoston, MA 02109 | | | | | | | | |
| | | | | | | | |
| | | | | | | | | |
| DISINTERESTED TRUSTEES: | | | | | | | | |
| | | | | | | | | |
| Jack W. Aber, PhD | | Trustee | | Professor, Boston University | | 1 | | Director, Manager |
| Boston University School of | | (December 2000 - Present) | | (1972- Present) | | | | Funds |
| Management | | | | | | | | Director, Third |
| 595 Commonwealth Avenue | | | | | | | | Avenue Funds |
| Boston, MA 02215 | | | | | | | | |
| Age: 71 | | | | | | | | |
| | | | | | | | | |
| John M. Cornish, Esq. | | Trustee | | Partner, Choate, Hall & Stewart | | 1 | | Director, Thompson |
| Choate Hall & Stewart | | (December 2000 - Present) | | (1985 - Present) | | | | Steel Company |
| 2 International Place | | | | | | | | |
| Boston, MA 02110 | | | | | | | | |
| Age: 61 | | | | | | | | |
| | | | | | | | | |
| Grady B. Hedgespeth | | Trustee | | President, ICA Group, a non-profit | | 1 | | Director, National |
| 11088 San Andrew Drive | | (December 2000 - Present) | | consulting firm | | | | Cooperative Bank |
| New Market, MD 21774 | | | | (2002- 2003); | | | | |
| Age: 53 | | | | Senior Vice President, CFO, Seedco | | | | |
| | | | | (2003- 2005) | | | | |
| | | | | Independent Consultant | | | | |
| | | | | (2005 - Present) | | | | |
| | | | | | | | | |
| OFFICERS: | | | | | | | | |
| | | | | | | | | |
Michele D. Hubley 45 Milk Street, 8th Floor | | Secretary and Chief Compliance Officer | | Vice President & Chief Compliance Officer of Appleton Partners, Inc. | | N/A | | N/A |
| Boston, MA 02109 | | (December 2004 - Present) | | | | | | |
| Age: 51 | | | | | | | | |
| | | | | | | | |
| | | | | | | | | |
| | | | | | | | | |
* All Interested Trustees are such because of their interest in the investment adviser, as defined in the Investment Company Act of 1940.
The Statement of Additional Information contains additional information about the Trustees and is available without charge upon request by calling
1-877-71-Apple.
Item 2. Code of Ethics.
As of the end of the period covered by this report, the registrant has adopted a code of ethics that applies to its principal executive officers and principal financial officers. During the period covered by this report, no amendments were made to the provisions of the code of ethics, nor did the registrant grant any waivers, including any implicit waivers, from the provisions of the code of ethics.
Item 3. Audit Committee Financial Expert.
The registrant’s Board of Trustees has determined that the registrant has at least one audit committee financial expert. Mr. Jack Aber is the registrant’s “audit committee financial expert” and is “independent” (as each term is defined in Item 3 of Form N-CSR).
Item 4. Principal Accountant Fees and Services.
(a) Audit Fees. Audit fees totaled $20,140 for the December 31, 2008 fiscal year and $19,000 for the December 31, 2007 fiscal year, including fees associated with the annual audit and filings of the registrant’s Form N-1A and Form N-SAR.
(b) Audit-Related Fees. There were no audit-related fees for the December 31, 2008 or December 31, 2007 fiscal years.
(c) Tax Fees. Tax fees totaled $2,900 for the December 31, 2008 fiscal year and $2,750 for the December 31, 2007 fiscal year and consisted of fees for tax compliance services during both years.
(d) All Other Fees. There were no other fees for the December 31, 2008 or December 31, 2007 fiscal years.
(e) (1) Audit Committee Pre-Approval Policies. The Audit Committee’s pre-approval policies describe the types of audit, audit-related, tax and other services that may receive the general pre-approval of the Audit Committee. The pre-approval policies provide that annual audit service fees, tax services not specifically granted pre-approval, services exceeding pre-approved cost levels and other services that have not received general pre-approval will be subject to specific pre-approval by the Audit Committee. The pre-approval policies further provide that the Committee may grant general pre-approval to other audit services (statutory audits and services associated with SEC registration statements, periodic reports and other documents filed with the SEC or other documents issued in connection with securities offerings), audit-related services (accounting consultations related to accounting, financial reporting or disclosure matters not classified as “audit services,” assistance with understanding and implementing new accounting and financial reporting guidance from rulemaking authorities, agreed-upon or expanded audit procedures related to accounting and/or billing records required to respond to or comply with financial, accounting or regulatory reporting matters and assistance with internal control reporting requirements under Form N-SAR and Form N-CSR), tax services that have historically been provided by the auditor that the Committee believes would not impair the independence of the auditor and are consistent with the SEC’s rules on auditor independence and permissible non-audit services classified as “all other services” that are routine and recurring services.
(e)(2) All services described in paragraphs (b) through (d) of Item 4 were approved by the Audit Committee.
(f) Not applicable
(g) The aggregate non-audit fees for services to the registrant, its investment adviser and any entity controlling, controlled by, or under common control with the adviser that provides ongoing services to the registrant were $2,900 for the fiscal year ended December 31, 2008 and $2,750 for the fiscal year ended December 31, 2007.
(h) Not applicable
Item 5. Audit Committee of Listed Companies.
Not applicable.
Item 6. Schedule of Investments.
The Schedule of Investments in securities of unaffiliated issuers is included as part of the report to shareholders filed under Item 1 of this Form.
Item 7. Disclosure of Proxy Voting Policies and Procedures for Closed-End Funds.
Not applicable.
Item 8. Portfolio Managers of Closed-End Funds.
Not Applicable.
Item 9. Purchases of Equity Securities by Closed-End Funds.
Not Applicable.
Item 10. Submission of Matters to a Vote of Security Holders.
Not Applicable.
Item 11. Controls and Procedures.
| (a) | The registrant’s principal executive and principal financial officers, or persons performing similar functions, have concluded that the registrant’s disclosure controls and procedures (as defined in Rule 30a-3(c) under the Investment Company Act of 1940, as amended (the “1940 Act”)) are effective as of a date within 90 days of the filing date of this report. |
| (b) | There were no significant changes in the registrant’s internal control over financial reporting that occurred during the registrant’s last fiscal half-year that have materially affected, or are reasonably likely to materially affect, the registrant’s internal control over financial reporting. |
Item 12. Exhibits.
| (a)(1) | Code of Ethics for Principal Executive and Financial Officers was filed on March 3, 2006 with Form N-CSR for period ending December 31, 2005 and is hereby incorporated by reference. |
| (a)(2) | Certifications required by Rule 30a-2(a) under the Act (17 CFR 270.30a-2) are filed herewith. |
| (b)(1) | Certifications required by Rule 30a-2(b) of the Investment Company Act of 1940 and Section 906 of the Sarbanes-Oxley Act of 2002 are filed herewith. |