Table of Contents
SECURITIES AND EXCHANGE COMMISSION
Washington, D.C. 20549
Form 6-K
Report of Foreign Private Issuer
Pursuant to Rules 13a-16 or 15d-16 under
the Securities Exchange Act of 1934
for the period ended March 31, 2008
Commission file Number: 1-15154
ALLIANZ SE
Königinstrasse 28
80802 Munich
Germany
(Address of principal executive offices)
Indicate by check mark whether the registrant files or will file annual reports under cover Form 20-F or Form 40-F.
Form 20-F x Form 40-F ¨
Indicate by check mark whether the registrant by furnishing the information contained in this Form is also thereby furnishing the information to the Commission pursuant to Rule 12g3-2(b) under the Securities Exchange Act of 1934.
Yes ¨ No x
THIS REPORT ON FORM 6-K (EXCEPT FOR ANY NON-GAAP FINANCIAL MEASURE AS SUCH TERM IS DEFINED IN REGULATION G UNDER THE SECURITIES EXCHANGE ACT OF 1934, AS AMENDED) SHALL BE DEEMED TO BE INCORPORATED BY REFERENCE IN THE REGISTRATION STATEMENTS ON FORM S-8 (FILE NO. 333-13462 AND NO. 333-139900) OF ALLIANZ SE AND TO BE A PART THEREOF FROM THE DATE ON WHICH THIS REPORT IS FURNISHED, TO THE EXTENT NOT SUPERSEDED BY DOCUMENTS OR REPORTS SUBSEQUENTLY FILED OR FURNISHED. FOR THE AVOIDANCE OF DOUBT, THE DISCLOSURE CONTAINING ANY NON-GAAP FINANCIAL MEASURE CONTAINED IN THE ATTACHED REPORT IS NOT INCORPORATED BY REFERENCE INTO THE ABOVE-MENTIONED REGISTRATION STATEMENTS FILED BY ALLIANZ SE.
Table of Contents
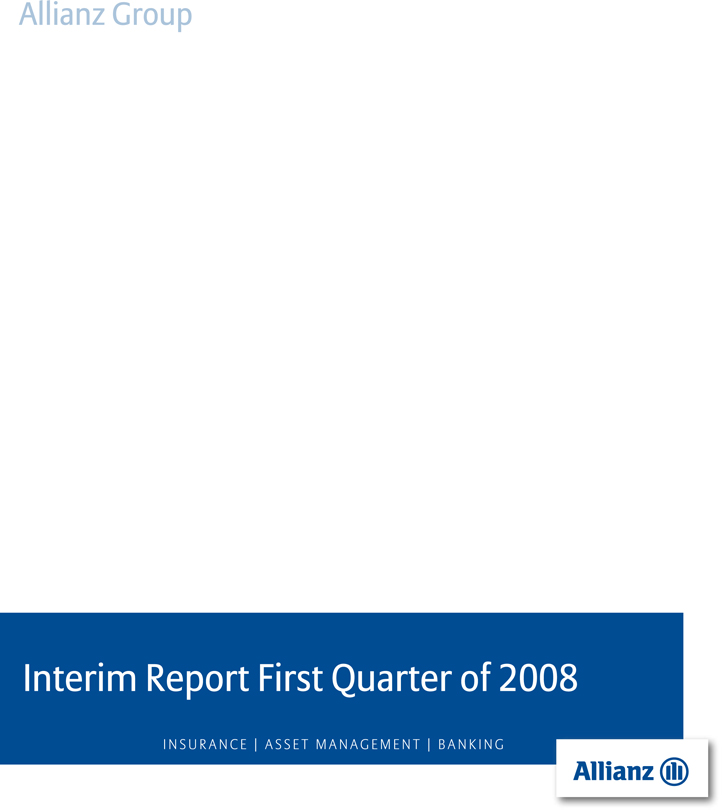
Table of Contents
| Group Management Report | ||||
| Executive Summary and Outlook | 2 | |||
| Property-Casualty Insurance Operations | 11 | |||
| Life/Health Insurance Operations | 16 | |||
| Banking Operations | 20 | |||
| Asset Management Operations | 24 | |||
| Corporate Activities | 28 | |||
| Balance Sheet Review | 29 | |||
| Other Information | 33 | |||
| Condensed Consolidated Financial Statements for the First Quarter of 2008 | ||||
| Detailed Index | 35 | |||
| Condensed Consolidated Interim Financial Statements | 35 | |||
| Notes to the Condensed Consolidated Interim Financial Statements | 41 | |||
Allianz Share
Development of the Allianz share price since 2007
indexed on the Allianz share price in€
Source: Thomson Financial Datastream
Current Information on the development of the Allianz share price is available on the Internet atwww.allianz.com/share.
Basic Allianz share information
| Share type | Registered share with restricted transfer | |||
| Denomination | No-par-value share | |||
| Stock exchanges | All German stock exchanges, London, Paris, Zurich, Milan, New York | |||
| Security Codes | WKN 840 400 ISIN DE 000 840 400 5 | |||
| Bloomberg | ALV GY | |||
| Reuters | ALVG.DE |
Investor Relations
We endeavor to keep our shareholders up-to-date on all company developments. Our Investor Relations Team is pleased to answer any questions you may have.
Allianz SE
Investor Relations
Koeniginstrasse 28
80802 Muenchen
Germany
Fax: + 49 89 3800 3899
E-Mail: investor.relations@allianz.com
Internet:www.allianz.com/investor-relations
For telephone enquiries, our “Allianz Investor Line” is available:
+ 49 1802 2554269
+ 49 1802 ALLIANZ
Table of Contents
Allianz Group Key Data
| Three months ended March 31, | 2008 | 2007 | Change from previous year | |||||||||||
| INCOME STATEMENT | ||||||||||||||
| Total revenues1) | € mn | 27,653 | 29,323 | (5.7)% | ||||||||||
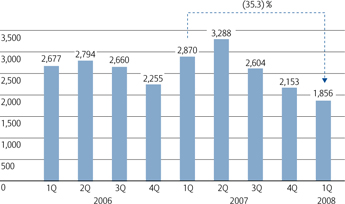
| Operating profit2) | € mn | 1,856 | 2,870 | (35.3)% | ||||||||||
| Net income | € mn | 1,148 | 3,240 | (64.6)% | ||||||||||
| SEGMENTS | ||||||||||||||
| Property-Casualty | ||||||||||||||
| Gross premiums written | € mn | 13,710 | 14,111 | (2.8)% | ||||||||||
| Operating profit2) | € mn | 1,479 | 1,267 | 16.7% | ||||||||||
| Net income | € mn | 1,057 | 1,180 | (10.4)% | ||||||||||
| Combined ratio | % | 94.8 | 96.8 | (2.0) pts | ||||||||||
| Life/Health | ||||||||||||||
| Statutory premiums | € mn | 12,327 | 12,326 | 0.0% | ||||||||||
| Operating profit2) | € mn | 589 | 750 | (21.5)% | ||||||||||
| Net income | € mn | 452 | 553 | (18.3)% | ||||||||||
| Statutory expense ratio | % | 9.1 | 7.2 | 1.9 pts | ||||||||||
| Banking | ||||||||||||||
| Operating revenues | € mn | 778 | 2,101 | (63.0)% | ||||||||||
| Operating profit2) | € mn | (456) | 700 | n.m. | ||||||||||
| Net income | € mn | (538) | 625 | n.m. | ||||||||||
| Cost-income ratio | % | 157.1 | 66.9 | 90.2 pts | ||||||||||
| Asset Management | ||||||||||||||
| Operating revenues | € mn | 727 | 780 | (6.8)% | ||||||||||
| Operating profit2) | € mn | 241 | 312 | (22.8)% | ||||||||||
| Net income | € mn | 78 | 99 | (21.2)% | ||||||||||
| Cost-income ratio | % | 66.9 | 60.0 | 6.9 pts | ||||||||||
| BALANCE SHEET | ||||||||||||||
| Total assets as of March 31, | € mn | 1,126,766 | 1,061,1494) | 6.2% | ||||||||||
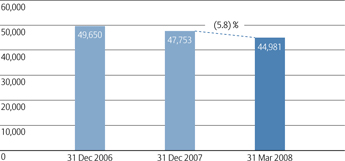
| Shareholders’ equity as of March 31, | € mn | 44,981 | 47,7534) | (5.8)% | ||||||||||
| Minority interests as of March 31, | € mn | 3,507 | 3,6284) | (3.3)% | ||||||||||
| SHARE INFORMATION | ||||||||||||||
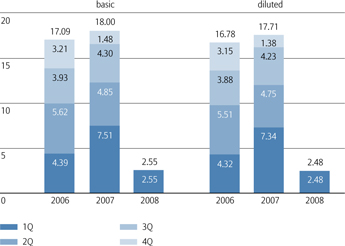
| Basic earnings per share | € | 2.55 | 7.51 | (66.0)% | ||||||||||
| Diluted earnings per share | € | 2.48 | 7.34 | (66.2)% | ||||||||||
| Share price as of March 31, | € | 125.48 | 147.954) | (15.2)% | ||||||||||
| Market capitalization as of March 31, | € bn | 56.8 | 66.64) | (14.7)% | ||||||||||
| OTHER DATA | ||||||||||||||
| Return on equity after income tax3) | % | 2.5 | 16.44) | (13.9) pts | ||||||||||
| Third-party assets under management as of March 31, | € bn | 736 | 765 | (3.8)% |
1) | Total revenues comprise Property-Casualty segment’s gross premiums written, Life/Health segment’s statutory premiums, Banking segment’s operating revenues and Asset Management segment’s operating revenues. |
2) | The Allianz Group uses operating profit to evaluate the performance of its business segments and the Group as a whole. |
3) | Based on average shareholders’ equity. Average shareholders’ equity has been calculated based upon the average of the current and the preceding shareholders’ equity. |
4) | As of December 31, 2007. |
1
Table of Contents
Executive Summary and Outlook1)
– Robust operating profit of€ 1.9 billion in difficult markets.
– Property-Casualty operating profit improvement of 16.7 % to€ 1.5 billion.
– Life/Health results affected by lower realized gains, impairments and accounting volatility.
–€ 845 million further ABS markdowns resulted in Banking operating loss of€ 456 million.
– Weak equity markets impact results in Asset Management.
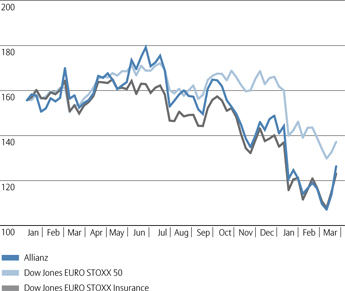
Total revenues
in€ bn
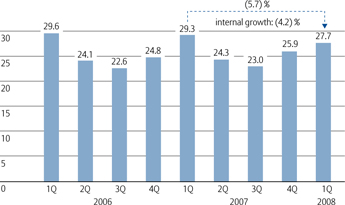
Net income
in€ mn
Operating profit
in€ mn
Shareholders’ equity2)
in€ mn
1) | The Allianz Group operates and manages its activities primarily through four operating segments: Property-Casualty, Life/Health, Banking and Asset Management. Effective January 1, 2006, in addition to our four operating segments and with retrospective application, we introduced a fifth business segment named Corporate. |
2) | Does not include minority interests. |
2
Table of Contents
Allianz Group Interim Report First Quarter of 2008 Group Management Report
Allianz Group’s Consolidated Results of Operations
In the first quarter 2008 (1Q 2008), we recorded operating profit of € 1,856 million and net income of € 1,148 million. These results were considerably lower than in the prior year period.
Without any doubt 1Q 2008 was a very difficult quarter with the credit crisis continuing, a further decline in the US house and securitized mortgage prices and weak equity markets around the globe. These economic developments had an impact on our results as well: We recorded further markdowns on other exposed asset-backed securities (ABS) of € 845 million following the further deterioration of observable marks.
In 1Q 2007 we took advantage of very favorable market conditions and realized € 2,045 million of capital gains. Due to the poor market conditions in 1Q 2008 we deliberately realized only enough gains to compensate for impairments. Overall, realized gains net of impairments were € 1,791 million lower than in the prior year period.
Furthermore, we saw some spill-over effects from the credit crisis in other operations, such as lower fee and commission income in the Banking segment or lower revenues from our third party equity business. However, the vast majority of our operations proved to be very resilient against the market turbulences.
Total revenues1)
Total revenues – Segments
in€ mn
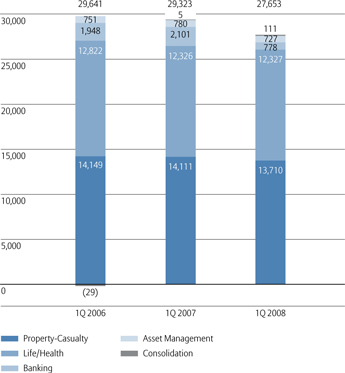
Total revenues decreased by 5.7 % to € 27,653 million. Key drivers behind this development were the impact of the credit crisis on our banking activities which resulted in the above mentioned additional markdowns leading to a net dealing loss of € 562 million. Furthermore, in Italy we experienced a decline in sales of € 1,202 million in our bancassurrance channels. In addition, foreign currency translation effects reduced revenues by € 606 million. On an internal basis 2), growth amounted to (4.2) %.
Property-Casualty
At € 13,710 million, gross premiums written were 2.8 % lower than in the previous year. On an internal basis premiums declined by 0.6 %. Positive impacts resulted from the acquisitions in Russia and Kazakhstan while negative currency translation effects offset this increase to a large extent. There
1) | Total revenues comprise Property-Casualty segment’s gross premiums written, Life/Health segment’s statutory premiums Banking segment’s operating revenues and Asset Management segment’s operating revenues. |
2) | Internal total revenue growth excludes the effects of foreign currency translation as well as acquisitions and disposals. Please refer to page 34 for a reconciliation of nominal total revenue growth to internal total revenue growth for each of our segments and the Allianz Group as a whole. |
3
Table of Contents
Group Management Report Allianz Group Interim Report First Quarter of 2008
was a reclassification of AGF’s health business which was until now shown in the Property-Casualty segment to the Life/Health segment. This reduced Property-Casualty premiums by €304 million.
We maintained our strategy of selective underwriting, and the expansion into emerging markets is continuing to pay off. Whereas we recorded flat or negative revenue movements in our more mature markets, where we accepted only those risks which we believe will yield adequate returns, premiums in our emerging markets 1)grew strongly by €208 million.
Life/Health
With €12,327 million, statutory premiums were at the same level as the prior year. Currency translation effects had a negative impact on revenues of €321 million. On an internal basis, including the reclassification of the above mentioned health business, revenues grew slightly by 0.2 %.
We achieved strong growth in most of our life insurance markets. In Italy we recorded declining sales in our bancassurrance channels which mainly handle unit-linked products. The difficult situation in the United States persisted in the first quarter.
Banking
Revenues in our Banking segment showed a significant decline of 63.0 % to €778 million as a result of further markdowns of €845 million on the ABS trading portfolio. Driven by these markdowns, we recorded a net dealing loss of €562 million coming from a net dealing income of €341 million. Net interest income declined by €232 million because the prior year period contained a one-off capital gain of €171 million stemming from the disposal of subsidiaries at an associated company. In addition, our fee and commission income declined by €188 million due to the aforementioned market turbulences.
1) | New Europe, Asia-Pacific, South America, Mexico, Middle East and Northern Africa. |
Asset Management
Third party assets under management declined from €765 billion at year end 2007 to €736 billion in 1Q 2008 despite net inflows of €26 billion. Main reasons for this development were negative currency translation effects of €39 billion and negative market related effects of € 8 billion.
Operating revenues were down 6.8 % to €727 million compared to the prior year period including some negative one-off effects from seed money investments and support measures for money market funds. On an internal basis revenues grew by 0.5 %.
Operating profit
Operating profit – Segments
in€ mn
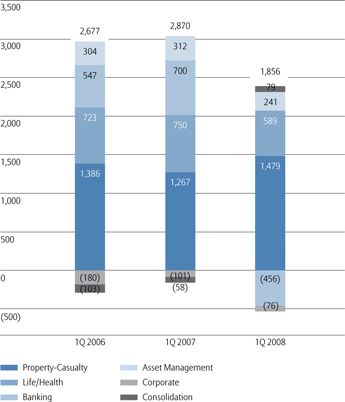
At € 1,856 million, operating profit was down € 1,014 million, of which ABS markdowns comprise € 845 million. However, the operating profit development remained mixed across the other segments. Whereas we recorded a very strong quarter in Property-Casualty, poor equity market
4
Table of Contents
Allianz Group Interim Report First Quarter of 2008 Group Management Report
conditions resulted in a significant reduction in operating profit from Life/Health. Asset management operations were also impacted by the financial markets crisis – though to a lesser extent – resulting in lower fee and commission income and one-off effects.
Furthermore, our continued focus on group initiatives and restructuring in order to improve efficiency and effectiveness, and drive down our costs are paying off. Administrative expenses were reduced by 11.2 %, with all segments contributing to the development.
Property-Casualty
We saw another quarter of strong operating profitability: at € 1,479 million, operating profit was up 16.7 % on the previous year’s level. Our strict policy of selective underwriting and pricing discipline contributed to this development. Claims from natural catastrophes were € 90 million lower than in the previous period, however there was an increase in the number of large claims. We achieved a very competitive combined ratio of 94.8 %.
Life/Health
Operating profit declined by 21.5 % to € 589 million. Key drivers behind this development were higher impairments on our equity portfolio due to the market environment, lower realized gains and the widening of credit spreads. In contrast to the prior year, where we recorded realized gains of € 1,088 million due to the favorable market conditions, we postponed any large scale realizations due to the poor market conditions in 1Q 2008. Therefore, realized gains before policyholder participation declined by 40.3 % to € 649 million.
Banking
Our Banking segment recorded an operating loss of € 456 million, € 1,156 million lower than the result in the comparison period. Mainly, this development was a result of the € 845 million ABS markdowns. Last year’s operating profit of € 700 million was positively affected by a one-off capital gain of € 171 million stemming from the disposal of an associated company. We managed to further reduce our operating expenses, by 13.1 %, to € 1,222 million. With net
additions of € 12 million (1Q 2007: net releases of € 5 million) loan loss provisions were still at a moderate level, reflecting the high quality of the loan book.
Asset Management
The segment’s operating profit was 22.8 % lower, at € 241 million in 1Q 2008 stemming mainly from lower operating revenues. Expenses increased, reflecting the run-rate effects from our business expansion and the extension of our distribution network. We expect this to yield higher revenues in future. Taking into consideration strong net inflows, stable margins and the temporary nature of one-off effects, we see our Asset Management business well positioned when markets return to normal. Our cost-income ratio has increased by 6.9 percentage points to 66.9 %.
Corporate Segment
In our Corporate Segment the overall operating loss reduced from € 101 million in the prior year period to € 76 million in 1Q 2008. Higher interest and higher fee and commission income contributed most to this development.
Non-operating result
Income from non-operating items at € 46 million decreased by € 1,640 million due primarily to significantly higher impairments on investments of € 424 million and lower realized gains of € 678 million. In the prior year period, we recorded net realized gains and impairments of investments of € 2,045 million, stemming particularly from the sales of equity investments in a very favorable market environment. In contrast, in this period, we refrained from any large scale realizations due to the poor market conditions realizing gains net of impairments of € 254 million.
Net income
Net income decreased to € 1,148 million. Lower income tax expenses following the tax reform in Germany and lower minorities in earnings due to the completion of the minority buy-out at AGF in France contributed positively to the net income development. Due to the non-recognition of tax-losses on ABS markdowns the effective tax rate increased by 14.2 percentage points to 35.4 %.
5
Table of Contents
Group Management Report Allianz Group Interim Report First Quarter of 2008
Earnings per share1)
in€
1) | See note 37 to our condensed consolidated interim financial statements for further details. |
Segment Information – Total Revenues and Operating Profit
| Three months ended March 31, | Property- Casualty | Life/Health | Banking | Asset Management | Corporate | Consolidation | Group | |||||||||||||||||||||
| € mn | € mn | € mn | € mn | € mn | € mn | € mn | ||||||||||||||||||||||
| 2008 | ||||||||||||||||||||||||||||
| Total revenues1) | 13,710 | 12,327 | 778 | 727 | — | 111 | 27,653 | |||||||||||||||||||||
| Operating profit (loss) | 1,479 | 589 | (456) | 241 | (76) | 79 | 1,856 | |||||||||||||||||||||
| Non-operating items | 95 | 18 | 48 | (115) | (102) | 102 | 46 | |||||||||||||||||||||
| Income (loss) before income taxes and minority interests in earnings | 1,574 | 607 | (408) | 126 | (178) | 181 | 1,902 | |||||||||||||||||||||
| Income taxes | (478) | (136) | (116) | (46) | 86 | 16 | (674) | |||||||||||||||||||||
| Minority interests in earnings | (39) | (19) | (14) | (2) | (7) | 1 | (80) | |||||||||||||||||||||
| Net income (loss) | 1,057 | 452 | (538) | 78 | (99) | 198 | 1,148 | |||||||||||||||||||||
| 2007 | ||||||||||||||||||||||||||||
| Total revenues1) | 14,111 | 12,326 | 2,101 | 780 | — | 5 | 29,323 | |||||||||||||||||||||
| Operating profit (loss) | 1,267 | 750 | 700 | 312 | (101) | (58) | 2,870 | |||||||||||||||||||||
| Non-operating items | 664 | 103 | 117 | (122) | 511 | 413 | 1,686 | |||||||||||||||||||||
| Income (loss) before income taxes and minority interests in earnings | 1,931 | 853 | 817 | 190 | 410 | 355 | 4,556 | |||||||||||||||||||||
| Income taxes | (537) | (201) | (168) | (80) | (25) | 44 | (967) | |||||||||||||||||||||
| Minority interests in earnings | (214) | (99) | (24) | (11) | (4) | 3 | (349) | |||||||||||||||||||||
| Net income (loss) | 1,180 | 553 | 625 | 99 | 381 | 402 | 3,240 |
1) | Total revenues comprise Property-Casualty segment’s gross premiums written, Life/Health segment’s statutory premiums, Banking segment’s operating revenues and Asset Management segment’s operating revenues. |
6
Table of Contents
Allianz Group Interim Report First Quarter of 2008 Group Management Report
Impact of the financial markets turbulence
The crisis in the mortgage market in the United States led to a devaluation of prices for various asset-backed securities (“ABS”), even for those with a high rating. Primarily, this affected collateralized debt obligations (“CDO”), and residential mortgage-backed securities especially those originating in the United States (“U.S. RMBS”).
The turbulence in the financial markets also impacted our business development, however the impact varied in each business segment.
The major impact of this crisis occurs in the Banking segment, with the substantial portion being attributable to some business units of Dresdner Bank’s investment banking activities. In contrast, impacts on our insurance operations have been negligible. The investment activities of the insurance segments were only impacted to a very limited extent, reflecting the high quality of the asset bases with no material CDO and subprime exposure. Similarly, the impact on our Asset Management segment was marginal.
Impact on insurance operations
Of our Property-Casualty asset base, ABS made up € 4.8 billion, as of March 31, 2008, which is around 5 %. CDOs accounted for € 0.2 billion of this amount, of which € 1 million are subprime-related. Unrealized losses on CDOs of € 2 million were recorded in our equity.
Within our Life/Health asset base, ABS amounted to € 13.3 billion, as of March 31, 2008, less than 4 % of total average Life/Health assets. Of these, € 0.2 billion are CDOs of which none are subprime-related. Unrealized losses on CDOs of € 7 million were recorded in our equity.
Impact on investment banking activities of Dresdner Bank
Dresdner Bank is engaged in various business activities involving structured products. These comprise asset-backed securities of the trading book, credit enhancements, conduits, leveraged buy-out commitments and structured investment vehicles. Furthermore, Dresdner Bank has sold credit protection for third party ABS and has re-insured these positions with monoline insurers (“monoliners”).
Asset-backed securities of the trading book
The underlying of asset-backed securities is a pool of assets.
As of March 31, 2008, Dresdner Bank carried ABS trading assets of € 10.1 billion. The majority of these ABS are of a high quality, with 81 % of them rated A or better.
Breakdown of exposure by rating class
in %
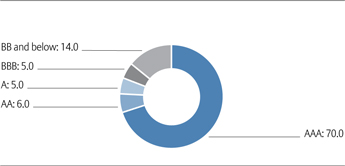
After write-downs, the net exposure amounts to € 8.1 billion as of March 31, 2008. It contains € 1.0 billion CDOs, € 0.9 billion U.S. RMBS and € 6.2 billion other ABS. Because the financial markets turbulence mainly affected CDOs and U.S. RMBS, these net exposures are classified as “critical ABS”. We took substantial write-downs on CDOs and U.S. RMBS, recognizing the different quality and characteristics of the assets.
7
Table of Contents
Group Management Report Allianz Group Interim Report First Quarter of 2008
| Exposure type | Exposure as of | Total write- downs 2007/2008 | in % of exposure | Remaining book value as of 31/03/2008 | ||||||||||||
| € mn | € mn | € mn | ||||||||||||||
| U.S. RMBS | ||||||||||||||||
| Prime | 662 | 182 | 27% | 480 | ||||||||||||
| Midprime | 315 | 169 | 54% | 146 | ||||||||||||
| Subprime | 573 | 322 | 56% | 251 | ||||||||||||
| Total U.S. RMBS | 1,550 | 673 | 43% | 877 | ||||||||||||
| CDO | ||||||||||||||||
| High grade | 1,503 | 542 | 36% | 961 | ||||||||||||
| Mezzanine | 620 | 620 | 100% | — | ||||||||||||
| Total CDO | 2,123 | 1,162 | 55% | 961 |
Credit enhancements
Credit enhancements are one or more initiatives taken by the originator in a securitization structure to enhance the security, credit or the rating of the securitized instrument. In this context, Dresdner Bank offered second loss protection for credit investment related conduits (“CIRC”). This structure primarily contains ABS.
Under the CIRC structures, Dresdner Bank provides second loss protection, whereas the first loss stays with the client. Additionally, the Bank is entitled to sell the portfolio to the market, if the value of this portfolio falls below a pre-defined threshold. Here as well, the exposure was reduced and as of March 31, 2008, was a notional amount of € 2.1 billion.
Conduits
A conduit is a special purpose entity that securitizes its financial assets, e.g. receivables, by means of commercial papers.
Since the late nineties, Dresdner Bank arranges the securitization of third party and own asset portfolios through asset-backed commercial paper programmes (“ABCP”) via several conduits. The underlying pool of assets exhibits a good quality, with 80 % having at least an A rating. Dresdner Bank has provided liquidity back-up lines of € 11.8 billion of which € 7.3 billion were undrawn, as of March 31, 2008.
Leveraged buy-out
A leveraged buy-out is a financing transaction involving a significant amount of debt.
Dresdner Bank provides credit lines for these transactions, the bulk of which are typically syndicated. In the first quarter of 2008, Dresdner Bank has reduced its LBO exposure to € 4.0 billion containing drawn and undrawn amounts.
Monoliner
Dresdner Bank has entered into business relations with monoliners – companies that guarantee the repayment of a security and the corresponding interest in the event that the issuer defaults – in order to hedge the exposure from credit protection sold for third party ABS.
Dresdner Bank has provided credit protection via Credit Default Swaps (“CDS”) for ABS exposures. According to our risk policies, these CDS positions are re-insured with monoliners: only in case of a default of payment from the underlying assets and a breach of contractual duties of the monoliners, will an ultimate loss occur. This loss amounts to the difference between the guaranteed amount from the monoliner and the value of the underlying assets. Dresdner Bank bought credit protection for counterparty risks from monoliners of a notional € 0.4 billion, reducing the net counter-party risk to € 1.3 billion as of March 31, 2008.
Structured Investment Vehicles (“SIV”)
A structured investment vehicle is an entity that primarily invests in long-term, high quality securities. The investments are refinanced by medium term notes (“MTN”) or commercial papers (“CP”).
8
Table of Contents
Allianz Group Interim Report First Quarter of 2008 Group Management Report
On March 18, 2008, Dresdner Bank and K2 Corporation entered into an agreement through which Dresdner Bank will provide a support facility to the Structured Investment Vehicle, K2. The agreement consists of a U.S.$ 1.5 billion committed revolving mezzanine credit facility and a ‘backstop’ facility.
The mezzanine credit facility provides K2 with immediate additional liquidity, allowing K2 to draw-down funds for terms up to the maturity date of its longest dated senior debt obligations. Under the terms of the backstop facility, Dresdner Bank has undertaken to provide to K2 firm prices at which it will purchase assets from K2 in the event that K2 is unable to obtain better prices for such assets on the open market. The aggregate of such prices provided by Dresdner Bank will at all times equate to an amount that ensures K2 has sufficient funds to repay its senior debt in full. Both facilities may be utilized in certain credit-related events.
Risk Management
Risk management is an integral part of our business processes and supports our value-based management. As our internal risk capital model provides management with information which allows for active asset-liability management and monitoring, risk is well controlled and there are no identified risks which could in the future pose a threat to the existence of the Allianz Group.
The impacts from the subprime-crisis are described in the paragraph “Impacts from the financial markets turbulence”.
The information contained in the risk report in our 2007 Annual Report is still valid.
Events After the Balance Sheet Date
See “Outlook” below and Note 41 to the consolidated financial statements.
Opportunities
As presented in our 2007 Annual Report, we remain confident that the business prospects for financial service providers remain positive.
Outlook
Our outlook remains unchanged.
We believe that the targets covered by our mid-term outlook through 2009 are still achievable. Although we are seeing some recovery of US residential mortgage prices as well as of equities markets, it is hard to predict when the financial crisis will end. In this environment, 2008 will be difficult and the longer it takes, the harder it will be to achieve our three-year outlook. But, we remain optimistic medium term as the fundamentals of our business are in good shape, and we are well positioned for the upturn when it happens.
Through 2009, we are striving for an average annual consolidated operating profit growth of 10 % from the 2006 level, adjusted for the particularly favorable natural catastrophe trend in 2006. This is subject to a normal level of operating profit contribution from Dresdner Bank.
Within the same period, we are aiming at a combined ratio of less than 94 % on average in our Property-Casualty segment, an average new business margin1)greater than 3 % in the Life/Health segment and average annual growth of
1) | New business margin according to the definition of European Embedded Value. |
9
Table of Contents
Group Management Report Allianz Group Interim Report First Quarter of 2008
third-party assets under management of 10%, excluding foreign currency conversion effects for our Asset Management segment.
We are not in a position to confirm the 15% average return on risk adjusted capital (“RoRAC”) target for the period 2007 – 2009 for our Banking segment. We do not expect that the years 2008 and 2009 will make up for the shortfall in 2007. Due to the uncertainty of future development of the credit markets and the high volatility of market prices, both triggered by the current financial markets turbulence, the projection of earnings is only possible within a non-meaningful broad range. In addition, a negative impact from additional mark-downs on our trading portfolio particularly in U.S. RMBS and CDOs may affect future quarterly results. However, we expect that the prices will bottom out during 2008. We do not feel comfortable to predict the timing more precisely. However, we stick with our ambition to show annual RoRACs of 15% or above for our Banking segment in the future.
As always, natural catastrophes and adverse developments in the capital markets, as well as the factors stated in our cautionary note regarding forward-looking statements, may severely impact our results of operations.
Cautionary Note Regarding Forward-Looking Statements
The statements contained herein may include statements of future expectations and other forward-looking statements that are based on management’s current views and assumptions and involve known and unknown risks and uncertainties that could cause actual results, performance or events to differ materially from those expressed or implied in such statements. In addition to statements which are forward-looking by reason of context, the words “may”, “will”, “should”, “expects”, “plans”, “intends”, “anticipates”, “believes”, “estimates”, “predicts”, “potential”, or “continue” and similar expressions identify forward-looking statements. Actual results, performance or events may differ materially from those in such statements due to, without limitation, (i) general economic conditions, including in particular economic conditions in the Allianz Group’s core business and core markets, (ii) performance of financial markets, including emerging markets, (iii) the frequency and severity of insured loss events, (iv) mortality and morbidity levels and trends, (v) persistency levels, (vi) the extent of credit defaults, (vii) interest rate levels, (viii) currency exchange rates including the Euro/U.S. Dollar exchange rate, (ix) changing levels of competition, (x) changes in laws and regulations, including monetary convergence and the European Monetary Union, (xi) changes in the policies of central banks and/or foreign governments, (xii) the impact of acquisitions, including related integration issues, (xiii) reorganization measures, and (xiv) general competitive factors, in each case on a local, regional, national and/or global basis. Many of these factors may be more likely to occur, or more pronounced, as a result of terrorist activities and their consequences. The matters discussed herein may also be affected by risks and uncertainties described from time to time in Allianz SE’s filings with the U.S. Securities and Exchange Commission. The company assumes no obligation to update any forward-looking statement.
10
Table of Contents
Property-Casualty Insurance Operations
– Another strong performance with operating profit growth of 16.7%.
– Combined ratio of 94.8%.
– Emerging markets make up 9% of total revenues.
Earnings Summary
Gross premiums written
Profitability remained our key focus as price declines prevaled in some core markets. We selectively wrote only those risks which we believe will generate adequate returns and intentionally forewent premium growth where prices were too low. As a result of this underwriting discipline, gross premiums written of € 13,710 million were 2.8% lower than in the previous year. Positive impacts on revenue growth resulted from last year’s acquisitions in Russia and Kazakhstan. The reclassification of AGF’s health business to the Life/Health segment and negative currency translation effects largely offset this growth. Adjusting prior year’s premiums for the health business transferred, revenues were down by 0.8%. On an internal basis premiums declined by 0.6%.
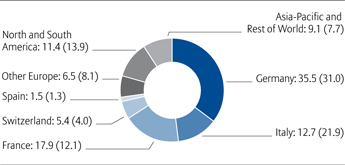
Gross premiums written by region1)
in%
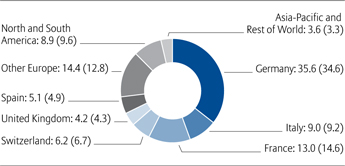
1) | After elimination of transactions between Allianz Group companies in different geographic regions and different segments. Gross premiums written from our specialty lines have been allocated to the respective geographic regions. |
The development of gross premiums written varied considerably across our various markets. In our more mature markets we recorded flat or even negative revenue trends,
whereas in our emerging markets1) premiums grew strongly by € 208 million. This demonstrates that our strategy of expansion into emerging markets continues to pay off. Together, the emerging markets contributed € 1,266 million (1Q 2007: € 1,058 million) or 9.2% (1Q 2007: 7.5%) to total gross premiums written.
With € 182 million, New Europe contributed the highest absolute amount to revenue growth. The main drivers for this development were the full consolidation of ROSNO and Progress Garant in Russia and ATF-Polis in Kazakhstan. Motor insurance business in Poland also added to the increase in gross premiums.
At Allianz Sach in Germany, revenues declined by € 58 million due to a weak market environment in motor insurance.
In France, revenues decreased by € 301 million mainly through the transfer of a health insurance entity that was previously recorded in the property-casualty segment to the life/health segment. Adjusted for this effect, the decline in France amounted to only € 21 million.
In the United States at Fireman’s Fund Insurance Company (“Fireman’s Fund”) premiums were stable on a U.S. Dollar basis. However, with the further weakening of the U.S. Dollar compared to the Euro a decrease in revenues of € 110 million was recorded at the group level.
Our Italian operations also showed a decline in gross premiums written of € 73 million. This was due to price and volume changes, mainly in the motor business. Further more, premiums were impacted from a new regulation, the so-called Bersani law, which resulted in an overall price reduction.
1) | New Europe, Asia-Pacific, South America, Mexico, Middle East and Northern Africa. |
11
Table of Contents
Group Management Report Allianz Group Interim Report First Quarter of 2008
At Allianz Global Corporate & Specialty (“AGCS”) revenues were down by € 71 million as we experienced lower rates and maintained our selective underwriting policy. Furthermore, the currency depreciation of the U.S. Dollar and the GBP compared to the Euro contributed to the decline.
Gross premiums written – Internal growth rates1)
in%
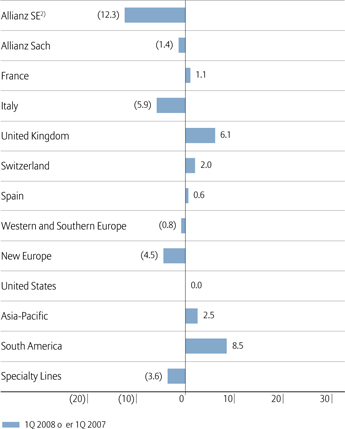
1) | After elimination of transactions between Allianz Group companies in different geographic regions and different segments. |
2) | Together with our property-casualty reinsurance business assumed, primarily attributable to Allianz SE, the decrease within Germany was 2.6%. |
Operating profit
Operating profit
in€ mn
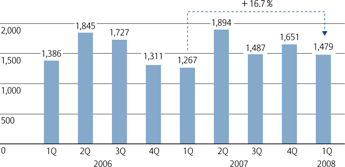
Operating profit improved strongly by 16.7% to € 1,479 million compared to the first quarter 2007, where operating profit was significantly impacted by net losses from natural catastrophes related to winterstorm “Kyrill” in Europe. Main drivers for the improvement were significantly lower acquisition and administrative expenses.
Thecombined ratio declined by 2.0 percentage points to 94.8%.
Claims and insurance benefits incurred were down by 1.3% to € 6,301 million. The transfer of the AGF health business to the life/health segment as already described led to a decrease of claims incurred.
On anaccident year basis theloss ratio increased by 1.9 percentage points to 72.3%. The positive impact from lower natural catastrophe activities was offset by higher impact of man made large claims, price reductions and moderate claims inflation.
Therun-off ratio amounted to 3.6% which is at the average level of the last three years.
Acquisition and administrative expenses decreased considerably by 10.6% to € 2,391 million. Due to the positive development in our acquisition and administrative expenses our expense ratio improved by 2.5 percentage points to 26.1%. Main drivers for the positive development of administrative expenses were – apart from reclassifications – further efficiency gains of about € 69 million and lower mark-to-market valuation (€ 54 million) of our Group Equity Incentive programs.
12
Table of Contents
Allianz Group Interim Report First Quarter of 2008 Group Management Report
Interest and similar income was up by 4.5% to € 1,051 million, mainly due to increased interest income in the first quarter 2008 compared to lower dividends in the respective quarter of 2007.
Non-operating result
In total, the non-operating result decreased by 85.7% to a gain of € 95 million mainly from lower net realized gains and higher impairments of investments. These negative effects were partially offset by the positive trading result and lower restructuring charges.
Net realized gains from investments decreased significantly by 49.2% to € 372 million compared to the previous year when we sold our shares in Germanischer Lloyd. In the first quarter 2008 we recorded gains mainly due to the sale of our participation in Linde AG and the disposal of AGF buildings.
Non-operatingnet impairments of investmentsincreased to € 342 million, reflecting the overall weakness in financial markets.
Restructuring charges turned positive due to the release of reserves at Allianz Sach.
Net income
Net income decreased by 10.4% to € 1,057 million. Although income taxes were down to € 478 million, the effective tax rate rose from 27.8% to 30.4%. This resulted mainly from a significantly lower tax-exempt income than in the first quarter 2007. Lower minority interests in earnings contributed € 175 million.
13
Table of Contents
Group Management Report Allianz Group Interim Report First Quarter of 2008
Property-Casualty segment’s income statement and ratios1)
| Three months ended March 31, | 2008 € mn | 2007 € mn | ||||||
| Gross premiums written2) | 13,710 | 14,111 | ||||||
| Ceded premiums written | (1,285) | (1,586) | ||||||
| Change in unearned premiums | (3,252) | (3,167) | ||||||
| Premiums earned (net) | 9,173 | 9,358 | ||||||
| Interest and similar income | 1,051 | 1,006 | ||||||
| Operating income from financial assets and liabilities carried at fair value through income (net)3) | 14 | 17 | ||||||
| Operating realized gains/losses (net)4) | (3) | 34 | ||||||
| Fee and commission income | 267 | 272 | ||||||
| Other income | 250 | 84 | ||||||
| Operating revenues | 10,752 | 10,771 | ||||||
| Claims and insurance benefits incurred (net) | (6,301) | (6,383) | ||||||
| Changes in reserves for insurance and investment contracts (net) | (29) | (81) | ||||||
| Interest expenses | (88) | (92) | ||||||
| Operating impairments of investments (net)5) | (93) | (2) | ||||||
| Investment expenses | (123) | (74) | ||||||
| Acquisition and administrative expenses (net) | (2,391) | (2,675) | ||||||
| Fee and commission expenses | (248) | (197) | ||||||
| Operating expenses | (9,273) | (9,504) | ||||||
| Operating profit | 1,479 | 1,267 | ||||||
| Non-operating income from financial assets and liabilities carried at fair value through income (net)3) | 63 | (29) | ||||||
| Non-operating realized gains/losses (net)4) | 372 | 733 | ||||||
| Non-operating impairments of investments (net)5) | (342) | (24) | ||||||
| Amortization of intangible assets | (4) | (2) | ||||||
| Restructuring charges | 6 | (14) | ||||||
| Non-operating items | 95 | 664 | ||||||
| Income before income taxes and minority interests in earnings | 1,574 | 1,931 | ||||||
| Income taxes | (478) | (537) | ||||||
| Minority interests in earnings | (39) | (214) | ||||||
| Net income | 1,057 | 1,180 | ||||||
| Loss ratio6)in % | 68.7 | 68.2 | ||||||
| Expense ratio7)in % | 26.1 | 28.6 | ||||||
| Combined ratio8)in % | 94.8 | 96.8 |
1) | Effective 1Q 2008, health business in Belgium and France is shown within Life/Health segment. Prior year balances have not been adjusted. |
2) | For the Property-Casualty segment, total revenues are measured based upon gross premiums written. |
3) | The total of these items equals income from financial assets and liabilities carried at fair value through income (net) in the segment income statement included in Note 4 to the condensed consolidated interim financial statements. |
4) | The total of these items equals realized gains/losses (net) in the segment income statement included in Note 4 to the condensed consolidated interim financial statements. |
5) | The total of these items equals impairments of investments (net) in the segment income statement included in Note 4 to the condensed consolidated interim financial statements. |
6) | Represents claims and insurance benefits incurred (net) divided by premiums earned (net). |
7) | Represents acquisition and administrative expenses (net) divided by premiums earned (net). |
8) | Represents the total of acquisition and administrative expenses (net) and claims and insurance benefits incurred (net) divided by premiums earned (net). |
14
Table of Contents
Allianz Group Interim Report First Quarter of 2008 Group Management Report
Property-Casualty Operations by Geographic Region
The following table sets forth our Property-Casualty gross premiums written, premiums earned (net), operating profit, combined ratio, loss ratio and expense ratio by geographic region for the three months ended March 31, 2008 and 2007. Consistent with our general practice, these figures are presented before consolidation adjustments, representing the elimination of transactions between Allianz Group companies in different geographic regions and different segments.
| Gross premiums written | Premiums earned (net) | Operating profit | Combined ratio | Loss ratio | Expense ratio | |||||||||||||||||||||||||||||||||||||||||||||||||||
Three months ended March, 31 | 2008 as stated € mn | 2007 as stated € mn | 2008 internal1) € mn | 2007 internal1) € mn | 2008 € mn | 2007 € mn | 2008 € mn | 2007 € mn | 2008 % | 2007 % | 2008 % | 2007 % | 2008 % | 2007 % | ||||||||||||||||||||||||||||||||||||||||||
| Germany2)3) | 4,638 | 4,616 | 4,638 | 4,761 | 2,431 | 2,267 | 595 | 115 | 94.2 | 103.2 | 71.6 | 73.6 | 22.6 | 29.6 | ||||||||||||||||||||||||||||||||||||||||||
| Italy | 1,173 | 1,246 | 1,173 | 1,246 | 1,156 | 1,197 | 166 | 175 | 93.1 | 93.4 | 69.7 | 70.1 | 23.4 | 23.3 | ||||||||||||||||||||||||||||||||||||||||||
| France4) | 1,394 | 1,695 | 1,394 | 1,379 | 830 | 1,114 | 59 | 75 | 99.4 | 101.2 | 72.3 | 73.7 | 27.1 | 27.5 | ||||||||||||||||||||||||||||||||||||||||||
| United Kingdom | 506 | 539 | 572 | 539 | 460 | 491 | 58 | 63 | 97.1 | 96.3 | 63.1 | 62.9 | 34.0 | 33.4 | ||||||||||||||||||||||||||||||||||||||||||
| Spain | 695 | 691 | 695 | 691 | 462 | 434 | 76 | 69 | 89.0 | 90.1 | 70.0 | 71.2 | 19.0 | 18.9 | ||||||||||||||||||||||||||||||||||||||||||
| Switzerland2)3) | 775 | 966 | 767 | 752 | 309 | 404 | 50 | 51 | 90.8 | 97.6 | 68.0 | 70.3 | 22.8 | 27.3 | ||||||||||||||||||||||||||||||||||||||||||
| Netherlands | 298 | 306 | 298 | 306 | 193 | 198 | 19 | 24 | 97.3 | 93.6 | 66.3 | 62.2 | 31.0 | 31.4 | ||||||||||||||||||||||||||||||||||||||||||
| Austria | 342 | 351 | 342 | 351 | 182 | 183 | 18 | 21 | 97.1 | 97.3 | 74.1 | 76.6 | 23.0 | 20.7 | ||||||||||||||||||||||||||||||||||||||||||
| Ireland | 200 | 203 | 200 | 203 | 150 | 151 | 30 | 98 | 90.2 | 93.2 | 65.5 | 68.6 | 24.7 | 24.6 | ||||||||||||||||||||||||||||||||||||||||||
| Belgium5) | 111 | 124 | 111 | 108 | 65 | 75 | 10 | 5 | 96.1 | 109.2 | 57.4 | 75.3 | 38.7 | 33.9 | ||||||||||||||||||||||||||||||||||||||||||
| Portugal | 87 | 80 | 87 | 80 | 61 | 62 | 10 | 10 | 89.8 | 89.5 | 63.8 | 60.9 | 26.0 | 28.6 | ||||||||||||||||||||||||||||||||||||||||||
| Greece | 22 | 21 | 22 | 21 | 13 | 12 | 3 | 3 | 85.5 | 85.8 | 56.1 | 56.7 | 29.4 | 29.1 | ||||||||||||||||||||||||||||||||||||||||||
| Western and Southern Europe | 1,060 | 1,085 | 1,060 | 1,069 | 664 | 681 | 95 6) | 166 6) | 94.7 | 95.7 | 67.0 | 68.7 | 27.7 | 27.0 | ||||||||||||||||||||||||||||||||||||||||||
| Russia7) | 225 | 68 | 18 | 67 | 174 | 45 | (2) | 1 | 100.7 | 104.8 | 61.2 | 66.5 | 39.5 | 38.3 | ||||||||||||||||||||||||||||||||||||||||||
| Hungary | 183 | 194 | 189 | 194 | 113 | 126 | 18 | 23 | 94.3 | 92.1 | 63.3 | 64.8 | 31.0 | 27.3 | ||||||||||||||||||||||||||||||||||||||||||
| Poland | 106 | 86 | 97 | 86 | 76 | 56 | 7 | 5 | 95.0 | 96.4 | 63.6 | 63.8 | 31.4 | 32.6 | ||||||||||||||||||||||||||||||||||||||||||
| Romania | 93 | 90 | 101 | 89 | 37 | 36 | 3 | — | 103.1 | 103.8 | 76.4 | 80.8 | 26.7 | 23.0 | ||||||||||||||||||||||||||||||||||||||||||
| Slovakia | 110 | 106 | 106 | 106 | 67 | 67 | 29 | 28 | 64.4 | 66.4 | 40.4 | 40.3 | 24.0 | 26.1 | ||||||||||||||||||||||||||||||||||||||||||
| Czech Republic | 82 | 78 | 75 | 78 | 54 | 45 | 12 | 12 | 82.3 | 79.8 | 60.0 | 57.6 | 22.3 | 22.2 | ||||||||||||||||||||||||||||||||||||||||||
| Bulgaria | 25 | 23 | 25 | 24 | 20 | 16 | 4 | 4 | 82.1 | 77.5 | 53.1 | 39.0 | 29.0 | 38.5 | ||||||||||||||||||||||||||||||||||||||||||
| Croatia | 26 | 23 | 26 | 23 | 19 | 15 | 2 | 1 | 93.7 | 97.7 | 64.9 | 68.5 | 28.8 | 29.2 | ||||||||||||||||||||||||||||||||||||||||||
| New Europe8) | 850 | 668 | 637 | 667 | 559 | 406 | 67 | 69 | 91.8 | 90.3 | 60.2 | 60.6 | 31.6 | 29.7 | ||||||||||||||||||||||||||||||||||||||||||
| Other Europe | 1,910 | 1,753 | 1,697 | 1,736 | 1,223 | 1,087 | 162 | 235 | 93.4 | 93.2 | 63.9 | 65.6 | 29.5 | 27.6 | ||||||||||||||||||||||||||||||||||||||||||
| United States | 772 | 882 | 882 | 882 | 685 | 801 | 89 | 166 | 97.4 | 90.8 | 66.7 | 57.0 | 30.7 | 33.8 | ||||||||||||||||||||||||||||||||||||||||||
| Mexico9) | 38 | 39 | 43 | 39 | 19 | 19 | 4 | 5 | 86.8 | 84.5 | 63.4 | 58.2 | 23.4 | 26.3 | ||||||||||||||||||||||||||||||||||||||||||
| NAFTA | 810 | 921 | 925 | 921 | 704 | 820 | 93 | 171 | 97.1 | 90.6 | 66.6 | 57.0 | 30.5 | 33.6 | ||||||||||||||||||||||||||||||||||||||||||
| Australia | 351 | 352 | 349 | 352 | 308 | 304 | 41 | 50 | 103.8 | 102.4 | 80.6 | 77.9 | 23.2 | 24.5 | ||||||||||||||||||||||||||||||||||||||||||
| Other | 102 | 81 | 95 | 81 | 53 | 37 | 3 | 3 | 100.7 | 100.5 | 60.9 | 60.5 | 39.8 | 40.0 | ||||||||||||||||||||||||||||||||||||||||||
| Asia-Pacific | 453 | 433 | 444 | 433 | 361 | 341 | 44 | 53 | 103.3 | 102.2 | 77.6 | 76.0 | 25.7 | 26.2 | ||||||||||||||||||||||||||||||||||||||||||
| South America | 237 | 236 | 231 | 213 | 181 | 168 | 17 | 14 | 98.3 | 100.1 | 63.4 | 65.3 | 34.9 | 34.8 | ||||||||||||||||||||||||||||||||||||||||||
| Other | 39 | 34 | 41 | 34 | 13 | 8 | 2 | 3 | — 10) | — 10) | — 10) | — 10) | — 10) | — 10) | ||||||||||||||||||||||||||||||||||||||||||
| Specialty lines | ||||||||||||||||||||||||||||||||||||||||||||||||||||||||
Allianz Global Corporate & Specialty2) | 863 | 934 | 863 | 1,003 | 425 | 467 | 53 | 95 | 96.7 | 94.0 | 70.7 | 66.3 | 26.0 | 27.7 | ||||||||||||||||||||||||||||||||||||||||||
| Credit Insurance | 532 | 489 | 532 | 489 | 343 | 301 | 77 | 117 | 89.1 | 76.3 | 63.2 | 48.5 | 25.9 | 27.8 | ||||||||||||||||||||||||||||||||||||||||||
Travel Insurance and Assistance Services | 327 | 296 | 327 | 296 | 275 | 259 | 25 | 31 | 93.5 | 100.6 | 58.0 | 54.9 | 35.5 | 45.7 | ||||||||||||||||||||||||||||||||||||||||||
| Subtotal | 14,352 | 14,849 | 14,299 | 14,493 | 9,173 | 9,358 | 1,477 | 1,267 | — | — | — | — | — | — | ||||||||||||||||||||||||||||||||||||||||||
| Consolidation11) | (642) | (738) | (624) | (737) | — | — | 2 | — | — | — | — | — | — | — | ||||||||||||||||||||||||||||||||||||||||||
| Total | 13,710 | 14,111 | 13,675 | 13,756 | 9,173 | 9,358 | 1,479 | 1,267 | 94.8 | 96.8 | 68.7 | 68.2 | 26.1 | 28.6 | ||||||||||||||||||||||||||||||||||||||||||
1) | Reflect gross premiums written on an internal basis (adjusted for foreign currency translation and (de-)consolidation effects). |
2) | Effective 1Q 2008, Allianz Risk Transfer AG is shown within Germany and Allianz Global Corporate & Specialty. Prior year balances have not been adjusted. |
3) | Reinsurance business of Allianz Suisse was transferred to Allianz SE. Effective 1Q 2008, renewal business is shown in Germany, run-off business is shown in Switzerland. |
4) | Effective 1Q 2008, health business in France is shown within Life/ Health segment. Prior year balances have not been adjusted. |
5) | Effective 1Q 2008, health business in Belgium is shown within Life/ Health segment. Prior year balances have not been adjusted. |
6) | Contains€ 5 mn and€ 5 mn for 1Q 2008 and 1Q 2007 respectively from a former operating entity located in Luxembourg. |
7) | Effective February 21, 2007, Russian People’s Insurance Society “Rosno” was consolidated following the acquisition of approximately 49.2 % of the shares in ROSNO by the Allianz Group, increasing our holding to approximately 97 %. Effective May 21, 2007, we consolidated Progress Garant for the first time. |
8) | Contains income and expense items from a management holding in both 2008 and 2007. |
9) | Effective Q1 2007, life business in Mexico is shown within the Life/Health segment. |
10) | Presentation not meaningful. |
11) | Represents elimination of transactions between Allianz Group companies in different geographic regions. |
15
Table of Contents
Life/Health Insurance Operations
– Revenue development rather flat due to significant decline in revenues from our Italian bancassurance channel.
– Lower realized gains, higher impairments and widening of credit spreads led to a decline in operating profit.
Earnings Summary
Statutory premiums
At € 12,327 million, statutory premiums showed a slight growth of 0.2% on an internal basis. Large negative currency translation effects impacted revenue growth by € 321 million. Premiums were up by € 304 million due to the reclassification of AGF’s health business from the Property-Casualty segment to the Life/Health segment.
Statutory premiums by region1)
in%
1) | After elimination of transactions between Allianz Group companies in different geographic regions and different segments. |
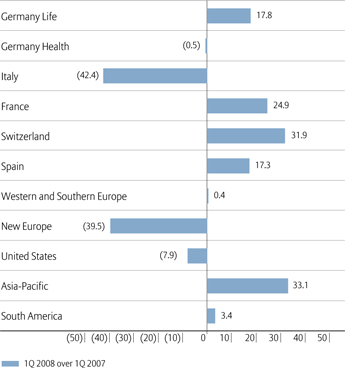
The revenue development was mixed across our various life insurance markets: Whereas most of our operating entities worldwide showed a good performance in the first quarter with remarkably positive developments in France (+ € 721 million), the German life/health operations (+ € 536 million), Asia-Pacific (+ € 168 million) and Switzerland (+ € 165 million) we experienced declining premiums in Italy (– € 1,201 million), the United States (– € 325 million) and New Europe (– € 147 million).
After a very successful year in 2007, the entire bancassurance sector in Italy was down by 30% in 1Q 2008. This was the main reason for our declining revenues in this market. In addition, one of our local bancassurance partners withdrew from cooperation after a change in ownership.
In the United States revenues were down almost entirely driven by declining sales of fixed annuity products, for which we recorded unusually high sales in the previous year’s quarter as a result of sales promotion activities that we did not yet repeat in the current year. Furthermore, premium development still reflected the legal and regulatory environment affecting the sale of equity-indexed annuity products. Due to the weak equity markets, revenues from variable annuity products increased only slightly.
In New Europe, the decline in premium volume was entirely due to lower premiums in Poland, where we decided not to run the yearly sales campaign for single premium products due to the difficult market situation.
Dynamic sales of single premium products were an important growth driver in the first quarter. Mostly, these stemmed from the acquisition of large group insurance contracts that added to the positive development in France, Germany and Switzerland.
We were able to maintain growth momentum in Asia- Pacific.
16
Table of Contents
Allianz Group Interim Report First Quarter of 2008 Group Management Report
Statutory premiums – Internal growth rates1)
in%
1) | After elimination of transactions between Allianz Group companies in different geographic regions and different segments. |
Operating profit
Operating profit
in€ mn
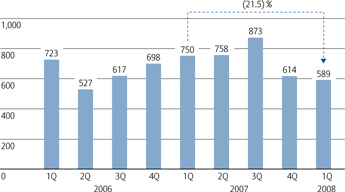
Operating profit declined by 21.5% to € 589 million with almost all markets contributing to this decline. This is primarily a result of weak corporate bond and equity markets in which our investment income as well as our technical result suffered.
In contrast to the prior year, where we recorded relatively high realized gains due to the favorable market conditions,
we refrained from any large scale realizations due to the poor market conditions in 1Q 2008. Therefore,net realized gains declined by 40.3% to € 649 million.
Due to the weak equity markets we recordednet impairments on our available-for-sale equity portfolio of € 980 million compared to € 37 million a year earlier. In addition widening credit spreads had a negative effect on our marked-to-market US bond portfolio, lowering operating profit by € 68 million.
In aggregate,acquisition and administrative expenses increased by 26.8% to € 1,108 million. The main driver was acquisition-related expenses which were up by € 283 million to € 706 million due to an unusual high positive impact (€ 242 million) from the update of assumptions at Allianz Leben in 1Q 2007. This technical effect was partially offset by efficiency gains of € 20 million and favorable currency translation effects resulting in € 49 million lower administrative expenses. The statutory expense ratio increased by 1.9 percentage points to 9.1%.
Income from financial assets and liabilities carried at fair value through income amounted to € 231 million mainly as a result of positive effects from the accounting treatment for certain derivative instruments.
Non-operating result
In aggregate, non-operating items were down by € 85 million driven by lower net realized gains not to be shared with policyholders in Italy and South Korea.
Net income
Net income amounted to € 452 million, down 18.3% compared to the previous year’s figure, mainly due to the lower operating profit.
The decrease in pre-tax income led to lower income tax expenses of € 136 million. The decline in the effective tax rate by 1.2 percentage points to 22.4% is mainly a result of lower tax rates in Germany and Italy.
Minority interests in earnings were down by € 80 million to € 19 million reflecting the minority buy-out at AGF in France.
17
Table of Contents
Group Management Report Allianz Group Interim Report First Quarter of 2008
Life/Health segment’s income statement and ratios1)
| Three months ended March 31, | 2008 € mn | 2007 € mn | ||||||
| Statutory premiums2) | 12,327 | 12,326 | ||||||
| Ceded premiums written | (143) | (193) | ||||||
| Change in unearned premiums | (37) | (27) | ||||||
| Statutory premiums (net) | 12,147 | 12,106 | ||||||
| Deposits from SFAS 97 insurance and investment contracts | (6,558) | (6,921) | ||||||
| Premiums earned (net) | 5,589 | 5,185 | ||||||
| Interest and similar income | 3,200 | 3,155 | ||||||
| Operating income from financial assets and liabilities carried at fair value through income (net)3) | 231 | (311) | ||||||
| Operating realized gains/losses (net)4) | 649 | 1,088 | ||||||
| Fee and commission income | 171 | 171 | ||||||
| Other income | 110 | 54 | ||||||
| Operating revenues | 9,950 | 9,342 | ||||||
| Claims and insurance benefits incurred (net) | (5,013) | (4,702) | ||||||
| Changes in reserves for insurance and investment contracts (net) | (1,803) | (2,624) | ||||||
| Interest expenses | (70) | (91) | ||||||
| Loan loss provisions | 2 | (3) | ||||||
| Operating impairments of investments (net)5) | (980) | (37) | ||||||
| Investment expenses | (328) | (196) | ||||||
| Acquisition and administrative expenses (net) | (1,108) | (874) | ||||||
| Fee and commission expenses | (60) | (62) | ||||||
| Operating restructuring charges6) | (1) | (3) | ||||||
| Operating expenses | (9,361) | (8,592) | ||||||
| Operating profit | 589 | 750 | ||||||
| Non-operating income from financial assets and liabilities carried at fair value through income (net)3) | 11 | 1 | ||||||
| Non-operating realized gains/losses (net)4) | 12 | 105 | ||||||
| Non-operating impairments of investments (net)5) | (4) | — | ||||||
| Amortization of intangible assets | (1) | (1) | ||||||
| Non-operating restructuring charges6) | — | (2) | ||||||
| Non-operating items | 18 | 103 | ||||||
| Income before income taxes and minority interests in earnings | 607 | 853 | ||||||
| Income taxes | (136) | (201) | ||||||
| Minority interests in earnings | (19) | (99) | ||||||
| Net income | 452 | 553 | ||||||
| Statutory expense ratio7)in % | 9.1 | 7.2 |
1) | Effective 1Q 2008, health business in Belgium and France is shown within Life/Health segment. Prior year balances have not been adjusted. |
2) | For the Life/Health segment, total revenues are measured based upon statutory premiums. Statutory premiums are gross premiums written from sales of life insurance policies, as well as gross receipts from sales of unit linked and other investment-oriented products, in accordance with the statutory accounting practices applicable in the insurer’s home jurisdiction. |
3) | The total of these items equals income from financial assets and liabilities carried at fair value through income (net) in the segment income statement included in Note 4 to the condensed consolidated interim financial statements. |
4) | The total of these items equals realized gains/losses (net) in the segment income statement included in Note 4 to the condensed consolidated interim financial statements. |
5) | The total of these items equals impairments of investments (net) in the segment income statement included in Note 4 to the condensed consolidated interim financial statements. |
6) | The total of these items equals restructuring charges in the segment income statement included in Note 4 to the condensed consolidated interim financial statements. |
7) | Represents acquisition and administrative expenses (net) divided by statutory premiums (net). |
18
Table of Contents
Allianz Group Interim Report First Quarter of 2008 Group Management Report
Life/Health Operations by Geographic Region
The following table sets forth our Life/Health statutory premiums, premiums earned (net), operating profit and statutory expense ratio by geographic region for the three months ended March 31, 2008 and 2007. Consistent with our general practice, these figures are presented before consolidation adjustments, representing the elimination of transactions between Allianz Group companies in different geographic regions and different segments.
| Statutory premiums1) | Premiums earned (net) | Operating profit | Statutory expense ratio | |||||||||||||||||||||||||||||||||||||
| Three months ended March, 31 | 2008 as € mn | 2007 as € mn | 2008 € m | 2007 € m | 2008 € mn | 2007 € mn | 2008 € mn | 2007 € mn | 2008 % | 2007 % | ||||||||||||||||||||||||||||||
| Germany Life | 3,579 | 3,039 | 3,579 | 3,039 | 2,624 | 2,567 | 187 | 191 | 7.2 | 1.4 | ||||||||||||||||||||||||||||||
| Germany Health3) | 775 | 779 | 775 | 779 | 776 | 780 | 37 | 41 | 9.5 | 10.2 | ||||||||||||||||||||||||||||||
| Italy | 1,629 | 2,830 | 1,629 | 2,830 | 214 | 243 | 31 | 94 | 8.1 | 5.3 | ||||||||||||||||||||||||||||||
| France4) | 2,211 | 1,490 | 2,211 | 1,770 | 697 | 435 | 160 | 135 | 13.3 | 13.5 | ||||||||||||||||||||||||||||||
| Switzerland | 663 | 498 | 657 | 498 | 194 | 195 | 17 | 16 | 3.0 | 4.5 | ||||||||||||||||||||||||||||||
| Spain | 183 | 156 | 183 | 156 | 112 | 111 | 26 | 27 | 9.7 | 10.6 | ||||||||||||||||||||||||||||||
| Belgium5) | 203 | 194 | 203 | 210 | 89 | 76 | 30 | 44 | 9.8 | 7.7 | ||||||||||||||||||||||||||||||
| Netherlands | 99 | 112 | 99 | 112 | 33 | 36 | 9 | 11 | 19.7 | 12.4 | ||||||||||||||||||||||||||||||
| Austria | 108 | 102 | 108 | 102 | 82 | 68 | 8 | 19 | 11.8 | 10.1 | ||||||||||||||||||||||||||||||
| Portugal | 25 | 22 | 25 | 22 | 19 | 18 | 5 | 10 | 27.2 | 31.3 | ||||||||||||||||||||||||||||||
| Greece | 29 | 29 | 29 | 29 | 18 | 16 | 1 | 1 | 21.3 | 16.7 | ||||||||||||||||||||||||||||||
| Luxembourg | 23 | 10 | 23 | 10 | 7 | 6 | 1 | 3 | 10.0 | 24.2 | ||||||||||||||||||||||||||||||
| Western and Southern Europe | 487 | 469 | 487 | 485 | 248 | 220 | 54 | 87 6) | 13.8 | 11.4 | ||||||||||||||||||||||||||||||
| Poland | 63 | 248 | 58 | 248 | 38 | 28 | 4 | 3 | 39.4 | 8.5 | ||||||||||||||||||||||||||||||
| Slovakia | 80 | 63 | 77 | 63 | 42 | 40 | 9 | 7 | 8.8 | 14.9 | ||||||||||||||||||||||||||||||
| Hungary | 44 | 30 | 45 | 30 | 20 | 20 | 4 | 4 | 16.2 | 20.5 | ||||||||||||||||||||||||||||||
| Czech Republic | 27 | 21 | 25 | 21 | 16 | 13 | 4 | 4 | 17.7 | 20.0 | ||||||||||||||||||||||||||||||
| Croatia | 13 | 12 | 13 | 12 | 9 | 9 | 2 | 2 | 27.1 | 16.5 | ||||||||||||||||||||||||||||||
| Bulgaria | 7 | 7 | 7 | 7 | 6 | 6 | 1 | 1 | 24.0 | 14.3 | ||||||||||||||||||||||||||||||
| Romania | 7 | 9 | 8 | 9 | 3 | 2 | 1 | (1) | 31.0 | 28.0 | ||||||||||||||||||||||||||||||
| Russia | 4 | 2 | 4 | 2 | 4 | 2 | (3) | (1) | 135.9 | 147.0 | ||||||||||||||||||||||||||||||
| New Europe | 245 | 392 | 237 | 392 | 138 | 120 | 22 | 19 | 22.8 | 12.4 | ||||||||||||||||||||||||||||||
| Other Europe | 732 | 861 | 724 | 877 | 386 | 340 | 76 | 106 | 16.9 | 11.9 | ||||||||||||||||||||||||||||||
| Mexico7) | 34 | 7 | 38 | 7 | 7 | 7 | – | 1 | 4.7 | 16.2 | ||||||||||||||||||||||||||||||
| United States | 1,344 | 1,669 | 1,537 | 1,669 | 174 | 101 | 6 | 71 | 5.4 | 9.3 | ||||||||||||||||||||||||||||||
| NAFTA | 1,378 | 1,676 | 1,575 | 1,676 | 181 | 108 | 6 | 72 | 5.3 | 9.4 | ||||||||||||||||||||||||||||||
| South Korea | 484 | 465 | 564 | 465 | 210 | 253 | 30 | 54 | 12.0 | 14.0 | ||||||||||||||||||||||||||||||
| Taiwan | 455 | 350 | 498 | 350 | 27 | 15 | 2 | 3 | 7.1 | 2.3 | ||||||||||||||||||||||||||||||
| Indonesia | 45 | 30 | 52 | 30 | 10 | 11 | 3 | 2 | 12.3 | 21.4 | ||||||||||||||||||||||||||||||
| Malaysia | 31 | 29 | 33 | 29 | 28 | 23 | 2 | 3 | 15.0 | 15.0 | ||||||||||||||||||||||||||||||
| Other | 75 | 48 | 80 | 48 | 6 | 4 | (10) | (4) | 20.5 | 13.5 | ||||||||||||||||||||||||||||||
| Asia-Pacific | 1,090 | 922 | 1,227 | 922 | 281 | 306 | 27 | 58 | 10.6 | 9.9 | ||||||||||||||||||||||||||||||
| South America | 30 | 33 | 30 | 29 | 29 | 9 | 6 | (2) | 16.1 | 20.4 | ||||||||||||||||||||||||||||||
| Other | 110 | 102 | 112 | 102 | 95 | 91 | 17 | 3 | —8) | —8) | ||||||||||||||||||||||||||||||
| Subtotal | 12,380 | 12,386 | 12,702 | 12,678 | 5,589 | 5,185 | 590 | 741 | — | — | ||||||||||||||||||||||||||||||
| Consolidation9) | (53) | (60) | (54) | (60) | — | — | (1) | 9 | — | — | ||||||||||||||||||||||||||||||
| Total | 12,327 | 12,326 | 12,648 | 12,618 | 5,589 | 5,185 | 589 | 750 | 9.1 | 7.2 | ||||||||||||||||||||||||||||||
1) | Statutory premiums are gross premiums written from sales of life insurance policies as well as gross receipts from sales of unit-linked and other investment-oriented products, in accordance with the statutory accounting practices applicable in the insurer’s home jurisdiction. |
2) | Reflect statutory premiums on an internal basis (adjusted for foreign currency translation and (de-)consolidation effects). |
3) | Loss ratios were 79.4 % and 77.8 % for the three months ended March 31, 2008 and 2007 respectively. |
4) | Effective 1Q 2008, health business in France is shown within Life/ Health segment. Prior year balances have not been adjusted. |
5) | Effective 1Q 2008, health business in Belgium is shown within Life/ Health segment. Prior year balances have not been adjusted. |
6) | Contains run-off€ (1) mn 1Q 2007 from our former life insurance business in the United Kingdom which we sold in December 2004. |
7) | Effective 2007, life business in Mexico is shown within the Life/Health segment. |
8) | Presentation not meaningful. |
9) | Represents elimination of transactions between Allianz Group companies in different geographic regions. |
19
Table of Contents
| – | Revenues significantly impacted by further markdowns on asset-backed securities of€ 845 million resulting in an operating loss of€453 million. |
| – | Further expense savings achieved of€191 million in all expense categories and across all divisions. |
| – | The quality of Dresdner Bank’s loan book remained strong. |
Earnings Summary
Operating revenues
Dresdner Bank’soperating revenues were down by 64.5% to €719 million as the financial markets crisis heavily impacted our net trading income. Excluding the markdowns of €845 million the revenue shortfall was €459 million, mainly due to a positive prior year one-off effect of €171 million and €95 million additional provision for our exposure to monoline insurers.
Net interest income dropped by €231 million to €669 million compared to the previous year when we recorded a positive effect from the disposal of an associated company amounting to €171 million. In addition the positive impact from the accounting treatment for derivative financial instruments which do not qualify for hedge accounting came to €8 million and therefore was €51 million lower. Without these effects net interest income remained stable with a positive development in our operating divisions.
1) | The results of operations of our Banking segment are almost exclusively represented by Dresdner Bank, accounting for 92.4% and 96.3% of our total Banking segment’s operating revenues for the three months ended March 31, 2008 and 2007, respectively. Accordingly, the discussion of our Banking segment’s results of operations relates solely to the operations of Dresdner Bank. |
Net fee and commission income at €604 million was down 23.4% mainly due to a decline in the securities business which decreased by €116 million to €296 million primarily in the Private & Corporate Clients division, where we saw less client activity. In addition, we recorded declines in the underwriting business and in the mergers and aquisition business.
Net dealing income, which comprisesnet trading income andnet income from financial assets and liabilities designated at fair value through income, was a loss of €554 million compared to a dealing income of €334 million a year ago. The development was largely driven by the impact from the credit crisis resulting in markdowns of €845 million on asset-backed securities (ABS) in our trading book and mark-to-market adjustments for our monoline exposure amounting to €95 million.
20
Table of Contents
Allianz Group Interim Report First Quarter of 2008 Group Management Report
Operating profit (loss)
Operating profit (loss)
in€mn
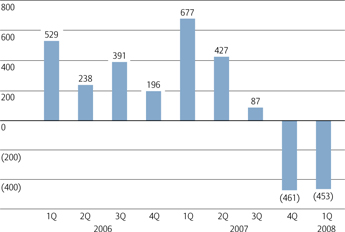
Mainly due to the high ABS markdowns, we recorded anoperating loss of €453 million coming from an operating profit €677 million a year ago.
Operating expenses at €1,162 million were €191 million below the previous year with almost all expense categories contributing to this development.Administrative expenses were down 14.7% to €1,156 million. Thereof, personnel expenses declined 18.8% to €719 million mainly due to significantly reduced performance-related compensation reflecting the decline in revenues in the Investment Bank. Non-personnel expenses decreased by 7.0% to €437 million mainly through cost savings in IT, lower office costs and reduced consulting fees.
Loan loss provisions recorded net additions of €10 million in the first three months of 2008 after net releases of €7 million one year ago. This was due to a slight increase of gross additions and marginally lower recoveries.
Due to the weak revenue situation we recorded a significant increase in ourcost-income ratio to 161.6%, up 94.7 percentage points, although we could lower our operating expenses significantly by 14.1%.
Non-operating result
Thenon-operating result declined by €66 million to a gain of €49 million mostly driven by lower net realized gains.
Net realized gains declined by 54.0% to €63 million. In the prior year period, we recorded large gains from the disposal of Arcandor and Germanischer Lloyd compared to a lower result from the sale of DEGI in this year’s first quarter.
Partly offsetting this development were releases ofrestructuring provisions of €16 million in 2008.
Net income (loss)
Due to the significantly lower operating profit, we recorded anet loss of €513 million compared to a net income of €612 million in the prior year period.
Despite the negative pre-tax income, we recorded anincome tax charge of €94 million (1Q 2007: €158 million) due to positive income in other jurisdictions. The non-recognition of deferred tax assets for losses from ABS markdowns led to an effective tax rate of (23.3)% (1Q 2007: 19.9%).
21
Table of Contents
Group Management Report Allianz Group Interim Report First Quarter of 2008
Banking Operations by Division
The following table sets forth our banking operating revenues, operating profit and cost-income ratio by division. Consistent with our general practice, these figures are presented before consolidation adjustments, representing the elimination of transactions between Allianz Group companies in different segments.
| Operating revenues | Operating profit (loss) | Cost-income ratio | ||||||||||||||||||||||
| 2008 € mn | 2007 € mn | 2008 € mn | 2007 € mn | 2008 % | 2007 % | |||||||||||||||||||
| Private & Corporate Clients | 875 | 993 | 217 | 312 | 75.0 | 68.5 | ||||||||||||||||||
| Investment Banking | (31) | 890 | (575) | 220 | —2) | 76.3 | ||||||||||||||||||
| Corporate Other1) | (125) | 140 | (95) | 145 | —2) | —2) | ||||||||||||||||||
| Dresdner Bank | 719 | 2,023 | (453) | 677 | 161.6 | 66.9 | ||||||||||||||||||
| Other Banks3) | 59 | 78 | (3) | 23 | 101.7 | 67.9 | ||||||||||||||||||
| Total | 778 | 2,101 | (456) | 700 | 157.1 | 66.9 | ||||||||||||||||||
1) | These items include, in particular, impacts from the accounting treatment for derivative financial instruments which do not qualify for hedge accounting as well as provisioning requirements for country and general risks. For the three months ended March 31, 2008 and 2007 the impact from the accounting treatment for derivative financial instruments which do not qualify for hedge accounting on Corporate Other’s operating revenues amounted to€ (28) mn and€ (20) mn, respectively. |
2) | Presentation not meaningful. |
3) | Consists of non-Dresdner Bank banking operations within our Banking segment. |
22
Table of Contents
Allianz Group Interim Report First Quarter of 2008 Group Management Report
Income statement and cost-income ratios for the Banking segment and Dresdner Bank
| Three months ended March 31, | 2008 | 2007 | ||||||||||||||
Banking € mn | Dresdner Bank € mn | Banking Segment € mn | Dresdner Bank € mn | |||||||||||||
| Net interest income1) | 696 | 669 | 928 | 900 | ||||||||||||
| Net fee and commission income2) | 644 | 604 | 832 | 789 | ||||||||||||
| Trading income (net)3) | (706) | (698) | 351 | 345 | ||||||||||||
| Income from financial assets and liabilities designated at fair value through income (net)3) | 144 | 144 | (10) | (11) | ||||||||||||
| Operating revenues4) | 778 | 719 | 2,101 | 2,023 | ||||||||||||
| Administrative expenses | (1,218) | (1,156) | (1,410) | (1,355) | ||||||||||||
| Investment expenses | 2 | (1) | (9) | (11) | ||||||||||||
| Other expenses | (6) | (5) | 13 | 13 | ||||||||||||
| Operating expenses | (1,222) | (1,162) | (1,406) | (1,353) | ||||||||||||
| Loan loss provisions | (12) | (10) | 5 | 7 | ||||||||||||
| Operating profit (loss) | (456) | (453) | 700 | 677 | ||||||||||||
| Realized gains/losses (net) | 62 | 63 | 139 | 137 | ||||||||||||
| Impairments of investments (net) | (30) | (30) | (13) | (13) | ||||||||||||
| Restructuring charges | 16 | 16 | (9) | (9) | ||||||||||||
| Non-operating items | 48 | 49 | 117 | 115 | ||||||||||||
| Income (loss) before income taxes and minority interests in earnings | (408) | (404) | 817 | 792 | ||||||||||||
| Income taxes | (116) | (94) | (168) | (158) | ||||||||||||
| Minority interests in earnings | (14) | (15) | (24) | (22) | ||||||||||||
| Net income (loss) | (538) | (513) | 625 | 612 | ||||||||||||
| Cost-income ratio5)in % | 157.1 | 161.6 | 66.9 | 66.9 | ||||||||||||
1) | Represents interest and similar income less interest expenses. |
2) | Represents fee and commission income less fee and commission expenses. |
3) | The total of these items equals income from financial assets and liabilities carried at fair value through income (net) in the segment income statement included in Note 4 to the condensed consolidated interim financial statements. |
4) | For the Banking segment, total revenues are measured based upon operating revenues. |
5) | Represents operating expenses divided by operating revenues. |
23
Table of Contents
– Weak equity markets dampen revenues.
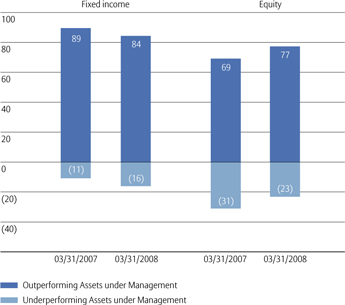
– 83% of the third-party assets outperformed their benchmarks.
– Strong net inflows and stable margins.
Third-Party Assets Under Management of the Allianz Group
The vast majority of our assets under management continued to outperform their respective benchmarks. Despite the credit crisis we managed to achieve an outperformance record of 84 % for our fixed income business. On the equity side, more than three-quarters of our assets outperformed their respective benchmarks.
Rolling investment performance of Allianz Global Investors1)
in %
Third party assets under management were down by 3.8 % to €736 billion. On an internal basis, which excludes consolidation and foreign currency effects our asset base grew by 2.4 % since the year end 2007.
Development of third-party assets under management in
€ bn
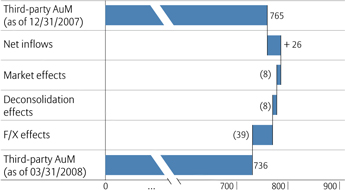
In line with the overall favorable development of the fixed income markets worldwide, fixed income products contributed €29 billion to the total net inflows showing that the performance track record in this sector is paying off. Outflows of €3 billion were recorded in the equity business as we observed investors favoring money market funds over equities. Deconsolidation effects of €8 billion resulted mainly from the sale of our former real estate fund company DEGI. The major reason for the decrease in third party assets under management were negative currency translation effects of €39 billion, resulting primarily from the continuing downward trend of the US Dollar versus the Euro.
1) | AGI account-based, asset-weighted 3-year investment performance of 3rd party assets vs. benchmark including all equity and fixed income accounts managed on a discretionary basis by equity and fixed income managers of AGI (including direct accounts, Spezialfonds and CPMs of Allianz with AGI Germany). For some retail funds the net of fee performance is compared to the median performance of an appropriate peer group (Micropal or Lipper; 1st and 2nd quartile mean out-performance). For all other retail funds and for all institutional accounts performance is calculated gross of fees using closing prices (revaluated) where appropriate and compared to the benchmark of each individual fund or account. Other than under GIPS, the performance of closed funds/accounts is not included in the analysis. Also not included: WRAP accounts and accounts of Caywood Scholl, AGI Taiwan, AGI Korea, AGF AM and RAS AM. |
24
Table of Contents
Allianz Group Interim Report First Quarter of 2008 Group Management Report
Third-party assets under management by geographic region as of March 31, 2008 (December 31, 2007)1)
in %
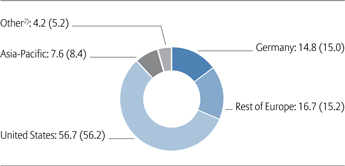
1) | Based on the origination of assets. |
2) | Consists of third-party assets managed by Dresdner Bank (approximately€12 bn and€18 bn as of March 31, 2008 and December 31, 2007, respectively) and by other Allianz Group companies (approximately€19 bn and€22 bn as of March 31, 2008 and December, 31 2007 respectively). |
There were no major movements in the geographic origination of third party assets under management. The one-third to two-thirds weighting of retail and institutional clients remained almost stable with a slight shift towards the institutional share. Most clients came from the United States. Twenty percent of the assets under management are in equities, with fixed income business making up the other eighty percent. In 1Q 2008 there was a marginal movement from equities to fixed income. Whereas on the equity side the allocation between the United States, Germany and other countries was fairly balanced, the majority of the fixed income business comes from to the United States.
Earnings Summary1)
Operating Revenues
Operating revenues declined by 6.3 % to €710 million. This shortfall is explained by negative foreign currency development (€75 million) and by lower revenues from our third-party equity business.Income from financial assets and liabilities carried at fair value through income (net) turned negative due to movements in the value of seed money investments of €31 million, partly offset by a €21 million gain from foreign currency hedging. The internal growth rate amounted to 0.9 %.
Net fee and commission income at €693 million was down 4.8 % primarily driven by lower management fees. At stable revenue margins the increase of asset based management fees as a result of the higher third-party asset base was offset by currency related effects.
| Three months ended March, 31 | 2008 € mn | 2007 € mn | ||||||
| Management fees | 824 | 851 | ||||||
| Loading and exit fees | 64 | 81 | ||||||
| Performance fees | 13 | 16 | ||||||
| Other income | 64 | 101 | ||||||
| Fee and commission income | 965 | 1,049 | ||||||
| Commissions | (193) | (220) | ||||||
| Other expenses | (79) | (101) | ||||||
| Fee and commission expenses | (272) | (321) | ||||||
| Net fee and commission income | 693 | 728 |
1) | The results of operations of our Asset Management segment are almost exclusively represented by AGI, accounting for 97.7 % (1Q 2007: 97.2 %) and 98.8 % (1Q 2007: 97.4 %) of our total Asset Management segment’s operating revenues and operating profit in the first three months of 2008 , respectively. Accordingly, the discussion of our Asset Management segment’s results of operations relates solely to the operations of AGI. |
25
Table of Contents
Group Management Report Allianz Group Interim Report First Quarter of 2008
Operating Profit
The combination of these lower revenues and the higher expenses described below, resulted in an operating profit decrease of 21.7 % to €238 million.
Operating Profit
in€ mn
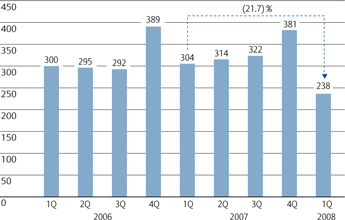
Despite the downturn in operating revenues,administrative expenses, excluding acquisition-related expenses , developed adversely and were up 4.0 % to €472 million. This reflects the run-rate effects from last year’s business expansion and investments in our distribution network. On an internal basis the expense increase amounted to 16.7 %. As a result ourcost-income ratioincreased by 6.6 percentage points to 66.5 %.
Non-operating result
In aggregate, the negative result from non-operating items declined slightly compared to a year ago.
At €120 million,acquisition related expenses were 1.6 % lower, mainly driven by a positive foreign currency impact. The number of outstanding Class B Units was lower at the end of the first quarter 2008 compared to year end 2007. In the first quarter, the Allianz Group had acquired an additional 23,946 Class B Units bringing the total acquired to 67,863. Originally 150,000 units were outstanding.
Net income
Net income decreased by 18.3 % to €76 million mainly driven by the lower operating profit.
The lower income led to a decline in tax charges which amounted to €45 million. The effective tax rate of 36.6 %, down 6.8 percentage points, is a result of lower tax rates in Germany and Italy and less income in the United States. Due to the minority buy-out at AGF in France, minority interests in earnings decreased by €8 million to €2 million.
26
Table of Contents
Allianz Group Interim Report First Quarter of 2008 Group Management Report
Income statement and cost-income ratios for the Asset Management segment and AGI
| Three months ended March 31, | 2008 | 2007 | ||||||||||||||
Asset € mn | Allianz Global Investors € mn | Asset € mn | Allianz Global Investors € mn | |||||||||||||
| Net fee and commission income1) | 706 | 693 | 746 | 728 | ||||||||||||
| Net interest income2) | 20 | 15 | 23 | 19 | ||||||||||||
| Income from financial assets and liabilities carried at fair value through income (net) | (4) | (3) | 7 | 7 | ||||||||||||
| Other income | 5 | 5 | 4 | 4 | ||||||||||||
| Operating revenues3) | 727 | 710 | 780 | 758 | ||||||||||||
| Administrative expenses, excluding acquisition-related expenses4) | (486) | (472) | (468) | (454) | ||||||||||||
| Operating expenses | (486) | (472) | (468) | (454) | ||||||||||||
| Operating profit | 241 | 238 | 312 | 304 | ||||||||||||
| Realized gains/losses (net) | 8 | 8 | 2 | 2 | ||||||||||||
| Impairments of investments (net) | (3) | (3) | — | — | ||||||||||||
| Acquisition-related expenses4), thereof: | ||||||||||||||||
Deferred purchases of interests in PIMCO | (120) | (120) | (122) | (122) | ||||||||||||
| Restructuring charges | — | — | (2) | (2) | ||||||||||||
| Non-operating items | (115) | (115) | (122) | (122) | ||||||||||||
| Income before income taxes and minority interests in earnings | 126 | 123 | 190 | 182 | ||||||||||||
| Income taxes | (46) | (45) | (80) | (79) | ||||||||||||
| Minority interests in earnings | (2) | (2) | (11) | (10) | ||||||||||||
| Net income | 78 | 76 | 99 | 93 | ||||||||||||
| Cost-income ratio5)in % | 66.9 | 66.5 | 60.0 | 59.9 | ||||||||||||
1) | Represents fee and commission income less fee and commission expenses. |
2) | Represents interest and similar income less interest expense and investment expenses. |
3) | For the Asset Management segment, total revenues are measured based upon operating revenues. |
4) | The total of these items equals acquisition and administrative expenses (net) in the segment income statement included in Note 4 to the condensed consolidated interim financial statements. |
5) | Represents operating expenses divided by operating revenues. |
27
Table of Contents
– Reduced operating loss due to positive development in Private Equity business.
– Lower realized gains affected net income.
Earnings Summary
The overall operating loss reduced by €25 million to €76 million. This improvement was attributable to increased profits in the Private Equity business, partly offset by a slightly higher operating loss in the Holding Function.
The prior year’s net income of €381 million turned into a net loss of €99 million in 1Q 2008, primarily due to a lower volume of realized gains in the Holding Function.
Holding Function
Operating profit (loss)
At €140 million, the operating loss was €8 million higher than a year ago. Interest and similar income increased by more than 50 % mainly driven by a higher asset base. This positive development was more than offset by higher interest and administrative expenses.
Non-operating result
Non-operating items turned to a loss of €90 million from a €512 million gain in the first three months of 2007. The gain a year ago mainly resulted from exceptionally high gains of
€640 million from the disposal of equity investments. Due to the weak market conditions in 1Q 2008 we refrained from any large scale realizations.
Net income
As a result of the movements in operating profit and non-operating items, the prior year net income of €364 million turned into a net loss of €137 million in 1Q 2008.
Private Equity
Operating profit
Operating profit more than doubled to €64 million. Fee and commission income rose significantly due to several real estate transactions in the first quarter 2008.
Non-operating result
Non-operating loss increased by €11 million to €12 million mainly due to higher net impairments of investments.
Net income
As a result of the favorable development in operating profit, net income more than doubled to €38 million.
| Holding Function | Private Equity | Total | ||||||||||||||||||||||
| Three months ended March, 31 | 2008 € mn | 2007 € mn | 2008 € mn | 2007 €mn | 2008 € mn | 2007 € mn | ||||||||||||||||||
| Operating profit (loss) | (140) | (132) | 64 | 31 | (76) | (101) | ||||||||||||||||||
| Non-operating items | (90) | 512 | (12) | (1) | (102) | 511 | ||||||||||||||||||
| Income (loss) before income taxes and minorities | (230) | 380 | 52 | 30 | (178) | 410 | ||||||||||||||||||
| Net income (loss) | (137) | 364 | 38 | 17 | (99) | 381 | ||||||||||||||||||
30
Table of Contents
– Shareholders’ equity remained strong at€ 45 billion.
Shareholders’ Equity
Shareholders’ equity1)
in€ mn
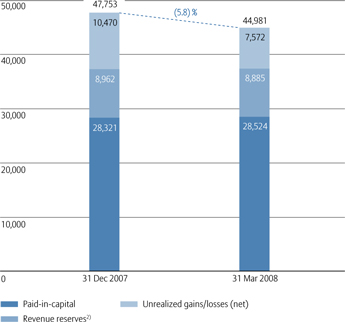
1) | Does not include minority interests of€ 3.5 bn and€ 3.6 bn as of March 31, 2008 and December 31, 2007, respectively. Please see note 19 to the condensed consolidated financial statements for further information. |
2) | Includes foreign currency translation adjustments. |
As of March 31, 2008, shareholders’ equity was 5.8% lower than for the year-end 2007. First quarter’s net income of € 1.1 billion was added to the equity but mainly due to a reduction of unrealized gains of € 2.8 billion and negative foreign currency translation effects of € 0.8 billion shareholders’ equity decreased to € 45.0 billion.
Total Assets and Total Liabilities
Total assets and liabilities increased by € 65.6 billion and € 68.5 billion, respectively. In the following sections we analyze important developments within the balance sheets of our Property-Casualty, Life/Health and Banking segments as presented on page 43. Relative to the Allianz Group’s total assets and total liabilities, we consider the total assets and total liabilities from our Asset Management segment as immaterial and have, accordingly, excluded these assets and liabilities from the following discussion. Our Asset Management segment’s results of operations stem primarily from its business with third-party assets. Please see pages 24 and 25 for further information on the development of our third-party assets.
29
Table of Contents
Group Management Report Allianz Group Interim Report First Quarter of 2008
Assets and Liabilities of the Property-Casualty segment
Property-Casualty assets
Property-Casualty asset base
fair values1) in€ bn
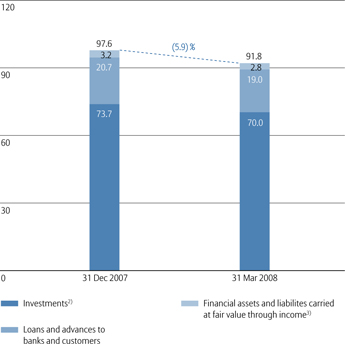
1) | Loans and advances to banks and customers, held-to-maturity investments, and real estate held for investment are stated at amortized cost. Investments in associates and joint ventures are stated at either amortized cost or equity, depending upon, among other factors, our ownership percentage. |
2) | Does not include affiliates of€ 9.8 bn and€ 10.0 bn as of March 31, 2008 and December 31, 2007, respectively. |
3) | Includes debt securities of€ 2.3 bn and€ 2.7 bn as of March 31, 2008 and December 31, 2007, respectively, equity securities of€ 0.4 bn and€ 0.4 bn as of March 31, 2008 and December 31, 2007, respectively, and derivative financial instruments of€ 0.1 bn and€ 0.1 bn as of March 31, 2008 and December 31, 2007, respectively. |
Our Property-Casualty asset base decreased by € 5.8 billion or 5.9% to € 91.8 billion mostly driven by a decline in the segment’s investments, excluding affiliates. This decline of € 3.7 billion led to a volume of € 70.0 billion as of March 31, 2008 and was caused mainly by the poor equity market development which impacted our equity investments down € 3.4 billion to € 13.1 billion.
Of our Property-Casualty asset base, ABS made up € 4.8 billion, as of March 31, 2008, which is around 5%. CDOs accounted for € 0.2 billion of this amount, of which € 1 million are subprime-related. Unrealized losses on CDOs of € 2 million were recorded in our equity.
Property-Casualty liabilities
Reserves for loss and loss adjustment expenses in our Property-Casualty segment decreased by 4.4% to € 54.5 billion. Main contributors to this decline were the change in presentation of two health insurance entities which were previously recorded within the property-casualty segment and are now recorded in the Life/Health segment and foreign currency translation effects.
30
Table of Contents
Allianz Group Interim Report First Quarter of 2008 Group Management Report
Assets and Liabilities of the Life/Health segment
Life/Health assets
Life/Health asset base
fair values1) in€ bn
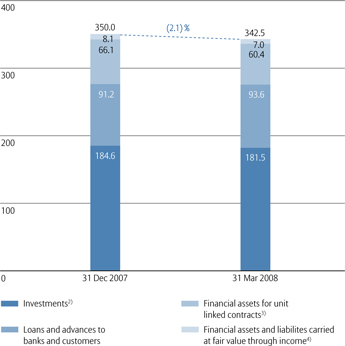
1) | Loans and advances to banks and customers, held-to-maturity investments, and real estate held for investment are stated at amortized cost. Investments in associates and joint ventures are stated at either amortized cost or equity, depending upon, among other factors, our ownership percentage. |
2) | Does not include affiliates of€ 2.9 bn and€ 2.7 bn as of March 31, 2008 and December, 31, 2007, respectively. |
3) | Financial assets for unit-linked contracts represent assets owned by, and managed on the behalf of, policyholders of the Allianz Group, with all appreciation and depreciation in these assets accruing to the benefit of policyholders. As a result, the value of financial assets for unit-linked contracts in our balance sheet corresponds with the value of financial liabilities for unit-linked contracts. |
4) | Includes debt securities of€ 8.0 bn and€ 9.3 bn as of March 31, 2008 and December 31, 2007, respectively, equity securities of€ 3.1 bn and€ 3.3 bn as of March 31, 2008 and December 31, 2007, respectively, and derivative financial instruments of€ (4.1) bn and€ (4.5) bn as of March 31, 2008 and December 31, 2007, respectively. |
In aggregate, our Life/Health asset base declined by 2.1% to € 342.5 billion, stemming primarily from a decrease in our financial assets for unit-linked contracts which were down € 5.7 billion to € 60.4 billion. This development arose from the current market situation which impacted the fair value of our assets in this category. In addition the segment’s investments decreased slightly by 1.7% to € 181.5 billion.
This development was caused mainly by reduced equity exposure (down € 6.7 billion to € 34.5 billion) due to poor equity market conditions.
Within our Life/Health asset base, ABS amounted to € 13.3 billion, as of March 31, 2008, less than 4% of total Life/Health assets. Of these, € 0.2 billion are CDOs of which none are subprime-related. Unrealized losses on CDOs of € 7 million were recorded in our equity.
Life/Health liabilities
Life/Health reserves for insurance and investment contracts were down 1.1% to € 280.1 billion driven mainly by a reduction of premium refund reserves in Germany of € (2.7) billion due to impairments of investments, and foreign currency translations effects of € (3.1) billion from the United States and Korea.
31
Table of Contents
Group Management Report Allianz Group Interim Report First Quarter of 2008
Assets and Liabilities of the Banking segment
Banking loans and advances to banks and customers1)
in€ bn
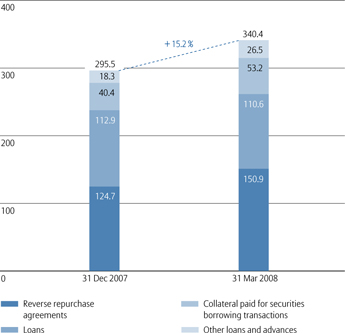
1) | Includes loan loss allowance of€ (0.8) bn and€ (0.8) bn as of March 31, 2008 and December 31, 2007, respectively. |
Banking loans and advances to banks and customers
Loans and advances to banks and customers in our Banking segment were up 15.2% to € 340.4 billion from year-end 2007. This increase was mainly caused by higher volumes of collateralized refinancing activities at Dresdner Bank.
Banking liabilities to banks and customers
Accordingly, liabilities to banks and customers experienced an increase of 16.7% to € 374.0 billion namely in the form of repurchase agreements.
32
Table of Contents
Reconciliation of Consolidated Operating Profit and Income Before Income Taxes and Minority Interests in Earnings
The previous analysis is based on our consolidated financial statements and should be read in conjunction with those statements. The Allianz Group uses operating profit to evaluate the performance of its business segments and the Group as a whole. The Allianz Group considers the presentation of operating profit to be useful and meaningful to investors because it enhances the understanding of the Allianz Group’s underlying operating performance and the comparability of its operating performance over time. Operating profit highlights the portion of income before income taxes and minority interests in earnings attributable to the on-going core operations of the Allianz Group. To better understand the on-going operations of the business, we exclude the effects of acquisition-related expenses and the amortization of intangible assets, as these relate to business combinations; and we exclude interest expense from external debt and non-operating income from financial assets and liabilities carried at fair value through income (net) as these relate to our capital structure.
We believe that trends in the underlying profitability of our business can be more clearly identified without the fluctuating effects of the realized capital gains and losses or impairments of investment securities, as these are largely dependent on market cycles or issuer-specific events over which we have little or no control, and can and do vary, sometimes materially, across periods. Further, the timing of sales that would result in such gains or losses is largely at our discretion.
Similarly, we exclude restructuring charges because the timing of the restructuring charges are largely within our control, and accordingly their exclusion provides additional insight into the operating trends of the underlying business. This differentiation is not made if the profit sources are shared with the policyholder.
Operating profit should be viewed as complementary to, and not a substitute for, income before income taxes and minority interests in earnings or net income as determined in accordance with IFRS.
Reconciliation of operating profit on a consolidated basis to the Allianz Group’s income before income taxes and minority interests in earnings for the three months ended March 31, 2008 and 2007.
| Three months ended March 31, | 2008 € mn | 2007 € mn | ||||||
| Operating profit | 1,856 | 2,870 | ||||||
| Non-operating realized gains/losses (net) and impairments of investments (net) | 254 | 2,045 | ||||||
| Non-operating income from financial assets and liabilities carried at fair value through income (net) | 147 | 34 | ||||||
| Interest expense from external debt | (252) | (222) | ||||||
| Non-operating restructuring charges | 22 | (27) | ||||||
| Acquisition-related expenses | (107) | (122) | ||||||
| Amortization of intangible assets | (5) | (3) | ||||||
| Reclassification of policyholder participation in tax benefits arising in connection with tax-exempt income | (13) | (19) | ||||||
| Income before income taxes and minority interests in earnings | 1,902 | 4,556 |
33
Table of Contents
Group Management Report Allianz Group Interim Report First Quarter of 2008
Composition of Total Revenue Growth
We further believe that an understanding of our total revenue performance is enhanced when the effects of foreign currency translation as well as acquisitions and disposals (or “changes in scope of consolidation”) are excluded. Accordingly, in addition to presenting “nominal growth”, we also present “internal growth”, which excludes the effects of foreign currency translation and changes in scope of consolidation.
Reconciliation of nominal total1) revenue growth to internal total1)revenue growth for the three months ended March 31, 2008
Nominal growth | Changes in scope of consoli- dation | Foreign currency translation | Internal growth | |||||||||||||
| % | % | % | % | |||||||||||||
| Property-Casualty | (2.8) | (0.9) | (1.3) | (0.6) | ||||||||||||
| Life/Health | — | 2.4 | (2.6) | 0.2 | ||||||||||||
| Banking | (63.0) | — | (1.6) | (61.4) | ||||||||||||
thereof: Dresdner Bank | (64.4) | — | (1.6) | (62.8) | ||||||||||||
| Asset Management | (6.8) | (0.4) | (6.9) | 0.5 | ||||||||||||
thereof: Allianz Global Investors | (6.4) | (0.1) | (7.2) | 0.9 | ||||||||||||
| Allianz Group | (5.7) | 0.6 | (2.1) | (4.2) |
1) | Total revenues comprise Property-Casualty segment’s gross premiums written, Life/Health segment’s statutory premiums, Banking segment’s operating revenues and Asset Management segment’s operating revenues. Segment growth rates are presented before the elimination of transactions between Allianz Group companies in different segments. |
34
Table of Contents
Allianz Group Interim Report First Quarter of 2008
Condensed Consolidated Interim Financial Statements Contents
36 | Consolidated Balance Sheets | |||
37 | Consolidated Income Statements | |||
38 | Consolidated Statements of Changes in Equity | |||
39 | Condensed Consolidated Statements of Cash Flows | |||
| Notes to the Condensed Consolidated Interim Financial Statements | ||||
41 | 1 | Basis of presentation | ||
41 | 2 | Changes in the presentation of the condensed consolidated interim financial statements | ||
41 | 3 | Consolidation | ||
42 | 4 | Segment reporting | ||
| Supplementary Information to the Consolidated Balance Sheets | ||||
54 | 5 | Financial assets carried at fair value through income | ||
54 | 6 | Investments | ||
55 | 7 | Loans and advances to banks and customers | ||
55 | 8 | Reinsurance assets | ||
55 | 9 | Deferred acquisition costs | ||
56 | 10 | Other assets | ||
56 | 11 | Intangible assets | ||
56 | 12 | Financial liabilities carried at fair value through income | ||
57 | 13 | Liabilities to banks and customers | ||
57 | 14 | Reserves for loss and loss adjustment expenses | ||
58 | 15 | Reserves for insurance and investment contracts | ||
58 | 16 | Other liabilities | ||
58 | 17 | Certificated liabilities | ||
58 | 18 | Participation certificates and subordinated liabilities | ||
59 | 19 | Equity | ||
35
Table of Contents
Condensed Consolidated Interim Financial Statements Allianz Group Interim Report First Quarter of 2008
Consolidated Balance Sheets
As of March 31, 2008 and as of December 31, 2007
| Note | As of March 31, € mn | As of € mn | ||||||||||
| ASSETS | ||||||||||||
| Cash and cash equivalents | 29,626 | 31,337 | ||||||||||
| Financial assets carried at fair value through income | 5 | 211,472 | 185,461 | |||||||||
| Investments | 6 | 278,865 | 286,952 | |||||||||
| Loans and advances to banks and customers | 7 | 444,764 | 396,702 | |||||||||
| Financial assets for unit linked contracts | 60,425 | 66,060 | ||||||||||
| Reinsurance assets | 8 | 14,540 | 15,312 | |||||||||
| Deferred acquisition costs | 9 | 20,072 | 19,613 | |||||||||
| Deferred tax assets | 4,716 | 4,771 | ||||||||||
| Other assets | 10 | 49,097 | 41,528 | |||||||||
| Intangible assets | 11 | 13,189 | 13,413 | |||||||||
| Total assets | 1,126,766 | 1,061,149 | ||||||||||
| Note | As of March 31, € mn | As of December 31, 2007 € mn | ||||||||||
| LIABILITIES AND EQUITY | ||||||||||||
| Financial liabilities carried at fair value through income | 12 | 147,518 | 126,053 | |||||||||
| Liabilities to banks and customers | 13 | 389,065 | 336,494 | |||||||||
| Unearned premiums | 18,424 | 15,020 | ||||||||||
| Reserves for loss and loss adjustment expenses | 14 | 62,661 | 63,706 | |||||||||
| Reserves for insurance and investment contracts | 15 | 288,892 | 292,244 | |||||||||
| Financial liabilities for unit linked contracts | 60,425 | 66,060 | ||||||||||
| Deferred tax liabilities | 3,985 | 3,973 | ||||||||||
| Other liabilities | 16 | 55,978 | 49,324 | |||||||||
| Certificated liabilities | 17 | 36,453 | 42,070 | |||||||||
| Participation certificates and subordinated liabilities | 18 | 14,877 | 14,824 | |||||||||
| Total liabilities | 1,078,278 | 1,009,768 | ||||||||||
| Shareholders’ equity | 44,981 | 47,753 | ||||||||||
| Minority interests | 3,507 | 3,628 | ||||||||||
| Total equity | 19 | 48,488 | 51,381 | |||||||||
| Total liabilities and equity | 1,126,766 | 1,061,149 | ||||||||||
36
Table of Contents
Allianz Group Interim Report First Quarter of 2008 Condensed Consolidated Interim Financial Statements
Consolidated Income Statements
For the three months ended March 31, 2008 and March 31, 2007
| Three months ended March 31, | Note | 2008 € mn | 2007 € mn | |||||||||
| Premiums written | 19,468 | 19,503 | ||||||||||
| Ceded premiums written | (1,416) | (1,761) | ||||||||||
| Change in unearned premiums | (3,290) | (3,199) | ||||||||||
| Premiums earned (net) | 20 | 14,762 | 14,543 | |||||||||
| Interest and similar income | 21 | 6,410 | 6,266 | |||||||||
| Income from financial assets and liabilities carried at fair value through income (net) | 22 | (52) | 115 | |||||||||
| Realized gains/losses (net) | 23 | 1,327 | 3,209 | |||||||||
| Fee and commission income | 24 | 2,101 | 2,356 | |||||||||
| Other income | 25 | 351 | 93 | |||||||||
| Income from fully consolidated private equity investments | 26 | 579 | 471 | |||||||||
| Total income | 25,478 | 27,053 | ||||||||||
| Claims and insurance benefits incurred (gross) | (11,986) | (12,047) | ||||||||||
| Claims and Insurance benefits incurred (ceded) | 672 | 962 | ||||||||||
| Claims and insurance benefits incurred (net) | 27 | (11,314) | (11,085) | |||||||||
| Change in reserves for insurance and investment contracts (net) | 28 | (1,845) | (2,736) | |||||||||
| Interest expenses | 29 | (1,826) | (1,598) | |||||||||
| Loan loss provisions | 30 | (10) | 2 | |||||||||
| Impairments of investments (net) | 31 | (1,497) | (67) | |||||||||
| Investment expenses | 32 | (437) | (261) | |||||||||
| Acquisition and administrative expenses (net) | 33 | (5,446) | (5,638) | |||||||||
| Fee and commission expenses | 34 | (655) | (634) | |||||||||
| Amortization of intangible assets | (5) | (3) | ||||||||||
| Restructuring charges | 21 | (30) | ||||||||||
| Other expenses | (6) | 13 | ||||||||||
| Expenses from fully consolidated private equity investments | 35 | (556) | (460) | |||||||||
| Total expenses | (23,576) | (22,497) | ||||||||||
| Income before income taxes and minority interests in earnings | 1,902 | 4,556 | ||||||||||
| Income taxes | 36 | (674) | (967) | |||||||||
| Minority interests in earnings | (80) | (349) | ||||||||||
| Net income | 1,148 | 3,240 | ||||||||||
| Three months ended March 31, | Note | 2008 € | 2007 € | |||||||||
| Basic earnings per share | 37 | 2.55 | 7.51 | |||||||||
| Diluted earnings per share | 37 | 2.48 | 7.34 | |||||||||
37
Table of Contents
Condensed Consolidated Interim Financial Statements Allianz Group Interim Report First Quarter of 2008
Consolidated Statements of Changes in Equity
For the three months ended March 31, 2008 and March 31, 2007
Paid-in
| Revenue
| Foreign currency translation adjustments | Unrealized gains and losses (net) | Shareholders’
| Minority
| Total equity
| ||||||||||||||||||||||||||
| € mn | € mn | € mn | € mn | € mn | € mn | € mn | ||||||||||||||||||||||||||
| Balance as of December 31, 2006 | 25,398 | 13,070 | (2,210) | 13,392 | 49,650 | 7,180 | 56,830 | |||||||||||||||||||||||||
| Foreign currency translation adjustments | — | — | (141) | (4) | (145) | (23) | (168) | |||||||||||||||||||||||||
| Available-for-sale investments | ||||||||||||||||||||||||||||||||
Unrealized gains and losses (net) arising during the period | — | — | — | 233 | 233 | (28) | 205 | |||||||||||||||||||||||||
Transferred to net income on disposal | — | — | — | (1,787) | (1,787) | (86) | (1,873) | |||||||||||||||||||||||||
| Cash flow hedges | — | — | — | 5 | 5 | — | 5 | |||||||||||||||||||||||||
| Miscellaneous | — | (84) | — | — | (84) | 7 | (77) | |||||||||||||||||||||||||
| Total income and expense recognized directly in shareholders’ equity | — | (84) | (141) | (1,553) | (1,778) | (130) | (1,908) | |||||||||||||||||||||||||
| Net income | — | 3,240 | — | — | 3,240 | 349 | 3,589 | |||||||||||||||||||||||||
| Total recognized income and expense for the period | — | 3,156 | (141) | (1,553) | 1,462 | 219 | 1,681 | |||||||||||||||||||||||||
| Paid-in capital | — | — | — | — | — | — | — | |||||||||||||||||||||||||
| Treasury shares | — | 348 | — | — | 348 | — | 348 | |||||||||||||||||||||||||
| Transactions between equity holders | — | (6) | — | (2) | (8) | 34 | 26 | |||||||||||||||||||||||||
| Dividends paid | — | — | — | — | — | (23) | (23) | |||||||||||||||||||||||||
| Balance as of March 31, 2007 | 25,398 | 16,568 | (2,351) | 11,837 | 51,452 | 7,410 | 58,862 | |||||||||||||||||||||||||
| Balance as of December 31, 2007 | 28,321 | 12,618 | (3,656) | 10,470 | 47,753 | 3,628 | 51,381 | |||||||||||||||||||||||||
| Foreign currency translation adjustments | — | — | (830) | (2) | (832) | (127) | (959) | |||||||||||||||||||||||||
| Available-for-sale investments | ||||||||||||||||||||||||||||||||
Unrealized gains and losses (net) arising during the period | — | — | — | (2,795) | (2,795) | (35) | (2,830) | |||||||||||||||||||||||||
Transferred to net income on disposal | — | — | — | (142) | (142) | 4 | (138) | |||||||||||||||||||||||||
| Cash flow hedges | — | — | — | 40 | 40 | — | 40 | |||||||||||||||||||||||||
| Miscellaneous | — | (69) | — | — | (69) | (4) | (73) | |||||||||||||||||||||||||
| Total income and expense recognized directly in shareholders’ equity | — | (69) | (830) | (2,899) | (3,798) | (162) | (3,960) | |||||||||||||||||||||||||
| Net income | — | 1,148 | — | — | 1,148 | 80 | 1,228 | |||||||||||||||||||||||||
| Total recognized income and expense for the period | — | 1,079 | (830) | (2,899) | (2,650) | (82) | (2,732) | |||||||||||||||||||||||||
| Paid-in capital | 203 | — | — | — | 203 | — | 203 | |||||||||||||||||||||||||
| Treasury shares | — | (204) | — | — | (204) | — | (204) | |||||||||||||||||||||||||
| Transactions between equity holders | — | (122) | — | 1 | (121) | (4) | (125) | |||||||||||||||||||||||||
| Dividends paid | — | — | — | — | — | (35) | (35) | |||||||||||||||||||||||||
| Balance as of March 31, 2008 | 28,524 | 13,371 | (4,486) | 7,572 | 44,981 | 3,507 | 48,488 |
38
Table of Contents
Allianz Group Interim Report First Quarter of 2008 Condensed Consolidated Interim Financial Statements
Condensed Consolidated Statements of Cash Flows
For the three months ended March 31, 2008 and March 31, 2007
| Three months ended March 31, | 2008 € mn | 2007 € mn | ||||||
| Summary: | ||||||||
| Net cash flow provided by operating activities | 5,608 | 5,065 | ||||||
| Net cash flow used in investing activities | (11,931) | (7,903) | ||||||
| Net cash flow provided by financing activities | 4,630 | 5,534 | ||||||
| Effect of exchange rate changes on cash and cash equivalents | (18) | (14) | ||||||
| Change in cash and cash equivalents | (1,711) | 2,682 | ||||||
| Cash and cash equivalents at beginning of period | 31,337 | 33,031 | ||||||
| Cash and cash equivalents at end of period | 29,626 | 35,713 | ||||||
| Cash flow from operating activities: | ||||||||
| Net income | 1,148 | 3,240 | ||||||
| Adjustments to reconcile net income to net cash flow provided by operating activities | ||||||||
Minority interests in earnings | 80 | 349 | ||||||
Share of earnings from investments in associates and joint ventures | (21) | (259) | ||||||
Realized gains/losses (net) and impairments of investments (net) of: | ||||||||
Available-for-sale and held-to-maturity investments, investments in associates and joint ventures, real estate held for investment, loans to banks and customers | 170 | (3,142) | ||||||
Other investments, mainly financial assets held for trading and designated at fair value through income | (195) | (459) | ||||||
Depreciation and amortization | 139 | 200 | ||||||
Loan loss provision | 10 | (2) | ||||||
Interest credited to policyholder accounts | 879 | 657 | ||||||
Net change in: | ||||||||
Financial assets and liabilities held for trading | (5,843) | 7,597 | ||||||
Reverse repurchase agreements and collateral paid for securities borrowing transactions | (39,585) | (30,887) | ||||||
Repurchase agreements and collateral received from securities lending transactions | 45,425 | 25,798 | ||||||
Reinsurance assets | 210 | 623 | ||||||
Deferred acquisition costs | (744) | (756) | ||||||
Unearned premiums | 3,681 | 3,554 | ||||||
Reserves for losses and loss adjustment expenses | (315) | (1,221) | ||||||
Reserves for insurance and investment contracts | 556 | 1,866 | ||||||
Deferred tax assets/liabilities | 168 | 266 | ||||||
Financial assets designated at fair value through income (only banking) | 988 | (651) | ||||||
Financial liabilities designated at fair value through income (only banking) | (143) | 49 | ||||||
Other (net) | (1,000) | (1,757) | ||||||
Subtotal | 4,460 | 1,825 | ||||||
| Net cash flow provided by operating activities | 5,608 | 5,065 | ||||||
| Cash flow from investing activities: | ||||||||
| Proceeds from the sale, maturity or repayment of: | ||||||||
Financial assets designated at fair value through income | 754 | 1,813 | ||||||
Available-for-sale investments | 26,144 | 42,628 | ||||||
Held-to-maturity investments | 64 | 80 | ||||||
Investments in associates and joint ventures | 384 | 262 | ||||||
Non-current assets and disposal groups held for sale | 2,155 | — | ||||||
Real estate held for investment | 247 | 177 | ||||||
Loans and advances to banks and customers (purchased loans) | 986 | 2,519 | ||||||
Property and equipment | 186 | 188 | ||||||
Subtotal | 30,920 | 47,667 |
39
Table of Contents
Condensed Consolidated Interim Financial Statements Allianz Group Interim Report First Quarter of 2008
| Three months ended March 31, | 2008 € mn | 2007 € mn | ||||||
| Payments for the purchase or origination of: | ||||||||
Financial assets designated at fair value through income | (1,042) | (2,139) | ||||||
Available-for-sale investments | (29,687) | (44,048) | ||||||
Held-to-maturity investments | (135) | (59) | ||||||
Investments in associates and joint ventures | (261) | (593) | ||||||
Non-current assets and disposal groups held for sale | (10) | — | ||||||
Real estate held for investment | (45) | (20) | ||||||
Loans and advances to banks and customers (purchased loans) | (1,784) | (3,903) | ||||||
Property and equipment | (214) | (139) | ||||||
Subtotal | (33,178) | (50,901) | ||||||
| Business combinations: | ||||||||
Acquisitions of subsidiaries, net of cash acquired | — | (507) | ||||||
| Change in other loans and advances to banks and customers (originated loans) | (9,478) | (4,038) | ||||||
| Other (net) | (195) | (124) | ||||||
| Net cash flow used in investing activities | (11,931) | (7,903) | ||||||
| Cash flow from financing activities: | ||||||||
| Policyholders’ account deposits | 4,369 | 3,024 | ||||||
| Policyholders’ account withdrawals | (2,735) | (2,533) | ||||||
| Net change in liabilities to banks and customers | 7,207 | 6,139 | ||||||
| Proceeds from the issuance of certificated liabilities, participation certificates and subordinated liabilities | 12,375 | 25,541 | ||||||
| Repayments of certificated liabilities, participation certificates and subordinated liabilities | (16,155) | (26,599) | ||||||
| Cash inflow from capital increases | 203 | — | ||||||
| Transactions between equity holders | (125) | 21 | ||||||
| Dividends paid to shareholders | (35) | (23) | ||||||
| Net cash from sale or purchase of treasury shares | (56) | 189 | ||||||
| Other (net) | (418) | (225) | ||||||
| Net cash flow provided by financing activities | 4,630 | 5,534 |
40
Table of Contents
Allianz Group Interim Report First Quarter of 2008 Notes to the Condensed Consolidated Interim Financial Statements
Notes to the Condensed Consolidated Interim Financial Statements
Basis of presentation
The condensed consolidated interim financial statements of the Allianz Group – comprising the consolidated balance sheet, income statement, condensed cash flow statement, statement of changes in equity and selected explanatory notes – are presented in accordance with the requirements of IAS 34, Interim Financial Reporting, and have been prepared in accordance with International Financial Reporting Standards (“IFRS”), as adopted under European Union (“EU”) regulations in accordance with section 315a of the German Commercial Code (“HGB”). The condensed consolidated interim financial statements of the Allianz Group have also been prepared in accordance with IFRS as issued by the International Accounting Standard Board (“IASB”). The Allianz Group’s application of IFRS results in no differences between IFRS as adopted by the EU and IFRS as issued by the IASB.
The condensed consolidated interim financial statements comply with all new or amended IFRS, where application is compulsory for the first time for periods beginning on January 1, 2008. See Note 2 regarding changes to IFRS effective January 1, 2008.
For existing and unchanged IFRS the accounting policies for recognition, measurement, consolidation and presentation applied in the preparation of the condensed consolidated interim financial statements are consistent with the accounting policies that have been applied in the preparation of the consolidated financial statements for the year ended December 31, 2007.
IFRS do not provide specific guidance concerning all aspects of the recognition and measurement of insurance and reinsurance contracts. Therefore, as envisioned in IAS 8, Accounting Policies, Changes in Accounting Estimates and Errors, the provisions embodied under accounting principles generally accepted in the United States of America (“US GAAP”) have been applied to those aspects where specific guidance is not provided by IFRS 4, Insurance Contracts.
The condensed consolidated interim financial statements are presented in millions of Euro (€mn).
2 Changes in the presentation of the condensed consolidated interim financial statements
As presented in the Notes to the Allianz Group´s consolidated financial statements for the year ended December 31, 2007, the Allianz Group identified certain prior period errors in 2007. The Allianz Group evaluated the errors individually and in the aggregate, and concluded that they were immaterial to the consolidated financial statements for all years in which they were included, and the Allianz Group corrected the errors in the 2007 consolidated financial statements. The impact of the corrections to these condensed consolidated interim financial statements was an adjustment in the consolidated statement of changes in equity to the following line items.
| As of March 31, 2007 € mn | ||||
| Shareholders’ equity | ||||
Revenue reserves | (559) | |||
Unrealized gains and losses (net) | (272) | |||
Subtotal | (831) | |||
| Minority interests | 771 | |||
| Total equity | (60) |
Reclassifications
Certain prior period amounts have been reclassified to conform to the current period presentation.
Scope of consolidation
Effective March 18, 2008, K2 was fully consolidated and included in the condensed consolidated interim financial statement of the Allianz Group for the first quarter ended March 31, 2008.
The Allianz Group presented out of the total assets and total liabilities of €10,537 mn each, assets of €8,665 mn within other assets and liabilities of €8,889 mn within other liabilities on a provisional basis in the consolidated balance sheet as of March 31, 2008. During the 2nd quarter of 2008 the Allianz Group will finalize the classification of these assets and liabilities.
41
Table of Contents
Notes to the Condensed Consolidated Interim Financial Statements Allianz Group Interim Report First Quarter of 2008
Allianz Group
Business Segment Information – Consolidated Balance Sheets
As of March 31, 2008 and as of December 31, 2007
| Property-Casualty | Life/Health | |||||||||||||||
As of March 31, 2008 € mn | As of December 31, 2007 € mn | As of March 31, 2008 € mn | As of December 31, 2007 € mn | |||||||||||||
| ASSETS | ||||||||||||||||
| Cash and cash equivalents | 5,431 | 4,985 | 10,543 | 8,779 | ||||||||||||
| Financial assets carried at fair value through income | 2,863 | 3,302 | 11,670 | 13,216 | ||||||||||||
| Investments | 79,840 | 83,741 | 184,384 | 187,289 | ||||||||||||
| Loans and advances to banks and customers | 19,030 | 20,712 | 93,640 | 91,188 | ||||||||||||
| Financial assets for unit linked contracts | — | — | 60,425 | 66,060 | ||||||||||||
| Reinsurance assets | 9,671 | 10,317 | 4,914 | 5,043 | ||||||||||||
| Deferred acquisition costs | 4,028 | 3,681 | 15,892 | 15,838 | ||||||||||||
| Deferred tax assets | 1,499 | 1,442 | 221 | 316 | ||||||||||||
| Other assets | 26,531 | 21,864 | 14,547 | 14,071 | ||||||||||||
| Intangible assets | 2,312 | 2,332 | 2,209 | 2,218 | ||||||||||||
| Total assets | 151,205 | 152,376 | 398,445 | 404,018 | ||||||||||||
| Property-Casualty | Life/Health | |||||||||||||||
As of March 31, € mn | As of December € mn | As of March 31, € mn | As of December € mn | |||||||||||||
| LIABILITIES AND EQUITY | ||||||||||||||||
| Financial liabilities carried at fair value through income | 47 | 96 | 4,665 | 5,147 | ||||||||||||
| Liabilities to banks and customers | 6,401 | 6,865 | 7,861 | 6,078 | ||||||||||||
| Unearned premiums | 16,351 | 13,163 | 2,074 | 1,858 | ||||||||||||
| Reserves for loss and loss adjustment expenses | 54,451 | 56,943 | 8,218 | 6,773 | ||||||||||||
| Reserves for insurance and investment contracts | 8,711 | 8,976 | 280,087 | 283,139 | ||||||||||||
| Financial liabilities for unit linked contracts | — | — | 60,425 | 66,060 | ||||||||||||
| Deferred tax liabilities | 2,534 | 2,606 | 815 | 946 | ||||||||||||
| Other liabilities | 24,178 | 22,989 | 17,896 | 17,741 | ||||||||||||
| Certificated liabilities | 155 | 158 | 3 | 3 | ||||||||||||
| Participation certificates and subordinated liabilities | 903 | 905 | 65 | 60 | ||||||||||||
| Total liabilities | 113,731 | 112,701 | 382,109 | 387,805 | ||||||||||||
42
Table of Contents
Allianz Group Interim Report First Quarter of 2008 Notes to the Condensed Consolidated Interim Financial Statements
| Banking | Asset Management | Corporate | Consolidation | Group | ||||||||||||||||||||||||||||||||
As of € mn | As of December 31, € mn | As of March 31, 2008 € mn | As of December 31, € mn | As of March 31, 2008 € mn | As of December 31, € mn | As of March 31, 2008 € mn | As of December 31, € mn | As of March 31, 2008 € mn | As of December 31, € mn | |||||||||||||||||||||||||||
| 13,057 | 17,307 | 666 | 770 | 540 | 445 | (611) | (949) | 29,626 | 31,337 | |||||||||||||||||||||||||||
| 196,538 | 168,339 | 849 | 980 | 529 | 887 | (977) | (1,263) | 211,472 | 185,461 | |||||||||||||||||||||||||||
| 16,318 | 16,284 | 884 | 879 | 102,729 | 102,894 | (105,290) | (104,135) | 278,865 | 286,952 | |||||||||||||||||||||||||||
| 340,442 | 295,506 | 594 | 469 | 5,465 | 4,754 | (14,407) | (15,927) | 444,764 | 396,702 | |||||||||||||||||||||||||||
| — | — | — | — | — | — | — | — | 60,425 | 66,060 | |||||||||||||||||||||||||||
| — | — | — | — | — | — | (45) | (48) | 14,540 | 15,312 | |||||||||||||||||||||||||||
| — | — | 152 | 94 | — | — | — | — | 20,072 | 19,613 | |||||||||||||||||||||||||||
| 1,605 | 1,733 | 157 | 161 | 1,007 | 935 | 227 | 184 | 4,716 | 4,771 | |||||||||||||||||||||||||||
| 17,126 | 8,203 | 3,263 | 3,452 | 9,427 | 10,786 | (21,797) | (16,848) | 49,097 | 41,528 | |||||||||||||||||||||||||||
| 2,374 | 2,379 | 6,040 | 6,227 | 254 | 257 | — | — | 13,189 | 13,413 | |||||||||||||||||||||||||||
| 587,460 | 509,751 | 12,605 | 13,032 | 119,951 | 120,958 | (142,900) | (138,986) | 1,126,766 | 1,061,149 | |||||||||||||||||||||||||||
| Banking | Asset Management | Corporate | Consolidation | Group | ||||||||||||||||||||||||||||||||
As of € mn | As of December 31, € mn | As of March 31, 2008 € mn | As of December 31, € mn | As of March 31, 2008 € mn | As of December 31, € mn | As of March 31, 2008 € mn | As of December 31, € mn | As of March 31, 2008 € mn | As of December 31, € mn | |||||||||||||||||||||||||||
| 142,738 | 120,383 | — | — | 744 | 1,376 | (676) | (949) | 147,518 | 126,053 | |||||||||||||||||||||||||||
| 374,022 | 320,388 | 959 | 807 | 8,366 | 13,023 | (8,544) | (10,667) | 389,065 | 336,494 | |||||||||||||||||||||||||||
| — | — | — | — | — | — | (1) | (1) | 18,424 | 15,020 | |||||||||||||||||||||||||||
| — | — | — | — | — | — | (8) | (10) | 62,661 | 63,706 | |||||||||||||||||||||||||||
| — | — | — | — | 322 | 358 | (228) | (229) | 288,892 | 292,244 | |||||||||||||||||||||||||||
| — | — | — | — | — | — | — | — | 60,425 | 66,060 | |||||||||||||||||||||||||||
| 105 | 102 | 49 | 35 | 257 | 88 | 225 | 196 | 3,985 | 3,973 | |||||||||||||||||||||||||||
| 19,313 | 11,011 | 2,911 | 3,647 | 19,683 | 14,625 | (28,003) | (20,689) | 55,978 | 49,324 | |||||||||||||||||||||||||||
| 29,209 | 34,778 | — | — | 9,589 | 9,567 | (2,503) | (2,436) | 36,453 | 42,070 | |||||||||||||||||||||||||||
| 8,034 | 7,966 | 14 | 14 | 7,048 | 7,069 | (1,187) | (1,190) | 14,877 | 14,824 | |||||||||||||||||||||||||||
| 573,421 | 494,628 | 3,933 | 4,503 | 46,009 | 46,106 | (40,925) | (35,975) | 1,078,278 | 1,009,768 | |||||||||||||||||||||||||||
| Total equity | 48,488 | 51,381 | ||||||||||||||||||||||||||||||||||
| Total liabilities and equity | 1,126,766 | 1,061,149 | ||||||||||||||||||||||||||||||||||
43
Table of Contents
Notes to the Condensed Consolidated Interim Financial Statements Allianz Group Interim Report First Quarter of 2008
Allianz Group
Business Segment Information – Consolidated Income Statements
For the three months ended March 31, 2008 and March 31, 2007
| Property-Casualty | Life/Health | |||||||||||||||
| Three months ended March 31, | 2008 € mn | 2007 € mn | 2008 € mn | 2007 € mn | ||||||||||||
| Premiums written | 13,710 | 14,111 | 5,764 | 5,395 | ||||||||||||
| Ceded premiums written | (1,285) | (1,586) | (137) | (178) | ||||||||||||
| Change in unearned premiums | (3,252) | (3,167) | (38) | (32) | ||||||||||||
| Premiums earned (net) | 9,173 | 9,358 | 5,589 | 5,185 | ||||||||||||
| Interest and similar income | 1,051 | 1,006 | 3,200 | 3,155 | ||||||||||||
| Income from financial assets and liabilities carried at fair value through income (net) | 77 | (12) | 242 | (310) | ||||||||||||
| Realized gains/losses (net) | 369 | 767 | 661 | 1,193 | ||||||||||||
| Fee and commission income | 267 | 272 | 171 | 171 | ||||||||||||
| Other income | 250 | 84 | 110 | 54 | ||||||||||||
| Income from fully consolidated private equity investments | — | — | — | — | ||||||||||||
| Total income | 11,187 | 11,475 | 9,973 | 9,448 | ||||||||||||
| Claims and insurance benefits incurred (gross) | (6,858) | (7,174) | (5,130) | (4,878) | ||||||||||||
| Claims and insurance benefits incurred (ceded) | 557 | 791 | 117 | 176 | ||||||||||||
| Claims and insurance benefits incurred (net) | (6,301) | (6,383) | (5,013) | (4,702) | ||||||||||||
| Change in reserves for insurance and investment contracts (net) | (29) | (81) | (1,803) | (2,624) | ||||||||||||
| Interest expenses | (88) | (92) | (70) | (91) | ||||||||||||
| Loan loss provisions | — | — | 2 | (3) | ||||||||||||
| Impairments of investments (net) | (435) | (26) | (984) | (37) | ||||||||||||
| Investment expenses | (123) | (74) | (328) | (196) | ||||||||||||
| Acquisition and administrative expenses (net) | (2,391) | (2,675) | (1,108) | (874) | ||||||||||||
| Fee and commission expenses | (248) | (197) | (60) | (62) | ||||||||||||
| Amortization of intangible assets | (4) | (2) | (1) | (1) | ||||||||||||
| Restructuring charges | 6 | (14) | (1) | (5) | ||||||||||||
| Other expenses | — | — | — | — | ||||||||||||
| Expenses from fully consolidated private equity investments | — | — | — | — | ||||||||||||
| Total expenses | (9,613) | (9,544) | (9,366) | (8,595) | ||||||||||||
| Income (loss) before income taxes and minority interests in earnings | 1,574 | 1,931 | 607 | 853 | ||||||||||||
| Income taxes | (478) | (537) | (136) | (201) | ||||||||||||
| Minority interests in earnings | (39) | (214) | (19) | (99) | ||||||||||||
| Net income (loss) | 1,057 | 1,180 | 452 | 553 | ||||||||||||
44
Table of Contents
Allianz Group Interim Report First Quarter of 2008 Notes to the Condensed Consolidated Interim Financial Statements
| Banking | Asset Management | Corporate | Consolidation | Group | ||||||||||||||||||||||||||||||||
2008 € mn | 2007 € mn | 2008 € mn | 2007 € mn | 2008 € mn | 2007 € mn | 2008 € mn | 2007 € mn | 2008 € mn | 2007 € mn | |||||||||||||||||||||||||||
| — | — | — | — | — | — | (6) | (3) | 19,468 | 19,503 | |||||||||||||||||||||||||||
| — | — | — | — | — | — | 6 | 3 | (1,416) | (1,761) | |||||||||||||||||||||||||||
| — | — | — | — | — | — | — | — | (3,290) | (3,199) | |||||||||||||||||||||||||||
| — | — | — | — | — | — | — | — | 14,762 | 14,543 | |||||||||||||||||||||||||||
| 2,238 | 2,209 | 28 | 33 | 230 | 154 | (337) | (291) | 6,410 | 6,266 | |||||||||||||||||||||||||||
| (562) | 341 | (4) | 7 | 208 | 85 | (13) | 4 | (52) | 115 | |||||||||||||||||||||||||||
| 62 | 139 | 8 | 2 | (16) | 640 | 243 | 468 | 1,327 | 3,209 | |||||||||||||||||||||||||||
| 784 | 978 | 986 | 1,073 | 65 | 45 | (172) | (183) | 2,101 | 2,356 | |||||||||||||||||||||||||||
| — | — | 5 | 4 | 1 | 5 | (15) | (54) | 351 | 93 | |||||||||||||||||||||||||||
| — | — | — | — | 579 | 471 | — | — | 579 | 471 | |||||||||||||||||||||||||||
| 2,522 | 3,667 | 1,023 | 1,119 | 1,067 | 1,400 | (294) | (56) | 25,478 | 27,053 | |||||||||||||||||||||||||||
| — | — | — | — | — | — | 2 | 5 | (11,986) | (12,047) | |||||||||||||||||||||||||||
| — | — | — | — | — | — | (2) | (5) | 672 | 962 | |||||||||||||||||||||||||||
| — | — | — | — | — | — | — | — | (11,314) | (11,085) | |||||||||||||||||||||||||||
| — | — | — | — | — | — | (13) | (31) | (1,845) | (2,736) | |||||||||||||||||||||||||||
| (1,542) | (1,281) | (9) | (11) | (425) | (353) | 308 | 230 | (1,826) | (1,598) | |||||||||||||||||||||||||||
| (12) | 5 | — | — | — | — | — | — | (10) | 2 | |||||||||||||||||||||||||||
| (30) | (13) | (3) | — | (45) | 9 | — | — | (1,497) | (67) | |||||||||||||||||||||||||||
| 2 | (9) | 1 | 1 | (44) | (34) | 55 | 51 | (437) | (261) | |||||||||||||||||||||||||||
| (1,218) | (1,410) | (606) | (590) | (146) | (117) | 23 | 28 | (5,446) | (5,638) | |||||||||||||||||||||||||||
| (140) | (146) | (280) | (327) | (29) | (35) | 102 | 133 | (655) | (634) | |||||||||||||||||||||||||||
| — | — | — | — | — | — | — | — | (5) | (3) | |||||||||||||||||||||||||||
| 16 | (9) | — | (2) | — | — | — | — | 21 | (30) | |||||||||||||||||||||||||||
| (6) | 13 | — | — | — | — | — | — | (6) | 13 | |||||||||||||||||||||||||||
| — | — | — | — | (556) | (460) | — | — | (556) | (460) | |||||||||||||||||||||||||||
| (2,930) | (2,850) | (897) | (929) | (1,245) | (990) | 475 | 411 | (23,576) | (22,497) | |||||||||||||||||||||||||||
| (408) | 817 | 126 | 190 | (178) | 410 | 181 | 355 | 1,902 | 4,556 | |||||||||||||||||||||||||||
| (116) | (168) | (46) | (80) | 86 | (25) | 16 | 44 | (674) | (967) | |||||||||||||||||||||||||||
| (14) | (24) | (2) | (11) | (7) | (4) | 1 | 3 | (80) | (349) | |||||||||||||||||||||||||||
| (538) | 625 | 78 | 99 | (99) | 381 | 198 | 402 | 1,148 | 3,240 | |||||||||||||||||||||||||||
45
Table of Contents
Notes to the Condensed Consolidated Interim Financial Statements Allianz Group Interim Report First Quarter of 2008
Allianz Group
Business Segment Information – Total revenues and reconciliation of
Operating Profit and Net Income for the three months ended March 31, 2008
and March 31, 2007
| Property-Casualty1) | Life/Health1) | |||||||||||||||
| Three months ended March 31, | 2008 € mn | 2007 € mn | 2008 € mn | 2007 € mn | ||||||||||||
| Total revenues2) | 13,710 | 14,111 | 12,327 | 12,326 | ||||||||||||
| Premiums earned (net) | 9,173 | 9,358 | 5,589 | 5,185 | ||||||||||||
| Interest and similar income | 1,051 | 1,006 | 3,200 | 3,155 | ||||||||||||
| Operating income from financial assets and liabilities carried at fair value through income (net) | 14 | 17 | 231 | (311) | ||||||||||||
| Operating realized gains/losses (net) | (3) | 34 | 649 | 1,088 | ||||||||||||
| Fee and commission income | 267 | 272 | 171 | 171 | ||||||||||||
| Other income | 250 | 84 | 110 | 54 | ||||||||||||
| Income from fully consolidated private equity investments | — | — | — | — | ||||||||||||
| Claims and insurance benefits incurred (net) | (6,301) | (6,383) | (5,013) | (4,702) | ||||||||||||
| Change in reserves for insurance and investment contracts (net) | (29) | (81) | (1,803) | (2,624) | ||||||||||||
| Interest expenses, excluding interest expenses from external debt | (88) | (92) | (70) | (91) | ||||||||||||
| Loan loss provisions | — | — | 2 | (3) | ||||||||||||
| Operating impairments of investments (net) | (93) | (2) | (980) | (37) | ||||||||||||
| Investment expenses | (123) | (74) | (328) | (196) | ||||||||||||
| Acquisition and administrative expenses (net), excluding acquisition-related expenses | (2,391) | (2,675) | (1,108) | (874) | ||||||||||||
| Fee and commission expenses | (248) | (197) | (60) | (62) | ||||||||||||
| Operating restructuring charges | — | — | (1) | (3) | ||||||||||||
| Other expenses | — | — | — | — | ||||||||||||
| Expenses from fully consolidated private equity investments | — | — | — | — | ||||||||||||
| Reclassification of tax benefits | — | — | — | — | ||||||||||||
| Operating profit (loss) | 1,479 | 1,267 | 589 | 750 | ||||||||||||
| Non-operating income from financial assets and liabilities carried at fair value through income (net) | 63 | (29) | 11 | 1 | ||||||||||||
| Non-operating realized gains/losses (net) | 372 | 733 | 12 | 105 | ||||||||||||
| Non-operating impairments of investments (net) | (342) | (24) | (4) | — | ||||||||||||
| Interest expenses from external debt | — | — | — | — | ||||||||||||
| Acquisition-related expenses | — | — | — | — | ||||||||||||
| Amortization of intangible assets | (4) | (2) | (1) | (1) | ||||||||||||
| Non-operating restructuring charges | 6 | (14) | — | (2) | ||||||||||||
| Reclassification of tax benefits | — | — | — | — | ||||||||||||
| Non-operating items | 95 | 664 | 18 | 103 | ||||||||||||
| Income (loss) before income taxes and minority interests in earnings | 1,574 | 1,931 | 607 | 853 | ||||||||||||
| Income taxes | (478) | (537) | (136) | (201) | ||||||||||||
| Minority interests in earnings | (39) | (214) | (19) | (99) | ||||||||||||
| Net income (loss) | 1,057 | 1,180 | 452 | 553 | ||||||||||||
1) | Effective 1Q 2008, health business in Belgium and France is shown within Life/Health segment. Prior year balances have not been adjusted. |
2) | Total revenues comprise Property-Casualty segment’s gross premiums written, Life/Health segment’s statutory premiums, Banking segment’s operating revenues and Asset Management segment’s operating revenues. |
46
Table of Contents
Allianz Group Interim Report First Quarter of 2008 Notes to the Condensed Consolidated Interim Financial Statements
| Banking | Asset Management | Corporate | Consolidation | Group | ||||||||||||||||||||||||||||||||
2008 € mn | 2007 € mn | 2008 € mn | 2007 € mn | 2008 € mn | 2007 € mn | 2008 € mn | 2007 € mn | 2008 € mn | 2007 € mn | |||||||||||||||||||||||||||
| 778 | 2,101 | 727 | 780 | — | — | 111 | 5 | 27,653 | 29,323 | |||||||||||||||||||||||||||
| — | — | — | — | — | — | — | — | 14,762 | 14,543 | |||||||||||||||||||||||||||
| 2,238 | 2,209 | 28 | 33 | 230 | 154 | (337) | (291) | 6,410 | 6,266 | |||||||||||||||||||||||||||
| (562) | 341 | (4) | 7 | 10 | 1 | 112 | 26 | (199) | 81 | |||||||||||||||||||||||||||
| — | — | — | — | — | — | 3 | 14 | 649 | 1,136 | |||||||||||||||||||||||||||
| 784 | 978 | 986 | 1,073 | 65 | 45 | (172) | (183) | 2,101 | 2,356 | |||||||||||||||||||||||||||
| — | — | 5 | 4 | 1 | 5 | (15) | (54) | 351 | 93 | |||||||||||||||||||||||||||
| — | — | — | — | 579 | 471 | — | — | 579 | 471 | |||||||||||||||||||||||||||
| — | — | — | — | — | — | — | — | (11,314) | (11,085) | |||||||||||||||||||||||||||
| — | — | — | — | — | — | (13) | (31) | (1,845) | (2,736) | |||||||||||||||||||||||||||
| (1,542) | (1,281) | (9) | (11) | (173) | (131) | 308 | 230 | (1,574) | (1,376) | |||||||||||||||||||||||||||
| (12) | 5 | — | — | — | — | — | — | (10) | 2 | |||||||||||||||||||||||||||
| — | — | — | — | — | — | — | — | (1,073) | (39) | |||||||||||||||||||||||||||
| 2 | (9) | 1 | 1 | (44) | (34) | 55 | 51 | (437) | (261) | |||||||||||||||||||||||||||
| (1,218) | (1,410) | (486) | (468) | (159) | (117) | 23 | 28 | (5,339) | (5,516) | |||||||||||||||||||||||||||
| (140) | (146) | (280) | (327) | (29) | (35) | 102 | 133 | (655) | (634) | |||||||||||||||||||||||||||
| — | — | — | — | — | — | — | — | (1) | (3) | |||||||||||||||||||||||||||
| (6) | 13 | — | — | — | — | — | — | (6) | 13 | |||||||||||||||||||||||||||
| — | — | — | — | (556) | (460) | — | — | (556) | (460) | |||||||||||||||||||||||||||
| — | — | — | — | — | — | 13 | 19 | 13 | 19 | |||||||||||||||||||||||||||
| (456) | 700 | 241 | 312 | (76) | (101) | 79 | (58) | 1,856 | 2,870 | |||||||||||||||||||||||||||
| — | — | — | — | 198 | 84 | (125) | (22) | 147 | 34 | |||||||||||||||||||||||||||
| 62 | 139 | 8 | 2 | (16) | 640 | 240 | 454 | 678 | 2,073 | |||||||||||||||||||||||||||
| (30) | (13) | (3) | — | (45) | 9 | — | — | (424) | (28) | |||||||||||||||||||||||||||
| — | — | — | — | (252) | (222) | — | — | (252) | (222) | |||||||||||||||||||||||||||
| — | — | (120) | (122) | 13 | — | — | — | (107) | (122) | |||||||||||||||||||||||||||
| — | — | — | — | — | — | — | — | (5) | (3) | |||||||||||||||||||||||||||
| 16 | (9) | — | (2) | — | — | — | — | 22 | (27) | |||||||||||||||||||||||||||
| — | — | — | — | — | — | (13) | (19) | (13) | (19) | |||||||||||||||||||||||||||
| 48 | 117 | (115) | (122) | (102) | 511 | 102 | 413 | 46 | 1,686 | |||||||||||||||||||||||||||
| (408) | 817 | 126 | 190 | (178) | 410 | 181 | 355 | 1,902 | 4,556 | |||||||||||||||||||||||||||
| (116) | (168) | (46) | (80) | 86 | (25) | 16 | 44 | (674) | (967) | |||||||||||||||||||||||||||
| (14) | (24) | (2) | (11) | (7) | (4) | 1 | 3 | (80) | (349) | |||||||||||||||||||||||||||
| (538) | 625 | 78 | 99 | (99) | 381 | 198 | 402 | 1,148 | 3,240 | |||||||||||||||||||||||||||
47
Table of Contents
Notes to the Condensed Consolidated Interim Financial Statements Allianz Group Interim Report First Quarter of 2008
Operating Profit
The Allianz Group uses operating profit to evaluate the performance of its business segments and the Group as a whole. The Allianz Group considers the presentation of operating profit to be useful and meaningful to investors because it enhances the understanding of the Allianz Group’s underlying operating performance and the comparability of its operating performance over time. Operating profit highlights the portion of income before income taxes and minority interests in earnings attributable to the ongoing core operations of the Allianz Group. To better understand the on-going operations of the business, we exclude the effects of acquisition-related expenses and the amortization of intangible assets, as these relate to business combinations; and we exclude interest expense from external debt and non-operating income from financial assets and liabilities carried at fair value through income (net) as these relate to our capital structure.
The Allianz Group believes that trends in the underlying profitability of it´s business can be more clearly identified without the fluctuating effects of the realized capital gains and losses or impairments of investment securities, as these are largely dependent on market cycles or issuer-specific events over which the Allianz Group has little or no control, and can and do vary, sometimes materially, across periods. Further, the timing of sales that would result in such gains or losses is largely at the discretion of the Allianz Group. Similarly, restructuring charges are excluded because the timing of the restructuring charges are largely within the control of the Allianz Group, and accordingly their exclusion provides additional insight into the operating trends of the underlying business. This differentiation is not made if the profit sources are shared with policyholders.
Operating profit should be viewed as complementary to, and not a substitute for, income before income taxes and minority interests in earnings or net income as determined in accordance with IFRS.
48
Table of Contents
Allianz Group Interim Report First Quarter of 2008 Notes to the Condensed Consolidated Interim Financial Statements
Property-Casualty Segment1)
| Three months ended March 31, | 2008 € mn | 2007 € mn | ||||||
| Gross premiums written2) | 13,710 | 14,111 | ||||||
| Ceded premiums written | (1,285) | (1,586) | ||||||
| Change in unearned premiums | (3,252) | (3,167) | ||||||
| Premiums earned (net) | 9,173 | 9,358 | ||||||
| Interest and similar income | 1,051 | 1,006 | ||||||
| Operating income from financial assets and liabilities carried at fair value through income (net)3) | 14 | 17 | ||||||
| Operating realized gains/losses (net)4) | (3) | 34 | ||||||
| Fee and commission income | 267 | 272 | ||||||
| Other income | 250 | 84 | ||||||
| Operating revenues | 10,752 | 10,771 | ||||||
| Claims and insurance benefits incurred (net) | (6,301) | (6,383) | ||||||
| Changes in reserves for insurance and investment contracts (net) | (29) | (81) | ||||||
| Interest expenses | (88) | (92) | ||||||
| Operating impairments of investments (net)5) | (93) | (2) | ||||||
| Investment expenses | (123) | (74) | ||||||
| Acquisition and administrative expenses (net) | (2,391) | (2,675) | ||||||
| Fee and commission expenses | (248) | (197) | ||||||
| Operating expenses | (9,273) | (9,504) | ||||||
| Operating profit | 1,479 | 1,267 | ||||||
| Non-operating income from financial assets and liabilities carried at fair value through income (net)3) | 63 | (29) | ||||||
| Non-operating realized gains/losses (net)4) | 372 | 733 | ||||||
| Non-operating impairments of investments (net)5) | (342) | (24) | ||||||
| Amortization of intangible assets | (4) | (2) | ||||||
| Restructuring charges | 6 | (14) | ||||||
| Non-operating items | 95 | 664 | ||||||
| Income before income taxes and minority interests in earnings | 1,574 | 1,931 | ||||||
| Income taxes | (478) | (537) | ||||||
| Minority interests in earnings | (39) | (214) | ||||||
| Net income | 1,057 | 1,180 | ||||||
| Loss ratio6)in % | 68.7 | 68.2 | ||||||
| Expense ratio7)in % | 26.1 | 28.6 | ||||||
| Combined ratio8)in % | 94.8 | 96.8 |
1) | Effective 1Q 2008, health business in Belgium and France is shown within Life/Health segment. Prior year balances have not been adjusted. |
2) | For the Property-Casualty segment, total revenues are measured based upon gross premiums written. |
3) | The total of these items equals income from financial assets and liabilities carried at fair value through income (net) in the segment income statement. |
4) | The total of these items equals realized gains/losses (net) in the segment income statement. |
5) | The total of these items equals impairments of investments (net) in the segment income statement. |
6) | Represents claims and insurance benefits incurred (net) divided by premiums earned (net). |
7) | Represents acquisition and administrative expenses (net) divided by premiums earned (net). |
8) | Represents the total of acquisition and administrative expenses (net) and claims and insurance benefits incurred (net) divided by premiums earned (net). |
49
Table of Contents
Notes to the Condensed Consolidated Interim Financial Statements Allianz Group Interim Report First Quarter of 2008
Life/Health Segment1)
| Three months ended March 31, | 2008 € mn | 2007 € mn | ||||||
| Statutory premiums2) | 12,327 | 12,326 | ||||||
| Ceded premiums written | (143) | (193) | ||||||
| Change in unearned premiums | (37) | (27) | ||||||
| Statutory premiums (net) | 12,147 | 12,106 | ||||||
| Deposits from SFAS 97 insurance and investment contracts | (6,558) | (6,921) | ||||||
| Premiums earned (net) | 5,589 | 5,185 | ||||||
| Interest and similar income | 3,200 | 3,155 | ||||||
| Operating income from financial assets and liabilities carried at fair value through income (net)3) | 231 | (311) | ||||||
| Operating realized gains/losses (net)4) | 649 | 1,088 | ||||||
| Fee and commission income | 171 | 171 | ||||||
| Other income | 110 | 54 | ||||||
| Operating revenues | 9,950 | 9,342 | ||||||
| Claims and insurance benefits incurred (net) | (5,013) | (4,702) | ||||||
| Changes in reserves for insurance and investment contracts (net) | (1,803) | (2,624) | ||||||
| Interest expenses | (70) | (91) | ||||||
| Loan loss provisions | 2 | (3) | ||||||
| Operating impairments of investments (net)5) | (980) | (37) | ||||||
| Investment expenses | (328) | (196) | ||||||
| Acquisition and administrative expenses (net) | (1,108) | (874) | ||||||
| Fee and commission expenses | (60) | (62) | ||||||
| Operating restructuring charges6) | (1) | (3) | ||||||
| Operating expenses | (9,361) | (8,592) | ||||||
| Operating profit | 589 | 750 | ||||||
| Non-operating income from financial assets and liabilities carried at fair value through income (net)3) | 11 | 1 | ||||||
| Non-operating realized gains/losses (net)4) | 12 | 105 | ||||||
| Non-operating impairments of investments (net)5) | (4) | — | ||||||
| Amortization of intangible assets | (1) | (1) | ||||||
| Non-operating restructuring charges6) | — | (2) | ||||||
| Non-operating items | 18 | 103 | ||||||
| Income before income taxes and minority interests in earnings | 607 | 853 | ||||||
| Income taxes | (136) | (201) | ||||||
| Minority interests in earnings | (19) | (99) | ||||||
| Net income | 452 | 553 | ||||||
| Statutory expense ratio7)in % | 9.1 | 7.2 |
1) | Effective 1Q 2008, health business in Belgium and France is shown within Life/Health segment. Prior year balances have not been adjusted. |
2) | For the Life/Health segment, total revenues are measured based upon statutory premiums. Statutory premiums are gross premiums written from sales of life insurance policies, as well as gross receipts from sales of unit linked and other investment-oriented products, in accordance with the statutory accounting practices applicable in the insurer’s home jurisdiction. |
3) | The total of these items equals income from financial assets and liabilities carried at fair value through income (net) in the segment income statement. |
4) | The total of these items equals realized gains/losses (net) in the segment income statement. |
5) | The total of these items equals impairments of investments (net) in the segment income statement. |
6) | The total of these items equals restructuring charges in the segment income statement. |
7) | Represents acquisition and administrative expenses (net) divided by statutory premiums (net). |
50
Table of Contents
Allianz Group Interim Report First Quarter of 2008 Notes to the Condensed Consolidated Interim Financial Statements
Banking Segment
| Three months ended March 31, | 2008 | 2007 | ||||||||||||||
Banking € mn | Dresdner Bank € mn | Banking € mn | Dresdner Bank € mn | |||||||||||||
| Net interest income1) | 696 | 669 | 928 | 900 | ||||||||||||
| Net fee and commission income2) | 644 | 604 | 832 | 789 | ||||||||||||
| Trading income (net)3) | (706) | (698) | 351 | 345 | ||||||||||||
| Income from financial assets and liabilities designated at fair value through income (net)3) | 144 | 144 | (10) | (11) | ||||||||||||
| Operating revenues4) | 778 | 719 | 2,101 | 2,023 | ||||||||||||
| Administrative expenses | (1,218) | (1,156) | (1,410) | (1,355) | ||||||||||||
| Investment expenses | 2 | (1) | (9) | (11) | ||||||||||||
| Other expenses | (6) | (5) | 13 | 13 | ||||||||||||
| Operating expenses | (1,222) | (1,162) | (1,406) | (1,353) | ||||||||||||
| Loan loss provisions | (12) | (10) | 5 | 7 | ||||||||||||
| Operating profit (loss) | (456) | (453) | 700 | 677 | ||||||||||||
| Realized gains/losses (net) | 62 | 63 | 139 | 137 | ||||||||||||
| Impairments of investments (net) | (30) | (30) | (13) | (13) | ||||||||||||
| Restructuring charges | 16 | 16 | (9) | (9) | ||||||||||||
| Non-operating items | 48 | 49 | 117 | 115 | ||||||||||||
| Income (loss) before income taxes and minority interests in earnings | (408) | (404) | 817 | 792 | ||||||||||||
| Income taxes | (116) | (94) | (168) | (158) | ||||||||||||
| Minority interests in earnings | (14) | (15) | (24) | (22) | ||||||||||||
| Net income (loss) | (538) | (513) | 625 | 612 | ||||||||||||
| Cost-income ratio5)in % | 157.1 | 161.6 | 66.9 | 66.9 | ||||||||||||
1) | Represents interest and similar income less interest expenses. |
2) | Represents fee and commission income less fee and commission expenses. |
3) | The total of these items equals income from financial assets and liabilities carried at fair value through income (net) in the segment income statement. |
4) | For the Banking segment, total revenues are measured based upon operating revenues. |
5) | Represents operating expenses divided by operating revenues. |
51
Table of Contents
Notes to the Condensed Consolidated Interim Financial Statements Allianz Group Interim Report First Quarter of 2008
Asset Management Segment
| Three months ended March 31, | 2008 | 2007 | ||||||||||||||
Asset € mn | Allianz Global Investors € mn | Asset € mn | Allianz Global Investors € mn | |||||||||||||
| Net fee and commission income1) | 706 | 693 | 746 | 728 | ||||||||||||
| Net interest income2) | 20 | 15 | 23 | 19 | ||||||||||||
| Income from financial assets and liabilities carried at fair value through income (net) | (4) | (3) | 7 | 7 | ||||||||||||
| Other income | 5 | 5 | 4 | 4 | ||||||||||||
| Operating revenues3) | 727 | 710 | 780 | 758 | ||||||||||||
| Administrative expenses, excluding acquisition-related expenses4) | (486) | (472) | (468) | (454) | ||||||||||||
| Operating expenses | (486) | (472) | (468) | (454) | ||||||||||||
| Operating profit | 241 | 238 | 312 | 304 | ||||||||||||
| Realized gains/losses (net) | 8 | 8 | 2 | 2 | ||||||||||||
| Impairments of investments (net) | (3) | (3) | — | — | ||||||||||||
| Acquisition-related expenses4), thereof: | ||||||||||||||||
Deferred purchases of interests in PIMCO | (120) | (120) | (122) | (122) | ||||||||||||
| Restructuring charges | — | — | (2) | (2) | ||||||||||||
| Non-operating items | (115) | (115) | (122) | (122) | ||||||||||||
| Income before income taxes and minority interests in earnings | 126 | 123 | 190 | 182 | ||||||||||||
| Income taxes | (46) | (45) | (80) | (79) | ||||||||||||
| Minority interests in earnings | (2) | (2) | (11) | (10) | ||||||||||||
| Net income | 78 | 76 | 99 | 93 | ||||||||||||
| Cost-income ratio5)in % | 66.9 | 66.5 | 60.0 | 59.9 | ||||||||||||
1) | Represents fee and commission income less fee and commission expenses. |
2) | Represents interest and similar income less interest expenses and investment expenses. |
3) | For the Asset Management segment, total revenues are measured based upon operating revenues. |
4) | The total of these items equals acquisition and administrative expenses (net) in the segment income statement. |
5) | Represents operating expenses divided by operating revenues |
52
Table of Contents
Allianz Group Interim Report First Quarter of 2008 Notes to the Condensed Consolidated Interim Financial Statements
Corporate Segment
| Three months ended March 31, | 2008 € mn | 2007 € mn | ||||||
| Interest and similar income | 230 | 154 | ||||||
| Operating income from financial assets and liabilities carried at fair value through income (net)1) | 10 | 1 | ||||||
| Fee and commission income | 65 | 45 | ||||||
| Other income | 1 | 5 | ||||||
| Income from fully consolidated private equity investments | 579 | 471 | ||||||
| Operating revenues | 885 | 676 | ||||||
| Interest expenses, excluding interest expenses from external debt2) | (173) | (131) | ||||||
| Investment expenses | (44) | (34) | ||||||
| Acquisition and administrative expenses (net), excluding acquisition-related expenses3) | (159) | (117) | ||||||
| Fee and commission expenses | (29) | (35) | ||||||
| Expenses from fully consolidated private equity investments | (556) | (460) | ||||||
| Operating expenses | (961) | (777) | ||||||
| Operating loss | (76) | (101) | ||||||
| Non-operating income from financial assets and liabilities carried at fair value through income (net)1) | 198 | 84 | ||||||
| Realized gains/losses (net) | (16) | 640 | ||||||
| Interest expenses from external debt2) | (252) | (222) | ||||||
| Impairments of investments (net) | (45) | 9 | ||||||
| Acquisition-related expenses3) | 13 | — | ||||||
| Non-operating items | (102) | 511 | ||||||
| Income (loss) before income taxes and minority interests in earnings | (178) | 410 | ||||||
| Income taxes | 86 | (25) | ||||||
| Minority interests in earnings | (7) | (4) | ||||||
| Net income (loss) | (99) | 381 |
1) | The total of these items equals income from financial assets and liabilities carried at fair value through income (net) in the segment income statement. |
2) | The total of these items equals interest expenses in the segment income statement. |
3) | The total of these items equals acquisition and administrative expenses (net) in the segment income statement. |
53
Table of Contents
Notes to the Condensed Consolidated Interim Financial Statements Allianz Group Interim Report First Quarter of 2008
Supplementary Information to the Consolidated Balance Sheets
5 Financial assets carried at fair value through income
As of March 31, 2008 € mn | As of € mn | |||||||
| Financial assets held for trading | ||||||||
Debt securities1) | 65,381 | 59,715 | ||||||
Equity securities | 28,037 | 30,596 | ||||||
Derivative financial instruments | 98,135 | 73,230 | ||||||
Subtotal | 191,553 | 163,541 | ||||||
| Financial assets designated at fair value through income | ||||||||
Debt securities2)3) | 14,109 | 15,924 | ||||||
Equity securities | 4,118 | 4,232 | ||||||
Loans to banks and customers | 1,692 | 1,764 | ||||||
Subtotal | 19,919 | 21,920 | ||||||
| Total | 211,472 | 185,461 |
1) | Debt securities held for trading include€13.2 bn (2007:€15.1 bn) of asset-backed securities of Dresdner Bank as of March 31, 2008. |
2) | Debt securities designated at fair value through income include€2.0 bn (2007:€2.8 bn) of credit investment related conduits (“CIRC”) of Dresdner Bank as of March 31, 2008. |
3) | Debt securities designated at fair value through income include€0.8 bn (2007:€0.8 bn) of asset-backed securities of the Life/Health segment as of March 31, 2008. |
As of March 31, € mn | As of € mn | |||||||
| Available-for-sale investments | 259,868 | 268,001 | ||||||
| Held-to-maturity investments | 4,809 | 4,659 | ||||||
| Funds held by others under reinsurance contracts assumed | 1,070 | 1,063 | ||||||
| Investments in associates and joint ventures | 5,413 | 5,471 | ||||||
| Real estate held for investment | 7,705 | 7,758 | ||||||
| Total | 278,865 | 286,952 |
Available-for-sale investments
| As of March 31, 2008 | As of December 31, 2007 | |||||||||||||||||||||||||||||||
| Amortized | Unrealized | Unrealized | Fair Value | Amortized | Unrealized | Unrealized | Fair Value | |||||||||||||||||||||||||
Cost € mn | Gains € mn | Losses € mn | € mn | Cost € mn | Gains € mn | Losses € mn | € mn | |||||||||||||||||||||||||
| Debt securities | ||||||||||||||||||||||||||||||||
Government and agency mortgage-backed securities (residential and commercial)1) | 10,772 | 70 | (83) | 10,759 | 7,628 | 30 | (112) | 7,546 | ||||||||||||||||||||||||
Corporate mortgage-backed securities (residential and commercial)1) | 2,737 | 1 | (122) | 2,616 | 6,663 | 39 | (101) | 6,601 | ||||||||||||||||||||||||
Other asset-backed securities1) | 5,431 | 34 | (149) | 5,316 | 5,384 | 34 | (92) | 5,326 | ||||||||||||||||||||||||
Government and government agency bonds | 95,826 | 1,863 | (1,052) | 96,637 | 98,285 | 1,334 | (1,479) | 98,140 | ||||||||||||||||||||||||
Corporate bonds | 91,270 | 780 | (2,934) | 89,116 | 86,095 | 660 | (2,356) | 84,399 | ||||||||||||||||||||||||
Other | 4,003 | 58 | (135) | 3,926 | 2,933 | 99 | (104) | 2,928 | ||||||||||||||||||||||||
Subtotal | 210,039 | 2,806 | (4,475) | 208,370 | 206,988 | 2,196 | (4,244) | 204,940 | ||||||||||||||||||||||||
| Equity securities | 36,671 | 16,111 | (1,284) | 51,498 | 40,794 | 22,734 | (467) | 63,061 | ||||||||||||||||||||||||
| Total | 246,710 | 18,917 | (5,759) | 259,868 | 247,782 | 24,930 | (4,711) | 268,001 | ||||||||||||||||||||||||
1) | includes asset-backed-securities of the Property-Casualty segment of€4.8 bn (2007:€4.9 bn) and of the Life/Health segment of€12.5 bn (2007:€13.0 bn) as of March 31, 2008. |
54
Table of Contents
Allianz Group Interim Report First Quarter of 2008 Notes to the Condensed Consolidated Interim Financial Statements
7 Loans and advances to banks and customers
| As of March 31, 2008 | As of December 31, 2007 | |||||||||||||||||||||||
Banks € mn | Customers € mn | Total € mn | Banks € mn | Customers € mn | Total € mn | |||||||||||||||||||
| Short-term investments and certificates of deposit | 12,449 | — | 12,449 | 10,316 | — | 10,316 | ||||||||||||||||||
| Reverse repurchase agreements | 87,078 | 65,011 | 152,089 | 68,340 | 56,991 | 125,331 | ||||||||||||||||||
| Collateral paid for securities borrowing transactions | 27,576 | 25,629 | 53,205 | 16,664 | 23,714 | 40,378 | ||||||||||||||||||
| Loans | 76,082 | 124,649 | 200,731 | 74,944 | 125,403 | 200,347 | ||||||||||||||||||
| Other | 16,270 | 10,831 | 27,101 | 14,012 | 7,148 | 21,160 | ||||||||||||||||||
| Subtotal | 219,455 | 226,120 | 445,575 | 184,276 | 213,256 | 397,532 | ||||||||||||||||||
| Loan loss allowance | (3) | (808) | (811) | (3) | (827) | (830) | ||||||||||||||||||
| Total | 219,452 | 225,312 | 444,764 | 184,273 | 212,429 | 396,702 | ||||||||||||||||||
Loans and advances to customers by type of customer
As of March 31, 2008 € mn | As of € mn | |||||||
| Corporate customers | 158,537 | 148,848 | ||||||
| Private customers | 55,218 | 55,761 | ||||||
| Public authorities | 12,365 | 8,647 | ||||||
| Total | 226,120 | 213,256 |
As of March 31, 2008 € mn | As of € mn | |||||||
| Unearned premiums | 1,606 | 1,342 | ||||||
| Reserves for loss and loss adjustment expenses | 8,136 | 8,561 | ||||||
| Aggregate policy reserves | 4,736 | 5,319 | ||||||
| Other insurance reserves | 62 | 90 | ||||||
| Total | 14,540 | 15,312 |
As of March 31, 2008 € mn | As of € mn | |||||||
| Deferred acquisition costs | ||||||||
Property-Casualty | 4,023 | 3,675 | ||||||
Life/Health | 14,180 | 14,118 | ||||||
Asset Management | 152 | 94 | ||||||
Subtotal | 18,355 | 17,887 | ||||||
| Present value of future profits | 1,218 | 1,206 | ||||||
| Deferred sales inducements | 499 | 520 | ||||||
| Total | 20,072 | 19,613 |
55
Table of Contents
Notes to the Condensed Consolidated Interim Financial Statements Allianz Group Interim Report First Quarter of 2008
As of March 31, 2008 € mn | As of € mn | |||||||
| Receivables | ||||||||
Policyholders | 4,547 | 4,616 | ||||||
Agents | 4,682 | 3,956 | ||||||
Reinsurers | 2,150 | 2,676 | ||||||
Other | 5,180 | 4,994 | ||||||
Less allowance for doubtful accounts | (406) | (389) | ||||||
Subtotal | 16,153 | 15,853 | ||||||
| Tax receivables | ||||||||
Income tax | 1,957 | 2,536 | ||||||
Other tax | 874 | 731 | ||||||
Subtotal | 2,831 | 3,267 | ||||||
| Accrued dividends, interest and rent | 8,983 | 8,782 | ||||||
| Prepaid expenses | ||||||||
Interest and rent | 26 | 29 | ||||||
Other prepaid expenses | 353 | 261 | ||||||
Subtotal | 379 | 290 | ||||||
| Derivative financial instruments used for hedging that meet the criteria for hedge accounting and firm commitments | 688 | 344 | ||||||
| Property and equipment | ||||||||
Real estate held for own use | 3,743 | 3,708 | ||||||
Equipment | 1,596 | 1,666 | ||||||
Software | 1,152 | 1,165 | ||||||
Subtotal | 6,491 | 6,539 | ||||||
| Non-current assets and disposal groups held for sale | 1,561 | 3,503 | ||||||
| Other assets1)2) | 12,011 | 2,950 | ||||||
| Total | 49,097 | 41,528 |
1) | As of March 31, 2008, includes prepaid benefit costs for defined benefit plans of€521 mn. |
2) | As of March 31, 2008, includes assets of K2 of€8,665 mn. |
Non-current assets and disposal groups held for sale as of March 31, 2008 include assets related to Selecta AG of €1,552 mn (2007: €1,543 mn). During the first quarter ended March 31, 2008 the Allianz Group disposed of €1,950 mn related to the portfolios of real estate held for investment and real estate held for own use in Germany.
As of March 31, 2008 € mn | As of € mn | |||||||
| Goodwill | 12,225 | 12,453 | ||||||
| Brand names | 745 | 737 | ||||||
| Other | 219 | 223 | ||||||
| Total | 13,189 | 13,413 |
Changes in goodwill for the three months ended March 31, 2008, were as follows:
2008 € mn | ||||
| Cost as of January 1, | 12,677 | |||
| Accumulated impairments as of January 1, | (224) | |||
| Carrying amount as of January 1, | 12,453 | |||
| Foreign currency translation adjustments | (228) | |||
| Carrying amount as of March 31, | 12,225 | |||
| Accumulated impairments as of March 31, | 224 | |||
| Cost as of March 31, | 12,449 |
12 Financial liabilities carried at fair value through income
As of March 31, 2008 € mn | As of € mn | |||||||
| Financial liabilities held for trading | ||||||||
Obligations to deliver securities | 44,440 | 34,795 | ||||||
Derivative financial instruments | 100,835 | 76,819 | ||||||
Other trading liabilities | 552 | 12,469 | ||||||
Subtotal | 145,827 | 124,083 | ||||||
| Financial liabilities designated at fair value through income | 1,691 | 1,970 | ||||||
| Total | 147,518 | 126,053 |
56
Table of Contents
Allianz Group Interim Report First Quarter of 2008 Notes to the Condensed Consolidated Interim Financial Statements
13 Liabilities to banks and customers
| As of March 31, 2008 | As of December 31, 2007 | |||||||||||||||||||||||
Banks € mn | Customers € mn | Total € mn | Banks € mn | Customers € mn | Total € mn | |||||||||||||||||||
| Payable on demand | 18,783 | 68,916 | 87,699 | 11,204 | 60,443 | 71,647 | ||||||||||||||||||
| Savings deposits | — | 5,267 | 5,267 | — | 5,304 | 5,304 | ||||||||||||||||||
| Term deposits and certificates of deposit | 53,216 | 77,301 | 130,517 | 64,129 | 72,938 | 137,067 | ||||||||||||||||||
| Repurchase agreements | 67,273 | 67,728 | 135,001 | 50,444 | 42,145 | 92,589 | ||||||||||||||||||
| Collateral received from securities lending transactions | 18,510 | 5,467 | 23,977 | 16,235 | 4,729 | 20,964 | ||||||||||||||||||
| Other | 3,302 | 3,302 | 6,604 | 5,513 | 3,410 | 8,923 | ||||||||||||||||||
| Total | 161,084 | 227,981 | 389,065 | 147,525 | 188,969 | 336,494 | ||||||||||||||||||
14 Reserves for loss and loss adjustment expenses
As of March 31, 2008 € mn | As of € mn | |||||||
| Property-Casualty | 54,451 | 56,943 | ||||||
| Life/Health | 8,218 | 6,773 | ||||||
| Consolidation | (8) | (10) | ||||||
| Total | 62,661 | 63,706 |
Changes in the reserves for loss and loss adjustment expenses for the Property-Casualty segment for the three months ended March 31, 2008 and March 31, 2007, are as follows:
| 2008 | 2007 | |||||||||||||||||||||||
| Gross € mn | Ceded € mn | Net € mn | Gross € mn | Ceded € mn | Net € mn | |||||||||||||||||||
| As of January 1, | 56,943 | (8,266) | 48,677 | 58,664 | (9,333) | 49,331 | ||||||||||||||||||
| Loss and loss adjustment expenses incurred | ||||||||||||||||||||||||
Current year | 7,401 | (772) | 6,629 | 7,581 | (990) | 6,591 | ||||||||||||||||||
Prior years | (543) | 215 | (328) | (407) | 199 | (208) | ||||||||||||||||||
Subtotal | 6,858 | (557) | 6,301 | 7,174 | (791) | 6,383 | ||||||||||||||||||
| Loss and loss adjustment expenses paid | ||||||||||||||||||||||||
Current year | (1,603) | 80 | (1,523) | (1,825) | 142 | (1,683) | ||||||||||||||||||
Prior years | (5,337) | 606 | (4,731) | (5,879) | 770 | (5,109) | ||||||||||||||||||
Subtotal | (6,940) | 686 | (6,254) | (7,704) | 912 | (6,792) | ||||||||||||||||||
| Foreign currency translation adjustments and other changes | (929) | 267 | (662) | (920) | 783 | (137) | ||||||||||||||||||
| Changes in the consolidated subsidiaries of the Allianz Group | — | — | — | 107 | (9) | 98 | ||||||||||||||||||
| Reclassifications1) | (1,481) | 90 | (1,391) | — | — | — | ||||||||||||||||||
| As of March 31, | 54,451 | (7,780) | 46,671 | 57,321 | (8,438) | 48,883 | ||||||||||||||||||
1) | Effective 1Q 2008, health business in Belgium and France is shown within Life/Health segment. Prior year balances have not been adjusted. |
57
Table of Contents
Notes to the Condensed Consolidated Interim Financial Statements Allianz Group Interim Report First Quarter of 2008
15 Reserves for insurance and investment contracts
As of € mn | As of € mn | |||||||
| Aggregate policy reserves | 265,117 | 264,243 | ||||||
| Reserves for premium refunds | 22,988 | 27,225 | ||||||
| Other insurance reserves | 787 | 776 | ||||||
| Total | 288,892 | 292,244 |
As of March 31, 2008 € mn | As of € mn | |||||||
| Payables | ||||||||
Policyholders | 4,657 | 4,806 | ||||||
Reinsurance | 1,813 | 1,844 | ||||||
Agents | 1,488 | 1,743 | ||||||
Subtotal | 7,958 | 8,393 | ||||||
| Payables for social security | 324 | 196 | ||||||
| Tax payables | ||||||||
Income tax | 2,112 | 2,563 | ||||||
Other | 1,615 | 1,012 | ||||||
Subtotal | 3,727 | 3,575 | ||||||
| Accrued interest and rent | 3,851 | 4,226 | ||||||
| Unearned income | ||||||||
Interest and rent | 8 | 6 | ||||||
Other | 602 | 351 | ||||||
Subtotal | 610 | 357 | ||||||
| Provisions | ||||||||
Pensions and similar obligations | 4,104 | 4,184 | ||||||
Employee related | 2,368 | 2,956 | ||||||
Share-based compensation | 1,361 | 1,761 | ||||||
Restructuring plans | 461 | 541 | ||||||
Loan commitments | 178 | 201 | ||||||
Contingent losses from non-insurance business | 144 | 134 | ||||||
Other provisions | 1,806 | 1,857 | ||||||
Subtotal | 10,422 | 11,634 | ||||||
| Deposits retained for reinsurance ceded | 2,896 | 3,227 | ||||||
| Derivative financial instruments used for hedging purposes that meet the criteria for hedge accounting and firm commitments | 1,074 | 2,210 | ||||||
| Financial liabilities for puttable equity instruments | 3,557 | 4,162 | ||||||
| Disposal groups held for sale | 1,312 | 1,293 | ||||||
| Other liabilities1) | 20,247 | 10,051 | ||||||
| Total | 55,978 | 49,324 |
1) | As of March 31, 2008, includes liabilities of K2 of€ 8,889 mn. |
As of March 31, 2008 € mn | As of € mn | |||||||
| Allianz SE1) | ||||||||
Senior bonds | 4,090 | 4,279 | ||||||
Exchangeable bonds | — | 450 | ||||||
Money market securities | 3,540 | 2,929 | ||||||
Subtotal | 7,630 | 7,658 | ||||||
| Banking subsidiaries | ||||||||
Senior bonds | 15,371 | 18,111 | ||||||
Money market securities | 13,449 | 16,298 | ||||||
Subtotal | 28,820 | 34,409 | ||||||
| All other subsidiaries | ||||||||
Certificated liabilities | 3 | 3 | ||||||
Subtotal | 3 | 3 | ||||||
| Total | 36,453 | 42,070 |
1) | Includes senior bonds, exchangeable bonds and money market securities issued by Allianz Finance B.V. and Allianz Finance II B.V. guaranteed by Allianz SE and money market securities issued by Allianz Finance Corporation, a wholly-owned subsidiary of Allianz SE, which are fully and unconditionally guaranteed by Allianz SE. |
18 Participation certificates and subordinated liabilities
As of March 31, 2008 € mn | As of € mn | |||||||
| Allianz SE1) | ||||||||
Subordinated bonds | 6,832 | 6,853 | ||||||
Participation certificates | 85 | 85 | ||||||
Subtotal | 6,917 | 6,938 | ||||||
| Banking subsidiaries | ||||||||
Subordinated bonds | 2,928 | 2,822 | ||||||
Hybrid equity | 2,386 | 2,429 | ||||||
Participation certificates | 1,698 | 1,686 | ||||||
Subtotal | 7,012 | 6,937 | ||||||
| All other subsidiaries | ||||||||
Subordinated liabilities | 903 | 904 | ||||||
Hybrid equity | 45 | 45 | ||||||
Subtotal | 948 | 949 | ||||||
| Total | 14,877 | 14,824 |
1) | Includes subordinated bonds issued by Allianz Finance B.V. and Allianz Finance II B.V. and guaranteed by Allianz SE. |
58
Table of Contents
Allianz Group Interim Report First Quarter of 2008 Notes to the Condensed Consolidated Interim Financial Statements
As of € mn | As of € mn | |||||||
| Shareholders’ equity | ||||||||
Issued capital | 1,158 | 1,152 | ||||||
Capital reserve | 27,366 | 27,169 | ||||||
Revenue reserves | 13,747 | 12,790 | ||||||
Treasury shares | (376) | (172) | ||||||
Foreign currency translation adjustments | (4,486) | (3,656) | ||||||
Unrealized gains and losses (net) 1) | 7,572 | 10,470 | ||||||
Subtotal | 44,981 | 47,753 | ||||||
| Minority interests | 3,507 | 3,628 | ||||||
| Total | 48,488 | 51,381 |
1) | As of March 31, 2008 includes€215 mn related to cash flow hedges (2007:€175 mn). |
59
Table of Contents
Notes to the Condensed Consolidated Interim Financial Statements Allianz Group Interim Report First Quarter of 2008
Supplementary Information to the Consolidated Income Statements
| Three months ended March 31, | Property- | Life/Health | Consolidation | Group | ||||||||||||
Casualty € mn | € mn | € mn | € mn | |||||||||||||
| 2008 | ||||||||||||||||
| Premiums written | ||||||||||||||||
Direct | 13,138 | 5,673 | — | 18,811 | ||||||||||||
Assumed | 572 | 91 | (6) | 657 | ||||||||||||
Subtotal | 13,710 | 5,764 | (6) | 19,468 | ||||||||||||
Ceded | (1,285) | (137) | 6 | (1,416) | ||||||||||||
Net | 12,425 | 5,627 | — | 18,052 | ||||||||||||
| Change in unearned premiums | ||||||||||||||||
Direct | (3,462) | (38) | — | (3,500) | ||||||||||||
Assumed | (98) | (2) | — | (100) | ||||||||||||
Subtotal | (3,560) | (40) | — | (3,600) | ||||||||||||
Ceded | 308 | 2 | — | 310 | ||||||||||||
Net | (3,252) | (38) | — | (3,290) | ||||||||||||
| Premiums earned | ||||||||||||||||
Direct | 9,676 | 5,635 | — | 15,311 | ||||||||||||
Assumed | 474 | 89 | (6) | 557 | ||||||||||||
Subtotal | 10,150 | 5,724 | (6) | 15,868 | ||||||||||||
Ceded | (977) | (135) | 6 | (1,106) | ||||||||||||
Net | 9,173 | 5,589 | — | 14,762 | ||||||||||||
| 2007 | ||||||||||||||||
| Premiums written | ||||||||||||||||
Direct | 13,464 | 5,311 | — | 18,775 | ||||||||||||
Assumed | 647 | 84 | (3) | 728 | ||||||||||||
Subtotal | 14,111 | 5,395 | (3) | 19,503 | ||||||||||||
Ceded | (1,586) | (178) | 3 | (1,761) | ||||||||||||
Net | 12,525 | 5,217 | — | 17,742 | ||||||||||||
| Change in unearned premiums | ||||||||||||||||
Direct | (3,498) | (38) | — | (3,536) | ||||||||||||
Assumed | (39) | 4 | — | (35) | ||||||||||||
Subtotal | (3,537) | (34) | — | (3,571) | ||||||||||||
Ceded | 370 | 2 | — | 372 | ||||||||||||
Net | (3,167) | (32) | — | (3,199) | ||||||||||||
| Premiums earned | ||||||||||||||||
Direct | 9,966 | 5,273 | — | 15,239 | ||||||||||||
Assumed | 608 | 88 | (3) | 693 | ||||||||||||
Subtotal | 10,574 | 5,361 | (3) | 15,932 | ||||||||||||
Ceded | (1,216) | (176) | 3 | (1,389) | ||||||||||||
Net | 9,358 | 5,185 | — | 14,543 |
60
Table of Contents
Allianz Group Interim Report First Quarter of 2008 Notes to the Condensed Consolidated Interim Financial Statements
21 Interest and similar income
| Three months ended March 31, | 2008 € mn | 2007 € mn | ||||||
| Interest from held-to-maturity investments | 57 | 56 | ||||||
| Dividends from available-for-sale investments | 277 | 307 | ||||||
| Interest from available-for-sale investments | 2,529 | 2,368 | ||||||
| Share of earnings from investments in associates and joint ventures | 21 | 259 | ||||||
| Rent from real estate held for investment | 189 | 209 | ||||||
| Interest from loans to banks and customers | 3,303 | 2,998 | ||||||
| Other interest | 34 | 69 | ||||||
| Total | 6,410 | 6,266 |
22 Income from financial assets and liabilities carried at fair value through income (net)
| Three months ended March 31, | Property- Casualty € mn | Life/Health € mn | Banking € mn | Asset Managment € mn | Corporate € mn | Consolidation € mn | Group € mn | |||||||||||||||||||||
| 2008 | ||||||||||||||||||||||||||||
| Income (expenses) from financial assets and liabilities held for trading | 90 | 558 | (706) | 16 | 208 | (13) | 153 | |||||||||||||||||||||
| Income (expenses) from financial assets designated at fair value through income | (23) | (531) | 132 | (74) | — | — | (496) | |||||||||||||||||||||
| Income from financial liabilities designated at fair value through income | — | — | 34 | — | — | — | 34 | |||||||||||||||||||||
| Income (expenses) from financial liabilities for puttable equity instruments (net) | 10 | 215 | (22) | 54 | — | — | 257 | |||||||||||||||||||||
| Total | 77 | 242 | (562) | (4) | 208 | (13) | (52) | |||||||||||||||||||||
| 2007 | ||||||||||||||||||||||||||||
| Income (expenses) from financial assets and liabilities held for trading | (44) | (414) | 351 | (1) | 82 | 4 | (22) | |||||||||||||||||||||
| Income from financial assets designated at fair value through income | 30 | 139 | 32 | 22 | 3 | — | 226 | |||||||||||||||||||||
| Income (expenses) from financial liabilities designated at fair value through income | 2 | 8 | (42) | — | — | — | (32) | |||||||||||||||||||||
| Expenses from financial liabilities for puttable equity instruments (net) | — | (43) | — | (14) | — | — | (57) | |||||||||||||||||||||
| Total | (12) | (310) | 341 | 7 | 85 | 4 | 115 |
Income from financial assets and liabilities held for trading (net)
Life/Health Segment
Income from financial assets and liabilities held for trading for the three months ended March 31, 2008 includes in the Life/Health segment income of €569 mn (2007: expenses of €417 mn) from derivative financial instruments. Income of €138 mn (2007: expenses of €243 mn) results from the purchase of forward contracts for interest bonds and forward sales of shares. Also included are expenses from derivative financial instruments related to equity indexed annuity contracts and guaranteed benefits under unit-linked contracts of €241 mn (2007: €140 mn) and income from other derivative financial instruments of €672 mn (2007: expenses of €34 mn).
61
Table of Contents
Notes to the Condensed Consolidated Interim Financial Statements Allianz Group Interim Report First Quarter of 2008
Banking Segment
Income from financial assets and liabilities held for trading of the Banking segment comprises:
| Three months ended March 31, | 2008 € mn | 2007 € mn | ||||||
| Trading in interest products | 3 | 156 | ||||||
| Trading in loan products1) | (692) | 83 | ||||||
| Trading in equity products | (102) | 123 | ||||||
| Foreign exchange/ precious metals trading | 149 | 52 | ||||||
| Other trading activities | (64) | (63) | ||||||
| Total | (706) | 351 |
1) | For the three months ended March 31, 2008 includes impairments of€845 mn for asset-backed securities held for trading of Dresdner Bank. |
Corporate Segment
Income from financial assets and liabilities held for trading for the three months ended March 31, 2008, includes in the Corporate segment income of €55 mn (2007: €50 mn) from derivative financial instruments for which hedge accounting is not applied. This includes income from derivative financial instruments embedded in exchangeable bonds of €133 mn (2007: expenses of €97 mn), expenses from derivative financial instruments which partially hedge the exchangeable bonds, however, which do not qualify for hedge accounting, of €7 mn (2007: income of €164 mn), and expenses from other derivative financial instruments of €71 mn (2007: €17 mn).
23 Realized gains/losses (net)
| Three months ended March 31, | 2008 € m | 2007 € m | ||||||
| Realized gains | ||||||||
| Available-for-sale investments | ||||||||
Equity securities | 1,620 | 3,158 | ||||||
Debt securities | 178 | 139 | ||||||
Subtotal | 1,798 | 3,297 | ||||||
| Investments in associates and joint ventures1) | 66 | 7 | ||||||
| Real estate held for investment | 166 | 109 | ||||||
| Loans to banks and customers | 9 | 9 | ||||||
| Subtotal | 2,039 | 3,422 | ||||||
| Realized losses | ||||||||
| Available-for-sale investments | ||||||||
Equity securities | (561) | (54) | ||||||
Debt securities | (86) | (136) | ||||||
Subtotal | (647) | (190) | ||||||
| Investments in associates and joint ventures2) | (3) | (3) | ||||||
| Real estate held for investment | (52) | (7) | ||||||
| Loans to banks and customers | (10) | (13) | ||||||
| Subtotal | (712) | (213) | ||||||
| Total | 1,327 | 3,209 |
1) | During the three months ended March 31, 2008, includes realized gains from the disposal of subsidiaries and businesses of€66 mn (2007:€1 mn). |
2) | During the three months ended March 31, 2008, includes realized losses from the disposal of subsidiaries of€1 mn (2007:€— mn). |
62
Table of Contents
Allianz Group Interim Report First Quarter of 2008 Notes to the Condensed Consolidated Interim Financial Statements
| Three months ended March 31, | 2008 | 2007 | ||||||||||||||||||||||
Segment €mn | Consolidation €mn | Group €mn | Segment €mn | Consolidation €mn | Group €mn | |||||||||||||||||||
| Property-Casualty | ||||||||||||||||||||||||
| Fees from credit and assistance business | 171 | — | 171 | 173 | — | 173 | ||||||||||||||||||
| Service agreements | 96 | (3) | 93 | 99 | (5) | 94 | ||||||||||||||||||
| Subtotal | 267 | (3) | 264 | 272 | (5) | 267 | ||||||||||||||||||
| Life/Health | ||||||||||||||||||||||||
| Service agreements | 34 | (3) | 31 | 54 | (11) | 43 | ||||||||||||||||||
| Investment advisory | 134 | (9) | 125 | 114 | (8) | 106 | ||||||||||||||||||
| Other | 3 | (3) | — | 3 | (3) | — | ||||||||||||||||||
| Subtotal | 171 | (15) | 156 | 171 | (22) | 149 | ||||||||||||||||||
| Banking | ||||||||||||||||||||||||
| Securities business | 348 | (45) | 303 | 465 | (49) | 416 | ||||||||||||||||||
| Investment advisory | 86 | (29) | 57 | 154 | (38) | 116 | ||||||||||||||||||
| Payment transactions | 91 | (1) | 90 | 91 | — | 91 | ||||||||||||||||||
| Mergers and acquisitions advisory | 23 | — | 23 | 41 | — | 41 | ||||||||||||||||||
| Underwriting business | 10 | — | 10 | 23 | — | 23 | ||||||||||||||||||
| Other | 226 | (19) | 207 | 204 | (9) | 195 | ||||||||||||||||||
| Subtotal | 784 | (94) | 690 | 978 | (96) | 882 | ||||||||||||||||||
| Asset Management | ||||||||||||||||||||||||
| Management fees | 841 | (27) | 814 | 866 | (30) | 836 | ||||||||||||||||||
| Loading and exit fees | 66 | — | 66 | 82 | — | 82 | ||||||||||||||||||
| Performance fees | 13 | — | 13 | 16 | — | 16 | ||||||||||||||||||
| Other | 66 | (1) | 65 | 109 | (2) | 107 | ||||||||||||||||||
| Subtotal | 986 | (28) | 958 | 1,073 | (32) | 1,041 | ||||||||||||||||||
| Corporate | ||||||||||||||||||||||||
| Service agreements | 59 | (31) | 28 | 45 | (28) | 17 | ||||||||||||||||||
| Other | 6 | (1) | 5 | — | — | — | ||||||||||||||||||
| Subtotal | 65 | (32) | 33 | 45 | (28) | 17 | ||||||||||||||||||
| Total | 2,273 | (172) | 2,101 | 2,539 | (183) | 2,356 | ||||||||||||||||||
| Three months ended March 31, | 2008 €mn | 2007 €mn | ||||||
| Realized gains from disposals of real estate held for own use | 348 | 91 | ||||||
| Income from non-current assets and disposal groups held for sale | — | 2 | ||||||
| Other | 3 | — | ||||||
| Total | 351 | 93 |
63
Table of Contents
Notes to the Condensed Consolidated Interim Financial Statements Allianz Group Interim Report First Quarter of 2008
26 Income from fully consolidated private equity investments
| Three months ended March 31, | MAN Roland € mn | Selecta AG
€ mn | Other
€ mn | Total
€ mn | ||||||||||||
| 2008 | ||||||||||||||||
| Sales and service revenues | 374 | 184 | 14 | 572 | ||||||||||||
| Other operating revenues | 4 | — | — | 4 | ||||||||||||
| Interest income | 3 | — | — | 3 | ||||||||||||
| Total | 381 | 184 | 14 | 579 | ||||||||||||
| 2007 | ||||||||||||||||
| Sales and service revenues | 456 | — | — | 456 | ||||||||||||
| Other operating revenues | 12 | — | — | 12 | ||||||||||||
| Interest income | 3 | — | — | 3 | ||||||||||||
| Total | 471 | — | — | 471 |
27 Claims and insurance benefits incurred (net)
| Three months ended March 31, | Property- € mn | Life/Health
€ mn | Consolidation
€ mn | Group
€ mn | ||||||||||||
| 2008 | ||||||||||||||||
| Gross | ||||||||||||||||
Claims and insurance benefits paid | (6,940) | (5,179) | 2 | (12,117) | ||||||||||||
Change in loss and loss adjustment expenses | 82 | 49 | — | 131 | ||||||||||||
Subtotal | (6,858) | (5,130) | 2 | (11,986) | ||||||||||||
| Ceded | ||||||||||||||||
Claims and insurance benefits paid | 686 | 141 | (2) | 825 | ||||||||||||
Change in loss and loss adjustment expenses | (129) | (24) | — | (153) | ||||||||||||
Subtotal | 557 | 117 | (2) | 672 | ||||||||||||
| Net | ||||||||||||||||
Claims and insurance benefits paid | (6,254) | (5,038) | — | (11,292) | ||||||||||||
Change in loss and loss adjustment expenses | (47) | 25 | — | (22) | ||||||||||||
Total | (6,301) | (5,013) | — | (11,314) | ||||||||||||
| 2007 | ||||||||||||||||
| Gross | ||||||||||||||||
Claims and insurance benefits paid | (7,704) | (4,888) | 6 | (12,586) | ||||||||||||
Change in loss and loss adjustment expenses | 530 | 10 | (1) | 539 | ||||||||||||
Subtotal | (7,174) | (4,878) | 5 | (12,047) | ||||||||||||
| Ceded | ||||||||||||||||
Claims and insurance benefits paid | 912 | 202 | (6) | 1,108 | ||||||||||||
Change in loss and loss adjustment expenses | (121) | (26) | 1 | (146) | ||||||||||||
Subtotal | 791 | 176 | (5) | 962 | ||||||||||||
| Net | ||||||||||||||||
Claims and insurance benefits paid | (6,792) | (4,686) | — | (11,478) | ||||||||||||
Change in loss and loss adjustment expenses | 409 | (16) | — | 393 | ||||||||||||
Total | (6,383) | (4,702) | — | (11,085) |
64
Table of Contents
Allianz Group Interim Report First Quarter of 2008 Notes to the Condensed Consolidated Interim Financial Statements
28 Change in reserves for insurance and investment contracts (net)
| Three months ended March 31, | Property- € mn | Life/Health
€ mn | Consolidation
€ mn | Group
€ mn | ||||||||||||
| 2008 | ||||||||||||||||
| Gross | ||||||||||||||||
Aggregate policy reserves | (65) | (1,280) | — | (1,345) | ||||||||||||
Other insurance reserves | (3) | (12) | — | (15) | ||||||||||||
Expenses for premium refunds | 41 | (523) | (13) | (495) | ||||||||||||
Subtotal | (27) | (1,815) | (13) | (1,855) | ||||||||||||
| Ceded | ||||||||||||||||
Aggregate policy reserves | (17) | 4 | — | (13) | ||||||||||||
Other insurance reserves | 7 | 2 | — | 9 | ||||||||||||
Expenses for premium refunds | 8 | 6 | — | 14 | ||||||||||||
Subtotal | (2) | 12 | — | 10 | ||||||||||||
| Net | ||||||||||||||||
Aggregate policy reserves | (82) | (1,276) | — | (1,358) | ||||||||||||
Other insurance reserves | 4 | (10) | — | (6) | ||||||||||||
Expenses for premium refunds | 49 | (517) | (13) | (481) | ||||||||||||
Total | (29) | (1,803) | (13) | (1,845) | ||||||||||||
| 2007 | ||||||||||||||||
| Gross | ||||||||||||||||
Aggregate policy reserves | (62) | (504) | — | (566) | ||||||||||||
Other insurance reserves | — | (94) | — | (94) | ||||||||||||
Expenses for premium refunds | (21) | (2,046) | (31) | (2,098) | ||||||||||||
Subtotal | (83) | (2,644) | (31) | (2,758) | ||||||||||||
| Ceded | ||||||||||||||||
Aggregate policy reserves | (1) | 19 | — | 18 | ||||||||||||
Other insurance reserves | 1 | (4) | — | (3) | ||||||||||||
Expenses for premium refunds | 2 | 5 | — | 7 | ||||||||||||
Subtotal | 2 | 20 | — | 22 | ||||||||||||
| Net | ||||||||||||||||
Aggregate policy reserves | (63) | (485) | — | (548) | ||||||||||||
Other insurance reserves | 1 | (98) | — | (97) | ||||||||||||
Expenses for premium refunds | (19) | (2,041) | (31) | (2,091) | ||||||||||||
Total | (81) | (2,624) | (31) | (2,736) |
65
Table of Contents
Notes to the Condensed Consolidated Interim Financial Statements Allianz Group Interim Report First Quarter of 2008
| Three months ended March 31, | 2008 € mn | 2007 € mn | ||||||
| Liabilities to banks and customers | (870) | (833) | ||||||
| Deposits retained on reinsurance ceded | (26) | (20) | ||||||
| Certificated liabilities | (487) | (380) | ||||||
| Participating certificates and subordinated liabilities | (165) | (178) | ||||||
| Other | (278) | (187) | ||||||
| Total | (1,826) | (1,598) |
| Three months ended March 31, | 2008 € mn | 2007 € mn | ||||||
| Additions to allowances including direct impairments | (118) | (106) | ||||||
| Amounts released | 57 | 51 | ||||||
| Recoveries on loans previously impaired | 51 | 57 | ||||||
| Total | (10) | 2 |
31 Impairments of investments (net)
| Three months ended March 31, | 2008 € mn | 2007 € mn | ||||||
| Impairments | ||||||||
| Available-for-sale investments | ||||||||
Equity securities | (1,444) | (81) | ||||||
Debt securities | (53) | — | ||||||
Subtotal | (1,497) | (81) | ||||||
| Real estate held for investment | (18) | (2) | ||||||
| Subtotal | (1,515) | (83) | ||||||
| Reversals of impairments | ||||||||
| Available-for-sale investments | ||||||||
Debt securities | — | 13 | ||||||
| Real estate held for investment | 18 | 3 | ||||||
| Subtotal | 18 | 16 | ||||||
| Total | (1,497) | (67) |
| Three months ended March 31, | 2008 € mn | 2007 € mn | ||||||
| Investment management expenses | (104) | (103) | ||||||
| Depreciation from real estate held for investment | (44) | (54) | ||||||
| Other expenses from real estate held for investment | (27) | (72) | ||||||
| Foreign currency gains and losses (net) | ||||||||
Foreign currency gains | 310 | 127 | ||||||
Foreign currency losses | (572) | (159) | ||||||
Subtotal | (262) | (32) | ||||||
| Total | (437) | (261) |
66
Table of Contents
Allianz Group Interim Report First Quarter of 2008 Notes to the Condensed Consolidated Interim Financial Statements
33 Acquisition and administrative expenses (net)
| Three months ended March 31, | 2008 | 2007 | ||||||||||||||||||||||
Segment € mn | Consolidation € mn | Group € mn | Segment € mn | Consolidation € mn | Group € mn | |||||||||||||||||||
| Property-Casualty | ||||||||||||||||||||||||
| Acquisition costs | ||||||||||||||||||||||||
Incurred | (2,140) | — | (2,140) | (2,153) | — | (2,153) | ||||||||||||||||||
Commissions and profit received on reinsurance business ceded | 216 | (1) | 215 | 168 | — | 168 | ||||||||||||||||||
Deferrals of acquisition costs | 1,451 | — | 1,451 | 1,587 | — | 1,587 | ||||||||||||||||||
Amortization of deferred acquisition costs | (1,114) | — | (1,114) | (1,267) | — | (1,267) | ||||||||||||||||||
Subtotal | (1,587) | (1) | (1,588) | (1,665) | — | (1,665) | ||||||||||||||||||
| Administrative expenses | (804) | 9 | (795) | (1,010) | 16 | (994) | ||||||||||||||||||
| Subtotal | (2,391) | 8 | (2,383) | (2,675) | 16 | (2,659) | ||||||||||||||||||
| Life/Health | ||||||||||||||||||||||||
| Acquisition costs | ||||||||||||||||||||||||
Incurred | (983) | 1 | (982) | (917) | 1 | (916) | ||||||||||||||||||
Commissions and profit received on reinsurance business ceded | 25 | — | 25 | 48 | — | 48 | ||||||||||||||||||
Deferrals of acquisition costs | 620 | — | 620 | 627 | — | 627 | ||||||||||||||||||
Amortization of deferred acquisition costs | (368) | — | (368) | (182) | — | (182) | ||||||||||||||||||
Subtotal | (706) | 1 | (705) | (424) | 1 | (423) | ||||||||||||||||||
| Administrative expenses | (402) | 4 | (398) | (450) | (10) | (460) | ||||||||||||||||||
| Subtotal | (1,108) | 5 | (1,103) | (874) | (9) | (883) | ||||||||||||||||||
| Banking | ||||||||||||||||||||||||
| Personnel expenses | (744) | — | (744) | (907) | — | (907) | ||||||||||||||||||
| Non-personnel expenses | (474) | — | (474) | (503) | 9 | (494) | ||||||||||||||||||
| Subtotal | (1,218) | — | (1,218) | (1,410) | 9 | (1,401) | ||||||||||||||||||
| Asset Management | ||||||||||||||||||||||||
| Personnel expenses | (422) | — | (422) | (425) | — | (425) | ||||||||||||||||||
| Non-personnel expenses | (184) | (1) | (185) | (165) | 6 | (159) | ||||||||||||||||||
| Subtotal | (606) | (1) | (607) | (590) | 6 | (584) | ||||||||||||||||||
| Corporate | ||||||||||||||||||||||||
| Administrative expenses | (146) | 11 | (135) | (117) | 6 | (111) | ||||||||||||||||||
| Subtotal | (146) | 11 | (135) | (117) | 6 | (111) | ||||||||||||||||||
| Total | (5,469) | 23 | (5,446) | (5,666) | 28 | (5,638) | ||||||||||||||||||
67
Table of Contents
Notes to the Condensed Consolidated Interim Financial Statements Allianz Group Interim Report First Quarter of 2008
34 Fee and commission expenses
| Three months ended March 31, | 2008 | 2007 | ||||||||||||||||||||||
Segment €mn | Consolidation € mn | Group € mn | Segment € mn | Consolidation €mn | Group € mn | |||||||||||||||||||
| Property-Casualty | ||||||||||||||||||||||||
| Fees from credit and assistance business | (138) | — | (138) | (118) | — | (118) | ||||||||||||||||||
| Service agreements | (110) | 1 | (109) | (79) | 4 | (75) | ||||||||||||||||||
| Subtotal | (248) | 1 | (247) | (197) | 4 | (193) | ||||||||||||||||||
| Life/Health | ||||||||||||||||||||||||
| Service agreements | (20) | 4 | (16) | (21) | 8 | (13) | ||||||||||||||||||
| Investment advisory | (40) | 5 | (35) | (41) | 1 | (40) | ||||||||||||||||||
| Subtotal | (60) | 9 | (51) | (62) | 9 | (53) | ||||||||||||||||||
| Banking | ||||||||||||||||||||||||
| Securities business | (40) | — | (40) | (40) | — | (40) | ||||||||||||||||||
| Investment advisory | (40) | — | (40) | (46) | 2 | (44) | ||||||||||||||||||
| Payment transactions | (6) | — | (6) | (5) | — | (5) | ||||||||||||||||||
| Mergers and acquisitions advisory | (3) | — | (3) | (3) | — | (3) | ||||||||||||||||||
| Other | (51) | 3 | (48) | (52) | 3 | (49) | ||||||||||||||||||
| Subtotal | (140) | 3 | (137) | (146) | 5 | (141) | ||||||||||||||||||
| Asset Management | ||||||||||||||||||||||||
| Commissions | (212) | 84 | (128) | (235) | 112 | (123) | ||||||||||||||||||
| Other | (68) | 4 | (64) | (92) | 1 | (91) | ||||||||||||||||||
| Subtotal | (280) | 88 | (192) | (327) | 113 | (214) | ||||||||||||||||||
| Corporate | ||||||||||||||||||||||||
| Service agreements | (28) | 1 | (27) | (35) | 2 | (33) | ||||||||||||||||||
| Other | (1) | — | (1) | — | — | — | ||||||||||||||||||
| Subtotal | (29) | 1 | (28) | (35) | 2 | (33) | ||||||||||||||||||
| Total | (757) | 102 | (655) | (767) | 133 | (634) | ||||||||||||||||||
35 Expenses from fully consolidated private equity investments
| Three months ended March 31, | MAN Roland € mn | Selecta AG € mn | Other € mn | Total € mn | ||||||||||||
| 2008 | ||||||||||||||||
| Cost of goods sold | (290) | (113) | (2) | (405) | ||||||||||||
| Commissions | (36) | — | — | (36) | ||||||||||||
| General and administrative expenses | (39) | (55) | — | (94) | ||||||||||||
| Interest expense | (4) | (17) | — | (21) | ||||||||||||
| Total | (369) | (185) | (2) | (556) | ||||||||||||
| 2007 | ||||||||||||||||
| Cost of goods sold | (352) | — | — | (352) | ||||||||||||
| Commissions | (39) | — | — | (39) | ||||||||||||
| General and administrative expenses | (62) | — | — | (62) | ||||||||||||
| Interest expense | (7) | — | — | (7) | ||||||||||||
| Total | (460) | — | — | (460) |
68
Table of Contents
Allianz Group Interim Report First Quarter of 2008 Notes to the Condensed Consolidated Interim Financial Statements
Three months ended March 31,
| 2008 € mn | 2007 € mn | ||||||
| Current income tax expense | (447) | (686) | ||||||
| Deferred income tax expense | (227) | (281) | ||||||
| Total | (674) | (967) |
Basic earnings per share is computed by dividing net income by the weighted average number of common shares outstanding for the period. Diluted earnings per share reflects the effect of dilutive securities. Dilutive securities include participation certificates issued by Allianz SE which can potentially be converted to Allianz shares, warrants issued by Allianz SE, share-based compensation plans, and derivatives on own shares.
Reconciliation of basic and diluted earnings per share
Three months ended March 31,
| 2008 € mn | 2007 € mn | ||||||||
| Numerator for basic earnings per share (net income) | 1,148 | 3,240 | ||||||||
| Effect of dilutive securities | (24) | (7) | ||||||||
| Numerator for diluted earnings per share (net income after assumed conversion) | 1,124 | 3,233 | ||||||||
| Denominator for basic earnings per share (weighted-average shares) | 449,417,813 | 431,473,954 | ||||||||
| Dilutive securities | ||||||||||
Participation certificates | 1,469,443 | 1,469,443 | ||||||||
Warrants | 273,699 | 964,831 | ||||||||
Share-based compensation plans | 1,701,773 | 1,088,515 | ||||||||
Derivatives on own shares | 1,026,683 | 5,639,750 | ||||||||
Subtotal | 4,471,598 | 9,162,539 | ||||||||
| Denominator for diluted earnings per share (weighted-average shares after assumed conversion) | 453,889,411 | 440,636,493 | ||||||||
| Basic earnings per share | € | 2.55 | € | 7.51 | ||||||
| Diluted earnings per share | € | 2.48 | € | 7.34 | ||||||
For the three months ended March 31, 2008, the weighted average number of shares excludes 1,820,099 (2007: 676,046) treasury shares.
69
Table of Contents
Notes to the Condensed Consolidated Interim Financial Statements Allianz Group Interim Report First Quarter of 2008
Other Information
38 Supplemental information on the Banking Segment
Net interest income from the Banking Segment
Three months ended March 31,
| Segment
€ mn | Consolidation
€ mn | Group
€ mn | |||||||||
| 2008 | ||||||||||||
| Interest and similar income | 2,238 | (46) | 2,192 | |||||||||
| Interest expense | (1,542) | 69 | (1,473) | |||||||||
| Net interest income | 696 | 23 | 719 | |||||||||
| 2007 | ||||||||||||
| Interest and similar income | 2,209 | (11) | 2,198 | |||||||||
| Interest expense | (1,281) | 31 | (1,250) | |||||||||
| Net interest income | 928 | 20 | 948 |
Net fee and commission income from the Banking Segment
Three months ended March 31,
| Segment
€ mn | Consolidation
€ mn | Group
€ mn | |||||||||
| 2008 | ||||||||||||
| Fee and commission income | 784 | (94) | 690 | |||||||||
| Fee and commission expense | (140) | 3 | (137) | |||||||||
| Net fee and commission income | 644 | (91) | 553 | |||||||||
| 2007 | ||||||||||||
| Fee and commission income | 978 | (96) | 882 | |||||||||
| Fee and commission expense | (146) | 5 | (141) | |||||||||
| Net fee and commission income | 832 | (91) | 741 |
The net fee and commission income of the Allianz Group’s Banking segment includes the following:
Three months ended March 31,
| 2008 € mn | 2007 € mn | ||||||
| Securities business | 308 | 425 | ||||||
| Investment advisory | 46 | 108 | ||||||
| Payment transactions | 85 | 86 | ||||||
| Merger and acquisitions advisory | 20 | 38 | ||||||
| Underwriting business | 10 | 23 | ||||||
| Other | 175 | 152 | ||||||
| Total | 644 | 832 |
39 Supplemental information on the condensed consolidated statements of cash flows
Three months ended March 31,
| 2008 € mn | 2007 € mn | ||||||
| Income taxes paid | (318) | (533) | ||||||
| Dividends received | 244 | 238 | ||||||
| Interest received | 5,715 | 5,725 | ||||||
| Interest paid | (2,204) | (1,829) | ||||||
| Significant non-cash transactions: | ||||||||
Settlement of exchangeable bonds issued by Allianz Finance II B.V. for shares: | ||||||||
Available-for-sale investments | (450) | (812) | ||||||
Certificated liabilities | (450) | (812) | ||||||
Novation of quota share reinsurance agreement: | ||||||||
Reinsurance assets | (29) | (1,213) | ||||||
Deferred acquisition costs | 1 | 70 | ||||||
Payables from reinsurance contracts | (28) | (1,143) |
Number of employees
| As of March 31, 2008 | As of 2007 | |||||||
| Germany | 70,640 | 72,063 | ||||||
| Other countries | 109,214 | 109,144 | ||||||
| Total | 179,854 | 181,207 |
70
Table of Contents
Allianz Group Interim Report First Quarter of 2008 Notes to the Condensed Consolidated Interim Financial Statements
Allianz Group acquires further stakes in Turkish insurance joint venture
In April 2008, the Allianz Group signed a share purchase agreement regarding the acquisition of a shareholding in Koç Allianz Sigorta AŞ and Koç Allianz Hayat ve Emeklilik. The transaction is subject to relevant regulatory and competition board approval.
Within this transaction the Allianz Group acquires 47.1% of shares in the non-life insurer Koç Allianz Sigorta AŞ and 49.0% of the shares in the life-insurance and pension company Koç Allianz Hayat ve Emeklilik AS for a total consideration of € 373 mn.
After the completion of the transaction the Allianz Group will control 84.2% of Koç Allianz Sigorta AŞ and 87.0% of Koç Allianz Hayat ve Emeklilik AŞ.
Munich, May 8, 2008
Allianz SE
The Board of Management

71
Table of Contents
Review Report Allianz Group Interim Report First Quarter of 2008
To Allianz SE, Munich
We have reviewed the condensed consolidated interim financial statements of the Allianz SE, Munich - comprising the balance sheet, income statement, condensed cash flow statement, statement of changes in equity and selected explanatory notes - together with the interim group management report of the Allianz SE, Munich for the period from January 1 to March 31, 2008 that are part of the quarterly financial report according to § 37 x WpHG [„Wertpapierhandelsgesetz“: „German Securities Trading Act“]. The preparation of the condensed consolidated interim financial statements in accordance with those IFRS applicable to interim financial reporting as adopted by the EU and as issued by the IASB, and of the interim group management report in accordance with the requirements of the WpHG applicable to interim group management reports, is the responsibility of the Company’s management. Our responsibility is to issue a report on the condensed consolidated interim financial statements and on the interim group management report based on our review.
We performed our review of the condensed consolidated interim financial statements and the interim group management report in accordance with the German generally accepted standards for the review of financial statements promulgated by the Institut der Wirtschaftsprüfer (IDW). Those standards require that we plan and conduct the review so that we can preclude through critical evaluation, with a certain level of assurance, that the condensed con-
solidated interim financial statements have not been prepared, in material aspects, in accordance with the IFRS applicable to interim financial reporting as adopted by the EU and as issued by the IASB, and that the interim group management report has not been prepared, in material aspects, in accordance with the requirements of the WpHG applicable to interim group management reports. A review is limited primarily to inquiries of company employees and analytical assessments and therefore does not provide the assurance attainable in a financial statement audit. Since, in accordance with our engagement, we have not performed a financial statement audit, we cannot issue an auditor’s report.
Based on our review, no matters have come to our attention that cause us to presume that the condensed interim consolidated financial statements have not been prepared, in all material respects, in accordance with the IFRS applicable to interim financial reporting as adopted by the EU and as issued by the IASB, or that the interim group management report has not been prepared, in all material respects, in accordance with the requirements of the WpHG applicable to interim group management reports.
Munich, May 8, 2008
KPMG Deutsche Treuhand-Gesellschaft
Aktiengesellschaft
Wirtschaftsprüfungsgesellschaft
 |  | |
Elisabeth Andriowsky | Johannes Pastor | |
Independent Auditor | Independent Auditor |
72
Table of Contents
Allianz SE
Koeniginstrasse 28
80802 Muenchen
Germany
Telephone +49 89 38 00 0
info@allianz.com
www.allianz.com
Table of Contents
SIGNATURE
Pursuant to the requirements of the Securities Exchange Act of 1934, the registrant has duly caused this report to be signed on its behalf by the undersigned, thereunto duly authorized.
Date: May 9, 2008
| ALLIANZ SE | ||||
| By | /s/ Burkhard Keese | |||
| Name: | Burkhard Keese | |||
| Title: | Executive Vice President Group Financial Reporting | |||
| ALLIANZ SE | ||||
| By | /s/ Harold Michael Langley-Poole | |||
| Name: | Harold Michael Langley-Poole | |||
| Title: | Head of Group Management Reporting | |||