Table of Contents
SECURITIES AND EXCHANGE COMMISSION
Washington, D.C. 20549
Form 6-K
Report of Foreign Private Issuer
Pursuant to Rules 13a-16 or 15d-16 under
the Securities Exchange Act of 1934
for the period ended June 30, 2009
Commission file Number: 1-15154
ALLIANZ SE
Königinstrasse 28
80802 Munich
Germany
(Address of principal executive offices)
Indicate by check mark whether the registrant files or will file annual reports under cover Form 20-F or Form 40-F.
Form 20-F x Form 40-F ¨
Indicate by check mark if the registrant is submitting the Form 6-K in paper as permitted by Regulation S-T Rule 101(b)(1):
Indicate by check mark if the registrant is submitting the Form 6-K in paper as permitted by Regulation S-T Rule 101(b)(7):
THIS REPORT ON FORM 6-K (EXCEPT FOR ANY NON-GAAP FINANCIAL MEASURE AS SUCH TERM IS DEFINED IN REGULATION G UNDER THE SECURITIES EXCHANGE ACT OF 1934, AS AMENDED) SHALL BE DEEMED TO BE INCORPORATED BY REFERENCE IN THE REGISTRATION STATEMENTS ON FORM S-8 (FILE NO. 333-13462 AND NO. 333-139900) AND ON FORM F-3 (FILE NO. 333-151308) OF ALLIANZ SE AND TO BE A PART THEREOF FROM THE DATE ON WHICH THIS REPORT IS FURNISHED, TO THE EXTENT NOT SUPERSEDED BY DOCUMENTS OR REPORTS SUBSEQUENTLY FILED OR FURNISHED. FOR THE AVOIDANCE OF DOUBT, THE DISCLOSURE CONTAINING ANY NON-GAAP FINANCIAL MEASURE CONTAINED IN THE ATTACHED REPORT, INCLUDING WITHOUT LIMITATION REFERENCES TO “CONSOLIDATED OPERATING PROFIT” AND OPERATING PROFIT AS IT RELATES TO THE ALLIANZ GROUP, INCLUDING THE TABLES ENTITLED “OPERATING PROFIT” AND “OPERATING PROFIT—SEGMENTS” ON PAGES 3 AND 4 (AS THEY RELATE TO THE ALLIANZ GROUP) AND THE SECTION ENTITLED “RECONCILIATION OF CONSOLIDATED OPERATING PROFIT AND INCOME BEFORE INCOME TAXES AND MINORITY INTERESTS IN EARNINGS”, AND TO ANY OTHER NON-GAAP FINANCIAL MEASURES, IS NOT INCORPORATED BY REFERENCE INTO THE ABOVE-MENTIONED REGISTRATION STATEMENTS FILED BY ALLIANZ SE.
Table of Contents
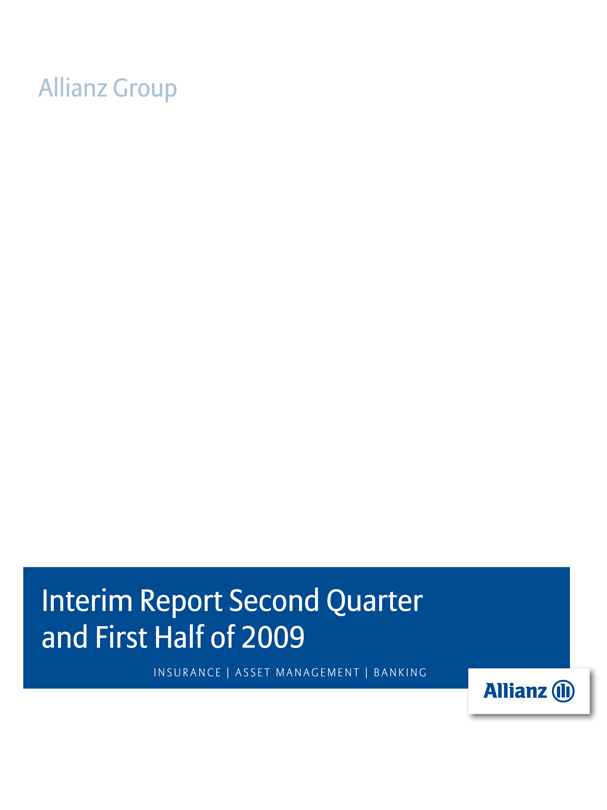
Table of Contents
To go directly to any chapter, simply clickØØ on the head-line or the page number
| Group Management Report | ||||
| Executive Summary and Outlook | 2 | |||
| Property-Casualty Insurance Operations | 11 | |||
| Life/Health Insurance Operations | 18 | |||
| Financial Services | 24 | |||
| Corporate Activities | 28 | |||
| Balance Sheet Review | 29 | |||
| Other Information | 37 | |||
| Condensed Consolidated Interim Financial Statements for the Second Quarter and the First Half of 2009 | ||||
| Detailed Index | 39 | |||
| Condensed Consolidated Interim Financial Statements | 40 | |||
| Notes to the Condensed Consolidated Interim Financial Statements | 46 | |||
Allianz Share
Development of the Allianz share price since January 1, 2009
indexed on the Allianz share price in€
Source: Thomson Reuters Datastream
Up-to-date information on the development of the Allianz share price is available atwww.allianz.com/share.
Basic Allianz share information
| Share type | Registered share with restricted transfer | |||
| Denomination | No-par-value share | |||
| Stock exchanges | All German stock exchanges, London, Paris, Zurich, Milan, New York | |||
| Security Codes | WKN 840 400 ISIN DE 000 840 400 5 | |||
| Bloomberg | ALV GY | |||
| Reuters | ALVG.DE |
Investor Relations
We endeavor to keep our shareholders up-to-date on all company developments. Our Investor Relations Team is pleased to answer any questions you may have.
Allianz SE
Investor Relations
Koeniginstrasse 28
80802 Muenchen
Germany
Fax: + 49 89 3800 3899
E-Mail: investor.relations@allianz.com
Internet:www.allianz.com/investor-relations
For telephone enquiries, our “Allianz Investor Line” is available:
+ 49 1802 2554269
+ 49 1802 ALLIANZ
Table of Contents
Allianz Group Key Data
| Three months ended June 30, | Six months ended June 30, | |||||||||||||||||||||||||
| 2009 | 2008 | Change previous | 2009 | 2008 | Change previous | |||||||||||||||||||||
| INCOME STATEMENT | ||||||||||||||||||||||||||
| Total revenues1) | € mn | 22,172 | 21,521 | 3.0% | 49,899 | 48,484 | 2.9% | |||||||||||||||||||
| Operating profit2) | € mn | 1,786 | 2,659 | (32.8)% | 3,205 | 4,885 | (34.4)% | |||||||||||||||||||
| Net income from continuing operations3) | € mn | 1,869 | 2,225 | (16.0)% | 2,293 | 3,605 | (36.4)% | |||||||||||||||||||
| Net loss from discontinued operations, net of income taxes and minority interests in earnings3) | € mn | — | (683) | — | (395) | (915) | 56.8% | |||||||||||||||||||
| Net income3) | € mn | 1,869 | 1,542 | 21.2% | 1,898 | 2,690 | (29.4)% | |||||||||||||||||||
| SEGMENTS (Continuing Operations) 4) | ||||||||||||||||||||||||||
| Property-Casualty | ||||||||||||||||||||||||||
| Gross premiums written | € mn | 9,522 | 9,842 | (3.3)% | 23,408 | 23,552 | (0.6)% | |||||||||||||||||||
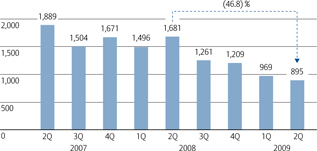
| Operating profit2) | € mn | 895 | 1,681 | (46.8)% | 1,864 | 3,177 | (41.3)% | |||||||||||||||||||
| Combined ratio | % | 98.9 | 93.5 | 5.4 pts | 98.8 | 94.5 | 4.3 pts | |||||||||||||||||||
| Life/Health | ||||||||||||||||||||||||||
| Statutory premiums | € mn | 11,766 | 10,729 | 9.7% | 24,779 | 23,056 | 7.5% | |||||||||||||||||||
| Operating profit2) | € mn | 990 | 703 | 40.8% | 1,392 | 1,292 | 7.7% | |||||||||||||||||||
| Cost-income ratio | % | 93.8 | 94.7 | (0.9) pts | 95.5 | 95.5 | 0.0 pts | |||||||||||||||||||
| Financial Services | ||||||||||||||||||||||||||
| Operating revenues | € mn | 926 | 925 | 0.1% | 1,788 | 1,846 | (3.1)% | |||||||||||||||||||
| Operating profit2) | € mn | 146 | 285 | (48.8)% | 344 | 540 | (36.3)% | |||||||||||||||||||
| Cost-income ratio | % | 83.2 | 68.8 | 14.4 pts | 79.8 | 70.2 | 9.6 pts | |||||||||||||||||||
| BALANCE SHEET | ||||||||||||||||||||||||||
| Total assets as of June 30,5) | € mn | 555,699 | 955,576 | (41.8)% | 555,699 | 955,576 | (41.8)% | |||||||||||||||||||
| Shareholders’ equity as of June 30,5) | € mn | 34,530 | 33,684 | 2.5% | 34,530 | 33,684 | 2.5% | |||||||||||||||||||
| Minority interests as of June 30,5) | € mn | 2,081 | 3,564 | (41.6)% | 2,081 | 3,564 | (41.6)% | |||||||||||||||||||
| SHARE INFORMATION | ||||||||||||||||||||||||||
| Basic earnings per share | € | 4.14 | 3.44 | 20.3% | 4.21 | 5.98 | (29.6)% | |||||||||||||||||||
| Diluted earnings per share | € | 4.13 | 3.39 | 21.8% | 4.17 | 5.85 | (28.7)% | |||||||||||||||||||
| Share price as of June 30,5) | € | 65.63 | 75.00 | (12.5)% | 65.63 | 75.00 | (12.5)% | |||||||||||||||||||
| Market capitalization as of June 30,5) | € bn | 29.7 | 34.0 | (12.5)% | 29.7 | 34.0 | (12.5)% | |||||||||||||||||||
| OTHER DATA | ||||||||||||||||||||||||||
| Third-party assets under management as of June 30,5) | € bn | 813 | 703 | 15.6% | 813 | 703 | 15.6% | |||||||||||||||||||
| 1) | Total revenues comprise Property-Casualty segment’s gross premiums written, Life/Health segment’s statutory premiums and Financial Services segment’s operating revenues. |
| 2) | The Allianz Group uses operating profit to evaluate the performance of its business segments and the Group as a whole. |
| 3) | Following the announcement of the sale on August 31, 2008, Dresdner Bank was qualified as held-for-sale and discontinued operations. The transfer of ownership of Dresdner Bank to Commerzbank was completed on January 12, 2009 as scheduled. Accordingly, assets and liabilities of Dresdner Bank have been deconsolidated in the first quarter 2009. The loss from derecognition of discontinued operations amounts to€ 395 mn and represents mainly the recycling of components of other comprehensive income. All income and expenses relating to the discontinued operations of Dresdner Bank have been reclassified and presented in a separate line item “Net loss from discontinued operations, net of income taxes and minority interests in earnings” in the consolidated income statements for all years presented in accordance with IFRS 5. |
| 4) | The Allianz Group operates and manages its activities through four segments: Property-Casualty, Life/Health, Financial Services and Corporate. For further information please refer to Note 5 of our condensed consolidated interim financial statements. |
| 5) | 2008 figures as of December 31, 2008. |
1
Table of Contents
– Net income increased 21% to€ 1.9 billion.
– Particularly good results in Life.
– Solvency ratio remains strong at 159%.
Second Quarter 2009 at a Glance
Robust results in tough environment
In the second quarter net income amounted to € 1,869 million, an increase of 21.2% compared to € 1,542 million in the second quarter 2008. Total revenues of € 22,172 million increased by 3%. Operating profit was solid at € 1,786 million. While there was a significant reduction in Property-Casualty operating profit, there was a particularly strong operating profit in Life/Health operations.
Allianz Group’s Consolidated Results of Operations
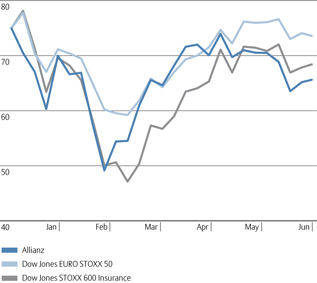
Total revenues1)
Total revenues
in€ bn
On an internal basis 2), total revenues increased by 1.4% in comparison to the prior year quarter. The Life/Health insurance segment delivered 7.7% growth, whilst internal growth in our Property-Casualty operations declined by 3.7%. Revenues in the Financial Services segment decreased on an internal basis by 11.7% in the second quarter 2009.
Foreign currency exchange effects increased total revenues by € 223 million. First time consolidation effects mainly of cominvest and our Turkish subsidiary contributed € 132 million to total revenues, which went up by 3.0% on a nominal basis.
| 1) | Total revenues comprise Property-Casualty segment’s gross premiums written, Life/Health segment’s statutory premiums and Financial Services segment’s operating revenues. |
| 2) | Internal total revenue growth excludes the effects of foreign currency translation as well as acquisitions and disposals. Please refer to page 38 for a reconciliation of nominal total revenue growth to internal total revenue growth for each of our segments and the Allianz Group as a whole. |
2
Table of Contents
Allianz Group Interim Report Second Quarter and First Half of 2009 Group Management Report
In the first six months of 2009 total revenues of € 49,899 million were up 1.4 % on an internal basis. Life/Health insurance operations increased by 5.5% , whilst growth declined in our Property-Casualty and Financial Services operations by 0.9% and 14.7%, respectively. Foreign currency exchange effects increased total revenues by € 454 million and first-time consolidation effects contributed € 288 million. Over-all, total revenues increased by 2.9% on a nominal basis for the first half year.
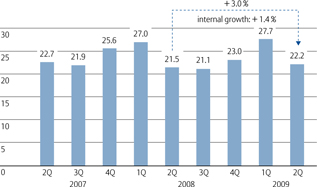
Total revenues – Segments
in€ mn
Reflective of the overall decline in industrial country gross domestic product and the continuing softening markets, gross premiums written fromProperty-Casualty operations were down by 3.7% on an internal basis. On a nominal basis, gross premiums written were down by 3.3% to € 9,522 million, including the first-time consolidation of our subsidiary in Turkey and a negative foreign currency translation effect.
For the first half year, gross premiums written of € 23,408 million decreased by 0.9% on an internal basis while nominal growth decreased by 0.6%.
| 1) | Total revenues include€ (42) mn,€ 25 mn and€ 16 mn from consolidation for 2Q 2009, 2008 and 2007, respectively. |
In ourLife/Health segment statutory premiums of € 11,766 million grew by 7.7% on an internal basis in the second quarter of 2009. This growth is driven by a continuing strong demand for products with minimum guarantees and participating components. In the first half of 2009 statutory premiums of € 24,779 million grew by 5.5% on an internal basis.
Revenues in ourFinancial Services segment remained stable at € 926 million in the second quarter. This was pre-dominantly driven by the revenue development in Asset Management. Adjusted for foreign currency and consolidation effects total revenues were 11.7% lower on an internal basis compared to previous year’s quarter. For the first six months operating revenues for the Financial Services segment were € 1,788 million, a decline of 14.7% on an internal basis.
Operating profit
Operating profit
in€ mn
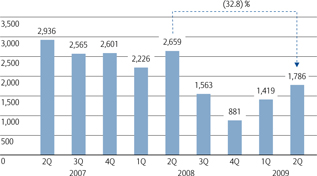
Operating profit of € 1,786 million doubled compared to the fourth quarter 2008 and was 25.9% higher than in the first quarter 2009. But when compared to the high level of the second quarter 2008, operating profit was down by 32.8%. On a six months basis operating profit of € 3,205 million was down by 34.4%.
3
Table of Contents
Group Management Report Allianz Group Interim Report Second Quarter and First Half of 2009
Operating profit – Segments
in€ mn
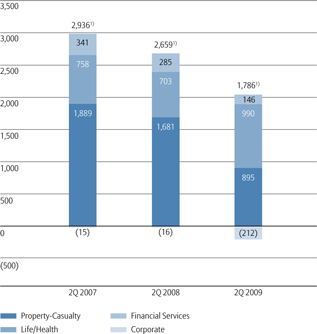
At € 895 million, theProperty-Casualty segment operating profit decreased by 46.8% compared to the previous year. This decline was attributable to a lower underwriting result as well as a lower interest and similar income. On a six months basis, operating profit declined by 41.3% to € 1,864 million, for the same reasons as the decline in the second quarter.
In theLife/Health segment operating profit increased to € 990 million, an increase of 40.8 % in comparison to € 703 million in the second quarter 2008 and represented a strong recovery after € 402 million operating profit in the first quarter 2009 and a loss in the fourth quarter 2008 of € 302 million. The main driver for this positive development is the investment result. This is based on the high quality of our fixed income debt portfolio as reflected in low impairments. For the first six months of 2009 operating profit increased to € 1,392 million compared to € 1,292 million the first six months of 2008.
| 1) | Operating profit includes€ (33) mn,€ 6 mn and€ (37) mn from consolidation for 2Q 2009, 2008 and 2007, respectively. |
In theFinancial Services segment we recorded an operating profit of € 146 million, down 48.8% compared to last year’s quarter. A particular driver for this development was the set-up costs for our banking operations in Germany. For the first six months we recorded an operating profit of € 344 million, a decline of 36.3%. The development was largely consistent with the 2009 to 2008 second quarter comparison.
In the second quarter 2009, the operating loss fromCorporate activities increased to € 212 million, due to lower current investment income and negative foreign currency effects compared to 2008, which were partially off-set by hedge results. For the first six months the operating loss from Corporate activities increased to € 383 million compared to € 120 million in 2008.
Non-operating result
Non-operating items amounted to a profit of € 548 million in the second quarter 2009 compared to a profit of € 156 million in 2008. This positive development was mainly due to lower non-operating impairments and higher income from financial assets and liabilities carried at fair value through income. Realized gains amounting to € 959 million were € 95 million lower than in the second quarter of 2008.
In the first half of 2009 our non-operating result amounted to a loss of € 426 million compared to a loss of € 52 million in the first six months of 2008. This development was mainly driven by lower realized gains and an expense from fully consolidated private equity investments.
4
Table of Contents
Allianz Group Interim Report Second Quarter and First Half of 2009 Group Management Report
Net income (loss) from continuing operations
Net income (loss) from continuing operations
in€ mn
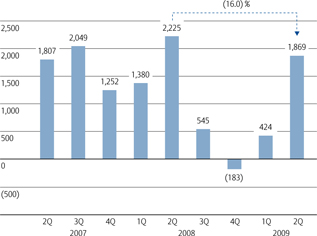
Net income from continuing operations was € 1,869 million compared to € 2,225 million in the second quarter 2008.
Income taxes amounted to € 447 million in the second quarter 2009 compared to € 509 million in the second quarter 2008. The effective tax rate was 19.2% compared to 18.1% in the second quarter 2008.
On a six months basis income taxes amounted to € 468 million in 2009 compared to € 1,081 million in 2008. The effective tax rate was 16.8% compared to 22.4% in the first six months in 2008.
Net income (loss) from discontinued operations
Since the completion of the Dresdner Bank sale there are no further results from discontinued operations.
Net income
Net income for the second quarter 2009 amounted to € 1,869 million compared to € 1,542 million one year ago. On a six months basis, net income was € 1,898 million compared to € 2,690 million in the first six months of 2008.
Earnings per share 1)
in€
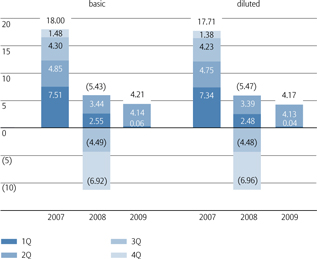
The net income translates into basic earnings per share of € 4.21 (diluted: € 4.17) for the first half of 2009.
Shareholders’ equity
Shareholders’ equity 2)
in€ mn
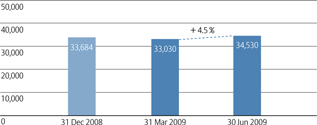
As of June 30, 2009, shareholders’ equity amounted to € 34,530 million, up 4.5% from March 31, 2009. For the second quarter, net income increased equity by € 1,869 million and unrealized gains added € 1,590 million. Dividends amounting to € 1,580 million for the fiscal year 2008 paid by Allianz SE in the second quarter 2009 reduced equity.
| 1) | For further information please refer to Note 38 to our condensed consolidated interim financial statements. |
| 2) | Does not include minority interests. |
5
Table of Contents
Group Management Report Allianz Group Interim Report Second Quarter and First Half of 2009
Conglomerate solvency
in€ bn
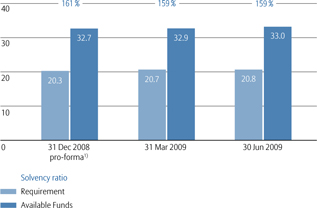
As of June 30, 2009 our available funds for the solvency margin, required for our insurance segments and our banking and asset management business were € 33.0 billion including off-balance sheet reserves, surpassing the minimum legally stipulated level by € 12.2 billion. This margin resulted in a cover ratio of 159% 2) at June 30, 2009. Our solvency position therefore remains strong.
| 1) | Available funds and requirement as of December 31, 2008 including discontinued operations were adjusted to reflect the pro-forma view. For example, we removed hybrid capital related to Dresdner Bank from available funds and adjusted the deduction of goodwill and other intangible assets. Furthermore, we deleted the requirement of our discontinued operations. |
| 2) | During the fiscal year, conglomerate solvency is partially based on assumptions. The extent to which intangible assets related to certain private equity investments are to be deducted from our own funds for the purpose of the conglomerate solvency calculation has not yet been finally agreed by BaFin. |
6
Table of Contents
Allianz Group Interim Report Second Quarter and First Half of 2009 Group Management Report
Total revenues and reconciliation of operating profit to net income
| Three months ended June 30, | Six months ended June 30, | |||||||||||||||
2009 € mn | 2008 € mn | 2009 € mn | 2008 € mn | |||||||||||||
| Total revenues1) | 22,172 | 21,521 | 49,899 | 48,484 | ||||||||||||
| Premiums earned (net) | 14,477 | 14,559 | 29,157 | 29,321 | ||||||||||||
| Interest and similar income | 4,800 | 5,427 | 9,214 | 9,883 | ||||||||||||
| Operating income from financial assets and liabilities carried at fair value through income (net) | 750 | (405) | 520 | (109) | ||||||||||||
| Operating realized gains/losses (net) | 659 | 348 | 824 | 997 | ||||||||||||
| Fee and commission income | 1,426 | 1,555 | 2,762 | 3,060 | ||||||||||||
| Other income | 15 | 15 | 19 | 366 | ||||||||||||
| Claims and insurance benefits incurred (net) | (11,105) | (10,787) | (22,884) | (22,101) | ||||||||||||
| Change in reserves for insurance and investment contracts (net) | (2,684) | (1,466) | (3,305) | (3,311) | ||||||||||||
| Interest expenses, excluding interest expenses from external debt | (131) | (233) | (303) | (474) | ||||||||||||
| Loan loss provisions | (24) | (1) | (39) | (6) | ||||||||||||
| Operating impairments of investments (net) | (271) | (987) | (1,409) | (2,060) | ||||||||||||
| Investment expenses | (429) | (159) | (367) | (595) | ||||||||||||
| Acquisition and administrative expenses (net), excluding acquisition-related expenses | (5,168) | (4,625) | (9,968) | (8,964) | ||||||||||||
| Fee and commission expenses | (552) | (592) | (1,043) | (1,143) | ||||||||||||
| Operating restructuring charges | 4 | — | 3 | (1) | ||||||||||||
| Other expenses | (1) | — | (2) | (1) | ||||||||||||
| Reclassification of tax benefits | 20 | 10 | 26 | 23 | ||||||||||||
| Operating profit | 1,786 | 2,659 | 3,205 | 4,885 | ||||||||||||
| Non-operating income from financial assets and liabilities carried at fair value through income (net) | 137 | (88) | 37 | 39 | ||||||||||||
| Non-operating realized gains/losses (net) | 959 | 1,054 | 1,213 | 1,464 | ||||||||||||
| Income from fully consolidated private equity investments (net) | (101) | 29 | (157) | 52 | ||||||||||||
| Interest expenses from external debt | (214) | (233) | (452) | (485) | ||||||||||||
| Non-operating impairments of investments (net) | (144) | (506) | (896) | (903) | ||||||||||||
| Acquisition-related expenses | (44) | (79) | (53) | (186) | ||||||||||||
| Amortization of intangible assets | (11) | (3) | (15) | (8) | ||||||||||||
| Non-operating restructuring charges | (14) | (8) | (77) | (2) | ||||||||||||
| Reclassification of tax benefits | (20) | (10) | (26) | (23) | ||||||||||||
| Non-operating items | 548 | 156 | (426) | (52) | ||||||||||||
| Income from continuing operations before income taxes and minority interests in earnings | 2,334 | 2,815 | 2,779 | 4,833 | ||||||||||||
| Income taxes | (447) | (509) | (468) | (1,081) | ||||||||||||
| Minority interests in earnings | (18) | (81) | (18) | (147) | ||||||||||||
| Net income from continuing operations | 1,869 | 2,225 | 2,293 | 3,605 | ||||||||||||
| Net income (loss) from discontinued operations, net of income taxes and minority interests in earnings | — | (683) | (395) | (915) | ||||||||||||
| Net income | 1,869 | 1,542 | 1,898 | 2,690 | ||||||||||||
| 1) | Total revenues comprise Property-Casualty segment’s gross premiums written, Life/Health segment’s statutory premiums (including unit-linked and other investment-oriented products) and Financial Services segment’s operating revenues. |
7
Table of Contents
Group Management Report Allianz Group Interim Report Second Quarter and First Half of 2009
Risk Management
Risk management is an integral part of our business processes and supports our value-based management. As our internal risk capital model provides management with information which allows for active asset-liability management and monitoring, risk is well controlled and managed.
The information contained in the risk report in our 2008 Annual Report is still valid.
Events After the Balance Sheet Date
Placement of a senior bond with a volume of€ 1.5 billion
On July 15, 2009 Allianz Finance II B.V., a fully consolidated subsidiary of the Allianz SE, placed a senior bond with a volume of € 1.5 billion on the capital market to institutional Investors. The senior bond has a maturity of 10 years and a fixed coupon of 4.75%.
Outlook
Economic Outlook
Developments in the second quarter of 2009 confirmed the first signs of economic recovery that had appeared in the first quarter. Stock markets recorded a strong rebound and corporate bond spreads narrowed appreciably.
This should not obscure the fact that the financial crisis had plunged the world economy into the severest recession for more than 50 years in late 2008 and early 2009. Therefore, despite the recovery we expect the global economy to shrink by around 2.5% in 2009 and industrial country gross domestic product to decrease by as much as 3.5%.
Recovery is likely, but uncertainty continues
Against this environment, forecasts are particularly subject to uncertainty. As a result, a wide variety of economic scenarios from a prolonged recession to an inflationary recovery are currently on the table. In our view a rebound in the world economy is likely in the second half of 2009. A host of leading indicators, including hard indicators such as new orders and industrial production, are pointing upwards again. The world economy is increasingly emerging from its state of shock. The massive boost from fiscal and monetary policy is starting to work. However, economic policy will not be able to maintain this course forever and in many countries private households will have to reduce their debt. This will weigh on economic growth in the medium term.
The challenges facing economic policy in the years ahead are enormous. High government deficits have to be reduced. Monetary policy needs to deal with excess liquidity in a timely fashion to avoid the risk of inflation. On the international stage there needs to be a high degree of cooperation to enable a sustained recovery in world trade with-out large external imbalances.
Regional economic performance
The performance in the emerging markets is very uneven in 2009. Asia is set to be the sole region to record positive growth, with an increase of 2.8%. China and India lead the way here. We estimate that Eastern European countries will decrease by 4.3%, primarily because recent growth in many Eastern European countries has been financed by the rapid
8
Table of Contents
Allianz Group Interim Report Second Quarter and First Half of 2009 Group Management Report
expansion of credit, partly in foreign currencies. Latin America will not escape the downturn either, we expect economic activity to shrink by 3% in 2009.
The economy of the United States will shrink by about 2.3% in 2009, a fairly modest figure bearing in mind that the U.S. was at the center of the real estate and banking crisis. We put the drop in Japanese GDP at 6.5%. Although the Japanese economy itself has been relatively untouched by the financial crisis, its dependence on export demand has had a notice-able impact on the economy’s performance, given the current environment. The same is true for Germany, where we expect economic activity to decline by 4.1%.
Financial markets
With the economy stabilizing, the prospects for a further recovery on the financial markets have improved. However, they are likely to remain volatile. Too many risks still exist – both on the financial markets and on banks’ books as well as in the real economy. With public sector debt and monetary policy inflating, bond yields could also rise appreciably. However, the economic environment on the financial markets in mid-2009 is significantly better than at the beginning of the year.
Environment for financial services providers remains challenging
Property-Casualty as well as Life insurance face markedly weaker demand due to the economic downturn and rising unemployment. Prices are moving upward only slowly and only in specific areas of business.
However, the underlying long-term driver for Life/Health insurance remains intact: due to demographic change, social security systems financed on a pay-as-you-go basis are not sustainable. Against the background of rising state deficits caused by the multitude of state rescue packages to dampen the impact of the current financial crisis, social security reforms already adopted might prove to be too generous in the future. Private health care and old-age provision are going to become even more important.
Outlook for the Allianz Group
Allianz is well capitalized and our solvency ratio remains strong at 159%, after a notional accrual of 2009 dividend for the first half amounting to € 0.9 billion. With a high quality investment portfolio, conservative risk appetite and active risk management program, our solvency position has little sensitivity to downside risks, and we are able to withstand a prolonged difficult market environment.
The underlying fundamentals in our operations are healthy. In Property-Casualty, prices are moving upward only slowly and only in specific areas of business. However, we estimate a slightly favorable trend overall driven by tariff increases. As well as the positive impacts from premium increases, compared to the first half of 2009 we expect our combined ratio to improve also through the claims and expenses lines. Higher claims expenses in the first half of 2009 reflected a multitude of weather-related claims. We anticipate a lower impact from such sources in the second half of 2009. Actions have been taken to further improve selective underwriting in markets where highest losses have been recorded, and we expect to see the benefits of those actions flow through the operating results over time. As a result of our ongoing efficiency and effectiveness initiatives, we are realizing further improvements in productivity that we expect will keep the growth in claims and administrative expenses to below the level of inflation.
The fundamentals of our Life portfolio are sound and benefit from our conservative risk strategy. Top line growth reflects continued demand for investment products with underlying guarantees and investment participation, and further positive capital market and economic developments would support the growth trend at good margins, and lead to a more stable value generation in our Life/Health businesses. Actions taken in the U.S. to redesign and reprice products have stabilized and improved the situation there, and strong inflows in the fixed indexed annuities in the second quarter with a balanced risk profile for the company look set to continue. As capital markets stabilized and credit spreads narrowed, there was a catch-up effect in the U.S. operating profit in line with our earlier predictions which may not recur in the second half of 2009. For the full year 2009, we expect interest and similar income in Life/Health to exceed the level of 2008.
9
Table of Contents
Group Management Report Allianz Group Interim Report Second Quarter and First Half of 2009
In Financial Services, our Asset Management business generated its highest profit of the last twelve months, and operating profit is consistently moving up again, supported by the integration of cominvest. While the equities business continues to suffer, the fixed-income business is performing outstandingly, and we expect this to continue for the rest of 2009. Third-party assets under management now exceed € 800 billion for the first time. A significant part of that asset growth occurred towards the end of the second quarter, and the associated increase in operating revenues that can be expected will flow through more strongly in the second half. We are realizing the benefits of our ongoing active expense management program, and we expect to see our cost-income ratio come down.
The set-up of Allianz Bank has been largely completed and the major part of the planned level of investment expenses has already been incurred.
Following the sale of Dresdner Bank, the result from discontinued operations is fixed and plays no further role in our outlook.
We remain confident that Allianz is well positioned to take advantage of an improving economic and operating environment, and has a sound platform for delivering solid earnings in our core insurance and asset accumulation businesses.
As always, natural catastrophes and adverse developments in the capital markets, as well as the factors stated in our cautionary note regarding forward-looking statements, may severely impact our results of operations.
Cautionary note regarding forward-looking statements
The statements contained herein may include statements of future expectations and other forward-looking statements that are based on management’s current views and assumptions and involve known and unknown risks and uncertainties that could cause actual results, performance or events to differ materially from those expressed or implied in such statements. In addition to statements which are forward-looking by reason of context, the words “may”, “will”, “should”, “expects”, “plans”, “intends”, “anticipates”, “believes”, “estimates”, “predicts”, “potential”, or “continue” and similar expressions identify forward-looking statements. Actual results, performance or events may differ materially from those in such statements due to, without limitation, (i) general economic conditions, including in particular economic conditions in the Allianz Group’s core business and core markets, (ii) performance of financial markets, including emerging markets, and including market volatility, liquidity and credit events (iii) the frequency and severity of insured loss events, including from natural catastrophes and including the development of loss expenses, (iv) mortality and morbidity levels and trends, (v) persistency levels, (vi) the extent of credit defaults, (vii) interest rate levels, (viii) currency exchange rates including the Euro/U.S. Dollar exchange rate, (ix) changing levels of competition, (x) changes in laws and regulations, including monetary convergence and the European Monetary Union, (xi) changes in the policies of central banks and/or foreign governments, (xii) the impact of acquisitions, including related integration issues, (xiii) reorganization measures, and (xiv) general competitive factors, in each case on a local, regional, national and/or global basis. Many of these factors may be more likely to occur, or more pronounced, as a result of terrorist activities and their consequences. The matters discussed herein may also be affected by risks and uncertainties described from time to time in Allianz SE’s filings with the U.S. Securities and Exchange Commission. The company assumes no obligation to update any forward-looking statement.
10
Table of Contents
Property-Casualty Insurance Operations
– Gross premiums written of€ 9,522 million in soft markets.
– Combined ratio of 98.9%.
Earnings Summary
Gross premiums written
2009 to 2008 second quarter comparison
On a total growth basis, gross premiums written were down by 3.3% to € 9,522 million on a nominal basis. Adjusted for the consolidation of our subsidiary in Turkey and negative foreign currency translation effects of € 42 million, the decline was 3.7% 1). Most of this decline was due to a lower amount of crop business underwritten in the United States, which is strongly dependent on the commodity price development. Without this effect internal growth would have been only (0.5)%. In the second quarter 2009 we observed markets generally remaining soft. In the face of the ongoing recession we stayed disciplined with regards to risk selection, and 3.6% of the revenue decline resulted from a reduction in volume, while price development was positive with 0.6%.
In the second quarter 2009, motor business, accounting for 38% of our portfolio 2), reported € 208 million less premiums. Our non-motor business decreased by € 114 million.
The discussion about overall price changes in the paragraphs below relate to developments in the respective operating entity or country. We comment on the development of gross premiums written on an internal basis, meaning adjusted for foreign currency translation and (de-) consolidation effects, in order to provide more comparable information.
| 1) | This decline comprises volume and price effects as described below as well as negative development of other special Property-Casualty-lines amounting to (0.7)%. |
| 2) | With regard to the total Property-Casualty business excluding reinsurance, AGCS, credit and travel business. |
Gross premiums written – Internal growth rates
in %
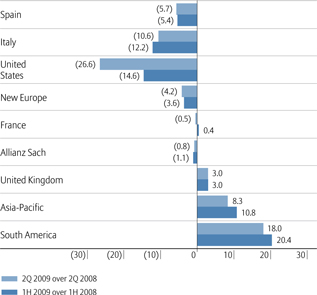
InSpain revenues declined by 5.7% or € 30 million. Volume developed favorably due to an increase in the number of policies and customers. In contrast, tough competition in motor and commercial lines in an overall soft market environment led to lower prices. Despite negative price impacts – we estimate it to be around 6.3% – our Spanish operation is one of our most profitable businesses.
InItaly, revenues declined by 10.6% or € 128 million which was mainly attributable to lower average premiums in motor business which are still impacted by the Bersani law. Volume decreased in both motor and non-motor business, as we continued to pursue a selective underwriting approach and active portfolio cleaning. We estimate the negative price effect on premiums written to be 3.3%.
11
Table of Contents
Group Management Report Allianz Group Interim Report Second Quarter and First Half of 2009
In theUnited States gross premiums written were down by 26.6% or € 248 million. Volume decreased mostly in our crop business, driven by lower commodity prices. In addition, overall rates were still relatively low and the market remained soft, although we observed a positive price trend in commercial lines. We estimate the negative price effect on premiums written to be 2.6%.
InNew Europe, revenues decreased by 4.2% or € 33 million. The volume decline was mainly driven by the economic recession affecting in particular motor business due to less car registrations. In non-motor business the decrease in volume resulted from lower sales of voluntary medical insurance. Prices in New Europe decreased as a result of the high competition in the market. The estimated negative price effect on premiums written was 0.8%.
Revenues inFrance were down by 0.5% or € 4 million. In order to address the high combined ratio, we increased prices in almost all business lines. As a consequence, in a competitive market, there was some loss of volume. The estimated positive price effect on premiums written was 2.5%. The decrease in volume was partially offset by higher sales in commercial lines.
Gross premiums written atAllianz Sach in Germany decreased by 0.8% or € 14 million. This decline was attributable to lower prices and volume in motor business. The volume decrease was mainly a result of a portfolio cleaning exercise, particularly in non-profitable fleet business in order to improve our combined ratio. Prices decreased as competitors offered secondary discounted tariffs and customers displayed higher price sensitivity. In non-motor business we recorded lower volume but higher prices mainly in personal property and corporate business. We estimate the positive overall price effect to be 2.5%.
In theUnited Kingdom gross premiums written increased by 3.0% or € 16 million. The volume decreased slightly mainly driven by personal lines as a result of active portfolio cleaning in order to improve our profitability, and the fact that we decided to discontinue our direct business. Rates increased in commercial lines and personal lines. We estimate the positive price effect to be 4.3%.
InAustralia, revenues increased by 14.1% or € 55 million. This increase resulted mainly from significant price increases which were implemented in mid-2008 according to overall market hardening. In addition volume grew, mainly driven by motor and household. There was a positive price effect of an estimated 8.4%.
InSouth America, revenues increased by 18.0% or € 44 million mainly driven by Brazil, where we continued to benefit from better penetration in regions outside the major metropolitan areas. Motor, fire and engineering contributed most to the development.
AtAGCS premiums increased by 9.5% or € 73 million. This development stemmed from volume growth in marine and liability business. Increased prices resulted from our energy, aviation and financial lines of business.
At ourcredit insurance business we increased prices on average by 10%. At the same time we reduced our exposure to large multinational corporations. In addition, the volume of our business declined as a result of lower trading volume of our customers.
2009 to 2008 first half comparison
Gross premiums written of € 23,408 million decreased on an internal basis by 0.9%. 1.2% of this decrease resulted from a reduction in volume, while there was a 0.5% positive price effect. On a nominal basis, revenues were down by 0.6%. Consolidation and de-consolidation effects impacted revenue development positively by 0.8% and were mainly attributable to the consolidation of our Turkish entity. Currency translation had a negative impact of 0.5%. The developments in most of our markets were largely consistent with the 2009 to 2008 second quarter comparison, whereas our operations in France showed higher revenues in the first quarter 2009 which outweighed the decline in the second quarter.
12
Table of Contents
Allianz Group Interim Report Second Quarter and First Half of 2009 Group Management Report
Operating profit
Operating profit
in€ mn
2009 to 2008 second quarter comparison
Ouroperating profit dropped by 46.8% to € 895 million. This decline was mainly attributable to a lower underwriting result, down by € 487 million, and a decrease in interest and similar income of € 399 million. The lower underwriting result stemmed firstly from our credit insurance at Euler Hermes, secondly from lower releases of prior years’ loss reserves and thirdly from higher expenses. The decrease in interest and similar income resulted primarily from lower dividend income.
Thecombined ratio increased by 5.4 percentage points to 98.9% due to higher accident year losses (making up for 1.8 percentage points), lower releases of prior years’ loss reserves contributing 2.7 percentage points, and higher expenses with an impact of 0.9 percentage points.
Theaccident year loss ratio amounted to 72.7% and thus increased by 1.8 percentage points. Thereof, change in frequency and severity contributed 2.4 percentage points. The losses of our credit insurance business at Euler Hermes added another 0.7 percentage points to this deterioration as the macroeconomic environment resulted in a significantly higher frequency of defaults and delayed payments. A lower load from natural catastrophes, down by 1.2 percentage points, partly offset these effects. In addition we recorded a positive impact from higher prices.
The overall impact from natural catastrophes was € 105 million, including the earthquake in Italy, May hail and hailstorm “Felix” in Germany.
Acquisition and administrative expenses increased by 2.7% to € 2,657 million. This development was driven mostly by higher acquisition expenses, which increased by € 56 million to € 1,819 million. This increase resulted from higher business volume relating partly to external growth. Administrative expenses went up slightly by € 15 million to € 838 million. Theexpense ratio increased by 0.9 percentage points to 28.3%.
Operating net investment income
| Three months ended June 30, | Six months ended June 30, | |||||||||||||||
2009 € mn | 2008 € mn | 2009 € mn | 2008 € mn | |||||||||||||
| Interest and similar income | 932 | 1,331 | 1,865 | 2,382 | ||||||||||||
| Operating income from financial assets and liabilities carried at fair value through income (net) | 52 | (65) | 38 | 29 | ||||||||||||
| Operating realized gains/losses (net) | 20 | 61 | 16 | 58 | ||||||||||||
| Operating impairments of investments (net) | (4) | (72) | (66) | (165) | ||||||||||||
| Investment expenses | (128) | (79) | (106) | (202) | ||||||||||||
| Changes in reserves for insurance and investment contracts (premium refunds) | (64) | (12) | (54) | 37 | ||||||||||||
| Operating net investment income | 808 | 1,164 | 1,693 | 2,139 | ||||||||||||
13
Table of Contents
Group Management Report Allianz Group Interim Report Second Quarter and First Half of 2009
Net investment income decreased by € 356 million to € 808 million.Interest and similar income decreased by 30.0% to € 932 million, primarily due to lower dividend income as a result of reduced equity investments. This effect will be partially recovered by the end of the year since the majority of the equity disposal proceeds were invested in interest-bearing debt securities. The lower interest rate environment resulted in a reduced yield on our fixed-income investments.Investment expensesamounted to € 128 million, an increase of 62.0% due to negative currency translation effects mainly driven by the U.S. Dollar. This effect was partially offset by our currency hedging activities.
2009 to 2008 first half comparison
On a six months basis, operating profit declined by 41.3% to € 1,864 million. This development was mainly driven by a lower underwriting result and lower operating net investment income. The expense ratio increased by 0.9 percentage points to 28.0% and our combined ratio was up by 4.3 percentage points to 98.8%.
14
Table of Contents
Allianz Group Interim Report Second Quarter and First Half of 2009 Group Management Report
Property-Casualty segment information
| Three months ended June 30, | Six months ended June 30, | |||||||||||||||
2009 € mn | 2008 € mn | 2009 € mn | 2008 € mn | |||||||||||||
| Gross premiums written1) | 9,522 | 9,842 | 23,408 | 23,552 | ||||||||||||
| Ceded premiums written | (985) | (1,115) | (2,355) | (2,400) | ||||||||||||
| Change in unearned premiums | 828 | 721 | (2,356) | (2,531) | ||||||||||||
| Premiums earned (net) | 9,365 | 9,448 | 18,697 | 18,621 | ||||||||||||
| Interest and similar income | 932 | 1,331 | 1,865 | 2,382 | ||||||||||||
| Operating income from financial assets and liabilities carried at fair value through income (net) | 52 | (65) | 38 | 29 | ||||||||||||
| Operating realized gains/losses (net) | 20 | 61 | 16 | 58 | ||||||||||||
| Fee and commission income | 270 | 293 | 542 | 560 | ||||||||||||
| Other income | 5 | 7 | 8 | 257 | ||||||||||||
| Operating revenues | 10,644 | 11,075 | 21,166 | 21,907 | ||||||||||||
| Claims and insurance benefits incurred (net) | (6,608) | (6,247) | (13,241) | (12,548) | ||||||||||||
| Changes in reserves for insurance and investment contracts (net) | (95) | (70) | (125) | (99) | ||||||||||||
| Interest expenses | (26) | (91) | (60) | (179) | ||||||||||||
| Loan loss provisions | (2) | (1) | (8) | (1) | ||||||||||||
| Operating impairments of investments (net) | (4) | (72) | (66) | (165) | ||||||||||||
| Investment expenses | (128) | (79) | (106) | (202) | ||||||||||||
| Acquisition and administrative expenses (net) | (2,657) | (2,586) | (5,232) | (5,040) | ||||||||||||
| Fee and commission expenses | (229) | (248) | (463) | (496) | ||||||||||||
| Other expenses | — | — | (1) | — | ||||||||||||
| Operating expenses | (9,749) | (9,394) | (19,302) | (18,730) | ||||||||||||
| Operating profit | 895 | 1,681 | 1,864 | 3,177 | ||||||||||||
| Loss ratio2)in % | 70.6 | 66.1 | 70.8 | 67.4 | ||||||||||||
| Expense ratio3)in % | 28.3 | 27.4 | 28.0 | 27.1 | ||||||||||||
| Combined ratio4)in % | 98.9 | 93.5 | 98.8 | 94.5 | ||||||||||||
| 1) | For the Property-Casualty segment, total revenues are measured based upon gross premiums written. |
| 2) | Represents claims and insurance benefits incurred (net) divided by premiums earned (net). |
| 3) | Represents acquisition and administrative expenses (net) divided by premiums earned (net). |
| 4) | Represents the total of acquisition and administrative expenses (net) and claims and insurance benefits incurred (net) divided by premiums earned (net). |
15
Table of Contents
Group Management Report Allianz Group Interim Report Second Quarter and First Half of 2009
Property-Casualty Operations by Business Divisions
| Gross premiums written | Premiums earned (net) | Operating profit | Combined ratio | Loss ratio | Expense ratio | |||||||||||||||||||||||||||||||||||||||||||||||||||
| internal 1) | ||||||||||||||||||||||||||||||||||||||||||||||||||||||||
Three months ended June 30, | 2009 € mn | 2008 € mn | 2009 € mn | 2008 € mn | 2009 € mn | 2008 € mn | 2009 € mn | 2008 € mn | 2009 % | 2008 % | 2009 % | 2008 % | 2009 % | 2008 % | ||||||||||||||||||||||||||||||||||||||||||
| Germany | 1,682 | 1,696 | 1,682 | 1,696 | 1,820 | 1,843 | 55 | 219 | 106.2 | 100.0 | 77.7 | 72.6 | 28.5 | 27.4 | ||||||||||||||||||||||||||||||||||||||||||
| Switzerland | 126 | 124 | 119 | 122 | 312 | 289 | 38 | 25 | 91.5 | 94.0 | 68.0 | 71.5 | 23.5 | 22.5 | ||||||||||||||||||||||||||||||||||||||||||
| Austria | 198 | 197 | 198 | 197 | 169 | 177 | 19 | 28 | 95.1 | 92.1 | 73.3 | 68.7 | 21.8 | 23.4 | ||||||||||||||||||||||||||||||||||||||||||
| German Speaking Countries | 2,006 | 2,017 | 1,999 | 2,015 | 2,301 | 2,309 | 112 | 272 | 103.3 | 98.7 | 76.1 | 72.2 | 27.2 | 26.5 | ||||||||||||||||||||||||||||||||||||||||||
| Italy | 1,085 | 1,232 | 1,085 | 1,213 | 1,054 | 1,171 | 95 | 301 | 100.9 | 93.2 | 74.9 | 69.2 | 26.0 | 24.0 | ||||||||||||||||||||||||||||||||||||||||||
| Spain | 492 | 522 | 492 | 522 | 446 | 469 | 74 | 67 | 89.4 | 91.6 | 68.5 | 70.4 | 20.9 | 21.2 | ||||||||||||||||||||||||||||||||||||||||||
| South America | 265 | 244 | 288 | 244 | 200 | 187 | 14 | 22 | 99.8 | 96.9 | 64.8 | 64.5 | 35.0 | 32.4 | ||||||||||||||||||||||||||||||||||||||||||
| Portugal | 66 | 71 | 66 | 71 | 59 | 62 | 11 | 10 | 90.8 | 91.6 | 65.6 | 64.4 | 25.2 | 27.2 | ||||||||||||||||||||||||||||||||||||||||||
| Turkey2) | 103 | — | — | — | 65 | — | 1 | — | 108.0 | — | 81.5 | — | 26.5 | — | ||||||||||||||||||||||||||||||||||||||||||
| Greece | 24 | 20 | 24 | 20 | 16 | 14 | 3 | 2 | 90.7 | 93.3 | 56.9 | 61.3 | 33.8 | 32.0 | ||||||||||||||||||||||||||||||||||||||||||
| Europe I incl. South America | 2,035 | 2,089 | 1,955 | 2,070 | 1,840 | 1,903 | 198 | 402 | 97.8 | 93.2 | 72.0 | 68.9 | 25.8 | 24.3 | ||||||||||||||||||||||||||||||||||||||||||
| France | 839 | 843 | 839 | 843 | 790 | 808 | 18 | 114 | 105.4 | 96.1 | 76.2 | 69.1 | 29.2 | 27.0 | ||||||||||||||||||||||||||||||||||||||||||
Credit Insurance | 421 | 437 | 421 | 437 | 293 | 333 | (32) | 112 | 118.9 | 87.4 | 92.9 | 60.2 | 26.0 | 27.2 | ||||||||||||||||||||||||||||||||||||||||||
| Travel Insurance and Assistance Services | 346 | 307 | 346 | 307 | 326 | 308 | 27 | 33 | 98.8 | 89.1 | 60.8 | 53.6 | 38.0 | 35.5 | ||||||||||||||||||||||||||||||||||||||||||
| Netherlands | 214 | 222 | 214 | 222 | 200 | 203 | 12 | 24 | 99.9 | 94.2 | 68.6 | 63.6 | 31.3 | 30.6 | ||||||||||||||||||||||||||||||||||||||||||
| Belgium | 75 | 73 | 75 | 73 | 67 | 65 | 15 | 13 | 92.1 | 97.3 | 56.3 | 59.8 | 35.8 | 37.5 | ||||||||||||||||||||||||||||||||||||||||||
| Africa | 17 | 17 | 17 | 17 | 11 | 12 | 2 | 4 | 96.1 | 76.4 | 51.1 | 37.6 | 45.0 | 38.8 | ||||||||||||||||||||||||||||||||||||||||||
| Europe II incl. Africa | 1,912 | 1,899 | 1,912 | 1,899 | 1,687 | 1,729 | 46 3) | 307 3) | 105.3 | 93.0 | 74.3 | 63.6 | 31.0 | 29.4 | ||||||||||||||||||||||||||||||||||||||||||
United States | 786 | 1,061 | 686 | 934 | 701 | 743 | 88 | 141 | 99.7 | 90.9 | 67.5 | 63.4 | 32.2 | 27.5 | ||||||||||||||||||||||||||||||||||||||||||
Mexico | 50 | 74 | 55 | 74 | 21 | 21 | 1 | 1 | 90.1 | 94.6 | 65.0 | 68.6 | 25.1 | 26.0 | ||||||||||||||||||||||||||||||||||||||||||
| NAFTA | 836 | 1,135 | 741 | 1,008 | 722 | 764 | 89 | 142 | 99.4 | 91.0 | 67.4 | 63.6 | 32.0 | 27.4 | ||||||||||||||||||||||||||||||||||||||||||
| Reinsurance PC | 810 | 718 | 797 | 718 | 781 | 741 | 112 | 130 | 90.7 | 89.1 | 66.2 | 60.7 | 24.5 | 28.4 | ||||||||||||||||||||||||||||||||||||||||||
| Allianz Global Corporate & Specialty | 839 | 657 | 839 | 766 | 543 | 449 | 134 | 155 | 88.8 | 83.0 | 63.0 | 58.8 | 25.8 | 24.2 | ||||||||||||||||||||||||||||||||||||||||||
| AZ Insurance plc | 491 | 528 | 544 | 528 | 406 | 443 | 53 | 64 | 94.0 | 94.2 | 60.5 | 61.1 | 33.5 | 33.1 | ||||||||||||||||||||||||||||||||||||||||||
| Australia | 411 | 390 | 445 | 390 | 291 | 303 | 71 | 94 | 88.6 | 89.2 | 63.4 | 64.6 | 25.2 | 24.6 | ||||||||||||||||||||||||||||||||||||||||||
| Ireland | 153 | 163 | 153 | 163 | 146 | 146 | (1) | 29 | 110.4 | 93.0 | 82.9 | 65.8 | 27.5 | 27.2 | ||||||||||||||||||||||||||||||||||||||||||
| ART | 75 | 120 | 54 | 120 | 48 | 17 | 14 | 12 | 108.5 | 50.8 | 60.6 | 34.2 | 47.9 | 16.6 | ||||||||||||||||||||||||||||||||||||||||||
Anglo Broker Markets/ Global Lines | 3,615 | 3,711 | 3,573 | 3,693 | 2,937 | 2,863 | 472 | 626 | 94.0 | 89.3 | 65.6 | 61.7 | 28.4 | 27.6 | ||||||||||||||||||||||||||||||||||||||||||
Russia/CIS4) | 199 | 261 | 232 | 261 | 137 | 171 | 9 | 4 | 95.9 | 107.6 | 53.4 | 64.7 | 42.5 | 42.9 | ||||||||||||||||||||||||||||||||||||||||||
Hungary | 97 | 118 | 112 | 118 | 104 | 118 | 20 | 11 | 80.1 | 100.2 | 51.6 | 70.1 | 28.5 | 30.1 | ||||||||||||||||||||||||||||||||||||||||||
Poland | 94 | 122 | 123 | 122 | 70 | 83 | 3 | 17 | 101.8 | 82.8 | 65.4 | 55.5 | 36.4 | 27.3 | ||||||||||||||||||||||||||||||||||||||||||
Romania | 73 | 83 | 83 | 83 | 36 | 33 | 1 | 1 | 98.4 | 106.8 | 70.1 | 83.7 | 28.3 | 23.1 | ||||||||||||||||||||||||||||||||||||||||||
Slovakia | 81 | 78 | 81 | 78 | 79 | 76 | 22 | 28 | 75.0 | 71.1 | 48.6 | 42.3 | 26.4 | 28.8 | ||||||||||||||||||||||||||||||||||||||||||
Czech Republic | 63 | 66 | 68 | 66 | 55 | 52 | 9 | 7 | 82.4 | 89.8 | 60.0 | 67.8 | 22.4 | 22.0 | ||||||||||||||||||||||||||||||||||||||||||
Bulgaria | 26 | 28 | 26 | 28 | 14 | 16 | — | 1 | 104.6 | 100.0 | 61.2 | 57.8 | 43.4 | 42.2 | ||||||||||||||||||||||||||||||||||||||||||
Croatia | 22 | 25 | 23 | 25 | 19 | 19 | 1 | 1 | 99.3 | 99.3 | 62.2 | 62.2 | 37.1 | 37.1 | ||||||||||||||||||||||||||||||||||||||||||
| New Europe5) | 655 | 781 | 748 | 781 | 514 | 568 | 60 | 62 | 89.6 | 96.2 | 56.4 | 62.6 | 33.2 | 33.6 | ||||||||||||||||||||||||||||||||||||||||||
Asia-Pacific (excl. Australia) | 125 | 109 | 118 | 109 | 63 | 53 | 6 | 5 | 97.8 | 97.7 | 66.3 | 60.9 | 31.5 | 36.8 | ||||||||||||||||||||||||||||||||||||||||||
| Middle East | 16 | 13 | 14 | 13 | 9 | 5 | 1 | — | 134.3 | 120.9 | 71.2 | 63.6 | 63.1 | 57.3 | ||||||||||||||||||||||||||||||||||||||||||
| Growth Markets | 796 | 903 | 880 | 903 | 586 | 626 | 67 | 67 | 91.1 | 96.8 | 57.7 | 62.6 | 33.4 | 34.2 | ||||||||||||||||||||||||||||||||||||||||||
| Consolidation6) | (842) | (777) | (874) | (775) | 14 | 18 | — | 7 | — | — | — | — | — | — | ||||||||||||||||||||||||||||||||||||||||||
| Total | 9,522 | 9,842 | 9,445 | 9,805 | 9,365 | 9,448 | 895 | 1,681 | 98.9 | 93.5 | 70.6 | 66.1 | 28.3 | 27.4 | ||||||||||||||||||||||||||||||||||||||||||
| 1) | Reflect gross premiums written on an internal basis (adjusted for foreign currency translation and (de-) consolidation effects). |
| 2) | Effective July 21, 2008, Koç Allianz Sigorta AS was consolidated following the acquisition of approximately 47.1% of the shares in Koç Allianz Sigorta AS by the Allianz Group, increasing our holding to approximately 84.2%. |
| 3) | Contains€ 7 mn and€ 11 mn for 1H 2009 and 1H 2008, respectively, from a former operating entity located in Luxembourg (€ 4 mn and€ 5 mn for 2Q 2009 and 2Q 2008, respectively) and also€ 1 mn and€ 3 mn for 1H 2009 and 1H 2008, respectively, from AGF UK (€ 0 mn and€ 2 mn for 2Q 2009 and 2Q 2008, respectively). |
16
Table of Contents
Allianz Group Interim Report Second Quarter and First Half of 2009 Group Management Report
| Gross premiums written | Premiums earned (net) | Operating profit | Combined ratio | Loss ratio | Expense ratio | |||||||||||||||||||||||||||||||||||||||||||||||||||
| internal1) | ||||||||||||||||||||||||||||||||||||||||||||||||||||||||
| Six months ended June 30, | 2009 € mn | 2008 € mn | 2009 € mn | 2008 € mn | 2009 € mn | 2008 € mn | 2009 € mn | 2008 € mn | 2009 % | 2008 % | 2009 % | 2008 % | 2009 % | 2008 % | ||||||||||||||||||||||||||||||||||||||||||
| Germany | 5,716 | 5,781 | 5,716 | 5,781 | 3,598 | 3,632 | 332 | 693 | 100.6 | 99.1 | 72.4 | 72.9 | 28.2 | 26.2 | ||||||||||||||||||||||||||||||||||||||||||
| Switzerland | 960 | 898 | 898 | 893 | 652 | 598 | 84 | 77 | 92.6 | 92.6 | 70.3 | 69.7 | 22.3 | 22.9 | ||||||||||||||||||||||||||||||||||||||||||
| Austria | 536 | 540 | 536 | 540 | 350 | 359 | 38 | 47 | 95.4 | 95.1 | 71.4 | 71.5 | 24.0 | 23.6 | ||||||||||||||||||||||||||||||||||||||||||
| German Speaking Countries | 7,212 | 7,219 | 7,150 | 7,214 | 4,600 | 4,589 | 454 | 817 | 99.0 | 98.0 | 72.0 | 72.4 | 27.0 | 25.6 | ||||||||||||||||||||||||||||||||||||||||||
| Italy | 2,088 | 2,406 | 2,088 | 2,377 | 2,117 | 2,328 | 205 | 467 | 99.9 | 93.4 | 75.3 | 69.4 | 24.6 | 24.0 | ||||||||||||||||||||||||||||||||||||||||||
| Spain | 1,150 | 1,216 | 1,150 | 1,216 | 899 | 931 | 150 | 143 | 89.5 | 90.5 | 69.3 | 70.2 | 20.2 | 20.3 | ||||||||||||||||||||||||||||||||||||||||||
| South America | 523 | 481 | 579 | 481 | 383 | 368 | 31 | 38 | 100.1 | 97.7 | 66.4 | 64.0 | 33.7 | 33.7 | ||||||||||||||||||||||||||||||||||||||||||
| Portugal | 147 | 158 | 147 | 158 | 119 | 123 | 21 | 21 | 90.9 | 90.9 | 65.3 | 64.1 | 25.6 | 26.8 | ||||||||||||||||||||||||||||||||||||||||||
| Turkey2) | 227 | — | — | — | 127 | — | 2 | — | 110.7 | — | 84.4 | — | 26.3 | — | ||||||||||||||||||||||||||||||||||||||||||
| Greece | 47 | 41 | 47 | 41 | 29 | 26 | 6 | 5 | 88.4 | 90.2 | 57.2 | 58.8 | 31.2 | 31.4 | ||||||||||||||||||||||||||||||||||||||||||
| Europe I incl. South America | 4,182 | 4,302 | 4,011 | 4,273 | 3,674 | 3,776 | 415 | 674 | 97.4 | 93.0 | 72.8 | 68.9 | 24.6 | 24.1 | ||||||||||||||||||||||||||||||||||||||||||
| France | 2,246 | 2,236 | 2,246 | 2,236 | 1,592 | 1,639 | (36) | 174 | 108.7 | 98.0 | 80.9 | 70.7 | 27.8 | 27.3 | ||||||||||||||||||||||||||||||||||||||||||
| Credit Insurance | 952 | 969 | 952 | 969 | 603 | 675 | (24) | 189 | 116.7 | 88.7 | 88.5 | 61.7 | 28.2 | 27.0 | ||||||||||||||||||||||||||||||||||||||||||
| Travel Insurance and Assistance Services | 695 | 633 | 695 | 633 | 622 | 583 | 40 | 59 | 98.0 | 91.3 | 61.0 | 55.7 | 37.0 | 35.6 | ||||||||||||||||||||||||||||||||||||||||||
| Netherlands | 526 | 521 | 526 | 521 | 397 | 396 | 27 | 43 | 99.6 | 96.0 | 69.1 | 65.0 | 30.5 | 31.0 | ||||||||||||||||||||||||||||||||||||||||||
| Belgium | 189 | 184 | 189 | 184 | 131 | 130 | 23 | 23 | 96.0 | 97.0 | 60.3 | 58.6 | 35.7 | 38.4 | ||||||||||||||||||||||||||||||||||||||||||
| Africa | 44 | 43 | 44 | 43 | 18 | 18 | 3 | 4 | 94.7 | 76.0 | 59.2 | 46.7 | 35.5 | 29.3 | ||||||||||||||||||||||||||||||||||||||||||
| Europe II incl. Africa | 4,652 | 4,586 | 4,652 | 4,586 | 3,363 | 3,441 | 413) | 506 3) | 106.6 | 94.8 | 76.4 | 65.3 | 30.2 | 29.5 | ||||||||||||||||||||||||||||||||||||||||||
United States | 1,574 | 1,833 | 1,370 | 1,605 | 1,464 | 1,428 | 190 | 234 | 99.0 | 94.2 | 65.9 | 65.0 | 33.1 | 29.2 | ||||||||||||||||||||||||||||||||||||||||||
Mexico | 100 | 112 | 113 | 112 | 40 | 40 | 5 | 5 | 91.1 | 91.9 | 66.2 | 66.1 | 24.9 | 25.8 | ||||||||||||||||||||||||||||||||||||||||||
| NAFTA | 1,674 | 1,945 | 1,483 | 1,717 | 1,504 | 1,468 | 195 | 239 | 98.8 | 94.1 | 65.9 | 65.0 | 32.9 | 29.1 | ||||||||||||||||||||||||||||||||||||||||||
| Reinsurance PC | 2,293 | 1,967 | 2,293 | 1,967 | 1,552 | 1,378 | 115 | 239 | 98.2 | 88.0 | 71.3 | 63.6 | 26.9 | 24.4 | ||||||||||||||||||||||||||||||||||||||||||
| Allianz Global Corporate & Specialty | 1,874 | 1,500 | 1,874 | 1,679 | 1,104 | 855 | 272 | 202 | 87.3 | 90.4 | 63.6 | 65.0 | 23.7 | 25.4 | ||||||||||||||||||||||||||||||||||||||||||
| AZ Insurance plc | 924 | 1,034 | 1,065 | 1,034 | 790 | 903 | 98 | 122 | 95.0 | 95.7 | 61.8 | 61.7 | 33.2 | 34.0 | ||||||||||||||||||||||||||||||||||||||||||
| Australia | 738 | 742 | 832 | 742 | 544 | 610 | 100 | 137 | 96.8 | 97.0 | 71.9 | 72.6 | 24.9 | 24.4 | ||||||||||||||||||||||||||||||||||||||||||
| Ireland | 344 | 363 | 344 | 363 | 287 | 296 | (5) | 59 | 111.4 | 92.1 | 83.8 | 65.7 | 27.6 | 26.4 | ||||||||||||||||||||||||||||||||||||||||||
| ART | 155 | 141 | 110 | 141 | 94 | 37 | 27 | 19 | 96.0 | 67.3 | 53.4 | 41.8 | 42.6 | 25.5 | ||||||||||||||||||||||||||||||||||||||||||
| Anglo Broker Markets/ Global Lines | 8,002 | 7,692 | 8,001 | 7,643 | 5,875 | 5,547 | 802 | 1,017 | 96.4 | 92.3 | 67.6 | 64.8 | 28.8 | 27.5 | ||||||||||||||||||||||||||||||||||||||||||
Russia/CIS4) | 373 | 486 | 442 | 486 | 271 | 344 | 16 | 2 | 97.0 | 104.2 | 54.4 | 63.0 | 42.6 | 41.2 | ||||||||||||||||||||||||||||||||||||||||||
Hungary | 244 | 301 | 278 | 301 | 205 | 231 | 37 | 30 | 91.9 | 97.6 | 64.4 | 66.8 | 27.5 | 30.8 | ||||||||||||||||||||||||||||||||||||||||||
Poland | 180 | 227 | 231 | 227 | 141 | 159 | 7 | 24 | 100.5 | 88.8 | 63.7 | 59.4 | 36.8 | 29.4 | ||||||||||||||||||||||||||||||||||||||||||
Romania | 148 | 175 | 171 | 175 | 72 | 70 | 1 | 4 | 102.4 | 105.1 | 77.4 | 79.9 | 25.0 | 25.2 | ||||||||||||||||||||||||||||||||||||||||||
Slovakia | 204 | 188 | 204 | 188 | 155 | 143 | 42 | 57 | 77.1 | 67.9 | 49.5 | 41.4 | 27.6 | 26.5 | ||||||||||||||||||||||||||||||||||||||||||
Czech Republic | 140 | 149 | 151 | 149 | 106 | 107 | 21 | 19 | 81.2 | 86.2 | 60.2 | 63.9 | 21.0 | 22.3 | ||||||||||||||||||||||||||||||||||||||||||
Bulgaria | 45 | 54 | 45 | 54 | 33 | 36 | 5 | 5 | 88.6 | 90.6 | 53.5 | 55.2 | 35.1 | 35.4 | ||||||||||||||||||||||||||||||||||||||||||
Croatia | 49 | 51 | 50 | 51 | 39 | 37 | 2 | 3 | 101.5 | 96.9 | 64.5 | 63.5 | 37.0 | 33.4 | ||||||||||||||||||||||||||||||||||||||||||
| New Europe5) | 1,383 | 1,631 | 1,572 | 1,631 | 1,022 | 1,127 | 121 | 129 | 92.1 | 94.1 | 59.5 | 61.4 | 32.6 | 32.7 | ||||||||||||||||||||||||||||||||||||||||||
| Asia-Pacific (excl. Australia) | 251 | 212 | 235 | 212 | 126 | 106 | 11 | 8 | 98.7 | 99.2 | 62.9 | 60.9 | 35.8 | 38.3 | ||||||||||||||||||||||||||||||||||||||||||
| Middle East | 35 | 26 | 31 | 26 | 17 | 11 | 2 | 1 | 136.9 | 120.0 | 68.6 | 64.6 | 68.3 | 55.4 | ||||||||||||||||||||||||||||||||||||||||||
| Growth Markets | 1,669 | 1,869 | 1,838 | 1,869 | 1,165 | 1,244 | 134 | 138 | 93.5 | 94.9 | 60.0 | 61.4 | 33.5 | 33.5 | ||||||||||||||||||||||||||||||||||||||||||
| Consolidation6) | (2,309) | (2,116) | (2,395) | (2,116) | 20 | 24 | 18 | 25 | — | — | — | — | — | — | ||||||||||||||||||||||||||||||||||||||||||
| Total | 23,408 | 23,552 | 23,257 | 23,469 | 18,697 | 18,621 | 1,864 | 3,177 | 98.8 | 94.5 | 70.8 | 67.4 | 28.0 | 27.1 | ||||||||||||||||||||||||||||||||||||||||||
| 4) | Contains operations in Kazakhstan and Ukraine. |
| 5) | Contains income and expense items from a management holding. |
| 6) | Represents elimination of transactions between Allianz Group companies in different geographic regions. |
17
Table of Contents
Life/Health Insurance Operations
– Strong revenue growth for the year to date and in the second quarter.
– Almost€ 1 billion operating profit in the second quarter, our highest ever.
– Recovery of prior year credit spread losses.
Earnings Summary
Statutory premiums 1)
2009 to 2008 second quarter comparison
Our statutory premiums grew by 7.7% on an internal basis. As in first quarter 2009 growth was driven by continued strong demand for products with minimum guarantees and participating components. Pure unit-linked business was still impacted by consumer aversion to equity and investment risks following the financial market crisis.
| 1) | We comment on the development of our statutory premiums written on an internal basis; meaning adjusted for foreign currency translation and (de-)consolidation effects in order to provide more comparable information. |
Statutory premiums – Internal growth rates
in %
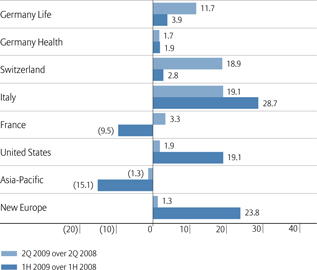
In theGerman life business, we recorded premium growth of 11.7% or € 359 million. Here, sales of single premium deposit products were up, following the overall market recovery for single premium business. We also saw an increase in our Commercial line of business. Premium growth in our health business is stable compared to the first quarter.
In Italy, premiums were up 19.1% or € 310 million, driven by continued high sales of a product with a minimum guarantee and a participating component sold via our bancassurance channel. Market demand for pure unit-linked investment business with equity participation was still low as consumers remained risk averse.
18
Table of Contents
Allianz Group Interim Report Second Quarter and First Half of 2009 Group Management Report
InSwitzerland, premiums grew by 18.9% or € 39 million due to an increased demand in the individual traditional single premiums with guarantees and a continued demand for group life contracts.
Compared to the first quarter, where growth was negative, in this quarter, premiums in ourFrench business grew by 3.3%. This growth was attributable to sales in traditional investment business.
Premium growth in our businesses inSouth Korea andJapan were still impacted by the financial markets down-turn. However, we had significant growth in investment business inTaiwan to counter this decline as investors confidence returned with the market rebound in this country. Taken together, our operations inAsia-Pacific generated a small decline of 1.3% or € 12 million in revenues.
In theUnited States premiums were up 1.9% or € 26 million. As announced at year-end 2008 we have been making significant changes to our product portfolio – variable annuity living benefit riders were suspended at the end of the first quarter and our fixed and fixed index annuity products were redesigned and repriced. As the result of the rider suspension, variable annuity sales have tailed off this quarter as expected and the repriced fixed and fixed index annuities sales remained at a stable high level.
2009 to 2008 first half comparison
In the first half of 2009 our statutory premiums grew 5.5% on an internal basis. Premiums developed in line with the described effects for the second quarter, with the exception of unit-linked business. Unit-linked sales were hit stronger in the first quarter than in the second quarter and recovered in line with the upturn of the financial markets.
Operating profit
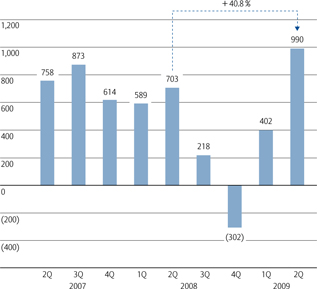
Operating profit
in€ mn
2009 to 2008 second quarter comparison
Operating profit increased from € 703 million in the second quarter 2008 to € 990 million this quarter. This was the strongest quarter profit we have reported for our Life/Health operations and was largely attributable to our investment result. Our equity reduction programe reduced the income from dividends, whereas the credit spread narrowing produced much higher income from the Fair Value Option especially in France. Improved market conditions allowed for higher realized gains and very limited impairments. Our technical and expense result remained fairly stable.
Interest and similar income stood at € 3,638 million and delivered a stable yield of 1.2% 1). This compares to € 3,814 million in the second quarter 2008. The development was on the one hand driven by our reduced equity exposure and lower dividend receipts (€ 408 million), which was a cyclical effect and is expected to pick up again in the second half of the year. On the other hand, and partly compensating this, we recorded an increase in interest income on debt securities due to higher assets under management. However yields declined in line with the lower interest rate environment.
| 1) | On debt securities including cash components, based on an average asset base of€ 268.2 bn. |
19
Table of Contents
Group Management Report Allianz Group Interim Report Second Quarter and First Half of 2009
We recorded a € 615 millionnet gain from financial assets and liabilities carried at fair value through income, after a loss of € 352 million in the second quarter of 2008. This swing was primarily due to the upturn in equity markets, credit spread narrowing and a gain from foreign exchange currency hedges. The corresponding currency losses from hedged securities are shown underinvestment expenses.
Net realized gains/losses amounted to € 639 million, an increase of € 366 million, which was to a large extent attributable to the sale of ICBC and Bayer shares.
Net impairments on investments amounted to € 267 million, a significantly lower level compared to € 898 million in the second quarter 2008. Remaining impairments mostly resulted from private equity investments and debt securities.
Changes in reserves for insurance and investment contracts (net) amounted to € 2,455 million, € 1,066 million higher than in the second quarter 2008. This was driven by an increase of reserves for premium refunds to policyholders following a higher investment result.
Net claims and insurance benefits incurred were down 0.9% to € 4,497 million.
Acquisition and administrative expenses (net)amounted to
€ 1,631 million, up 26.9%. Whereas administrative expenses declined, the amortization of deferred acquisition costs at Allianz Life in the United States went up, resulting in higher acquisition expenses.
Ourcost-income ratio improved 0.9 percentage points to 93.8%. The development was driven by the higher relative investment performance compared to the premiums generated in the period.
2009 to 2008 first half comparison
Operating profit increased to a remarkable level of € 1,392 million. This development is in line with the capital market recovery and reinforces the underlying profitability of our Life/Health portfolio.
20
Table of Contents
Allianz Group Interim Report Second Quarter and First Half of 2009 Group Management Report
Life/Health segment information
| Three months ended June 30, | Six months ended June 30, | |||||||||||||||
2009 € mn | 2008 € mn | 2009 € mn | 2008 € mn | |||||||||||||
| Statutory premiums1) | 11,766 | 10,729 | 24,779 | 23,056 | ||||||||||||
| Ceded premiums written | (127) | (124) | (270) | (267) | ||||||||||||
| Change in unearned premiums | (24) | (29) | (53) | (66) | ||||||||||||
| Statutory premiums (net) | 11,615 | 10,576 | 24,456 | 22,723 | ||||||||||||
| Deposits from SFAS 97 insurance and investment contracts | (6,503) | (5,465) | (13,996) | (12,023) | ||||||||||||
| Premiums earned (net) | 5,112 | 5,111 | 10,460 | 10,700 | ||||||||||||
| Interest and similar income | 3,638 | 3,814 | 6,943 | 7,014 | ||||||||||||
| Operating income from financial assets and liabilities carried at fair value through income (net) | 615 | (352) | 384 | (113) | ||||||||||||
| Operating realized gains/losses (net) | 639 | 273 | 810 | 922 | ||||||||||||
| Fee and commission income | 122 | 168 | 241 | 339 | ||||||||||||
| Other income | 6 | 5 | 9 | 115 | ||||||||||||
| Operating revenues | 10,132 | 9,019 | 18,847 | 18,977 | ||||||||||||
| Claims and insurance benefits incurred (net) | (4,497) | (4,540) | (9,643) | (9,553) | ||||||||||||
| Changes in reserves for insurance and investment contracts (net) | (2,455) | (1,389) | (3,040) | (3,192) | ||||||||||||
| Interest expenses | (27) | (55) | (71) | (125) | ||||||||||||
| Loan loss provisions | (12) | 4 | (14) | 6 | ||||||||||||
| Operating impairments of investments (net) | (267) | (898) | (1,343) | (1,878) | ||||||||||||
| Investment expenses | (205) | (82) | (171) | (410) | ||||||||||||
| Acquisition and administrative expenses (net) | (1,631) | (1,285) | (3,060) | (2,401) | ||||||||||||
| Fee and commission expenses | (52) | (70) | (116) | (130) | ||||||||||||
| Operating restructuring charges | 4 | — | 3 | (1) | ||||||||||||
| Other expenses | — | (1) | — | (1) | ||||||||||||
| Operating expenses | (9,142) | (8,316) | (17,455) | (17,685) | ||||||||||||
| Operating profit | 990 | 703 | 1,392 | 1,292 | ||||||||||||
| Cost-income ratio2)in % | 93.8 | 94.7 | 95.5 | 95.5 | ||||||||||||
| 1) | For the Life/Health segment, total revenues are measured based upon statutory premiums. Statutory premiums are gross premiums written from sales of life and health insurance policies, as well as gross receipts from sales of unit-linked and other investment-oriented products, in accordance with the statutory accounting practices applicable in the insurer’s home jurisdiction. |
| 2) | Represents deposits from SFAS 97 insurance and investment contracts, claims and insurance benefits incurred (net), changes in reserves for insurance and investment contracts (net) and acquisition and administrative expenses (net) divided by statutory premiums (net), interest and similar income, operating income from financial assets and liabilities carried at fair value through income (net), operating realized gains/losses (net), fee and commission income, other income, interest expenses, loan loss provisions, operating impairments of investments (net), investment expenses, fee and commission expenses, operating restructuring charges and other expenses. |
21
Table of Contents
Group Management Report Allianz Group Interim Report Second Quarter and First Half of 2009
Life/Health Operations by Business Divisions
| Statutory premiums 1) | Premiums earned (net) | Operating profit | Cost-income ratio | |||||||||||||||||||||||||||||||||||||
| Three months ended June 30, | internal 2) | |||||||||||||||||||||||||||||||||||||||
2009 € mn | 2008 € mn | 2009 € mn | 2008 € mn | 2009 €��mn | 2008 € mn | 2009 € mn | 2008 € mn | 2009 % | 2008 % | |||||||||||||||||||||||||||||||
| Germany Life | 3,436 | 3,077 | 3,436 | 3,077 | 2,255 | 2,260 | 185 | 176 | 96.4 | 95.7 | ||||||||||||||||||||||||||||||
| Germany Health 3) | 792 | 779 | 792 | 779 | 792 | 777 | 27 | 23 | 97.2 | 97.6 | ||||||||||||||||||||||||||||||
| Switzerland | 260 | 206 | 245 | 206 | 120 | 85 | 30 | 17 | 91.0 | 93.5 | ||||||||||||||||||||||||||||||
| Austria | 131 | 139 | 131 | 139 | 62 | 68 | 6 | 6 | 95.9 | 96.5 | ||||||||||||||||||||||||||||||
| German Speaking Countries | 4,619 | 4,201 | 4,604 | 4,201 | 3,229 | 3,190 | 248 | 222 | 96.2 | 96.0 | ||||||||||||||||||||||||||||||
| Italy | 1,935 | 1,625 | 1,935 | 1,625 | 187 | 232 | 86 | 97 | 96.2 | 94.9 | ||||||||||||||||||||||||||||||
| Spain | 214 | 233 | 214 | 233 | 110 | 119 | 26 | 30 | 90.6 | 89.4 | ||||||||||||||||||||||||||||||
| Portugal | 35 | 31 | 35 | 31 | 20 | 19 | 4 | 3 | 89.6 | 89.4 | ||||||||||||||||||||||||||||||
| Greece | 29 | 27 | 29 | 27 | 15 | 17 | — | 2 | 98.4 | 92.8 | ||||||||||||||||||||||||||||||
| South America | 9 | 9 | 11 | 9 | 7 | 6 | — | 1 | 96.4 | 94.0 | ||||||||||||||||||||||||||||||
| Turkey 4) | 21 | — | — | — | 9 | — | 2 | — | 93.3 | — | ||||||||||||||||||||||||||||||
| Europe I incl. South America | 2,243 | 1,925 | 2,224 | 1,925 | 348 | 393 | 118 | 133 | 95.5 | 94.1 | ||||||||||||||||||||||||||||||
| France | 1,746 | 1,690 | 1,746 | 1,690 | 748 | 637 | 235 | 140 | 90.8 | 93.4 | ||||||||||||||||||||||||||||||
| Belgium | 179 | 185 | 179 | 185 | 75 | 76 | 24 | 21 | 91.0 | 91.9 | ||||||||||||||||||||||||||||||
| Netherlands | 88 | 98 | 88 | 98 | 33 | 33 | 5 | 12 | 95.5 | 89.7 | ||||||||||||||||||||||||||||||
| Luxembourg | 30 | 12 | 30 | 12 | 7 | 7 | 1 | 1 | 97.1 | 93.7 | ||||||||||||||||||||||||||||||
| Africa | 9 | 8 | 9 | 8 | 5 | 3 | 1 | 1 | 90.7 | 92.8 | ||||||||||||||||||||||||||||||
| Global Life | 52 | — | 52 | — | 1 | — | — | — | 100.6 | — | ||||||||||||||||||||||||||||||
| Europe II incl. Africa | 2,104 | 1,993 | 2,104 | 1,993 | 869 | 756 | 266 | 175 | 91.3 | 93.1 | ||||||||||||||||||||||||||||||
United States | 1,630 | 1,396 | 1,422 | 1,396 | 170 | 254 | 305 | 149 | 87.7 | 91.4 | ||||||||||||||||||||||||||||||
Mexico | 10 | 13 | 11 | 13 | 8 | 8 | — | 2 | 94.2 | 93.2 | ||||||||||||||||||||||||||||||
| NAFTA | 1,640 | 1,409 | 1,433 | 1,409 | 178 | 262 | 305 | 151 | 87.8 | 91.4 | ||||||||||||||||||||||||||||||
| AZ Reinsurance LH | 71 | 79 | 71 | 79 | 67 | 75 | 8 | 6 | 90.7 | 92.4 | ||||||||||||||||||||||||||||||
| Anglo Broker Markets/Global Lines | 1,711 | 1,488 | 1,504 | 1,488 | 245 | 337 | 313 | 157 | 87.8 | 91.5 | ||||||||||||||||||||||||||||||
South Korea | 339 | 380 | 373 | 380 | 158 | 186 | 19 | 26 | 95.2 | 94.2 | ||||||||||||||||||||||||||||||
Taiwan | 421 | 227 | 399 | 227 | 12 | 23 | 1 | (1) | 99.7 | 100.4 | ||||||||||||||||||||||||||||||
Malaysia | 41 | 32 | 40 | 32 | 37 | 27 | 3 | 2 | 93.5 | 95.5 | ||||||||||||||||||||||||||||||
Indonesia | 42 | 48 | 42 | 48 | 21 | 12 | 4 | 2 | 90.1 | 95.8 | ||||||||||||||||||||||||||||||
Other | 63 | 237 | 58 | 237 | 34 | 25 | (7) | (18) | 111.8 | 108.3 | ||||||||||||||||||||||||||||||
| Asia-Pacific | 906 | 924 | 912 | 924 | 262 | 273 | 20 | 11 | 98.0 | 98.9 | ||||||||||||||||||||||||||||||
Hungary | 23 | 51 | 27 | 51 | 17 | 19 | 3 | 2 | 89.0 | 94.8 | ||||||||||||||||||||||||||||||
Slovakia | 61 | 65 | 61 | 65 | 44 | 43 | 8 | 9 | 88.8 | 88.9 | ||||||||||||||||||||||||||||||
Czech Republic | 24 | 22 | 26 | 22 | 11 | 15 | 3 | — | 87.9 | 99.2 | ||||||||||||||||||||||||||||||
Poland | 72 | 58 | 94 | 58 | 44 | 43 | 4 | (1) | 93.9 | 101.7 | ||||||||||||||||||||||||||||||
Romania | 6 | 9 | 7 | 9 | 3 | 4 | 1 | — | 89.6 | 102.6 | ||||||||||||||||||||||||||||||
Bulgaria | 6 | 8 | 6 | 8 | 5 | 7 | 2 | — | 73.6 | 91.0 | ||||||||||||||||||||||||||||||
Croatia | 11 | 17 | 11 | 17 | 10 | 11 | 2 | — | 88.3 | 97.7 | ||||||||||||||||||||||||||||||
Russia | 5 | 4 | 5 | 4 | 4 | 3 | (2) | (4) | 118.7 | 202.0 | ||||||||||||||||||||||||||||||
| New Europe | 208 | 234 | 237 | 234 | 138 | 145 | 21 | 6 | 90.9 | 97.0 | ||||||||||||||||||||||||||||||
| Middle East | 25 | 19 | 22 | 19 | 21 | 17 | — | 4 | 98.1 | 87.1 | ||||||||||||||||||||||||||||||
| Growth Markets | 1,139 | 1,177 | 1,171 | 1,177 | 421 | 435 | 41 | 21 | 96.7 | 98.3 | ||||||||||||||||||||||||||||||
| Consolidation 5) | (50) | (55) | (50) | (55) | — | — | 4 | (5) | — | — | ||||||||||||||||||||||||||||||
| Total | 11,766 | 10,729 | 11,557 | 10,729 | 5,112 | 5,111 | 990 | 703 | 93.8 | 94.7 | ||||||||||||||||||||||||||||||
| 1) | Statutory premiums are gross premiums written from sales of life insurance policies as well as gross receipts from sales of unit-linked and other investment-oriented products, in accordance with the statutory accounting practices applicable in the insurer’s home jurisdiction. |
| 2) | Reflect statutory premiums on an internal basis (adjusted for foreign currency translation and (de-) consolidation effects). |
| 3) | Loss ratios were 69.1% and 72.1% for the three months ended June 30, 2009 and 2008, respectively, and 74.3% and 75.7% for the six month ended June 30, 2009 and 2008, respectively. |
22
Table of Contents
Allianz Group Interim Report Second Quarter and First Half of 2009 Group Management Report
| Statutory premiums 1) | Premiums earned (net) | Operating profit | Cost-income ratio | |||||||||||||||||||||||||||||||||||||
| Six months ended June 30, | internal 2) | |||||||||||||||||||||||||||||||||||||||
2009 € mn | 2008 € mn | 2009 € mn | 2008 € mn | 2009 € mn | 2008 € mn | 2009 € mn | 2008 € mn | 2009 % | 2008 % | |||||||||||||||||||||||||||||||
| Germany Life | 6,915 | 6,656 | 6,915 | 6,656 | 4,615 | 4,884 | 350 | 363 | 96.3 | 96.0 | ||||||||||||||||||||||||||||||
| Germany Health 3) | 1,583 | 1,553 | 1,583 | 1,553 | 1,584 | 1,553 | 46 | 60 | 97.6 | 96.9 | ||||||||||||||||||||||||||||||
| Switzerland | 954 | 869 | 893 | 869 | 356 | 279 | 38 | 34 | 96.4 | 96.4 | ||||||||||||||||||||||||||||||
| Austria | 248 | 247 | 248 | 247 | 151 | 150 | 10 | 14 | 96.4 | 95.2 | ||||||||||||||||||||||||||||||
| German Speaking Countries | 9,700 | 9,325 | 9,639 | 9,325 | 6,706 | 6,866 | 444 | 471 | 96.5 | 96.2 | ||||||||||||||||||||||||||||||
| Italy | 4,188 | 3,254 | 4,188 | 3,254 | 374 | 446 | 95 | 127 | 98.0 | 96.6 | ||||||||||||||||||||||||||||||
| Spain | 459 | 416 | 459 | 416 | 220 | 231 | 53 | 56 | 90.8 | 89.4 | ||||||||||||||||||||||||||||||
| Portugal | 70 | 56 | 70 | 56 | 40 | 38 | 9 | 8 | 88.7 | 86.4 | ||||||||||||||||||||||||||||||
| Greece | 60 | 56 | 60 | 56 | 33 | 35 | 1 | 3 | 97.5 | 94.2 | ||||||||||||||||||||||||||||||
| South America | 20 | 39 | 22 | 39 | 16 | 35 | 5 | 7 | 83.9 | 85.4 | ||||||||||||||||||||||||||||||
| Turkey 4) | 42 | — | — | — | 18 | — | 3 | — | 94.7 | — | ||||||||||||||||||||||||||||||
| Europe I incl. South America | 4,839 | 3,821 | 4,799 | 3,821 | 701 | 785 | 166 | 201 | 97.0 | 95.4 | ||||||||||||||||||||||||||||||
| France | 3,530 | 3,902 | 3,530 | 3,902 | 1,457 | 1,334 | 358 | 300 | 92.0 | 93.6 | ||||||||||||||||||||||||||||||
| Belgium | 334 | 388 | 334 | 388 | 162 | 165 | 31 | 51 | 93.4 | 90.4 | ||||||||||||||||||||||||||||||
| Netherlands | 193 | 197 | 193 | 197 | 81 | 66 | 15 | 21 | 93.3 | 90.7 | ||||||||||||||||||||||||||||||
| Luxembourg | 41 | 35 | 41 | 35 | 14 | 14 | 3 | 2 | 94.7 | 94.8 | ||||||||||||||||||||||||||||||
| Africa | 20 | 21 | 20 | 21 | 11 | 9 | 2 | 2 | 91.3 | 93.9 | ||||||||||||||||||||||||||||||
| Global Life | 92 | — | 92 | — | 1 | — | — | — | 100.0 | — | ||||||||||||||||||||||||||||||
| Europe II incl. Africa | 4,210 | 4,543 | 4,210 | 4,543 | 1,726 | 1,588 | 409 | 376 | 92.3 | 93.1 | ||||||||||||||||||||||||||||||
United States | 3,760 | 2,740 | 3,264 | 2,740 | 340 | 428 | 308 | 155 | 93.9 | 95.2 | ||||||||||||||||||||||||||||||
Mexico | 23 | 47 | 26 | 47 | 15 | 15 | 1 | 2 | 94.5 | 96.9 | ||||||||||||||||||||||||||||||
| NAFTA | 3,783 | 2,787 | 3,290 | 2,787 | 355 | 443 | 309 | 157 | 93.9 | 95.2 | ||||||||||||||||||||||||||||||
| AZ Reinsurance LH | 144 | 153 | 144 | 153 | 143 | 146 | 9 | 7 | 94.8 | 95.8 | ||||||||||||||||||||||||||||||
| Anglo Broker Markets/Global Lines | 3,927 | 2,940 | 3,434 | 2,940 | 498 | 589 | 318 | 164 | 94.0 | 95.3 | ||||||||||||||||||||||||||||||
South Korea | 638 | 864 | 762 | 864 | 311 | 396 | 35 | 56 | 95.4 | 94.4 | ||||||||||||||||||||||||||||||
Taiwan | 719 | 682 | 679 | 682 | 41 | 50 | 6 | 1 | 99.2 | 99.8 | ||||||||||||||||||||||||||||||
Malaysia | 79 | 63 | 77 | 63 | 71 | 55 | 5 | 4 | 93.9 | 94.4 | ||||||||||||||||||||||||||||||
Indonesia | 81 | 94 | 84 | 94 | 38 | 22 | 8 | 5 | 89.7 | 94.8 | ||||||||||||||||||||||||||||||
Other | 134 | 312 | 108 | 312 | 52 | 31 | (27) | (28) | 120.9 | 109.4 | ||||||||||||||||||||||||||||||
| Asia-Pacific | 1,651 | 2,015 | 1,710 | 2,015 | 513 | 554 | 27 | 38 | 98.5 | 98.3 | ||||||||||||||||||||||||||||||
Hungary | 45 | 95 | 52 | 95 | 32 | 39 | 8 | 6 | 84.8 | 93.7 | ||||||||||||||||||||||||||||||
Slovakia | 129 | 145 | 129 | 145 | 85 | 85 | 17 | 18 | 88.3 | 89.2 | ||||||||||||||||||||||||||||||
Czech Republic | 64 | 49 | 70 | 49 | 24 | 31 | 4 | 4 | 93.4 | 91.8 | ||||||||||||||||||||||||||||||
Poland | 221 | 121 | 284 | 121 | 84 | 81 | 6 | 3 | 97.2 | 97.6 | ||||||||||||||||||||||||||||||
Romania | 13 | 16 | 14 | 16 | 7 | 7 | 1 | 1 | 91.6 | 95.9 | ||||||||||||||||||||||||||||||
Bulgaria | 12 | 15 | 12 | 15 | 11 | 13 | 2 | 1 | 85.9 | 91.3 | ||||||||||||||||||||||||||||||
Croatia | 22 | 30 | 22 | 30 | 20 | 20 | 2 | 2 | 93.3 | 92.7 | ||||||||||||||||||||||||||||||
Russia | 8 | 8 | 10 | 8 | 8 | 7 | (3) | (7) | 128.1 | 180.9 | ||||||||||||||||||||||||||||||
| New Europe | 514 | 479 | 593 | 479 | 271 | 283 | 37 | 28 | 93.2 | 94.3 | ||||||||||||||||||||||||||||||
| Middle East | 49 | 41 | 43 | 41 | 45 | 35 | (9) | 5 | 120.4 | 90.7 | ||||||||||||||||||||||||||||||
| Growth Markets | 2,214 | 2,535 | 2,346 | 2,535 | 829 | 872 | 55 | 71 | 97.7 | 97.4 | ||||||||||||||||||||||||||||||
| Consolidation 5) | (111) | (108) | (110) | (108) | — | — | — | 9 | — | — | ||||||||||||||||||||||||||||||
| Total | 24,779 | 23,056 | 24,318 | 23,056 | 10,460 | 10,700 | 1,392 | 1,292 | 95.5 | 95.5 | ||||||||||||||||||||||||||||||
| 4) | Effective July 21, 2008, Koç Allianz Hayat ve Emeklilik AS was consolidated following the acquisition of approximately 51% of the shares in Koç Allianz Hayat ve Emeklilik AS by the Allianz Group, increasing our holding to approximately 89%. |
| 5) | Represents elimination of transactions between Allianz Group companies in different geographic regions. |
23
Table of Contents
| – | Operating profit of€ 146 million. |
| – | Third-party assets under management surpassed€ 800 billion. |
| – | Equities business remained under pressure. Fixed income business performed strongly. |
Earnings Summary 1)
2009 to 2008 second quarter comparison
Operating revenues in our Financial Services segment remained stable at € 926 million on a nominal basis compared to previous year’s quarter. Asset Management’s revenues increased by 5.5% to € 780 million, driven by a 7% increase in average assets under management, which was mainly due to the strengthening of the U.S. Dollar. Additionally, the first time consolidation of cominvest had an effect on the revenues. This movement in Asset Management offset a revenue decline of 19.1% to € 123 million in the Banking business due to lower fee income. Adjusted for foreign currency translation (€ 77 million) and consolidation effects (€ 31 million) operating revenues were 11.7% lower at € 817 million on an internal basis.
In a quarter-to-quarter comparison our segment’soperatingprofit was € 146 million, down 48.8%. This development was driven by an increase in operating expenses of 21.1% to € 770 million. In Asset Management expenses were up by 16.6% to € 534 million, primarily due to the appreciation of the U.S. Dollar and the first time consolidation of cominvest. In the Banking business, earnings were impacted by expensed set-up costs of € 84 million for the Allianz Bank in Germany. This was the main driver behind an increase in operating expenses of 53.7% to € 206 million.
2009 to 2008 first half comparison
For the first six months we recorded a decline inoperating revenues for Financial Services segment of 3.1% to € 1,788 million on a nominal basis. Adjusted for positive effects of the stronger U.S. Dollar (€ 145 million) and the first time consolidation of cominvest (€ 64 million) our revenues declined by 14.7% on an internal basis to € 1,575 million.
| 1) | Following the completion of the sale of Dresdner Bank on January 12, 2009, Allianz has modified its segment structure and introduced a new Financial Services segment starting with the first quarter 2009. Under the umbrella of Financial Services we have grouped our activities from Asset Management, Banking and Alternative Investment Management. |
The developments in revenues andoperating profit – which declined by 36.3% to € 344 million – were largely consistent with the 2009 to 2008 second quarter comparison.
Asset Management 2)
Third-party assets under management
As of June 30, 2009 our asset base in Asset Management amounted to € 813 billion, an increase of € 110 billion compared to December 31, 2008. We recorded net inflows for the first half of 2009 of € 28 billion with a positive contribution from fixed-income products of € 33 billion, partly offset by net outflows from our equity business. The rebounding markets in the second quarter led to market-related appreciations of € 39 billion, which lifted equities by € 6 billion and fixed-income securities by € 33 billion. Furthermore, we recorded a positive currency translation effect of € 3 billion. For further information on our third-party assets under management please refer to the following pages in this chapter.
Development of third-party assets under management
in€ bn
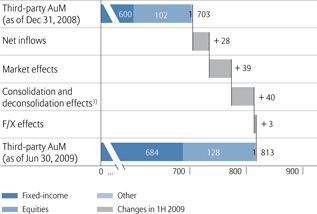
| 2) | The results of operations of our Financial Services segment are predominantly represented by our Asset Management business, accounting for 84.2% (2Q 2008: 79.9%) and 168.5% (2Q 2008: 98.6%) of our total Financial Services segment’s operating revenues and operating profit in the second quarter of 2009, respectively. Accordingly, we discuss the results of our Asset Management business in the following section. |
| 3) | Concerns basically cominvest. |
24
Table of Contents
Allianz Group Interim Report Second Quarter and First Half of 2009 Group Management Report
Operating revenues
| Three months ended June 30, | Six months ended June 30, | |||||||||||||||
2009 € mn | 2008 € mn | 2009 € mn | 2008 € mn | |||||||||||||
| Management fees | 877 | 840 | 1,697 | 1,681 | ||||||||||||
| Loading and exit fees | 66 | 64 | 125 | 130 | ||||||||||||
| Performance fees | 20 | 30 | 34 | 43 | ||||||||||||
| Other income | 9 | 118 | 23 | 184 | ||||||||||||
| Fee and commission income | 972 | 1,052 | 1,879 | 2,038 | ||||||||||||
| Commissions | (213) | (214) | (406) | (426) | ||||||||||||
| Other expenses | (7) | (117) | (12) | (185) | ||||||||||||
| Fee and commission expenses | (220) | (331) | (418) | (611) | ||||||||||||
| Net fee and commission income | 752 | 721 | 1,461 | 1,427 | ||||||||||||
2009 to 2008 second quarter comparison
Net fee and commission income amounted to € 752 million, an increase of 4.3% on a nominal basis.Management fees were up by € 37 million to € 877 million. Ourloading feeincome remained stable whileperformance fees declined by € 10 million. On an internal basis, net fee and commission income declined by 10.1%. This development was mainly attributable to the fact that our average third-party assets under management were lower on an internal basis, as equity investments declined in line with the equity market developments on a year-on-year comparison. This was only partly offset by the increase in internal growth of revenues in fixed-income.
Net income from financial assets and liabilities carried at fair value through income amounted to € 25 million and was € 22 million above the respective quarter in 2008.
2009 to 2008 first half comparison
For the first six months,operating revenues were up by 1.8% to € 1,495 million on a nominal basis. Adjusted for cominvest, contributing € 64 million, and positive foreign exchange effects, totalling € 145 million, we recordedoperating revenues of € 1,282 million, 12.7% down compared to the first half of 2008 on an internal basis. The developments in revenues were largely consistent with the 2009 to 2008 second quarter comparison.
Operating profit
2009 to 2008 second quarter comparison
Our Asset Management business experiences a recovery inoperating profit since the sharp decline in the third quarter 2008. Although this trend was supported by currency gains and the acquisition of cominvest, the operating profit development is also a result of our strong fixed-income business and our active expense management initiated in the fourth quarter 2008. Nevertheless the second quarter 2008 was a highly profitable one and therefore in a quarter-to-quarter comparison our operating profit declined by 12.5% to € 246 million in the second quarter 2009.
Operating profit
in€ mn
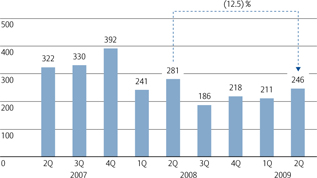
Cominvest and other one-off effects resulted in an increase inadministrative expenses to € 534 million, up 16.8%. Main drivers behind this increase were a foreign exchange development of € 43 million, the expenses of cominvest and
25
Table of Contents
Group Management Report Allianz Group Interim Report Second Quarter and First Half of 2009
other one-off effects amounting in total to € 40 million. Personnel expenses increased by 24.4% to € 357 million following the integration of cominvest. This increase was partially offset by lower non-personnel expenditure of € 19 million as a result of active cost management.
Ourcost-income ratio increased by 6.5% percentage points to 68.5% compared to the respective quarter last year. Compared to the peak in the third quarter 2008 the cost-income ratio is further tending downwards.
2009 to 2008 first half comparison
For the first half year 2009operating profit declined by 12.5% to € 457 million. The developments in the respective positions were largely consistent with the 2009 to 2008 second quarter comparison.
Third-party assets under management of the Allianz Group
Third-party assets under management by geographic region as of June 30, 2009
(December 31, 2008) 1)
in %
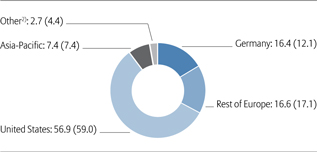
The acquisition of cominvest increased the proportion of investments originating in Germany since the beginning of the year, which now account for more than 16% of Allianz’s third-party assets under management.
| 1) | Based on the origination of assets. |
| 2) | Consists of third-party assets managed by other Allianz Group companies (approximately€ 22 bn as of June 30, 2009 and€ 22 bn as of December 31, 2008, respectively) and Dresdner Bank (approximately€ 9 bn as of December 31, 2008). |
The split between equity and fixed-income assets remained almost unchanged. The latter made up for 84% of third-party assets under management – a decrease of 1 percentage point versus year end 2008 – with equity assets accounting for the balance.
The weighting of retail and institutional clients shifted towards retail customers which accounted for 32% of our third-party assets as of June 30, 2009 (December 31, 2008: 26%).
Rolling investment performance of Allianz Global Investors3)
in %
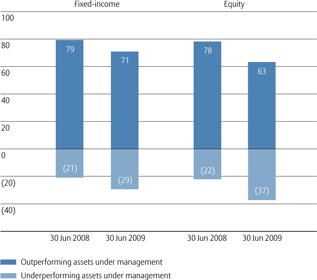
Compared to year-end 2008, the performance of Allianz Global Investors’ (AGI) assets under management recovered and remained robust. 63% (December 31, 2008: 62%) of our equity products achieved an outperformance against bench-marks. Our fixed-income products improved performance in the course of the second quarter and 71% (December 31, 2008: 48%) outperformed their respective benchmarks.
| 3) | AllianzGI account-based, asset-weighted 3-year investment performance of third party assets vs. benchmark including all equity and fixed income accounts managed on a discretionary basis by equity and fixed income managers of AllianzGI (including direct accounts and Spezialfonds, excluding CPM-portfolios of Allianz with AllianzGI Germany). For some retail funds the net of fee performance is compared to the median performance of an appropriate peer group (Morningstar or Lipper; 1st and 2nd quartile mean out-performance). For all other retail funds and for all institutional accounts performance is calculated gross of fees using closing prices (revaluated) where appropriate and compared to the benchmark of each individual fund or account. Other than under GIPS, the performance of closed funds/accounts is not included in the analysis. Also not included: accounts of AllianzGI France, AllianzGI Italy, AllianzGI Korea, and AllianzGI Taiwan. Only partially included: WRAP accounts. |
26
Table of Contents
Allianz Group Interim Report Second Quarter and First Half of 2009 Group Management Report
Financial Services segment information
| Asset Management | Banking | Alternative Investment Management | Financial Services1) | |||||||||||||||||||||||||||||
2009 € mn | 2008 € mn | 2009 € mn | 2008 € mn | 2009 € mn | 2008 € mn | 2009 € mn | 2008 € mn | |||||||||||||||||||||||||
| Three months ended June 30, | ||||||||||||||||||||||||||||||||
| Net fee and commission income 2) | 752 | 721 | 43 | 64 | 20 | 30 | 814 | 816 | ||||||||||||||||||||||||
| Net interest income 3) | (2) | 8 | 77 | 88 | — | 3 | 75 | 100 | ||||||||||||||||||||||||
| Income from financial assets and liabilities carried at fair value through income (net) | 25 | 3 | 3 | — | — | (1) | 28 | 2 | ||||||||||||||||||||||||
| Other income | 5 | 7 | — | — | 4 | — | 9 | 7 | ||||||||||||||||||||||||
| Operating revenues 4) | 780 | 739 | 123 | 152 | 24 | 32 | 926 | 925 | ||||||||||||||||||||||||
| Administrative expenses (net), excluding acquisition-related expenses | (534) | (457) | (207) | (137) | (31) | (42) | (771) | (638) | ||||||||||||||||||||||||
| Investment expenses | — | (1) | 2 | 2 | — | — | 2 | 1 | ||||||||||||||||||||||||
| Other expenses | — | — | (1) | 1 | — | — | (1) | 1 | ||||||||||||||||||||||||
| Operating expenses | (534) | (458) | (206) | (134) | (31) | (42) | (770) | (636) | ||||||||||||||||||||||||
| Loan loss provisions | — | — | (10) | (4) | — | — | (10) | (4) | ||||||||||||||||||||||||
| Operating profit (loss) | 246 | 281 | (93) | 14 | (7) | (10) | 146 | 285 | ||||||||||||||||||||||||
| Cost-income ratio 5)in % | 68.5 | 62.0 | 167.5 | 88.2 | 129.2 | 131.3 | 83.2 | 68.8 | ||||||||||||||||||||||||
| Six months ended June 30, | ||||||||||||||||||||||||||||||||
| Net fee and commission income 2) | 1,461 | 1,427 | 78 | 138 | 50 | 84 | 1,588 | 1,649 | ||||||||||||||||||||||||
| Net interest income 3) | 10 | 27 | 157 | 166 | 1 | 3 | 168 | 196 | ||||||||||||||||||||||||
| Income from financial assets and liabilities carried at fair value through income (net) | 16 | 2 | 4 | (10) | — | (3) | 20 | (11) | ||||||||||||||||||||||||
| Other income | 8 | 12 | — | — | 4 | — | 12 | 12 | ||||||||||||||||||||||||
| Operating revenues 4) | 1,495 | 1,468 | 239 | 294 | 55 | 84 | 1,788 | 1,846 | ||||||||||||||||||||||||
| Administrative expenses (net), excluding acquisition-related expenses | (1,039) | (946) | (325) | (277) | (64) | (75) | (1,427) | (1,298) | ||||||||||||||||||||||||
| Investment expenses | 1 | — | 1 | 5 | (1) | (2) | 1 | 3 | ||||||||||||||||||||||||
| Other expenses | — | — | (1) | — | — | — | (1) | — | ||||||||||||||||||||||||
| Operating expenses | (1,038) | (946) | (325) | (272) | (65) | (77) | (1,427) | (1,295) | ||||||||||||||||||||||||
| Loan loss provisions | — | — | (17) | (11) | — | — | (17) | (11) | ||||||||||||||||||||||||
| Operating profit (loss) | 457 | 522 | (103) | 11 | (10) | 7 | 344 | 540 | ||||||||||||||||||||||||
| Cost-income ratio 5)in % | 69.4 | 64.4 | 136.0 | 92.5 | 118.2 | 91.7 | 79.8 | 70.2 | ||||||||||||||||||||||||
| 1) | Including consolidation in between the financial services segment as recorded in the segment information in Note 5 to the condensed consolidated interim financial statements. |
| 2) | Represents fee and commission income less fee and commission expenses. |
| 3) | Represents interest and similar income less interest expenses. |
| 4) | For the Financial Services segment, total revenues are measured based upon operating revenues. |
| 5) | Represents operating expenses divided by operating revenues. |
27
Table of Contents
Earnings Summary
In the second quarter 2009 the aggregate operating loss amounted to € 212 million and increased € 196 million compared to a loss of € 16 million in the prior year quarter.
Interest and similar income declined by € 163 million mainly driven by lower interest income due to a lower level of short term interest rates compared to the previous year. Thereof, dividend income declined by € 62 million as a result of our equity exposure reduction program.
Investment expenses increased by € 96 million entirely driven by unfavorable foreign currency movements amounting to € 110 million, which were only partially offset by gains of € 37 million from foreign currency hedges reported in the line operating income from financial assets and liabilities carried at fair value through income.
Acquisition and administrative expenses were reduced by € 12 million or 9% on a three months basis.
In the first half of 2009, the same effects led to an operating loss of € 383 million, an increase of € 263 million compared to an operating loss of € 120 million in the first six months of 2008.
Corporate activities segment information
| Three months ended June 30, | Six months ended June 30, | |||||||||||||||
2009 € mn | 2008 € mn | 2009 € mn | 2008 € mn | |||||||||||||
| Total revenues | — | — | — | — | ||||||||||||
| Interest and similar income | 119 | 282 | 234 | 514 | ||||||||||||
| Operating income from financial assets and liabilities carried at fair value through income (net) | 45 | (2) | 47 | (2) | ||||||||||||
| Fee and commission income | 65 | 21 | 100 | 32 | ||||||||||||
| Other income | — | — | — | 1 | ||||||||||||
| Interest expenses, excluding interest expenses from external debt | (112) | (133) | (237) | (308) | ||||||||||||
| Investment expenses | (145) | (49) | (181) | (94) | ||||||||||||
| Acquisition and administrative expenses (net), excluding acquisition-related expenses | (121) | (133) | (275) | (260) | ||||||||||||
| Fee and commission expenses | (63) | (2) | (71) | (3) | ||||||||||||
| Operating loss | (212) | (16) | (383) | (120) | ||||||||||||
28
Table of Contents
– Strong solvency ratio of 159% 1).
– Shareholders’ equity of€ 34.5 billion.
Shareholders’ Equity 2)
Shareholders’ equity
in€ mn
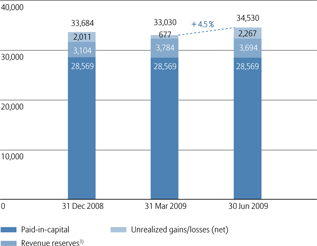
As of June 30, 2009, shareholders’ equity amounted to € 34,530 million and was up 4.5% from March 31, 2009. The change was driven by net income of € 1,869 million and an increase in unrealized gains of € 1,590 million, whilst the payment of the 2008 dividend of € 1,580 million reduced equity.
| 1) | During the fiscal year, conglomerate solvency is partially based on assumptions. The extent to which intangible assets related to certain private equity investments are to be deducted from our own funds for the purpose of the conglomerate solvency calculation has not yet been finally agreed by BaFin. |
| 2) | Does not include minority interests of€ 2.1 bn,€ 2.1 bn and€ 3.6 bn as of June 30, 2009, March 31, 2009 and December 31, 2008, respectively. For further information please refer to Note 21 to the condensed consolidated interim financial statements. |
| 3) | Include foreign currency translation adjustments. |
Regulatory capital adequacy
Allianz Group is a financial conglomerate within the scope of the Financial Conglomerates Directive and the related German law effective since January 1, 2005. Under this directive, a financial conglomerate is defined as any financial parent holding company that, together with its subsidiaries, has significant cross-border and cross-sector activities. The law requires that a financial conglomerate calculates the capital needed to meet the respective solvency requirements on a consolidated basis.
Conglomerate solvency
in€ bn

As of June 30, 2009 our available funds for the solvency margin, required for our insurance segments and our banking and asset management business were € 33.0 billion including off-balance sheet reserves, surpassing the minimum legally stipulated level by € 12.2 billion. This margin resulted in a cover ratio of 159% 1) at June 30, 2009.
| 4) | Available funds and requirement as of December 31, 2008 including discontinued operations were adjusted to reflect the pro-forma view. For example, we removed hybrid capital related to Dresdner Bank from available funds and adjusted the deduction of goodwill and other intangible assets. Furthermore, we deleted the requirement of our discontinued operations. |
29
Table of Contents
Group Management Report Allianz Group Interim Report Second Quarter and First Half of 2009
Total Assets and Total Liabilities
In the following sections, we show our asset allocation for our insurance portfolio and analyze important developments within the balance sheets of our Property-Casualty, Life/Health, Financial Services and Corporate segments as presented on pages 56 and 57.
As of June 30, 2009 total assets amounted to € 555.7 billion and total liabilities amounted to € 519.1 billion. When compared to the year end 2008 total assets and total liabilities decreased by € 399.9 billion and € 399.2 billion, respectively. This decrease was attributable to the deconsolidation of Dresdner Bank on January 12, 2009. For the year-end 2008 we recorded Dresdner Bank in our consolidated balance sheet as “Non-current assets and assets of disposal groups classified as held-for-sale” and “Liabilities of disposal groups classified as held-for-sale” with the amounts of € 417.9 billion and € 410.5 billion, respectively.
Asset allocation of Property-Casualty, Life/Health and Corporate segments
Investment assets from our Property-Casualty, Life/Health and Corporate segments amounted to € 383.0 billion as of June 30, 2009. Thereof, the fixed-income portfolio which comprised bonds and loans 1) accounted for € 342.4 billion, equities for € 27.1 billion and other investment categories for € 13.5 billion. The increase in our debt portfolio by € 26.6 billion was driven by higher net inflows mainly stemming from our Life/Health segment within the first six months of 2009 and positive market effects in the second quarter 2009 resulting from narrowing credit spreads.
| 1) | Excluding internal loans. |
Fixed-income portfolio by investment country
in %
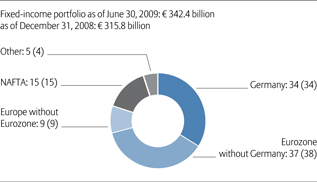
From a regional perspective our fixed-income portfolio is well diversified. The regional split in the first six months remained stable.
Fixed-income portfolio by type of issuer
in %
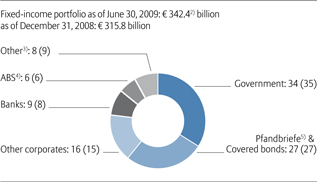
We consider our fixed-income portfolio to be both of high quality and well diversified. A share of more than 60% relates to government and covered bonds that help mitigate against possible future deteriorations in the credit markets. The relatively high share in government bonds and loans amounting to € 117.8 billion and German Pfandbriefe at € 61.7 billion secure a high fungibility of the portfolio as assets attributable to the Eurozone are eligible as collateral
| 2) | Including€ 13.6 billion subordinated debt securities; thereof€ 10.8 bn related to our exposure in banks as of June 30, 2009. |
| 3) | 5%-pts are mainly seasoned self-originated German Private Retail Mortgage Loans and 2%-pts are short-term deposits at banks. |
| 4) | Includes€ 7.9 bn U.S. Agency MBS. |
| 5) | Type of covered bond issued in Germany. |
30
Table of Contents
Allianz Group Interim Report Second Quarter and First Half of 2009 Group Management Report
and markets for government bonds are still liquid. In comparison to year-end 2008 investments in the category Other corporates increased mainly as market values went up due to lower credit spreads.
Government exposures
in %
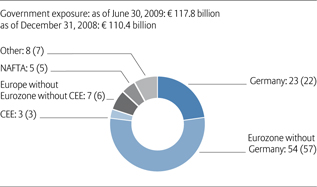
Nearly 80% of our government exposure was attributable to the Eurozone. This quota remained stable compared to year-end 2008.
Pfandbrief and covered bond portfolio
in %
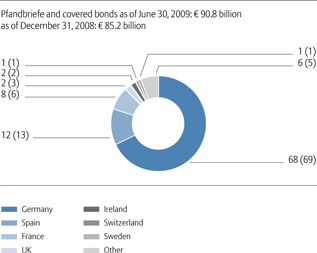
68% of covered bonds are German Pfandbriefe backed by either public sector loans or mortgage loans. On these as well as on all other covered bond exposures, minimum required security buffers as well as voluntary over-collateralization offer a substantial cushion for house price deterioration and payment defaults.
Assets and liabilities of the Property-Casualty segment
Property-Casualty assets
Property-Casualty asset base1)
fair values2) in€ bn
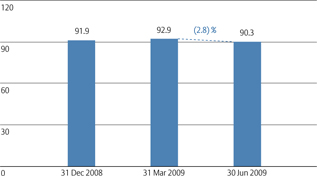
In thefirst quarter 2009, our Property-Casualty asset base increased by € 1.0 billion. An increase in debt securities of € 2.0 billion to € 53.6 billion outweighed the decline in equity investments, which were down 20.3% to € 5.1 billion, due to market movements and disposals. In addition cash and cash pool assets were € 1.0 billion above the year-end, and amounted to € 8.5 billion.
In thesecond quarter 2009, the Property-Casualty asset base decreased by 2.8% to € 90.3 billion. Equity investments declined by € 0.8 billion following large disposals of € 1.5 billion. In contrast, as equity markets recovered, positive market effects amounting to € 0.7 billion had an offsetting effect.
| 1) | We have changed the definition of the asset bases to better reflect the economic reality: from 1Q 2009 onwards we include cash and cash equivalents and receivables from cash pooling net of liabilities from securities lending in our asset bases. |
| 2) | Loans and advances to banks and customers, held-to-maturity investments, and real estate held for investment are stated at amortized cost. Investments in associates and joint ventures are stated at either amortized cost or equity, depending upon, among other factors, our ownership percentage. |
31
Table of Contents
Group Management Report Allianz Group Interim Report Second Quarter and First Half of 2009
Composition of the Property-Casualty asset base
fair values1)
As of € bn | As of € bn | As of 2008 € bn | ||||||||||
| Financial assets and liabilities carried at fair value through income | ||||||||||||
Equities | 0.2 | 0.1 | 0.2 | |||||||||
Debt securities | 1.6 | 1.4 | 1.5 | |||||||||
Other2) | 0.1 | 0.1 | 0.2 | |||||||||
Subtotal | 1.9 | 1.6 | 1.9 | |||||||||
| Investments3) | ||||||||||||
Equities | 4.3 | 5.1 | 6.4 | |||||||||
Debt securities | 55.4 | 53.6 | 51.6 | |||||||||
Cash and cash pool assets4) | 5.5 | 8.5 | 7.5 | |||||||||
Other | 6.7 | 6.9 | 6.9 | |||||||||
Subtotal | 71.9 | 74.1 | 72.4 | |||||||||
| Loans and advances to banks and customers | 16.5 | 17.2 | 17.6 | |||||||||
| Property-Casualty asset base | 90.3 | 92.9 | 91.9 |
Of our Property-Casualty asset base, asset-backed securities (ABS) made up € 4.4 billion as of June 30, 2009, which is less than 5% of our asset-base. CDOs accounted for € 0.1 billion of this amount.
Cash and cash pool assets decreased by € 3.0 billion due to a repayment of short-term cash liabilities, which decreased by the same amount. Therefore we recorded no net change.
| 1) | Loans and advances to banks and customers, held-to-maturity investments, and real estate held for investment are stated at amortized cost. Investments in associates and joint ventures are stated at either amortized cost or equity, depending upon, among other factors, our ownership percentage. |
| 2) | Comprises assets of€ 0.2 bn,€ 0.2 bn and€ 0.3 bn and liabilities of€ (0.1) bn,€ (0.1) bn and€ (0.1) bn as of June 30, 2009, March 31, 2009 and December 31, 2008 respectively. |
| 3) | Do not include affiliates of€ 10.9 bn,€ 10.6 bn and€ 10.7 bn as of June 30, 2009, March 31, 2009 and December 31, 2008, respectively. |
| 4) | Including cash and cash equivalents as stated in our segment balance sheet of€ 2.9 bn,€ 2.9 bn and€ 2.7 bn and receivables from cash pooling amounting to€ 2.6 bn,€ 5.6 bn and€ 5.0 bn net of liabilities from securities lending of€ 0 bn,€ 0 bn and€ (0.2) bn as of June 30, 2009, March 31, 2009 and December 31, 2008, respectively. |
Property-Casualty liabilities
Development of reserves for loss and loss adjustment expenses5)
in€ bn
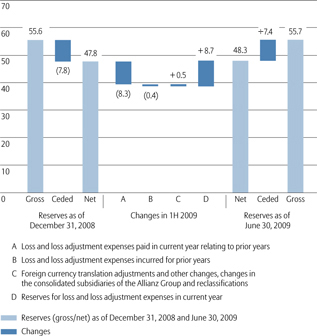
As of June 30, 2009, the segment’s gross reserves for loss and loss adjustment expenses increased by 0.2% to € 55.7 billion. On a net basis reserves were up 1.0% to € 48.3 billion. Foreign currency translation effects and other changes accounted for € 0.5 billion.
| 5) | After group consolidation. For further information about changes in the reserves for loss and loss adjustment expenses for the Property-Casualty segment please refer to Note 16 to the condensed consolidated interim financial statements. |
32
Table of Contents
Allianz Group Interim Report Second Quarter and First Half of 2009 Group Management Report
Assets and liabilities of the Life/Health segment
Life/Health assets
Life/Health asset base 1)
fair values2) in€ bn
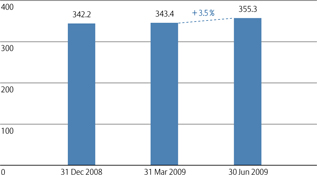
In thefirst quarter, our Life/Health asset base increased by 0.4% to € 343.4 billion. A reduction in equity investments of € 3.7 billion to € 18.5 billion due to the weak market environment, which led to market-related effects of € (2.0) billion, together with disposals, was mostly offset by an increase of € 3.2 billion in debt securities to € 157.6 billion. Furthermore, loans and advances to banks and customers increased by 5.1% to € 95.2 billion. Assets for unit-linked contracts declined by € 1.3 billion to € 49.1 billion.
In thesecond quarter, our Life/Health asset base increased by 3.5% to € 355.3 billion. We recorded a significant increase in debt investments from € 157.6 billion in the first quarter 2009 up to € 165.5 billion by the end of the second quarter 2009. This development was driven by strong net inflows from our Life insurance business and positive market movements induced by credit spread narrowing resulting in an increase of the value of our corporate bonds. A reduction in equity investments of € 0.3 billion to € 18.2 billion due to our equity reduction program was particularly offset by strong performing equity markets. Increase in loans and advances to banks and customers by € 6.4 billion was due to reinvestments from cash.
| 1) | We have changed the definition of the asset bases to better reflect the economic reality: from 1Q 2009 onwards we include cash and cash equivalents and receivables from cash pooling net of liabilities from securities lending in our asset bases. |
| 2) | Loans and advances to banks and customers, held-to-maturity investments, and real estate held for investment are stated at amortized cost. Investments in associates and joint ventures are stated at either amortized cost or equity, depending upon, among other factors, our ownership percentage. |
Composition of the Life/Health asset base
fair values2)
As of € bn | As of € bn | As of € bn | ||||||||||
| Financial assets and liabilities carried at fair value through income | ||||||||||||
Equities | 2.6 | 2.3 | 2.5 | |||||||||
Debt securities | 7.5 | 6.3 | 7.7 | |||||||||
Other 3) | (4.3) | (5.0) | (4.3) | |||||||||
Subtotal | 5.8 | 3.6 | 5.9 | |||||||||
| Investments4) | ||||||||||||
Equities | 18.2 | 18.5 | 22.2 | |||||||||
Debt securities | 165.5 | 157.6 | 154.4 | |||||||||
Cash and cash pool assets5) | 4.7 | 11.8 | 11.0 | |||||||||
Other | 7.6 | 7.6 | 7.7 | |||||||||
Subtotal | 196.0 | 195.5 | 195.3 | |||||||||
| Loans and advances to banks and customers | 101.6 | 95.2 | 90.6 | |||||||||
Financial assets for unit-linked contracts6) | 51.9 | 49.1 | 50.4 | |||||||||
| Life/Health asset base | 355.3 | 343.4 | 342.2 |
Within our Life/Health asset base, ABS amounted to € 15.6 billion as of June 30, 2009, which is less than 5% of total Life/Health assets. Thereof, € 1.0 billion are CDOs. Unrealized losses on CDOs of € 15 million were recorded in shareholders’ equity.
| 3) | Comprises assets of€ 1.0 bn,€ 1.2 bn and€ 1.5 bn and liabilities of€ (5.3) bn,€ (6.2) bn and€ (5.8) bn as of June 30, 2009, March 31, 2009 and December 31, 2008 respectively. |
| 4) | Do not include affiliates of€ 1.6 bn,€ 1.6 bn and€ 2.5 bn as of June 30, 2009, March 31, 2009 and December 31, 2008, respectively. |
| 5) | Including cash and cash equivalents as stated in our segment balance sheet of€ 2.6 bn,€ 2.8 bn and€ 4.8 bn and receivables from cash pooling amounting to€ 2.1 bn,€ 9.0 bn and€ 6.6 bn net of liabilities from securities lending of€ 0 bn,€ 0 bn and€ (0.4) bn as of June 30, 2009, March 31, 2009 and December 31, 2008, respectively. |
| 6) | Financial assets for unit-linked contracts represent assets owned by, and managed on the behalf of, policyholders of the Allianz Group, with all appreciation and depreciation in these assets accruing to the benefit of policyholders. As a result, the value of financial assets for unit-linked contracts in our balance sheet corresponds to the value of financial liabilities for unit-linked contracts. |
33
Table of Contents
Group Management Report Allianz Group Interim Report Second Quarter and First Half of 2009
Financial assets for unit-linked contracts
in€ bn
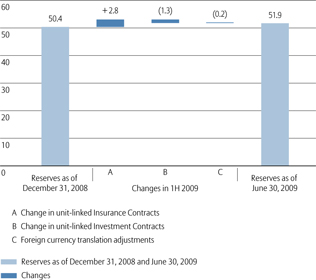
Our financial assets for unit-linked contracts amounted to € 51.9 billion. Unit-linked insurance contracts increased by € 2.8 billion, which was largely attributable to a favorable fund performance and a fairly stable premium inflow. Partly offsetting were changes from unit-linked investment contracts which decreased € 1.3 billion due to lower sales, as our Italian bankassurance channel was reoriented towards more traditional products.
Life/Health liabilities
Development of reserves for insurance and investment contracts
in€ bn
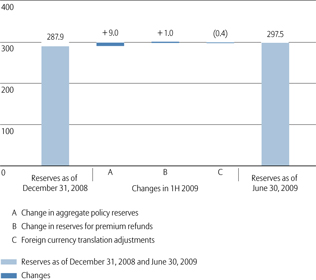
Life/Health reserves for insurance and investment contracts increased in the first half year of 2009 by € 9.6 billion to € 297.5 billion. We recorded additional policy reserves in Italy of € 2.1 billion, in Germany of € 1.9 billion and in Thailand, which we consolidated for the first time in the second quarter 2009, of € 1.9 billion. The partial recovery of financial markets strengthened the market values of our investments, therefore reserves for premium refund increased by € 0.9 billion, major driver was our German business. This was partly compensated by foreign currency losses mainly stemming from the U.S. Dollar.
Assets and liabilities of the Financial Services segment
Financial Services assets
Assets in our Financial Services segment relate mostly to our continuing banking business. Our Asset Management segment’s results of operations stem primarily from its management of third-party assets.1)
Loans and advances to banks and customers2)
in€ bn
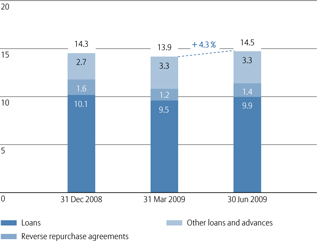
Financial Services liabilities
At the end of the first six months liabilities to banks and customers amounted to € 17.1 billion (up 1.2%). Thereof, liabilities payable on demand accounted for € 3.9 billion, repurchase agreements for € 1.3 billion, term deposits and certificates of deposit for € 4.5 billion and savings deposits for € 1.9 billion.
| 1) | For further information on the development of these third-party assets please refer to pages 24 and 26. |
| 2) | Includes loan loss allowance of€ (0.1) bn as of June 30, 2009, March 31, 2009 and December 31, 2008, respectively. |
34
Table of Contents
Allianz Group Interim Report Second Quarter and First Half of 2009 Group Management Report
Assets and liabilities of the Corporate segment
Corporate assets
Corporate asset base 1)
fair values 2) in€ bn
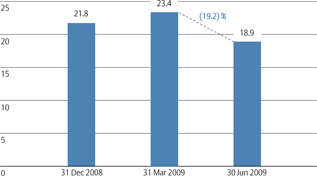
In thefirst quarter our Corporate asset base increased by 7.3% mainly driven by higher loans and advances to banks and customers of € 9.1 billion (December 31, 2008 € 6.0 billion). Thereof, short-term investments and certificates of deposit went up by € 2.1 billion to € 6.4 billion. Additionally, Allianz Group retained CDOs from Dresdner Bank which amounted to € 1.0 billion as of March 31, 2009. Investments were down by € 1.9 billion, mainly as equities were down by € 0.6 billion and cash and cash pool assets declined by € 1.4 billion.
In thesecond quarter the Corporate asset base declined by 19.2% to 18.9 billion. Investments in equities declined mainly due to the sale of ICBC with proceeds of € 1.2 billion. This development was partially offset by positive market movements. Loans and advances to banks and customers decreased by € 4.4 billion mainly due to lower short-term investments.
| 1) | We have changed the definition of the asset bases to better reflect the economic reality: from 1Q 2009 onwards we include cash and cash equivalents and receivables from cash pooling net of liabilities from securities lending in our asset bases. |
| 2) | Loans and advances to banks and customers, held-to-maturity investments, and real estate held for investment are stated at amortized cost. Investments in associates and joint ventures are stated at either amortized cost or equity, depending upon, among other factors, our ownership percentage. |
Composition of the Corporate asset base
fair values 2)
As of June 30, 2009 € bn | As of March 31, 2009 € bn | As of € bn | ||||||||||
| Financial assets and liabilities carried at fair value through income | ||||||||||||
Equities | — | — | — | |||||||||
Debt securities | 0.1 | 0.2 | 0.2 | |||||||||
Other 3) | — | — | (0.4) | |||||||||
Subtotal | 0.1 | 0.2 | (0.2) | |||||||||
| Investments 4) | ||||||||||||
Equities | 4.5 | 5.2 | 5.8 | |||||||||
Debt securities | 8.9 | 8.5 | 8.4 | |||||||||
Cash and cash pool assets 5) | 0.6 | 0.3 | 1.7 | |||||||||
Other | 0.1 | 0.1 | 0.1 | |||||||||
Subtotal | 14.1 | 14.1 | 16.0 | |||||||||
| Loans and advances to banks and customers | 4.7 | 9.1 | 6.0 | |||||||||
| Corporate asset base | 18.9 | 23.4 | 21.8 |
ABS in our Corporate asset base, amounted to € 0.9 billion as of June 30, 2009, which is around 5% of our asset-base.
Corporate liabilities
Other liabilities amounted to € 13.6 billion after € 16.3 billion at year-end 2008. In the first half 2009, certificated liabilities decreased by € 1.5 billion to € 12.0 billion. This was mainly attributable to the Allianz SE issued debt outstanding 6) which went down from € 8.2 billion as of December 31, 2008 to € 5.6 billion as of June 30, 2009.
Redemption of profit participation certificate
On June 24, 2009 the management board of Allianz SE decided to call for redemption of the profit participation certificates which were issued by Allianz SE. This call will be effective on December 31, 2009. The holders will receive a
| 3) | Comprises assets of€ 0.4 bn,€ 0.4 bn and€ 0.4 bn and liabilities of€ (0.4) bn,€ (0.4) bn and€ (0.8) bn as of June 30, 2009, March 31, 2009 and December 31, 2008 respectively. |
| 4) | Do not include affiliates of€ 66.7 bn,€ 65.8 bn and€ 87.1 bn as of June 30, 2009, March 31, 2009 and December 31, 2008, respectively. |
| 5) | Including cash and cash equivalents as stated in our segment balance sheet of€ 0.3 bn,€ 0.2 bn and€ 0.5 bn and receivables from cash pooling amounting to€ 0.3 bn,€ 0.1 bn and€ 1.2 bn net of liabilities from securities lending of€ 0 bn,€ 0 bn and€ 0 bn as of June 30, 2009, March 31, 2009 and December 31, 2008, respectively. |
| 6) | For further information on Allianz SE issued debt outstanding as of June 30, 2009, please refer to page 36 and to Note 19 and 20 to our condensed consolidated interim financial statements. |
35
Table of Contents
Group Management Report Allianz Group Interim Report Second Quarter and First Half of 2009
cash compensation corresponding to 122.9% of the volume-weighted average price of the Allianz SE shares, based on the quotation during the last three months prior to the termination, but not less than € 72.39 per profit participation certificate.
Allianz SE issued debt outstanding as of June 30, 2009 1)
| 1. Senior bonds2) | ||||
5.625% bond issued by Allianz Finance II B.V., Amsterdam | ||||
| Volume | € 0.9 bn | |||
| Year of issue | 2002 | |||
| Maturity date | 11/29/2012 | |||
| ISIN | XS 015 879 238 1 | |||
5.0% bond issued by Allianz Finance II B.V., Amsterdam | ||||
| Volume | € 1.5 bn | |||
| Year of issue | 2008 | |||
| Maturity date | 3/6/2013 | |||
| ISIN | DE 000 A0TR7K7 | |||
4.0% bond issued by Allianz Finance II B.V., Amsterdam | ||||
| Volume | € 1.5 bn | |||
| Year of issue | 2006 | |||
| Maturity date | 11/23/2016 | |||
| ISIN | XS 027 588 026 7 | |||
| 2. Subordinated bonds3) | ||||
6.125% bond issued by Allianz Finance II B. V., Amsterdam | ||||
| Volume | € 2.0 bn | |||
| Year of issue | 2002 | |||
| Maturity date | 5/31/2022 | |||
| ISIN | XS 014 888 756 4 | |||
6.5% bond issued by Allianz Finance II B. V., Amsterdam | ||||
| Volume | € 1.0 bn | |||
| Year of issue | 2002 | |||
| Maturity date | 1/13/2025 | |||
| ISIN | XS 015 952 750 5 | |||
7.25% bond issued by Allianz Finance II B. V., Amsterdam | ||||
| Volume | USD 0.5 bn | |||
| Year of issue | 2002 | |||
| Maturity date | Perpetual Bond | |||
| ISIN | XS 015 915 072 0 | |||
| 1) | For further information on Allianz SE issued debt outstanding as of June 30, 2009, please refer to Note 19 and 20 to our condensed consolidated interim financial statements. |
| 2) | Senior bonds and commercial papers provide for early termination rights in case of non-payment of amounts due under the bond (interest and principal) as well as in case of insolvency of the relevant issuer or, if applicable, the relevant guarantor (Allianz SE). The same applies to two subordinated bonds issued in 2002. |
| 3) | The terms of the subordinated bonds (except for the two subordinated bonds mentioned in footnote 2 above) do not provide for early termination rights in favor of the bond holder. Interest payments are subject to certain conditions which are linked, inter alia, to our net income, and may have to be deferred. Nevertheless, the terms of the relevant bonds provide for alternative settlement mechanisms which allow us to avoid an interest deferral using cash raised from the issuance of specific newly issued instruments. |
5.5% bond issued by Allianz SE | ||||
| Volume | € 1.5 bn | |||
| Year of issue | 2004 | |||
| Maturity date | Perpetual Bond | |||
| ISIN | XS 018 716 232 5 | |||
4.375% bond issued by Allianz Finance II B. V., Amsterdam | ||||
| Volume | € 1.4 bn | |||
| Year of issue | 2005 | |||
| Maturity date | Perpetual Bond | |||
| ISIN | XS 021 163 783 9 | |||
5.375% bond issued by Allianz Finance II B. V., Amsterdam | ||||
| Volume | € 0.8 bn | |||
| Year of issue | 2006 | |||
| Maturity date | Perpetual Bond | |||
| ISIN | DE000A0GNPZ3 | |||
8.375% bond issued by Allianz SE | ||||
| Volume | USD 2.0 bn | |||
| Year of issue | 2008 | |||
| Maturity date | Perpetual Bond | |||
| ISIN | US 018 805 200 7 | |||
| 3. Participation certificates | ||||
| Allianz SE participation certificate | ||||
| Volume | € 85.1 mn | |||
| ISIN | DE 000 840 405 4 | |||
| 4. Issues matured in 1H 2009 | ||||
Floating coupon rate bond issued by Allianz Finance II B.V., Amsterdam | ||||
| Volume | USD 0.4 bn | |||
| Year of issue | 2007 | |||
| Maturity date | 4/2/2009 | |||
| ISIN | XS 029 027 0056 | |||
36
Table of Contents
Reconciliation of Consolidated Operating Profit and Income Before Income Taxes and Minority Interests in Earnings
The previous analysis is based on our consolidated financial statements and should be read in conjunction with them. The Allianz Group uses operating profit to evaluate the performance of its business segments and the Group as a whole. The Allianz Group considers the presentation of operating profit to be useful and meaningful to investors because it enhances the understanding of the Allianz Group’s underlying operating performance and the comparability of its operating performance over time. Operating profit highlights the portion of income before income taxes and minority interests in earnings attributable to the on-going core operations of the Allianz Group. To better understand the on-going operations of the business, we exclude the effects of acquisition-related expenses and the amortization of intangible assets, as these relate to business combinations; and we exclude interest expense from external debt and non-operating income from financial assets and liabilities carried at fair value through income (net) as these relate to our capital structure.
We believe that trends in the underlying profitability of our business can be more clearly identified without the fluctuating effects of the realized capital gains and losses or impairments of investment securities, as these are largely dependent on market cycles or issuer-specific events over which we have little or no control, and can and do vary, sometimes materially, across periods. Furthermore, the timing of sales that would result in such gains or losses is largely at our discretion.
We also exclude income from fully consolidated private equity investments (net) as this represents income from industrial holdings, which is outside the Allianz Group’s normal scope of business.
Similarly, we exclude restructuring charges because the timing of the restructuring charges are largely within our control, and accordingly their exclusion provides additional insight into the operating trends of the underlying business. This differentiation is not made if the profit sources are shared with the policyholder.
Operating profit should be viewed as complementary to, and not a substitute for income before income taxes and minority interests in earnings or net income as determined in accordance with IFRS.
Reconciliation of operating profit on a consolidated basis to the Allianz Group’s income before income taxes and minority interests in earnings
| Three months ended June 30, | Six months ended June 30, | |||||||||||||||
2009 € mn | 2008 € mn | 2009 € mn | 2008 € mn | |||||||||||||
| Operating profit | 1,786 | 2,659 | 3,205 | 4,885 | ||||||||||||
| Non-operating realized gains/losses (net) and impairments of investments (net) | 815 | 548 | 317 | 561 | ||||||||||||
| Non-operating income from financial assets and liabilities carried at fair value through income (net) | 137 | (88) | 37 | 39 | ||||||||||||
| Income (loss) from fully consolidated private equity investments (net) | (101) | 29 | (157) | 52 | ||||||||||||
| Interest expenses from external debt | (214) | (233) | (452) | (485) | ||||||||||||
| Non-operating restructuring charges | (14) | (8) | (77) | (2) | ||||||||||||
| Acquisition-related expenses | (44) | (79) | (53) | (186) | ||||||||||||
| Amortization of intangible assets | (11) | (3) | (15) | (8) | ||||||||||||
| Reclassification of tax benefits | (20) | (10) | (26) | (23) | ||||||||||||
| Income before income taxes and minority interests in earnings | 2,334 | 2,815 | 2,779 | 4,833 | ||||||||||||
37
Table of Contents
Group Management Report Allianz Group Interim Report Second Quarter and First Half of 2009
Composition of Total Revenue 1) Growth
We also believe that an understanding of our total revenue performance is enhanced when the effects of foreign currency translation as well as acquisitions and disposals (or changes in scope of consolidation) are excluded. Accordingly, in addition to presenting “nominal growth”, we also present “internal growth”, which excludes the effects of foreign currency translation and changes in scope of consolidation.
Reconciliation of nominal total revenue growth to internal total revenue growth
| Three months ended June 30, | Six months ended June 30, | |||||||||||||||||||||||||||||||
| Nominal growth | Changes in scope of consolidation | Foreign currency translation | Internal growth | Nominal growth | Changes in scope of consolidation | Foreign currency translation | Internal growth | |||||||||||||||||||||||||
| % | % | % | % | % | % | % | % | |||||||||||||||||||||||||
| Property-Casualty | (3.3) | 0.8 | (0.4) | (3.7) | (0.6) | 0.8 | (0.5) | (0.9) | ||||||||||||||||||||||||
| Life/Health | 9.7 | 0.2 | 1.8 | 7.7 | 7.5 | 0.2 | 1.8 | 5.5 | ||||||||||||||||||||||||
| Financial Services | 0.1 | 3.3 | 8.5 | (11.7) | (3.1) | 3.7 | 7.9 | (14.7) | ||||||||||||||||||||||||
| thereof: Asset Management | 1.8 | 4.6 | 9.9 | (12.7) | 1.8 | 4.6 | 9.9 | (12.7) | ||||||||||||||||||||||||
| Allianz Group | 3.0 | 0.6 | 1.0 | 1.4 | 2.9 | 0.6 | 0.9 | 1.4 | ||||||||||||||||||||||||
| 1) | Total revenues comprise Property-Casualty segment’s gross premiums written, Life/Health segment’s statutory premiums and Financial Services segment’s operating revenues. Segment growth rates are presented before the elimination of transactions between Allianz Group companies in different segments. |
38
Table of Contents
Allianz Group Interim Report Second Quarter and First Half of 2009
Condensed Consolidated Interim Financial Statements
| Supplementary Information to the Consolidated Income Statements | ||||
78 | 22 | Premiums earned (net) | ||
80 | 23 | Interest and similar income | ||
80 | 24 | Income from financial assets and liabilities carried at fair value through income (net) | ||
81 | 25 | Realized gains/losses (net) | ||
82 | 26 | Fee and commission income | ||
84 | 27 | Other income | ||
84 | 28 | Income and expenses from fully consolidated private equity investments | ||
85 | 29 | Claims and insurance benefits incurred (net) | ||
86 | 30 | Change in reserves for insurance and investment contracts (net) | ||
87 | 31 | Interest expenses | ||
88 | 32 | Loan loss provisions | ||
88 | 33 | Impairments of investments (net) | ||
88 | 34 | Investment expenses | ||
89 | 35 | Acquisition and administrative expenses (net) | ||
91 | 36 | Fee and commission expenses | ||
92 | 37 | Income taxes | ||
93 | 38 | Earnings per share | ||
| Other Information | ||||
94 | 39 | Supplemental information on the condensed consolidated statements of cash flows | ||
95 | 40 | Other information | ||
95 | 41 | Subsequent events | ||
96 | Responsibility statement | |||
97 | Review report | |||
39
Table of Contents
Condensed Consolidated Interim Financial Statements Allianz Group Interim Report Second Quarter and First Half of 2009
Consolidated Balance Sheets
As of June 30, 2009 and as of December 31, 2008
| Note | As of June 30, 2009 € mn | As of € mn | ||||||||||
| ASSETS | ||||||||||||
| Cash and cash equivalents | 6,594 | 8,958 | ||||||||||
| Financial assets carried at fair value through income | 6 | 13,974 | 14,240 | |||||||||
| Investments | 7 | 269,852 | 260,147 | |||||||||
| Loans and advances to banks and customers | 8 | 127,114 | 115,655 | |||||||||
| Financial assets for unit-linked contracts | 51,869 | 50,450 | ||||||||||
| Reinsurance assets | 9 | 14,269 | 14,599 | |||||||||
| Deferred acquisition costs | 10 | 21,920 | 22,563 | |||||||||
| Deferred tax assets | 3,347 | 3,996 | ||||||||||
| Other assets | 11 | 33,155 | 34,004 | |||||||||
| Non-current assets and assets of disposal groups classified as held for sale | 3,12 | — | 419,513 | |||||||||
| Intangible assets | 13 | 13,605 | 11,451 | |||||||||
| Total assets | 555,699 | 955,576 | ||||||||||
| Note | As of June 30, 2009 € mn | As of December 31, € mn | ||||||||||
| LIABILITIES AND EQUITY | ||||||||||||
| Financial liabilities carried at fair value through income | 14 | 5,488 | 6,244 | |||||||||
| Liabilities to banks and customers | 15 | 21,289 | 18,451 | |||||||||
| Unearned premiums | 18,235 | 15,233 | ||||||||||
| Reserves for loss and loss adjustment expenses | 16 | 64,051 | 63,924 | |||||||||
| Reserves for insurance and investment contracts | 17 | 306,235 | 296,557 | |||||||||
| Financial liabilities for unit-linked contracts | 51,869 | 50,450 | ||||||||||
| Deferred tax liabilities | 3,698 | 3,833 | ||||||||||
| Other liabilities | 18 | 32,032 | 32,930 | |||||||||
| Liabilities of disposal groups classified as held for sale | 3,12 | — | 411,816 | |||||||||
| Certificated liabilities | 19 | 6,803 | 9,544 | |||||||||
| Participation certificates and subordinated liabilities | 20 | 9,388 | 9,346 | |||||||||
| Total liabilities | 519,088 | 918,328 | ||||||||||
| Shareholders’ equity | 34,530 | 33,684 | ||||||||||
| Minority interests | 2,081 | 3,564 | ||||||||||
| Total equity | 21 | 36,611 | 37,248 | |||||||||
| Total liabilities and equity | 555,699 | 955,576 | ||||||||||
40
Table of Contents
Allianz Group Interim Report Second Quarter and First Half of 2009 Condensed Consolidated Interim Financial Statements
Consolidated Income Statements
For the three months and six months ended June 30, 2009 and 2008
| Three months ended June 30, | Six months ended June 30, | |||||||||||||||||||
| Note | 2009 € mn | 2008 € mn | 2009 € mn | 2008 € mn | ||||||||||||||||
| Premiums written | 14,770 | 15,092 | 34,160 | 34,560 | ||||||||||||||||
| Ceded premiums written | (1,098) | (1,225) | (2,594) | (2,641) | ||||||||||||||||
| Change in unearned premiums | 805 | 692 | (2,409) | (2,598) | ||||||||||||||||
| Premiums earned (net) | 22 | 14,477 | 14,559 | 29,157 | 29,321 | |||||||||||||||
| Interest and similar income | 23 | 4,800 | 5,427 | 9,214 | 9,883 | |||||||||||||||
| Income from financial assets and liabilities carried at fair value through income (net) | 24 | 887 | (493) | 557 | (70) | |||||||||||||||
| Realized gains/losses (net) | 25 | 1,618 | 1,402 | 2,037 | 2,461 | |||||||||||||||
| Fee and commission income | 26 | 1,426 | 1,555 | 2,762 | 3,060 | |||||||||||||||
| Other income | 27 | 15 | 15 | 19 | 366 | |||||||||||||||
| Income from fully consolidated private equity investments | 28 | 489 | 627 | 958 | 1,206 | |||||||||||||||
| Total income | 23,712 | 23,092 | 44,704 | 46,227 | ||||||||||||||||
| Claims and insurance benefits incurred (gross) | (11,480) | (11,313) | (23,871) | (23,299) | ||||||||||||||||
| Claims and insurance benefits incurred (ceded) | 375 | 526 | 987 | 1,198 | ||||||||||||||||
| Claims and insurance benefits incurred (net) | 29 | (11,105) | (10,787) | (22,884) | (22,101) | |||||||||||||||
| Change in reserves for insurance and investment contracts (net) | 30 | (2,684) | (1,466) | (3,305) | (3,311) | |||||||||||||||
| Interest expenses | 31 | (345) | (466) | (755) | (959) | |||||||||||||||
| Loan loss provisions | 32 | (24) | (1) | (39) | (6) | |||||||||||||||
| Impairments of investments (net) | 33 | (415) | (1,493) | (2,305) | (2,963) | |||||||||||||||
| Investment expenses | 34 | (429) | (159) | (367) | (595) | |||||||||||||||
| Acquisition and administrative expenses (net) | 35 | (5,212) | (4,704) | (10,021) | (9,150) | |||||||||||||||
| Fee and commission expenses | 36 | (552) | (592) | (1,043) | (1,143) | |||||||||||||||
| Amortization of intangible assets | (11) | (3) | (15) | (8) | ||||||||||||||||
| Restructuring charges | (10) | (8) | (74) | (3) | ||||||||||||||||
| Other expenses | (1) | — | (2) | (1) | ||||||||||||||||
| Expenses from fully consolidated private equity investments | 28 | (590) | (598) | (1,115) | (1,154) | |||||||||||||||
| Total expenses | (21,378) | (20,277) | (41,925) | (41,394) | ||||||||||||||||
| Income from continuing operations before income taxes and minority interests in earnings | 2,334 | 2,815 | 2,779 | 4,833 | ||||||||||||||||
| Income taxes | 37 | (447) | (509) | (468) | (1,081) | |||||||||||||||
| Minority interests in earnings | (18) | (81) | (18) | (147) | ||||||||||||||||
| Net income from continuing operations | 1,869 | 2,225 | 2,293 | 3,605 | ||||||||||||||||
| Net income (loss) from discontinued operations, net of income taxes and minority interests in earnings | — | (683) | (395) | (915) | ||||||||||||||||
| Net income | 1,869 | 1,542 | 1,898 | 2,690 | ||||||||||||||||
| Three months ended June 30, | Six months ended June 30, | |||||||||||||||||||
| Note | 2009 € | 2008 € | 2009 € | 2008 € | ||||||||||||||||
| Basic earnings per share | 38 | 4.14 | 3.44 | 4.21 | 5.98 | |||||||||||||||
from continuing operations | 4.14 | 4.96 | 5.08 | 8.01 | ||||||||||||||||
from discontinued operations | — | (1.52) | (0.87) | (2.03) | ||||||||||||||||
| Diluted earnings per share | 38 | 4.13 | 3.39 | 4.17 | 5.85 | |||||||||||||||
from continuing operations | 4.13 | 4.90 | 5.04 | 7.86 | ||||||||||||||||
from discontinued operations | — | (1.51) | (0.87) | (2.01) | ||||||||||||||||
41
Table of Contents
Condensed Consolidated Interim Financial Statements Allianz Group Interim Report Second Quarter and First Half of 2009
Consolidated Statements of Comprehensive Income
For the three months and six months ended June 30, 2009 and 2008
Three months ended June 30, | Six months ended June 30, | |||||||||||||||
2009 € mn | 2008 € mn | 2009 € mn | 2008 € mn | |||||||||||||
| Net income (after taxes before minority interests in earnings) | 1,887 | 1,634 | 1,916 | 2,862 | ||||||||||||
| Other comprehensive income | ||||||||||||||||
Foreign currency translation adjustments | ||||||||||||||||
Reclassifications to net income | (26) | 1 | 522 | 1 | ||||||||||||
Changes arising during the period | (220) | 141 | (69) | (816) | ||||||||||||
Subtotal | (246) | 142 | 453 | (815) | ||||||||||||
Available-for-sale investments | ||||||||||||||||
Reclassifications to net income | (742) | (553) | (391) | (691) | ||||||||||||
Changes arising during the period | 2,340 | (3,106) | 685 | (5,932) | ||||||||||||
Subtotal | 1,598 | (3,659) | 294 | (6,623) | ||||||||||||
Cash flow hedges | ||||||||||||||||
Reclassifications to net income | (5) | 1 | (4) | 1 | ||||||||||||
Changes arising during the period | 9 | (26) | (25) | 14 | ||||||||||||
Subtotal | 4 | (25) | (29) | 15 | ||||||||||||
Share of other comprehensive income of associates | ||||||||||||||||
Reclassifications to net income | 5 | — | 5 | — | ||||||||||||
Changes arising during the period | 22 | (41) | 31 | (83) | ||||||||||||
Subtotal | 27 | (41) | 36 | (83) | ||||||||||||
Miscellaneous | ||||||||||||||||
Reclassifications to net income | — | — | — | — | ||||||||||||
Changes arising during the period | 9 | (232) | (63) | (269) | ||||||||||||
Subtotal | 9 | (232) | (63) | (269) | ||||||||||||
Total other comprehensive income | 1,392 | (3,815) | 691 | (7,775) | ||||||||||||
| Total comprehensive income | 3,279 | (2,181) | 2,607 | (4,913) | ||||||||||||
| Minority interests | (38) | (100) | (36) | (18) | ||||||||||||
| Total comprehensive income (shareholders’ interest) | 3,241 | (2,281) | 2,571 | (4,931) | ||||||||||||
For further details concerning income taxes relating to components of the other comprehensive income please see Note 37.
42
Table of Contents
Allianz Group Interim Report Second Quarter and First Half of 2009 Condensed Consolidated Interim Financial Statements
Consolidated Statements of Changes in Equity
For the six months ended June 30, 2009 and 2008
Paid-in capital
| Revenue
| Foreign currency translation adjustments | Unrealized gains and losses (net) | Shareholders’
| Minority
| Total equity
| ||||||||||||||||||||||||||
| € mn | € mn | € mn | € mn | € mn | € mn | € mn | ||||||||||||||||||||||||||
| Balance as of December 31, 2007 | 28,321 | 12,618 | (3,656) | 10,470 | 47,753 | 3,628 | 51,381 | |||||||||||||||||||||||||
| Total comprehensive income | — | 2,333 | (729) | (6,535) | (4,931) | 18 | (4,913) | |||||||||||||||||||||||||
| Paid-in capital | 203 | — | — | — | 203 | — | 203 | |||||||||||||||||||||||||
| Treasury shares | — | 39 | — | — | 39 | — | 39 | |||||||||||||||||||||||||
| Transactions between equity holders | — | (136) | — | 1 | (135) | (11) | (146) | |||||||||||||||||||||||||
| Dividends paid | — | (2,472) | — | — | (2,472) | (237) | (2,709) | |||||||||||||||||||||||||
| Balance as of June 30, 2008 | 28,524 | 12,382 | (4,385) | 3,936 | 40,457 | 3,398 | 43,855 | |||||||||||||||||||||||||
| Balance as of December 31, 2008 | 28,569 | 7,110 | (4,006) | 2,011 | 33,684 | 3,564 | 37,248 | |||||||||||||||||||||||||
| Total comprehensive income | — | 1,865 | 450 | 256 | 2,571 | 36 | 2,607 | |||||||||||||||||||||||||
| Paid-in capital | — | — | — | — | — | — | — | |||||||||||||||||||||||||
| Treasury shares | — | (137) | — | — | (137) | — | (137) | |||||||||||||||||||||||||
| Transactions between equity holders 1) | — | (8) | — | — | (8) | (1,431) | (1,439) | |||||||||||||||||||||||||
| Dividends paid | — | (1,580) | — | — | (1,580) | (88) | (1,668) | |||||||||||||||||||||||||
| Balance as of June 30, 2009 | 28,569 | 7,250 | (3,556) | 2,267 | 34,530 | 2,081 | 36,611 |
| 1) | Includes€ (1,738) mn minority interest changes from the derecognition of Dresdner Bank and€ 307 mn related to capital movements of subsidiaries owned less than 100 % as of June 30, 2009. |
43
Table of Contents
Condensed Consolidated Interim Financial Statements Allianz Group Interim Report Second Quarter and First Half of 2009
Condensed Consolidated Statements of Cash Flows
For the six months ended June 30, 2009 and 2008
| Six months ended June 30, | 2009 € mn | 2008 € mn | ||||||
| Summary | ||||||||
| Net cash flow provided by operating activities | 5,744 | 27,506 | ||||||
| Net cash flow used in investing activities | (37,630) | (4,559) | ||||||
| Net cash flow used in financing activities | (727) | (18,699) | ||||||
| Effect of exchange rate changes on cash and cash equivalents | 11 | (30) | ||||||
| Change in cash and cash equivalents | (32,602) | 4,218 | ||||||
| Cash and cash equivalents at beginning of period of continuing operations | 8,958 | 31,337 | ||||||
| Cash and cash equivalents at beginning of period reclassified to assets of disposal groups held for sale | 30,238 | — | ||||||
| Cash and cash equivalents at end of period | 6,594 | 35,555 | ||||||
| Cash flow from operating activities | ||||||||
| Net income | 1,898 | 2,690 | ||||||
| Adjustments to reconcile net income to net cash flow provided by operating activities | ||||||||
Minority interests in earnings | 18 | 172 | ||||||
Share of earnings from investments in associates and joint ventures | 25 | (68) | ||||||
Realized gains/losses (net) and impairments of investments (net) of | ||||||||
Available-for-sale and held-to-maturity investments, investments in associates and joint ventures, real estate held for investment, loans to banks and customers | 268 | 302 | ||||||
Other investments, mainly financial assets held for trading and designated at fair value through income | (354) | 1,846 | ||||||
Depreciation and amortization | 289 | 298 | ||||||
Loan loss provisions | 39 | 75 | ||||||
Interest credited to policyholder accounts | 1,696 | 1,680 | ||||||
Net change in | ||||||||
Financial assets and liabilities held for trading | (481) | 3,054 | ||||||
Reverse repurchase agreements and collateral paid for securities borrowing transactions | 144 | 36,262 | ||||||
Repurchase agreements and collateral received from securities lending transactions | (540) | (18,150) | ||||||
Reinsurance assets | 419 | 314 | ||||||
Deferred acquisition costs | 126 | (709) | ||||||
Unearned premiums | 2,811 | 3,073 | ||||||
Reserves for loss and loss adjustment expenses | (382) | (87) | ||||||
Reserves for insurance and investment contracts | 1,183 | 876 | ||||||
Deferred tax assets/liabilities | (215) | 244 | ||||||
Financial assets designated at fair value through income (only Dresdner Bank) | — | 2,896 | ||||||
Financial liabilities designated at fair value through income (only Dresdner Bank) | — | (4,028) | ||||||
Other (net) | (1,200) | (3,234) | ||||||
Subtotal | 3,846 | 24,816 | ||||||
| Net cash flow provided by operating activities | 5,744 | 27,506 | ||||||
| Cash flow from investing activities | ||||||||
| Proceeds from the sale, maturity or repayment of | ||||||||
Financial assets designated at fair value through income | 1,919 | 1,904 | ||||||
Available-for-sale investments | 53,481 | 59,802 | ||||||
Held-to-maturity investments | 214 | 163 | ||||||
Investments in associates and joint ventures | 1,636 | 585 | ||||||
Non-current assets and assets of disposal groups classified as held for sale | — | 2,147 | ||||||
Real estate held for investment | 64 | 299 | ||||||
Loans and advances to banks and customers (purchased loans) | 5,257 | 3,779 | ||||||
Property and equipment | 103 | 290 | ||||||
Subtotal | 62,674 | 68,969 |
44
Table of Contents
Allianz Group Interim Report Second Quarter and First Half of 2009 Condensed Consolidated Interim Financial Statements
| Six months ended June 30, | 2009 € mn | 2008 € mn | ||||||
| Payments for the purchase or origination of | ||||||||
Financial assets designated at fair value through income | (745) | (2,473) | ||||||
Available-for-sale investments | (60,384) | (62,297) | ||||||
Held-to-maturity investments | (143) | (450) | ||||||
Investments in associates and joint ventures | (757) | (351) | ||||||
Non-current assets and assets of disposal groups classified as held for sale | (36) | (37) | ||||||
Real estate held for investment | (84) | (118) | ||||||
Loans and advances to banks and customers (purchased loans) | (14,006) | (5,641) | ||||||
Property and equipment | (329) | (434) | ||||||
Subtotal | (76,484) | (71,801) | ||||||
| Business combinations (for further details see Note 39) | ||||||||
Proceeds from sale, net of cash disposed | (26,975) | — | ||||||
Acquisitions of subsidiaries, net of cash acquired | 77 | — | ||||||
| Change in other loans and advances to banks and customers (originated loans) | 2,659 | (1,875) | ||||||
| Other (net) | 419 | 148 | ||||||
| Net cash flow used in investing activities | (37,630) | (4,559) | ||||||
| Cash flow from financing activities | ||||||||
| Policyholders’ account deposits | 10,525 | 6,704 | ||||||
| Policyholders’ account withdrawals | (6,298) | (5,134) | ||||||
| Net change in liabilities to banks and customers | (499) | (11,728) | ||||||
| Proceeds from the issuance of certificated liabilities, participation certificates and subordinated liabilities | 7,624 | 97,930 | ||||||
| Repayments of certificated liabilities, participation certificates and subordinated liabilities | (10,375) | (103,304) | ||||||
| Cash inflow from capital increases | — | 203 | ||||||
| Transactions between equity holders | 258 | (146) | ||||||
| Dividends paid to shareholders | (1,668) | (2,709) | ||||||
| Net cash from sale or purchase of treasury shares | (213) | (23) | ||||||
| Other (net) | (81) | (492) | ||||||
| Net cash flow used in financing activities | (727) | (18,699) | ||||||
The following table shows the net cash flows provided by (used in) discontinued operations for the six months ended June 30, 2009 and 2008 that are included in the condensed consolidated statements of cash flows above.
| ||||||||
| Six months ended June 30, | 2009 € mn | 2008 € mn | ||||||
| Net cash flow provided by operating activities from discontinued operations | — | 21,798 | ||||||
| Net cash flow provided by (used in) investing activities from discontinued operations | — | (345) | ||||||
| Net cash flow provided by (used in) financing activities from discontinued operations | — | (16,462) | ||||||
| Net cash flow provided by discontinued operations | — | 4,991 | ||||||
See note 39 for supplemental information on the condensed consolidated statements of cash flow.
45
Table of Contents
Notes to the Condensed Consolidated Interim Financial Statements Allianz Group Interim Report Second Quarter and First Half of 2009
Notes to the Condensed Consolidated
Interim Financial Statements
The condensed consolidated interim financial statements of the Allianz Group – comprising the consolidated balance sheets, consolidated income statements, consolidated statements of comprehensive income, consolidated statements of changes in equity, condensed consolidated statements of cash flows and selected explanatory notes – are presented in accordance with the requirements of IAS 34, Interim Financial Reporting, and have been prepared in accordance with International Financial Reporting Standards (“IFRS”), as adopted under European Union (“EU”) regulations in accordance with section 315a of the German Commercial Code (“HGB”). The condensed consolidated interim financial statements of the Allianz Group have also been prepared in accordance with IFRS as issued by the International Accounting Standard Board (“IASB”). The Allianz Group’s application of IFRS results in no differences between IFRS as adopted by the EU and IFRS as issued by the IASB.
The condensed consolidated interim financial statements comply with all new or amended IFRS, where application is compulsory or early adopted for the first time for periods beginning on January 1, 2009. See Note 2 for further details.
For existing and unchanged IFRS the accounting policies for recognition, measurement, consolidation and presentation applied in the preparation of the condensed consolidated interim financial statements are consistent with the accounting policies that have been applied in the preparation of the consolidated financial statements for the year ended December 31, 2008. These condensed consolidated interim financial statements should be read in conjunction with the audited consolidated financial statements included in the Allianz Group Annual Report 2008.
IFRS do not provide specific guidance concerning all aspects of the recognition and measurement of insurance and reinsurance contracts. Therefore, as envisioned in IAS 8, Accounting Policies, Changes in Accounting Estimates and Errors, the provisions embodied under accounting principles generally accepted in the United States of America (“U.S. GAAP���) have been applied to those aspects where specific guidance is not provided by IFRS 4, Insurance Contracts.
The condensed consolidated interim financial statements are presented in millions of Euro (€ mn).
These condensed consolidated interim financial statements of the Allianz Group were authorized for issue by the Board of Management on August 6, 2009.
2 Recently adopted accounting pronouncements, changes in accounting policies and changes in the presentation of the condensed consolidated interim financial statements
Recently adopted accounting pronouncements (effective January 1, 2009 and early adoption)
IFRS 8, Operating Segments
In November 2006, the IASB issued IFRS 8, Operating Segments. Effectively replacing IAS 14, IFRS 8 requires that an entity selects operating segments that are consistent with internal reports regularly reviewed by the entity’s chief operating decision maker in order to allocate resources to the segment and assess its performance (i. e., the “management approach”). The standard also requires explanations of how segment information is prepared as well as reconciliations of total reportable segment revenues, total profits or losses, total assets and other material amounts disclosed for reportable segments to corresponding amounts recognized in the entity’s financial statements. The Allianz Group adopted IFRS 8 and early adopted the amendment to IFRS 8 as of January 1, 2009. IFRS 8 does not have any material impact on the Allianz Group’s financial results or financial position.
Previously, under IAS 14, the Allianz Group reported “Property-Casualty”, “Life/Health”, “Banking”, “Asset Management” and “Corporate” as primary segments that, where appropriate, were subsequently organized by geographical areas. The implementation of IFRS 8 led to a change in the segment report (Note 5) from prior periods. In adopting the management approach to segment reporting as mandated by IFRS 8, the Allianz Group has identified its reportable segments on the basis of both products and services and geographic regions. Furthermore, after the sale of Dresdner Bank, the Allianz Group’s main product and service offerings consist of property-casualty insurance, life/health insurance, financial services and corporate activities. Financial services refer to the Allianz Group’s asset management business, continuing banking operations and its alternative investment management operations. Based on information reported to the Allianz Group’s chief operating decision maker for the purposes of allocating resources and measuring performance, the following reportable segments have been identified:
46
Table of Contents
Allianz Group Interim Report Second Quarter and First Half of 2009 Notes to the Condensed Consolidated Interim Financial Statements
Property-Casualty
– German Speaking Countries
– Europe I incl. South America
– Europe II incl. Africa
– Anglo Broker Markets/Global Lines
– Growth Markets
Life/Health
– German Speaking Countries
– Europe I incl. South America
– Europe II incl. Africa
– Anglo Broker Markets/Global Lines
– Growth Markets
Financial Services
– Asset Management
– Banking
– Alternative Investment Management
Corporate
Since the Allianz Group uses operating profit as its internal profit or loss measure, operating profit is included in the segment report. For further details on segment reporting, please refer to Note 5.
In April 2009, the IASB issued an amendment to IFRS 8, Operating Segments as part of the Improvements to IFRSs.The amendment to IFRS 8 requires an entity to report total assets for reportable segments only if that information is regularly provided to the chief operating decision maker. Prior to the amendment, IFRS 8 required entities to report total assets for reportable segments regardless of whether the information was regularly provided to the chief operating decision maker or not.
The amendment is effective for annual periods beginning on or after January 1, 2010 and early application is permitted.
The Allianz Group adopted the amendment in the first quarter 2009. The amendment has not yet been endorsed by the EU, but does not have a material impact on the Allianz Group’s condensed consolidated interim financial statements.
IAS 1, Presentation of Financial Statements – revised
In September 2007, the IASB issued the revised IAS 1, Presentation of Financial Statements. The revised standard requires information in financial statements to be aggregated on the basis of shared characteristics and introduces a statement of comprehensive income. The revised standard gives preparers of financial statements the option of presenting
items of income and expense and components of other comprehensive income either in a single statement of comprehensive income with subtotals, or in two separate statements. The revisions also include changes in the titles of some of the financial statements to reflect their function more clearly. The new titles are not mandatory for use in financial statements. Allianz Group has decided not to change the titles of the statements. The Allianz Group adopted revised IAS 1 as of January 1, 2009.
Allianz Group decided to apply the two statement approach, i.e., in addition to the income statement, a statement of comprehensive income is presented including net income and other comprehensive income (“OCI”). For each component of OCI related tax effects are disclosed in the notes. Furthermore, reclassifications of components of OCI to realized gains or losses are separately presented for each component of OCI. The changes in presentation have also been included for prior periods. As a consequence, the statement of changes in equity includes transactions with owners in their capacity as owners, the total comprehensive income and, when applicable, the effects of retrospective applications or restatements. The Allianz Group’s condensed consolidated interim financial statements have been pre-sented with the effect of these changes.
Further amendments and interpretations
In addition to the above mentioned recently adopted accounting pronouncements, the following amendments to standards and interpretations have been adopted as of January 1, 2009:
– IAS 23, Borrowing Costs – amended
– IFRS 2, Share-based Payment – amended
– IAS 32, Financial Instruments: Presentation, and IAS 1,
Presentation of Financial Statements – amended
– Improvements to IFRS, if applicable
– Amendments to IFRIC 9 and IAS 39
– IFRIC 13, Customer Loyalty Programmes
– IFRIC 15, Agreements for the Construction of Real Estate
– IFRIC 16, Hedges of a Net Investment in a Foreign Operation
The Allianz Group adopted the amendments and interpretations as of January 1, 2009 with no material effect on its financial result or financial position.
47
Table of Contents
Notes to the Condensed Consolidated Interim Financial Statements Allianz Group Interim Report Second Quarter and First Half of 2009
Changes in accounting policies
IFRS 2, Share-based payment
As described in Note 2 and Note 48 of the Allianz Group’s Annual Report 2008, the Allianz Group accrues the fair value of the awards relating to Group Equity Incentive (“GEI”) plans as compensation expense over the vesting period. The fair value of the recorded liability is driven by two separate effects being (1) the accrual of the plan benefits over the vesting period and (2) changes in the share price of Allianz SE. In prior years, both effects were included in administrative expenses. The second effect is hedged with derivatives with changes in the fair value of the derivatives recognized in the line item “Income from financial assets and liabilities carried at fair value through income (net)”.
Effective June 30, 2009, Allianz Group voluntarily changed its accounting policy with regard to the presentation of expenses relating to the second effect. The accrual of plan benefits over the vesting period continues to be shown in administrative expenses. Expenses relating to changes in the share price of the Allianz SE are now presented within the line item “Income from financial assets and liabilities carried at fair value through income (net)”. The Allianz Group believes that this presentation is more relevant and gives a clearer picture of expenses relating to the GEIs at grant date. Subsequent fluctuations in the share price are offset due to the hedging of the share price fluctuations. Therefore, the recognition of expenses relating to share price fluctuations within the line item “Income from financial assets and liabilities carried at fair value through income (net)” better reflects the position of Allianz Group and reduces volatility in administrative expenses.
The change in accounting policy is applied retrospectively and results in changes in the presentation as described in the table below. There is no impact on recognition, initial or subsequent measurement of GEI plans.
Changes in the presentation of the condensed consolidated interim financial statements
Reclassification of Dresdner Bank as disposal group held for sale and discontinued operations
On August 31, 2008, Allianz SE (“Allianz”) and Commerzbank AG (“Commerzbank”) agreed on the sale of Dresdner Bank AG (“Dresdner Bank”) to Commerzbank. Following the announcement of the sale, Dresdner Bank qualified as disposal group held for sale and discontinued operations according to the requirements of IFRS 5, Non-current Assets Held for Sale and Discontinued Operations. The sale was completed on January 12, 2009.
Assets and liabilities of Dresdner Bank have been reclassified and presented as separate line items “Non-current assets and assets of disposal groups classified as held for sale” and “Liabilities of disposal groups classified as held for sale”, respectively, on the face of the consolidated balance sheet as of December 31, 2008 and have been deconsolidated on January 12, 2009.
Income and expenses relating to the discontinued operations of Dresdner Bank have been reclassified and presented in a separate line item “Net income (loss) from discontinued operations, net of income taxes and minority interests in earnings” in the consolidated income statements for all years presented in accordance with IFRS 5. Please see the table below for the impact on consolidated income statement resulting from the classification of Dresdner Bank as discontinued operations for the three and six months ended June 30, 2008.
For further details see Note 3.
Reclassification within Alternative Investment Management
After the sale of Dresdner Bank on January 12, 2009 and with the adoption of IFRS 8, Operating Segments, the Allianz Group has modified its segment structure and introduced a new Financial Services segment starting with the first quarter 2009. The activities of the asset managers of Alternative Investments, previously reported within the Corporate segment, are now assigned to this new segment. Following the new reporting structure of the Financial Services segment, prior years’ expenses of Alternative Investment Management were reclassified from “Fee and commission expenses” to “Acquisition and administrative expenses” to conform to the segment presentation introduced with the adoption of IFRS 8, Operating Segments.
Please see the table below for the impact on consolidated income statement resulting from the reclassification of expenses at Alternative Investment Management for the three and six months ended June 30, 2008.
48
Table of Contents
Allianz Group Interim Report Second Quarter and First Half of 2009 Notes to the Condensed Consolidated Interim Financial Statements
Impact of the changes in accounting policies and changes in presentation on the Allianz Group’s consolidated income statement
The following table summarizes the impacts on the consolidated income statement for the three months and six months ended June 30, 2008 relating to the change in accounting policy for GEI plans, the classification of Dresdner Bank as discontinued operations and the reclassification within Alternative Investment Management:
| Three months ended June 30, | 2008 | |||||||||||||||||||
| As previously reported | Change of GEI accounting | Income and expenses from discontinued operations | Reclassification within Alternative Investment Management | As reported | ||||||||||||||||
| € mn | € mn | € mn | € mn | € mn | ||||||||||||||||
| Premiums written | 15,092 | — | — | — | 15,092 | |||||||||||||||
| Ceded premiums written | (1,225) | — | — | — | (1,225) | |||||||||||||||
| Change in unearned premiums | 692 | — | — | — | 692 | |||||||||||||||
| Premiums earned (net) | 14,559 | — | — | — | 14,559 | |||||||||||||||
| Interest and similar income | 7,226 | — | (1,799) | — | 5,427 | |||||||||||||||
| Income from financial assets and liabilities carried at fair value through income (net) | (1,121) | 52 | 576 | — | (493) | |||||||||||||||
| Realized gains/losses (net) | 1,394 | — | 8 | — | 1,402 | |||||||||||||||
| Fee and commission income | 2,103 | — | (548) | — | 1,555 | |||||||||||||||
| Other income | 15 | — | — | — | 15 | |||||||||||||||
| Income from fully consolidated private equity investments | 627 | — | — | — | 627 | |||||||||||||||
| Total income | 24,803 | 52 | (1,763) | — | 23,092 | |||||||||||||||
| Claims and insurance benefits incurred (gross) | (11,313) | — | — | — | (11,313) | |||||||||||||||
| Claims and insurance benefits incurred (ceded) | 526 | — | — | — | 526 | |||||||||||||||
| Claims and insurance benefits incurred (net) | (10,787) | — | — | — | (10,787) | |||||||||||||||
| Change in reserves for insurance and investment contracts (net) | (1,466) | — | — | — | (1,466) | |||||||||||||||
| Interest expenses | (1,620) | — | 1,154 | — | (466) | |||||||||||||||
| Loan loss provisions | (65) | — | 64 | — | (1) | |||||||||||||||
| Impairments of investments (net) | (1,526) | — | 33 | — | (1,493) | |||||||||||||||
| Investment expenses | (160) | — | 1 | — | (159) | |||||||||||||||
| Acquisition and administrative expenses (net) | (5,641) | (52) | 1,022 | (33) | (4,704) | |||||||||||||||
| Fee and commission expenses | (712) | — | 87 | 33 | (592) | |||||||||||||||
| Amortization of intangible assets | (3) | — | — | — | (3) | |||||||||||||||
| Restructuring charges | (8) | — | — | — | (8) | |||||||||||||||
| Other expenses | (31) | — | 31 | — | — | |||||||||||||||
| Expenses from fully consolidated private equity investments | (598) | — | — | — | (598) | |||||||||||||||
| Total expenses | (22,617) | (52) | 2,392 | — | (20,277) | |||||||||||||||
| Income from continuing operations before income taxes and minority interests in earnings | 2,186 | — | 629 | — | 2,815 | |||||||||||||||
| Income taxes | (552) | — | 43 | — | (509) | |||||||||||||||
| Minority interests in earnings | (92) | — | 11 | — | (81) | |||||||||||||||
| Net income from continuing operations | 1,542 | — | 683 | — | 2,225 | |||||||||||||||
| Net income (loss) from discontinued operations, net of income taxes and minority interests in earnings | — | — | (683) | — | (683) | |||||||||||||||
| Net income | 1,542 | — | — | — | 1,542 | |||||||||||||||
49
Table of Contents
Notes to the Condensed Consolidated Interim Financial Statements Allianz Group Interim Report Second Quarter and First Half of 2009
| Six months ended June 30, | 2008 | |||||||||||||||||||
| As previously reported | Change of GEI accounting | Income and expenses from discontinued operations | Reclassification within Alternative Investment Management | As reported | ||||||||||||||||
| € mn | € mn | € mn | € mn | € mn | ||||||||||||||||
| Premiums written | 34,560 | — | — | — | 34,560 | |||||||||||||||
| Ceded premiums written | (2,641) | — | — | — | (2,641) | |||||||||||||||
| Change in unearned premiums | (2,598) | — | — | — | (2,598) | |||||||||||||||
| Premiums earned (net) | 29,321 | — | — | — | 29,321 | |||||||||||||||
| Interest and similar income | 13,636 | — | (3,753) | — | 9,883 | |||||||||||||||
| Income from financial assets and liabilities carried at fair value through income (net) | (1,173) | 103 | 1,000 | — | (70) | |||||||||||||||
| Realized gains/losses (net) | 2,721 | — | (260) | — | 2,461 | |||||||||||||||
| Fee and commission income | 4,204 | — | (1,144) | — | 3,060 | |||||||||||||||
| Other income | 366 | — | — | — | 366 | |||||||||||||||
| Income from fully consolidated private equity investments | 1,206 | — | — | — | 1,206 | |||||||||||||||
| Total income | 50,281 | 103 | (4,157) | — | 46,227 | |||||||||||||||
| Claims and insurance benefits incurred (gross) | (23,299) | — | — | — | (23,299) | |||||||||||||||
| Claims and insurance benefits incurred (ceded) | 1,198 | — | — | — | 1,198 | |||||||||||||||
| Claims and insurance benefits incurred (net) | (22,101) | — | — | — | (22,101) | |||||||||||||||
| Change in reserves for insurance and investment contracts (net) | (3,311) | — | — | (3,311) | ||||||||||||||||
| Interest expenses | (3,446) | — | 2,487 | — | (959) | |||||||||||||||
| Loan loss provisions | (75) | — | 69 | — | (6) | |||||||||||||||
| Impairments of investments (net) | (3,023) | — | 60 | — | (2,963) | |||||||||||||||
| Investment expenses | (597) | — | 2 | — | (595) | |||||||||||||||
| Acquisition and administrative expenses (net) | (11,087) | (103) | 2,100 | (60) | (9,150) | |||||||||||||||
| Fee and commission expenses | (1,367) | — | 164 | 60 | (1,143) | |||||||||||||||
| Amortization of intangible assets | (8) | — | — | — | (8) | |||||||||||||||
| Restructuring charges | 13 | — | (16) | — | (3) | |||||||||||||||
| Other expenses | (37) | — | 36 | — | (1) | |||||||||||||||
| Expenses from fully consolidated private equity investments | (1,154) | — | — | — | (1,154) | |||||||||||||||
| Total expenses | (46,193) | (103) | 4,902 | — | (41,394) | |||||||||||||||
| Income from continuing operations before income taxes and minority interests in earnings | 4,088 | — | 745 | — | 4,833 | |||||||||||||||
| Income taxes | (1,226) | — | 145 | — | (1,081) | |||||||||||||||
| Minority interests in earnings | (172) | — | 25 | — | (147) | |||||||||||||||
| Net income from continuing operations | 2,690 | — | 915 | — | 3,605 | |||||||||||||||
| Net income (loss) from discontinued operations, net of income taxes and minority interests in earnings | — | — | (915) | — | (915) | |||||||||||||||
| Net income | 2,690 | — | — | — | 2,690 | |||||||||||||||
Other reclassifications
Certain prior period amounts have been reclassified to conform to the current period presentation.
50
Table of Contents
Allianz Group Interim Report Second Quarter and First Half of 2009 Notes to the Condensed Consolidated Interim Financial Statements
Reclassification of financial assets
In the first quarter 2009 certain CDOs, which were retained from Dresdner Bank, were reclassified subsequent to the derecognition of Dresdner Bank according to IAS 39 from financial assets held for trading to loans and advances to banks and customers. The embedded derivatives included in the CDOs were separated and are shown within financial assets held for trading.
The CDOs were reclassified at their fair value of € 1.1 bn at the reclassification date.
As of January 31, | As of June 30, 2009 | |||||||||
Carrying value/ value at date of reclassifi-cation | Carrying value | Fair Value | ||||||||
| € mn | € mn | € mn | ||||||||
| CDOs reclassified from held for trading to loans to banks and customers (after bifurcation of embedded derivatives) | 1,085 | 920 | 899 | |||||||
The decline in fair value is principally due to principal repayments and foreign currency losses and is partially offset by amortizations.
The effective interest rate of the CDOs at the date of reclassification was approximately 13% with expected recoverable cash flows of € 2.4 bn.
3 Assets and liabilities of disposal groups classified as held for sale and discontinued operations
Impact of the sale of Dresdner Bank AG to Commerzbank AG
As described in the Notes to the Allianz Group’s consolidated financial statements for the year ended December 31, 2008, Allianz and Commerzbank agreed on the sale of Dresdner Bank. The transfer of ownership of Dresdner Bank to Commerzbank was completed on January 12, 2009 as scheduled. Accordingly, assets and liabilities of Dresdner Bank have been deconsolidated in the first quarter 2009.
The loss from derecognition of discontinued operations amounts to € 395 mn and represents mainly the reclassification of components of other comprehensive income to net income. All income and expenses relating to the discontinued operations of Dresdner Bank have been reclassified and presented in a separate line item “Net income (loss) from discontinued operations, net of income taxes and minority interests in earnings” in the consolidated income statements for all periods presented in accordance with IFRS 5.
51
Table of Contents
Notes to the Condensed Consolidated Interim Financial Statements Allianz Group Interim Report Second Quarter and First Half of 2009
Net income (loss) from discontinued operations for the three and six months ended June 30, 2009 and 2008, respectively is comprised of:
| Three months ended June 30, | Six months ended June 30, | |||||||||||||||
2009 € mn | 2008 € mn | 2009 € mn | 2008 € mn | |||||||||||||
| Interest and similar income | — | 1,799 | — | 3,753 | ||||||||||||
| Income from financial assets and liabilities carried at fair value through income (net) | — | (576) | — | (1,000) | ||||||||||||
| Realized gains/losses (net) | — | (8) | — | 260 | ||||||||||||
| Fee and commission income | — | 548 | — | 1,144 | ||||||||||||
| Total income from discontinued operations | — | 1,763 | — | 4,157 | ||||||||||||
| Interest expenses | — | (1,154) | — | (2,487) | ||||||||||||
| Loan loss provisions | — | (64) | — | (69) | ||||||||||||
| Impairments of investments (net) | — | (33) | — | (60) | ||||||||||||
| Investment expenses | — | (1) | — | (2) | ||||||||||||
| Acquisition and administrative expenses (net) | — | (1,022) | — | (2,100) | ||||||||||||
| Fee and commission expenses | — | (87) | — | (164) | ||||||||||||
| Restructuring charges | — | — | — | 16 | ||||||||||||
| Other expenses | — | (31) | — | (36) | ||||||||||||
| Total expenses from discontinued operations | — | (2,392) | — | (4,902) | ||||||||||||
| Result from discontinued operations before income taxes and minority interests in earnings | — | (629) | — | (745) | ||||||||||||
| Income taxes | — | (43) | — | (145) | ||||||||||||
| Minority interests in earnings | — | (11) | — | (25) | ||||||||||||
| Result from operating activities of discontinued operations | — | (683) | — | (915) | ||||||||||||
| Result from derecognition of discontinued operations | — | — | (395) | — | ||||||||||||
| Income taxes related to result from derecognition of discontinued operations | — | — | — | — | ||||||||||||
| After-tax result from derecognition of discontinued operations | — | — | (395) | — | ||||||||||||
| Net income (loss) from discontinued operations | — | (683) | (395) | (915) | ||||||||||||
52
Table of Contents
Allianz Group Interim Report Second Quarter and First Half of 2009 Notes to the Condensed Consolidated Interim Financial Statements
[THIS PAGE INTENTIONALLY LEFT BLANK]
53
Table of Contents
Notes to the Condensed Consolidated Interim Financial Statements Allianz Group Interim Report Second Quarter and First Half of 2009
Significant acquisitions
Ayudhya Allianz C.P. Life Public Company Limited
On June 29, 2009, the Allianz Group obtained control of the Thai life insurance company Ayudhya Allianz C.P. Life Public Company Limited, Bangkok, by appointing the majority of the members of the board of directors.
The cost of the investment in Ayudhya Allianz C.P. Life Public Company Limited amounts to € 71 mn.
Since Allianz Group obtained control of Ayudhya Allianz C.P. Life Public Company Limited at the end of June 2009, the impact of Ayudhya Allianz C.P. Life Public Company Limited on the Allianz Group’s net income for the three and six months ended June 30, 2009, was immaterial.
The amounts recognized for major classes of assets and liabilities are as follows:
Fair value
€ mn | Carrying amount € mn | |||||||
| Cash and cash equivalents | 77 | 77 | ||||||
| Investments | 1,714 | 1,714 | ||||||
| Deferred acquisition costs (PVFP) | 236 | 209 | ||||||
| Other assets | 89 | 40 | ||||||
| Total assets | 2,116 | 2,040 | ||||||
| Unearned premiums | 5 | 5 | ||||||
| Reserves for loss and loss adjustments | 1,973 | 1,853 | ||||||
| Other liabilities | 26 | 11 | ||||||
| Total equity | 112 | 171 | ||||||
| Total liabilities and equity | 2,116 | 2,040 |
The purchase accounting effects may be adjusted up to one year from the acquisition date upon finalization of the valuation process.
The premiums written and premiums earned (net) of the combined entity (Allianz Group including Ayudhya Allianz C.P. Life Public Company Limited) for the six months ended June 30, 2009, would have been € 34,307 mn (thereof Ayudhya: € 147 mn) and € 29,297 mn (thereof Ayudhya: € 140 mn) respectively, if the acquisition date had been on January 1, 2009. The net income of the combined entity for the six months ended June 30, 2009, would have been € 1,913 mn (thereof Ayudhya: € 15 mn) if the acquisition date had been on January 1, 2009.
The Allianz Group has identified 14 reportable segments in accordance with IFRS 8, Operating Segments. Business activities of the Allianz Group are first segregated by product and type of service: insurance activities, financial services activities and corporate activities. Due to differences in the nature of products, risks and capital allocation, insurance activities are further divided between property-casualty and life/health categories.
The following are the five primary regions in which the Allianz Group operates:
– German Speaking Countries
– Europe I incl. South America
– Europe II incl. Africa
– Anglo Broker Markets/Global Lines
– Growth Markets.
The Allianz Group has identified 10 reportable segments for insurance activities, representing Property-Casualty and Life/Health insurance categories organized by the geographical areas or regions listed above. Due to differences in the nature of products, risks and capital allocation, financial services activities are divided into three reportable segments: Asset Management, Banking and Alternative Investment Management. Corporate activities represent a separate reportable segment. The types of products and services from which reportable segments derive revenue are listed below.
Property-Casualty
In the Property-Casualty category, reportable segments offer a wide variety of insurance products to both private and corporate customers, including motor liability and own damage, accident, general liability, fire and property, legal expense, credit and travel insurance.
Life/Health
In the Life/Health category, reportable segments offer a comprehensive range of life and health insurance products on both individual and group basis, including annuity endowment and term insurance, unit-linked and investment-oriented products as well as full private health and supplemental health and care insurance.
54
Table of Contents
Allianz Group Interim Report Second Quarter and First Half of 2009 Notes to the Condensed Consolidated Interim Financial Statements
Financial Services
The reportable segment Asset Management operates as a global provider of institutional and retail asset management products and services to third-party investors and provides investment management services to the Allianz Group’s insurance operations. The products for retail and institutional customers include equity and fixed-income funds as well as alternative products. The United States and Germany as well as France, Italy and the Asia-Pacific region represent the primary asset management markets.
The reportable segment Banking consists of the banking activities in Germany, France, Italy and Central and Eastern Europe. The banks offer a wide range of products for corporate and retail clients with its main focus on the latter.
The reportable segment Alternative Investment Management provides global alternative investment management services in the private equity, real estate, renewable energy and infrastructure sectors on behalf of third-party investors and Allianz Group insurance operations.
Corporate
The reportable segment Corporate includes the management and support of the Allianz Group’s business through its strategy, risk, corporate finance, treasury, financial control, communication, legal, human resources and technology functions. The Corporate reportable segment also includes certain fully consolidated private equity investments.
Measurement
Prices for transactions between reportable segments are set on an arm’s length basis in a manner similar to transactions with third parties. Transactions between reportable segments are eliminated in the consolidation. For the reportable segments comprising the Allianz Group’s financial services activities, interest revenue is reported net of interest expenses.
The Allianz Group uses operating profit to evaluate the performance of its reportable segments. The Allianz Group considers the presentation of operating profit to be useful and meaningful to investors because it enhances the understanding of the Allianz Group’s underlying operating performance and the comparability of its operating performance over time. Operating profit highlights the portion of income before income taxes and minority interests in earnings attributable to
the ongoing core operations of the Allianz Group. To better understand the on-going operations of the business, we exclude the effects of acquisition-related expenses and the amortization of intangible assets, as these relate to business combinations; and we exclude interest expenses from external debt and non-operating income from financial assets and liabilities carried at fair value through income (net) as these relate to our capital structure.
The Allianz Group believes that trends in the underlying profitability of its business can be more clearly identified without the fluctuating effects of the realized capital gains and losses or impairments of investment securities, as these are largely dependent on market cycles or issuer-specific events over which the Allianz Group has little or no control, and can and do vary, sometimes materially, across periods. Further, the timing of sales that would result in such gains or losses is largely at the discretion of the Allianz Group. Similarly, restructuring charges are excluded because the timing of the restructuring charges are largely within the control of the Allianz Group, and accordingly their exclusion provides additional insight into the operating trends of the underlying business. This differentiation is not made if the profit sources are shared with policyholders.
Recent Organizational Changes
In connection with the sale of Dresdner Bank on January 12, 2009, the Allianz Group modified its internal organizational structure as noted above. Business activities of the Allianz Group are segregated by product and type of service, resulting in insurance activities, financial services activities and corporate activities. Financial services activities now include certain alternative investment management operations that were previously part of the Allianz Group’s corporate activities. The corresponding items of previously reported information have been restated to reflect this change in the composition of the Allianz Group’s reportable segments.
55
Table of Contents
Notes to the Condensed Consolidated Interim Financial Statements Allianz Group Interim Report Second Quarter and First Half of 2009
Business Segment Information – Consolidated Balance Sheets
As of June 30, 2009 and as of December 31, 2008
| Property-Casualty | Life/Health | |||||||||||||||
As of June 30, 2009 € mn | As of December 31, € mn | As of June 30, 2009 € mn | As of December 31, € mn | |||||||||||||
| ASSETS | ||||||||||||||||
| Cash and cash equivalents | 2,877 | 2,669 | 2,572 | 4,827 | ||||||||||||
| Financial assets carried at fair value through income | 1,925 | 1,998 | 11,107 | 11,739 | ||||||||||||
| Investments | 77,338 | 75,563 | 192,932 | 186,794 | ||||||||||||
| Loans and advances to banks and customers | 16,504 | 17,648 | 101,571 | 90,619 | ||||||||||||
| Financial assets for unit-linked contracts | — | — | 51,869 | 50,450 | ||||||||||||
| Reinsurance assets | 9,447 | 9,442 | 4,843 | 5,178 | ||||||||||||
| Deferred acquisition costs | 4,024 | 3,723 | 17,752 | 18,693 | ||||||||||||
| Deferred tax assets | 1,490 | 1,579 | 493 | 737 | ||||||||||||
| Other assets | 21,170 | 23,876 | 13,815 | 18,085 | ||||||||||||
| Non-current assets and assets of disposal groups classified as held for sale | — | — | — | — | ||||||||||||
| Intangible assets | 2,363 | 2,384 | 2,311 | 2,300 | ||||||||||||
| Total assets | 137,138 | 138,882 | 399,265 | 389,422 | ||||||||||||
| Property-Casualty | Life/Health | |||||||||||||||
As of June 30, 2009 € mn | As of December 31, € mn | As of June 30, 2009 € mn | As of December 31, € mn | |||||||||||||
| LIABILITIES AND EQUITY | ||||||||||||||||
| Financial liabilities carried at fair value through income | 85 | 103 | 5,285 | 5,833 | ||||||||||||
| Liabilities to banks and customers | 464 | 530 | 1,063 | 1,274 | ||||||||||||
| Unearned premiums | 15,984 | 12,984 | 2,260 | 2,258 | ||||||||||||
| Reserves for loss and loss adjustment expenses | 55,677 | 55,616 | 8,386 | 8,320 | ||||||||||||
| Reserves for insurance and investment contracts | 8,728 | 8,595 | 297,524 | 287,932 | ||||||||||||
| Financial liabilities for unit-linked contracts | — | — | 51,869 | 50,450 | ||||||||||||
| Deferred tax liabilities | 2,414 | 2,580 | 783 | 833 | ||||||||||||
| Other liabilities | 15,024 | 20,523 | 14,097 | 16,625 | ||||||||||||
| Liabilities of disposal groups classified as held for sale | — | — | — | — | ||||||||||||
| Certificated liabilities | 164 | 167 | 2 | 2 | ||||||||||||
| Participation certificates and subordinated liabilities | 846 | 846 | 65 | 65 | ||||||||||||
| Total liabilities | 99,386 | 101,944 | 381,334 | 373,592 | ||||||||||||
56
Table of Contents
Allianz Group Interim Report Second Quarter and First Half of 2009 Notes to the Condensed Consolidated Interim Financial Statements
Financial Services | Corporate | Consolidation | Group | |||||||||||||||||||||||||
As of June 30, 2009 € mn | As of December 31, € mn | As of June 30, 2009 € mn | As of € mn | As of June 30, 2009 € mn | As of December 31, € mn | As of June 30, 2009 € mn | As of December 31, € mn | |||||||||||||||||||||
| 1,359 | 1,590 | 270 | 492 | (484) | (620) | 6,594 | 8,958 | |||||||||||||||||||||
| 762 | 756 | 528 | 631 | (348) | (884) | 13,974 | 14,240 | |||||||||||||||||||||
| 4,765 | 3,493 | 80,209 | 101,461 | (85,392) | (107,164) | 269,852 | 260,147 | |||||||||||||||||||||
| 14,513 | 14,257 | 4,728 | 5,957 | (10,202) | (12,826) | 127,114 | 115,655 | |||||||||||||||||||||
| — | — | — | — | — | — | 51,869 | 50,450 | |||||||||||||||||||||
| — | — | — | — | (21) | (21) | 14,269 | 14,599 | |||||||||||||||||||||
| 144 | 147 | — | — | — | — | 21,920 | 22,563 | |||||||||||||||||||||
| 260 | 270 | 1,152 | 1,455 | (48) | (45) | 3,347 | 3,996 | |||||||||||||||||||||
| 2,172 | 3,528 | 5,317 | 7,681 | (9,319) | (19,166) | 33,155 | 34,004 | |||||||||||||||||||||
| — | 420,658 | — | 1,639 | — | (2,784) | — | 419,513 | |||||||||||||||||||||
| 7,147 | 6,527 | 1,784 | 240 | — | — | 13,605 | 11,451 | |||||||||||||||||||||
| 31,122 | 451,226 | 93,988 | 119,556 | (105,814) | (143,510) | 555,699 | 955,576 | |||||||||||||||||||||
Financial Services | Corporate | Consolidation | Group | |||||||||||||||||||||||||
As of June 30, 2009 € mn | As of December 31, € mn | As of June 30, 2009 € mn | As of December 31, € mn | As of June 30, 2009 € mn | As of December 31, € mn | As of June 30, 2009 € mn | As of € mn | |||||||||||||||||||||
| 39 | 51 | 397 | 877 | (318) | (620) | 5,488 | 6,244 | |||||||||||||||||||||
| 17,052 | 16,943 | 6,288 | 5,970 | (3,578) | (6,266) | 21,289 | 18,451 | |||||||||||||||||||||
| — | — | — | — | (9) | (9) | 18,235 | 15,233 | |||||||||||||||||||||
| — | — | — | — | (12) | (12) | 64,051 | 63,924 | |||||||||||||||||||||
| — | — | 130 | 227 | (147) | (197) | 306,235 | 296,557 | |||||||||||||||||||||
| — | — | — | — | — | — | 51,869 | 50,450 | |||||||||||||||||||||
| 41 | 30 | 507 | 433 | (47) | (43) | 3,698 | 3,833 | |||||||||||||||||||||
| 3,769 | 4,260 | 13,551 | 16,324 | (14,409) | (24,802) | 32,032 | 32,930 | |||||||||||||||||||||
| — | 414,134 | — | 1,347 | — | (3,665) | — | 411,816 | |||||||||||||||||||||
| 1,181 | 1,279 | 12,049 | 13,497 | (6,593) | (5,401) | 6,803 | 9,544 | |||||||||||||||||||||
| 249 | 199 | 8,485 | 8,493 | (257) | (257) | 9,388 | 9,346 | |||||||||||||||||||||
| 22,331 | 436,896 | 41,407 | 47,168 | (25,370) | (41,272) | 519,088 | 918,328 | |||||||||||||||||||||
| Total equity | 36,611 | 37,248 | ||||||||||||||||||||||||||
| Total liabilities and equity | 555,699 | 955,576 | ||||||||||||||||||||||||||
57
Table of Contents
Notes to the Condensed Consolidated Interim Financial Statements Allianz Group Interim Report Second Quarter and First Half of 2009
Business Segment Information – Total revenues and reconciliation of Operating profit (loss) to Net income (loss)
For the three months ended June 30, 2009 and 2008
| Property-Casualty | Life/Health | |||||||||||||||
| Three months ended June 30, | 2009 € mn | 2008 € mn | 2009 € mn | 2008 € mn | ||||||||||||
| Total revenues1) | 9,522 | 9,842 | 11,766 | 10,729 | ||||||||||||
| Premiums earned (net) | 9,365 | 9,448 | 5,112 | 5,111 | ||||||||||||
| Interest and similar income | 932 | 1,331 | 3,638 | 3,814 | ||||||||||||
| Operating income from financial assets and liabilities carried at fair value through income (net) | 52 | (65) | 615 | (352) | ||||||||||||
| Operating realized gains/losses (net) | 20 | 61 | 639 | 273 | ||||||||||||
| Fee and commission income | 270 | 293 | 122 | 168 | ||||||||||||
| Other income | 5 | 7 | 6 | 5 | ||||||||||||
| Claims and insurance benefits incurred (net) | (6,608) | (6,247) | (4,497) | (4,540) | ||||||||||||
| Change in reserves for insurance and investment contracts (net) | (95) | (70) | (2,455) | (1,389) | ||||||||||||
| Interest expenses, excluding interest expenses from external debt | (26) | (91) | (27) | (55) | ||||||||||||
| Loan loss provisions | (2) | (1) | (12) | 4 | ||||||||||||
| Operating impairments of investments (net) | (4) | (72) | (267) | (898) | ||||||||||||
| Investment expenses | (128) | (79) | (205) | (82) | ||||||||||||
| Acquisition and administrative expenses (net), excluding acquisition-related expenses | (2,657) | (2,586) | (1,631) | (1,285) | ||||||||||||
| Fee and commission expenses | (229) | (248) | (52) | (70) | ||||||||||||
| Operating restructuring charges | — | — | 4 | — | ||||||||||||
| Other expenses | — | — | — | (1) | ||||||||||||
| Reclassification of tax benefits | — | — | — | — | ||||||||||||
| Operating profit (loss) | 895 | 1,681 | 990 | 703 | ||||||||||||
| Non-operating income from financial assets and liabilities carried at fair value through income (net) | (35) | 16 | 15 | (3) | ||||||||||||
| Non-operating realized gains/losses (net) | 355 | 961 | 17 | (47) | ||||||||||||
| Income from fully consolidated private equity investments (net) | — | — | 3 | — | ||||||||||||
| Interest expenses from external debt | — | — | — | — | ||||||||||||
| Non-operating impairments of investments (net) | (118) | (341) | (9) | (6) | ||||||||||||
| Acquisition-related expenses | — | — | — | — | ||||||||||||
| Amortization of intangible assets | (4) | (3) | — | — | ||||||||||||
| Non-operating restructuring charges | (2) | (5) | (5) | (2) | ||||||||||||
| Reclassification of tax benefits | — | — | — | — | ||||||||||||
| Non-operating items | 196 | 628 | 21 | (58) | ||||||||||||
| Income (loss) from continuing operations before income taxes and minority interests in earnings | 1,091 | 2,309 | 1,011 | 645 | ||||||||||||
| Income taxes | (333) | (432) | (332) | (200) | ||||||||||||
| Minority interests in earnings | (9) | (55) | (18) | (20) | ||||||||||||
| Net income (loss) from continuing operations | 749 | 1,822 | 661 | 425 | ||||||||||||
| Net income (loss) from discontinued operations, net of income taxes and minority interests in earnings | — | — | — | — | ||||||||||||
| Net income (loss) | 749 | 1,822 | 661 | 425 | ||||||||||||
| 1) | Total revenues comprise Property-Casualty segment’s gross premiums written, Life/Health segment’s statutory premiums (including unit-linked and other investment-oriented products) and Financial Services segment’s operating revenues. |
58
Table of Contents
Allianz Group Interim Report Second Quarter and First Half of 2009 Notes to the Condensed Consolidated Interim Financial Statements
Financial Services | Corporate | Consolidation | Group | |||||||||||||||||||||||||
2009 € mn | 2008 € mn | 2009 € mn | 2008 € mn | 2009 € mn | 2008 € mn | 2009 € mn | 2008 € mn | |||||||||||||||||||||
| 926 | 925 | — | — | (42) | 25 | 22,172 | 21,521 | |||||||||||||||||||||
| — | — | — | — | — | — | 14,477 | 14,559 | |||||||||||||||||||||
| 174 | 283 | 119 | 282 | (63) | (283) | 4,800 | 5,427 | |||||||||||||||||||||
| 28 | 2 | 45 | (2) | 10 | 12 | 750 | (405) | |||||||||||||||||||||
| — | — | — | — | — | 14 | 659 | 348 | |||||||||||||||||||||
| 1,059 | 1,169 | 65 | 21 | (90) | (96) | 1,426 | 1,555 | |||||||||||||||||||||
| 9 | 7 | — | — | (5) | (4) | 15 | 15 | |||||||||||||||||||||
| — | — | — | — | — | — | (11,105) | (10,787) | |||||||||||||||||||||
| — | — | — | — | (134) | (7) | (2,684) | (1,466) | |||||||||||||||||||||
| (99) | (183) | (112) | (133) | 133 | 229 | (131) | (233) | |||||||||||||||||||||
| (10) | (4) | — | — | — | — | (24) | (1) | |||||||||||||||||||||
| — | — | — | — | — | (17) | (271) | (987) | |||||||||||||||||||||
| 2 | 1 | (145) | (49) | 47 | 50 | (429) | (159) | |||||||||||||||||||||
| (771) | (638) | (121) | (133) | 12 | 17 | (5,168) | (4,625) | |||||||||||||||||||||
| (245) | (353) | (63) | (2) | 37 | 81 | (552) | (592) | |||||||||||||||||||||
| — | — | — | — | — | — | 4 | — | |||||||||||||||||||||
| (1) | 1 | — | — | — | — | (1) | — | |||||||||||||||||||||
| — | — | — | — | 20 | 10 | 20 | 10 | |||||||||||||||||||||
| 146 | 285 | (212) | (16) | (33) | 6 | 1,786 | 2,659 | |||||||||||||||||||||
— | — | 205 | (62) | (48) | (39) | 137 | (88) | |||||||||||||||||||||
| 11 | 56 | 424 | 116 | 152 | (32) | 959 | 1,054 | |||||||||||||||||||||
| — | — | (219) | 29 | 115 | — | (101) | 29 | |||||||||||||||||||||
| — | — | (214) | (233) | — | — | (214) | (233) | |||||||||||||||||||||
| (5) | (5) | (12) | (120) | — | (34) | (144) | (506) | |||||||||||||||||||||
| (43) | (87) | (1) | 8 | — | — | (44) | (79) | |||||||||||||||||||||
| — | — | (7) | — | — | — | (11) | (3) | |||||||||||||||||||||
| (7) | (1) | — | — | — | — | (14) | (8) | |||||||||||||||||||||
| — | — | — | — | (20) | (10) | (20) | (10) | |||||||||||||||||||||
| (44) | (37) | 176 | (262) | 199 | (115) | 548 | 156 | |||||||||||||||||||||
102 | 248 | (36) | (278) | 166 | (109) | 2,334 | 2,815 | |||||||||||||||||||||
| (61) | (72) | 260 | 185 | 19 | 10 | (447) | (509) | |||||||||||||||||||||
| (1) | (3) | 18 | (4) | (8) | 1 | (18) | (81) | |||||||||||||||||||||
| 40 | 173 | 242 | (97) | 177 | (98) | 1,869 | 2,225 | |||||||||||||||||||||
— | (613) | — | — | — | (70) | — | (683) | |||||||||||||||||||||
| 40 | (440) | 242 | (97) | 177 | (168) | 1,869 | 1,542 | |||||||||||||||||||||
59
Table of Contents
Notes to the Condensed Consolidated Interim Financial Statements Allianz Group Interim Report Second Quarter and First Half of 2009
Business Segment Information – Total revenues and reconciliation of Operating profit (loss) to Net income (loss)
For the six months ended June 30, 2009 and 2008
| Property-Casualty | Life/Health | |||||||||||||||
| Six months ended June 30, | 2009 € mn | 2008 € mn | 2009 € mn | 2008 € mn | ||||||||||||
| Total revenues1) | 23,408 | 23,552 | 24,779 | 23,056 | ||||||||||||
| Premiums earned (net) | 18,697 | 18,621 | 10,460 | 10,700 | ||||||||||||
| Interest and similar income | 1,865 | 2,382 | 6,943 | 7,014 | ||||||||||||
| Operating income from financial assets and liabilities carried at fair value through income (net) | 38 | 29 | 384 | (113) | ||||||||||||
| Operating realized gains/losses (net) | 16 | 58 | 810 | 922 | ||||||||||||
| Fee and commission income | 542 | 560 | 241 | 339 | ||||||||||||
| Other income | 8 | 257 | 9 | 115 | ||||||||||||
| Claims and insurance benefits incurred (net) | (13,241) | (12,548) | (9,643) | (9,553) | ||||||||||||
| Change in reserves for insurance and investment contracts (net) | (125) | (99) | (3,040) | (3,192) | ||||||||||||
| Interest expenses, excluding interest expenses from external debt | (60) | (179) | (71) | (125) | ||||||||||||
| Loan loss provisions | (8) | (1) | (14) | 6 | ||||||||||||
| Operating impairments of investments (net) | (66) | (165) | (1,343) | (1,878) | ||||||||||||
| Investment expenses | (106) | (202) | (171) | (410) | ||||||||||||
| Acquisition and administrative expenses (net), excluding acquisition-related expenses | (5,232) | (5,040) | (3,060) | (2,401) | ||||||||||||
| Fee and commission expenses | (463) | (496) | (116) | (130) | ||||||||||||
| Operating restructuring charges | — | — | 3 | (1) | ||||||||||||
| Other expenses | (1) | — | — | (1) | ||||||||||||
| Reclassification of tax benefits | — | — | — | — | ||||||||||||
| Operating profit (loss) | 1,864 | 3,177 | 1,392 | 1,292 | ||||||||||||
| Non-operating income from financial assets and liabilities carried at fair value through income (net) | (59) | 62 | 8 | 8 | ||||||||||||
| Non-operating realized gains/losses (net) | 546 | 1,333 | 15 | (35) | ||||||||||||
| Income from fully consolidated private equity investments (net) | 1 | — | 9 | — | ||||||||||||
| Interest expenses from external debt | — | — | — | — | ||||||||||||
| Non-operating impairments of investments (net) | (450) | (683) | (68) | (10) | ||||||||||||
| Acquisition-related expenses | — | — | — | — | ||||||||||||
| Amortization of intangible assets | (7) | (7) | (1) | (1) | ||||||||||||
| Non-operating restructuring charges | (28) | 1 | (9) | (2) | ||||||||||||
| Reclassification of tax benefits | — | — | — | — | ||||||||||||
| Non-operating items | 3 | 706 | (46) | (40) | ||||||||||||
| Income (loss) from continuing operations before income taxes and minority interests in earnings | 1,867 | 3,883 | 1,346 | 1,252 | ||||||||||||
| Income taxes | (666) | (910) | (341) | (336) | ||||||||||||
| Minority interests in earnings | (21) | (94) | (23) | (39) | ||||||||||||
| Net income (loss) from continuing operations | 1,180 | 2,879 | 982 | 877 | ||||||||||||
| Net income (loss) from discontinued operations, net of income taxes and minority interests in earnings | — | — | — | — | ||||||||||||
| Net income (loss) | 1,180 | 2,879 | 982 | 877 | ||||||||||||
| 1) | Total revenues comprise Property-Casualty segment’s gross premiums written, Life/Health segment’s statutory premiums (including unit-linked and other investment-oriented products) and Financial Services segment’s operating revenues. |
60
Table of Contents
Allianz Group Interim Report Second Quarter and First Half of 2009 Notes to the Condensed Consolidated Interim Financial Statements
Financial Services | Corporate | Consolidation | Group | |||||||||||||||||||||||||
2009 € mn | 2008 € mn | 2009 € mn | 2008 € mn | 2009 € mn | 2008 € mn | 2009 € mn | 2008 € mn | |||||||||||||||||||||
| 1,788 | 1,846 | — | — | (76) | 30 | 49,899 | 48,484 | |||||||||||||||||||||
| — | — | — | — | — | — | 29,157 | 29,321 | |||||||||||||||||||||
| 391 | 550 | 234 | 514 | (219) | (577) | 9,214 | 9,883 | |||||||||||||||||||||
20 | (11) | 47 | (2) | 31 | (12) | 520 | (109) | |||||||||||||||||||||
| — | — | — | — | (2) | 17 | 824 | 997 | |||||||||||||||||||||
| 2,054 | 2,313 | 100 | 32 | (175) | (184) | 2,762 | 3,060 | |||||||||||||||||||||
| 12 | 12 | — | 1 | (10) | (19) | 19 | 366 | |||||||||||||||||||||
| — | — | — | — | — | — | (22,884) | (22,101) | |||||||||||||||||||||
| — | — | — | — | (140) | (20) | (3,305) | (3,311) | |||||||||||||||||||||
| (223) | (354) | (237) | (308) | 288 | 492 | (303) | (474) | |||||||||||||||||||||
| (17) | (11) | — | — | — | — | (39) | (6) | |||||||||||||||||||||
| — | — | — | — | — | (17) | (1,409) | (2,060) | |||||||||||||||||||||
| 1 | 3 | (181) | (94) | 90 | 108 | (367) | (595) | |||||||||||||||||||||
| (1,427) | (1,298) | (275) | (260) | 26 | 35 | (9,968) | (8,964) | |||||||||||||||||||||
| (466) | (664) | (71) | (3) | 73 | 150 | (1,043) | (1,143) | |||||||||||||||||||||
| — | — | — | — | — | — | 3 | (1) | |||||||||||||||||||||
| (1) | — | — | — | — | — | (2) | (1) | |||||||||||||||||||||
| — | — | — | — | 26 | 23 | 26 | 23 | |||||||||||||||||||||
| 344 | 540 | (383) | (120) | (12) | (4) | 3,205 | 4,885 | |||||||||||||||||||||
— | — | 123 | 124 | (35) | (155) | 37 | 39 | |||||||||||||||||||||
| 12 | 62 | 488 | 100 | 152 | 4 | 1,213 | 1,464 | |||||||||||||||||||||
| — | — | (282) | 52 | 115 | — | (157) | 52 | |||||||||||||||||||||
| — | — | (452) | (485) | — | — | (452) | (485) | |||||||||||||||||||||
| (14) | (10) | (364) | (166) | — | (34) | (896) | (903) | |||||||||||||||||||||
| (54) | (207) | 1 | 21 | — | — | (53) | (186) | |||||||||||||||||||||
| — | — | (7) | — | — | — | (15) | (8) | |||||||||||||||||||||
| (40) | (1) | — | — | — | — | (77) | (2) | |||||||||||||||||||||
| — | — | — | — | (26) | (23) | (26) | (23) | |||||||||||||||||||||
| (96) | (156) | (493) | (354) | 206 | (208) | (426) | (52) | |||||||||||||||||||||
248 | 384 | (876) | (474) | 194 | (212) | 2,779 | 4,833 | |||||||||||||||||||||
| (132) | (139) | 645 | 277 | 26 | 27 | (468) | (1,081) | |||||||||||||||||||||
| (4) | (6) | 38 | (11) | (8) | 3 | (18) | (147) | |||||||||||||||||||||
| 112 | 239 | (193) | (208) | 212 | (182) | 2,293 | 3,605 | |||||||||||||||||||||
(395) | (1,127) | — | — | — | 212 | (395) | (915) | |||||||||||||||||||||
| (283) | (888) | (193) | (208) | 212 | 30 | 1,898 | 2,690 | |||||||||||||||||||||
61
Table of Contents
Notes to the Condensed Consolidated Interim Financial Statements Allianz Group Interim Report Second Quarter and First Half of 2009
Reportable segments – Property-Casualty business
For the three months ended June 30, 2009 and 2008
| German Speaking Countries | Europe I incl. South America | |||||||||||||||
| Three months ended June 30, | 2009 € mn | 2008 € mn | 2009 € mn | 2008 € mn | ||||||||||||
| Gross premiums written1) | 2,006 | 2,017 | 2,035 | 2,089 | ||||||||||||
| Ceded premiums written | (402) | (406) | (217) | (175) | ||||||||||||
| Change in unearned premiums | 697 | 698 | 22 | (11) | ||||||||||||
| Premiums earned (net) | 2,301 | 2,309 | 1,840 | 1,903 | ||||||||||||
| Interest and similar income | 304 | 469 | 158 | 275 | ||||||||||||
| Operating income from financial assets and liabilities carried at fair value through income (net) | 24 | (95) | 12 | 13 | ||||||||||||
| Operating realized gains/losses (net) | 20 | 61 | — | — | ||||||||||||
| Fee and commission income | 39 | 48 | 10 | 3 | ||||||||||||
| Other income | — | 1 | — | 4 | ||||||||||||
| Operating revenues | 2,688 | 2,793 | 2,020 | 2,198 | ||||||||||||
| Claims and insurance benefits incurred (net) | (1,750) | (1,667) | (1,325) | (1,310) | ||||||||||||
| Changes in reserves for insurance and investment contracts (net) | (98) | (61) | — | (2) | ||||||||||||
| Interest expenses | (21) | (57) | (1) | (1) | ||||||||||||
| Loan loss provisions | (1) | — | — | — | ||||||||||||
| Operating impairments of investments (net) | (4) | (72) | — | — | ||||||||||||
| Investment expenses | (41) | (24) | (12) | (13) | ||||||||||||
| Acquisition and administrative expenses (net) | (628) | (611) | (475) | (463) | ||||||||||||
| Fee and commission expenses | (33) | (29) | (9) | (7) | ||||||||||||
| Other expenses | — | — | — | — | ||||||||||||
| Operating expenses | (2,576) | (2,521) | (1,822) | (1,796) | ||||||||||||
| Operating profit | 112 | 272 | 198 | 402 | ||||||||||||
| Loss ratio2)in % | 76.1 | 72.2 | 72.0 | 68.9 | ||||||||||||
| Expense ratio3)in % | 27.2 | 26.5 | 25.8 | 24.3 | ||||||||||||
| Combined ratio4)in % | 103.3 | 98.7 | 97.8 | 93.2 | ||||||||||||
| 1) | For the Property-Casualty segment, total revenues are measured based upon gross premiums written. |
| 2) | Represents claims and insurance benefits incurred (net) divided by premiums earned (net). |
| 3) | Represents acquisition and administrative expenses (net) divided by premiums earned (net). |
| 4) | Represents the total of acquisition and administrative expenses (net) and claims and insurance benefits incurred (net) divided by premiums earned (net). |
| 5) | Presentation not meaningful. |
62
Table of Contents
Allianz Group Interim Report Second Quarter and First Half of 2009 Notes to the Condensed Consolidated Interim Financial Statements
| Europe II incl. Africa | Anglo Broker Markets/ Global Lines | Growth Markets | Consolidation | Property-Casualty | ||||||||||||||||||||||||||||||||
2009 € mn | 2008 € mn | 2009 € mn | 2008 € mn | 2009 € mn | 2008 € mn | 2009 € mn | 2008 € mn | 2009 € mn | 2008 € mn | |||||||||||||||||||||||||||
| 1,912 | 1,899 | 3,615 | 3,711 | 796 | 903 | (842) | (777) | 9,522 | 9,842 | |||||||||||||||||||||||||||
| (333) | (284) | (687) | (801) | (202) | (244) | 856 | 795 | (985) | (1,115) | |||||||||||||||||||||||||||
| 108 | 114 | 9 | (47) | (8) | (33) | — | — | 828 | 721 | |||||||||||||||||||||||||||
| 1,687 | 1,729 | 2,937 | 2,863 | 586 | 626 | 14 | 18 | 9,365 | 9,448 | |||||||||||||||||||||||||||
| 147 | 252 | 304 | 313 | 42 | 46 | (23) | (24) | 932 | 1,331 | |||||||||||||||||||||||||||
| 20 | (4) | (7) | 14 | 3 | 7 | — | — | 52 | (65) | |||||||||||||||||||||||||||
| — | — | — | — | — | — | — | — | 20 | 61 | |||||||||||||||||||||||||||
| 193 | 201 | 35 | 33 | 13 | 16 | (20) | (8) | 270 | 293 | |||||||||||||||||||||||||||
| 3 | — | — | — | 2 | 2 | — | — | 5 | 7 | |||||||||||||||||||||||||||
| 2,050 | 2,178 | 3,269 | 3,223 | 646 | 697 | (29) | (14) | 10,644 | 11,075 | |||||||||||||||||||||||||||
| (1,254) | (1,099) | (1,926) | (1,767) | (338) | (392) | (15) | (12) | (6,608) | (6,247) | |||||||||||||||||||||||||||
| 2 | 1 | 6 | (9) | (5) | 1 | — | — | (95) | (70) | |||||||||||||||||||||||||||
| (22) | (55) | (5) | (3) | (3) | (3) | 26 | 28 | (26) | (91) | |||||||||||||||||||||||||||
| — | — | — | — | (1) | (1) | — | — | (2) | (1) | |||||||||||||||||||||||||||
| — | — | — | — | — | — | — | — | (4) | (72) | |||||||||||||||||||||||||||
| (42) | (29) | (13) | (1) | (19) | (8) | (1) | (4) | (128) | (79) | |||||||||||||||||||||||||||
| (522) | (509) | (835) | (791) | (196) | (214) | (1) | 2 | (2,657) | (2,586) | |||||||||||||||||||||||||||
| (166) | (180) | (24) | (26) | (17) | (13) | 20 | 7 | (229) | (248) | |||||||||||||||||||||||||||
| — | — | — | — | — | — | — | — | — | — | |||||||||||||||||||||||||||
| (2,004) | (1,871) | (2,797) | (2,597) | (579) | (630) | 29 | 21 | (9,749) | (9,394) | |||||||||||||||||||||||||||
| 46 | 307 | 472 | 626 | 67 | 67 | — | 7 | 895 | 1,681 | |||||||||||||||||||||||||||
| 74.3 | 63.6 | 65.6 | 61.7 | 57.7 | 62.6 | —5) | —5) | 70.6 | 66.1 | |||||||||||||||||||||||||||
| 31.0 | 29.4 | 28.4 | 27.6 | 33.4 | 34.2 | —5) | —5) | 28.3 | 27.4 | |||||||||||||||||||||||||||
| 105.3 | 93.0 | 94.0 | 89.3 | 91.1 | 96.8 | —5) | —5) | 98.9 | 93.5 | |||||||||||||||||||||||||||
63
Table of Contents
Notes to the Condensed Consolidated Interim Financial Statements Allianz Group Interim Report Second Quarter and First Half of 2009
Reportable segments – Property-Casualty business
For the six months ended June 30, 2009 and 2008
| German Speaking Countries | Europe I incl. South America | |||||||||||||||
| Six months ended June 30, | 2009 € mn | 2008 € mn | 2009 € mn | 2008 € mn | ||||||||||||
| Gross premiums written1) | 7,212 | 7,219 | 4,182 | 4,302 | ||||||||||||
| Ceded premiums written | (1,289) | (1,276) | (506) | (416) | ||||||||||||
| Change in unearned premiums | (1,323) | (1,354) | (2) | (110) | ||||||||||||
| Premiums earned (net) | 4,600 | 4,589 | 3,674 | 3,776 | ||||||||||||
| Interest and similar income | 620 | 853 | 297 | 414 | ||||||||||||
| Operating income from financial assets and liabilities carried at fair value through income (net) | 9 | (5) | 34 | 23 | ||||||||||||
| Operating realized gains/losses (net) | 16 | 58 | — | — | ||||||||||||
| Fee and commission income | 74 | 235 | 14 | 6 | ||||||||||||
| Other income | 1 | 240 | — | 11 | ||||||||||||
| Operating revenues | 5,320 | 5,970 | 4,019 | 4,230 | ||||||||||||
| Claims and insurance benefits incurred (net) | (3,312) | (3,322) | (2,673) | (2,601) | ||||||||||||
| Changes in reserves for insurance and investment contracts (net) | (114) | (68) | (1) | (4) | ||||||||||||
| Interest expenses | (44) | (113) | (3) | (2) | ||||||||||||
| Loan loss provisions | (1) | — | — | — | ||||||||||||
| Operating impairments of investments (net) | (66) | (165) | — | — | ||||||||||||
| Investment expenses | (23) | (88) | (8) | (27) | ||||||||||||
| Acquisition and administrative expenses (net) | (1,244) | (1,173) | (905) | (912) | ||||||||||||
| Fee and commission expenses | (62) | (224) | (14) | (10) | ||||||||||||
| Other expenses | — | — | — | — | ||||||||||||
| Operating expenses | (4,866) | (5,153) | (3,604) | (3,556) | ||||||||||||
| Operating profit | 454 | 817 | 415 | 674 | ||||||||||||
| Loss ratio2)in % | 72.0 | 72.4 | 72.8 | 68.9 | ||||||||||||
| Expense ratio3)in % | 27.0 | 25.6 | 24.6 | 24.1 | ||||||||||||
| Combined ratio4)in % | 99.0 | 98.0 | 97.4 | 93.0 | ||||||||||||
| 1) | For the Property-Casualty segment, total revenues are measured based upon gross premiums written. |
| 2) | Represents claims and insurance benefits incurred (net) divided by premiums earned (net). |
| 3) | Represents acquisition and administrative expenses (net) divided by premiums earned (net). |
| 4) | Represents the total of acquisition and administrative expenses (net) and claims and insurance benefits incurred (net) divided by premiums earned (net). |
| 5) | Presentation not meaningful. |
64
Table of Contents
Allianz Group Interim Report Second Quarter and First Half of 2009 Notes to the Condensed Consolidated Interim Financial Statements
| Europe II incl. Africa | Anglo Broker Markets/ Global Lines | Growth Markets | Consolidation | Property-Casualty | ||||||||||||||||||||||||||||||||
2009 € mn | 2008 € mn | 2009 € mn | 2008 € mn | 2009 € mn | 2008 € mn | 2009 € mn | 2008 € mn | 2009 € mn | 2008 € mn | |||||||||||||||||||||||||||
| 4,652 | 4,586 | 8,002 | 7,692 | 1,669 | 1,869 | (2,309) | (2,116) | 23,408 | 23,552 | |||||||||||||||||||||||||||
| (870) | (732) | (1,590) | (1,635) | (429) | (481) | 2,329 | 2,140 | (2,355) | (2,400) | |||||||||||||||||||||||||||
| (419) | (413) | (537) | (510) | (75) | (144) | — | — | (2,356) | (2,531) | |||||||||||||||||||||||||||
| 3,363 | 3,441 | 5,875 | 5,547 | 1,165 | 1,244 | 20 | 24 | 18,697 | 18,621 | |||||||||||||||||||||||||||
| 304 | 456 | 611 | 626 | 82 | 83 | (49) | (50) | 1,865 | 2,382 | |||||||||||||||||||||||||||
| 2 | (17) | (10) | 13 | 3 | (1) | — | 16 | 38 | 29 | |||||||||||||||||||||||||||
| — | — | — | — | — | — | — | — | 16 | 58 | |||||||||||||||||||||||||||
| 386 | 390 | 66 | 73 | 28 | 30 | (26) | (174) | 542 | 560 | |||||||||||||||||||||||||||
| 3 | 3 | — | — | 4 | 3 | — | — | 8 | 257 | |||||||||||||||||||||||||||
| 4,058 | 4,273 | 6,542 | 6,259 | 1,282 | 1,359 | (55) | (184) | 21,166 | 21,907 | |||||||||||||||||||||||||||
| (2,569) | (2,248) | (3,969) | (3,596) | (699) | (764) | (19) | (17) | (13,241) | (12,548) | |||||||||||||||||||||||||||
| (1) | 1 | (3) | (26) | (6) | (2) | — | — | (125) | (99) | |||||||||||||||||||||||||||
| (53) | (108) | (10) | (8) | (4) | (6) | 54 | 58 | (60) | (179) | |||||||||||||||||||||||||||
| — | — | — | — | (7) | (1) | — | — | (8) | (1) | |||||||||||||||||||||||||||
| — | — | — | — | — | — | — | — | (66) | (165) | |||||||||||||||||||||||||||
| (42) | (51) | (22) | (30) | (10) | (6) | (1) | — | (106) | (202) | |||||||||||||||||||||||||||
| (1,017) | (1,015) | (1,692) | (1,524) | (390) | (416) | 16 | — | (5,232) | (5,040) | |||||||||||||||||||||||||||
| (335) | (346) | (44) | (58) | (31) | (26) | 23 | 168 | (463) | (496) | |||||||||||||||||||||||||||
| — | — | — | — | (1) | — | — | — | (1) | — | |||||||||||||||||||||||||||
| (4,017) | (3,767) | (5,740) | (5,242) | (1,148) | (1,221) | 73 | 209 | (19,302) | (18,730) | |||||||||||||||||||||||||||
| 41 | 506 | 802 | 1,017 | 134 | 138 | 18 | 25 | 1,864 | 3,177 | |||||||||||||||||||||||||||
| 76.4 | 65.3 | 67.6 | 64.8 | 60.0 | 61.4 | —5) | —5) | 70.8 | 67.4 | |||||||||||||||||||||||||||
| 30.2 | 29.5 | 28.8 | 27.5 | 33.5 | 33.5 | —5) | —5) | 28.0 | 27.1 | |||||||||||||||||||||||||||
| 106.6 | 94.8 | 96.4 | 92.3 | 93.5 | 94.9 | —5) | —5) | 98.8 | 94.5 | |||||||||||||||||||||||||||
65
Table of Contents
Notes to the Condensed Consolidated Interim Financial Statements Allianz Group Interim Report Second Quarter and First Half of 2009
Reportable segments – Life/Health business
For the three months ended June 30, 2009 and 2008
| German Speaking Countries | Europe I incl. South America | |||||||||||||||
| Three months ended June 30, | 2009 € mn | 2008 € mn | 2009 € mn | 2008 € mn | ||||||||||||
| Statutory premiums1) | 4,619 | 4,201 | 2,243 | 1,925 | ||||||||||||
| Ceded premiums written | (50) | (52) | (17) | (23) | ||||||||||||
| Change in unearned premiums | (18) | (13) | 15 | 7 | ||||||||||||
| Statutory premiums (net) | 4,551 | 4,136 | 2,241 | 1,909 | ||||||||||||
| Deposits from SFAS 97 insurance and investment contracts | (1,322) | (946) | (1,893) | (1,516) | ||||||||||||
| Premiums earned (net) | 3,229 | 3,190 | 348 | 393 | ||||||||||||
| Interest and similar income | 1,983 | 2,139 | 352 | 376 | ||||||||||||
| Operating income from financial assets and liabilities carried at fair value through income (net) | (88) | (284) | (4) | 8 | ||||||||||||
| Operating realized gains/losses (net) | 522 | 184 | 12 | 7 | ||||||||||||
| Fee and commission income | 7 | 7 | 69 | 88 | ||||||||||||
| Other income | 4 | 2 | 1 | 3 | ||||||||||||
| Operating revenues | 5,657 | 5,238 | 778 | 875 | ||||||||||||
| Claims and insurance benefits incurred (net) | (3,075) | (3,102) | (400) | (423) | ||||||||||||
| Changes in reserves for insurance and investment contracts (net) | (1,655) | (908) | (46) | (31) | ||||||||||||
| Interest expenses | (27) | (29) | (2) | (7) | ||||||||||||
| Loan loss provisions | (6) | 4 | — | — | ||||||||||||
| Operating impairments of investments (net) | (198) | (641) | (4) | (71) | ||||||||||||
| Investment expenses | (144) | (15) | (5) | (10) | ||||||||||||
| Acquisition and administrative expenses (net) | (301) | (318) | (167) | (157) | ||||||||||||
| Fee and commission expenses | (7) | (7) | (36) | (43) | ||||||||||||
| Operating restructuring charges | 4 | — | — | — | ||||||||||||
| Other expenses | — | — | — | — | ||||||||||||
| Operating expenses | (5,409) | (5,016) | (660) | (742) | ||||||||||||
| Operating profit | 248 | 222 | 118 | 133 | ||||||||||||
| Cost-income ratio2)in % | 96.2 | 96.0 | 95.5 | 94.1 | ||||||||||||
| 1) | For the Life/Health segment, total revenues are measured based upon statutory premiums. Statutory premiums are gross premiums written from sales of life and health insurance policies, as well as gross receipts from sales of unit-linked and other investment-oriented products, in accordance with the statutory accounting practices applicable in the insurer’s home jurisdiction. |
| 2) | Represents deposits from SFAS 97 insurance and investment contracts, claims and insurance benefits incurred (net), changes in reserves for insurance and investment contracts (net) and acquisition and administrative expenses (net) divided by statutory premiums (net), interest and similar income, operating income from financial assets and liabilities carried at fair value through income (net), operating realized gains/losses (net), fee and commission income, other income, interest expenses, loan loss provisions, operating impairments of investments (net), investment expenses, fee and commission expenses, operating restructuring charges and other expenses. |
| 3) | Presentation not meaningful. |
66
Table of Contents
Allianz Group Interim Report Second Quarter and First Half of 2009 Notes to the Condensed Consolidated Interim Financial Statements
| Europe II incl. Africa | Anglo Broker Markets/ Global Lines | Growth Markets | Consolidation | Life/Health | ||||||||||||||||||||||||||||||||
2009 € mn | 2008 € mn | 2009 € mn | 2008 € mn | 2009 € mn | 2008 € mn | 2009 € mn | 2008 € mn | 2009 € mn | 2008 € mn | |||||||||||||||||||||||||||
| 2,104 | 1,993 | 1,711 | 1,488 | 1,139 | 1,177 | (50) | (55) | 11,766 | 10,729 | |||||||||||||||||||||||||||
| (58) | (59) | (35) | (31) | (17) | (14) | 50 | 55 | (127) | (124) | |||||||||||||||||||||||||||
| 12 | 7 | 2 | (6) | (35) | (24) | — | — | (24) | (29) | |||||||||||||||||||||||||||
| 2,058 | 1,941 | 1,678 | 1,451 | 1,087 | 1,139 | — | — | 11,615 | 10,576 | |||||||||||||||||||||||||||
| (1,189) | (1,185) | (1,433) | (1,114) | (666) | (704) | — | — | (6,503) | (5,465) | |||||||||||||||||||||||||||
| 869 | 756 | 245 | 337 | 421 | 435 | — | — | 5,112 | 5,111 | |||||||||||||||||||||||||||
| 667 | 772 | 526 | 406 | 125 | 117 | (15) | 4 | 3,638 | 3,814 | |||||||||||||||||||||||||||
279 | (42) | 419 | (22) | 4 | (11) | 5 | (1) | 615 | (352) | |||||||||||||||||||||||||||
| 100 | 77 | 3 | 2 | 2 | 4 | — | (1) | 639 | 273 | |||||||||||||||||||||||||||
| 18 | 23 | 10 | 31 | 20 | 20 | (2) | (1) | 122 | 168 | |||||||||||||||||||||||||||
| 1 | (2) | 1 | — | (1) | 2 | — | — | 6 | 5 | |||||||||||||||||||||||||||
| 1,934 | 1,584 | 1,204 | 754 | 571 | 567 | (12) | 1 | 10,132 | 9,019 | |||||||||||||||||||||||||||
| (735) | (685) | (100) | (120) | (187) | (210) | — | — | (4,497) | (4,540) | |||||||||||||||||||||||||||
| (481) | (134) | (111) | (175) | (162) | (142) | — | 1 | (2,455) | (1,389) | |||||||||||||||||||||||||||
| (8) | (36) | (2) | 1 | (2) | (1) | 14 | 17 | (27) | (55) | |||||||||||||||||||||||||||
| — | — | (6) | — | — | — | — | — | (12) | 4 | |||||||||||||||||||||||||||
| (32) | (149) | (34) | (8) | 1 | (6) | — | (23) | (267) | (898) | |||||||||||||||||||||||||||
| (39) | (45) | (9) | (7) | (9) | (5) | 1 | — | (205) | (82) | |||||||||||||||||||||||||||
| (372) | (357) | (619) | (281) | (171) | (170) | (1) | (2) | (1,631) | (1,285) | |||||||||||||||||||||||||||
| (1) | (3) | (10) | (7) | — | (11) | 2 | 1 | (52) | (70) | |||||||||||||||||||||||||||
| — | — | — | — | — | — | — | — | 4 | — | |||||||||||||||||||||||||||
| — | — | — | — | — | (1) | — | — | — | (1) | |||||||||||||||||||||||||||
| (1,668) | (1,409) | (891) | (597) | (530) | (546) | 16 | (6) | (9,142) | (8,316) | |||||||||||||||||||||||||||
| 266 | 175 | 313 | 157 | 41 | 21 | 4 | (5) | 990 | 703 | |||||||||||||||||||||||||||
| 91.3 | 93.1 | 87.8 | 91.5 | 96.7 | 98.3 | —3) | —3) | 93.8 | 94.7 | |||||||||||||||||||||||||||
67
Table of Contents
Notes to the Condensed Consolidated Interim Financial Statements Allianz Group Interim Report Second Quarter and First Half of 2009
Reportable segments – Life/Health business
For the six months ended June 30, 2009 and 2008
| German Speaking Countries | Europe I incl. South America | |||||||||||||||
| Six months ended June 30, | 2009 € mn | 2008 € mn | 2009 € mn | 2008 € mn | ||||||||||||
| Statutory premiums1) | 9,700 | 9,325 | 4,839 | 3,821 | ||||||||||||
| Ceded premiums written | (101) | (104) | (52) | (53) | ||||||||||||
| Change in unearned premiums | (41) | (16) | 36 | 26 | ||||||||||||
| Statutory premiums (net) | 9,558 | 9,205 | 4,823 | 3,794 | ||||||||||||
| Deposits from SFAS 97 insurance and investment contracts | (2,852) | (2,339) | (4,122) | (3,009) | ||||||||||||
| Premiums earned (net) | 6,706 | 6,866 | 701 | 785 | ||||||||||||
| Interest and similar income | 3,755 | 3,923 | 672 | 687 | ||||||||||||
| Operating income from financial assets and liabilities carried at fair value through income (net) | (101) | 452 | (12) | 11 | ||||||||||||
| Operating realized gains/losses (net) | 455 | 367 | 14 | 10 | ||||||||||||
| Fee and commission income | 10 | 15 | 141 | 175 | ||||||||||||
| Other income | 6 | 108 | 1 | 3 | ||||||||||||
| Operating revenues | 10,831 | 11,731 | 1,517 | 1,671 | ||||||||||||
| Claims and insurance benefits incurred (net) | (6,785) | (6,720) | (812) | (814) | ||||||||||||
| Changes in reserves for insurance and investment contracts (net) | (1,799) | (2,133) | (40) | (62) | ||||||||||||
| Interest expenses | (61) | (69) | (4) | (11) | ||||||||||||
| Loan loss provisions | (6) | 6 | — | — | ||||||||||||
| Operating impairments of investments (net) | (890) | (1,372) | (86) | (159) | ||||||||||||
| Investment expenses | (54) | (274) | (7) | (19) | ||||||||||||
| Acquisition and administrative expenses (net) | (785) | (685) | (329) | (322) | ||||||||||||
| Fee and commission expenses | (10) | (12) | (73) | (83) | ||||||||||||
| Operating restructuring charges | 3 | (1) | — | — | ||||||||||||
| Other expenses | — | — | — | — | ||||||||||||
| Operating expenses | (10,387) | (11,260) | (1,351) | (1,470) | ||||||||||||
| Operating profit | 444 | 471 | 166 | 201 | ||||||||||||
| Cost-income ratio2)in % | 96.5 | 96.2 | 97.0 | 95.4 | ||||||||||||
| 1) | For the Life/Health segment, total revenues are measured based upon statutory premiums. Statutory premiums are gross premiums written from sales of life and health insurance policies, as well as gross receipts from sales of unit-linked and other investment-oriented products, in accordance with the statutory accounting practices applicable in the insurer’s home jurisdiction. |
| 2) | Represents deposits from SFAS 97 insurance and investment contracts, claims and insurance benefits incurred (net), changes in reserves for insurance and investment contracts (net) and acquisition and administrative expenses (net) divided by statutory premiums (net), interest and similar income, operating income from financial assets and liabilities carried at fair value through income (net), operating realized gains/losses (net), fee and commission income, other income, interest expenses, loan loss provisions, operating impairments of investments (net), investment expenses, fee and commission expenses, operating restructuring charges and other expenses. |
| 3) | Presentation not meaningful. |
68
Table of Contents
Allianz Group Interim Report Second Quarter and First Half of 2009 Notes to the Condensed Consolidated Interim Financial Statements
| Europe II incl. Africa | Anglo Broker Markets/ Global Lines | Growth Markets | Consolidation | Life/Health | ||||||||||||||||||||||||||||||||
2009 € mn | 2008 € mn | 2009 € mn | 2008 € mn | 2009 € mn | 2008 € mn | 2009 € mn | 2008 € mn | 2009 € mn | 2008 € mn | |||||||||||||||||||||||||||
| 4,210 | 4,543 | 3,927 | 2,940 | 2,214 | 2,535 | (111) | (108) | 24,779 | 23,056 | |||||||||||||||||||||||||||
| (124) | (119) | (74) | (69) | (30) | (30) | 111 | 108 | (270) | (267) | |||||||||||||||||||||||||||
| (3) | (25) | (2) | (12) | (43) | (39) | — | — | (53) | (66) | |||||||||||||||||||||||||||
| 4,083 | 4,399 | 3,851 | 2,859 | 2,141 | 2,466 | — | — | 24,456 | 22,723 | |||||||||||||||||||||||||||
| (2,357) | (2,811) | (3,353) | (2,270) | (1,312) | (1,594) | — | — | (13,996) | (12,023) | |||||||||||||||||||||||||||
| 1,726 | 1,588 | 498 | 589 | 829 | 872 | — | — | 10,460 | 10,700 | |||||||||||||||||||||||||||
| 1,234 | 1,338 | 1,073 | 821 | 239 | 244 | (30) | 1 | 6,943 | 7,014 | |||||||||||||||||||||||||||
| 44 | (357) | 445 | (223) | 7 | (5) | 1 | 9 | 384 | (113) | |||||||||||||||||||||||||||
| 335 | 537 | 4 | 1 | 2 | 8 | — | (1) | 810 | 922 | |||||||||||||||||||||||||||
| 36 | 41 | 19 | 64 | 38 | 46 | (3) | (2) | 241 | 339 | |||||||||||||||||||||||||||
| 1 | 2 | 1 | — | — | 2 | — | — | 9 | 115 | |||||||||||||||||||||||||||
| 3,376 | 3,149 | 2,040 | 1,252 | 1,115 | 1,167 | (32) | 7 | 18,847 | 18,977 | |||||||||||||||||||||||||||
| (1,438) | (1,353) | (207) | (217) | (401) | (449) | — | — | (9,643) | (9,553) | |||||||||||||||||||||||||||
| (417) | (267) | (487) | (465) | (297) | (266) | — | 1 | (3,040) | (3,192) | |||||||||||||||||||||||||||
| (28) | (77) | (4) | (2) | (4) | (4) | 30 | 38 | (71) | (125) | |||||||||||||||||||||||||||
| — | — | (9) | — | 1 | — | — | — | (14) | 6 | |||||||||||||||||||||||||||
| (298) | (295) | (68) | (8) | (1) | (7) | — | (37) | (1,343) | (1,878) | |||||||||||||||||||||||||||
| (78) | (88) | (17) | (13) | (14) | (15) | (1) | (1) | (171) | (410) | |||||||||||||||||||||||||||
| (698) | (682) | (904) | (368) | (344) | (343) | — | (1) | (3,060) | (2,401) | |||||||||||||||||||||||||||
| (10) | (11) | (26) | (15) | — | (11) | 3 | 2 | (116) | (130) | |||||||||||||||||||||||||||
| — | — | — | — | — | — | — | — | 3 | (1) | |||||||||||||||||||||||||||
| — | — | — | — | — | (1) | — | — | — | (1) | |||||||||||||||||||||||||||
| (2,967) | (2,773) | (1,722) | (1,088) | (1,060) | (1,096) | 32 | 2 | (17,455) | (17,685) | |||||||||||||||||||||||||||
| 409 | 376 | 318 | 164 | 55 | 71 | — | 9 | 1,392 | 1,292 | |||||||||||||||||||||||||||
| 92.3 | 93.1 | 94.0 | 95.3 | 97.7 | 97.4 | —3) | —3) | 95.5 | 95.5 | |||||||||||||||||||||||||||
69
Table of Contents
Notes to the Condensed Consolidated Interim Financial Statements Allianz Group Interim Report Second Quarter and First Half of 2009
Reportable segments – Financial Services business
For the three months and six months ended June 30, 2009 and 2008
Asset Management | ||||||||
| Three months ended June 30, | 2009 € mn | 2008 € mn | ||||||
| Net fee and commission income1) | 752 | 721 | ||||||
| Net interest income2) | (2) | 8 | ||||||
| Income from financial assets and liabilities carried at fair value through income (net) | 25 | 3 | ||||||
| Other income | 5 | 7 | ||||||
| Operating revenues3) | 780 | 739 | ||||||
| Administrative expenses (net), excluding acquisition-related expenses | (534) | (457) | ||||||
| Investment expenses | — | (1) | ||||||
| Other expenses | — | — | ||||||
| Operating expenses | (534) | (458) | ||||||
| Loan loss provisions | — | — | ||||||
| Operating profit (loss) | 246 | 281 | ||||||
| Cost-income ratio4)in % | 68.5 | 62.0 | ||||||
| ||||||||
Asset Management | ||||||||
| Six months ended June 30, | 2009 € mn | 2008 € mn | ||||||
| Net fee and commission income1) | 1,461 | 1,427 | ||||||
| Net interest income2) | 10 | 27 | ||||||
| Income from financial assets and liabilities carried at fair value through income (net) | 16 | 2 | ||||||
| Other income | 8 | 12 | ||||||
| Operating revenues3) | 1,495 | 1,468 | ||||||
| Administrative expenses (net), excluding acquisition-related expenses | (1,039) | (946) | ||||||
| Investment expenses | 1 | — | ||||||
| Other expenses | — | — | ||||||
| Operating expenses | (1,038) | (946) | ||||||
| Loan loss provisions | — | — | ||||||
| Operating profit (loss) | 457 | 522 | ||||||
| Cost-income ratio4)in % | 69.4 | 64.4 | ||||||
| 1) | Represents fee and commission income less fee and commission expenses. |
| 2) | Represents interest and similar income less interest expenses. |
| 3) | For the Financial Services segment, total revenues are measured based upon operating revenues. |
| 4) | Represents operating expenses divided by operating revenues. |
| 5) | Presentation not meaningful. |
70
Table of Contents
Allianz Group Interim Report Second Quarter and First Half of 2009 Notes to the Condensed Consolidated Interim Financial Statements
| Banking | Alternative Investment Management | Consolidation | Financial Services | |||||||||||||||||||||||||
2009 € mn | 2008 € mn | 2009 € mn | 2008 € mn | 2009 € mn | 2008 € mn | 2009 € mn | 2008 € mn | |||||||||||||||||||||
| 43 | 64 | 20 | 30 | (1) | 1 | 814 | 816 | |||||||||||||||||||||
| 77 | 88 | — | 3 | — | 1 | 75 | 100 | |||||||||||||||||||||
| 3 | — | — | (1) | — | — | 28 | 2 | |||||||||||||||||||||
| — | — | 4 | — | — | — | 9 | 7 | |||||||||||||||||||||
| 123 | 152 | 24 | 32 | (1) | 2 | 926 | 925 | |||||||||||||||||||||
| (207) | (137) | (31) | (42) | 1 | (2) | (771) | (638) | |||||||||||||||||||||
| 2 | 2 | — | — | — | — | 2 | 1 | |||||||||||||||||||||
| (1) | 1 | — | — | — | — | (1) | 1 | |||||||||||||||||||||
| (206) | (134) | (31) | (42) | 1 | (2) | (770) | (636) | |||||||||||||||||||||
| (10) | (4) | — | — | — | — | (10) | (4) | |||||||||||||||||||||
| (93) | 14 | (7) | (10) | — | — | 146 | 285 | |||||||||||||||||||||
| 167.5 | 88.2 | 129.2 | 131.3 | —5) | —5) | 83.2 | 68.8 | |||||||||||||||||||||
| Banking | Alternative Investment Management | Consolidation | Financial Services | |||||||||||||||||||||||||
2009 € mn | 2008 € mn | 2009 € mn | 2008 € mn | 2009 € mn | 2008 € mn | 2009 € mn | 2008 € mn | |||||||||||||||||||||
| 78 | 138 | 50 | 84 | (1) | — | 1,588 | 1,649 | |||||||||||||||||||||
| 157 | 166 | 1 | 3 | — | — | 168 | 196 | |||||||||||||||||||||
| 4 | (10) | — | (3) | — | — | 20 | (11) | |||||||||||||||||||||
| — | — | 4 | — | — | — | 12 | 12 | |||||||||||||||||||||
| 239 | 294 | 55 | 84 | (1) | — | 1,788 | 1,846 | |||||||||||||||||||||
| (325) | (277) | (64) | (75) | 1 | — | (1,427) | (1,298) | |||||||||||||||||||||
| 1 | 5 | (1) | (2) | — | — | 1 | 3 | |||||||||||||||||||||
| (1) | — | — | — | — | — | (1) | — | |||||||||||||||||||||
| (325) | (272) | (65) | (77) | 1 | — | (1,427) | (1,295) | |||||||||||||||||||||
| (17) | (11) | — | — | — | — | (17) | (11) | |||||||||||||||||||||
| (103) | 11 | (10) | 7 | — | — | 344 | 540 | |||||||||||||||||||||
| 136.0 | 92.5 | 118.2 | 91.7 | —5) | —5) | 79.8 | 70.2 | |||||||||||||||||||||
71
Table of Contents
Notes to the Condensed Consolidated Interim Financial Statements Allianz Group Interim Report Second Quarter and First Half of 2009
Supplementary Information to the Consolidated Balance Sheets
6 Financial assets carried at fair value through income
As of June 30, 2009 € mn | As of € mn | |||||||
| Financial assets held for trading | ||||||||
Debt securities | 532 | 547 | ||||||
Equity securities | 101 | 99 | ||||||
Derivative financial instruments | 1,380 | 1,978 | ||||||
Subtotal | 2,013 | 2,624 | ||||||
| Financial assets designated at fair value through income | ||||||||
Debt securities1) | 8,848 | 8,589 | ||||||
Equity securities | 3,113 | 3,027 | ||||||
Subtotal | 11,961 | 11,616 | ||||||
| Total | 13,974 | 14,240 |
| 1) | Debt securities designated at fair value through income include€ 0.2 bn (2008:€ 0.2 bn) of asset-backed securities of the Life/Health segment as of June 30, 2009. |
As of June 30, 2009 € mn | As of € mn | |||||||
| Available-for-sale investments | 253,969 | 242,099 | ||||||
| Held-to-maturity investments | 4,844 | 4,934 | ||||||
| Funds held by others under reinsurance contracts assumed | 813 | 1,039 | ||||||
| Investments in associates and joint ventures | 2,782 | 4,524 | ||||||
| Real estate held for investment | 7,444 | 7,551 | ||||||
| Total | 269,852 | 260,147 |
Available-for-sale investments
| As of June 30, 2009 | As of December 31, 2008 | |||||||||||||||||||||||||||||||
| Amortized | Unrealized | Unrealized | Fair Value | Amortized | Unrealized | Unrealized | Fair Value | |||||||||||||||||||||||||
Cost € mn | Gains € mn | Losses € mn | € mn | Cost € mn | Gains € mn | Losses € mn | € mn | |||||||||||||||||||||||||
| Debt securities | ||||||||||||||||||||||||||||||||
Government and agency mortgage-backed securities (residential and commercial)1) | 8,198 | 189 | (41) | 8,346 | 7,814 | 177 | (2) | 7,989 | ||||||||||||||||||||||||
Corporate mortgage-backed securities (residential and commercial)1) | 8,637 | 16 | (1,277) | 7,376 | 8,714 | 14 | (1,417) | 7,311 | ||||||||||||||||||||||||
Other asset-backed securities1) | 4,519 | 64 | (239) | 4,344 | 4,858 | 16 | (385) | 4,489 | ||||||||||||||||||||||||
Government and government agency bonds | 100,376 | 3,072 | (1,045) | 102,403 | 94,742 | 4,573 | (1,020) | 98,295 | ||||||||||||||||||||||||
Corporate bonds | 108,085 | 2,473 | (5,001) | 105,557 | 98,864 | 1,367 | (7,028) | 93,203 | ||||||||||||||||||||||||
Other | 1,503 | 37 | (42) | 1,498 | 1,283 | 58 | (18) | 1,323 | ||||||||||||||||||||||||
Subtotal | 231,318 | 5,851 | (7,645) | 229,524 | 216,275 | 6,205 | (9,870) | 212,610 | ||||||||||||||||||||||||
| Equity securities | 18,049 | 6,709 | (313) | 24,445 | 23,802 | 6,538 | (851) | 29,489 | ||||||||||||||||||||||||
| Total | 249,367 | 12,560 | (7,958) | 253,969 | 240,077 | 12,743 | (10,721) | 242,099 | ||||||||||||||||||||||||
| 1) | Includes asset-backed securities of the Property-Casualty segment of€ 4.4 bn (2008:€ 4.4 bn) and of the Life/Health segment of€ 14.8 bn (2008:€ 14.5 bn) as of June 30, 2009. |
72
Table of Contents
Allianz Group Interim Report Second Quarter and First Half of 2009 Notes to the Condensed Consolidated Interim Financial Statements
8 Loans and advances to banks and customers
| As of June 30, 2009 | As of December 31, 2008 | |||||||||||||||||||||||
| Banks € mn | Customers € mn | Total € mn | Banks € mn | Customers € mn | Total € mn | |||||||||||||||||||
| Short-term investments and certificates of deposit | 8,784 | — | 8,784 | 9,622 | — | 9,622 | ||||||||||||||||||
| Reverse repurchase agreements | 1,456 | 17 | 1,473 | 1,612 | 5 | 1,617 | ||||||||||||||||||
| Loans | 69,703 | 41,874 | 111,577 | 63,734 | 37,501 | 101,235 | ||||||||||||||||||
| Other | 5,359 | 63 | 5,422 | 3,223 | 77 | 3,300 | ||||||||||||||||||
| Subtotal | 85,302 | 41,954 | 127,256 | 78,191 | 37,583 | 115,774 | ||||||||||||||||||
| Loan loss allowance | — | (142) | (142) | — | (119) | (119) | ||||||||||||||||||
| Total | 85,302 | 41,812 | 127,114 | 78,191 | 37,464 | 115,655 | ||||||||||||||||||
Loans and advances to customers by type of customer
As of June 30, € mn | As of € mn | |||||||
| Corporate customers | 12,494 | 10,448 | ||||||
| Private customers | 23,298 | 23,309 | ||||||
| Public authorities | 6,162 | 3,826 | ||||||
| Total | 41,954 | 37,583 |
As of June 30, 2009 € mn | As of € mn | |||||||
| Unearned premiums | 1,745 | 1,294 | ||||||
| Reserves for loss and loss adjustment expenses | 7,749 | 8,180 | ||||||
| Aggregate policy reserves | 4,700 | 5,018 | ||||||
| Other insurance reserves | 75 | 107 | ||||||
| Total | 14,269 | 14,599 |
As of June 30, 2009 € mn | As of € mn | |||||||
| Deferred acquisition costs | ||||||||
Property-Casualty | 4,024 | 3,721 | ||||||
Life/Health | 15,701 | 16,709 | ||||||
Financial Services | 144 | 147 | ||||||
Subtotal | 19,869 | 20,577 | ||||||
| Present value of future profits | 1,341 | 1,239 | ||||||
| Deferred sales inducements | 710 | 747 | ||||||
| Total | 21,920 | 22,563 |
As of June 30, 2009 € mn | As of € mn | |||||||
| Receivables | ||||||||
Policyholders | 4,915 | 4,467 | ||||||
Agents | 4,474 | 4,129 | ||||||
Reinsurers | 2,496 | 2,989 | ||||||
Other | 3,819 | 3,068 | ||||||
Less allowance for doubtful accounts | (578) | (499) | ||||||
Subtotal | 15,126 | 14,154 | ||||||
| Tax receivables | ||||||||
Income tax | 2,017 | 2,467 | ||||||
Other tax | 741 | 813 | ||||||
Subtotal | 2,758 | 3,280 | ||||||
| Accrued dividends, interest and rent | 6,216 | 5,918 | ||||||
| Prepaid expenses | ||||||||
Interest and rent | 31 | 28 | ||||||
Other prepaid expenses | 270 | 313 | ||||||
Subtotal | 301 | 341 | ||||||
Derivative financial instruments used for hedging that meet the criteria for hedge accounting and firm commitments | 586 | 1,101 | ||||||
| Property and equipment | ||||||||
Real estate held for own use | 3,159 | 3,122 | ||||||
Equipment | 1,476 | 1,242 | ||||||
Software | 1,195 | 1,116 | ||||||
Subtotal | 5,830 | 5,480 | ||||||
| Other assets | 2,338 | 3,730 | ||||||
| Total | 33,155 | 34,004 |
73
Table of Contents
Notes to the Condensed Consolidated Interim Financial Statements Allianz Group Interim Report Second Quarter and First Half of 2009
12 Non-current assets and assets and liabilities of disposal groups classified as held for sale
As of € mn | As of € mn | |||||||
| Non-current assets and assets of disposal groups classified as held for sale | ||||||||
Dresdner Bank Group | — | 417,874 | ||||||
Selecta AG | — | 1,639 | ||||||
| Total | — | 419,513 | ||||||
| Liabilities of disposal groups classified as held for sale | ||||||||
Dresdner Bank Group | — | 410,469 | ||||||
Selecta AG | — | 1,347 | ||||||
| Total | — | 411,816 |
Dresdner Bank Group
As described in detail in Note 3, the sale of Dresdner Bank was completed on January 12, 2009. Accordingly, assets and liabilities of Dresdner Bank were deconsolidated in the first quarter 2009.
Selecta AG
Given the current market environment the intended sale of Selecta has been deferred in order to optimise valuations and investment proceeds.
As a result, firstly the assets and liabilities of Selecta were re classified from “non-current assets and assets and liabilities of disposal groups classified as held for sale” as of June 30, 2009 based on their original IFRS presentation.
Secondly, the non-current assets of Selecta were remeasured at the date of reclassification to reflect the carrying amounts the assets would have had in the absence of the held for sale classification from the end of the fourth quarter 2007 until the end of the second quarter 2009. This resulted in depreciation and amortization expenses net of deferred income taxes of € 120 mn.
If Selecta was not classified as held for sale in the comparative periods presented, net income from continuing operations would have been € 16 mn lower for the three months and € 32 mn lower for the six months ended June 30, 2008 due to amortization and depreciation of the non-current assets of Selecta.
As of € mn | As of € mn | |||||||
| Goodwill | 12,280 | 11,221 | ||||||
| Brand names1) | 305 | 24 | ||||||
| Other2) | 1,020 | 206 | ||||||
| Total | 13,605 | 11,451 |
| 1) | Includes primarily the brand name of Selecta AG, Muntelier, as this subsidiary is reclassified out of disposal groups classified as held for sale. |
| 2) | Includes primarily long-term distribution agreements with Commerzbank (€ 473 mn), customer relationships (€ 305 mn), research and development costs (€ 89 mn) and bancassurance agreements (€ 15 mn). |
Changes in goodwill for the six months ended June 30, 2009, were as follows:
| 2009 € mn | ||||
| Cost as of January 1, | 11,445 | |||
| Accumulated impairments as of January 1, | (224) | |||
| Carrying amount as of January 1, | 11,221 | |||
| Additions | 613 | |||
| Foreign currency translation adjustments | (45) | |||
| Reclassification | 491 | |||
| Carrying amount as of June 30, | 12,280 | |||
| Accumulated impairments as of June 30, | 224 | |||
| Cost as of June 30, | 12,504 |
Additions include goodwill from the acquisition of a 100% participation in cominvest Asset Management GmbH, Frankfurt a.M., in the first quarter 2009.
The reclassification relates to the goodwill of Selecta AG, Muntelier, as this subsidiary is reclassified out of disposal groups classified as held for sale.
74
Table of Contents
Allianz Group Interim Report Second Quarter and First Half of 2009 Notes to the Condensed Consolidated Interim Financial Statements
14 Financial liabilities carried at fair value through income
As of June 30, 2009 € mn | As of € mn | |||||||
| Financial liabilities held for trading | ||||||||
Derivative financial instruments | 5,425 | 6,242 | ||||||
Other trading liabilities | 63 | 2 | ||||||
| Total | 5,488 | 6,244 |
15 Liabilities to banks and customers
| As of June 30, 2009 | As of December 31, 2008 | |||||||||||||||||||||||
Banks € mn | Customers € mn | Total € mn | Banks € mn | Customers € mn | Total € mn | |||||||||||||||||||
| Payable on demand | 215 | 3,640 | 3,855 | 311 | 4,096 | 4,407 | ||||||||||||||||||
| Savings deposits | — | 1,856 | 1,856 | — | 1,790 | 1,790 | ||||||||||||||||||
| Term deposits and certificates of deposit | 1,442 | 2,869 | 4,311 | 1,296 | 3,035 | 4,331 | ||||||||||||||||||
| Repurchase agreements | 326 | 293 | 619 | — | 568 | 568 | ||||||||||||||||||
| Collateral received from securities lending transactions | 36 | — | 36 | 627 | — | 627 | ||||||||||||||||||
| Other | 7,411 | 3,201 | 10,612 | 3,194 | 3,534 | 6,728 | ||||||||||||||||||
| Total | 9,430 | 11,859 | 21,289 | 5,428 | 13,023 | 18,451 | ||||||||||||||||||
16 Reserves for loss and loss adjustment expenses
As of € mn | As of € mn | |||||||
| Property-Casualty | 55,677 | 55,616 | ||||||
| Life/Health | 8,386 | 8,320 | ||||||
| Consolidation | (12) | (12) | ||||||
| Total | 64,051 | 63,924 |
Changes in the reserves for loss and loss adjustment expenses for the Property-Casualty segment for the six months ended June 30, 2009 and 2008 are as follows:
| 2009 | 2008 | |||||||||||||||||||||||
Gross € mn | Ceded € mn | Net € mn | Gross € mn | Ceded € mn | Net € mn | |||||||||||||||||||
| As of January 1, | 55,616 | (7,820) | 47,796 | 56,943 | (8,266) | 48,677 | ||||||||||||||||||
| Loss and loss adjustment expenses incurred | ||||||||||||||||||||||||
Current year | 14,853 | (1,204) | 13,649 | 14,684 | (1,350) | 13,334 | ||||||||||||||||||
Prior years | (835) | 427 | (408) | (1,148) | 362 | (786) | ||||||||||||||||||
Subtotal | 14,018 | (777) | 13,241 | 13,536 | (988) | 12,548 | ||||||||||||||||||
| Loss and loss adjustment expenses paid | ||||||||||||||||||||||||
Current year | (5,232) | 247 | (4,985) | (4,747) | 238 | (4,509) | ||||||||||||||||||
Prior years | (9,465) | 1,146 | (8,319) | (8,769) | 1,052 | (7,717) | ||||||||||||||||||
Subtotal | (14,697) | 1,393 | (13,304) | (13,516) | 1,290 | (12,226) | ||||||||||||||||||
| Foreign currency translation adjustments and other changes | 740 | (205) | 535 | (640) | 218 | (422) | ||||||||||||||||||
| Changes in the consolidated subsidiaries of the Allianz Group | — | — | — | 1 | — | 1 | ||||||||||||||||||
| Reclassifications 1) | — | — | — | (1,481) | 90 | (1,391) | ||||||||||||||||||
| As of June 30, | 55,677 | (7,409) | 48,268 | 54,843 | (7,656) | 47,187 | ||||||||||||||||||
| 1) | Since the first quarter 2008, health business in Belgium and France is shown within Life/Health segment. |
75
Table of Contents
Notes to the Condensed Consolidated Interim Financial Statements Allianz Group Interim Report Second Quarter and First Half of 2009
17 Reserves for insurance and investment contracts
As of June 30, 2009 € mn | As of € mn | |||||||
| Aggregate policy reserves | 287,477 | 278,700 | ||||||
| Reserves for premium refunds | 18,170 | 17,195 | ||||||
| Other insurance reserves | 588 | 662 | ||||||
| Total | 306,235 | 296,557 |
As of June 30, 2009 € mn | As of December 31, € mn | |||||||
| Payables | ||||||||
Policyholders | 4,266 | 4,695 | ||||||
Reinsurers | 2,155 | 2,062 | ||||||
Agents | 1,565 | 1,485 | ||||||
Subtotal | 7,986 | 8,242 | ||||||
| Payables for social security | 375 | 316 | ||||||
| Tax payables | ||||||||
Income tax | 1,390 | 1,446 | ||||||
Other | 1,104 | 971 | ||||||
Subtotal | 2,494 | 2,417 | ||||||
| Accrued interest and rent | 456 | 723 | ||||||
| Unearned income | ||||||||
Interest and rent | 10 | 10 | ||||||
Other | 343 | 361 | ||||||
Subtotal | 353 | 371 | ||||||
| Provisions | ||||||||
Pensions and similar obligations | 3,854 | 3,867 | ||||||
Employee related | 1,693 | 1,904 | ||||||
Share-based compensation | 941 | 1,295 | ||||||
Restructuring plans | 403 | 343 | ||||||
Loan commitments | 6 | 8 | ||||||
Contingent losses from non-insurance business | 89 | 109 | ||||||
Other provisions | 1,151 | 1,481 | ||||||
Subtotal | 8,137 | 9,007 | ||||||
| Deposits retained for reinsurance ceded | 2,690 | 2,852 | ||||||
| Derivative financial instruments used for hedging that meet the criteria for hedge accounting and firm commitments | 229 | 208 | ||||||
| Financial liabilities for puttable equity instruments | 3,078 | 2,718 | ||||||
| Other liabilities | 6,234 | 6,076 | ||||||
| Total | 32,032 | 32,930 |
As of June 30, 2009 € mn | As of € mn | |||||||
| Allianz SE1) | ||||||||
Senior bonds | 3,850 | 4,135 | ||||||
Money market securities | 1,744 | 4,103 | ||||||
Subtotal | 5,594 | 8,238 | ||||||
| Banking subsidiaries | ||||||||
Senior bonds | 1,022 | 1,278 | ||||||
Money market securities | 159 | — | ||||||
Subtotal | 1,181 | 1,278 | ||||||
| All other subsidiaries | ||||||||
Certificated liabilities | 28 | 28 | ||||||
Subtotal | 28 | 28 | ||||||
| Total | 6,803 | 9,544 |
| 1) | Includes senior bonds issued by Allianz Finance II B.V. guaranteed by Allianz SE and money market securities issued by Allianz Finance Corporation, a wholly-owned subsidiary of Allianz SE, which are fully and unconditionally guaranteed by Allianz SE. |
20 Participation certificates and subordinated liabilities
As of June 30, 2009 € mn | As of December 31, € mn | |||||||
| Allianz SE1) | ||||||||
Subordinated bonds | 8,189 | 8,197 | ||||||
Participation certificates | 85 | 85 | ||||||
Subtotal | 8,274 | 8,282 | ||||||
| Banking subsidiaries | ||||||||
Subordinated bonds | 173 | 173 | ||||||
Subtotal | 173 | 173 | ||||||
| All other subsidiaries | ||||||||
Subordinated liabilities | 846 | 846 | ||||||
Hybrid equity | 95 | 45 | ||||||
Subtotal | 941 | 891 | ||||||
| Total | 9,388 | 9,346 |
| 1) | Includes subordinated bonds issued by Allianz Finance II B.V. and guaranteed by Allianz SE. |
76
Table of Contents
Allianz Group Interim Report Second Quarter and First Half of 2009 Notes to the Condensed Consolidated Interim Financial Statements
As of June 30, 2009 € mn | As of € mn | |||||||
| Shareholders’ equity | ||||||||
Issued capital | 1,160 | 1,160 | ||||||
Capital reserve | 27,409 | 27,409 | ||||||
Revenue reserves | 7,534 | 7,257 | ||||||
Treasury shares | (284) | (147) | ||||||
Foreign currency translation adjustments | (3,556) | (4,006) | ||||||
Unrealized gains and losses (net)1) | 2,267 | 2,011 | ||||||
Subtotal | 34,530 | 33,684 | ||||||
| Minority interests | 2,081 | 3,564 | ||||||
| Total | 36,611 | 37,248 |
| 1) | As of June 30, 2009 includes€ 174 mn (2008:€ 203 mn) related to cash flow hedges. |
Dividends
In the second quarter of 2009 a total dividend of € 1,580 mn (2008: € 2,472 mn) or € 3.50 (2008: € 5.50) per qualifying share was paid to the shareholders.
77
Table of Contents
Notes to the Condensed Consolidated Interim Financial Statements Allianz Group Interim Report Second Quarter and First Half of 2009
Supplementary Information to the Consolidated Income Statements
| Three months ended June 30, | Property- | Life/Health | Consolidation | Group | ||||||||||||
Casualty € mn | € mn | € mn | € mn | |||||||||||||
| 2009 | ||||||||||||||||
| Premiums written | ||||||||||||||||
Direct | 8,855 | 5,168 | — | 14,023 | ||||||||||||
Assumed | 667 | 85 | (5) | 747 | ||||||||||||
Subtotal | 9,522 | 5,253 | (5) | 14,770 | ||||||||||||
Ceded | (985) | (118) | 5 | (1,098) | ||||||||||||
Net | 8,537 | 5,135 | — | 13,672 | ||||||||||||
| Change in unearned premiums | ||||||||||||||||
Direct | 892 | (20) | — | 872 | ||||||||||||
Assumed | (34) | (1) | 2 | (33) | ||||||||||||
Subtotal | 858 | (21) | 2 | 839 | ||||||||||||
Ceded | (30) | (2) | (2) | (34) | ||||||||||||
Net | 828 | (23) | — | 805 | ||||||||||||
| Premiums earned | ||||||||||||||||
Direct | 9,747 | 5,148 | — | 14,895 | ||||||||||||
Assumed | 633 | 84 | (3) | 714 | ||||||||||||
Subtotal | 10,380 | 5,232 | (3) | 15,609 | ||||||||||||
Ceded | (1,015) | (120) | 3 | (1,132) | ||||||||||||
Net | 9,365 | 5,112 | — | 14,477 | ||||||||||||
| 2008 | ||||||||||||||||
| Premiums written | ||||||||||||||||
Direct | 8,987 | 5,169 | — | 14,156 | ||||||||||||
Assumed | 855 | 86 | (5) | 936 | ||||||||||||
Subtotal | 9,842 | 5,255 | (5) | 15,092 | ||||||||||||
Ceded | (1,115) | (115) | 5 | (1,225) | ||||||||||||
Net | 8,727 | 5,140 | — | 13,867 | ||||||||||||
| Change in unearned premiums | ||||||||||||||||
Direct | 837 | (23) | — | 814 | ||||||||||||
Assumed | (188) | (4) | — | (192) | ||||||||||||
Subtotal | 649 | (27) | — | 622 | ||||||||||||
Ceded | 72 | (2) | — | 70 | ||||||||||||
Net | 721 | (29) | — | 692 | ||||||||||||
| Premiums earned | ||||||||||||||||
Direct | 9,824 | 5,146 | — | 14,970 | ||||||||||||
Assumed | 667 | 82 | (5) | 744 | ||||||||||||
Subtotal | 10,491 | 5,228 | (5) | 15,714 | ||||||||||||
Ceded | (1,043) | (117) | 5 | (1,155) | ||||||||||||
Net | 9,448 | 5,111 | — | 14,559 |
78
Table of Contents
Allianz Group Interim Report Second Quarter and First Half of 2009 Notes to the Condensed Consolidated Interim Financial Statements
22 Premiums earned (net) (continued)
| Six months ended June 30, | Property- | Life/Health | Consolidation | Group | ||||||||||||
Casualty € mn | € mn | € mn | € mn | |||||||||||||
| 2009 | ||||||||||||||||
| Premiums written | ||||||||||||||||
Direct | 21,972 | 10,597 | — | 32,569 | ||||||||||||
Assumed | 1,436 | 166 | (11) | 1,591 | ||||||||||||
Subtotal | 23,408 | 10,763 | (11) | 34,160 | ||||||||||||
Ceded | (2,355) | (250) | 11 | (2,594) | ||||||||||||
Net | 21,053 | 10,513 | — | 31,566 | ||||||||||||
| Change in unearned premiums | ||||||||||||||||
Direct | (2,570) | (51) | — | (2,621) | ||||||||||||
Assumed | (131) | (2) | (1) | (134) | ||||||||||||
Subtotal | (2,701) | (53) | (1) | (2,755) | ||||||||||||
Ceded | 345 | — | 1 | 346 | ||||||||||||
Net | (2,356) | (53) | — | (2,409) | ||||||||||||
| Premiums earned | ||||||||||||||||
Direct | 19,402 | 10,546 | — | 29,948 | ||||||||||||
Assumed | 1,305 | 164 | (12) | 1,457 | ||||||||||||
Subtotal | 20,707 | 10,710 | (12) | 31,405 | ||||||||||||
Ceded | (2,010) | (250) | 12 | (2,248) | ||||||||||||
Net | 18,697 | 10,460 | — | 29,157 | ||||||||||||
| 2008 | ||||||||||||||||
| Premiums written | ||||||||||||||||
Direct | 22,125 | 10,842 | — | 32,967 | ||||||||||||
Assumed | 1,427 | 177 | (11) | 1,593 | ||||||||||||
Subtotal | 23,552 | 11,019 | (11) | 34,560 | ||||||||||||
Ceded | (2,400) | (252) | 11 | (2,641) | ||||||||||||
Net | 21,152 | 10,767 | — | 31,919 | ||||||||||||
| Change in unearned premiums | ||||||||||||||||
Direct | (2,625) | (61) | — | (2,686) | ||||||||||||
Assumed | (286) | (6) | — | (292) | ||||||||||||
Subtotal | (2,911) | (67) | — | (2,978) | ||||||||||||
Ceded | 380 | — | — | 380 | ||||||||||||
Net | (2,531) | (67) | — | (2,598) | ||||||||||||
| Premiums earned | ||||||||||||||||
Direct | 19,500 | 10,781 | — | 30,281 | ||||||||||||
Assumed | 1,141 | 171 | (11) | 1,301 | ||||||||||||
Subtotal | 20,641 | 10,952 | (11) | 31,582 | ||||||||||||
Ceded | (2,020) | (252) | 11 | (2,261) | ||||||||||||
Net | 18,621 | 10,700 | — | 29,321 |
79
Table of Contents
Notes to the Condensed Consolidated Interim Financial Statements Allianz Group Interim Report Second Quarter and First Half of 2009
23 Interest and similar income
| Three months ended June 30, | Six months ended June 30, | |||||||||||||||
| 2009 € mn | 2008 € mn | 2009 € mn | 2008 € mn | |||||||||||||
| Interest from held-to-maturity investments | 59 | 61 | 119 | 118 | ||||||||||||
| Dividends from available-for-sale investments | 531 | 1,201 | 669 | 1,477 | ||||||||||||
| Interest from available-for-sale investments | 2,633 | 2,437 | 5,272 | 4,820 | ||||||||||||
| Share of earnings from investments in associates and joint ventures | 10 | 30 | (25) | 35 | ||||||||||||
| Rent from real estate held for investment | 171 | 164 | 336 | 350 | ||||||||||||
| Interest from loans to banks and customers | 1,354 | 1,487 | 2,764 | 3,003 | ||||||||||||
| Other interest | 42 | 47 | 79 | 80 | ||||||||||||
| Total | 4,800 | 5,427 | 9,214 | 9,883 | ||||||||||||
24 Income from financial assets and liabilities carried at fair value through income (net)
| Three months ended June 30, | Property- € mn | Life/Health € mn | Financial € mn | Corporate € mn | Consolidation € mn | Group € mn | ||||||||||||||||||
| 2009 | ||||||||||||||||||||||||
| Income (expenses) from financial assets and liabilities held for trading | (13) | 149 | 7 | 242 | (38) | 347 | ||||||||||||||||||
| Income from financial assets designated at fair value through income | 31 | 665 | 63 | 8 | — | 767 | ||||||||||||||||||
| Expenses from financial liabilities for puttable equity instruments (net) | (1) | (184) | (42) | — | — | (227) | ||||||||||||||||||
| Total | 17 | 630 | 28 | 250 | (38) | 887 | ||||||||||||||||||
| 2008 | ||||||||||||||||||||||||
| Expenses from financial assets and liabilities held for trading | (65) | (162) | (1) | (61) | (27) | (316) | ||||||||||||||||||
| Income (expenses) from financial assets designated at fair value through income | 16 | (283) | 7 | (3) | — | (263) | ||||||||||||||||||
| Income (expenses) from financial liabilities for puttable equity instruments (net) | — | 90 | (4) | — | — | 86 | ||||||||||||||||||
| Total | (49) | (355) | 2 | (64) | (27) | (493) | ||||||||||||||||||
| Six months ended June 30, | Property- € mn | Life/Health € mn | Financial € mn | Corporate € mn | Consolidation € mn | Group € mn | ||||||||||||||||||
| 2009 | ||||||||||||||||||||||||
| Income (expenses) from financial assets and liabilities held for trading | (80) | 129 | 6 | 160 | (4) | 211 | ||||||||||||||||||
| Income from financial assets designated at fair value through income | 61 | 355 | 38 | 11 | — | 465 | ||||||||||||||||||
| Expenses from financial liabilities for puttable equity instruments (net) | (2) | (92) | (24) | (1) | — | (119) | ||||||||||||||||||
| Total | (21) | 392 | 20 | 170 | (4) | 557 | ||||||||||||||||||
| 2008 | ||||||||||||||||||||||||
| Income from financial assets and liabilities held for trading | 88 | 404 | 6 | 124 | (167) | 455 | ||||||||||||||||||
| Expenses from financial assets designated at fair value through income | (7) | (814) | (67) | (2) | — | (890) | ||||||||||||||||||
| Income from financial liabilities for puttable equity instruments (net) | 10 | 305 | 50 | — | — | 365 | ||||||||||||||||||
| Total | 91 | (105) | (11) | 122 | (167) | (70) |
80
Table of Contents
Allianz Group Interim Report Second Quarter and First Half of 2009 Notes to the Condensed Consolidated Interim Financial Statements
Income from financial assets and liabilities held for trading (net)
Life/Health Segment
Income from financial assets and liabilities held for trading for the six months ended June 30, 2009 includes in the Life/Health segment income of € 122 mn (2008: € 412 mn) from derivative financial instruments. This includes expenses of € 108 mn (2008: income of € 525 mn) of German entities from financial derivative positions to protect against equity and foreign exchange rate fluctuations as well as for duration management. Also included is income from US entities amongst others from embedded derivatives required to be separated related to equity-indexed annuity contracts and guaranteed benefits under unit-linked contracts of € 284 mn (2008: expenses of € 207 mn).
Corporate Segment
Income from financial assets and liabilities held for trading for the six months ended June 30, 2009 includes in the Corporate segment income of € 129 mn (2008: expenses of € 55 mn) from derivative financial instruments. This includes income of € 91 mn (2008: € 75 mn) from financial derivatives to protect investments and liabilities against foreign exchange rate fluctuations. Additionally income from financial assets and liabilities held for trading for the six months ended June 30, 2009 includes income of € 31 mn (2008: € 181 mn) from hedges of share based compensation plans (restricted stock units).
25 Realized gains/losses (net)
| Three months ended June 30, | Six months ended June 30, | |||||||||||||||
2009 € mn | 2008 € mn | 2009 € mn | 2008 € mn | |||||||||||||
| Realized gains | ||||||||||||||||
| Available-for-sale investments | ||||||||||||||||
Equity securities | 2,211 | 1,928 | 2,963 | 3,386 | ||||||||||||
Debt securities | 362 | 88 | 869 | 263 | ||||||||||||
Subtotal | 2,573 | 2,016 | 3,832 | 3,649 | ||||||||||||
| Investments in associates and joint ventures 1) | 7 | 2 | 13 | 2 | ||||||||||||
| Real estate held for investment | 15 | 10 | 27 | 175 | ||||||||||||
| Loans to banks and customers | 79 | 26 | 104 | 33 | ||||||||||||
| Subtotal | 2,674 | 2,054 | 3,976 | 3,859 | ||||||||||||
| Realized losses | ||||||||||||||||
| Available-for-sale investments | ||||||||||||||||
Equity securities | (722) | (409) | (1,310) | (969) | ||||||||||||
Debt securities | (328) | (236) | (614) | (321) | ||||||||||||
Subtotal | (1,050) | (645) | (1,924) | (1,290) | ||||||||||||
| Investments in associates and joint ventures 2) | (2) | — | (5) | — | ||||||||||||
| Real estate held for investment | — | 3 | (3) | (94) | ||||||||||||
| Loans to banks and customers | (4) | (10) | (7) | (14) | ||||||||||||
| Subtotal | (1,056) | (652) | (1,939) | (1,398) | ||||||||||||
| Total | 1,618 | 1,402 | 2,037 | 2,461 | ||||||||||||
| 1) | During the three and six months ended June 30, 2009, includes realized gains from the disposal of subsidiaries and businesses of€ 2 mn (2008:€— mn) and€ 2 mn (2008:€— mn) respectively. |
| 2) | During the three and six months ended June 30, 2009 and 2008, includes no realized losses from the disposal of subsidiaries and businesses. |
81
Table of Contents
Notes to the Condensed Consolidated Interim Financial Statements Allianz Group Interim Report Second Quarter and First Half of 2009
| Three months ended June 30, | 2009 | 2008 | ||||||||||||||||||||||
Segment € mn | Consolidation € mn | Group € mn | Segment € mn | Consolidation € mn | Group € mn | |||||||||||||||||||
| Property-Casualty | ||||||||||||||||||||||||
| Fees from credit and assistance business | 177 | (1) | 176 | 184 | (1) | 183 | ||||||||||||||||||
| Service agreements | 90 | (15) | 75 | 109 | (16) | 93 | ||||||||||||||||||
| Investment advisory | 3 | — | 3 | — | — | — | ||||||||||||||||||
| Subtotal | 270 | (16) | 254 | 293 | (17) | 276 | ||||||||||||||||||
| Life/Health | ||||||||||||||||||||||||
| Service agreements | 24 | (8) | 16 | 40 | (11) | 29 | ||||||||||||||||||
| Investment advisory | 97 | (6) | 91 | 126 | (10) | 116 | ||||||||||||||||||
| Other | 1 | (1) | — | 2 | (2) | — | ||||||||||||||||||
| Subtotal | 122 | (15) | 107 | 168 | (23) | 145 | ||||||||||||||||||
| Financial Services | ||||||||||||||||||||||||
Banking | ||||||||||||||||||||||||
Securities business | 8 | (1) | 7 | 34 | (1) | 33 | ||||||||||||||||||
Investment advisory | 31 | (22) | 9 | 42 | (25) | 17 | ||||||||||||||||||
Payment transactions | 14 | — | 14 | 13 | (1) | 12 | ||||||||||||||||||
Other | 34 | (7) | 27 | 26 | 2 | 28 | ||||||||||||||||||
Subtotal | 87 | (30) | 57 | 115 | (25) | 90 | ||||||||||||||||||
Asset Management | ||||||||||||||||||||||||
Management fees | 877 | (25) | 852 | 840 | (33) | 807 | ||||||||||||||||||
Loading and exit fees | 66 | (1) | 65 | 64 | — | 64 | ||||||||||||||||||
Performance fees | 20 | — | 20 | 30 | — | 30 | ||||||||||||||||||
Other | 9 | 1 | 10 | 118 | — | 118 | ||||||||||||||||||
Subtotal | 972 | (25) | 947 | 1,052 | (33) | 1,019 | ||||||||||||||||||
Alternative Investment Management | ||||||||||||||||||||||||
Service agreements | 23 | (20) | 3 | 28 | (17) | 11 | ||||||||||||||||||
Subtotal | 23 | (20) | 3 | 28 | (17) | 11 | ||||||||||||||||||
Consolidation | (23) | 23 | — | (26) | 26 | — | ||||||||||||||||||
| Subtotal | 1,059 | (52) | 1,007 | 1,169 | (49) | 1,120 | ||||||||||||||||||
| Corporate | ||||||||||||||||||||||||
| Service agreements | 64 | (7) | 57 | 20 | (6) | 14 | ||||||||||||||||||
| Other | 1 | — | 1 | 1 | (1) | — | ||||||||||||||||||
| Subtotal | 65 | (7) | 58 | 21 | (7) | 14 | ||||||||||||||||||
| Total | 1,516 | (90) | 1,426 | 1,651 | (96) | 1,555 | ||||||||||||||||||
82
Table of Contents
Allianz Group Interim Report Second Quarter and First Half of 2009 Notes to the Condensed Consolidated Interim Financial Statements
26 Fee and commission income (continued)
| Six months ended June 30, | 2009 | 2008 | ||||||||||||||||||||||
Segment € mn | Consolidation € mn | Group € mn | Segment € mn | Consolidation € mn | Group € mn | |||||||||||||||||||
| Property-Casualty | ||||||||||||||||||||||||
| Fees from credit and assistance business | 356 | (1) | 355 | 355 | (1) | 354 | ||||||||||||||||||
| Service agreements | 180 | (29) | 151 | 205 | (19) | 186 | ||||||||||||||||||
| Investment advisory | 6 | — | 6 | — | — | — | ||||||||||||||||||
| Subtotal | 542 | (30) | 512 | 560 | (20) | 540 | ||||||||||||||||||
| Life/Health | ||||||||||||||||||||||||
| Service agreements | 44 | (15) | 29 | 74 | (14) | 60 | ||||||||||||||||||
| Investment advisory | 194 | (11) | 183 | 260 | (19) | 241 | ||||||||||||||||||
| Other | 3 | (3) | — | 5 | (5) | — | ||||||||||||||||||
| Subtotal | 241 | (29) | 212 | 339 | (38) | 301 | ||||||||||||||||||
| Financial Services | ||||||||||||||||||||||||
Banking | ||||||||||||||||||||||||
Securities business | 13 | (1) | 12 | 62 | (1) | 61 | ||||||||||||||||||
Investment advisory | 60 | (40) | 20 | 90 | (55) | 35 | ||||||||||||||||||
Payment transactions | 26 | — | 26 | 26 | (1) | 25 | ||||||||||||||||||
Other | 64 | (12) | 52 | 70 | (6) | 64 | ||||||||||||||||||
Subtotal | 163 | (53) | 110 | 248 | (63) | 185 | ||||||||||||||||||
Asset Management | ||||||||||||||||||||||||
Management fees | 1,697 | (50) | 1,647 | 1,681 | (60) | 1,621 | ||||||||||||||||||
Loading and exit fees | 125 | (1) | 124 | 130 | — | 130 | ||||||||||||||||||
Performance fees | 34 | — | 34 | 43 | — | 43 | ||||||||||||||||||
Other | 23 | — | 23 | 184 | (1) | 183 | ||||||||||||||||||
Subtotal | 1,879 | (51) | 1,828 | 2,038 | (61) | 1,977 | ||||||||||||||||||
Alternative Investment Management | ||||||||||||||||||||||||
Service agreements | 56 | (44) | 12 | 84 | (49) | 35 | ||||||||||||||||||
Subtotal | 56 | (44) | 12 | 84 | (49) | 35 | ||||||||||||||||||
Consolidation | (44) | 44 | — | (57) | 57 | — | ||||||||||||||||||
| Subtotal | 2,054 | (104) | 1,950 | 2,313 | (116) | 2,197 | ||||||||||||||||||
| Corporate | ||||||||||||||||||||||||
| Service agreements | 98 | (12) | 86 | 31 | (9) | 22 | ||||||||||||||||||
| Other | 2 | — | 2 | 1 | (1) | — | ||||||||||||||||||
| Subtotal | 100 | (12) | 88 | 32 | (10) | 22 | ||||||||||||||||||
| Total | 2,937 | (175) | 2,762 | 3,244 | (184) | 3,060 | ||||||||||||||||||
83
Table of Contents
Notes to the Condensed Consolidated Interim Financial Statements Allianz Group Interim Report Second Quarter and First Half of 2009
| 1) | The presented subtotal for expenses and total income and expenses from fully consolidated private equity investment for the three and six months ended June 30, 2009 differs from the amounts presented in the “consolidated income statements” and in “Total revenues and reconciliation of Operating profit (loss) to Net income (loss)”. This difference is due to a consolidation effect of€ 115 mn. This consolidation effect results from the deferred policyholder participation, recognised on the result from fully consolidated private equity investments within operating profit in the Life/Health segment, that was reclassified into expenses from fully consolidated private equity investments in non-operating profit to ensure a consistent presentation of the group operating profit. |
84
Table of Contents
Allianz Group Interim Report Second Quarter and First Half of 2009 Notes to the Condensed Consolidated Interim Financial Statements
29 Claims and insurance benefits incurred (net)
| Three months ended June 30, | Property- | Life/Health | Consolidation | Group | ||||||||||||
| Casualty € mn | € mn | € mn | € mn | |||||||||||||
| 2009 | ||||||||||||||||
| Gross | ||||||||||||||||
Claims and insurance benefits paid | (6,864) | (4,496) | 3 | (11,357) | ||||||||||||
Change in loss and loss adjustment expenses | (18) | (106) | 1 | (123) | ||||||||||||
Subtotal | (6,882) | (4,602) | 4 | (11,480) | ||||||||||||
| Ceded | ||||||||||||||||
Claims and insurance benefits paid | 434 | 107 | (3) | 538 | ||||||||||||
Change in loss and loss adjustment expenses | (160) | (2) | (1) | (163) | ||||||||||||
Subtotal | 274 | 105 | (4) | 375 | ||||||||||||
| Net | ||||||||||||||||
Claims and insurance benefits paid | (6,430) | (4,389) | — | (10,819) | ||||||||||||
Change in loss and loss adjustment expenses | (178) | (108) | — | (286) | ||||||||||||
Total | (6,608) | (4,497) | — | (11,105) | ||||||||||||
| 2008 | ||||||||||||||||
| Gross | ||||||||||||||||
Claims and insurance benefits paid | (6,576) | (4,529) | 2 | (11,103) | ||||||||||||
Change in loss and loss adjustment expenses | (102) | (108) | — | (210) | ||||||||||||
Subtotal | (6,678) | (4,637) | 2 | (11,313) | ||||||||||||
| Ceded | ||||||||||||||||
Claims and insurance benefits paid | 604 | 89 | (2) | 691 | ||||||||||||
Change in loss and loss adjustment expenses | (173) | 8 | — | (165) | ||||||||||||
Subtotal | 431 | 97 | (2) | 526 | ||||||||||||
| Net | ||||||||||||||||
Claims and insurance benefits paid | (5,972) | (4,440) | — | (10,412) | ||||||||||||
Change in loss and loss adjustment expenses | (275) | (100) | — | (375) | ||||||||||||
Total | (6,247) | (4,540) | — | (10,787) | ||||||||||||
| Six months ended June 30, | Property- | Life/Health | Consolidation | Group | ||||||||||||
| Casualty€ mn | € mn | € mn | € mn | |||||||||||||
| 2009 | ||||||||||||||||
| Gross | ||||||||||||||||
Claims and insurance benefits paid | (14,697) | (9,730) | 8 | (24,419) | ||||||||||||
Change in loss and loss adjustment expenses | 679 | (132) | 1 | 548 | ||||||||||||
Subtotal | (14,018) | (9,862) | 9 | (23,871) | ||||||||||||
| Ceded | ||||||||||||||||
Claims and insurance benefits paid | 1,393 | 234 | (8) | 1,619 | ||||||||||||
Change in loss and loss adjustment expenses | (616) | (15) | (1) | (632) | ||||||||||||
Subtotal | 777 | 219 | (9) | 987 | ||||||||||||
| Net | ||||||||||||||||
Claims and insurance benefits paid | (13,304) | (9,496) | — | (22,800) | ||||||||||||
Change in loss and loss adjustment expenses | 63 | (147) | — | (84) | ||||||||||||
Total | (13,241) | (9,643) | — | (22,884) | ||||||||||||
| 2008 | ||||||||||||||||
| Gross | ||||||||||||||||
Claims and insurance benefits paid | (13,516) | (9,708) | 4 | (23,220) | ||||||||||||
Change in loss and loss adjustment expenses | (20) | (59) | — | (79) | ||||||||||||
Subtotal | (13,536) | (9,767) | 4 | (23,299) | ||||||||||||
| Ceded | ||||||||||||||||
Claims and insurance benefits paid | 1,290 | 230 | (4) | 1,516 | ||||||||||||
Change in loss and loss adjustment expenses | (302) | (16) | — | (318) | ||||||||||||
Subtotal | 988 | 214 | (4) | 1,198 | ||||||||||||
| Net | ||||||||||||||||
Claims and insurance benefits paid | (12,226) | (9,478) | — | (21,704) | ||||||||||||
Change in loss and loss adjustment expenses | (322) | (75) | — | (397) | ||||||||||||
Total | (12,548) | (9,553) | — | (22,101) | ||||||||||||
85
Table of Contents
Notes to the Condensed Consolidated Interim Financial Statements Allianz Group Interim Report Second Quarter and First Half of 2009
30 Change in reserves for insurance and investment contracts (net)
| Three months ended June 30, | Property- Casualty € mn | Life/Health
€ mn | Consolidation
€ mn | Group
€ mn | ||||||||||||
| 2009 | ||||||||||||||||
| Gross | ||||||||||||||||
Aggregate policy reserves | (30) | (1,034) | 1 | (1,063) | ||||||||||||
Other insurance reserves | (40) | (36) | — | (76) | ||||||||||||
Expenses for premium refunds | (65) | (1,407) | (135) | (1,607) | ||||||||||||
Subtotal | (135) | (2,477) | (134) | (2,746) | ||||||||||||
| Ceded | ||||||||||||||||
Aggregate policy reserves | 3 | 22 | — | 25 | ||||||||||||
Other insurance reserves | 36 | 2 | — | 38 | ||||||||||||
Expenses for premium refunds | 1 | (2) | — | (1) | ||||||||||||
Subtotal | 40 | 22 | — | 62 | ||||||||||||
| Net | ||||||||||||||||
Aggregate policy reserves | (27) | (1,012) | 1 | (1,038) | ||||||||||||
Other insurance reserves | (4) | (34) | — | (38) | ||||||||||||
Expenses for premium refunds | (64) | (1,409) | (135) | (1,608) | ||||||||||||
Total | (95) | (2,455) | (134) | (2,684) | ||||||||||||
| 2008 | ||||||||||||||||
| Gross | ||||||||||||||||
Aggregate policy reserves | (67) | (887) | — | (954) | ||||||||||||
Other insurance reserves | 6 | (29) | — | (23) | ||||||||||||
Expenses for premium refunds | (13) | (481) | (8) | (502) | ||||||||||||
Subtotal | (74) | (1,397) | (8) | (1,479) | ||||||||||||
| Ceded | ||||||||||||||||
Aggregate policy reserves | 3 | 5 | 1 | 9 | ||||||||||||
Other insurance reserves | — | 1 | — | 1 | ||||||||||||
Expenses for premium refunds | 1 | 2 | — | 3 | ||||||||||||
Subtotal | 4 | 8 | 1 | 13 | ||||||||||||
| Net | ||||||||||||||||
Aggregate policy reserves | (64) | (882) | 1 | (945) | ||||||||||||
Other insurance reserves | 6 | (28) | — | (22) | ||||||||||||
Expenses for premium refunds | (12) | (479) | (8) | (499) | ||||||||||||
Total | (70) | (1,389) | (7) | (1,466) |
86
Table of Contents
Allianz Group Interim Report Second Quarter and First Half of 2009 Notes to the Condensed Consolidated Interim Financial Statements
30 Change in reserves for insurance and investment contracts (net) (continued)
| Six months ended June 30, | Property- | Life/Health | Consolidation | Group | ||||||||||||
| Casualty € mn | € mn | € mn | € mn | |||||||||||||
| 2009 | ||||||||||||||||
| Gross | ||||||||||||||||
Aggregate policy reserves | (74) | (1,651) | 1 | (1,724) | ||||||||||||
Other insurance reserves | (1) | (20) | — | (21) | ||||||||||||
Expenses for premium refunds | (54) | (1,394) | (141) | (1,589) | ||||||||||||
Subtotal | (129) | (3,065) | (140) | (3,334) | ||||||||||||
| Ceded | ||||||||||||||||
Aggregate policy reserves | 4 | 24 | — | 28 | ||||||||||||
Other insurance reserves | — | 3 | — | 3 | ||||||||||||
Expenses for premium refunds | — | (2) | — | (2) | ||||||||||||
Subtotal | 4 | 25 | — | 29 | ||||||||||||
| Net | ||||||||||||||||
Aggregate policy reserves | (70) | (1,627) | 1 | (1,696) | ||||||||||||
Other insurance reserves | (1) | (17) | — | (18) | ||||||||||||
Expenses for premium refunds | (54) | (1,396) | (141) | (1,591) | ||||||||||||
Total | (125) | (3,040) | (140) | (3,305) | ||||||||||||
| 2008 | ||||||||||||||||
| Gross | ||||||||||||||||
Aggregate policy reserves | (132) | (2,167) | — | (2,299) | ||||||||||||
Other insurance reserves | 3 | (41) | — | (38) | ||||||||||||
Expenses for premium refunds | 28 | (1,004) | (21) | (997) | ||||||||||||
Subtotal | (101) | (3,212) | (21) | (3,334) | ||||||||||||
| Ceded | ||||||||||||||||
Aggregate policy reserves | (14) | 9 | 1 | (4) | ||||||||||||
Other insurance reserves | 7 | 3 | — | 10 | ||||||||||||
Expenses for premium refunds | 9 | 8 | — | 17 | ||||||||||||
Subtotal | 2 | 20 | 1 | 23 | ||||||||||||
| Net | ||||||||||||||||
Aggregate policy reserves | (146) | (2,158) | 1 | (2,303) | ||||||||||||
Other insurance reserves | 10 | (38) | — | (28) | ||||||||||||
Expenses for premium refunds | 37 | (996) | (21) | (980) | ||||||||||||
Total | (99) | (3,192) | (20) | (3,311) | ||||||||||||
| ||||||||||||||||
| Three months ended June 30, | Six months ended June 30, | |||||||||||||||
2009 € mn | 2008 € mn | 2009 € mn | 2008 € mn | |||||||||||||
| Liabilities to banks and customers | (120) | (203) | (258) | (415) | ||||||||||||
| Deposits retained on reinsurance ceded | (15) | (10) | (35) | (36) | ||||||||||||
| Certificated liabilities | (64) | (105) | (140) | (218) | ||||||||||||
| Participating certificates and subordinated liabilities | (139) | (114) | (279) | (222) | ||||||||||||
| Other | (7) | (34) | (43) | (68) | ||||||||||||
| Total | (345) | (466) | (755) | (959) | ||||||||||||
87
Table of Contents
Notes to the Condensed Consolidated Interim Financial Statements Allianz Group Interim Report Second Quarter and First Half of 2009
| Three months ended June 30, | Six months ended June 30, | |||||||||||||||
2009 € mn | 2008 € mn | 2009 € mn | 2008 € mn | |||||||||||||
| Investment management expenses | (106) | (94) | (191) | (198) | ||||||||||||
| Depreciation from real estate held for investment | (39) | (43) | (87) | (86) | ||||||||||||
| Other expenses from real estate held for investment | (42) | (46) | (76) | (73) | ||||||||||||
| Foreign currency gains and losses (net) | ||||||||||||||||
Foreign currency gains | 1,670 | 174 | 4,204 | 484 | ||||||||||||
Foreign currency losses | (1,912) | (150) | (4,217) | (722) | ||||||||||||
Subtotal | (242) | 24 | (13) | (238) | ||||||||||||
| Total | (429) | (159) | (367) | (595) | ||||||||||||
88
Table of Contents
Allianz Group Interim Report Second Quarter and First Half of 2009 Notes to the Condensed Consolidated Interim Financial Statements
35 Acquisition and administrative expenses (net)
| Three months ended June 30, | 2009 | 2008 | ||||||||||||||||||||||
Segment € mn | Consolidation € mn | Group € mn | Segment € mn | Consolidation € mn | Group € mn | |||||||||||||||||||
| Property-Casualty | ||||||||||||||||||||||||
| Acquisition costs | ||||||||||||||||||||||||
Incurred | (1,861) | — | (1,861) | (1,847) | — | (1,847) | ||||||||||||||||||
Commissions and profit received on reinsurance business ceded | 152 | (1) | 151 | 132 | — | 132 | ||||||||||||||||||
Deferrals of acquisition costs | 1,144 | — | 1,144 | 1,005 | — | 1,005 | ||||||||||||||||||
Amortization of deferred acquisition costs | (1,254) | — | (1,254) | (1,053) | — | (1,053) | ||||||||||||||||||
Subtotal | (1,819) | (1) | (1,820) | (1,763) | — | (1,763) | ||||||||||||||||||
| Administrative expenses | (838) | (3) | (841) | (823) | 3 | (820) | ||||||||||||||||||
| Subtotal | (2,657) | (4) | (2,661) | (2,586) | 3 | (2,583) | ||||||||||||||||||
| Life/Health | ||||||||||||||||||||||||
| Acquisition costs | ||||||||||||||||||||||||
Incurred | (891) | 1 | (890) | (892) | — | (892) | ||||||||||||||||||
Commissions and profit received on reinsurance business ceded | 18 | (1) | 17 | 17 | — | 17 | ||||||||||||||||||
Deferrals of acquisition costs | 549 | — | 549 | 572 | — | 572 | ||||||||||||||||||
Amortization of deferred acquisition costs | (916) | — | (916) | (571) | — | (571) | ||||||||||||||||||
Subtotal | (1,240) | — | (1,240) | (874) | — | (874) | ||||||||||||||||||
| Administrative expenses | (391) | 2 | (389) | (411) | (3) | (414) | ||||||||||||||||||
| Subtotal | (1,631) | 2 | (1,629) | (1,285) | (3) | (1,288) | ||||||||||||||||||
| Financial Services | ||||||||||||||||||||||||
| Personnel expenses | (486) | — | (486) | (436) | 2 | (434) | ||||||||||||||||||
| Non-personnel expenses | (328) | 10 | (318) | (289) | 14 | (275) | ||||||||||||||||||
| Subtotal | (814) | 10 | (804) | (725) | 16 | (709) | ||||||||||||||||||
| Corporate | ||||||||||||||||||||||||
| Administrative expenses | (122) | 4 | (118) | (125) | 1 | (124) | ||||||||||||||||||
| Subtotal | (122) | 4 | (118) | (125) | 1 | (124) | ||||||||||||||||||
| Total | (5,224) | 12 | (5,212) | (4,721) | 17 | (4,704) | ||||||||||||||||||
89
Table of Contents
Notes to the Condensed Consolidated Interim Financial Statements Allianz Group Interim Report Second Quarter and First Half of 2009
35 Acquisition and administrative expenses (net) (continued)
| Six months ended June 30, | 2009 | 2008 | ||||||||||||||||||||||
Segment € mn | Consolidation € mn | Group € mn | Segment € mn | Consolidation € mn | Group € mn | |||||||||||||||||||
| Property-Casualty | ||||||||||||||||||||||||
| Acquisition costs | ||||||||||||||||||||||||
Incurred | (4,095) | — | (4,095) | (3,987) | — | (3,987) | ||||||||||||||||||
Commissions and profit received on reinsurance business ceded | 246 | (2) | 244 | 348 | (1) | 347 | ||||||||||||||||||
Deferrals of acquisition costs | 2,610 | — | 2,610 | 2,456 | — | 2,456 | ||||||||||||||||||
Amortization of deferred acquisition costs | (2,330) | — | (2,330) | (2,167) | — | (2,167) | ||||||||||||||||||
Subtotal | (3,569) | (2) | (3,571) | (3,350) | (1) | (3,351) | ||||||||||||||||||
| Administrative expenses | (1,663) | 5 | (1,658) | (1,690) | 12 | (1,678) | ||||||||||||||||||
| Subtotal | (5,232) | 3 | (5,229) | (5,040) | 11 | (5,029) | ||||||||||||||||||
| Life/Health | ||||||||||||||||||||||||
| Acquisition costs | ||||||||||||||||||||||||
Incurred | (1,855) | 2 | (1,853) | (1,875) | 1 | (1,874) | ||||||||||||||||||
Commissions and profit received on reinsurance business ceded | 38 | (1) | 37 | 42 | — | 42 | ||||||||||||||||||
Deferrals of acquisition costs | 1,105 | — | 1,105 | 1,192 | — | 1,192 | ||||||||||||||||||
Amortization of deferred acquisition costs | (1,601) | — | (1,601) | (939) | — | (939) | ||||||||||||||||||
Subtotal | (2,313) | 1 | (2,312) | (1,580) | 1 | (1,579) | ||||||||||||||||||
| Administrative expenses | (747) | 7 | (740) | (821) | 1 | (820) | ||||||||||||||||||
| Subtotal | (3,060) | 8 | (3,052) | (2,401) | 2 | (2,399) | ||||||||||||||||||
| Financial Services | ||||||||||||||||||||||||
| Personnel expenses | (890) | — | (890) | (940) | 2 | (938) | ||||||||||||||||||
| Non-personnel expenses | (591) | 18 | (573) | (565) | 14 | (551) | ||||||||||||||||||
| Subtotal | (1,481) | 18 | (1,463) | (1,505) | 16 | (1,489) | ||||||||||||||||||
| Corporate | ||||||||||||||||||||||||
| Administrative expenses | (274) | (3) | (277) | (239) | 6 | (233) | ||||||||||||||||||
| Subtotal | (274) | (3) | (277) | (239) | 6 | (233) | ||||||||||||||||||
| Total | (10,047) | 26 | (10,021) | (9,185) | 35 | (9,150) | ||||||||||||||||||
90
Table of Contents
Allianz Group Interim Report Second Quarter and First Half of 2009 Notes to the Condensed Consolidated Interim Financial Statements
36 Fee and commission expenses
| Three months ended June 30, | 2009 | 2008 | ||||||||||||||||||||||
Segment € mn | Consolidation € mn | Group € mn | Segment € mn | Consolidation € mn | Group € mn | |||||||||||||||||||
| Property-Casualty | ||||||||||||||||||||||||
| Fees from credit and assistance business | (125) | — | (125) | (155) | — | (155) | ||||||||||||||||||
| Service agreements | (104) | 15 | (89) | (93) | 2 | (91) | ||||||||||||||||||
| Subtotal | (229) | 15 | (214) | (248) | 2 | (246) | ||||||||||||||||||
| Life/Health | ||||||||||||||||||||||||
| Service agreements | (13) | 5 | (8) | (23) | 14 | (9) | ||||||||||||||||||
| Investment advisory | (39) | (4) | (43) | (47) | 3 | (44) | ||||||||||||||||||
| Subtotal | (52) | 1 | (51) | (70) | 17 | (53) | ||||||||||||||||||
| Financial Services | ||||||||||||||||||||||||
Banking | ||||||||||||||||||||||||
Securities business | (2) | — | (2) | (2) | — | (2) | ||||||||||||||||||
Investment advisory | — | — | — | (37) | — | (37) | ||||||||||||||||||
Payment transactions | (3) | — | (3) | (2) | — | (2) | ||||||||||||||||||
Other | (39) | — | (39) | (10) | 1 | (9) | ||||||||||||||||||
Subtotal | (44) | — | (44) | (51) | 1 | (50) | ||||||||||||||||||
Asset Management | ||||||||||||||||||||||||
Commissions | (213) | 34 | (179) | (214) | 83 | (131) | ||||||||||||||||||
Other | (7) | 1 | (6) | (117) | 5 | (112) | ||||||||||||||||||
Subtotal | (220) | 35 | (185) | (331) | 88 | (243) | ||||||||||||||||||
Alternative Investment Management | ||||||||||||||||||||||||
Service agreements | (3) | — | (3) | 2 | — | 2 | ||||||||||||||||||
Subtotal | (3) | — | (3) | 2 | — | 2 | ||||||||||||||||||
Consolidation | 22 | (22) | — | 27 | (27) | — | ||||||||||||||||||
| Subtotal | (245) | 13 | (232) | (353) | 62 | (291) | ||||||||||||||||||
| Corporate | ||||||||||||||||||||||||
| Service agreements | (63) | 8 | (55) | (2) | — | (2) | ||||||||||||||||||
| Subtotal | (63) | 8 | (55) | (2) | — | (2) | ||||||||||||||||||
| Total | (589) | 37 | (552) | (673) | 81 | (592) | ||||||||||||||||||
91
Table of Contents
Notes to the Condensed Consolidated Interim Financial Statements Allianz Group Interim Report Second Quarter and First Half of 2009
36 Fee and commission expenses (continued)
| Six months ended June 30, | 2009 | 2008 | ||||||||||||||||||||||
Segment € mn | Consolidation € mn | Group € mn | Segment €mn | Consolidation € mn | Group € mn | |||||||||||||||||||
| Property-Casualty | ||||||||||||||||||||||||
| Fees from credit and assistance business | (266) | — | (266) | (293) | — | (293) | ||||||||||||||||||
| Service agreements | (197) | 27 | (170) | (203) | 3 | (200) | ||||||||||||||||||
| Subtotal | (463) | 27 | (436) | (496) | 3 | (493) | ||||||||||||||||||
| Life/Health | ||||||||||||||||||||||||
| Service agreements | (23) | 9 | (14) | (43) | 18 | (25) | ||||||||||||||||||
| Investment advisory | (93) | 2 | (91) | (87) | 8 | (79) | ||||||||||||||||||
| Subtotal | (116) | 11 | (105) | (130) | 26 | (104) | ||||||||||||||||||
| Financial Services | ||||||||||||||||||||||||
Banking | ||||||||||||||||||||||||
Securities business | (3) | — | (3) | (4) | — | (4) | ||||||||||||||||||
Investment advisory | (29) | — | (29) | (75) | — | (75) | ||||||||||||||||||
Payment transactions | (6) | — | (6) | (3) | — | (3) | ||||||||||||||||||
Other | (47) | — | (47) | (28) | 2 | (26) | ||||||||||||||||||
Subtotal | (85) | — | (85) | (110) | 2 | (108) | ||||||||||||||||||
Asset Management | ||||||||||||||||||||||||
Commissions | (406) | 64 | (342) | (426) | 167 | (259) | ||||||||||||||||||
Other | (12) | 1 | (11) | (185) | 9 | (176) | ||||||||||||||||||
Subtotal | (418) | 65 | (353) | (611) | 176 | (435) | ||||||||||||||||||
Alternative Investment Management | ||||||||||||||||||||||||
Service agreements | (6) | 1 | (5) | — | — | — | ||||||||||||||||||
Subtotal | (6) | 1 | (5) | — | — | — | ||||||||||||||||||
Consolidation | 43 | (43) | — | 57 | (57) | — | ||||||||||||||||||
| Subtotal | (466) | 23 | (443) | (664) | 121 | (543) | ||||||||||||||||||
| Corporate | ||||||||||||||||||||||||
| Service agreements | (71) | 12 | (59) | (3) | — | (3) | ||||||||||||||||||
| Subtotal | (71) | 12 | (59) | (3) | — | (3) | ||||||||||||||||||
| Total | (1,116) | 73 | (1,043) | (1,293) | 150 | (1,143) | ||||||||||||||||||
| Three months ended June 30, | Six months ended June 30, | |||||||||||||||
2009 € mn | 2008 € mn | 2009 € mn | 2008 € mn | |||||||||||||
| Current income tax | (556) | (345) | (713) | (741) | ||||||||||||
| Deferred income tax | 109 | (164) | 245 | (340) | ||||||||||||
| Total | (447) | (509) | (468) | (1,081) | ||||||||||||
For the three and the six months ended June 30, 2009 and 2008 the income taxes relating to components of the other comprehensive income consist of the following:
| Three months ended June 30, | Six months ended June 30, | |||||||||||||||
2009 € mn | 2008 € mn | 2009 € mn | 2008 € mn | |||||||||||||
| Foreign currency translation adjustments | (32) | 2 | (1) | (12) | ||||||||||||
| Available for sale investments | (698) | 706 | (288) | 1,073 | ||||||||||||
| Cash flow hedges | (4) | 4 | 9 | (10) | ||||||||||||
| Share of other comprehensive income of associates | — | 4 | 1 | 4 | ||||||||||||
| Miscellaneous | — | (2) | 3 | — | ||||||||||||
| Total | (734) | 714 | (276) | 1,055 | ||||||||||||
92
Table of Contents
Allianz Group Interim Report Second Quarter and First Half of 2009 Notes to the Condensed Consolidated Interim Financial Statements
Basic earnings per share
Basic earnings per share are calculated by dividing net
income by the weighted average number of common
shares outstanding for the period.
| Three months ended June 30, | Six months ended June 30, | |||||||||||||||
2009 € mn | 2008 € mn | 2009 € mn | 2008 € mn | |||||||||||||
| Net income (loss) used to calculate basic earnings per share | 1,869 | 1,542 | 1,898 | 2,690 | ||||||||||||
from continuing operations | 1,869 | 2,225 | 2,293 | 3,605 | ||||||||||||
from discontinued operations | — | (683) | (395) | (915) | ||||||||||||
| Weighted average number of common shares outstanding | 451,024,346 | 448,412,817 | 451,360,017 | 449,818,651 | ||||||||||||
| Basic earnings per share (in€) | 4.14 | 3.44 | 4.21 | 5.98 | ||||||||||||
from continuing operations | 4.14 | 4.96 | 5.08 | 8.01 | ||||||||||||
from discontinued operations | — | (1.52) | (0.87) | (2.03) | ||||||||||||
Diluted earnings per share
Diluted earnings per share are calculated by dividing net income by the weighted average number of common shares outstanding for the period, both adjusted for the effects of potentially dilutive common shares. Potentially dilutive
common shares arise from the assumed conversion of participation certificates issued by Allianz SE, warrants issued by Allianz SE and share-based compensation plans, as well as from the conversion of derivatives on own shares.
| Three months ended June 30, | Six months ended June 30, | |||||||||||||||
2009 € mn | 2008 € mn | 2009 € mn | 2008 € mn | |||||||||||||
| Net income | 1,869 | 1,542 | 1,898 | 2,690 | ||||||||||||
| Effect of potential dilutive common shares | 2 | (10) | (4) | (32) | ||||||||||||
| Net income (loss) used to calculate diluted earnings per share | 1,871 | 1,532 | 1,894 | 2,658 | ||||||||||||
from continuing operations | 1,871 | 2,215 | 2,289 | 3,573 | ||||||||||||
from discontinued operations | — | (683) | (395) | (915) | ||||||||||||
| Weighted average number of common shares outstanding | 451,024,346 | 448,412,817 | 451,360,017 | 449,818,651 | ||||||||||||
| Potentially dilutive common shares resulting from assumed conversion of: | ||||||||||||||||
Participation certificates | 1,469,443 | 1,469,443 | 1,469,443 | 1,469,443 | ||||||||||||
Warrants | — | — | — | 140,715 | ||||||||||||
Share-based compensation plans | 909,844 | 1,178,270 | 1,372,452 | 1,664,019 | ||||||||||||
Derivatives on own shares | — | 935,570 | — | 1,322,705 | ||||||||||||
Subtotal | 2,379,287 | 3,583,283 | 2,841,895 | 4,596,882 | ||||||||||||
| Weighted average number of common shares outstanding after assumed conversion | 453,403,633 | 451,996,100 | 454,201,912 | 454,415,533 | ||||||||||||
| Diluted earnings per share (in€) | 4.13 | 3.39 | 4.17 | 5.85 | ||||||||||||
from continuing operations | 4.13 | 4.90 | 5.04 | 7.86 | ||||||||||||
from discontinued operations | — | (1.51) | (0.87) | (2.01) | ||||||||||||
For the six months ended June 30, 2009, the weighted
average number of common shares excludes 1,689,983
(2008: 1,975,305) treasury shares.
93
Table of Contents
Notes to the Condensed Consolidated Interim Financial Statements Allianz Group Interim Report Second Quarter and First Half of 2009
39 Supplemental information on the condensed consolidated statements of cash flows
| Six months ended June 30, | 2009
€ mn | 2008
€ mn | ||||||
| Income taxes paid | (313) | (1,604) | ||||||
| Dividends received | 591 | 1,384 | ||||||
| Interest received | 8,053 | 11,671 | ||||||
| Interest paid | (1,022) | (4,359) | ||||||
| Significant non-cash transactions | ||||||||
Settlement of exchangeable bonds issued by Allianz Finance II B.V. for shares | ||||||||
Available-for-sale investments | — | (450) | ||||||
Certificated liabilities | — | (450) | ||||||
Novation of quota share reinsurance agreement | ||||||||
Reinsurance assets | — | (29) | ||||||
Deferred acquisition costs | — | 1 | ||||||
Payables from reinsurance contracts | — | (28) | ||||||
Effects from first consolidation of K2 | ||||||||
Financial assets held for trading | — | 107 | ||||||
Financial assets designated at fair value through income | — | 8,665 | ||||||
Loans and advances to banks and customers | — | 1,714 | ||||||
Other assets | — | 51 | ||||||
Financial liabilities held for trading | — | 497 | ||||||
Financial liabilities designated at fair value through income | — | 8,889 | ||||||
Liabilities to banks and customers | — | 1,076 | ||||||
Other liabilities | — | 75 | ||||||
Effects from deconsolidation of Dresdner Bank | ||||||||
Commerzbank shares | ||||||||
Available-for-sale investments | 746 | — | ||||||
Assets of disposal groups held for sale | (746) | — | ||||||
Distribution channel | ||||||||
Intangible assets | 480 | — | ||||||
Assets of disposal groups held for sale | (480) | — | ||||||
Cominvest | ||||||||
Available-for-sale investments | 179 | — | ||||||
Loans and advances to banks and customers | 7 | — | ||||||
Deferred tax assets | 6 | — | ||||||
Intangible assets | 602 | — | ||||||
Property and equipment | 3 | — | ||||||
Other assets | 38 | — | ||||||
Assets of disposal groups held for sale | (835) | — | ||||||
Liabilities to banks and customers | 1 | — | ||||||
Deferred tax liabilities | (1) | — | ||||||
Certificated liabilities, participation certificates and subordinated liabilities | (50) | — | ||||||
Other liabilities | (133) | — | ||||||
Liabilities of disposal groups held for sale | 183 | — |
The transfer of ownership of Dresdner Bank to Commerz-bank was completed on January 12, 2009. According to the agreement Allianz received a total of € 3.215 bn in cash plus cash and cash equivalents of the Asset Manager cominvest of € 48 mn. The impact of the disposal, net of cash disposed, on the consolidated statement of cash flows for the six months ended June 30, 2009 was:
January 12, € mn | ||||
| Assets of disposal groups held for sale | 417,874 | |||
| less: cash and cash equivalents | (30,238) | |||
| Liabilities of disposal groups held for sale | (410,469) | |||
| Minority interests | (1,738) | |||
| Treasury shares | 69 | |||
| less non-cash components of the consideration received: | ||||
Commerzbank shares | (746) | |||
Distribution agreement | (480) | |||
Cominvest (net of cash acquired) | (652) | |||
Consolidation | (595) | |||
| Disposal of subsidiary, net of cash disposed | (26,975) |
On 29 June 2009, the Allianz Group obtained control of the Thai life insurance company Ayudhya Allianz C.P. Life Public Company Limited, Bangkok, by appointing the majority of the members of the board of directors. The impact of the acquisition, net of cash acquired, on the condensed consolidated statement of cash flows for the six months ended June 30, 2009 was:
As of June 30, € mn | ||||
| Investments | (1,714) | |||
| Deferred acquisiton costs (PVFP) | (236) | |||
| Other assets | (89) | |||
| Unearned premiums | 5 | |||
| Reserves for loss and loss adjustments | 1,973 | |||
| Other liabilities | 26 | |||
| Minority interests | 41 | |||
| Less: previous investments in Ayudhya | 71 | |||
| Acquisition of subsidiary, net of cash acquired | 77 |
94
Table of Contents
Allianz Group Interim Report Second Quarter and First Half of 2009 Notes to the Condensed Consolidated Interim Financial Statements
Number of employees
As of June 30, 2009 | As of December 31, | |||||||
| Germany | 49,654 | 71,267 | ||||||
| Other countries | 106,115 | 111,598 | ||||||
| Total | 155,769 | 182,865 1) |
| 1) | Includes 27,597 employees of discontinued operations of Dresdner Bank. |
Placement of a senior bond with a volume of€ 1.5 bn
On July 15, 2009 Allianz Finance II B.V., a fully consolidated subsidiary of the Allianz SE, placed a senior bond with a volume of € 1.5 bn on the capital market to institutional Euro-investors. The senior bond has a maturity of 10 years and a fixed coupon of 4.75 %.
Munich, August 6, 2009
Allianz SE
The Board of Management

95
Table of Contents
Responsibility statement Allianz Group Interim Report Second Quarter and First Half of 2009
To the best of our knowledge, and in accordance with the applicable reporting principles for interim financial reporting, the condensed consolidated interim financial statements give a true and fair view of the assets, liabilities, financial position and profit or loss of the group, and the interim group management report includes a fair review of the development and performance of the business and the position of the group, together with a description of the principal opportunities and risks associated with the expected development of the group for the remaining months of the financial year.
Munich, August 6, 2009
Allianz SE
The Board of Management

96
Table of Contents
Allianz Group Interim Report Second Quarter and First Half of 2009 Review report
To Allianz SE, Munich
We have reviewed the condensed consolidated interim financial statements of the Allianz SE, Munich – comprising the consolidated balance sheet, consolidated income statement, consolidated statement of comprehensive income, condensed consolidated statement of cash flow, consolidated statement of changes in equity and selected explanatory notes - together with the interim group management report of the Allianz SE, Munich for the period from January 1 to June 30, 2009 that are part of the quarterly financial report according to § 37 w WpHG [“Wertpapier-handelsgesetz”: “German Securities Trading Act”]. The preparation of the condensed consolidated interim financial statements in accordance with those IFRS applicable to interim financial reporting as adopted by the EU and in accordance with the IFRS for interim financial reporting as issued by the International Accounting Standards Board (IASB), and of the interim group management report in accordance with the requirements of the WpHG applicable to interim group management reports, is the responsibility of the Company’s management. Our responsibility is to issue a report on the condensed consolidated interim financial statements and on the interim group management report based on our review.
We performed our review of the condensed consolidated interim financial statements and the interim group management report in accordance with the German generally accepted standards for the review of financial statements promulgated by the Institut der Wirtschaftsprüfer (IDW). Those standards require that we plan and perform the review so that we can preclude through critical evaluation, with a certain level of assurance, that the condensed consolidated interim financial statements have not been prepared, in material aspects, in accordance with the IFRS
applicable to interim financial reporting as adopted by the EU and in accordance with the IFRS for interim financial reporting as issued by the IASB, and that the interim group management report has not been prepared, in material aspects, in accordance with the requirements of the WpHG applicable to interim group management reports. A review is limited primarily to inquiries of company employees and analytical assessments and therefore does not provide the assurance attainable in a financial statement audit. Since, in accordance with our engagement, we have not performed a financial statement audit, we cannot issue an auditor’s report.
Based on our review, no matters have come to our attention that cause us to presume that the condensed consolidated interim financial statements have not been prepared, in material respects, in accordance with the IFRS applicable to interim financial reporting as adopted by the EU and in accordance with the IFRS for interim financial reporting as issued by the IASB, or that the interim group management report has not been prepared, in material respects, in accordance with the requirements of the WpHG applicable to interim group management reports.
Munich, August 7, 2009
KPMG AG
Wirtschaftsprüfungsgesellschaft
 |  | |
| Dr. Frank Ellenbürger | Johannes Pastor | |
| Wirtschaftsprüfer | Wirtschaftsprüfer | |
| (Independent Auditor) | (Independent Auditor) |
97
Table of Contents
Allianz SE
Koeniginstrasse 28
80802 Muenchen
Germany
Telephone +49 89 38 00 0
Telefax +49 89 38 00 3425
info@allianz.com
www.allianz.com
Interim Report on the Internet
www.allianz.com/interim-report
Table of Contents
SIGNATURE
Pursuant to the requirements of the Securities Exchange Act of 1934, the registrant has duly caused this report to be signed on its behalf by the undersigned, thereunto duly authorized.
Date: August 7, 2009
| ALLIANZ SE | ||||
| By | /s/ Burkhard Keese | |||
| Name: | Burkhard Keese | |||
| Title: | Executive Vice President Group Financial Reporting | |||
| ALLIANZ SE | ||||
| By | /s/ Harold Michael Langley-Poole | |||
| Name: | Harold Michael Langley-Poole | |||
| Title: | Head of Group Management Reporting | |||