Exhibit 99.1

Exhibit 99.1

ProAssurance Investor Briefing | February 2020 2 The Latest NewsAppendix PRA Overview3-9Capital Management79-81 Topics of Importance & Key Themes10-13Investment Strategy82 Financial / Operating Performance14-20Net Investment Result83 PRA Performance vs. Benchmark84 Segment-Specific DiscussionDetailed Breakout of Investments85-90 Specialty P&C Operating Highlights21-27Tax Credits91 Specialty P&C Strategic Update28-40Change in capital92 NORCAL Acquisition Details51-50Ceded Premiums93 Workers' Compensation Operating Highlights41-57 Workers' Compensation Strategic Update58-62Safe Harbor & Non-GAAP Notices94 Segregated Portfolio Cell Operating Highlights63-68 Segregated Portfolio Cell Strategic Update69-73 Lloyd's Operating Highlights74-77 Table of Contents

rview ProAssuranceOve

ProAssurance Investor Briefing | February 2020 4 The ProAssurance Mission We exist to Protect Others. Our Shared Vision We will be the best in the world at understanding and providing solutions for the risks our customers encounter as healers, innovators, employers, and professionals. Through an integrated family of companies, products, and services, we will be a trusted partner enabling those we serve to focus on their vital work. As the employer of choice, we embrace every day as a singular opportunity to reach for extraordinary outcomes, build and deepen superior relationships, and accomplish our mission with infectious enthusiasm and unbending integrity. Corporate Values Integrity | Leadership | Relationships | Enthusiasm Mission, Vision, & Values
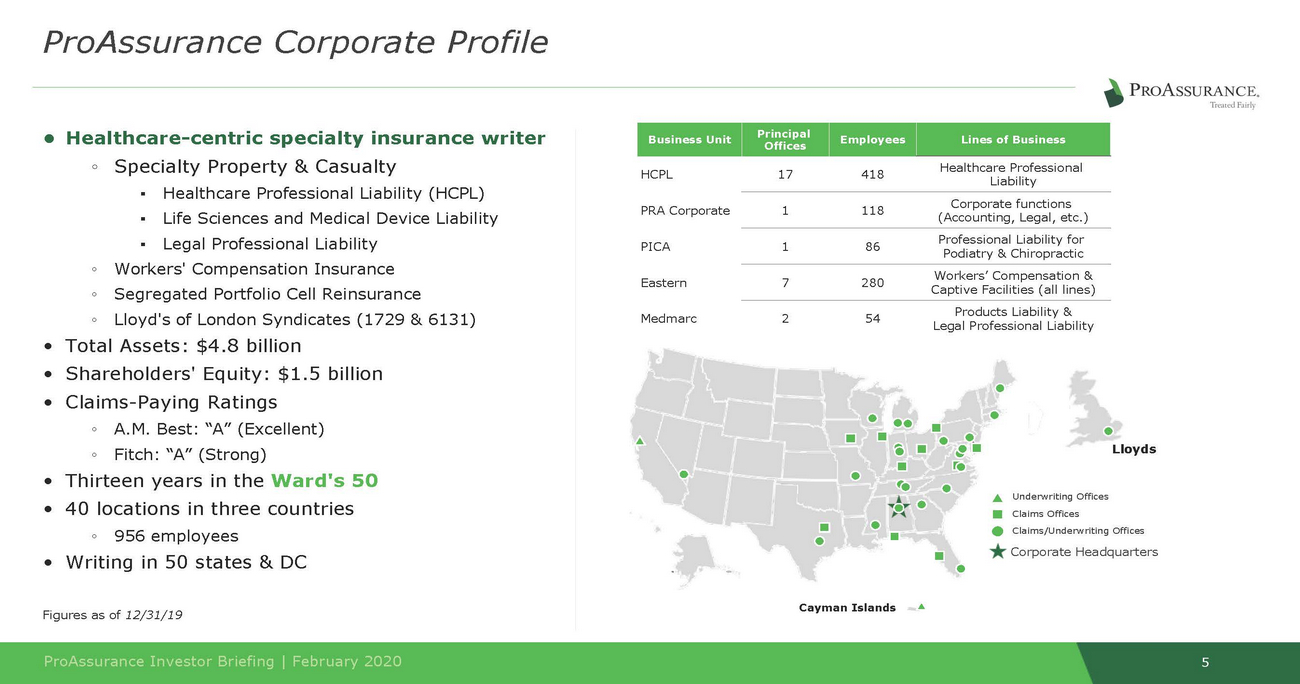
Liability 1 118 (Accounting, Legal, etc.) Podiatry & Chiropractic Captive Facilities (all lines) Legal Professional Liability ProAssurance Investor Briefing | February 2020 5 Cayman Islands Underwriting Offices laims Offices laims/Underwriting Offices orporate Headquarters Lloyds C C C • Total Assets: $4.8 billion • Shareholders' Equity: $1.5 billion • Claims-Paying Ratings ◦A.M. Best: “A” (Excellent) ◦Fitch: “A” (Strong) • Thirteen years in the Ward's 50 • 40 locations in three countries ◦956 employees • Writing in 50 states & DC Figures as of 12/31/19 ProAssurance Corporate Profile • Healthcare-centric specialty insurance writer ◦Specialty Property & Casualty ▪Healthcare Professional Liability (HCPL) ▪Life Sciences and Medical Device Liability ▪Legal Professional Liability ◦Workers' Compensation Insurance ◦Segregated Portfolio Cell Reinsurance ◦Lloyd's of London Syndicates (1729 & 6131) Business Unit Principal Offices Employees Lines of Business HCPL PRA Corporate PICA Eastern Medmarc 17418Healthcare Professional Corporate functions 186Professional Liability for 7280Workers’ Compensation & 254Products Liability &
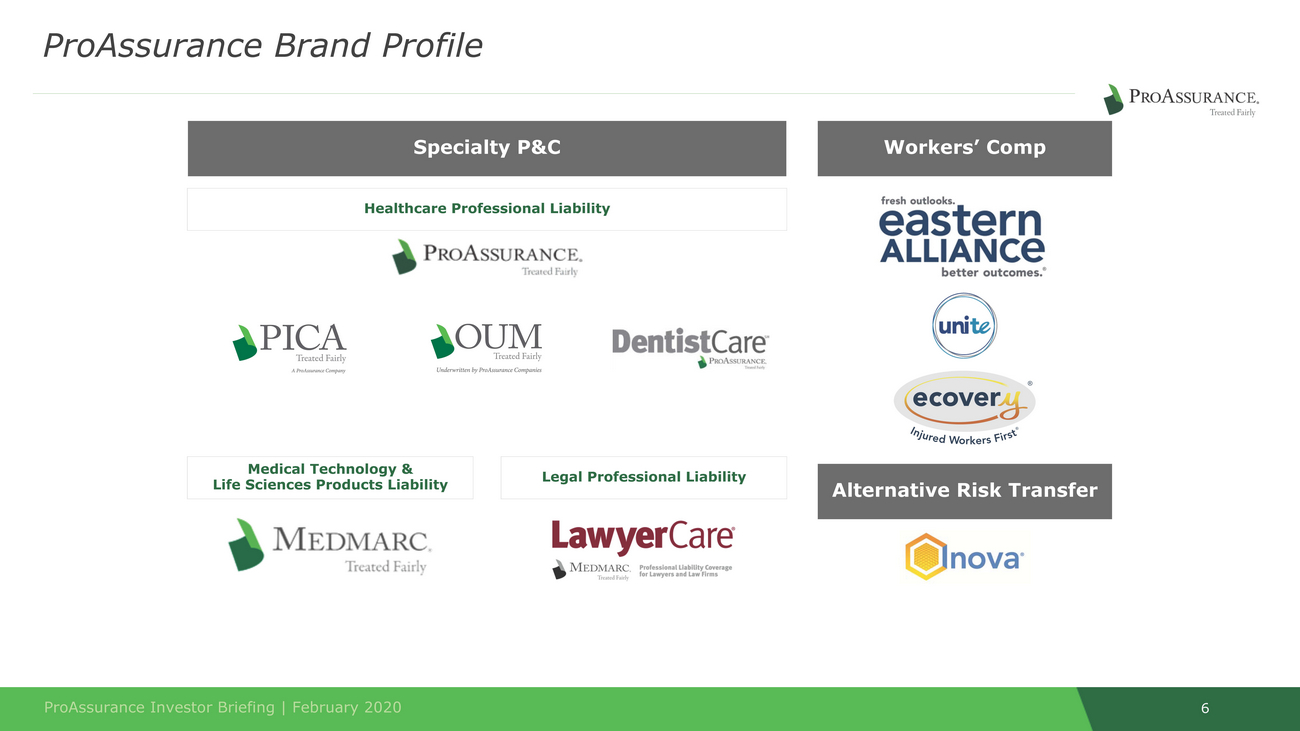
ProAssurance Investor Briefing | February 2020 6 Alternative Risk Transfer Legal Professional Liability Medical Technology & Life Sciences Products Liability Healthcare Professional Liability ProAssurance Brand Profile Workers’ Comp Specialty P&C

General Counsel Insurance Group Executive Team bios available on our website at https://investor.proassurance.com/OD ProAssurance Investor Briefing | February 2020 7 Jeff Lisenby Executive Vice President & Kevin Shook President Eastern Alliance Noreen Dishart Chief Human Resources Officer Dana Hendricks Chief Financial Officer Mike Boguski President Specialty P&C Ned Rand - President & Chief Executive Officer Mr. Rand, who assumed this position at ProAssurance on July 1, 2019, was formerly Chief Operating Officer, and has served as Chief Financial Officer, Executive Vice President, and Senior Vice President of Finance since joining ProAssurance in November of 2004. Prior to joining ProAssurance, Mr. Rand was Chief Accounting Officer and Head of Corporate Finance for PartnerRe Ltd. from 2000 - 2004. He also served as the Chief Financial Officer of Atlantic American Corporation from 1996 - 2000 and Controller of United Capitol Insurance Company from 1992 - 1996. Prior to that time, Mr. Rand was employed by Coopers & Lybrand (now PriceWaterhouseCoopers) for four years. Mr. Rand is a certified public accountant and is a graduate of Davidson College where he majored in Economics. ProAssurance Executive Leadership
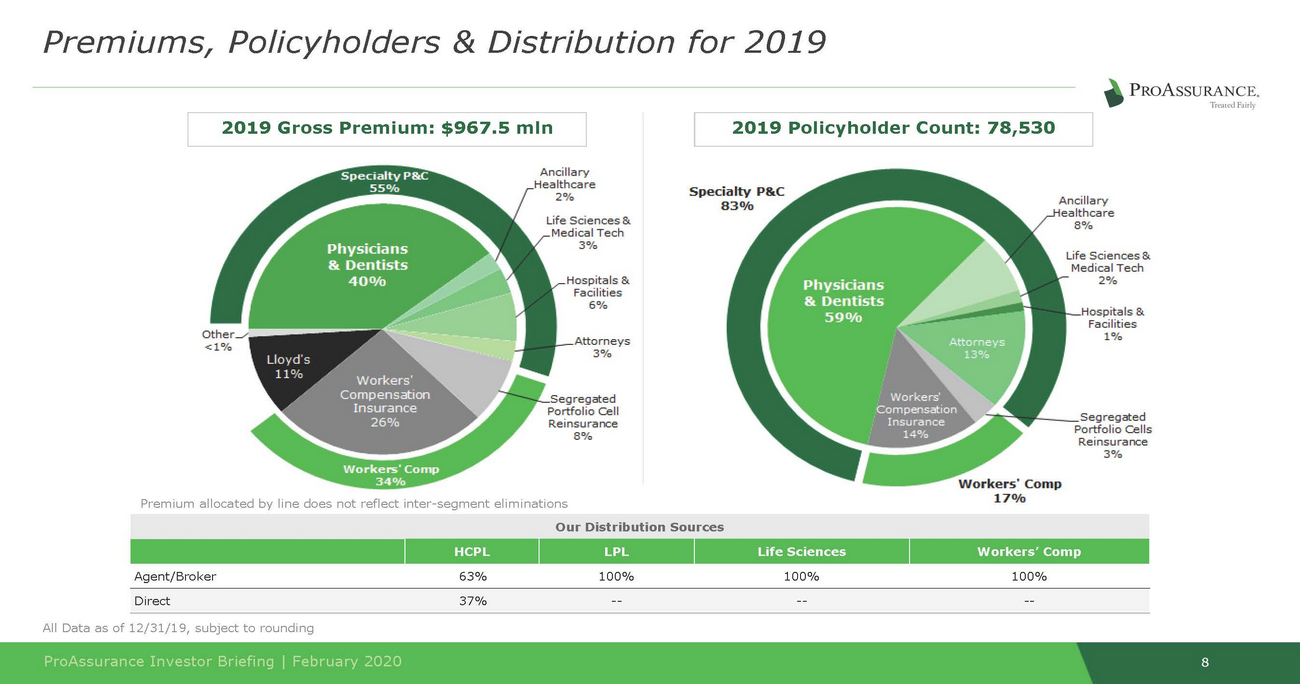
ProAssurance Investor Briefing | February 2020 8 All Data as of 12/31/19, subject to rounding Premium allocated by line does not reflect inter-segment eliminations Our Distribution Sources HCPL LPL Life Sciences Workers’ Comp Agent/Broker63%100%100%100% Direct37%------Premiums, Policyholders & Distribution for 2019 2019 Policyholder Count: 78,530 2019 Gross Premium: $967.5 mln

• Lloyd’s Syndicates ◦ ◦ Regulators are focused on excess capital and prudent business plans Signs of pricing improvement in recent renewal rounds ProAssurance Investor Briefing | February 2020 9 The Current State of the Markets We Serve • Healthcare Professional Liability (HCPL) ◦Broader market is catching up to our perception of severity trends ▪Social inflation and worsening severity trends continue to feature heavily in market participants' earnings remarks for 2019 ◦Signs of developing severity and greater scrutiny from regulators and rating agencies should bring rationality back to the market • Workers’ Compensation Insurance ◦Expanding economy and specialization fueling business gains and offsetting business lost to price competition ◦Increased claims severity as strong economy results in the hiring of less experienced workers ◦Pricing pressure may cause multi-line carriers to scale back • Segregated Portfolio Cell Reinsurance ◦Competitive market conditions and severity trends in our SPC captive business consistent with HCPL and Workers' Compensation Insurance ▪Opportunities for expansion of healthcare-centric captives offering both lines ◦Increased competition from multi-line captives leveraging workers' compensation insurance to offset losses in commercial auto and general liability

KeyThemes TopicsofImportanceand
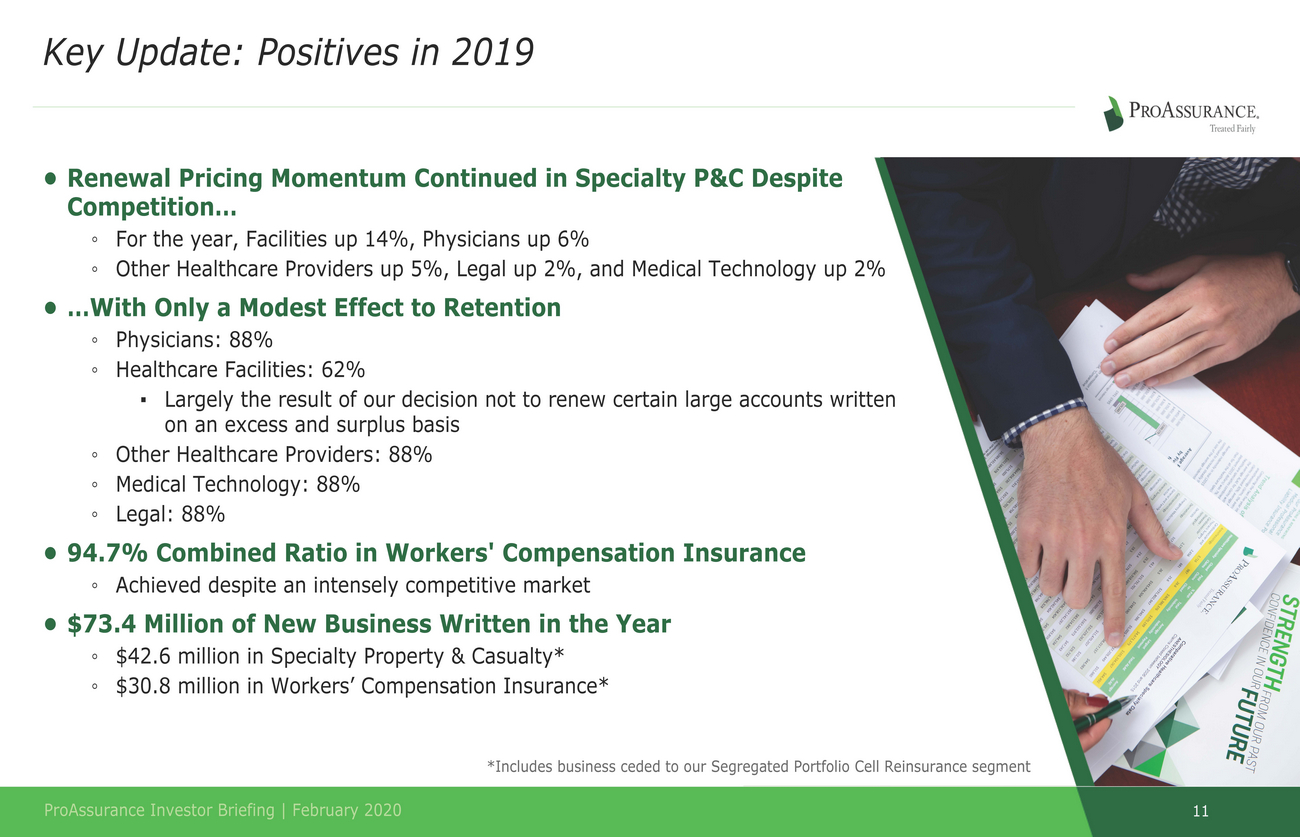
11 ProAssurance Investor Briefing | February 2020 *Includes business ceded to our Segregated Portfolio Cell Reinsurance segment Key Update: Positives in 2019 • Renewal Pricing Momentum Continued in Specialty P&C Despite Competition… ◦For the year, Facilities up 14%, Physicians up 6% ◦Other Healthcare Providers up 5%, Legal up 2%, and Medical Technology up 2% • …With Only a Modest Effect to Retention ◦Physicians: 88% ◦Healthcare Facilities: 62% ▪Largely the result of our decision not to renew certain large accounts written on an excess and surplus basis ◦Other Healthcare Providers: 88% ◦Medical Technology: 88% ◦Legal: 88% • 94.7% Combined Ratio in Workers' Compensation Insurance ◦Achieved despite an intensely competitive market • $73.4 Million of New Business Written in the Year ◦$42.6 million in Specialty Property & Casualty* ◦$30.8 million in Workers’ Compensation Insurance*
12 ProAssurance Investor Briefing | February 2020 Confronting the Challenges Ahead • Maintaining Caution as Loss Trends Develop in HCPL ◦Our caution is prompted by our own experience and the general industry outlook ◦Increasing current accident year loss picks to protect insureds, investors, and our balance sheet for the long-term • Responding to Adverse Loss Trends ◦Increasing market discipline allows us to add new HCPL business at higher rates ◦Tightening our underwriting criteria, terms and conditions, and price strengthening ◦Specialization in profitable markets and businesses provides an avenue for growth in Workers’ Compensation • Balancing Competing Capital Needs ◦Our planned acquisition of NORCAL Group (announced February 20, 2020) allows us to deploy available excess capital ◦Developing loss trends cause us to hold more capital • Managing Exposure to our Lloyd’s Investment ◦Reduced exposure down to 29% from 61% for the 2020 underwriting year ▪Due to the one quarter lag, this will be reflected in our second quarter 2020 results
Strategy 13 ProAssurance Investor Briefing | February 2020 •Successfully adapting to serve evolving risks through new distribution partners •Coverages that span the broad spectrum of healthcare and related risks •Dedicated to creating long-term value Forward Thinking •World class knowledge & expertise •Superior brand identity and reputation in the market •Broad range of coverages address every significant need in our target markets •Strong claims advocacy continues to differentiate PRA Proven Key Themes

ormance Financial/OperatingPerf
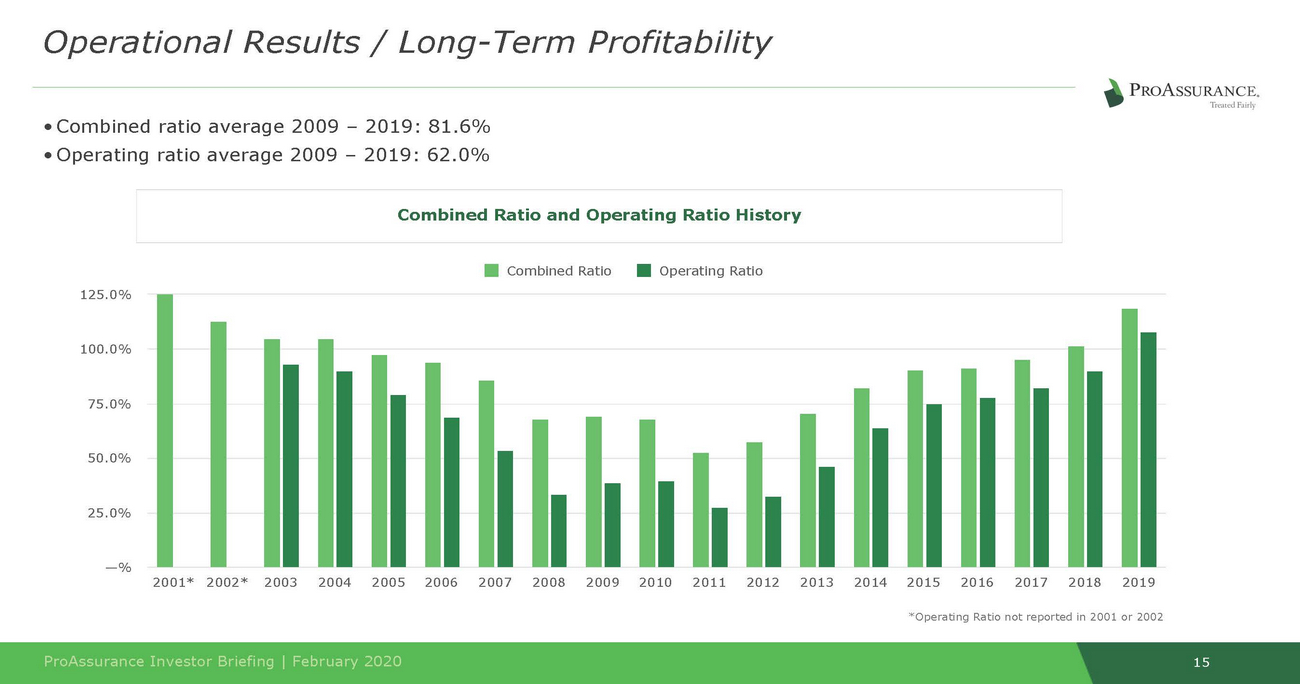
• Combined ratio average 2009 – 2019: 81.6% 15 ProAssurance Investor Briefing | February 2020 Operational Results / Long-Term Profitability • Operating ratio average 2009 – 2019: 62.0% Combined Ratio and Operating Ratio History Combined Ratio Operating Ratio 125.0% 100.0% 75.0% 50.0% 25.0% —% 2001* 2002* 2003 2004 2005 2006 2007 2008 2009 2010 2011 2012 2013 2014 2015 2016 2017 2018 2019 *Operating Ratio not reported in 2001 or 2002
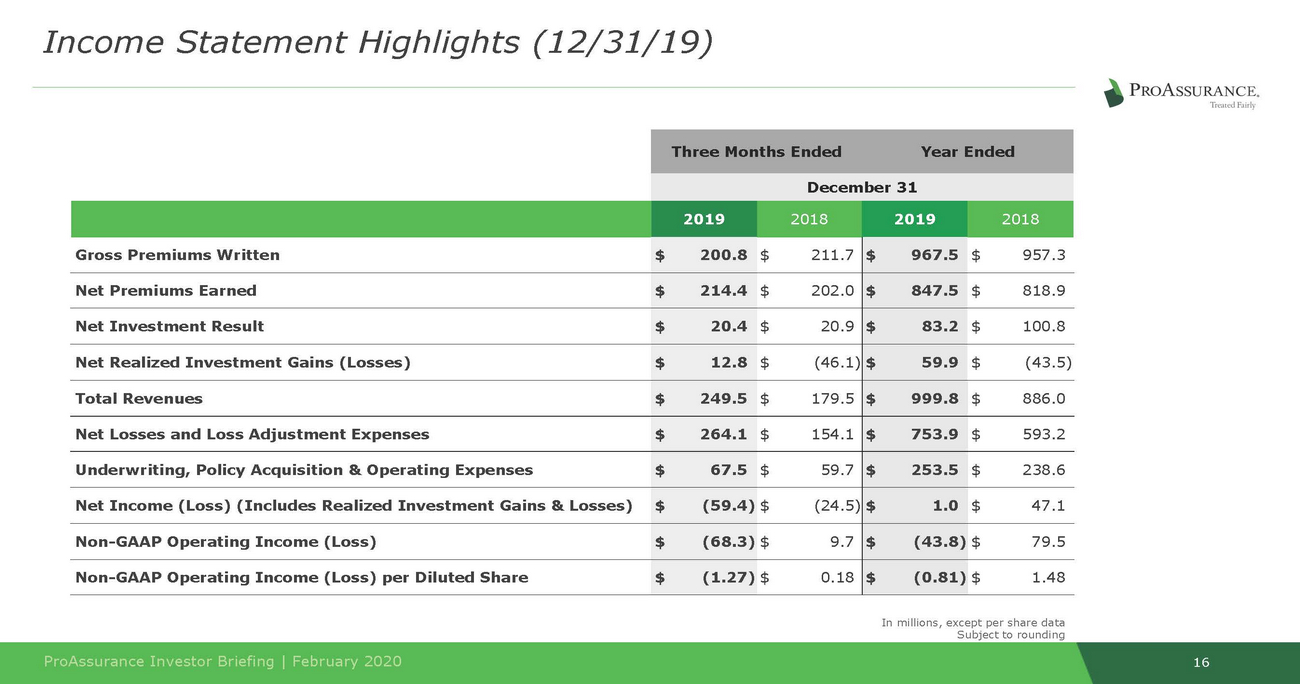
16 ProAssurance Investor Briefing | February 2020 In millions, except per share data Subject to rounding Three Months EndedYear Ended December 31 2019 2018 2019 2018 Gross Premiums Written $200.8 $211.7 $967.5 $957.3 Net Premiums Earned $214.4 $202.0 $847.5 $818.9 Net Investment Result $20.4 $20.9 $83.2 $100.8 Net Realized Investment Gains (Losses) $12.8 $(46.1) $59.9 $(43.5) Total Revenues $249.5 $179.5 $999.8 $886.0 Net Losses and Loss Adjustment Expenses $264.1 $154.1 $753.9 $593.2 Underwriting, Policy Acquisition & Operating Expenses $67.5 $59.7 $253.5 $238.6 Net Income (Loss) (Includes Realized Investment Gains & Losses) $(59.4) $(24.5) $1.0 $47.1 Non-GAAP Operating Income (Loss) $(68.3) $9.7 $(43.8) $79.5 Non-GAAP Operating Income (Loss) per Diluted Share $(1.27) $0.18 $(0.81) $1.48 Income Statement Highlights (12/31/19)
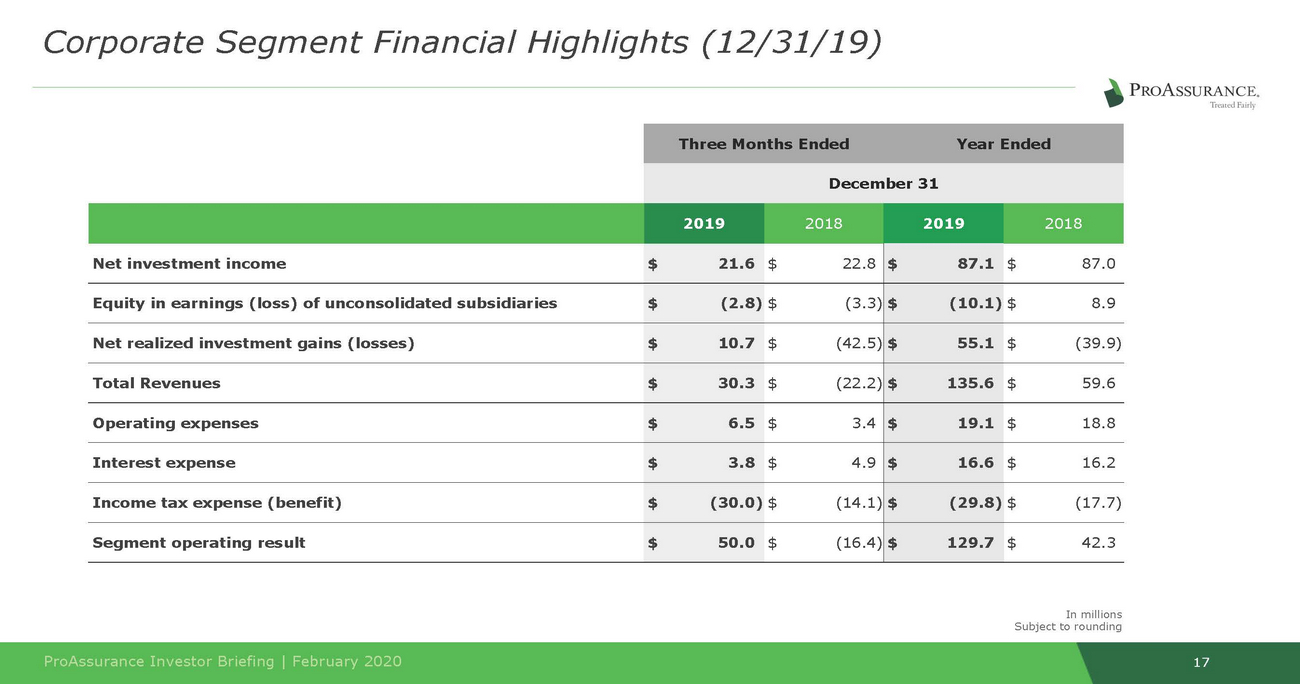
17 ProAssurance Investor Briefing | February 2020 In millions Subject to rounding Corporate Segment Financial Highlights (12/31/19) Three Months EndedYear Ended December 31 2019 2018 2019 2018 Net investment income $21.6 $22.8 $87.1 $87.0 Equity in earnings (loss) of unconsolidated subsidiaries $(2.8) $(3.3) $(10.1) $8.9 Net realized investment gains (losses) $10.7 $(42.5) $55.1 $(39.9) Total Revenues $30.3 $(22.2) $135.6 $59.6 Operating expenses $6.5 $3.4 $19.1 $18.8 Interest expense $3.8 $4.9 $16.6 $16.2 Income tax expense (benefit) $(30.0) $(14.1) $(29.8) $(17.7) Segment operating result $50.0 $(16.4) $129.7 $42.3
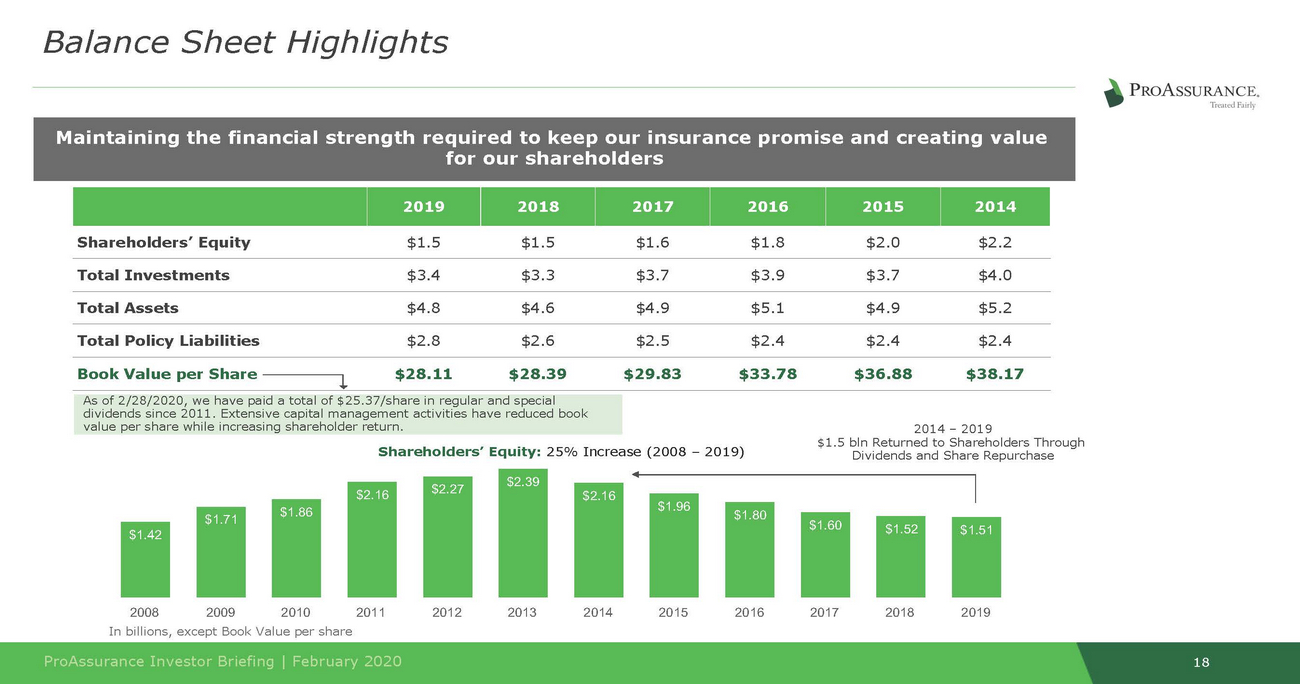
Shareholders’ Equity $1.5 $1.5 $1.6 $1.8 $2.0 $2.2 Total Investments $3.4 $3.3 $3.7 $3.9 $3.7 $4.0 Total Assets $4.8 $4.6 $4.9 $5.1 $4.9 $5.2 Total Policy Liabilities $2.8 $2.6 $2.5 $2.4 $2.4 $2.4 Book Value per Share $28.11 $28.39 $29.83 $33.78 $36.88 $38.17 Dividends and Share Repurchase In billions, except Book Value per share 18 ProAssurance Investor Briefing | February 2020 As of 2/28/2020, we have paid a total of $25.37/share in regular and special dividends since 2011. Extensive capital management activities have reduced book value per share while increasing shareholder return. 2014 – 2019 $1.5 bln Returned to Shareholders Through Shareholders’ Equity: 25% Increase (2008 – 2019) $2.27 $2.39 2008 2009 2010 2011 2012 2013 2014 2015 2016 2017 2018 2019 $1.42 $1.51 $1.52 $1.60 $1.71 $1.80 $1.86 $1.96 $2.16 $2.16 2019 2018 2017 2016 2015 2014 Maintaining the financial strength required to keep our insurance promise and creating value for our shareholders Balance Sheet Highlights
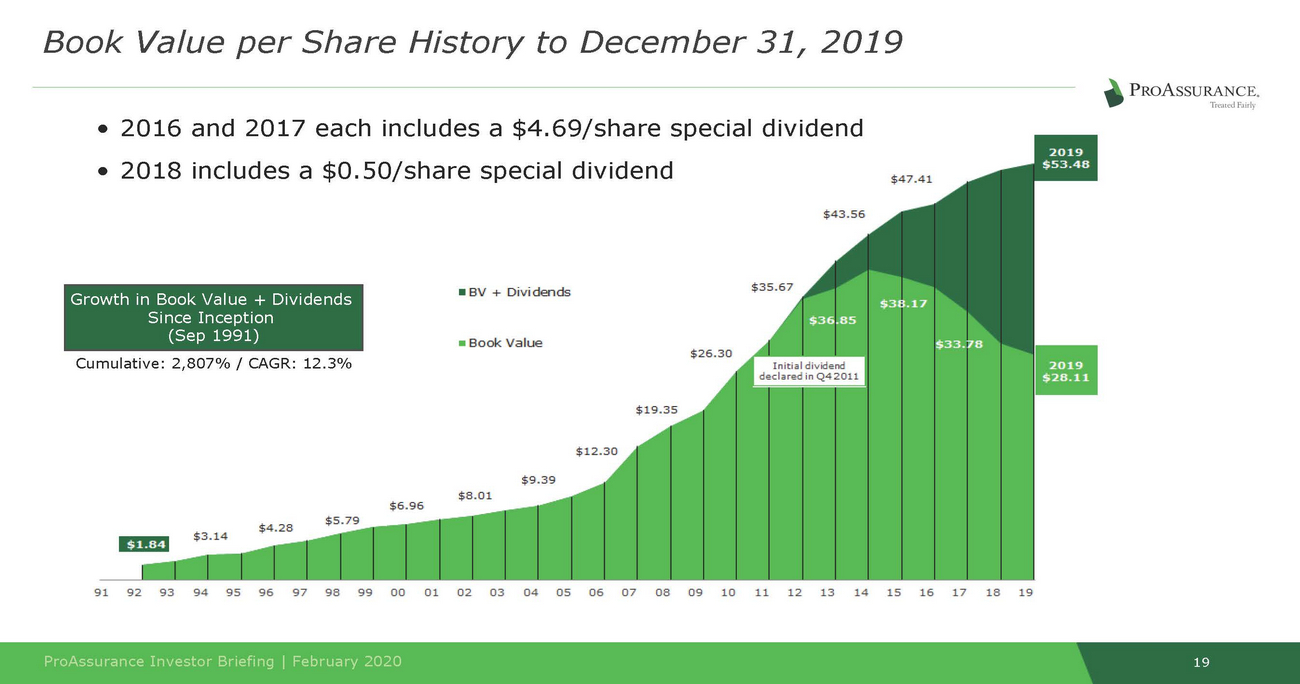
Cumulative: 2,807% / CAGR: 12.3% 19 ProAssurance Investor Briefing | February 2020 Growth in Book Value + Dividends Since Inception (Sep 1991) Book Value per Share History to December 31, 2019 • 2016 and 2017 each includes a $4.69/share special dividend • 2018 includes a $0.50/share special dividend
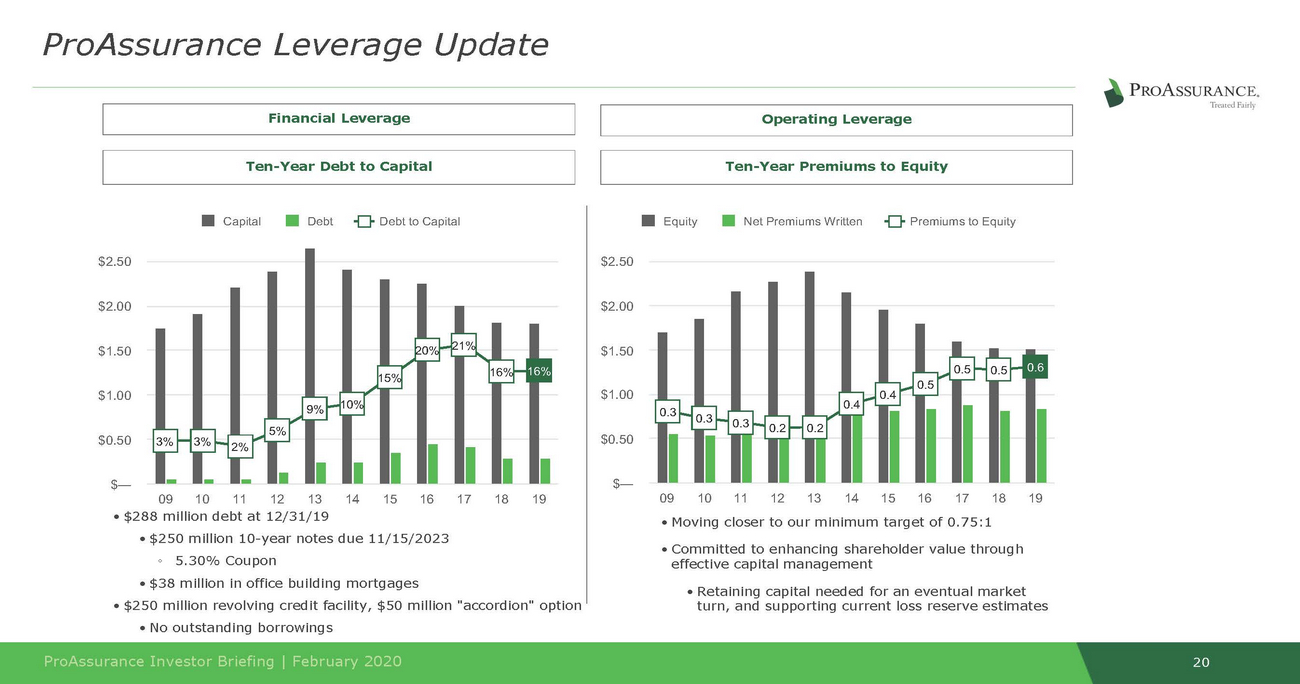
10% • $288 million debt at 12/31/19 effective capital management 20 CapitalDebtDebt to Capital $2.50 $2.00 $1.50 20% 21% 15%16% 16% $1.00 $0.50 $— 09 10 11 12 13 14 15 16 17 18 19 EquityNet Premiums WrittenPremiums to Equity $2.50 $2.00 $1.50 $1.00 $0.50 $— 09 10 11 12 13 14 15 16 17 18 19 • $250 million 10-year notes due 11/15/2023 ◦ 5.30% Coupon • $38 million in office building mortgages • Moving closer to our minimum target of 0.75:1 • Committed to enhancing shareholder value through • Retaining capital needed for an eventual market turn, and supporting current loss reserve estimates • $250 million revolving credit facility, $50 million "accordion" option • No outstanding borrowings ProAssurance Investor Briefing | February 2020 0.5 0.5 0.6 0.5 0.4 0.4 0.3 0.3 0.3 0.2 0.2 9% 5% 3% 3% 2% Ten-Year Debt to Capital Ten-Year Premiums to Equity Operating Leverage Financial Leverage ProAssurance Leverage Update

SegmentHighlights
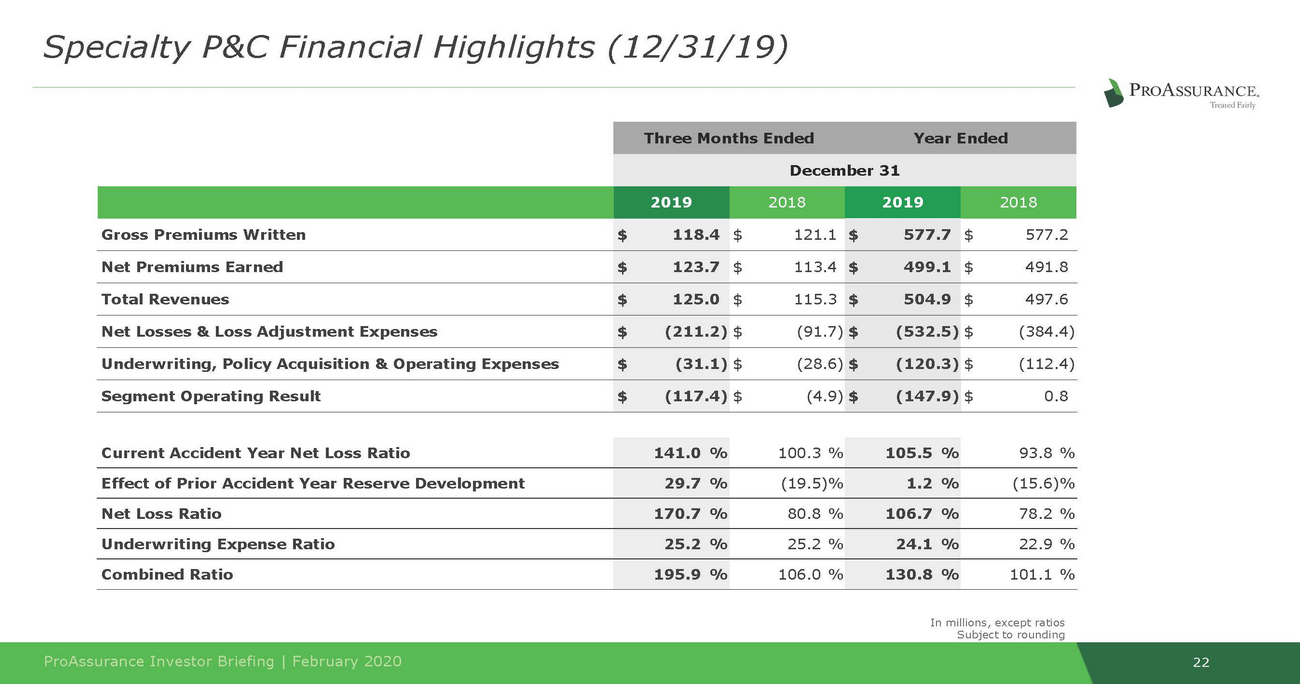
22 ProAssurance Investor Briefing | February 2020 In millions, except ratios Subject to rounding Current Accident Year Net Loss Ratio 141.0 % 100.3 % 105.5 % 93.8 % Effect of Prior Accident Year Reserve Development 29.7 % (19.5)% 1.2 % (15.6)% Net Loss Ratio 170.7 % 80.8 % 106.7 % 78.2 % Underwriting Expense Ratio 25.2 % 25.2 % 24.1 % 22.9 % Combined Ratio 195.9 % 106.0 % 130.8 % 101.1 % Three Months EndedYear Ended December 31 2019 2018 2019 2018 Gross Premiums Written $118.4 $121.1 $577.7 $577.2 Net Premiums Earned $123.7 $113.4 $499.1 $491.8 Total Revenues $125.0 $115.3 $504.9 $497.6 Net Losses & Loss Adjustment Expenses $(211.2) $(91.7) $(532.5) $(384.4) Underwriting, Policy Acquisition & Operating Expenses $(31.1) $(28.6) $(120.3) $(112.4) Segment Operating Result $(117.4) $(4.9) $(147.9) $0.8 Specialty P&C Financial Highlights (12/31/19)
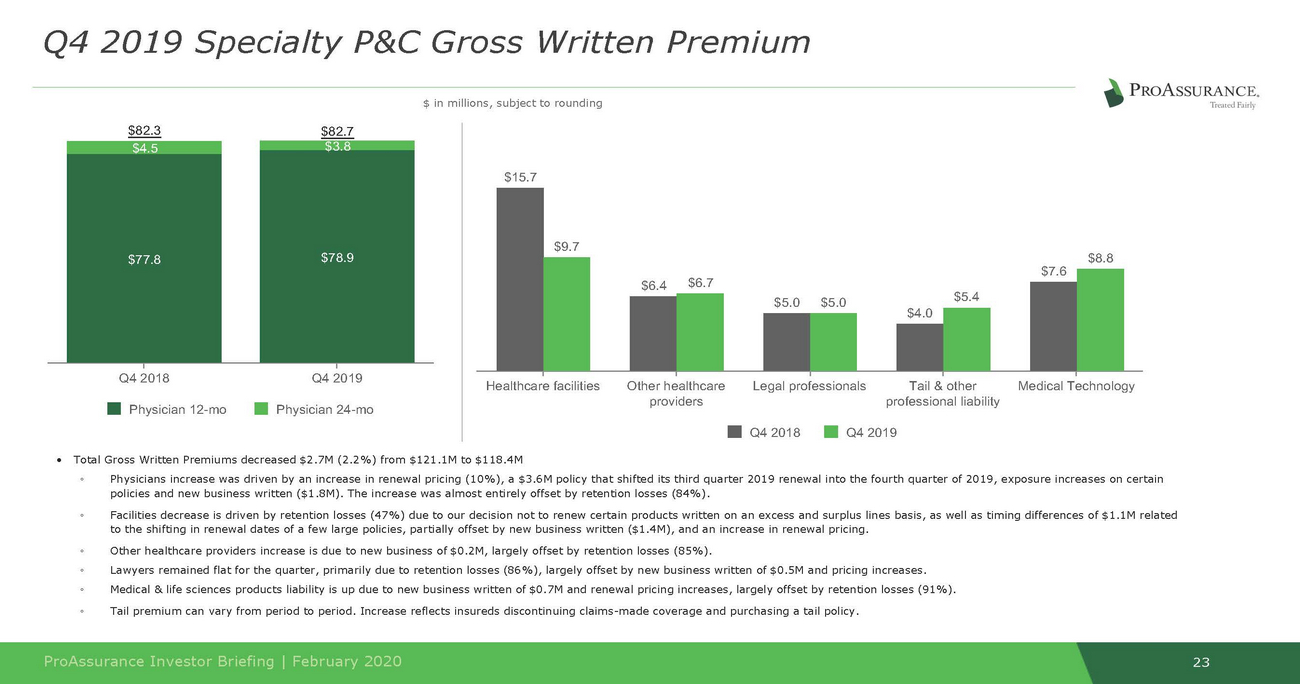
$8.8 $6.7 $6.4 $4.0 23 ProAssurance Investor Briefing | February 2020 Q4 2019 Specialty P&C Gross Written Premium $ in millions, subject to rounding $82.3 $82.7 $15.7 $4.5 $78.9 $77.8 $9.7 $7.6 $5.0 $5.0 $5.4 Q4 2018 Q4 2019 Physician 12-mo Physician 24-mo Healthcare facilities Other healthcare Legal professionals Tail & other Medical Technology providers professional liability Q4 2018 Q4 2019 • Total Gross Written Premiums decreased $2.7M (2.2%) from $121.1M to $118.4M ◦Physicians increase was driven by an increase in renewal pricing (10%), a $3.6M policy that shifted its third quarter 2019 renewal into the fourth quarter of 2019, exposure increases on certain policies and new business written ($1.8M). The increase was almost entirely offset by retention losses (84%). ◦Facilities decrease is driven by retention losses (47%) due to our decision not to renew certain products written on an excess and surplus lines basis, as well as timing differences of $1.1M related to the shifting in renewal dates of a few large policies, partially offset by new business written ($1.4M), and an increase in renewal pricing. ◦Other healthcare providers increase is due to new business of $0.2M, largely offset by retention losses (85%). ◦Lawyers remained flat for the quarter, primarily due to retention losses (86%), largely offset by new business written of $0.5M and pricing increases. ◦Medical & life sciences products liability is up due to new business written of $0.7M and renewal pricing increases, largely offset by retention losses (91%). ◦Tail premium can vary from period to period. Increase reflects insureds discontinuing claims-made coverage and purchasing a tail policy.
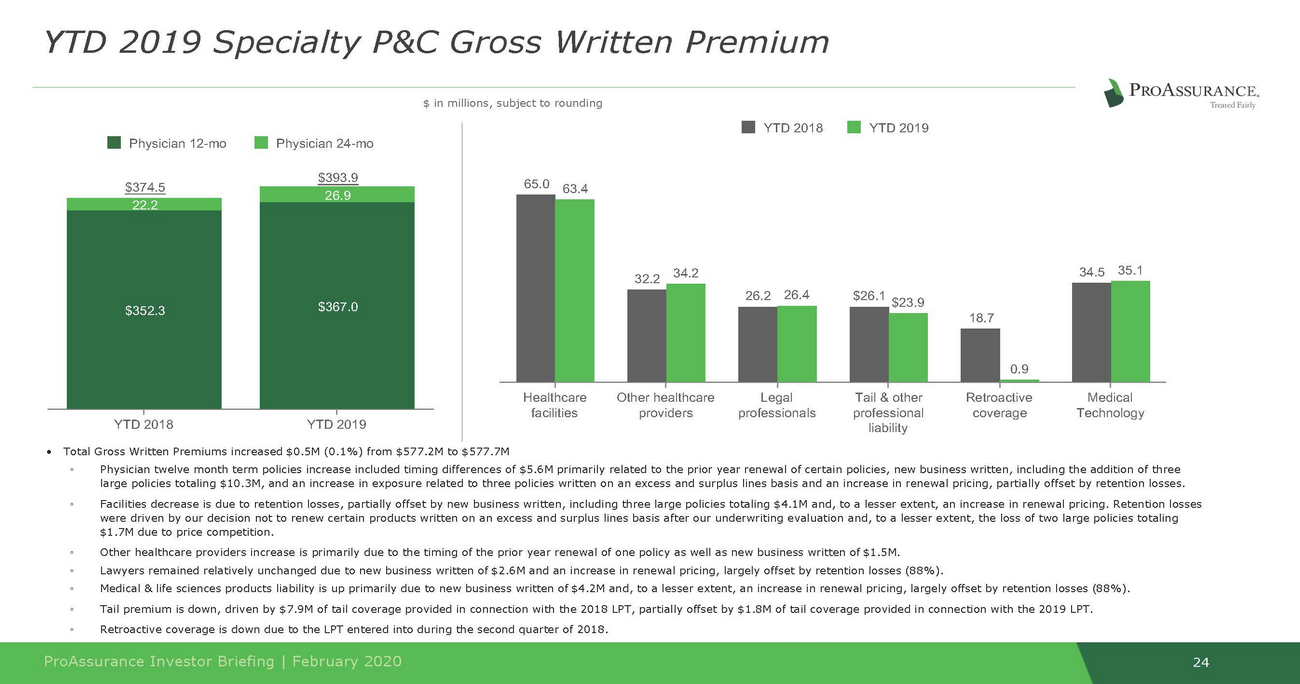
liability 24 ProAssurance Investor Briefing | February 2020 YTD 2019 Specialty P&C Gross Written Premium $ in millions, subject to rounding YTD 2018 YTD 2019 YTD 2018 YTD 2019 65.0 63.4 32.2 34.2 34.5 35.1 26.2 26.4 $26.1 $23.9 18.7 0.9 Healthcare Other healthcare Legal Tail & other Retroactive Medical facilities providers professionals professional coverage Technology • Total Gross Written Premiums increased $0.5M (0.1%) from $577.2M to $577.7M ◦Physician twelve month term policies increase included timing differences of $5.6M primarily related to the prior year renewal of certain policies, new business written, including the addition of three large policies totaling $10.3M, and an increase in exposure related to three policies written on an excess and surplus lines basis and an increase in renewal pricing, partially offset by retention losses. ◦Facilities decrease is due to retention losses, partially offset by new business written, including three large policies totaling $4.1M and, to a lesser extent, an increase in renewal pricing. Retention losses were driven by our decision not to renew certain products written on an excess and surplus lines basis after our underwriting evaluation and, to a lesser extent, the loss of two large policies totaling $1.7M due to price competition. ◦Other healthcare providers increase is primarily due to the timing of the prior year renewal of one policy as well as new business written of $1.5M. ◦Lawyers remained relatively unchanged due to new business written of $2.6M and an increase in renewal pricing, largely offset by retention losses (88%). ◦Medical & life sciences products liability is up primarily due to new business written of $4.2M and, to a lesser extent, an increase in renewal pricing, largely offset by retention losses (88%). ◦Tail premium is down, driven by $7.9M of tail coverage provided in connection with the 2018 LPT, partially offset by $1.8M of tail coverage provided in connection with the 2019 LPT. ◦Retroactive coverage is down due to the LPT entered into during the second quarter of 2018. $374.5 $393.9 26.9 22.2 $367.0 $352.3 Physician 12-mo Physician 24-mo
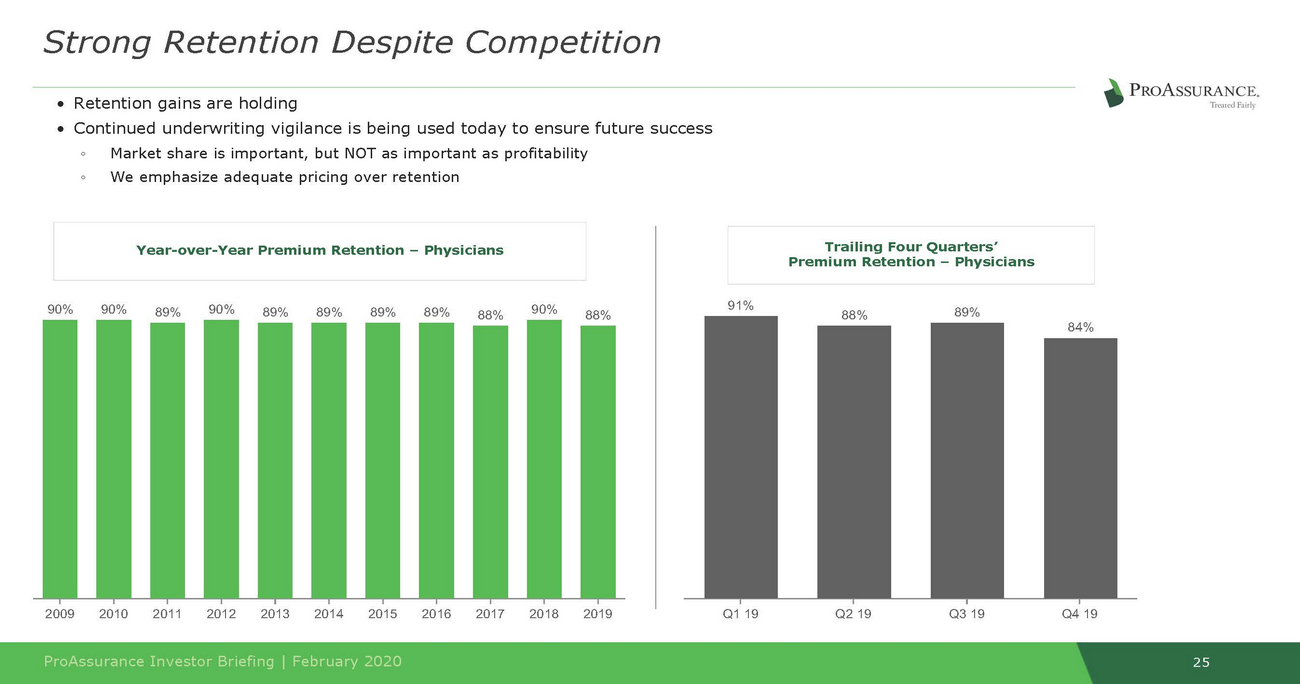
Premium Retention – Physicians 89% 88% 25 ProAssurance Investor Briefing | February 2020 Trailing Four Quarters’ 91% Q1 19 Q2 19 Q3 19 Q4 19 84% Year-over-Year Premium Retention – Physicians 90% 90% 89% 90% 89% 89% 89% 89% 88% 90% 88% 2009 2010 2011 2012 2013 2014 2015 2016 2017 2018 2019 • Continued underwriting vigilance is being used today to ensure future success ◦Market share is important, but NOT as important as profitability ◦We emphasize adequate pricing over retention Strong Retention Despite Competition • Retention gains are holding
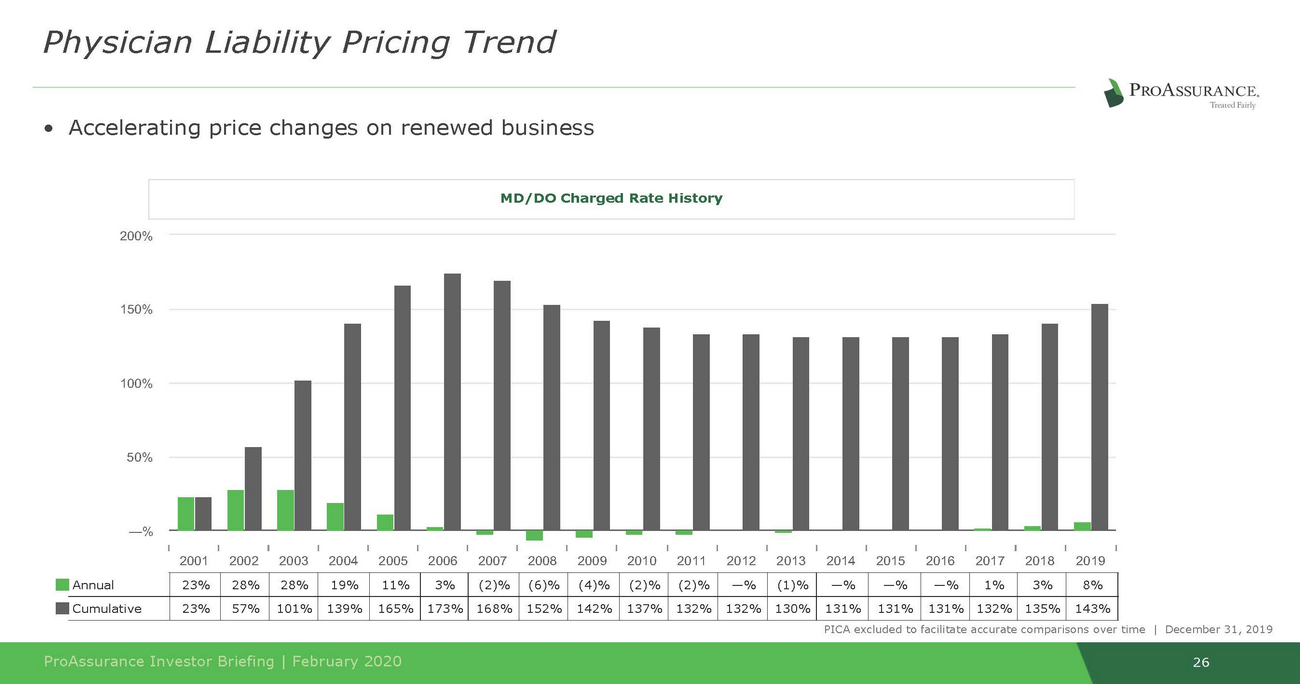
26 ProAssurance Investor Briefing | February 2020 MD/DO Charged Rate History 200% 150% 100% 50% —% 2001 2002 2003 2004 2005 2006 2007 2008 2009 2010 2011 2012 2013 2014 2015 2016 2017 2018 2019 Annual 23% 28% 28% 19% 11% 3% (2)% (6)% (4)% (2)% (2)% —% (1)% —% —% —% 1% 3% 8% Cumulative 23% 57% 101% 139% 165% 173% 168% 152% 142% 137% 132% 132% 130% 131% 131% 131% 132% 135% 143% PICA excluded to facilitate accurate comparisons over time | December 31, 2019 Physician Liability Pricing Trend •Accelerating price changes on renewed business
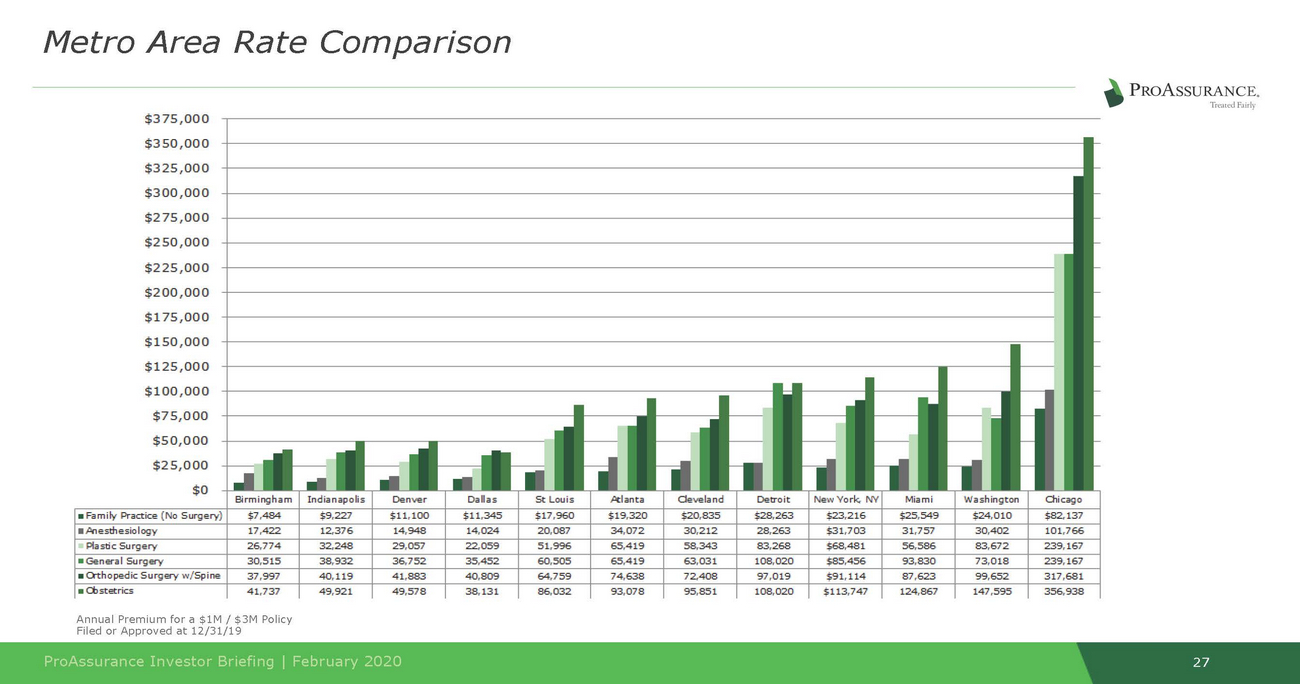
Metro Area Rate Comparison $375,000 $350,000 $325,000 $300,000 $275,000 $250,000 $225,000 $200,000 $175,000 $150,000 $125,000 $100,000 $75,000 $50,000 $25,000 49,921 49, 578 38,131 86,.032 93,078 95, 851 108,020 124, 867 147,595 356,.938 Annual Premium for a $1M I $3M Policy Filed or Approved at 12/31/19 ProAssurance Investor Briefing I February 2020 27

SegmentStrategicReview
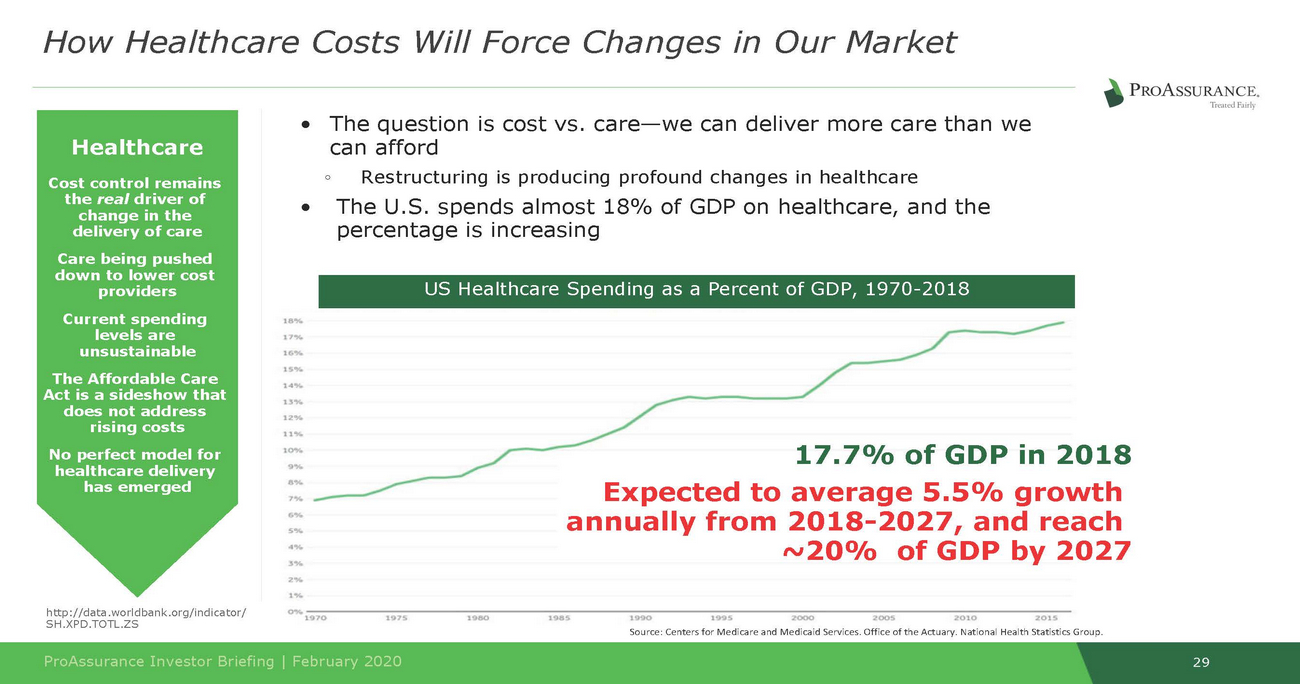
17.7% of GDP in 2018 Expected to average 5.5% growth annually from 2018-2027, and reach ~20% of GDP by 2027 http://data.worldbank.org/indicator/ SH.XPD.TOTL.ZS 29 ProAssurance Investor Briefing | February 2020 Source: Centers for Medicare and Medicaid Services. Office of the Actuary. National Health Statistics Group. Current spending levels are unsustainable The Affordable Care Act is a sideshow that does not address rising costs No perfect model for healthcare delivery has emerged Healthcare Cost control remains the real driver of change in the delivery of care Care being pushed •The question is cost vs. care—we can deliver more care than we can afford ◦Restructuring is producing profound changes in healthcare •The U.S. spends almost 18% of GDP on healthcare, and the percentage is increasing down to lower cost providers US Healthcare Spending as a Percent of GDP, 1970-2018 How Healthcare Costs Will Force Changes in Our Market
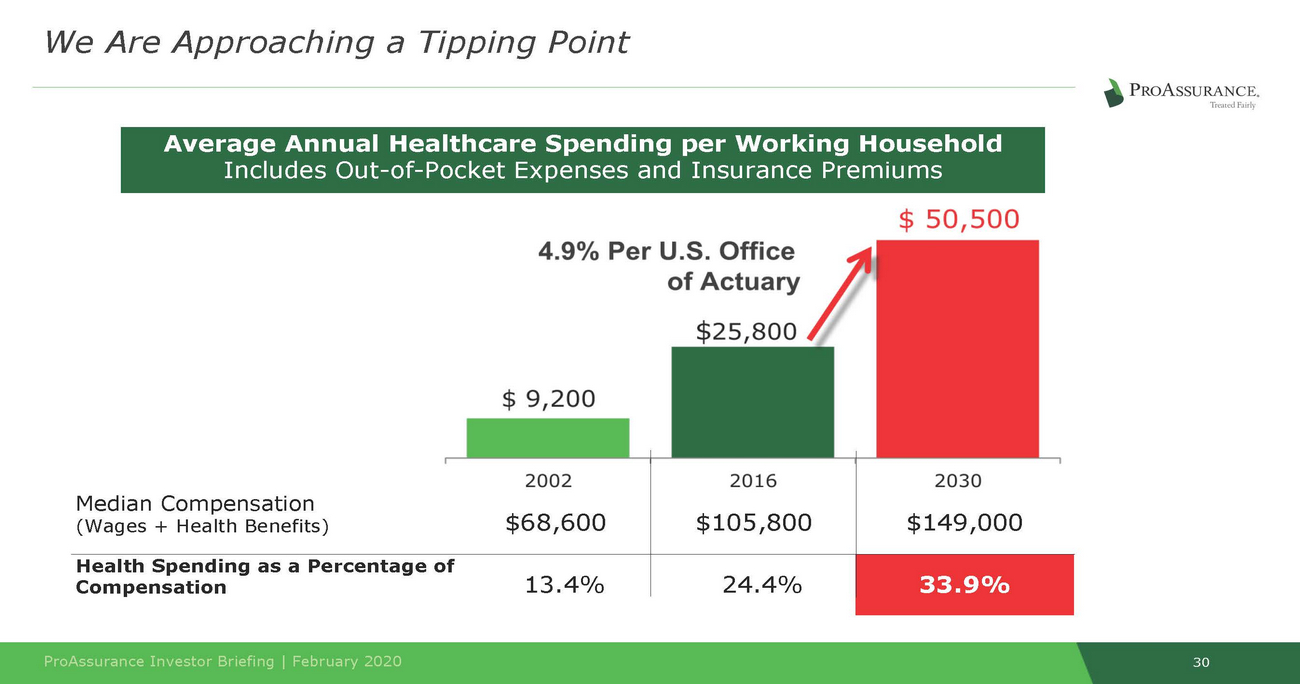
30 ProAssurance Investor Briefing | February 2020 Median Compensation (Wages + Health Benefits)$68,600 $105,800 $149,000 Health Spending as a Percentage of Compensation13.4% 24.4% 33.9% Average Annual Healthcare Spending per Working Household Includes Out-of-Pocket Expenses and Insurance Premiums We Are Approaching a Tipping Point
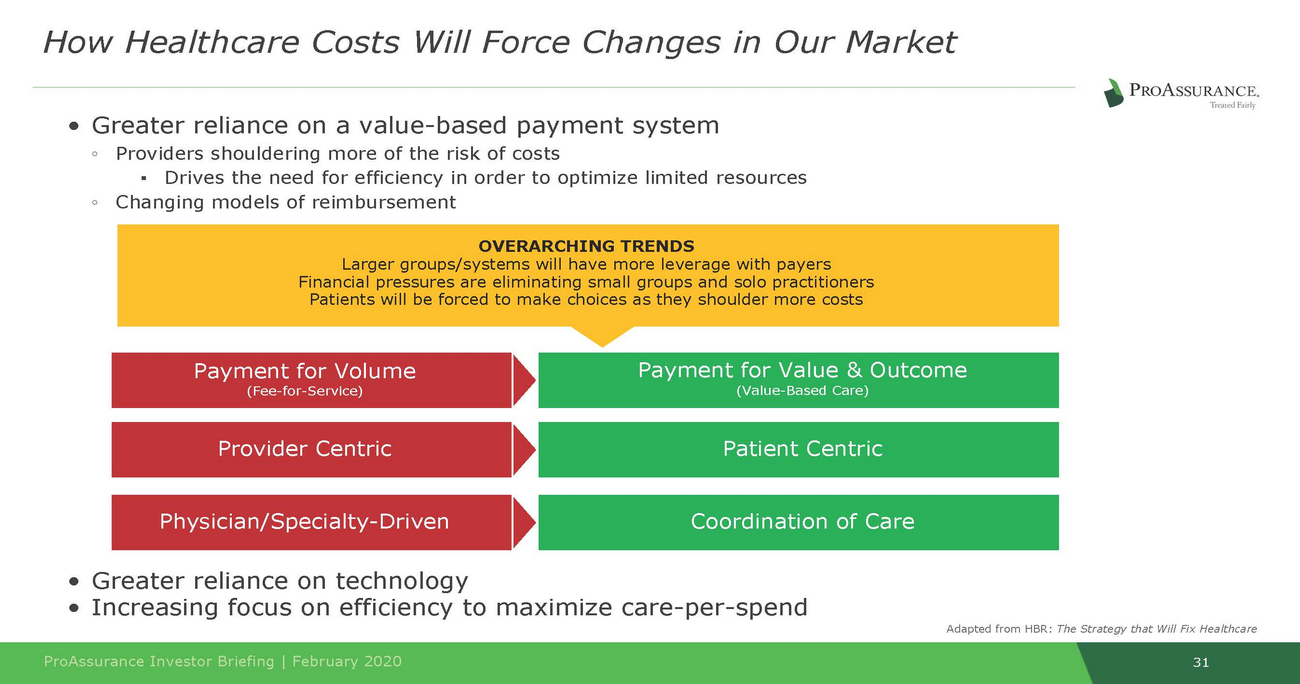
• Greater reliance on a value-based payment system • • Greater reliance on on technology efficiency to maximize care-per-spend Increasing focus 31 ProAssurance Investor Briefing | February 2020 Adapted from HBR: The Strategy that Will Fix Healthcare Coordination of Care Physician/Specialty-Driven Patient Centric Provider Centric Payment for Value & Outcome (Value-Based Care) Payment for Volume (Fee-for-Service) OVERARCHING TRENDS Larger groups/systems will have more leverage with payers Financial pressures are eliminating small groups and solo practitioners Patients will be forced to make choices as they shoulder more costs How Healthcare Costs Will Force Changes in Our Market ◦Providers shouldering more of the risk of costs ▪Drives the need for efficiency in order to optimize limited resources ◦Changing models of reimbursement
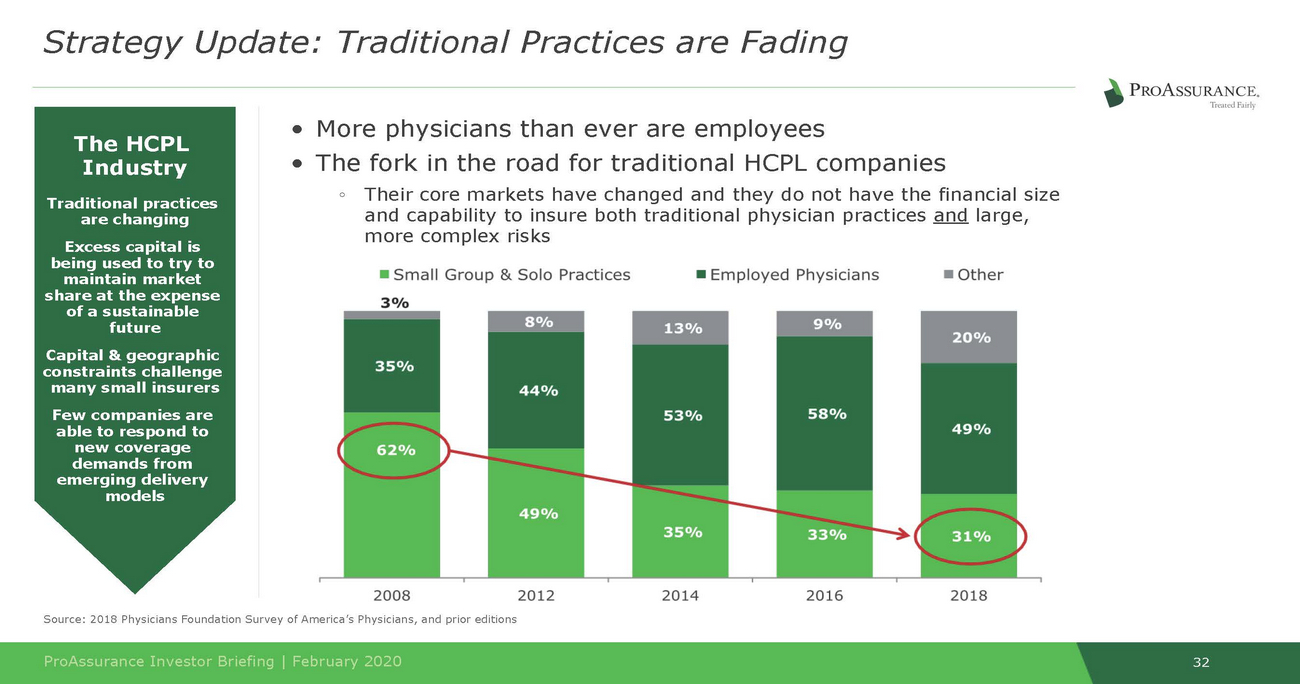
Industry are changing more complex risks 32 ProAssurance Investor Briefing | February 2020 Source: 2018 Physicians Foundation Survey of America’s Physicians, and prior editions The HCPL Traditional practices Excess capital is being used to try to maintain market share at the expense of a sustainable future Capital & geographic constraints challenge many small insurers Few companies are able to respond to new coverage demands from emerging delivery models • More physicians than ever are employees • The fork in the road for traditional HCPL companies ◦Their core markets have changed and they do not have the financial size and capability to insure both traditional physician practices and large, Strategy Update: Traditional Practices are Fading
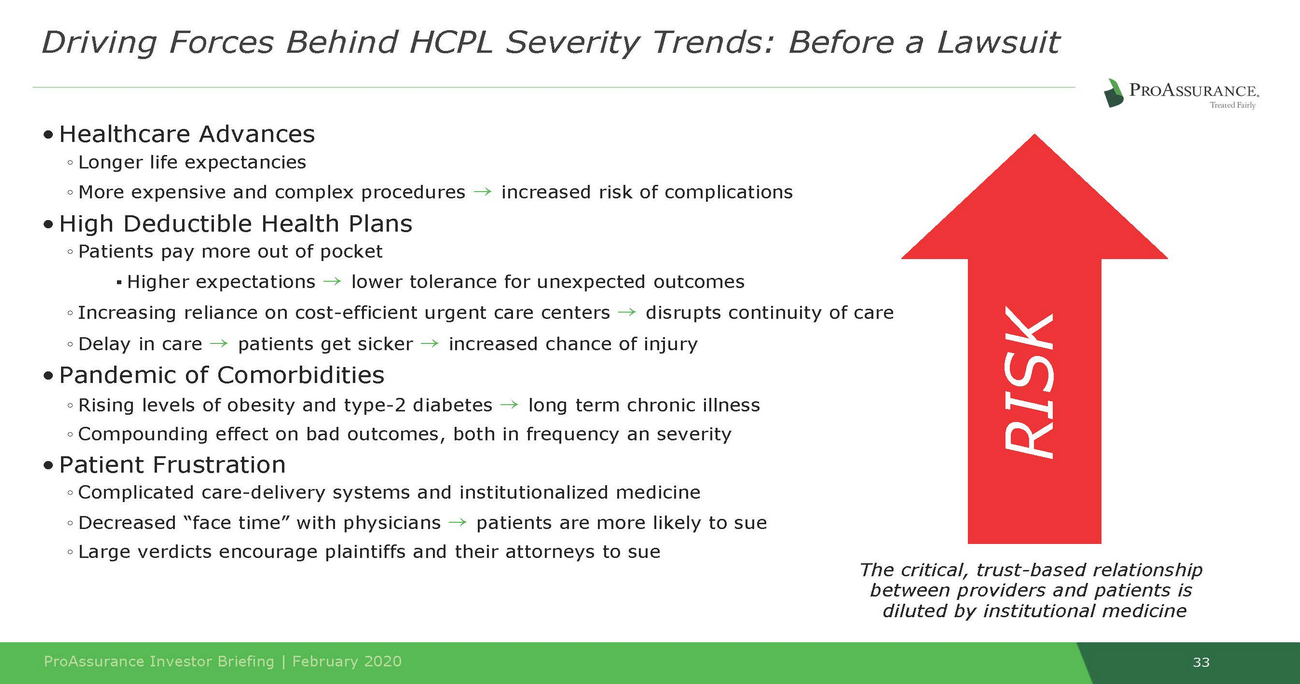
l medicine 33 RISK ProAssurance Investor Briefing | February 2020 • Healthcare Advances ◦ Longer life expectancies ◦ More expensive and complex procedures → increased risk of complications • High Deductible Health Plans ◦ Patients pay more out of pocket ▪ Higher expectations → lower tolerance for unexpected outcomes ◦ Increasing reliance on cost-efficient urgent care centers → disrupts continuity of care ◦ Delay in care → patients get sicker → increased chance of injury • Pandemic of Comorbidities ◦ Rising levels of obesity and type-2 diabetes → long term chronic illness ◦ Compounding effect on bad outcomes, both in frequency an severity • Patient Frustration ◦ Complicated care-delivery systems and institutionalized medicine ◦ Decreased “face time” with physicians → patients are more likely to sue ◦ Large verdicts encourage plaintiffs and their attorneys to sue The critical, trust-based between providers and diluted by institutiona relationship patients is Driving Forces Behind HCPL Severity Trends: Before a Lawsuit
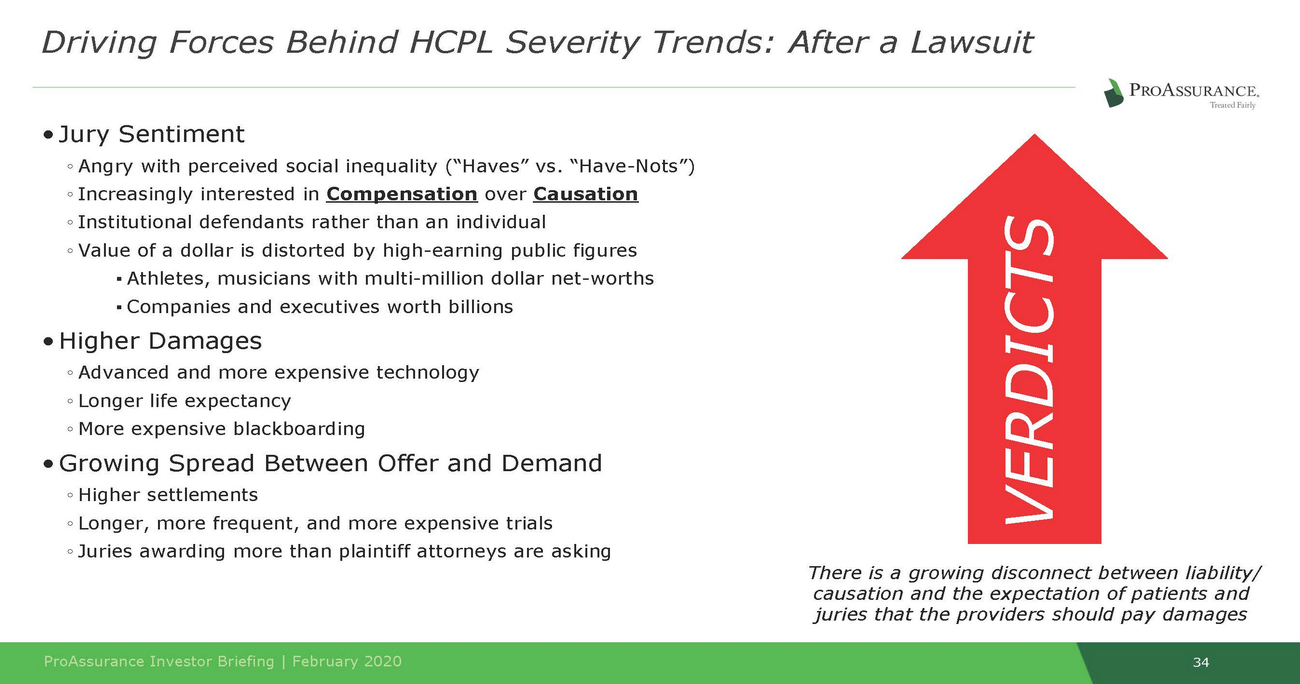
• Jury Sentiment ◦ Angry with perceived social inequality (“Haves” vs. “Have-Nots”) ◦ Increasingly interested in Compensation over Causation ◦ Institutional defendants rather than an individual ◦ Value of a dollar is distorted by high-earning public figures ▪ Athletes, musicians with multi-million dollar net-worths ▪ Companies and executives worth billions • Higher Damages ◦ Advanced and more expensive technology ◦ Longer life expectancy ◦ More expensive blackboarding • Growing Spread Between Offer and Demand ◦ Higher settlements ◦ Longer, more frequent, and more expensive trials ◦ Juries awarding more than plaintiff attorneys are asking There is a growing disconnect between liability/ causation and the expectation of patients and juries that the providers should pay damages ProAssurance Investor Briefing | February 2020 34 VERDICTS Driving Forces Behind HCPL Severity Trends: After a Lawsuit
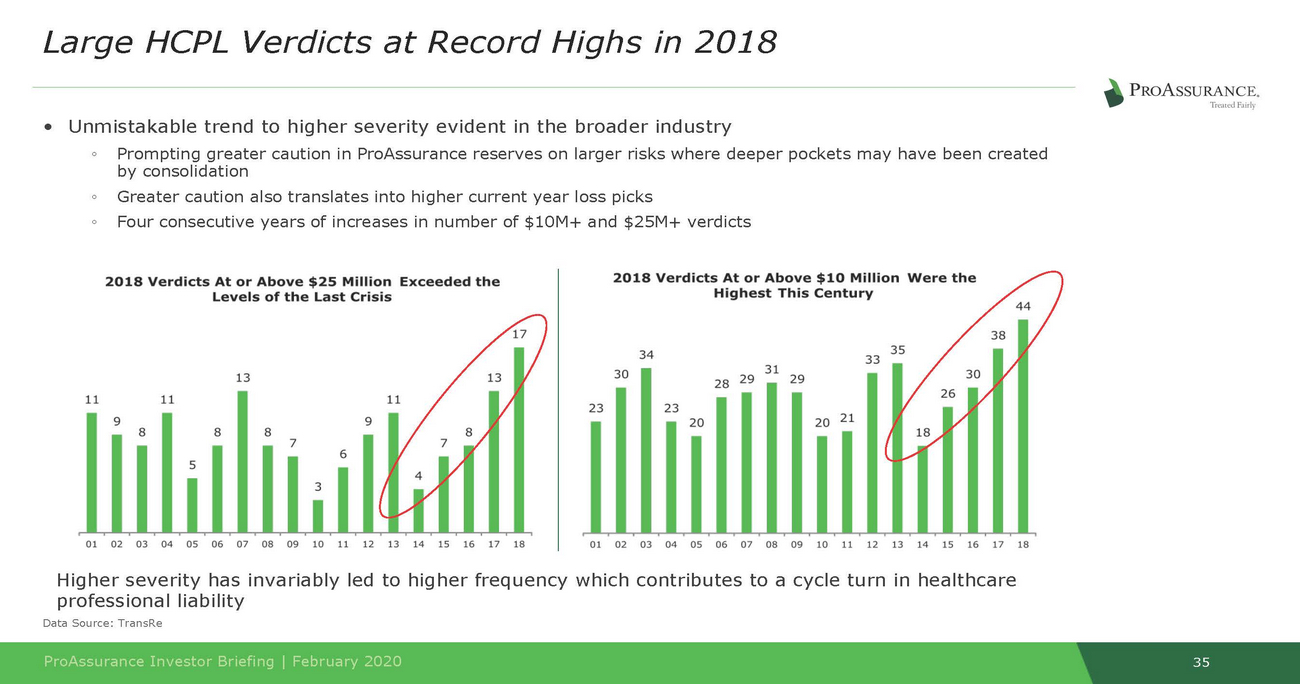
35 ProAssurance Investor Briefing | February 2020 •Unmistakable trend to higher severity evident in the broader industry ◦Prompting greater caution in ProAssurance reserves on larger risks where deeper pockets may have been created by consolidation ◦Greater caution also translates into higher current year loss picks ◦Four consecutive years of increases in number of $10M+ and $25M+ verdicts Higher severity has invariably led to higher frequency which contributes to a cycle turn in healthcare professional liability Data Source: TransRe Large HCPL Verdicts at Record Highs in 2018
strategy and success •Prudently leveraging our success and experience with the addition of specialized expertise •Traditional HCPL companies deepen our capabilities 36 ProAssurance Investor Briefing | February 2020 Broad capabilities to meet evolving demands in professional liability •Eastern, Medmarc, & PICA We have built the platform that allows us to serve the broad spectrum of healthcare ProAssurance has always evolved ahead of the curve •We have proven our ability to succeed across long insurance cycles •We have an unmatched combination of financial strength and deep experience Our long-term focus on financial strength and protecting the integrity of our balance sheet is central to our overall ProAssurance is Positioned to Succeed in HCPL
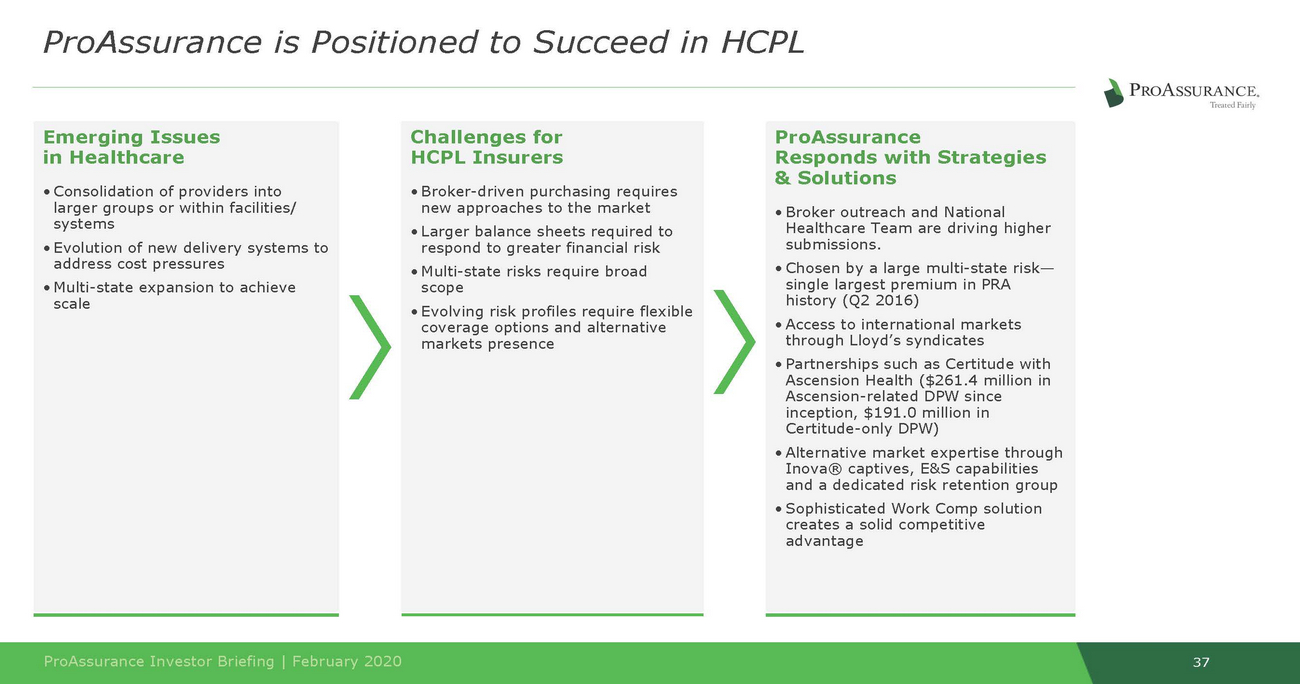
systems • Multi-state expansion to achieve through Lloyd’s syndicates 37 ProAssurance Investor Briefing | February 2020 Emerging Issues in Healthcare • Consolidation of providers into larger groups or within facilities/ • Evolution of new delivery systems to address cost pressures scale ProAssurance Responds with Strategies & Solutions • Broker outreach and National Healthcare Team are driving higher submissions. • Chosen by a large multi-state risk— single largest premium in PRA history (Q2 2016) • Access to international markets • Partnerships such as Certitude with Ascension Health ($261.4 million in Ascension-related DPW since inception, $191.0 million in Certitude-only DPW) • Alternative market expertise through Inova® captives, E&S capabilities and a dedicated risk retention group • Sophisticated Work Comp solution creates a solid competitive advantage Challenges for HCPL Insurers • Broker-driven purchasing requires new approaches to the market • Larger balance sheets required to respond to greater financial risk • Multi-state risks require broad scope • Evolving risk profiles require flexible coverage options and alternative markets presence ProAssurance is Positioned to Succeed in HCPL
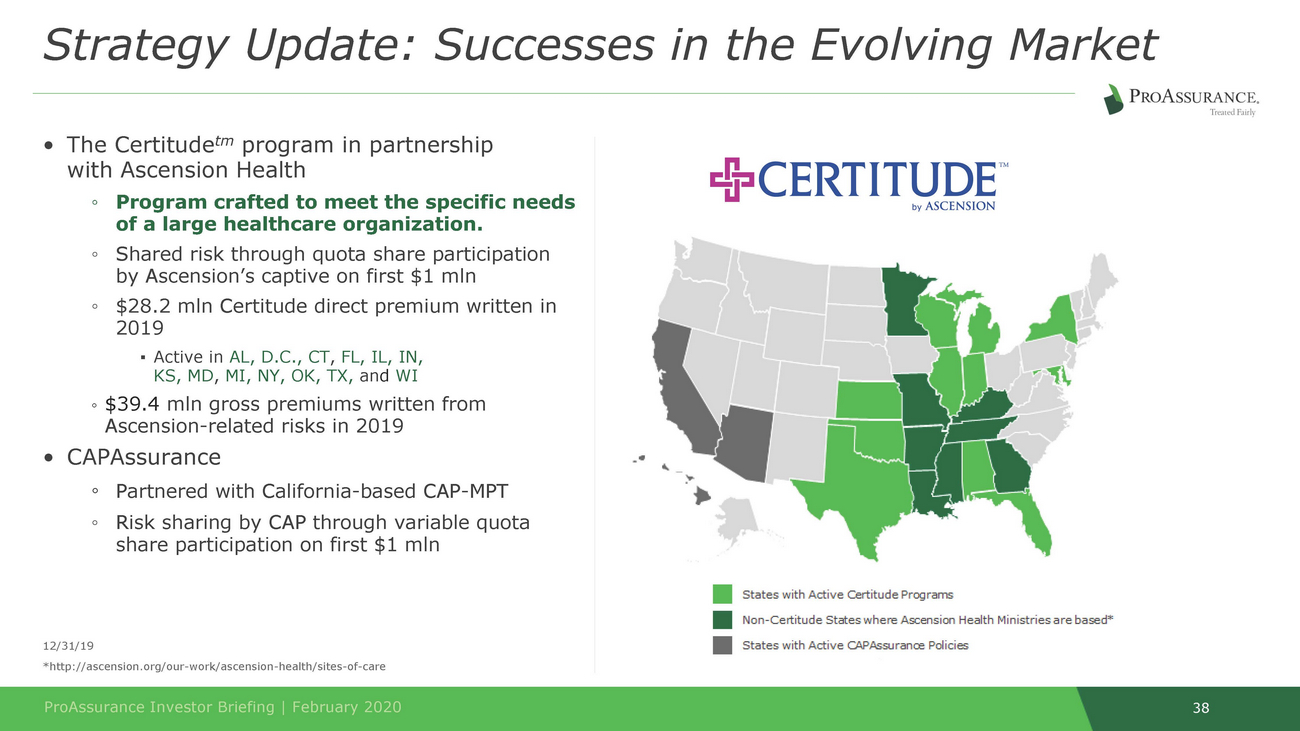
38 ProAssurance Investor Briefing | February 2020 12/31/19 *http://ascension.org/our-work/ascension-health/sites-of-care • The Certitudetm program in partnership with Ascension Health ◦Program crafted to meet the specific needs of a large healthcare organization. ◦Shared risk through quota share participation by Ascension’s captive on first $1 mln ◦$28.2 mln Certitude direct premium written in 2019 ▪ Active in AL, D.C., CT, FL, IL, IN, KS, MD, MI, NY, OK, TX, and WI ◦ $39.4 mln gross premiums written from Ascension-related risks in 2019 • CAPAssurance ◦Partnered with California-based CAP-MPT ◦Risk sharing by CAP through variable quota share participation on first $1 mln StrategyUpdate:SuccessesintheEvolvingMarket
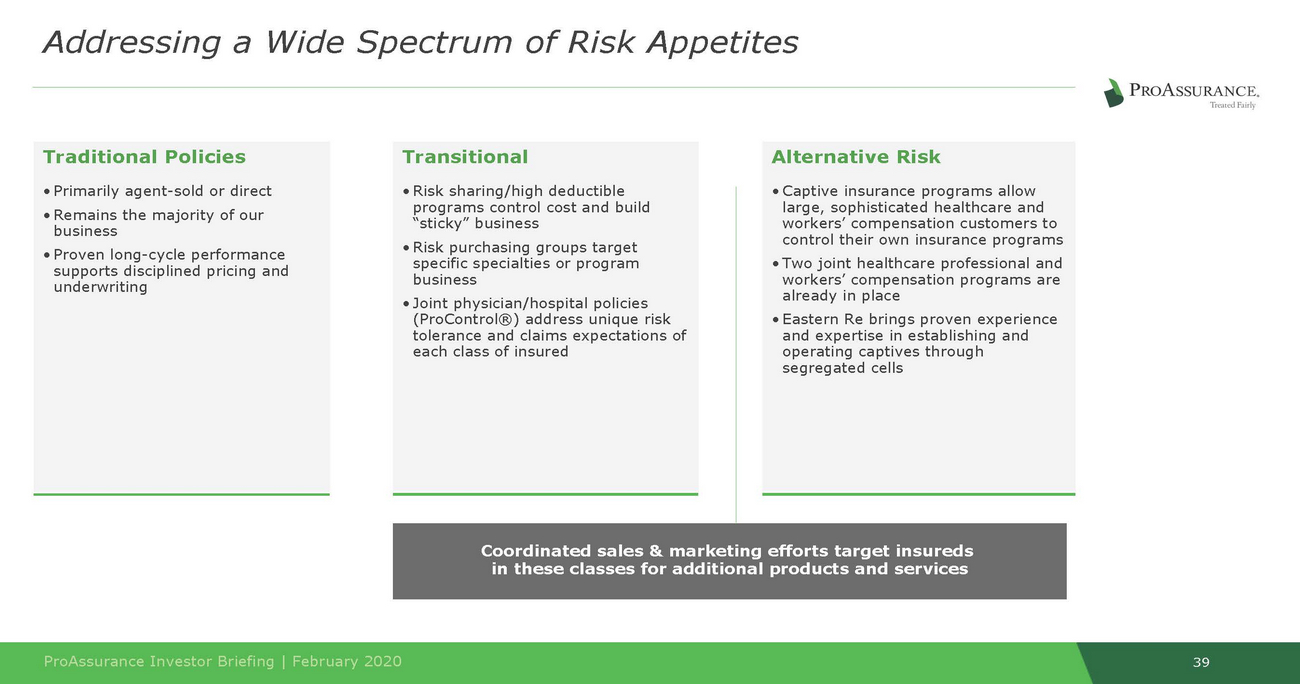
39 ProAssurance Investor Briefing | February 2020 workers’ compensation customers to workers’ compensation programs are Coordinated sales & marketing efforts target insureds in these classes for additional products and services Alternative Risk • Captive insurance programs allow large, sophisticated healthcare and control their own insurance programs • Two joint healthcare professional and already in place • Eastern Re brings proven experience and expertise in establishing and operating captives through segregated cells Transitional • Risk sharing/high deductible programs control cost and build “sticky” business • Risk purchasing groups target specific specialties or program business • Joint physician/hospital policies (ProControl®) address unique risk tolerance and claims expectations of each class of insured Traditional Policies • Primarily agent-sold or direct • Remains the majority of our business • Proven long-cycle performance supports disciplined pricing and underwriting Addressing a Wide Spectrum of Risk Appetites
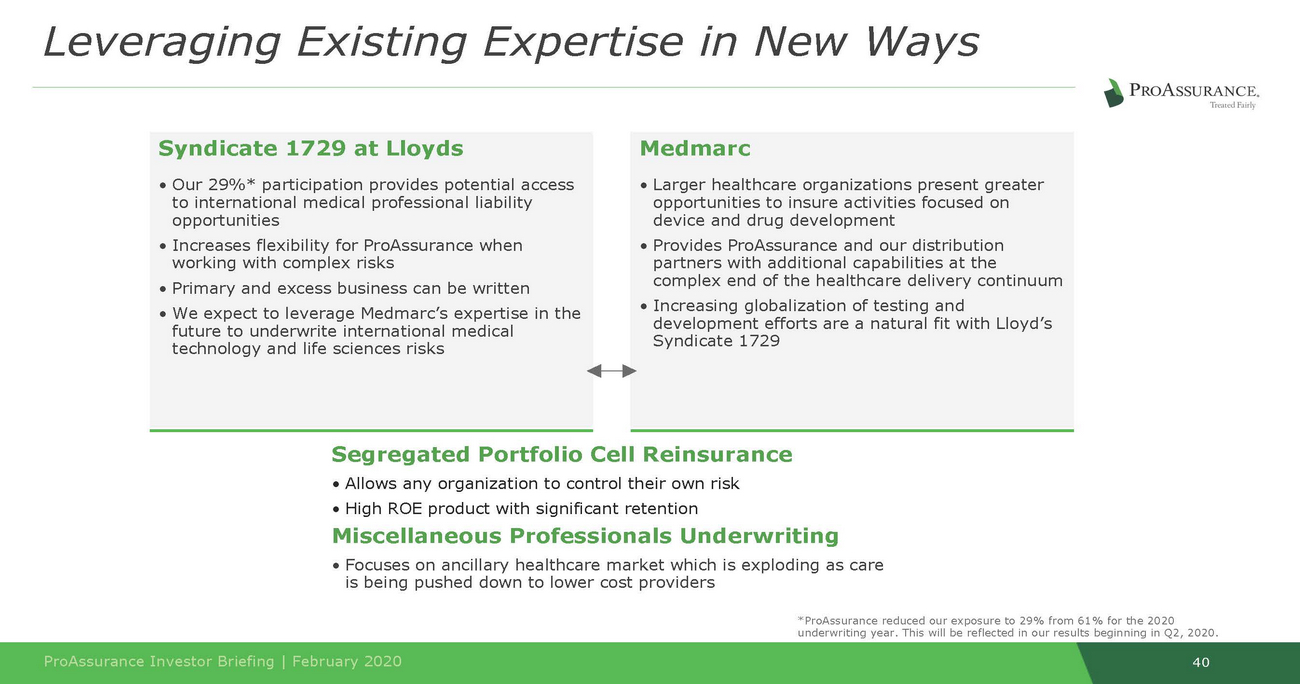
development efforts are a natural fit with Lloyd’s This will be reflected in our results beginning in Q2, 2020. 40 ProAssurance Investor Briefing | February 2020 Segregated Portfolio Cell Reinsurance • Allows any organization to control their own risk • High ROE product with significant retention Miscellaneous Professionals Underwriting • Focuses on ancillary healthcare market which is exploding as care is being pushed down to lower cost providers *ProAssurance redu ced our exposure to 29% from 61% for the 2020 underwriting year. Medmarc • Larger healthcare organizations present greater opportunities to insure activities focused on device and drug development • Provides ProAssurance and our distribution partners with additional capabilities at the complex end of the healthcare delivery continuum • Increasing globalization of testing and Syndicate 1729 Syndicate 1729 at Lloyds • Our 29%* participation provides potential access to international medical professional liability opportunities • Increases flexibility for ProAssurance when working with complex risks • Primary and excess business can be written • We expect to leverage Medmarc’s expertise in the future to underwrite international medical technology and life sciences risks LeveragingExistingExpertiseinNewWays

NORCAL PlannedAcquisitionof Group
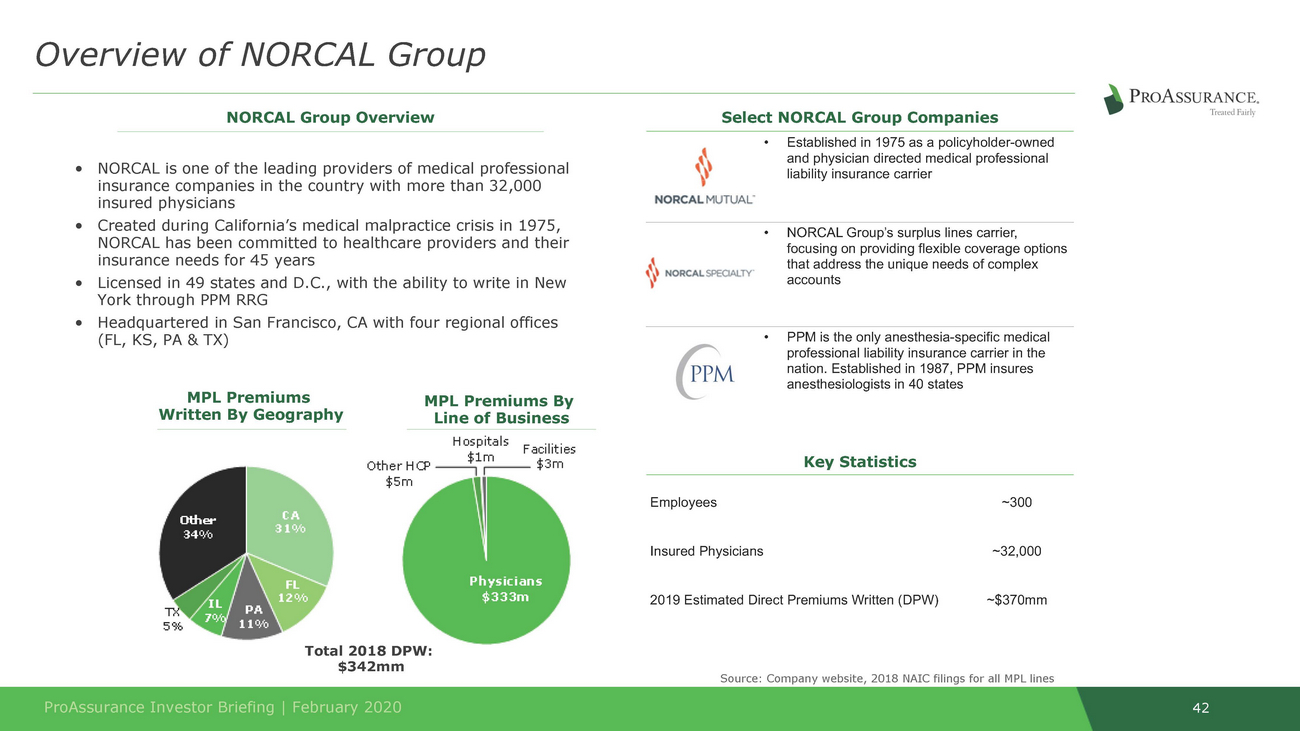
insurance companies in the country with more than 32,000 NORCAL has been committed to healthcare providers and their Line of Business Total 2018 DPW: $342mm Source: Company website, 2018 NAIC filings for all MPL lines 42 ProAssurance Investor Briefing | February 2020 MPL Premiums By MPL Premiums Written By Geography •NORCAL is one of the leading providers of medical professional insured physicians •Created during California’s medical malpractice crisis in 1975, insurance needs for 45 years •Licensed in 49 states and D.C., with the ability to write in New York through PPM RRG •Headquartered in San Francisco, CA with four regional offices (FL, KS, PA & TX) •Established in 1975 as a policyholder-owned and physician directed medical professional liability insurance carrier •NORCAL Group’s surplus lines carrier, focusing on providing flexible coverage options that address the unique needs of complex accounts •PPM is the only anesthesia-specific medical professional liability insurance carrier in the nation. Established in 1987, PPM insures anesthesiologists in 40 states Key Statistics Employees~300 Insured Physicians~32,000 2019 Estimated Direct Premiums Written (DPW)~$370mm Select NORCAL Group Companies NORCAL Group Overview Overview of NORCAL Group
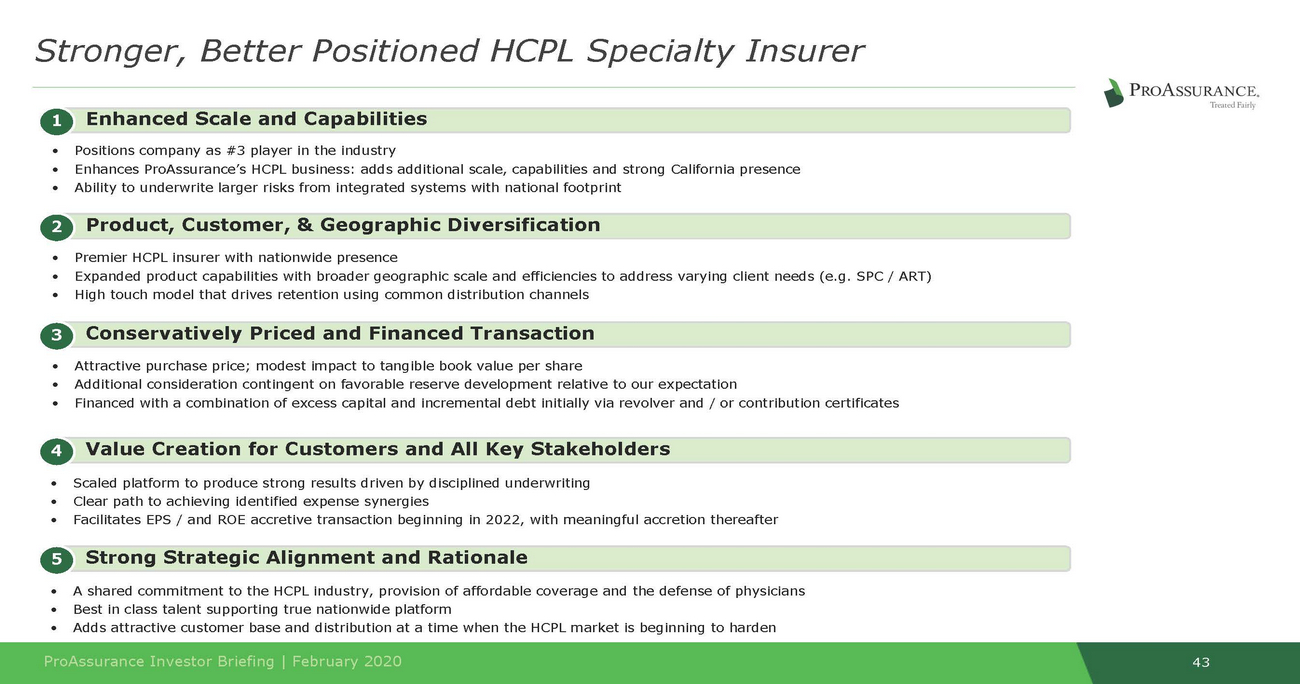
Enhanced Scale and Capabilities 1 • • • Positions company as #3 player in the industry Enhances ProAssurance’s HCPL business: adds additional scale, capabilities and strong California presence Ability to underwrite larger risks from integrated systems with national footprint Product, Customer, & Geographic Diversification Premier HCPL insurer with nationwide presence Expanded product capabilities with broader geographic scale and efficiencies to address varying client needs (e.g. SPC / ART) High touch model that drives retention using common distribution channels 2 • • • Conservatively Priced and Financed Transaction Attractive purchase price; modest impact to tangible book value per share Additional consideration contingent on favorable reserve development relative to our expectation Financed with a combination of excess capital and incremental debt initially via revolver and / or contribution certificates 3 • • • Value Creation for Customers and All Key Stakeholders 4 • • • Scaled platform to produce strong results driven by disciplined underwriting Clear path to achieving identified expense synergies Facilitates EPS / and ROE accretive transaction beginning in 2022, with meaningful accretion thereafter Strong Strategic Alignment and Rationale 5 • • • A shared commitment to the HCPL industry, provision of affordable coverage and the defense of physicians Best in class talent supporting true nationwide platform Adds attractive customer base and distribution at a time when the HCPL market is beginning to harden 43 ProAssurance Investor Briefing | February 2020 Stronger, Better Positioned HCPL Specialty Insurer
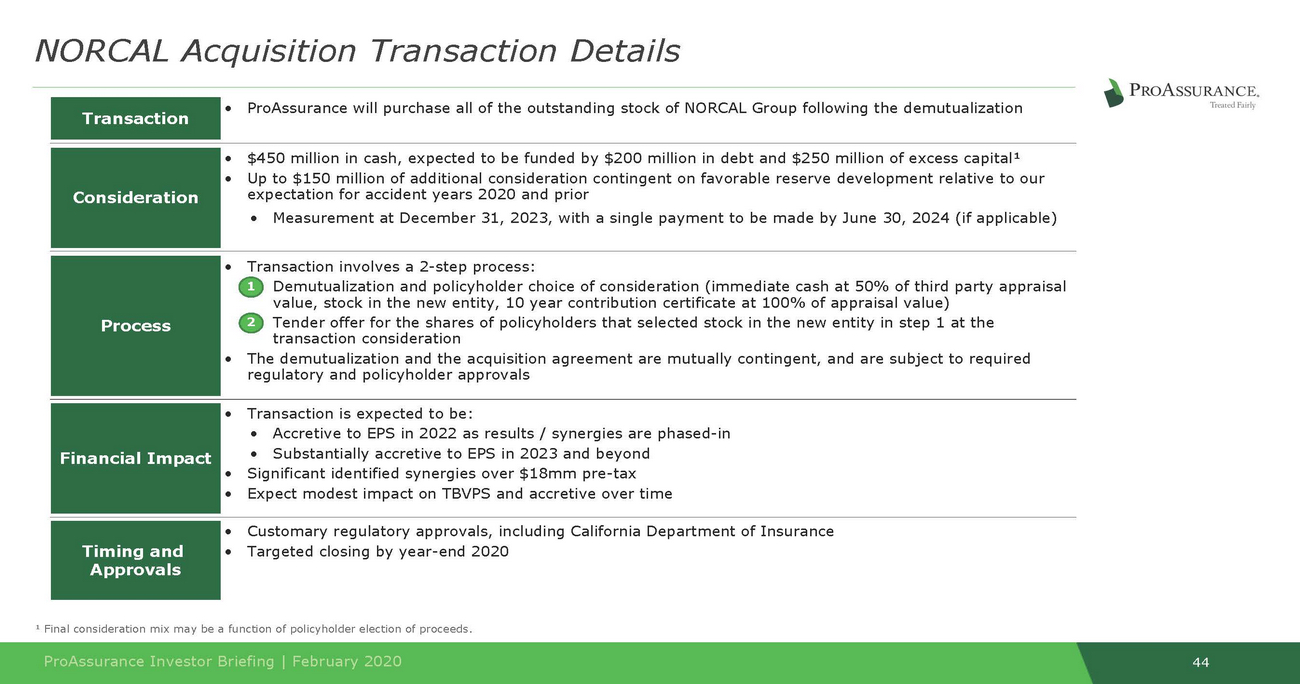
transaction consideration ¹ Final consideration mix may be a function of policyholder election of proceeds. 44 ProAssurance Investor Briefing | February 2020 Transaction •ProAssurance will purchase all of the outstanding stock of NORCAL Group following the demutualization Consideration •$450 million in cash, expected to be funded by $200 million in debt and $250 million of excess capital¹ •Up to $150 million of additional consideration contingent on favorable reserve development relative to our expectation for accident years 2020 and prior •Measurement at December 31, 2023, with a single payment to be made by June 30, 2024 (if applicable) Process •Transaction involves a 2-step process: 1•Demutualization and policyholder choice of consideration (immediate cash at 50% of third party appraisal value, stock in the new entity, 10 year contribution certificate at 100% of appraisal value) 2•Tender offer for the shares of policyholders that selected stock in the new entity in step 1 at the •The demutualization and the acquisition agreement are mutually contingent, and are subject to required regulatory and policyholder approvals Financial Impact •Transaction is expected to be: •Accretive to EPS in 2022 as results / synergies are phased-in •Substantially accretive to EPS in 2023 and beyond •Significant identified synergies over $18mm pre-tax •Expect modest impact on TBVPS and accretive over time Timing and Approvals •Customary regulatory approvals, including California Department of Insurance •Targeted closing by year-end 2020 NORCAL Acquisition Transaction Details
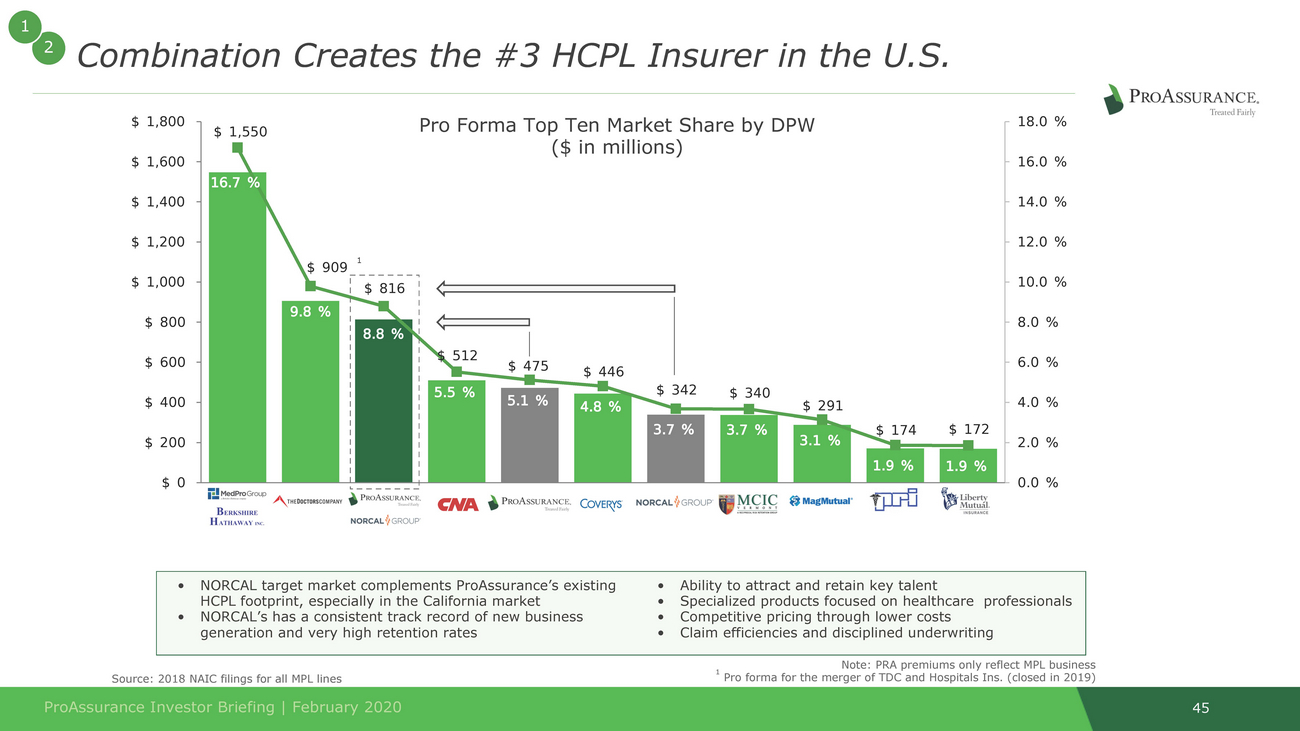
1 1 1 Pro forma for the merger of TDC and Hospitals Ins. (closed in 2019) filings for all MPL lines 45 ProAssurance Investor Briefing | February 2020 •NORCAL target market complements ProAssurance’s existing HCPL footprint, especially in the California market •NORCAL’s has a consistent track record of new business generation and very high retention rates •Ability to attract and retain key talent •Specialized products focused on healthcare professionals •Competitive pricing through lower costs •Claim efficiencies and disciplined underwriting Note: PRA premiums only reflect MPL business Source: 2018 NAIC Pro Forma Top Ten Market Share by DPW ($ in millions) 2Combination Creates the #3 HCPL Insurer in the U.S.
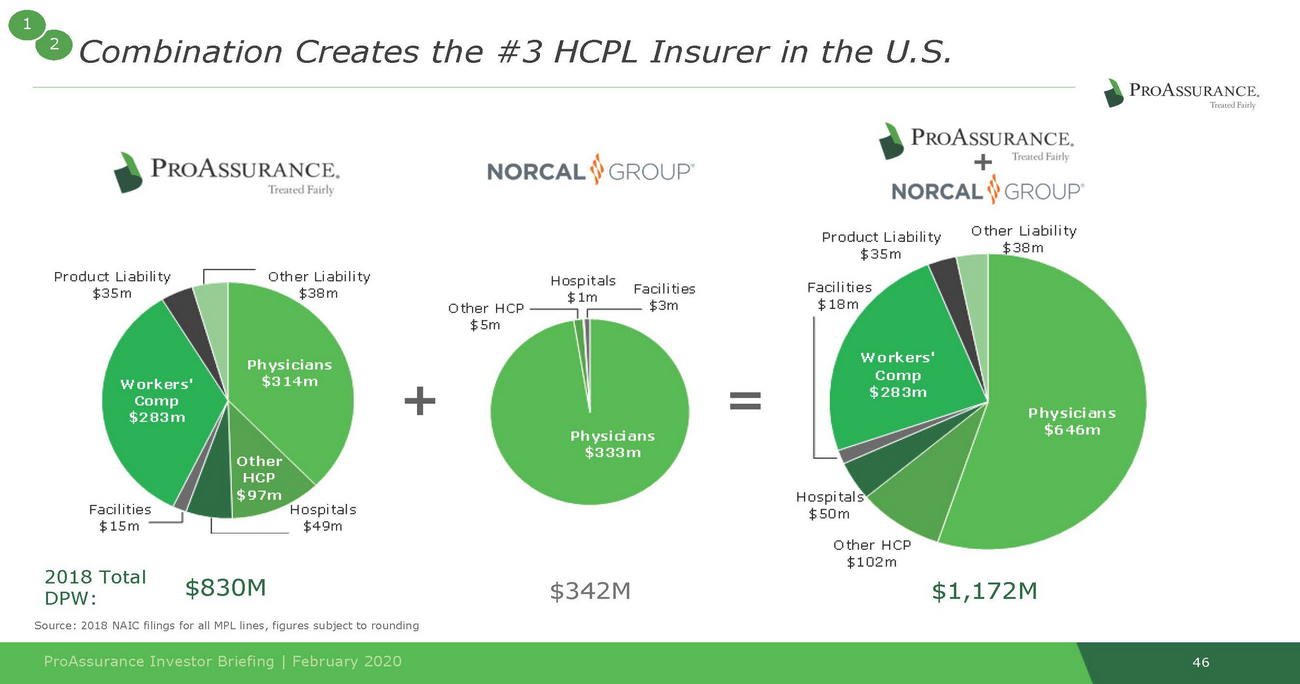
• • combination Creates the #3 HCPL Insurer in the U.S. PROAS+SURANCE. ·l n:ltl'(] b1rl) PROASSURANCE. Ifl tl:'d l-1irh NORCAL ' '\\ GROUP Product Liability $35m Product Liability $35m Hospitals Facilities $1m Other HCP ------., .-------$3m $5m - + 2018 Total DPW: $830M $342M $1,172M Source: 2018 NAIC filings for all MPL lines,figures subject to rounding ProAssurance Investor Briefing I February 2020 46
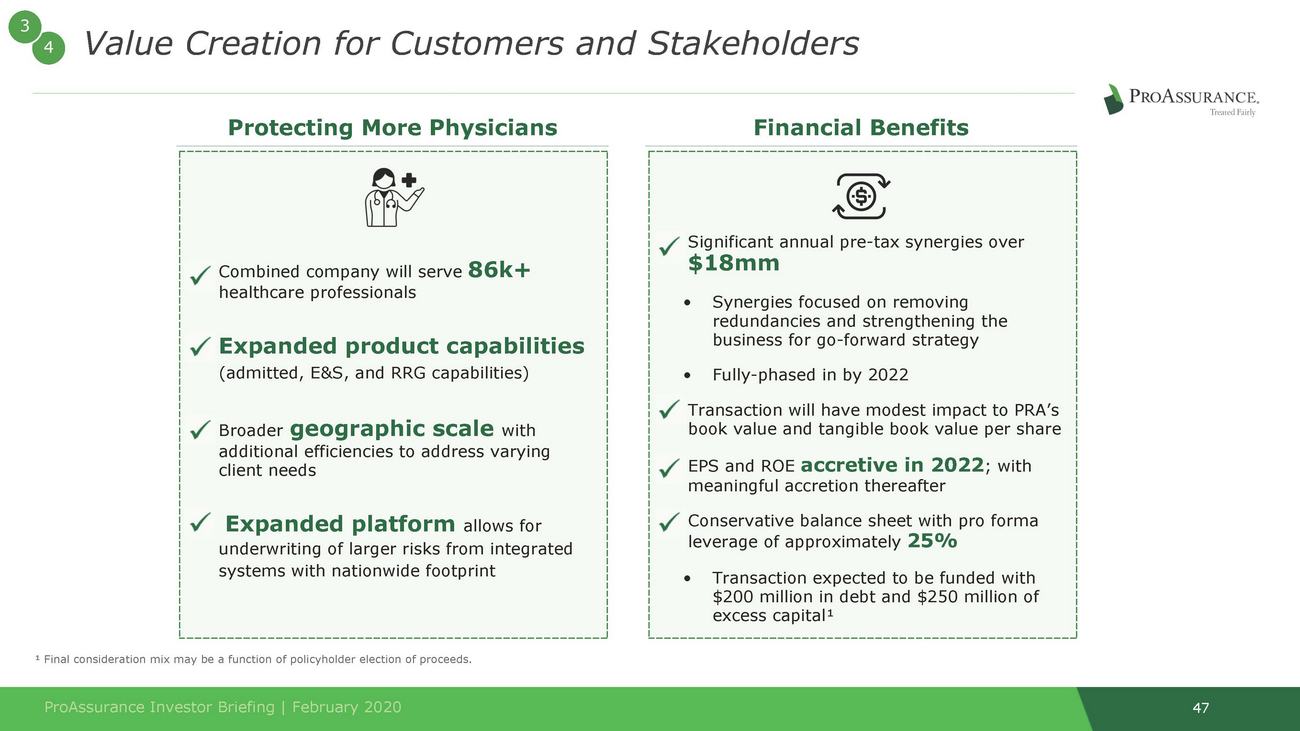
3 Protecting More Physicians book value and tangible book value per share meaningful accretion thereafter leverage of approximately 25% ¹ Final consideration mix may be a function of policyholder election of proceeds. 47 ProAssurance Investor Briefing | February 2020 •Significant annual pre-tax synergies over $18mm •Synergies focused on removing redundancies and strengthening the business for go-forward strategy •Fully-phased in by 2022 •Transaction will have modest impact to PRA’s •EPS and ROE accretive in 2022; with •Conservative balance sheet with pro forma •Transaction expected to be funded with $200 million in debt and $250 million of excess capital¹ •Combined company will serve 86k+ healthcare professionals •Expanded product capabilities (admitted, E&S, and RRG capabilities) •Broader geographic scale with additional efficiencies to address varying client needs •Expanded platform allows for underwriting of larger risks from integrated systems with nationwide footprint Financial Benefits 4Value Creation for Customers and Stakeholders
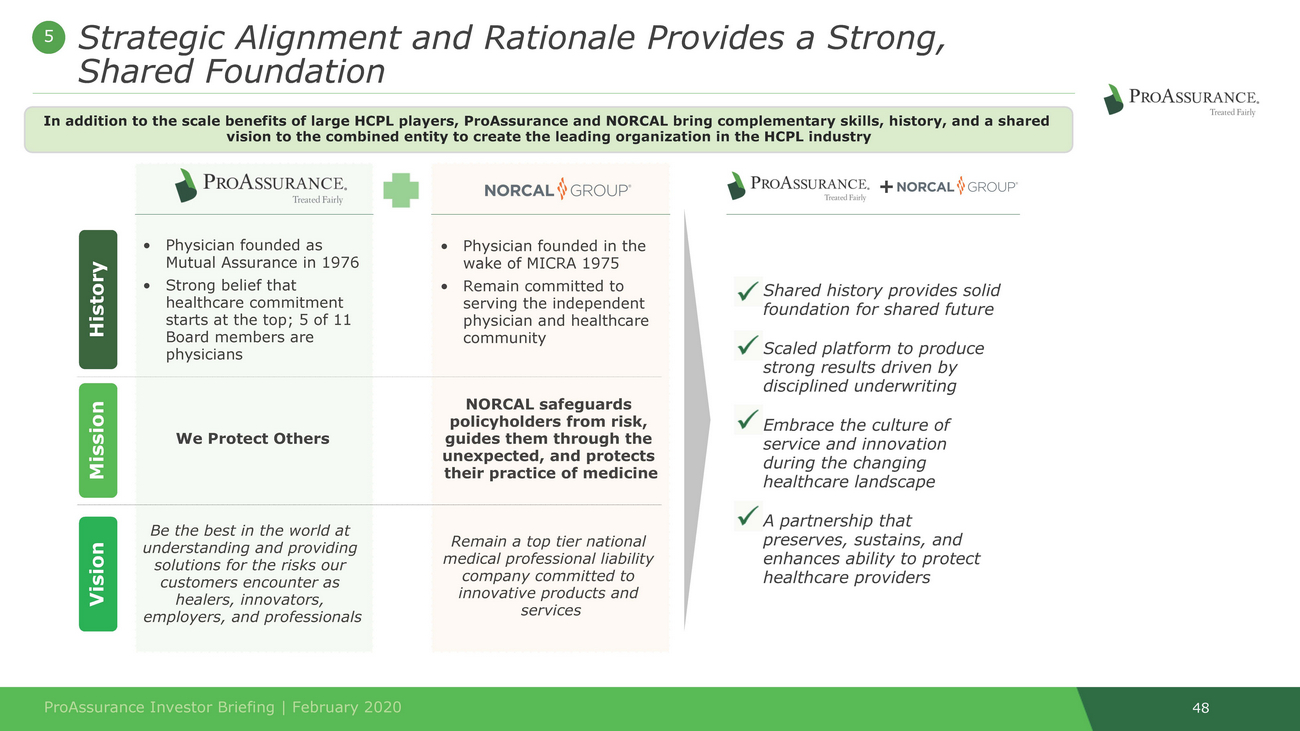
In addition to the scale benefits of large HCPL players, ProAssurance and NORCAL bring complementary skills, history, and a shared vision to the combined entity to create the leading organization in the HCPL industry healthcare commitment physicians guides them through the company committed to services 48 Vision Mission History ProAssurance Investor Briefing | February 2020 • Shared history provides solid foundation for shared future • Scaled platform to produce strong results driven by disciplined underwriting • Embrace the culture of service and innovation during the changing healthcare landscape • A partnership that preserves, sustains, and enhances ability to protect healthcare providers •Physician founded in the wake of MICRA 1975 •Remain committed to serving the independent physician and healthcare community •Physician founded as Mutual Assurance in 1976 •Strong belief that starts at the top; 5 of 11 Board members are NORCAL safeguards We Protect Others policyholders from risk, unexpected, and protects their practice of medicine Be the best in the world at understanding and providing solutions for the risks our customers encounter as healers, innovators, employers, and professionals Remain a top tier national medical professional liability innovative products and + 5Strategic Alignment and Rationale Provides a Strong, Shared Foundation
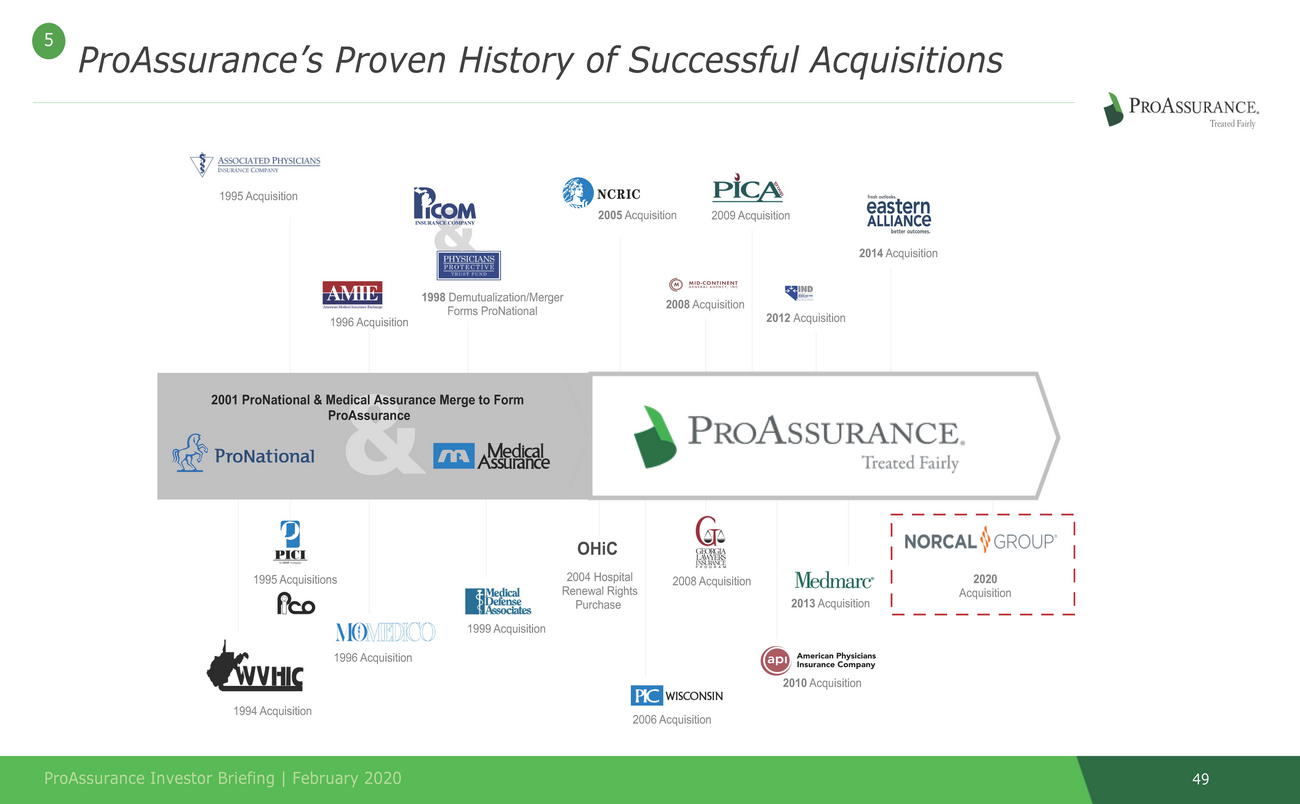
ProAssurance’s Proven History of Successful Acquisitions 1996 Acquisition 2001 ProNational & Me&dical Assurance Merge to Form Acquisition 49 ProAssurance Investor Briefing | February 2020 2006 Acquisition 1994 Acquisition 2010 Acquisition 020 1998 Demutualization/Merger 2008 Acquisition 2012 Acquisition Forms ProNational ProAssurance OHiC 2004 Hospital Renewal Rights Purchase 2 1999 Acquisition 1996 Acquisition 2013 Acquisition 2008 Acquisition 1995 Acquisitions 2014 Acquisition & 2009 Acquisition 2005 Acquisition 1995 Acquisition 5
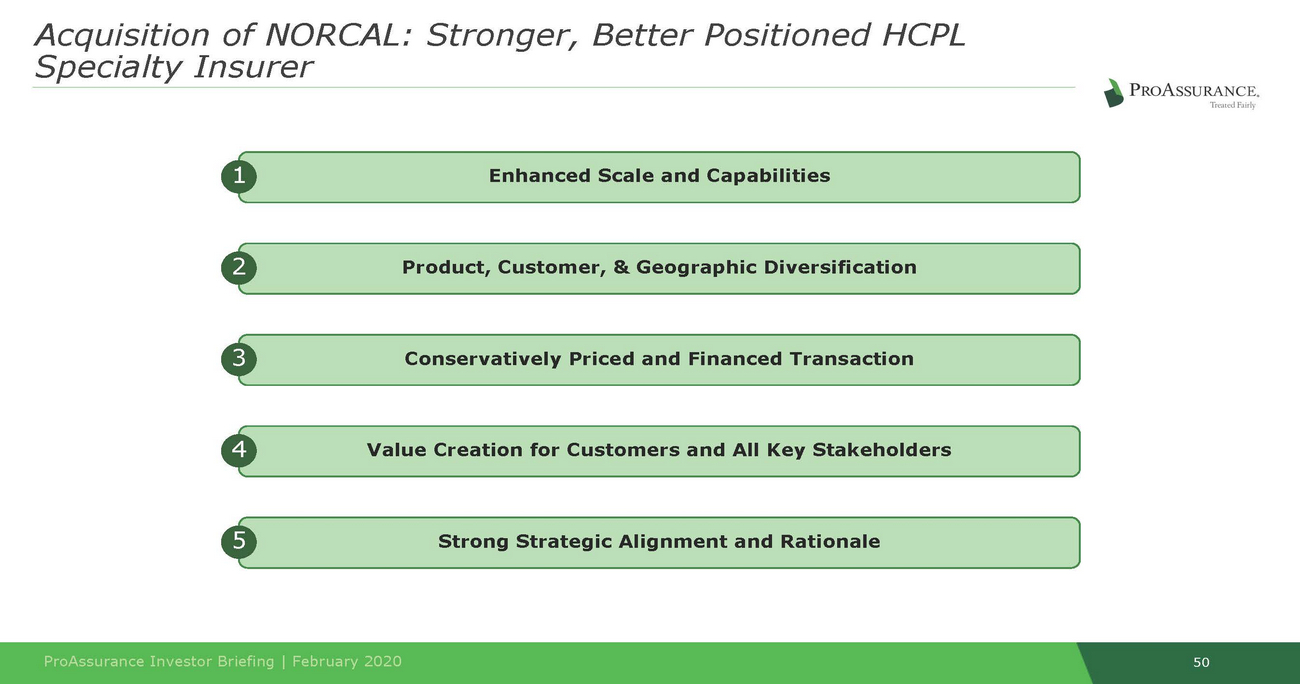
Acquisition of NORCAL: Stronger, Better Positioned HCPL Specialty Insurer 1 Enhanced Scale and Capabilities 2 Product, Customer, & Geographic Diversification 3 Conservatively Priced and Financed Transaction 4 Value Creation for Customers and All Key Stakeholders 5 Strong Strategic Alignment and Rationale 50 ProAssurance Investor Briefing | February 2020

SegmentHighlights
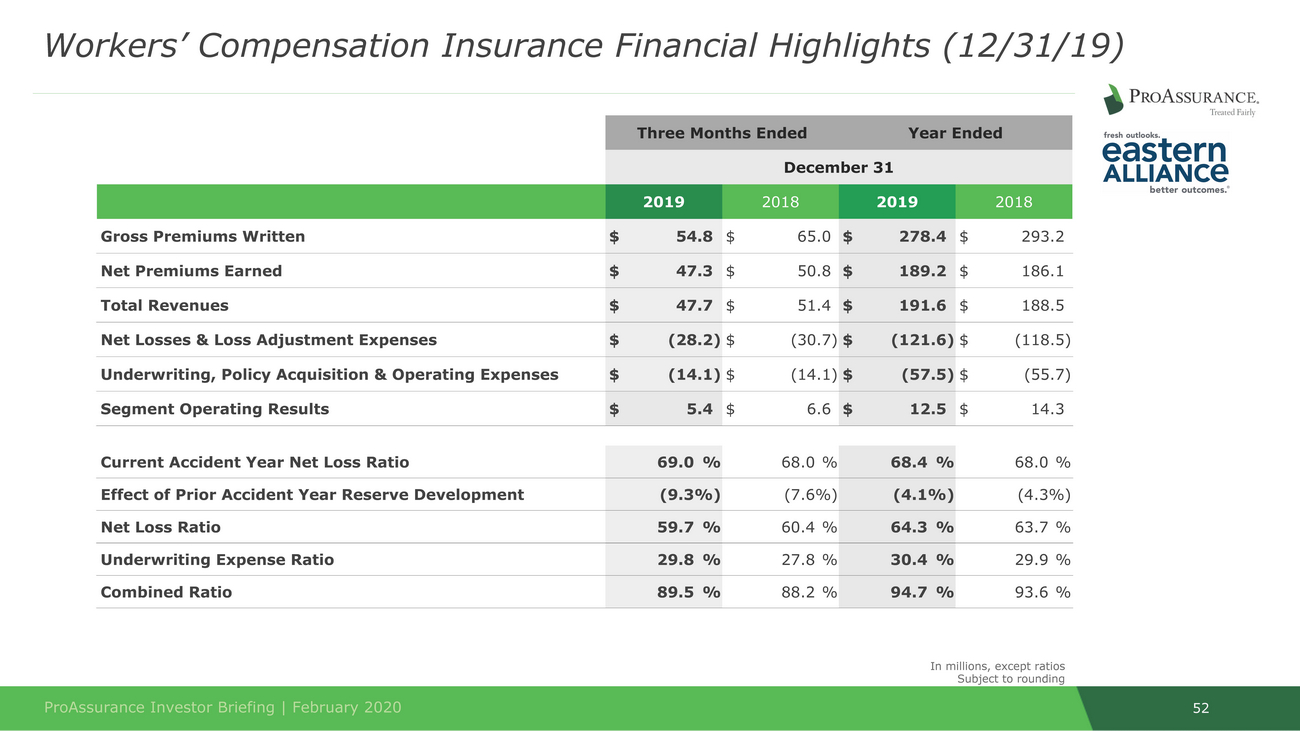
52 ProAssurance Investor Briefing | February 2020 In millions, except ratios Subject to rounding Current Accident Year Net Loss Ratio 69.0 % 68.0 % 68.4 % 68.0 % Effect of Prior Accident Year Reserve Development (9.3%) (7.6%) (4.1%) (4.3%) Net Loss Ratio 59.7 % 60.4 % 64.3 % 63.7 % Underwriting Expense Ratio 29.8 % 27.8 % 30.4 % 29.9 % Combined Ratio 89.5 % 88.2 % 94.7 % 93.6 % Three Months EndedYear Ended 2019 2018 2019 2018 Gross Premiums Written $54.8 $65.0 $278.4 $293.2 Net Premiums Earned $47.3 $50.8 $189.2 $186.1 Total Revenues $47.7 $51.4 $191.6 $188.5 Net Losses & Loss Adjustment Expenses $(28.2) $(30.7) $(121.6) $(118.5) Underwriting, Policy Acquisition & Operating Expenses $(14.1) $(14.1) $(57.5) $(55.7) Segment Operating Results $5.4 $6.6 $12.5 $14.3 Workers’ Compensation Insurance Financial Highlights (12/31/19) December 31
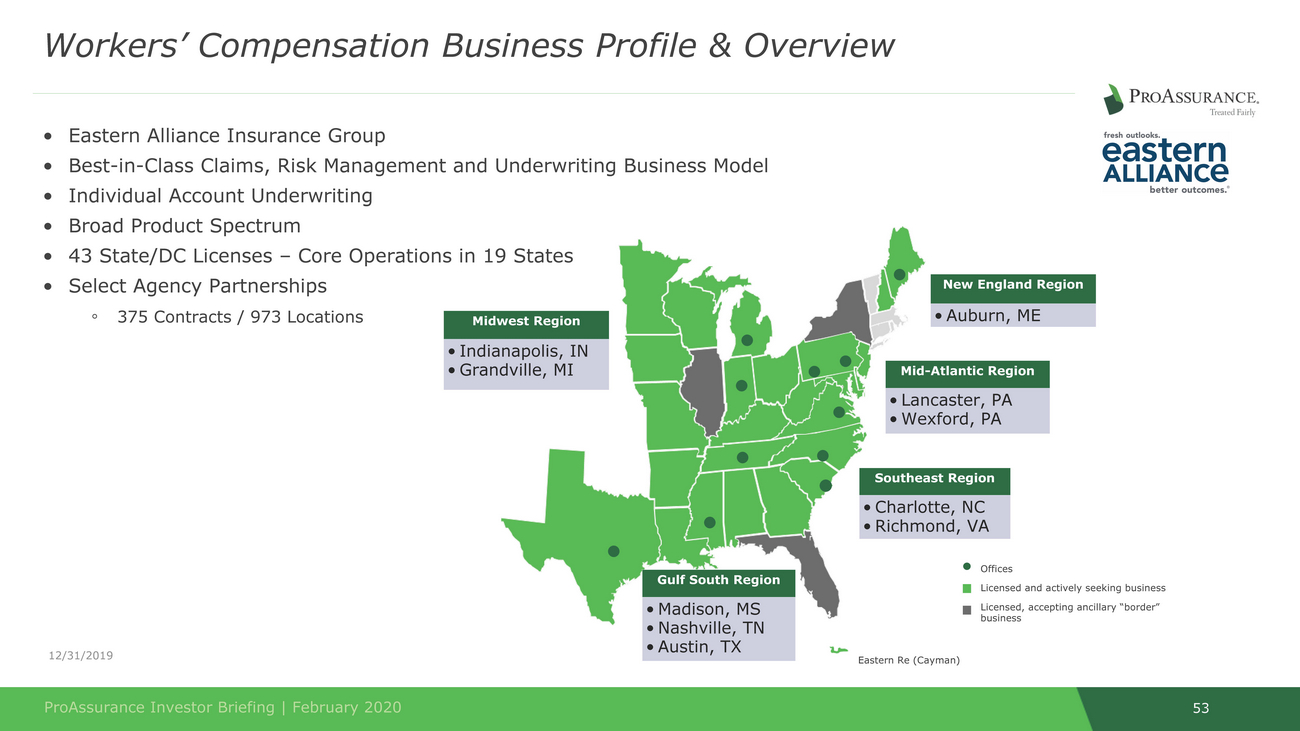
dison, MS shville, TN Austin, TX 53 •Individual Account Underwriting •Broad Product Spectrum •43 State/DC Licenses – Core Operations in 19 States •Select Agency Partnerships ◦375 Contracts / 973 Locations business Gulf South Region • Ma • Na • ProAssurance Investor Briefing | February 2020 Eastern Re (Cayman) 12/31/2019 Offices Licensed and actively seeking business Licensed, accepting ancillary “border” Southeast Region • Charlotte, NC • Richmond, VA Mid-Atlantic Region • Lancaster, PA • Wexford, PA Midwest Region • Indianapolis, IN • Grandville, MI New England Region • Auburn, ME Workers’ Compensation Business Profile & Overview •Eastern Alliance Insurance Group •Best-in-Class Claims, Risk Management and Underwriting Business Model
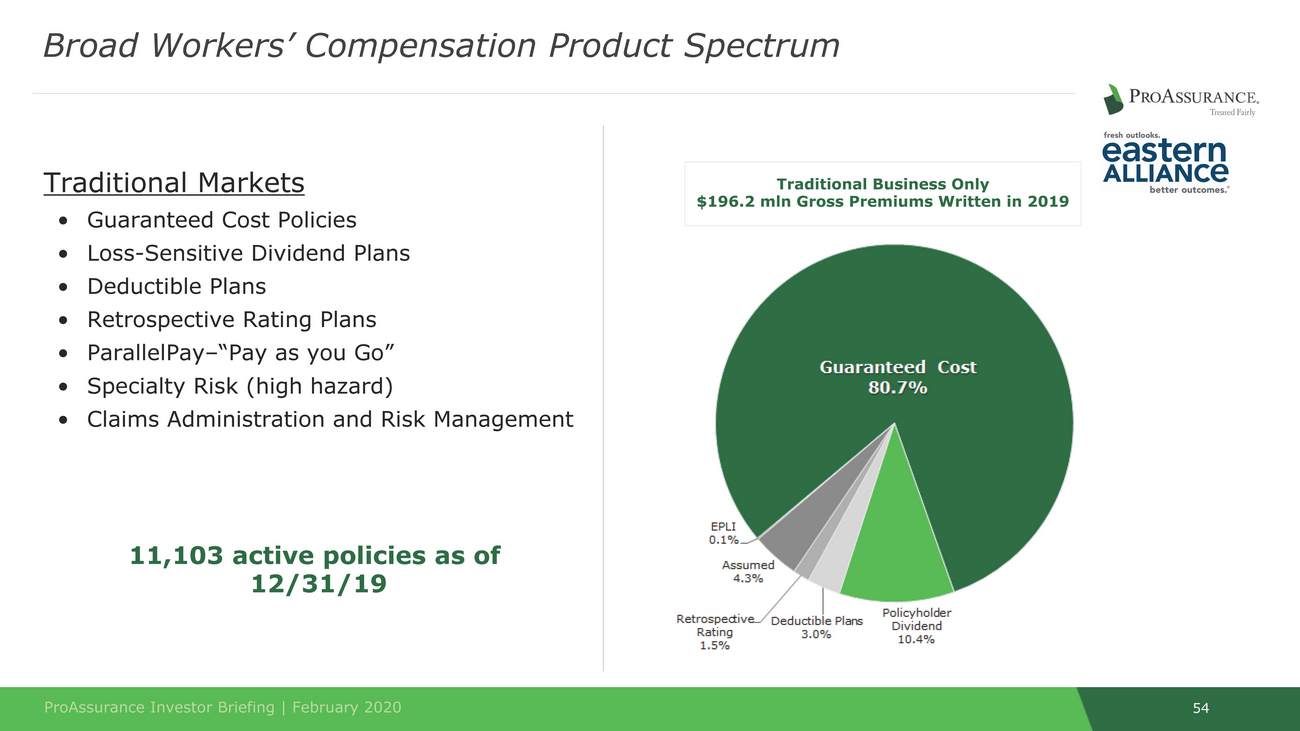
54 ProAssurance Investor Briefing | February 2020 Traditional Markets •Guaranteed Cost Policies •Loss-Sensitive Dividend Plans •Deductible Plans •Retrospective Rating Plans •ParallelPay–“Pay as you Go” •Specialty Risk (high hazard) •Claims Administration and Risk Management 11,103 active policies as of 12/31/19 Traditional Business Only $196.2 mln Gross Premiums Written in 2019 Broad Workers’ Compensation Product Spectrum
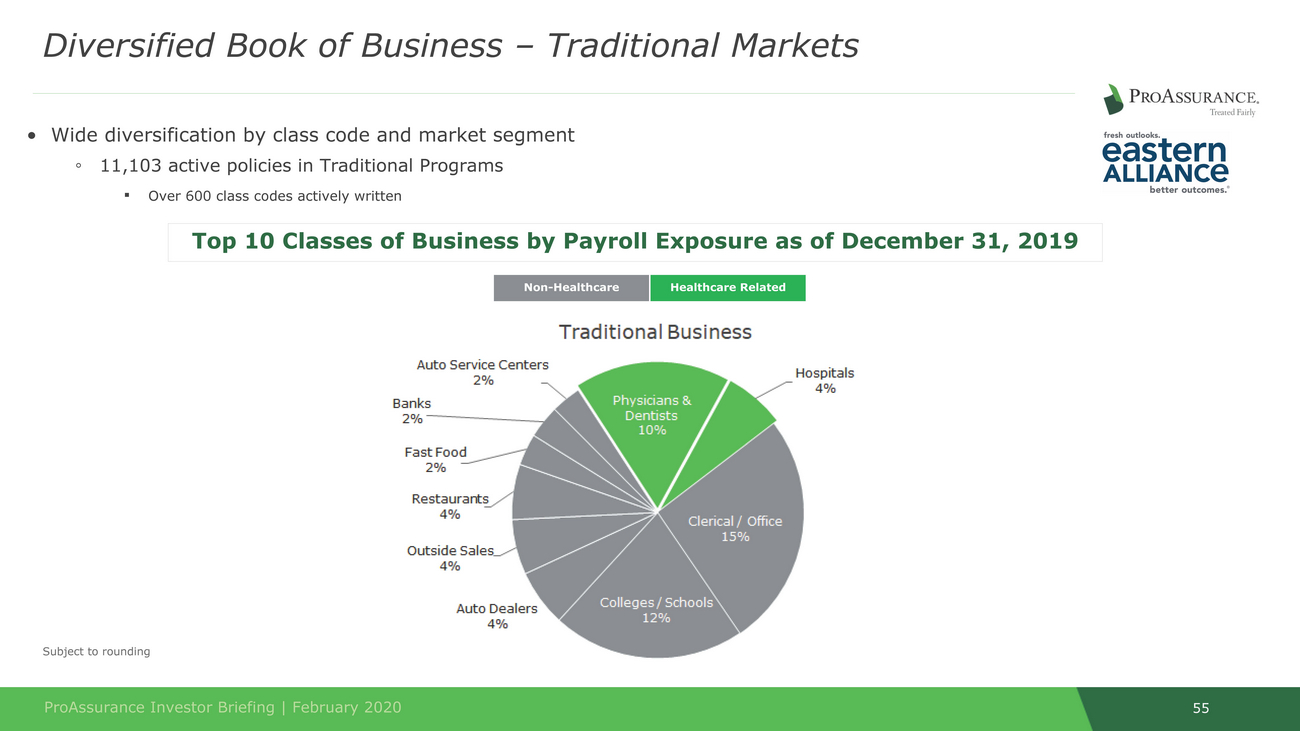
• Wide diversification by class code and market segment ◦ 11,103 active policies in Traditional Programs ▪ Over 600 class codes actively written 55 ProAssurance Investor Briefing | February 2020 Subject to rounding Non-Healthcare Healthcare Related Top 10 Classes of Business by Payroll Exposure as of December 31, 2019 Diversified Book of Business – Traditional Markets
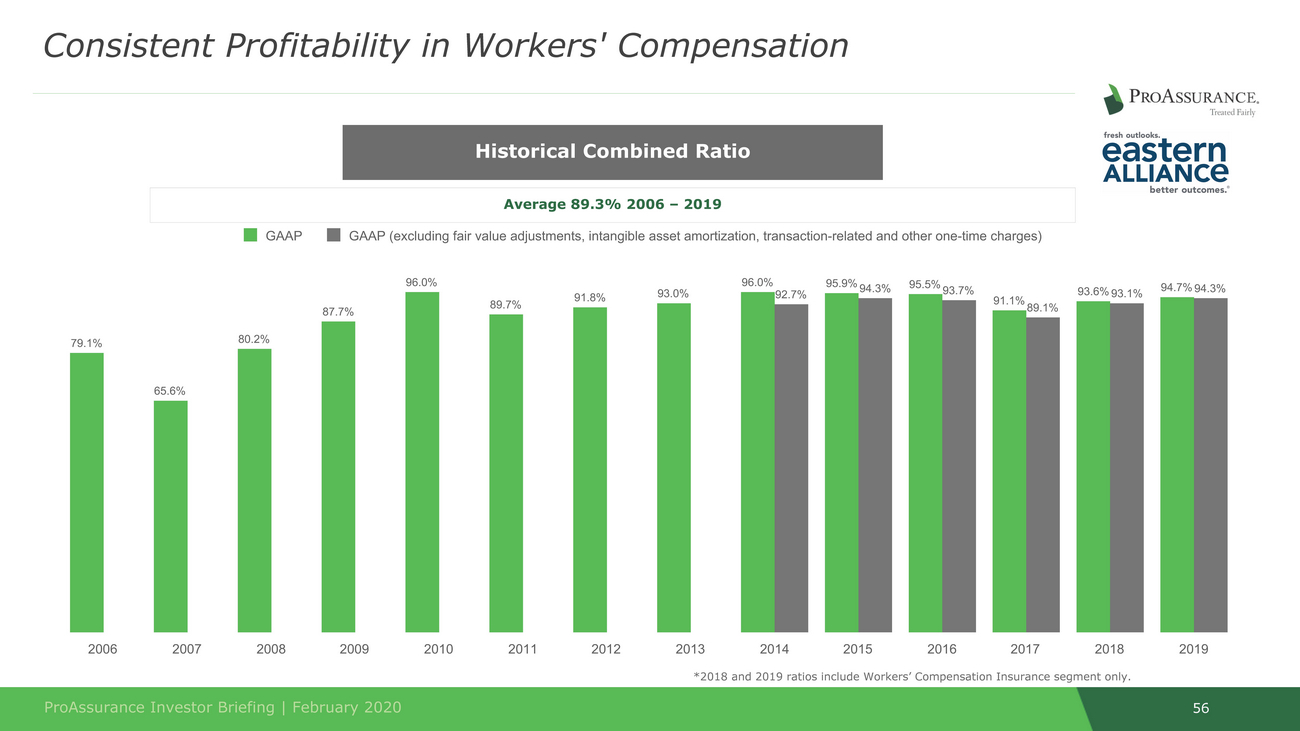
Average 89.3% 2006 – 2019 93.6% 93.1% 93.0% 92.7% 91.8% 91.1% 56 ProAssurance Investor Briefing | February 2020 GAAP GAAP (excluding fair value adjustments, intangible asset amortization, transaction-related and other one-time charges) 96.0% 96.0% 95.9% 94.3% 95.5% 93.7% 94.7% 94.3% 87.7% 89.7% 89.1% 79.1% 80.2% 65.6% 2006 2007 2008 2009 2010 2011 2012 2013 2014 2015 2016 2017 2018 2019 *2018 and 2019 ratios include Workers’ Compensation Insurance segment only. Historical Combined Ratio Consistent Profitability in Workers' Compensation
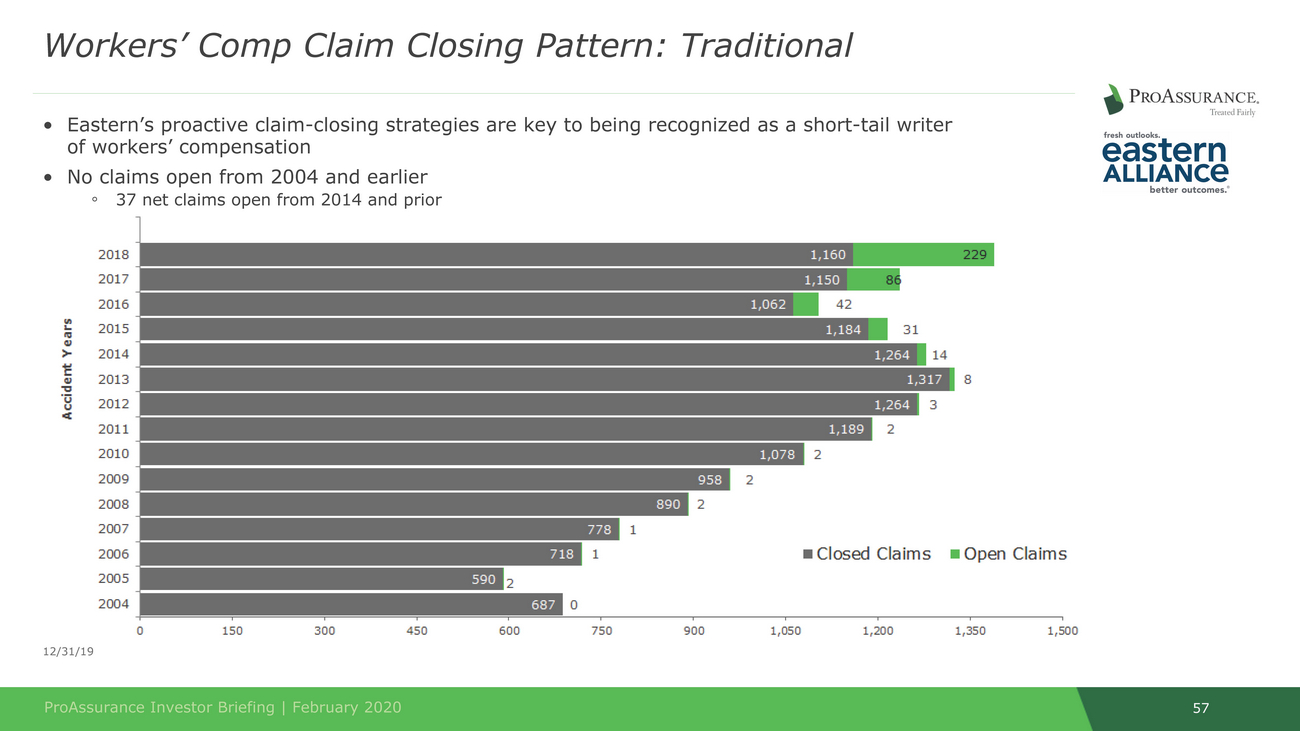
57 ProAssurance Investor Briefing | February 2020 12/31/19 of workers’ compensation •No claims open from 2004 and earlier ◦37 net claims open from 2014 and prior Workers’ Comp Claim Closing Pattern: Traditional •Eastern’s proactive claim-closing strategies are key to being recognized as a short-tail writer

SegmentStrategicReview
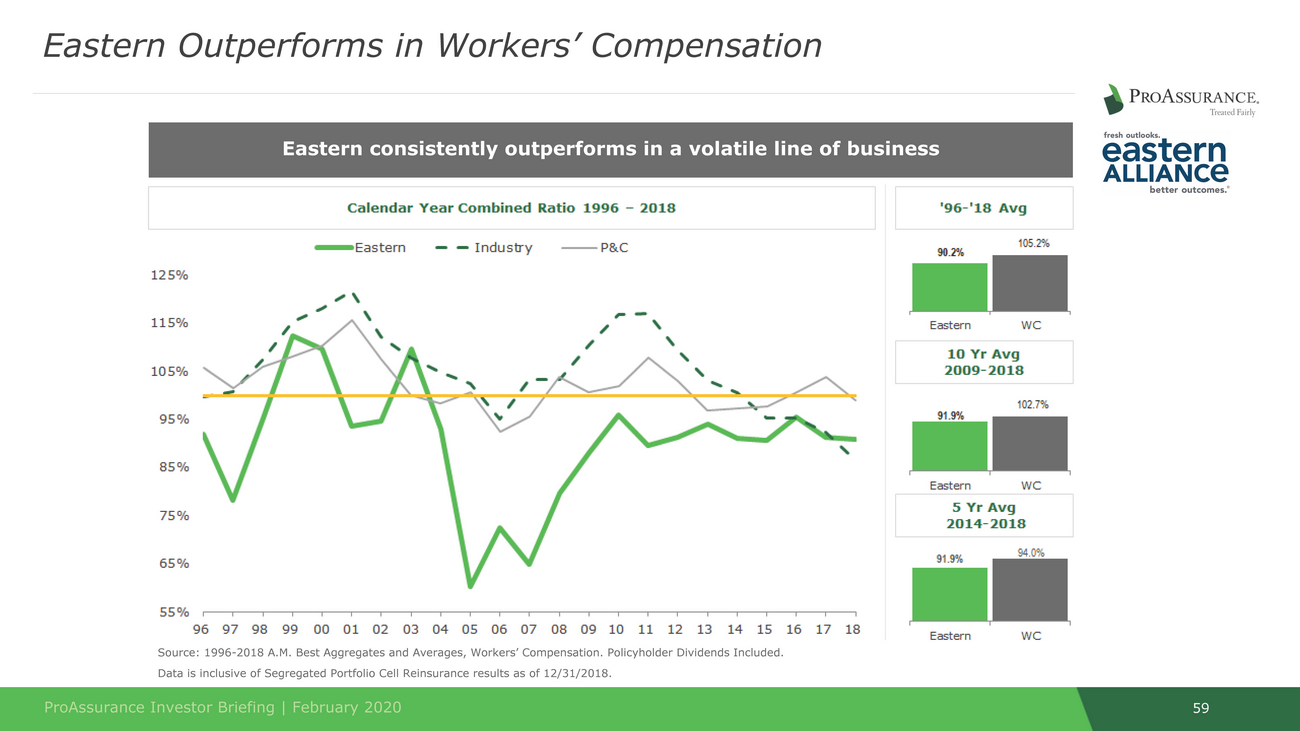
Source: 1996-2018 A.M. Best Aggregates and Averages, Workers’ Compensation. Policyholder Dividends Included. 59 ProAssurance Investor Briefing | February 2020 Data is inclusive of Segregated Portfolio Cell Reinsurance results as of 12/31/2018. Eastern consistently outperforms in a volatile line of business Eastern Outperforms in Workers’ Compensation
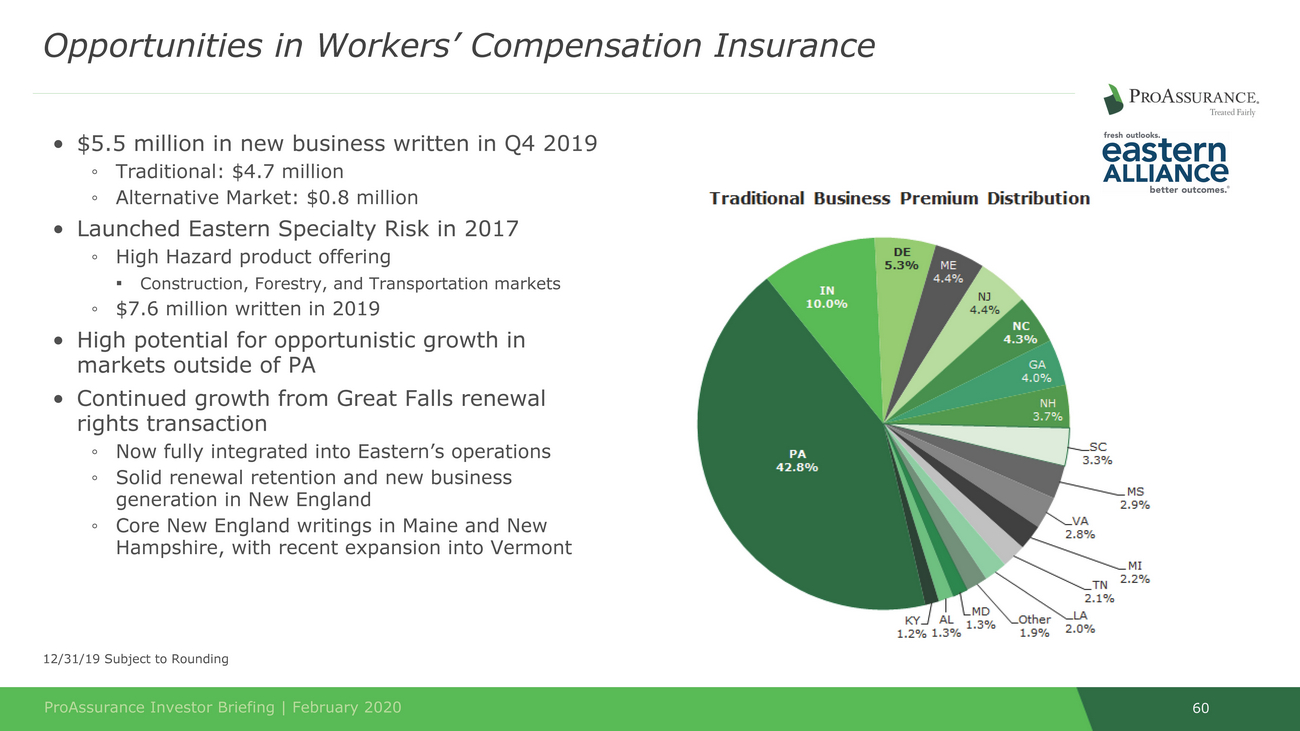
60 ProAssurance Investor Briefing | February 2020 12/31/19 Subject to Rounding • $5.5 million in new business written in Q4 2019 ◦Traditional: $4.7 million ◦Alternative Market: $0.8 million • Launched Eastern Specialty Risk in 2017 ◦High Hazard product offering ▪Construction, Forestry, and Transportation markets ◦$7.6 million written in 2019 • High potential for opportunistic growth in markets outside of PA • Continued growth from Great Falls renewal rights transaction ◦Now fully integrated into Eastern’s operations ◦Solid renewal retention and new business generation in New England ◦Core New England writings in Maine and New Hampshire, with recent expansion into Vermont Opportunities in Workers’ Compensation Insurance

61 ProAssurance Investor Briefing | February 2020 •Dedicated to effective claims management and returning injured workers to wellness •Disciplined individual account underwriting with focus on rate adequacy in rural territories •Understands market dynamics and regulatory concerns ◦ Use of local knowledge that has always differentiated ProAssurance StrategyUpdate:HowEasternDifferentiates
62 ProAssurance Investor Briefing | February 2020 12/31/2019 SpecialtyRisk:HigherRiskButNOTHighRisk •Business Overview ◦Focusing on the next level of risk: higher hazard but not typical “high hazard” ▪Some classes previous written by Eastern in High Modification programs ▪$1.6 million in direct premiums in Q4 2019, $7.6 million in 2019 ◦$8.2 million in direct premiums in 2018 with continuing favorable loss trends ◦Initial submission quantity and quality are solid, largely construction-related and regional transportation risks ◦Business profile aligns with expected growth in payroll/premium in the US, especially in infrastructure-focused industries ◦Broad acceptance from existing agents that have deep relationships with Eastern ◦Many have one or two accounts with competitors and look to move those to Eastern with this option •Expected Loss Profile ◦Loss are expected to be less frequent, but more severe, although mitigated by an excellent reinsurance structure ◦Full support of reinsurance partners ▪Retentions remain the same as in existing business ▪Deepens the reinsurance relationship by providing additional rate for new exposures ◦Loss profile means higher premiums and greater margins ◦Eastern will apply its innovative claims and risk management strategies to shorten the tail, reduce the incidence and severity of claims and enhance workplace safety

SegmentHighlights
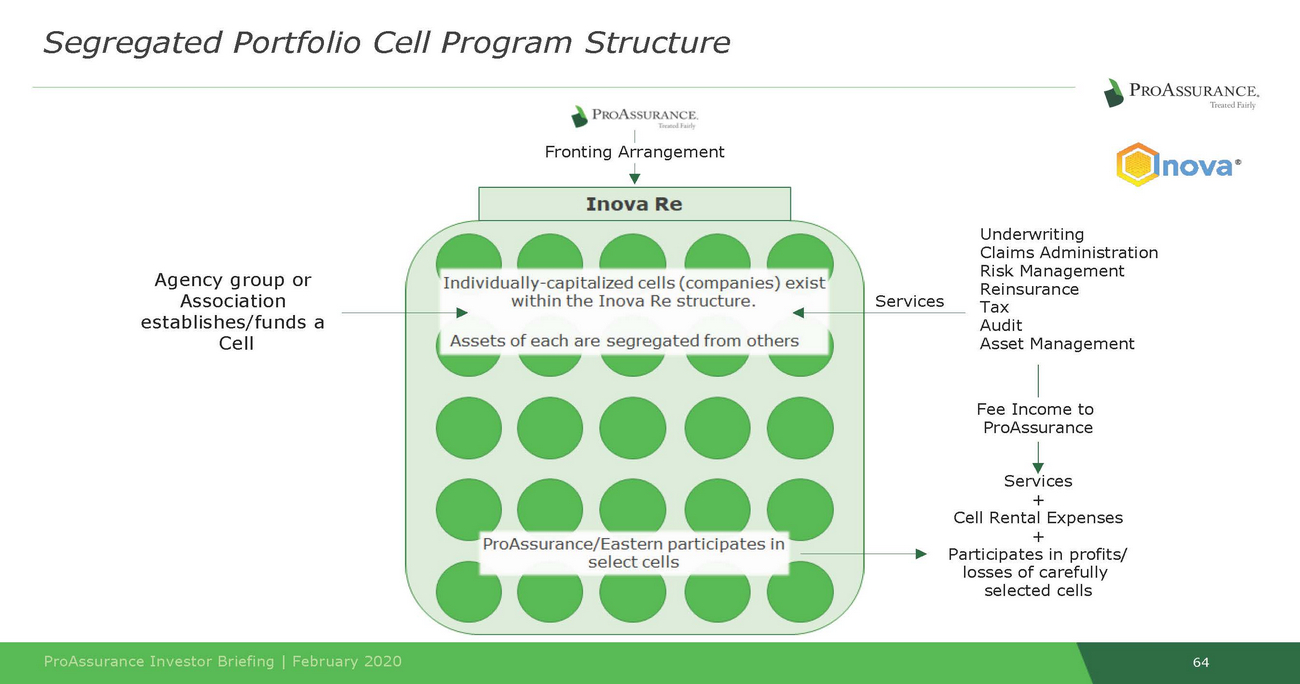
Fronting Arrangement establishes/funds a Cell Asset Management Fee Income to ProAssurance Participates in profits/ losses of carefully selected cells 64 ProAssurance Investor Briefing | February 2020 Services + Cell Rental Expenses + Agency group or Association Underwriting Claims Administration Risk Management Reinsurance Tax Audit Services Segregated Portfolio Cell Program Structure
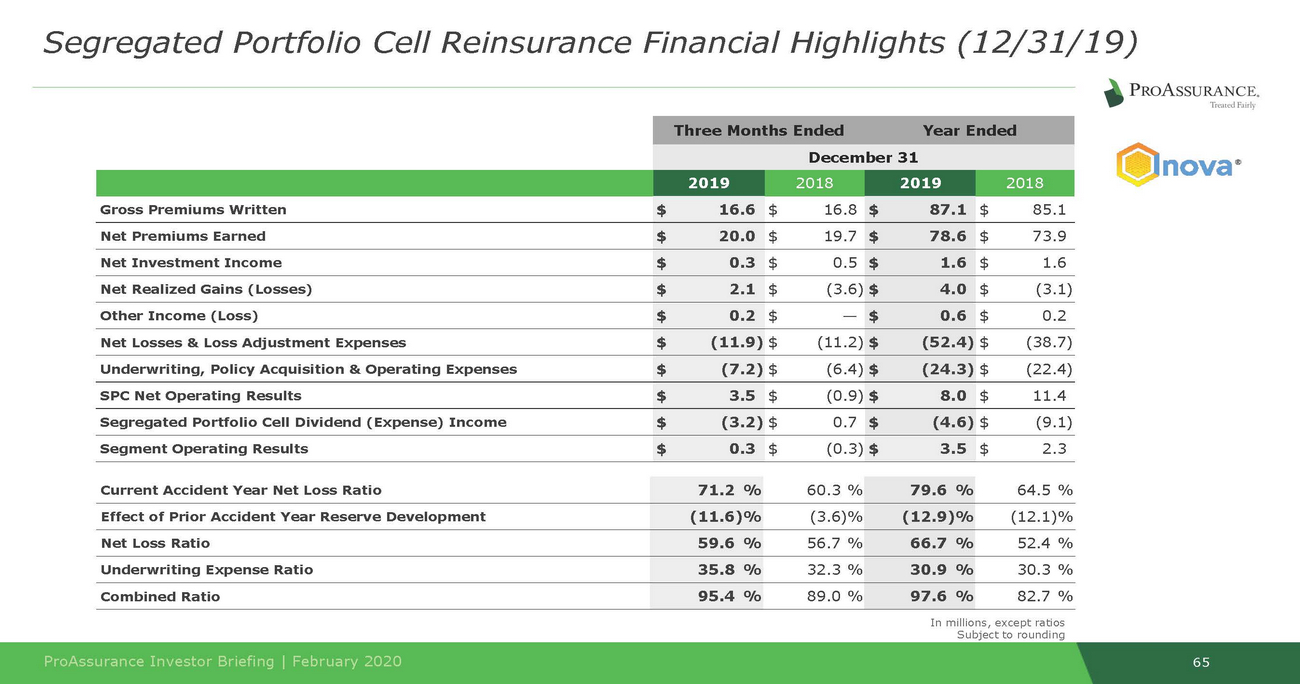
65 ProAssurance Investor Briefing | February 2020 In millions, except ratios Subject to rounding Current Accident Year Net Loss Ratio 71.2 % 60.3 % 79.6 % 64.5 % Effect of Prior Accident Year Reserve Development (11.6)% (3.6)% (12.9)% (12.1)% Net Loss Ratio 59.6 % 56.7 % 66.7 % 52.4 % Underwriting Expense Ratio 35.8 % 32.3 % 30.9 % 30.3 % Combined Ratio 95.4 % 89.0 % 97.6 % 82.7 % Three Months EndedYear Ended December 31 2019 2018 2019 2018 Gross Premiums Written $16.6 $16.8 $87.1 $85.1 Net Premiums Earned $20.0 $19.7 $78.6 $73.9 Net Investment Income $0.3 $0.5 $1.6 $1.6 Net Realized Gains (Losses) $2.1 $(3.6) $4.0 $(3.1) Other Income (Loss) $0.2 $— $0.6 $0.2 Net Losses & Loss Adjustment Expenses $(11.9) $(11.2) $(52.4) $(38.7) Underwriting, Policy Acquisition & Operating Expenses $(7.2) $(6.4) $(24.3) $(22.4) SPC Net Operating Results $3.5 $(0.9) $8.0 $11.4 Segregated Portfolio Cell Dividend (Expense) Income $(3.2) $0.7 $(4.6) $(9.1) Segment Operating Results $0.3 $(0.3) $3.5 $2.3 Segregated Portfolio Cell Reinsurance Financial Highlights (12/31/19)
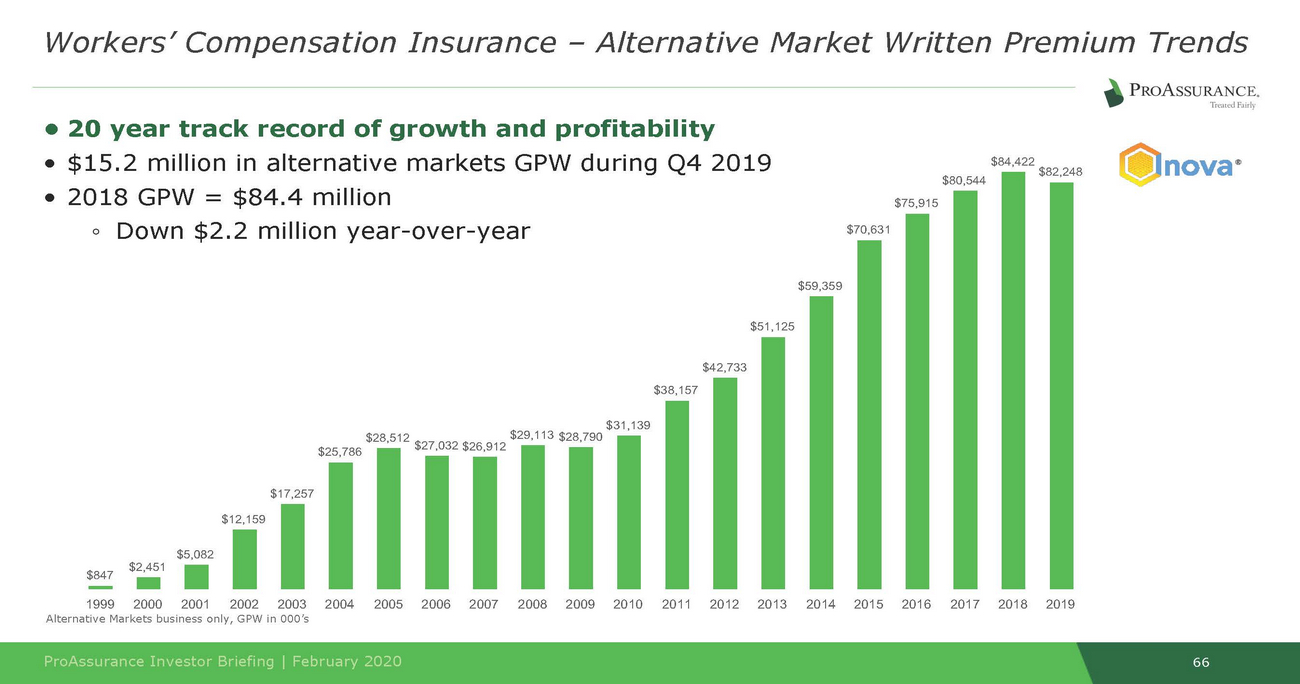
• 20 year track record of growth and profitability $28,512 $27,032 $26,912 $29,113 $28,790 $847 lternative Markets business only, GPW in 000’s 66 ProAssurance Investor Briefing | February 2020 Workers’ Compensation Insurance – Alternative Market Written Premium Trends • • $15.2 million in alternative markets GPW during Q4 2019$84,422 $82,248 $80,544 2018 GPW = $84.4 million$75,915 ◦Down $2.2 million year-over-year$70,631 $59,359 $51,125 $42,733 $38,157 $31,139 $25,786 $17,257 $12,159 $5,082 $2,451 1999 2000 2001 2002 2003 2004 2005 2006 2007 2008 2009 2010 2011 2012 2013 2014 2015 2016 2017 2018 2019 A
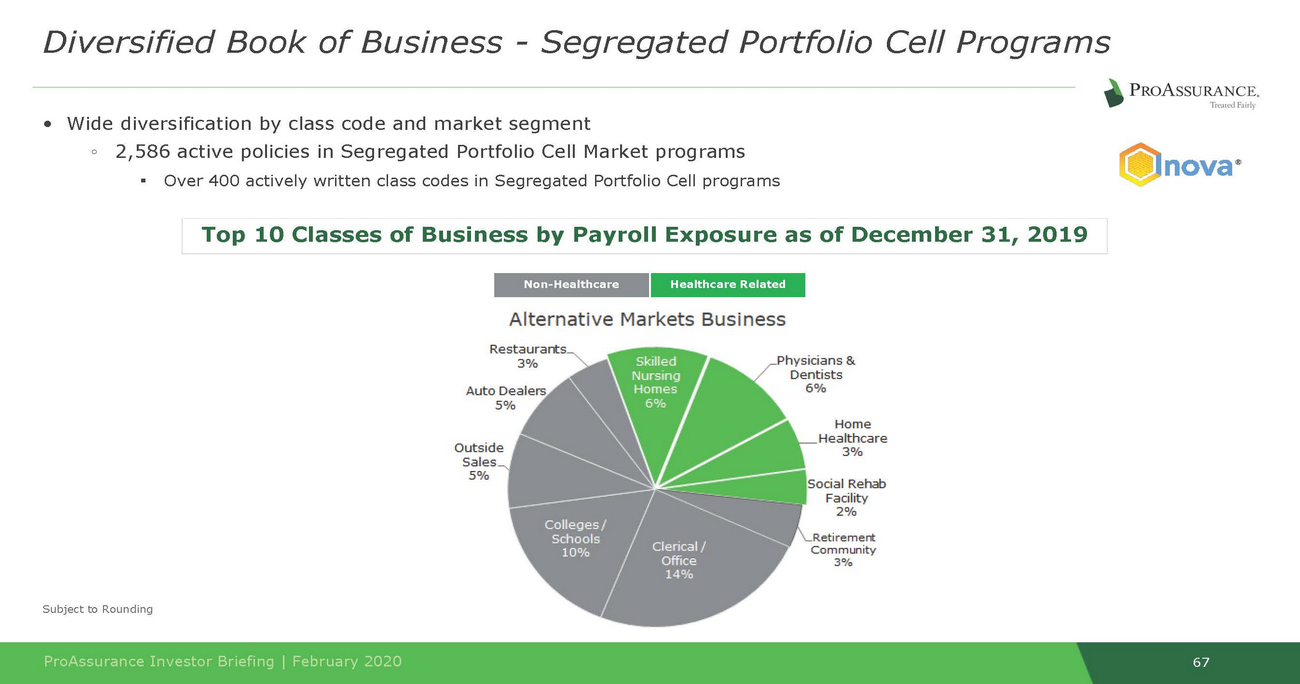
• Wide diversification by class code and market segment Subject to Rounding 67 ProAssurance Investor Briefing | February 2020 Diversified Book of Business - Segregated Portfolio Cell Programs ◦2,586 active policies in Segregated Portfolio Cell Market programs ▪Over 400 actively written class codes in Segregated Portfolio Cell programs Non-Healthcare Healthcare Related Top 10 Classes of Business by Payroll Exposure as of December 31, 2019
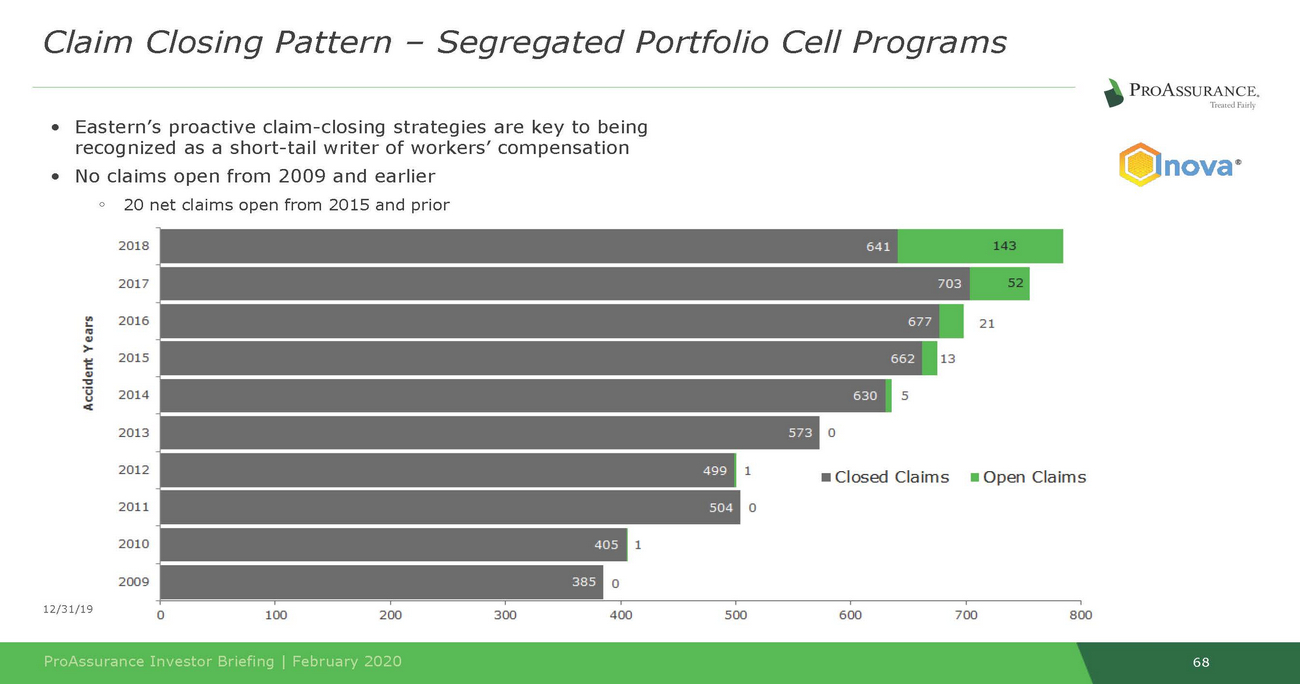
68 ProAssurance Investor Briefing | February 2020 12/31/19 •Eastern’s proactive claim-closing strategies are key to being recognized as a short-tail writer of workers’ compensation •No claims open from 2009 and earlier ◦20 net claims open from 2015 and prior Claim Closing Pattern – Segregated Portfolio Cell Programs

SegmentStrategicReview
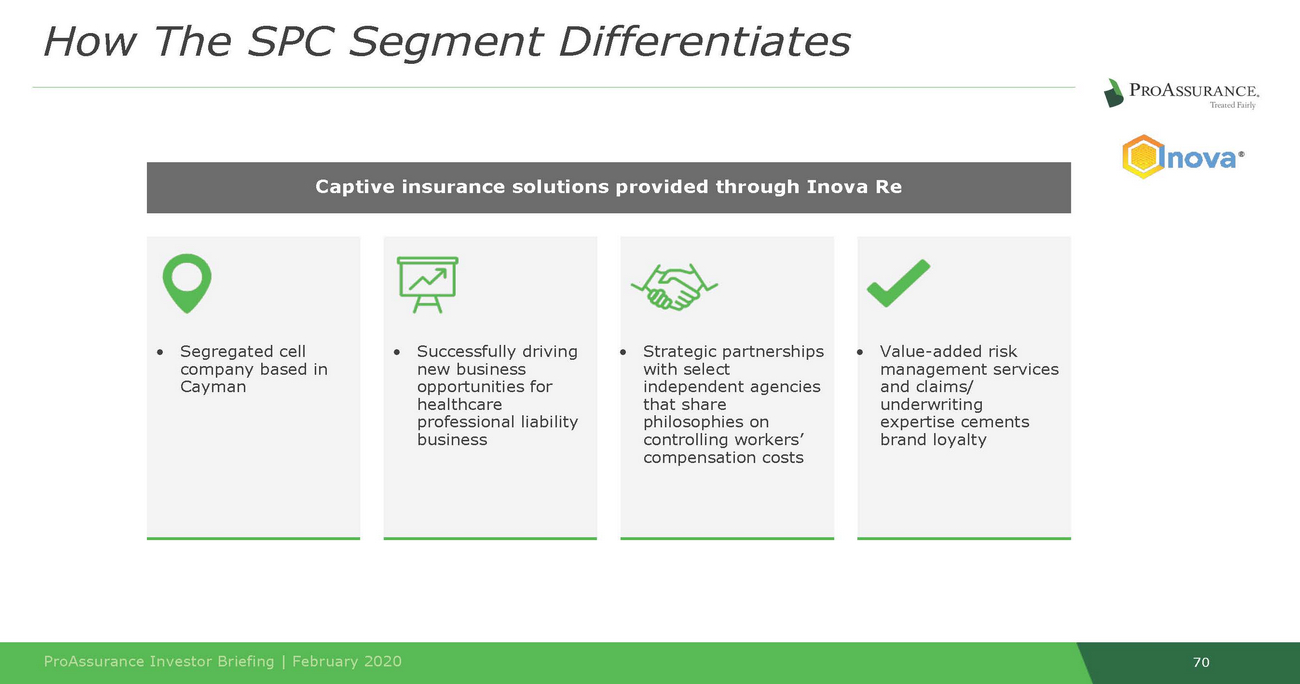
70 ProAssurance Investor Briefing | February 2020 •Successfully driving new business opportunities for healthcare professional liability business •Segregated cell company based in Cayman •Strategic partnerships with select independent agencies that share philosophies on controlling workers’ compensation costs •Value-added risk management services and claims/ underwriting expertise cements brand loyalty Captive insurance solutions provided through Inova Re HowTheSPCSegmentDifferentiates

71 ProAssurance Investor Briefing | February 2020 • Alternative market solutions are in high demand ◦Fast growing sector of the Property and Casualty marketplace • Segregated Portfolio Cells are a high ROE product with significant retention ◦Low capital requirement by not assuming risk ◦Fee-based revenue diversifies earnings that are largely based on underwriting ◦Jointly-owned SPCs Inova brand launched in Q1 of 2014 • Unique product offering differentiates Eastern & ProAssurance ◦HCPL / WC lines in a single SPC ◦Leverage “mono-line” expertise for both ◦With the uncertainty created by healthcare reform, it is more important than ever for healthcare organizations to manage “controllable” expenses • Enhances agency partnerships ◦Risk sharing (joint ownership) educates agents on principles of underwriting, risk management and claims administration HowSegregatedPortfolioCellsBenefitProAssurance
• “Turn-key” Operation to finish ◦ Flexible ownership ◦ Account management, underwriting, claims, 72 ProAssurance Investor Briefing | February 2020 HowSegregatedPortfolioCellsBenefitInsureds ◦Provides simple and easy transition from start ◦Minimal start-up capitalization • Monthly and Annual Reporting Package ◦Detailed monthly reporting package ◦Quarterly actuarial reviews and financials • Opportunities to Participate in Profit • Dedicated Service Team risk management, marketing, accounting, premium audit • Highly Rated Paper • Stable Off-Shore Facility ◦Over 30 years in operation (since 1987) ◦Cayman Islands Monetary Authority regulation ◦Segregated portfolio cells statutorily protected from each other • Multi-State Coverage • “Fully-Bundled” Approach ◦No need for separate service agreements or providers • Access to ProAssurance / Eastern Reinsurance Markets ◦Reinsurance Program Protection
73 ProAssurance Investor Briefing | February 2020 * 6/30/19. Cayman Islands Monetary Authority: https://www.cima.ky/upimages/commonfiles/StatsbyPrimaryClassofBusiness-website_1563201694.pdf AdvantagesoftheCaymanIslandsDomicile • Second largest captive domicile in the world ◦Largest healthcare captive domicile in the world ◦90% of business from North America • Healthcare captives represent 33.2% of all captives • Medical professional liability is the largest primary line followed by workers’ compensation ◦Medical Malpractice: $5.8 billion in period premiums ($14.8 bln in Assets) ◦Workers’ Compensation: $4.0 billion in premiums ($11.9 bln in Assets) • CIMA: Cayman Islands Monetary Authority • Strong regulatory structure ◦SPC Legislation

SegmentHighlights
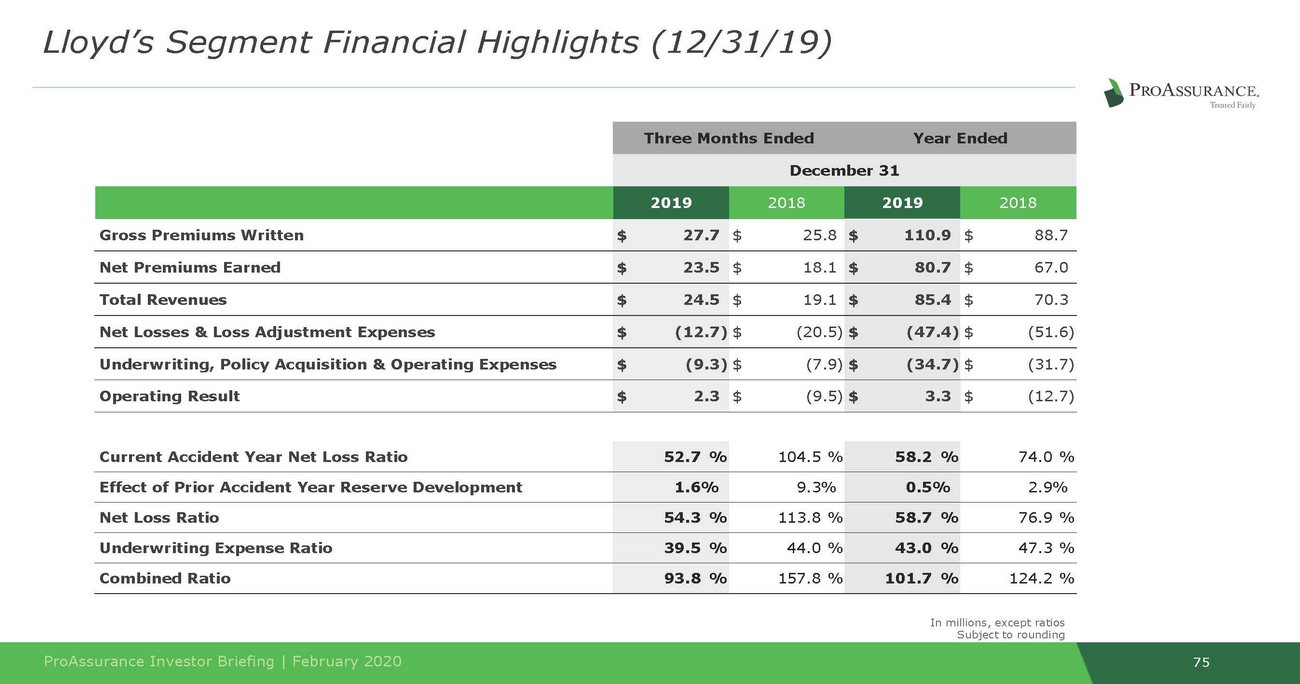
75 ProAssurance Investor Briefing | February 2020 In millions, except ratios Subject to rounding Current Accident Year Net Loss Ratio 52.7 % 104.5 % 58.2 % 74.0 % Effect of Prior Accident Year Reserve Development 1.6% 9.3% 0.5% 2.9% Net Loss Ratio 54.3 % 113.8 % 58.7 % 76.9 % Underwriting Expense Ratio 39.5 % 44.0 % 43.0 % 47.3 % Combined Ratio 93.8 % 157.8 % 101.7 % 124.2 % Three Months EndedYear Ended December 31 2019 2018 2019 2018 Gross Premiums Written $27.7 $25.8 $110.9 $88.7 Net Premiums Earned $23.5 $18.1 $80.7 $67.0 Total Revenues $24.5 $19.1 $85.4 $70.3 Net Losses & Loss Adjustment Expenses $(12.7) $(20.5) $(47.4) $(51.6) Underwriting, Policy Acquisition & Operating Expenses $(9.3) $(7.9) $(34.7) $(31.7) Operating Result $2.3 $(9.5) $3.3 $(12.7) Lloyd’s Segment Financial Highlights (12/31/19)
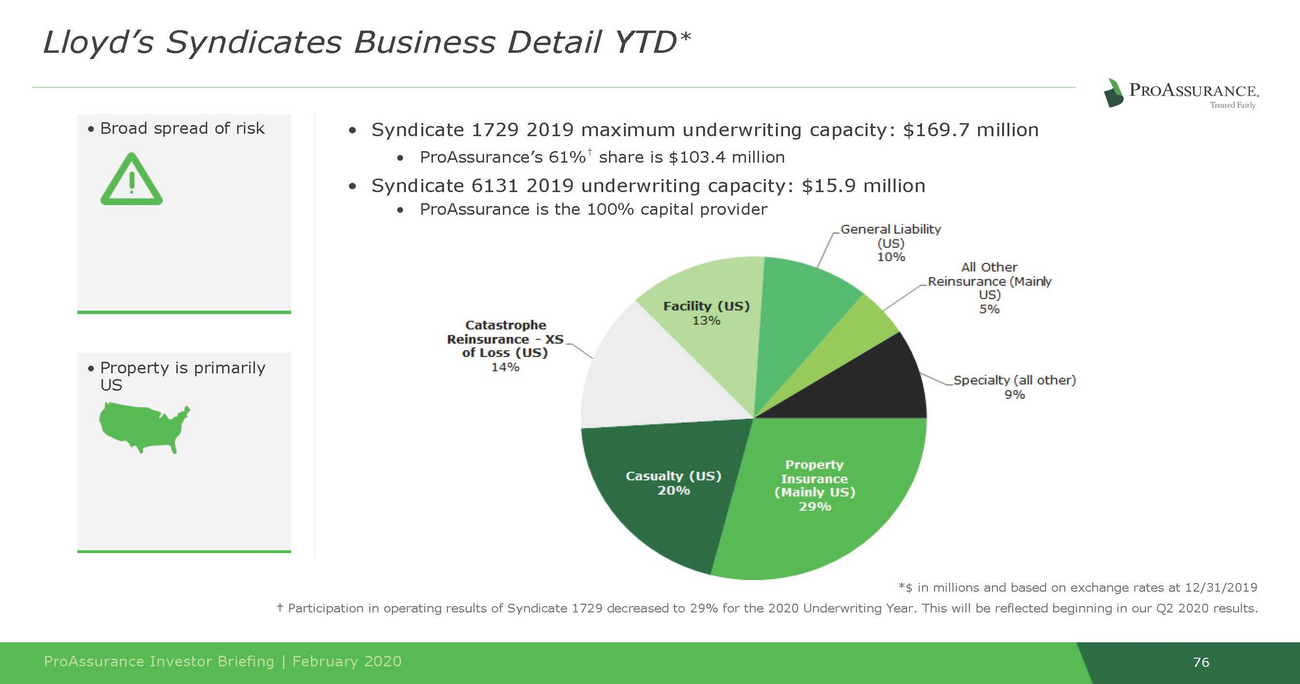
*$ in millions and based on exchange rates at 12/31/2019 76 ProAssurance Investor Briefing | February 2020 † Participation in operating results of Syndicate 1729 decreased to 29% for the 2020 Underwriting Year. This will be reflected beginning in our Q2 2020 results. • Property is primarily US •Syndicate 1729 2019 maximum underwriting capacity: $169.7 million •ProAssurance’s 61%† share is $103.4 million •Syndicate 6131 2019 underwriting capacity: $15.9 million •ProAssurance is the 100% capital provider • Broad spread of risk Lloyd’s Syndicates Business Detail YTD*
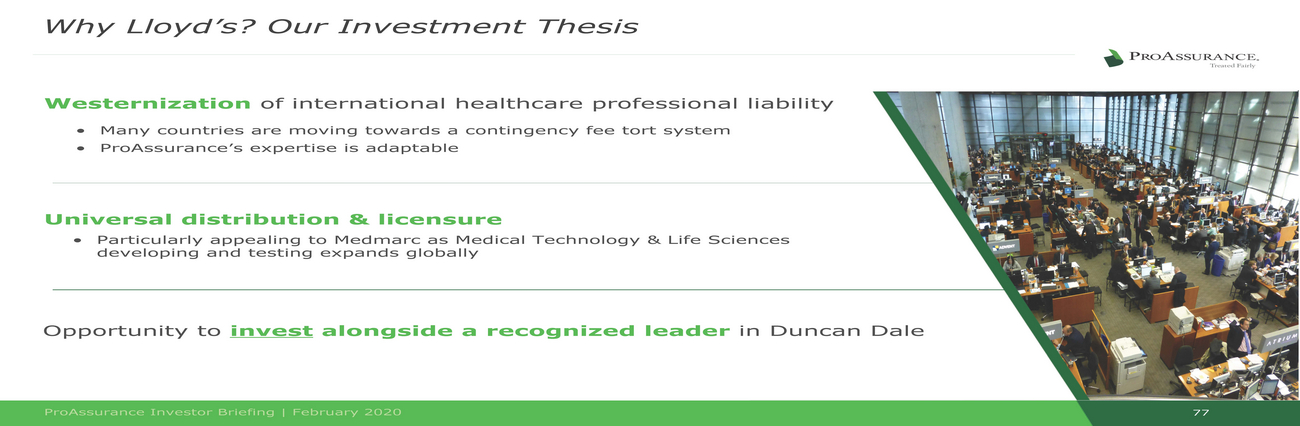
• Particularly appealing to Medmarc as Medical Technology & Life Sciences 77 ProAssurance Investor Briefing | February 2020 Opportunity to invest alongside a recognized leader in Duncan Dale Universal distribution & licensure developing and testing expands globally Why Lloyd’s? Our Investment Thesis Westernization of international healthcare professional liability •Many countries are moving towards a contingency fee tort system •ProAssurance’s expertise is adaptable

Appendix
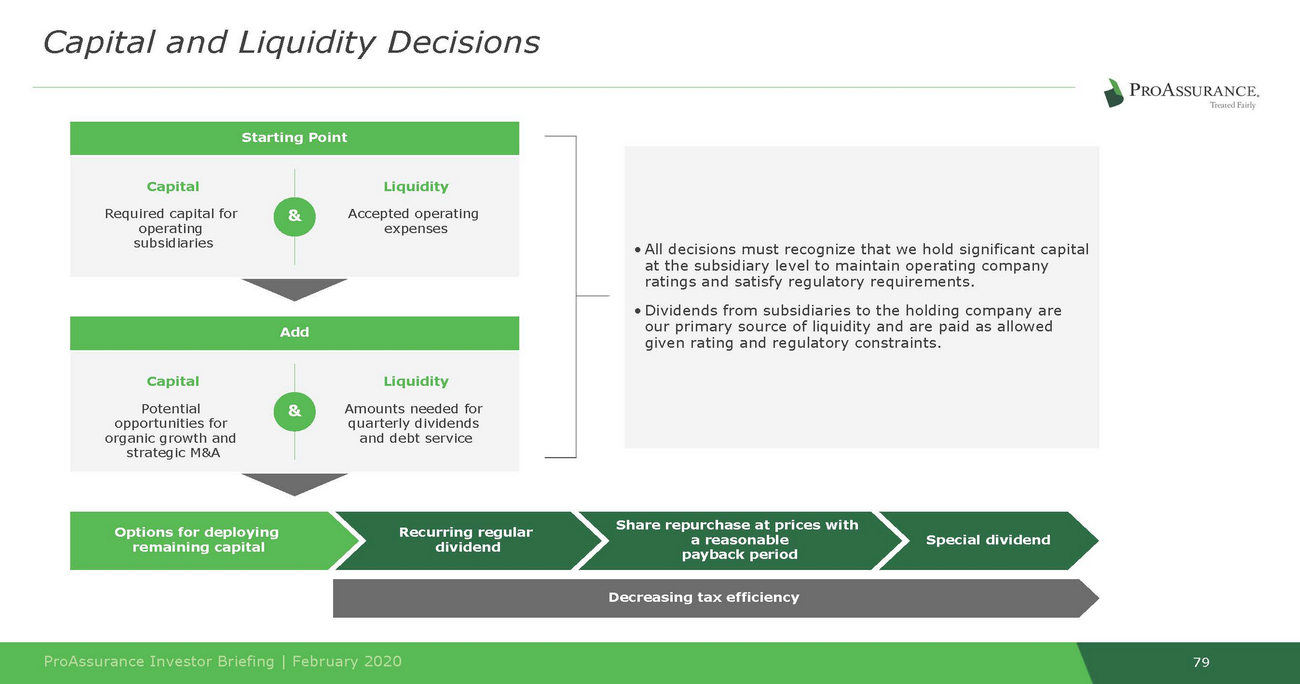
Share repurchase at prices with a reasonable payback period Options for deploying remaining capital Recurring regular dividend dividend Decreasing tax efficiency 79 ProAssurance Investor Briefing | February 2020 Special Add & Liquidity Amounts needed for quarterly dividends and debt service Capital Potential opportunities for organic growth and strategic M&A • All decisions must recognize that we hold significant capital at the subsidiary level to maintain operating company ratings and satisfy regulatory requirements. • Dividends from subsidiaries to the holding company are our primary source of liquidity and are paid as allowed given rating and regulatory constraints. Starting Point & Liquidity Accepted operating expenses Capital Required capital for operating subsidiaries Capital and Liquidity Decisions
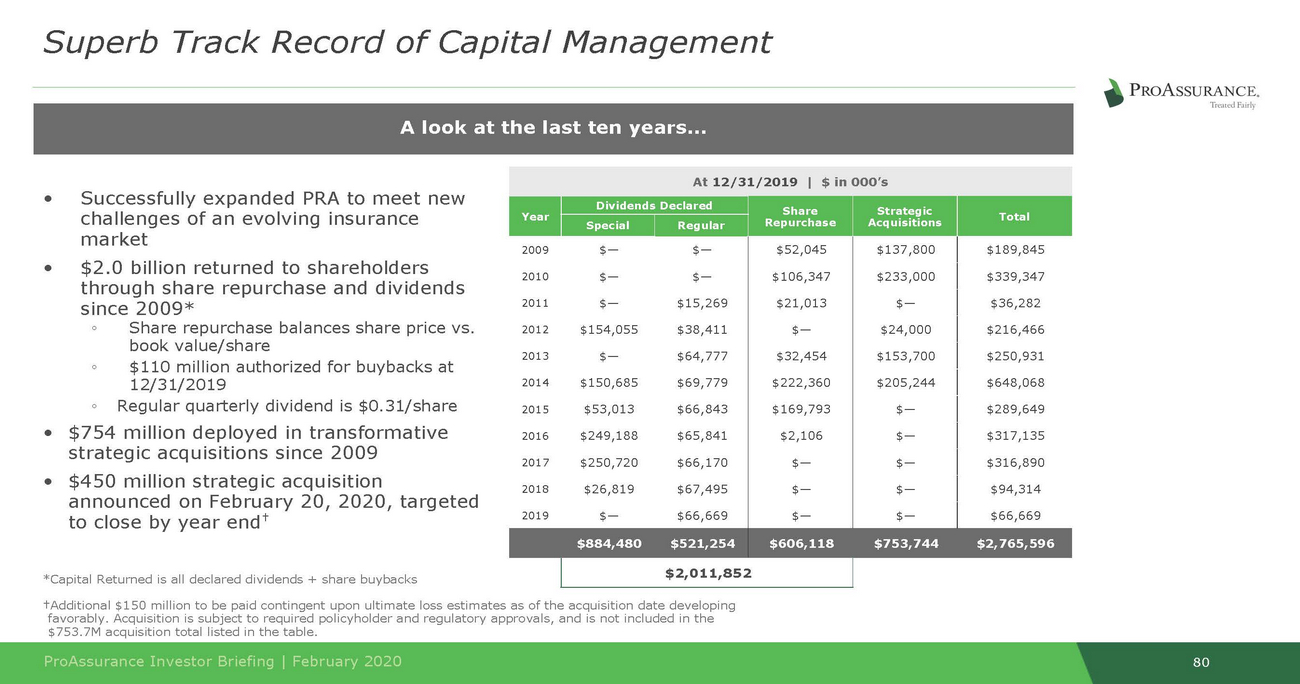
challenges of an evolving insurance announced on February 20, 2020, targeted *Capital Returned is all declared dividends + share buybacks †Additional $150 million to be paid contingent upon ultimate loss estimates as of the acquisition date developing favorably. Acquisition is subject to required policyholder and regulatory approvals, and is not included in the 80 ProAssurance Investor Briefing | February 2020 $753.7M acquisition total listed in the table. •Successfully expanded PRA to meet new market •$2.0 billion returned to shareholders through share repurchase and dividends since 2009* ◦Share repurchase balances share price vs. book value/share ◦$110 million authorized for buybacks at 12/31/2019 ◦Regular quarterly dividend is $0.31/share •$754 million deployed in transformative strategic acquisitions since 2009 •$450 million strategic acquisition to close by year end† At 12/31/2019 | $ in 000’s Year Dividends Declared Share Repurchase Strategic Acquisitions Total Special Regular 2009$—$— 2010$—$— 2011$—$15,269 2012$154,055$38,411 2013$—$64,777 2014$150,685$69,779 2015$53,013$66,843 2016$249,188$65,841 2017$250,720$66,170 2018$26,819$67,495 2019$—$66,669 $52,045 $106,347 $21,013 $— $32,454 $222,360 $169,793 $2,106 $— $— $— $137,800 $233,000 $— $24,000 $153,700 $205,244 $— $— $— $— $— $189,845 $339,347 $36,282 $216,466 $250,931 $648,068 $289,649 $317,135 $316,890 $94,314 $66,669 $884,480$521,254 $606,118$753,744$2,765,596 $2,011,852 A look at the last ten years… Superb Track Record of Capital Management
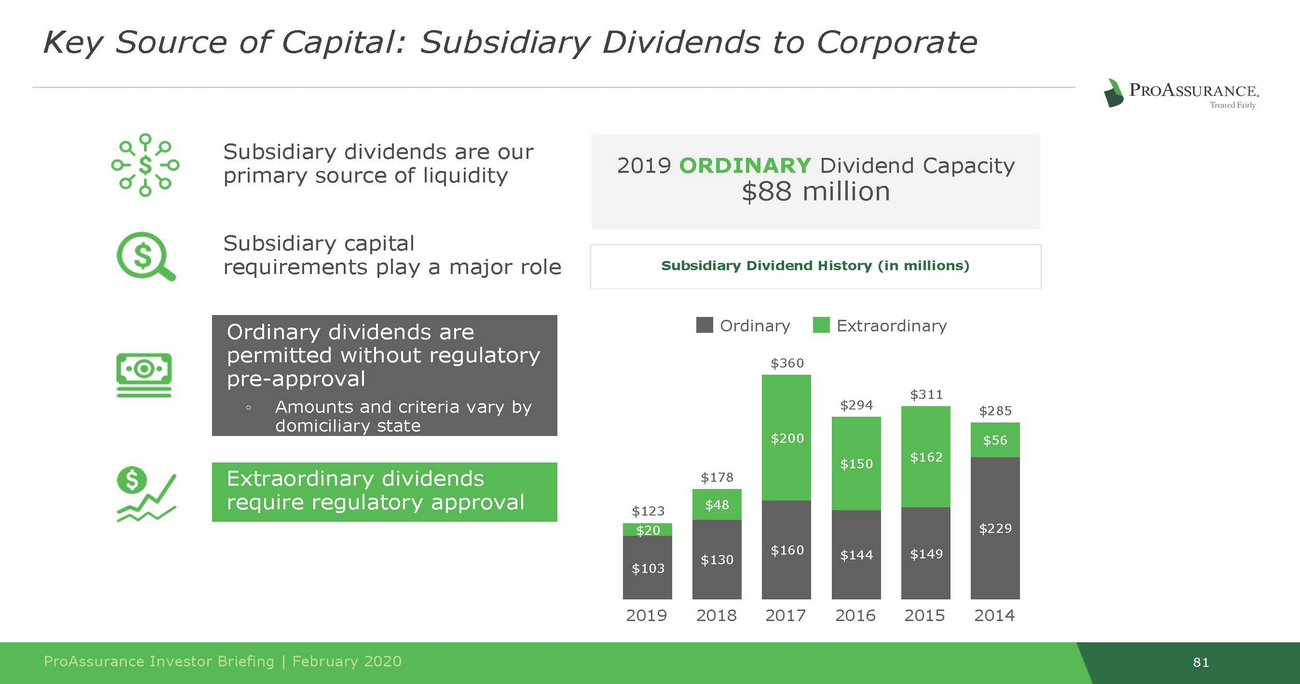
primary source of liquidity Subsidiary capital requirements play a major role pre-approval 81 ProAssurance Investor Briefing | February 2020 Extraordinary dividends require regulatory approval Ordinary dividends are permitted without regulatory ◦Amounts and criteria vary by domiciliary state OrdinaryExtraordinary $360 $311 $294 $285 $178 $123 201920182017201620152014 $20 $103 $48 $130 $56 $229 $150 $144 $162 $149 $200 $160 Subsidiary Dividend History (in millions) Subsidiary dividends are our 2019 ORDINARY Dividend Capacity $88 million Key Source of Capital: Subsidiary Dividends to Corporate
82 ProAssurance Investor Briefing | February 2020 • Ongoing analysis of holdings to ensure lasting quality and profitability • Duration management remains paramount ◦We will not extend duration in search of incremental yield • Optimizing our allocations for better risk-adjusted returns ◦Ensures non-correlation of returns • Effective stewardship of capital ensures a position of financial strength through turbulent market cycles Investment Strategy and 2020 Outlook
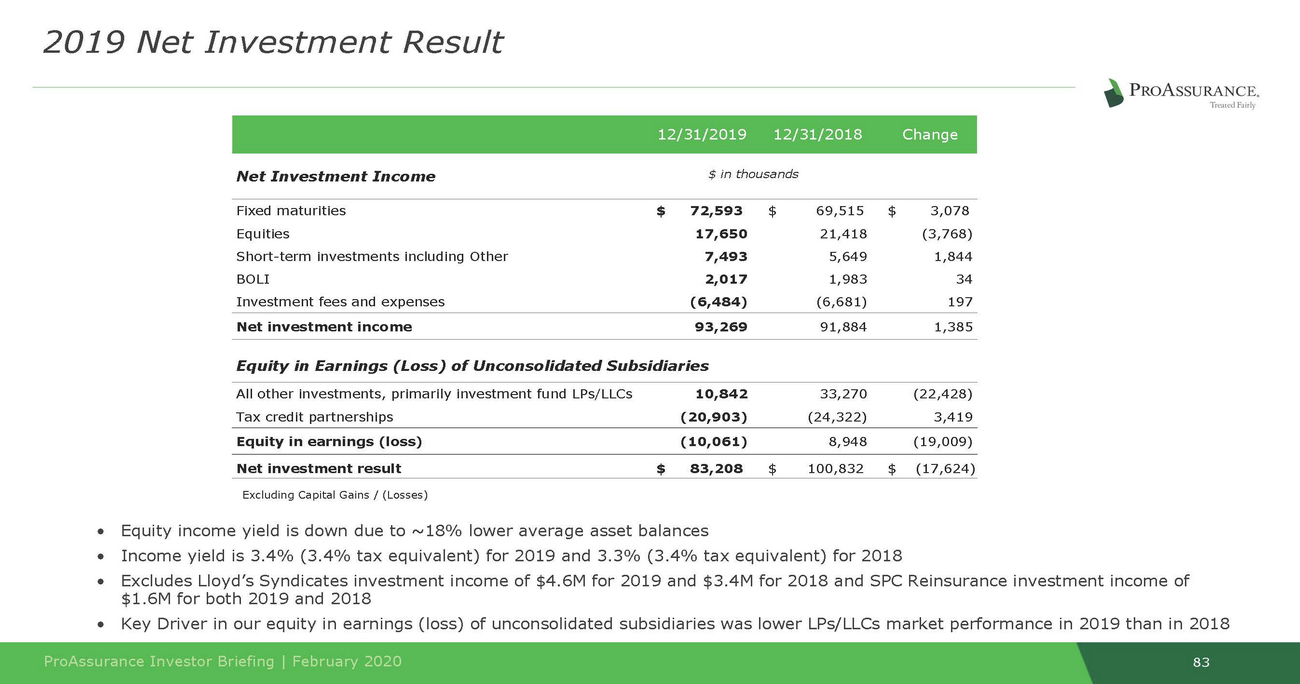
83 ProAssurance Investor Briefing | February 2020 •Equity income yield is down due to ~18% lower average asset balances •Income yield is 3.4% (3.4% tax equivalent) for 2019 and 3.3% (3.4% tax equivalent) for 2018 •Excludes Lloyd’s Syndicates investment income of $4.6M for 2019 and $3.4M for 2018 and SPC Reinsurance investment income of $1.6M for both 2019 and 2018 •Key Driver in our equity in earnings (loss) of unconsolidated subsidiaries was lower LPs/LLCs market performance in 2019 than in 2018 Excluding Capital Gains / (Losses) 12/31/201912/31/2018Change Net Investment Income Fixed maturities$72,593$69,515$3,078 Equities17,65021,418(3,768) Short-term investments including Other 7,4935,6491,844 BOLI2,0171,98334 Investment fees and expenses(6,484)(6,681)197 Net investment income93,26991,8841,385 Equity in Earnings (Loss) of Unconsolidated Subsidiaries All other investments, primarily investment fund LPs/LLCs10,84233,270(22,428) Tax credit partnerships(20,903)(24,322)3,419 Equity in earnings (loss)(10,061)8,948(19,009) Net investment result$83,208$100,832$(17,624) $ in thousands 2019 Net Investment Result
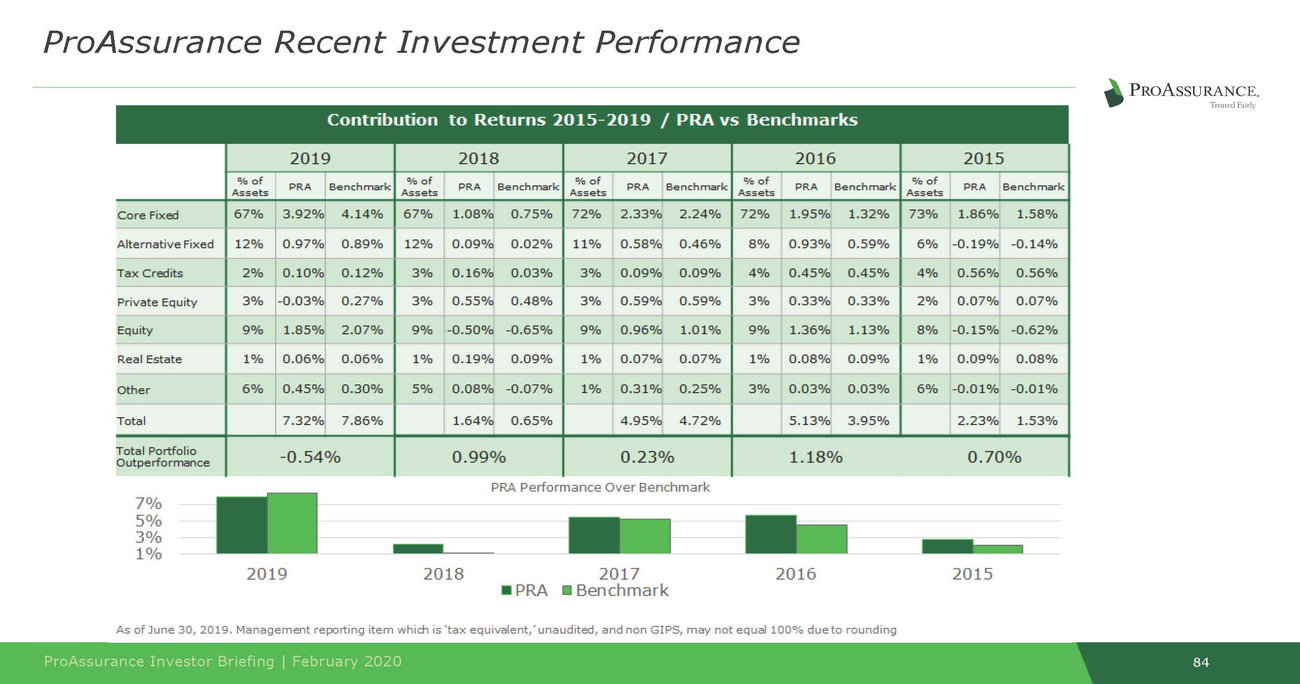
ProAssurance Recent Investment Performance - o/a of Benchmark Assets -0.14% 12% 0.09% 0.02% 11% 0.58% 0.46% 6% -0.19% ed '-- - - PRA Performance Over Benchmark 7°/o 5°/o 3°/o 1°/o 2019 2018 2017 •PRA •Benchmark 2016 2015 As of June 30, 2019.Management reporting item which is 'tax equivalent,'unaudited, and non GIPS,may not equallOO% due to rounding ProAssurance Investor Briefing I February 2020 84 Cont ri bu ti on to Returns 2015-2019 I PRA vs B enchmarks 2019 1--%of PRA IBenchmark 2018 - - 2017 PRABenchmark Assets 2016 %of PRABenchmark Assets 2015 % RA Benchmark Assets o/a of PRA Assets Core Fixed AlternativeFix Tax Credits Private Equity Equity Real Estate Other Total 67% 12% 2% 3.92% 4.14% .97%0.89% 0.10%0.12% 1-0.03%0.27% 1.85% 2.07% j 0.06%0.06% 0.45%0.30% r 7.32%7.86% 67%1.08% 0.75% 72%2.33% 2.24% 72%1.95%1.32% 8% 0.93%0.59% 73%1.86%1.58% - - - - 1-3% 0.16% 0.03% 3% 0.09%0.09% 14% 0.45%0.45% - 1 4% 0.56%0.56% - - - 3% 9% 1% 6% 3% 0.55% 0.48% 9% -0.50% -0.65% 1% 0.19%0.09% 5% 0.08% -0.07% 1.64% 0.65% 3% 0.59%0.59% 9% 0.96%1.01% 1% 0.07%0.07% 1% 0.31%0.25% 4.95%4.72% 3% 0.33%0.33% 9% 1.36%1.13% 1% 0.08%0.09% 3% 0.03%0.03% 5.13%3.95% 2% 0.07%0.07% 8% -0.15% -0.62% 1% 0.09%0.08% 6% -0.01% -0.01% 2.23%1.53% Total Portfolio Outperformance -0.54°/o 0.99°/o 0.23°/o , 1.18°/o0.70°/o _ !--- - -
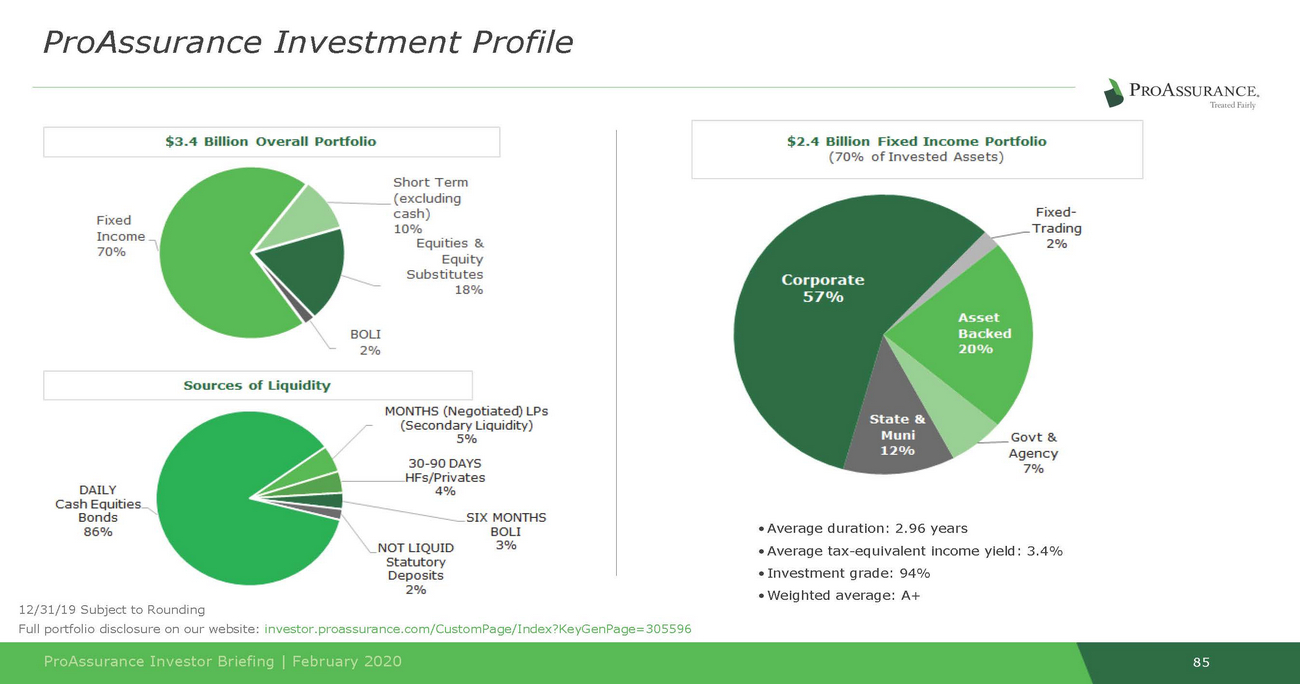
85 ProAssurance Investor Briefing | February 2020 • Average duration: 2.96 years • Average tax-equivalent income yield: 3.4% • Investment grade: 94% 12/31/19 Subject to Rounding • Weighted average: A+ Full portfolio disclosure on our website: investor.proassurance.com/CustomPage/Index?KeyGenPage=305596 ProAssurance Investment Profile
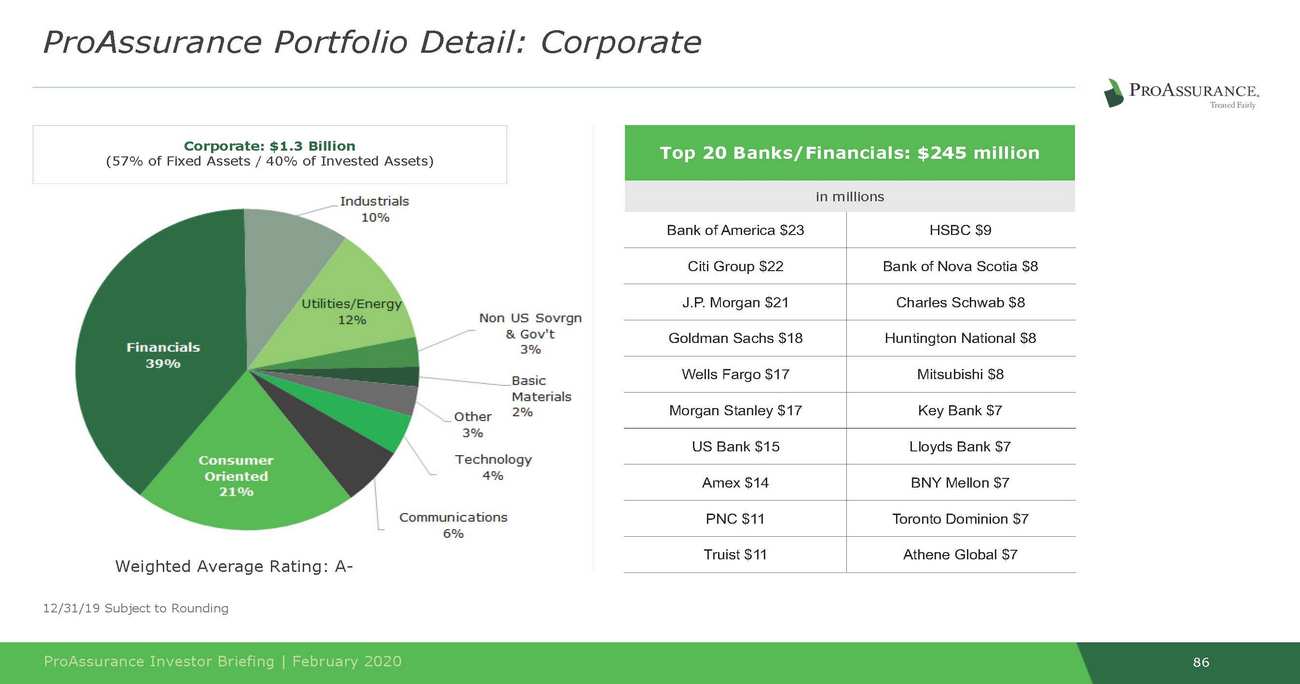
86 ProAssurance Investor Briefing | February 2020 12/31/19 Subject to Rounding Weighted Average Rating: A-Top 20 Banks/Financials: $245 million in millions Bank of America $23 HSBC $9 Citi Group $22 Bank of Nova Scotia $8 J.P. Morgan $21 Charles Schwab $8 Goldman Sachs $18 Huntington National $8 Wells Fargo $17 Mitsubishi $8 Morgan Stanley $17 Key Bank $7 US Bank $15 Lloyds Bank $7 Amex $14 BNY Mellon $7 PNC $11 Toronto Dominion $7 Truist $11 Athene Global $7 Corporate: $1.3 Billion (57% of Fixed Assets / 40% of Invested Assets) ProAssurance Portfolio Detail: Corporate
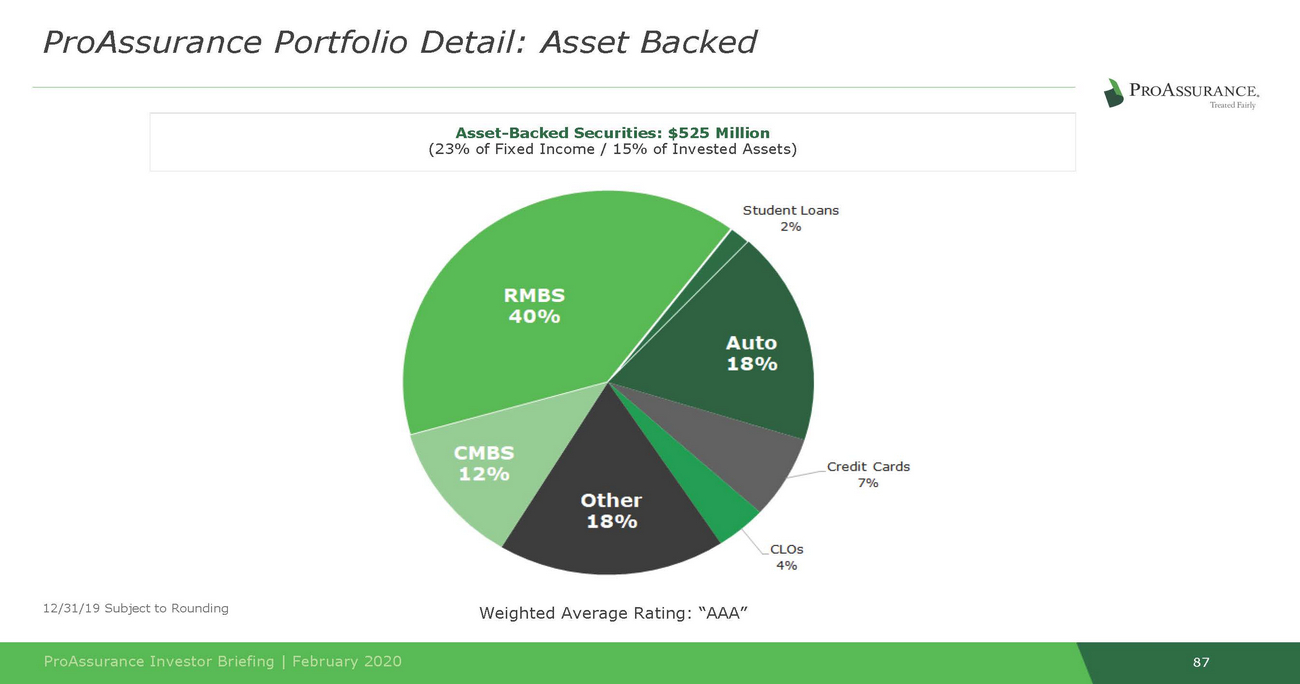
87 ProAssurance Investor Briefing | February 2020 12/31/19 Subject to Rounding Weighted Average Rating: “AAA” Asset-Backed Securities: (23% of Fixed Income / 15% of Invested Assets) $525 Million ProAssurance Portfolio Detail: Asset Backed

Weighted Average Rating: “AA” 88 ProAssurance Investor Briefing | February 2020 12/31/19 Subject to Rounding All Fixed Trading Securities are owned by Lloyd’s Syndicate 1729 Fixed Maturities: $47 Million (2% of Fixed Income / 1% of Invested Assets) ProAssurance Portfolio Detail: Fixed-Trading
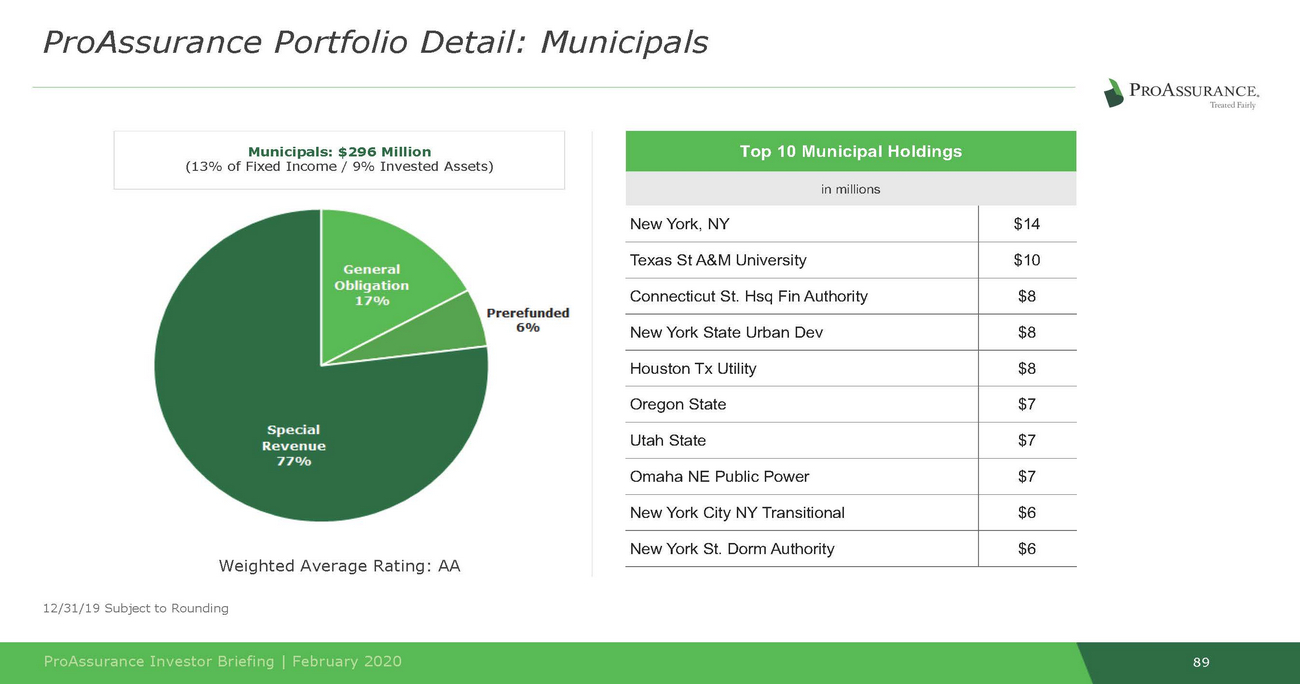
89 ProAssurance Investor Briefing | February 2020 12/31/19 Subject to Rounding Weighted Average Rating: AA Top 10 Municipal Holdings in millions New York, NY $14 Texas St A&M University $10 Connecticut St. Hsq Fin Authority $8 New York State Urban Dev $8 Houston Tx Utility $8 Oregon State $7 Utah State $7 Omaha NE Public Power $7 New York City NY Transitional $6 New York St. Dorm Authority $6 Municipals: $296 Million (13% of Fixed Income / 9% Invested Assets) ProAssurance Portfolio Detail: Municipals
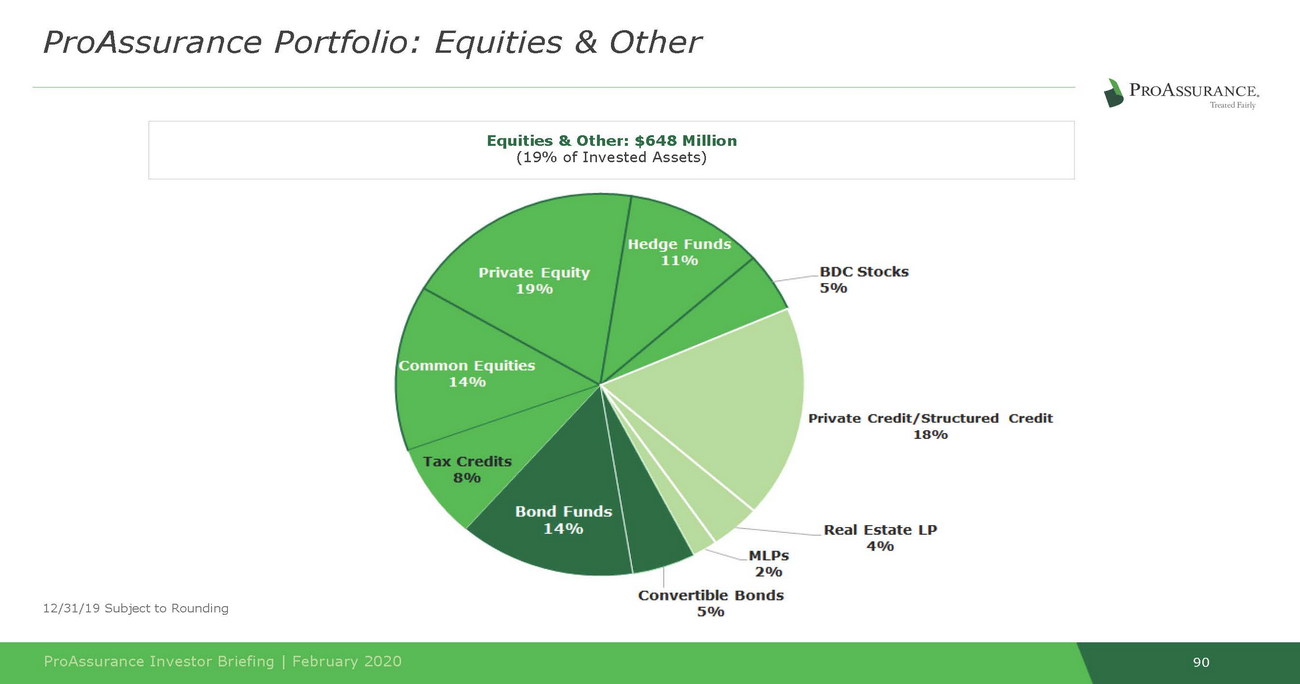
90 ProAssurance Investor Briefing | February 2020 12/31/19 Subject to Rounding Equities & Ot (19% of Invested Assets) her: $648 Million ProAssurance Portfolio: Equities & Other
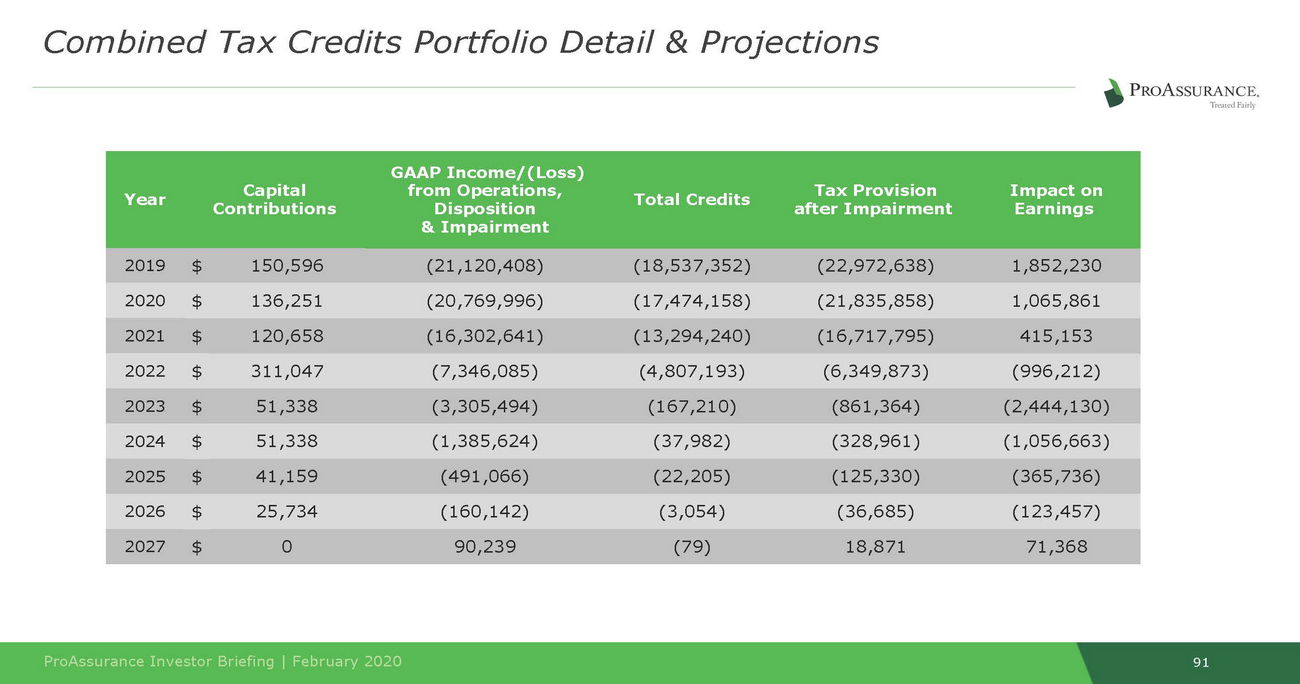
Contributions Disposition after Impairment Earnings 91 ProAssurance Investor Briefing | February 2020 GAAP Income/(Loss) YearCapitalfrom Operations,Total CreditsTax ProvisionImpact on & Impairment 2019$150,596(21,120,408)(18,537,352)(22,972,638)1,852,230 2020$136,251(20,769,996)(17,474,158)(21,835,858)1,065,861 2021$120,658(16,302,641)(13,294,240)(16,717,795)415,153 2022$311,047(7,346,085)(4,807,193)(6,349,873)(996,212) 2023$51,338(3,305,494)(167,210)(861,364)(2,444,130) 2024$51,338(1,385,624)(37,982)(328,961)(1,056,663) 2025$41,159(491,066)(22,205)(125,330)(365,736) 2026$25,734(160,142)(3,054)(36,685)(123,457) 2027$090,239(79)18,87171,368 Combined Tax Credits Portfolio Detail & Projections
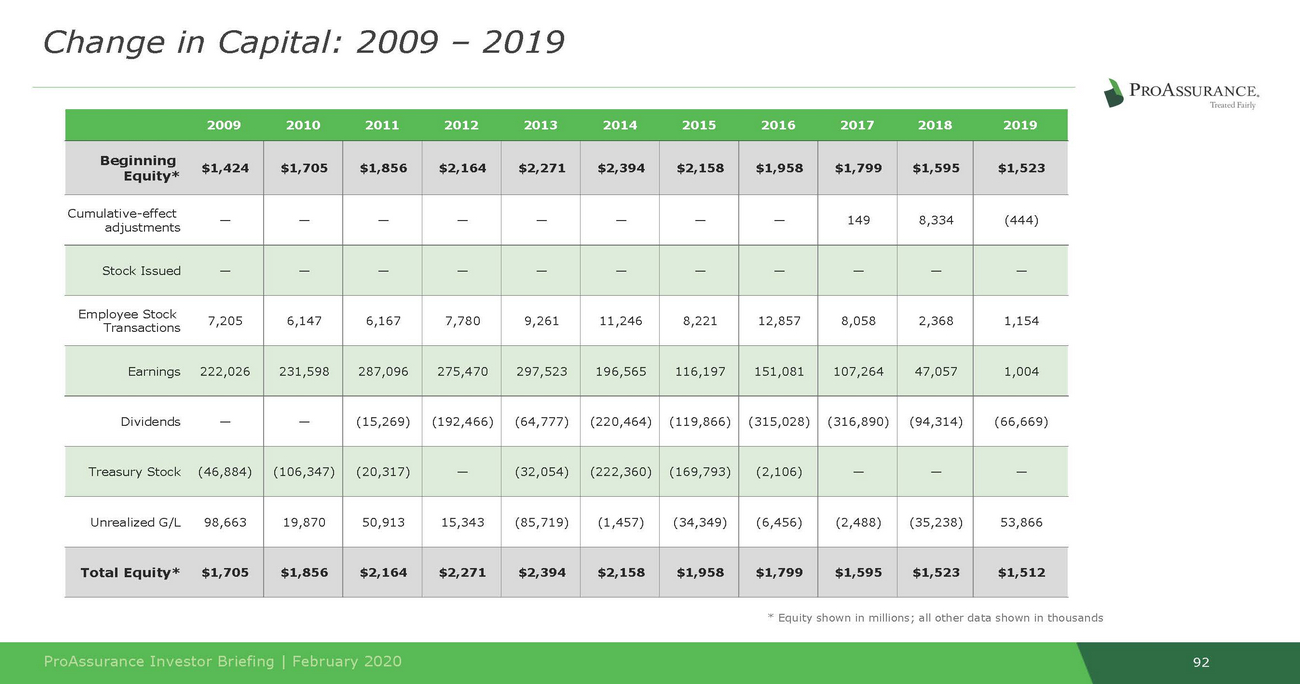
92 ProAssurance Investor Briefing | February 2020 * Equity shown in millions; all other data shown in thousands 20092010201120122013201420152016201720182019 Beginning Equity*$1,424 $1,705 $1,856 $2,164 $2,271 $2,394 $2,158 $1,958 $1,799 $1,595 $1,523 Cumulative-effect adjustments— — — — — — — — 149 8,334 (444) Stock Issued— — — — — — — — — — — Employee Stock Transactions7,205 6,147 6,167 7,780 9,261 11,246 8,221 12,857 8,058 2,368 1,154 Earnings222,026 231,598 287,096 275,470 297,523 196,565 116,197 151,081 107,264 47,057 1,004 Dividends— — (15,269) (192,466) (64,777) (220,464) (119,866) (315,028) (316,890) (94,314) (66,669) Treasury Stock(46,884) (106,347) (20,317) — (32,054) (222,360) (169,793) (2,106) — — — Unrealized G/L98,663 19,870 50,913 15,343 (85,719) (1,457) (34,349) (6,456) (2,488) (35,238) 53,866 Total Equity*$1,705 $1,856 $2,164 $2,271 $2,394 $2,158 $1,958 $1,799 $1,595 $1,523 $1,512 Change in Capital: 2009 ‒ 2019
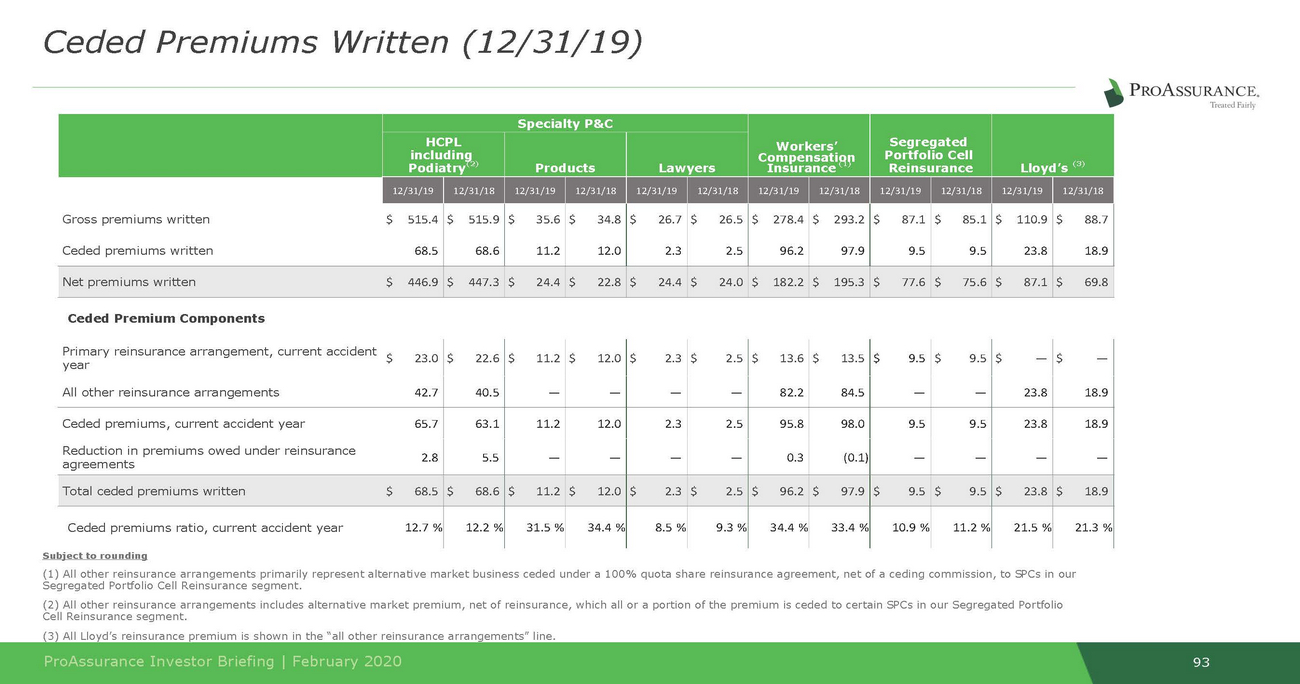
including Subject to rounding (1) All other reinsurance arrangements primarily represent alternative market business ceded under a 100% quota share reinsurance agreement, net of a ceding commission, to SPCs in our Segregated Portfolio Cell Reinsurance segment. (2) All other reinsurance arrangements includes alternative market premium, net of reinsurance, which all or a portion of the premium is ceded to certain SPCs in our Segregated Portfolio 93 Cell Reinsurance segment. (3) All Lloyd’s reinsurance premium is shown in the “all other reinsurance arrangements” line. ProAssurance Investor Briefing | February 2020 Ceded Premiums Written (12/31/19) Specialty P&C Workers’ Compensation Insurance (1) Segregated Portfolio Cell Reinsurance Lloyd’s (3) HCPL Podiatry(2) Products Lawyers 12/31/19 12/31/18 12/31/19 12/31/18 12/31/19 12/31/18 12/31/19 12/31/18 12/31/19 12/31/18 12/31/19 12/31/18 Gross premiums written$515.4 Ceded premiums written68.5 $515.9 68.6 $35.6 11.2 $34.8 12.0 $26.7 2.3 $26.5 2.5 $278.4 96.2 $293.2 97.9 $87.1 9.5 $85.1 9.5 $110.9 23.8 $88.7 18.9 Net premiums written$446.9 $447.3 $24.4 $22.8 $24.4 $24.0 $182.2 $195.3 $77.6 $75.6 $87.1 $69.8 Ceded Premium Components Primary reinsurance arrangement, current accident year$23.0 $22.6 $11.2 $12.0 $2.3 $2.5 $13.6 $13.5 $9.5 $9.5 $— $— All other reinsurance arrangements42.7 40.5 — — — — 82.2 84.5 — — 23.8 18.9 Ceded premiums, current accident year65.7 63.1 11.2 12.0 2.3 2.5 95.8 98.0 9.5 9.5 23.8 18.9 Reduction in premiums owed under reinsurance agreements2.8 5.5 — — — — 0.3 (0.1) — — — — Total ceded premiums written$68.5 $68.6 $11.2 $12.0 $2.3 $2.5 $96.2 $97.9 $9.5 $9.5 $23.8 $18.9 Ceded premiums ratio, current accident year12.7 % 12.2 % 31.5 % 34.4 % 8.5 % 9.3 % 34.4 % 33.4 % 10.9 % 11.2 % 21.5 % 21.3 %
94 ProAssurance Investor Briefing | February 2020 review this presentation in conjunction with a thorough reading and understanding of these risk factors. This presentation contains Non-GAAP measures, and we may reference Non-GAAP measures in our remarks and discussions with investors. The primary Non-GAAP measure we reference is Non-GAAP operating income, a Non-GAAP financial measure that is widely used to evaluate performance within the insurance sector. In calculating Non-GAAP operating income, we have excluded the after-tax effects of net realized investment gains or losses and guaranty fund assessments or recoupments that do not reflect normal operating results. We believe Non-GAAP operating income presents a useful view of the performance of our insurance operations, but should be considered in conjunction with net income computed in accordance with GAAP. A reconciliation of these measures to GAAP measures is available in our regular reports on Forms 10-Q and 10-K and in our latest quarterly news release, all of which are available in the Investor Relations section of our website, Investor.ProAssurance.com. This presentation contains Forward Looking Statements and other information designed to convey our projections and expectations regarding future results. There are a number of factors which could cause our actual results to vary materially from those projected in this presentation. The principal risk factors that may cause these differences are described in various documents we file with the Securities and Exchange Commission, such as our Current Reports on Form 8-K, and our regular reports on Forms 10-Q and 10-K, particularly in “Item 1A, Risk Factors.” Please Non-GAAP Measures Forward Looking Statements IMPORTANTSAFEHARBOR&NON-GAAPNOTICES