Howard H. Friedman President, Healthcare Professional Liability Group Frank B. O’Neil Chief Communications Officer Mid - Atlantic Investor Meetings May 8 - 9, 2014
F ORWARD L OOKING S TATEMENTS This presentation contains Forward Looking Statements and other information designed to convey our projections and expectations regarding future results. There are a number of factors which could cause our actual results to vary materially from those projected in this presentation. The principal risk factors that may cause these differences are described in various documents we file with the Securities and Exchange Commission, such as our Current Reports on Form 8 - K, and our regular reports on Forms 10 - Q and 10 - K, particularly in “Item 1A, Risk Factors.” Please review this presentation in conjunction with a thorough reading and understanding of these risk factors. We especially identify statements concerning our acquisition of Eastern Insurance Holdings, Inc. and the establishment of Lloyd's Syndicate 1729 as Forward Looking Statements and direct your attention to our news releases issued on September 24, 2013, our Current Report on Form 8K, issued on September 24, 2013 and our subsequently filed Forms 10K and 10Q for discussion s of risk factors pertaining to these transactions and subsequent integration into ProAssurance. This presentation contains Non - GAAP measures, and we may reference Non - GAAP measures in our remarks and discussions. A reconciliation of these measures to GAAP measures is included in this presentation and is also available in our latest quarterly news release, which is available in the Investor Relations section of our website, www.ProAssurance.com, and in the related Current Report on Form 8K disclosing that release . Financial data in this presentation is believed to be accurate at the time of printing, however the data is unaudited unless otherwise noted. N ON - GAAP M EASURES 1 U NAUDITED F INANCIAL S TATEMENTS
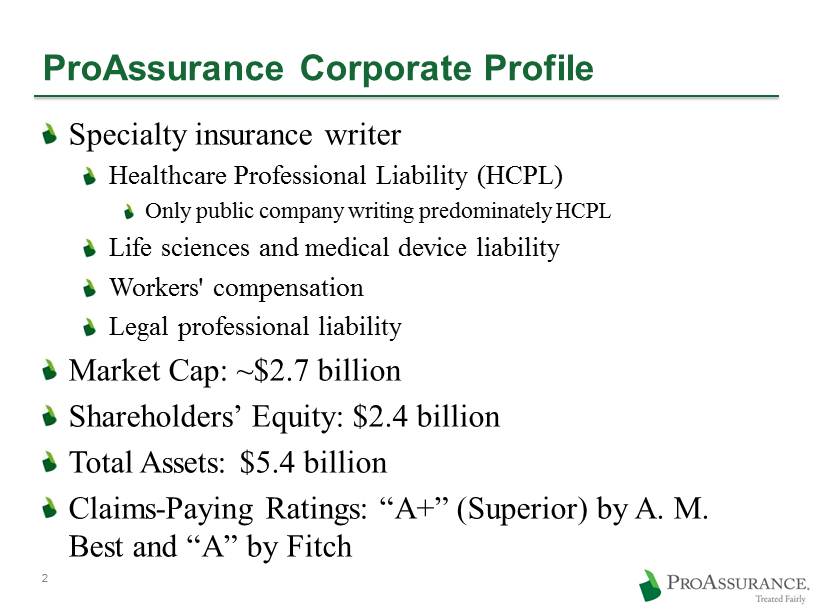
ProAssurance Corporate Profile Specialty insurance writer Healthcare Professional Liability (HCPL) Only public company writing predominately HCPL Life sciences and medical device liability Workers' compensation Legal professional liability Market Cap: ~$2.7 billion Shareholders’ Equity: $2.4 billion Total Assets: $5.4 billion Claims - Paying Ratings: “A+” (Superior) by A. M. Best and “A” by Fitch 2

Hot Topics for Investors Our commentary on first quarter 2014 results and updates on recent transactions and strategy
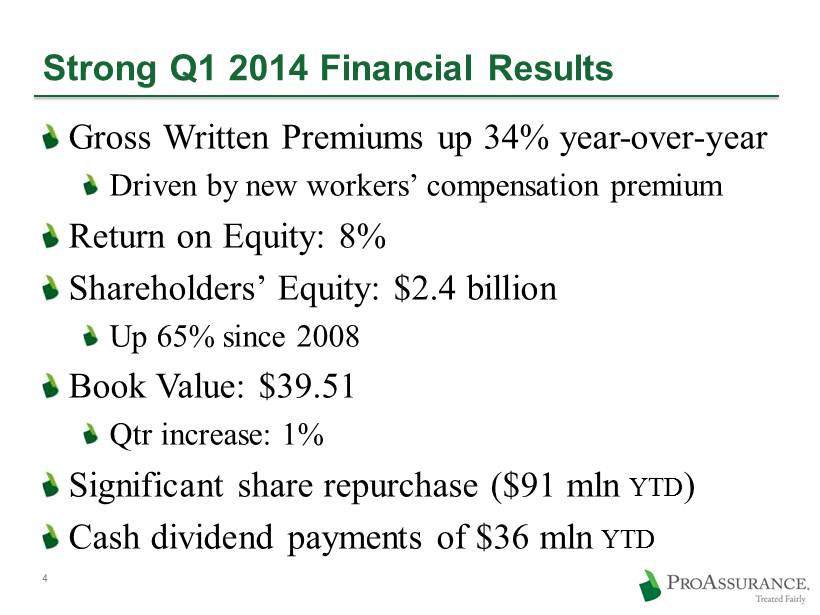
Strong Q1 2014 Financial Results Gross Written Premiums up 34% year - over - year Driven by new workers’ compensation premium Return on Equity: 8% Shareholders’ Equity: $2.4 billion Up 65% since 2008 Book Value: $39.51 Qtr increase: 1% Significant share repurchase ($91 mln YTD ) Cash dividend payments of $36 mln YTD 4
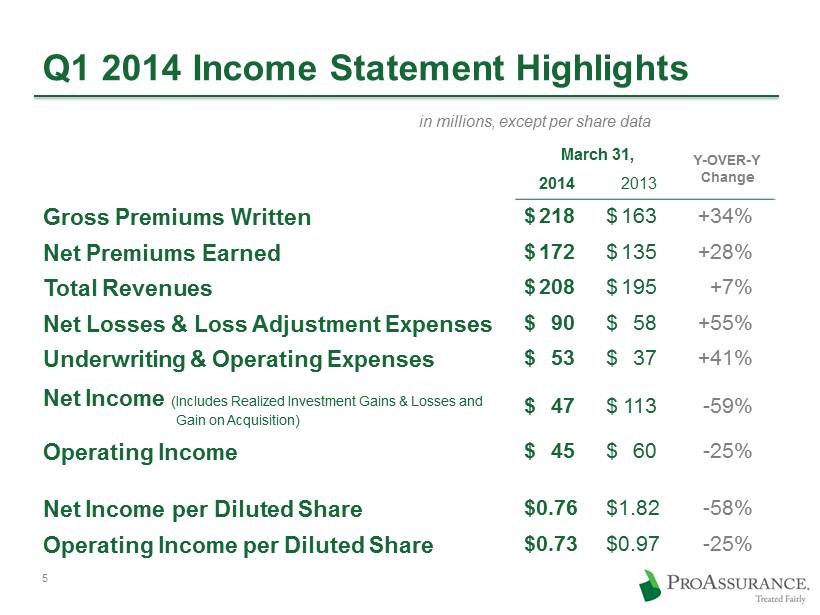
Q1 2014 Income Statement Highlights in millions, except per share data March 31, Y - OVER - Y Change 2014 2013 Gross Premiums Written $ 218 $ 163 +34% Net Premiums Earned $ 172 $ 135 +28% Total Revenues $ 208 $ 195 +7% Net Losses & Loss Adjustment Expenses $ 90 $ 58 +55% Underwriting & Operating Expenses $ 53 $ 37 +41% Net Income (Includes Realized Investment Gains & Losses and Gain on Acquisition) $ 47 $ 113 - 59% Operating Income $ 45 $ 60 - 25% Net Income per Diluted Share $0.76 $1.82 - 58% Operating Income per Diluted Share $0.73 $0.97 - 25% 5
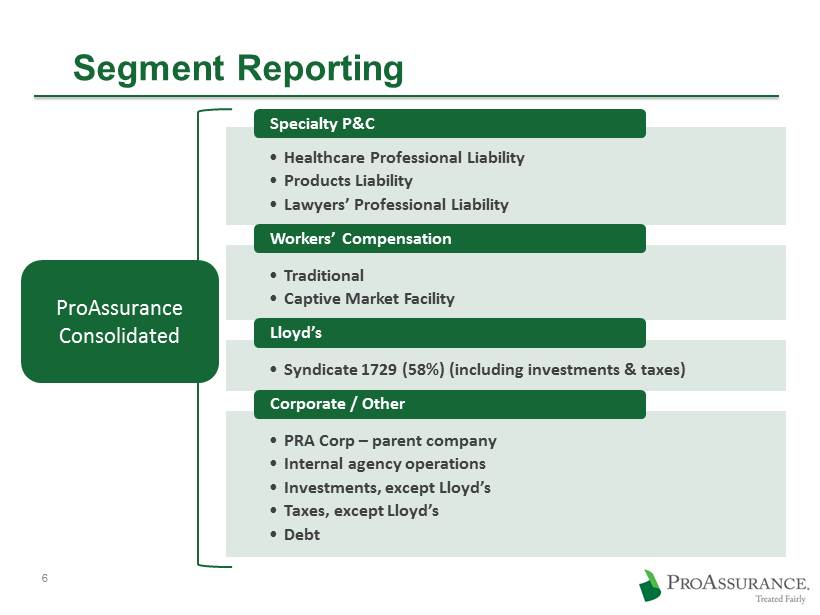
6 Segment Reporting • Healthcare Professional Liability • Products Liability • Lawyers’ Professional Liability Specialty P&C • Traditional • Captive Market Facility Workers’ Compensation • Syndicate 1729 (58%) (including investments & taxes) Lloyd’s • PRA Corp – parent company • Internal agency operations • Investments, except Lloyd’s • Taxes, except Lloyd’s • Debt Corporate / Other ProAssurance Consolidated
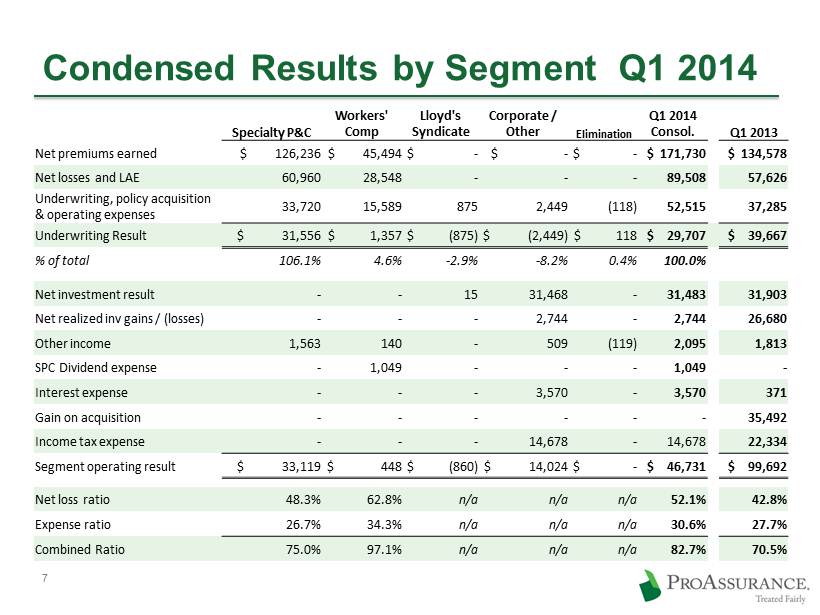
7 Condensed Results by Segment Q1 2014 Specialty P&C Workers' Comp Lloyd's Syndicate Corporate / Other Elimination Q1 2014 Consol. Q1 2013 Net premiums earned $ 126,236 $ 45,494 $ - $ - $ - $ 171,730 $ 134,578 Net losses and LAE 60,960 28,548 - - - 89,508 57,626 Underwriting, policy acquisition & operating expenses 33,720 15,589 875 2,449 ( 118) 52,515 37,285 Underwriting Result $ 31,556 $ 1,357 $ (875) $ (2,449) $ 118 $ 29,707 $ 39,667 % of total 106.1% 4.6% - 2.9% - 8.2% 0.4% 100.0% Net investment result - - 15 31,468 - 31,483 31,903 Net realized inv gains / (losses) - - - 2,744 - 2,744 26,680 Other income 1,563 140 - 509 (119) 2,095 1,813 SPC Dividend expense - 1,049 - - - 1,049 - Interest expense - - - 3,570 - 3,570 371 Gain on acquisition - - - - - - 35,492 Income tax expense - - - 14,678 - 14,678 22,334 Segment operating result $ 33,119 $ 448 $ (860) $ 14,024 $ - $ 46,731 $ 99,692 Net loss ratio 48.3% 62.8% n/a n/a n/a 52.1% 42.8% Expense ratio 26.7% 34.3% n/a n/a n/a 30.6% 27.7% Combined Ratio 75.0% 97.1% n/a n/a n/a 82.7% 70.5%
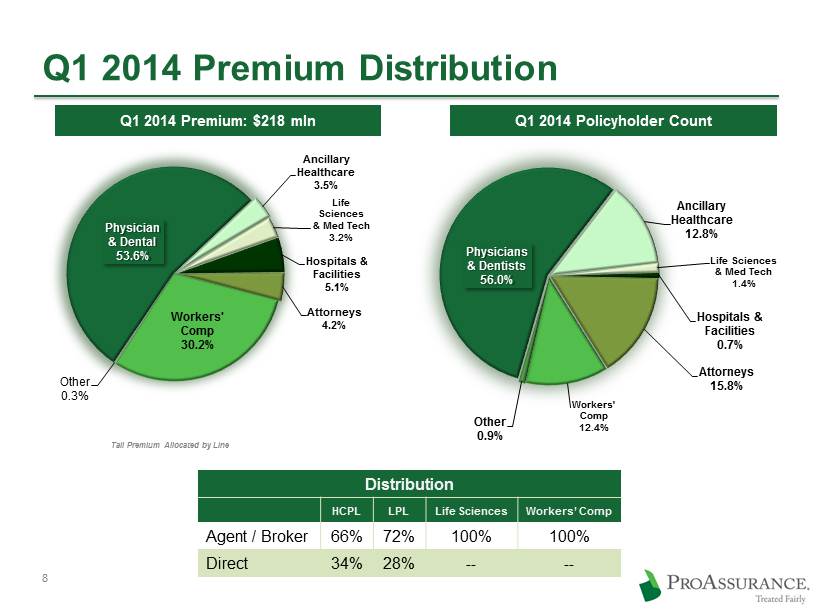
8 Q1 2014 Premium Distribution Physicians & Dentists 56.0% Ancillary Healthcare 12.8% Life Sciences & Med Tech 1.4% Hospitals & Facilities 0.7% Attorneys 15.8% Workers' Comp 12.4% Other 0.9% Physician & Dental 53.6% Ancillary Healthcare 3.5% Life Sciences & Med Tech 3.2% Hospitals & Facilities 5.1% Attorneys 4.2% Workers' Comp 30.2% Other 0.3% Q1 2014 Policyholder Count Q1 2014 Premium: $218 mln Distribution HCPL LPL Life Sciences Workers’ Comp Agent / Broker 66% 72% 100% 100% Direct 34% 28% -- -- Tail Premium Allocated by Line
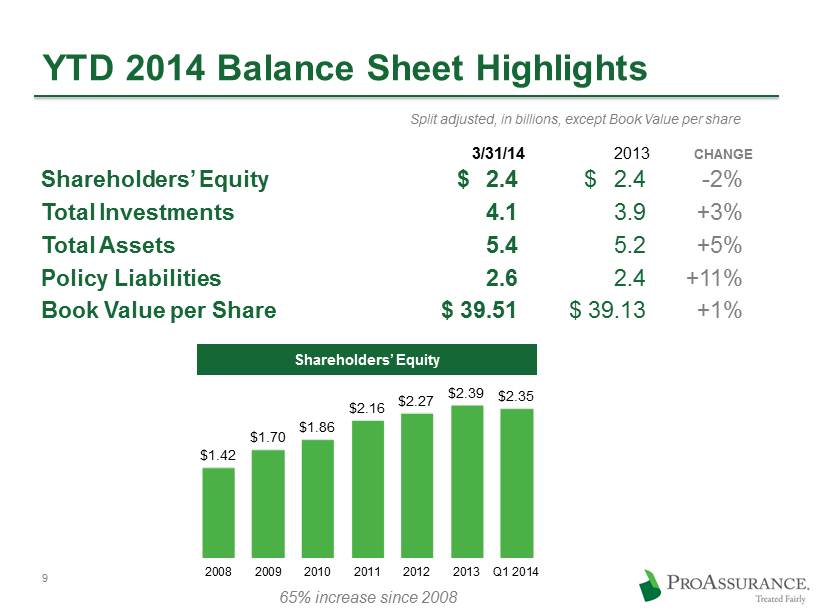
YTD 2014 Balance Sheet Highlights Split adjusted, in billions, except Book Value per share Shareholders’ Equity $ 2.4 $ 2.4 - 2% Total Investments 4.1 3.9 +3% Total Assets 5.4 5.2 +5% Policy Liabilities 2.6 2.4 +11% 3/31/14 2013 CHANGE $1.42 $1.70 $1.86 $2.16 $2.27 $2.39 $2.35 2008 2009 2010 2011 2012 2013 Q1 2014 Shareholders’ Equity 65% increase since 2008 Book Value per Share $ 39.51 $ 39.13 +1% 9
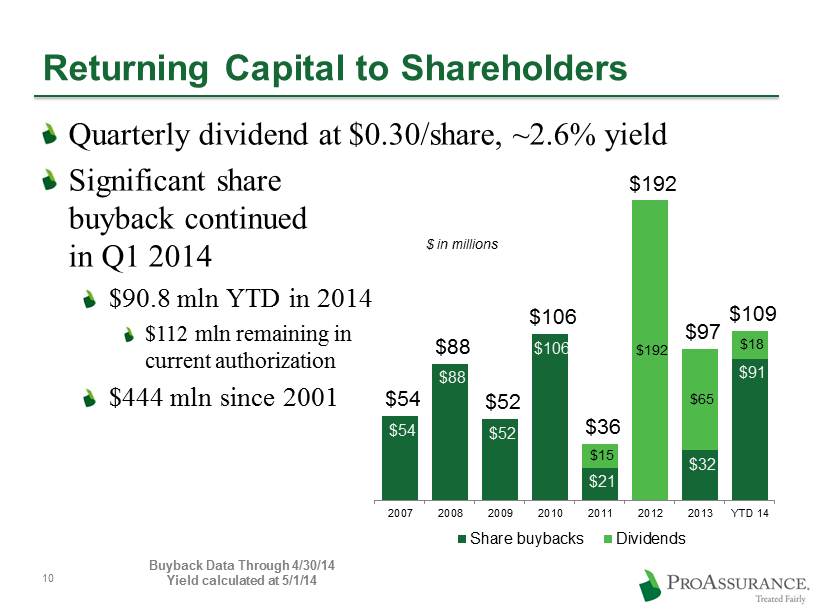
Returning Capital to Shareholders Quarterly dividend at $0.30/share, ~2.6% yield Significant share buyback continued in Q1 2014 $90.8 mln YTD in 2014 $112 mln remaining in current authorization $444 mln since 2001 $91 $32 $21 $106 $52 $88 $54 $18 $65 $192 $15 $109 $97 $192 $36 $106 $52 $88 $54 YTD 14 2013 2012 2011 2010 2009 2008 2007 Share buybacks Dividends $ in millions Buyback Data Through 4/30/14 Yield calculated at 5/1/14 10
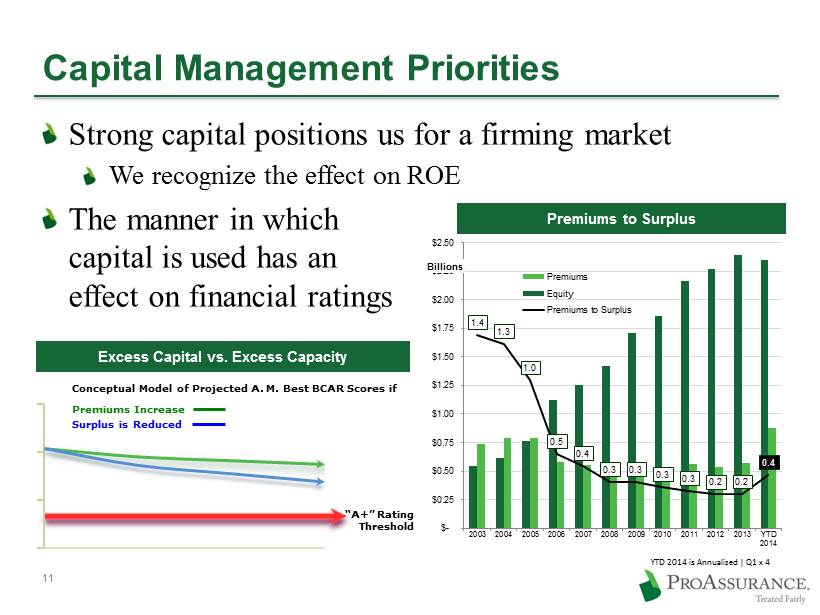
Capital Management Priorities Strong capital positions us for a firming market We recognize the effect on ROE The manner in which capital is used has an effect on financial ratings 1.4 1.3 1.0 0.5 0.4 0.3 0.3 0.3 0.3 0.2 0.2 0.4 $- $0.25 $0.50 $0.75 $1.00 $1.25 $1.50 $1.75 $2.00 $2.25 $2.50 YTD 2014 2013 2012 2011 2010 2009 2008 2007 2006 2005 2004 2003 Billions Premiums Equity Premiums to Surplus YTD 2014 is Annualized | Q1 x 4 Conceptual Model of Projected A. M. Best BCAR Scores if Premiums Increase Surplus is Reduced Excess Capital vs. Excess Capacity Premiums to Surplus “A+” Rating Threshold 11
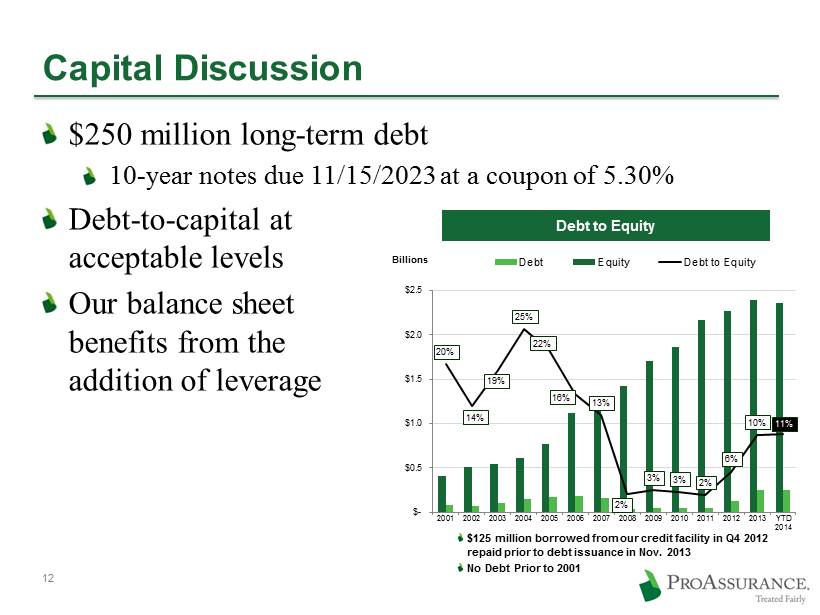
Capital Discussion $250 million long - term debt 10 - year notes due 11/15/2023 at a coupon of 5.30% Debt - to - capital at acceptable levels Our balance sheet benefits from the addition of leverage 11% 10% 6% 2% 3% 3% 2% 13% 16% 22% 25% 19% 14% 20% $- $0.5 $1.0 $1.5 $2.0 $2.5 YTD 2014 2013 2012 2011 2010 2009 2008 2007 2006 2005 2004 2003 2002 2001 Billions Debt Equity Debt to Equity Debt to Equity $125 million borrowed from our credit facility in Q4 2012 repaid prior to debt issuance in Nov. 2013 No Debt Prior to 2001 12
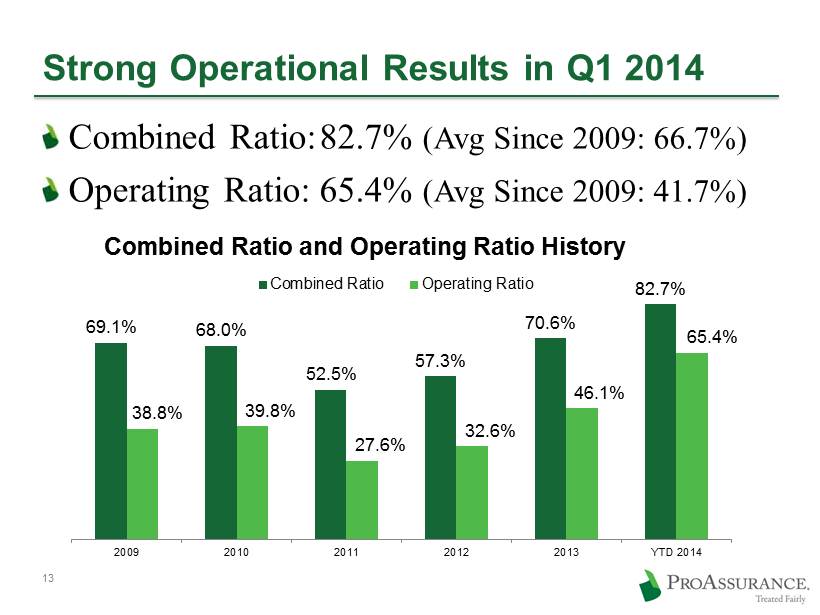
Strong Operational Results in Q1 2014 Combined Ratio: 82.7% ( Avg Since 2009: 66.7%) Operating Ratio: 65.4% ( Avg Since 2009: 41.7%) 69.1% 68.0% 52.5% 57.3% 70.6% 82.7% 38.8% 39.8% 27.6% 32.6% 46.1% 65.4% 2009 2010 2011 2012 2013 YTD 2014 Combined Ratio and Operating Ratio History Combined Ratio Operating Ratio 13
Q1 2014 Corporate Update Acquired Eastern Insurance effective 1/1/14 Integration into ProAssurance well underway Significant contributions to Q1 results Lloyd’s Syndicate 1729 opened on 1/1/14 Business on the books as planned All staffing arrangement complete Medmarc and IND fully integrated into ProAssurance operations 14
Eastern Insurance Transaction Details Continues building the platform to serve the needs of larger integrated health systems and healthcare delivery organizations Workers’ compensation represents one of the single largest liability expenditures for healthcare entities Eastern and ProAssurance underwrite large healthcare books of business, which will continue to be a target market for both companies Eastern’s business is 20% healthcare and growing 15
Lloyd’s Syndicate Transaction Details First policies underwritten January 1, 2014 ProAssurance is providing 58% of underwriting capital Remaining capital from other corporates and private names ProAssurance has committed $76 mln in 2014 Six - Year Commitment of up to $200 mln 16
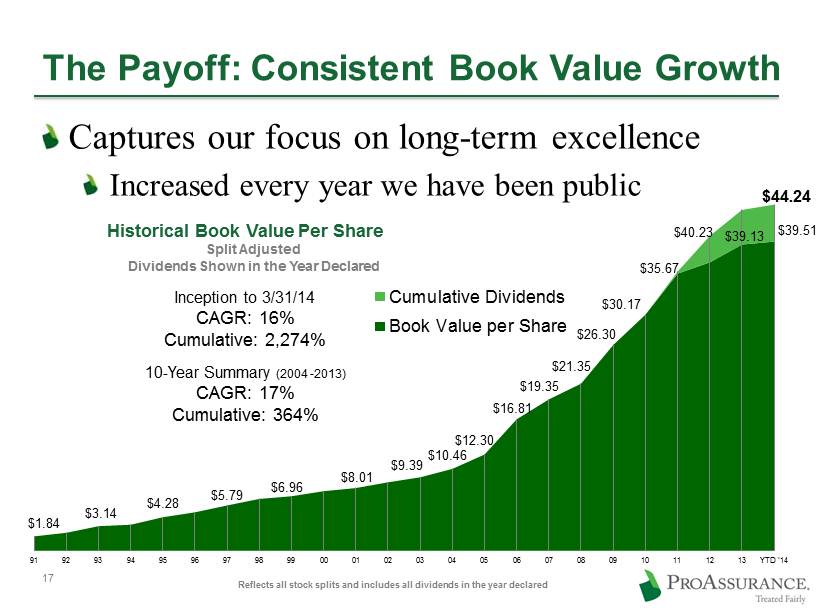
$1.84 $3.14 $4.28 $5.79 $6.96 $8.01 $9.39 $10.46 $12.30 $16.81 $19.35 $21.35 $26.30 $30.17 $39.13 $39.51 91 92 93 94 95 96 97 98 99 00 01 02 03 04 05 06 07 08 09 10 11 12 13 YTD '14 Cumulative Dividends Book Value per Share $35.67 $44.24 $40.23 The Payoff: Consistent Book Value Growth Captures our focus on long - term excellence Increased every year we have been public 17 Inception to 3/31/14 CAGR: 16% Cumulative: 2,274% 10 - Year Summary ( 2004 - 2013) CAGR: 17% Cumulative: 364% Historical Book Value Per Share Split Adjusted Dividends Shown in the Year Declared Reflects all stock splits and includes all dividends in the year declared
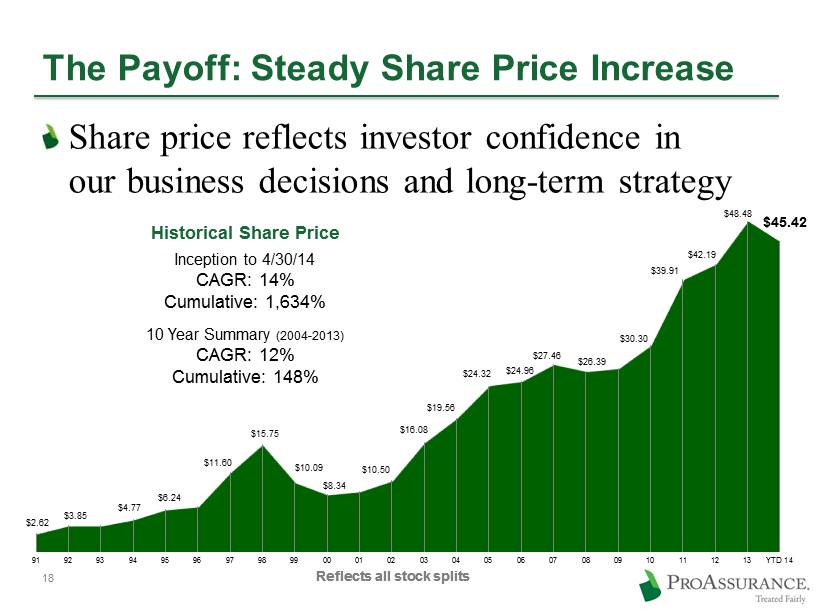
$2.62 $3.85 $4.77 $6.24 $11.60 $15.75 $10.09 $8.34 $10.50 $16.08 $19.56 $24.32 $24.96 $27.46 $26.39 $30.30 $39.91 $42.19 $48.48 $45.42 91 92 93 94 95 96 97 98 99 00 01 02 03 04 05 06 07 08 09 10 11 12 13 YTD 14 The Payoff: Steady Share Price Increase Share price reflects investor confidence in our business decisions and long - term strategy Reflects all stock splits Historical Share Price Reflects all stock splits Inception to 4/30/14 CAGR: 14% Cumulative: 1,634% 10 Year Summary ( 2004 - 2013) CAGR: 12% Cumulative: 148% 18
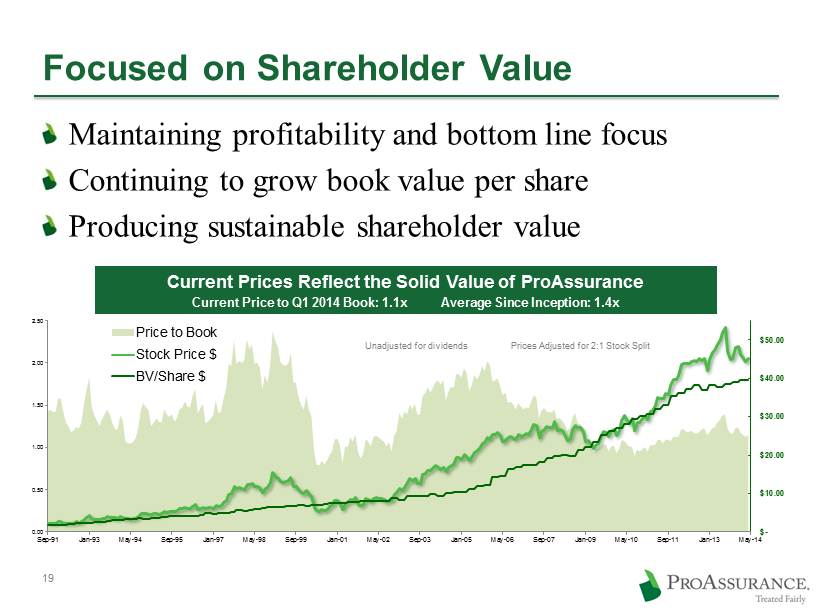
Focused on Shareholder Value Maintaining profitability and bottom line focus Continuing to grow book value per share Producing sustainable shareholder value 19 0.00 0.50 1.00 1.50 2.00 2.50 $- $10.00 $20.00 $30.00 $40.00 $50.00 Sep-91 Jan-93 May-94 Sep-95 Jan-97 May-98 Sep-99 Jan-01 May-02 Sep-03 Jan-05 May-06 Sep-07 Jan-09 May-10 Sep-11 Jan-13 May-14 Price to Book Stock Price $ BV/Share $ Current Prices Reflect the Solid Value of ProAssurance Current Price to Q1 2014 Book: 1.1x Average Since Inception: 1.4x Unadjusted for dividends Prices Adjusted for 2:1 Stock Split
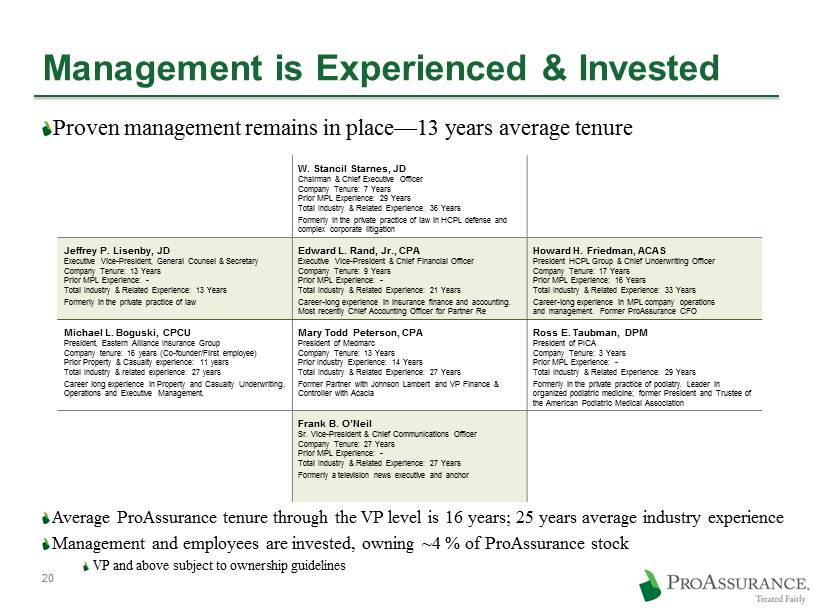
W. Stancil Starnes, JD Chairman & Chief Executive Officer Company Tenure: 7 Years Prior MPL Experience: 29 Years Total Industry & Related Experience: 36 Years Formerly in the private practice of law in HCPL defense and complex corporate litigation Jeffrey P. Lisenby, JD Executive Vice - President, General Counsel & Secretary Company Tenure : 13 Years Prior MPL Experience: - Total Industry & Related Experience: 13 Years Formerly in the private practice of law Edward L. Rand, Jr., CPA Executive Vice - President & Chief Financial Officer Company Tenure : 9 Years Prior MPL Experience: - Total Industry & Related Experience: 21 Years Career - long experience in insurance finance and accounting. Most recently Chief Accounting Officer for Partner Re Howard H. Friedman, ACAS President HCPL Group & Chief Underwriting Officer Company Tenure: 17 Years Prior MPL Experience: 16 Years Total Industry & Related Experience: 33 Years Career - long experience in MPL company operations and management. Former ProAssurance CFO Michael L. Boguski, CPCU President, Eastern Alliance Insurance Group Company tenure: 16 years (Co - founder/First employee) Prior Property & Casualty experience: 11 years Total Industry & related experience: 27 years Career long experience in Property and Casualty Underwriting, Operations and Executive Management. Mary Todd Peterson, CPA President of Medmarc Company Tenure : 13 Years Prior Industry Experience: 14 Years Total Industry & Related Experience: 27 Years Former Partner with Johnson Lambert and VP Finance & Controller with Acacia Ross E. Taubman, DPM President of PICA Company Tenure: 3 Years Prior MPL Experience: - Total Industry & Related Experience: 29 Years Formerly in the private practice of podiatry. Leader in organized podiatric medicine; former President and Trustee of the American Podiatric Medical Association Frank B. O’Neil Sr. Vice - President & Chief Communications Officer Company Tenure: 27 Years Prior MPL Experience: - Total Industry & Related Experience: 27 Years Formerly a television news executive and anchor Management is Experienced & Invested Proven management remains in place — 13 years average tenure Average ProAssurance tenure through the VP level is 16 years; 25 years average industry experience Management and employees are invested, owning ~4 % of ProAssurance stock VP and above subject to ownership guidelines 20
Segment Highlights We report results in three operational segments Specialty Property Casualty Insurance Workers’ Compensation Insurance Lloyd’s Syndicate 1729
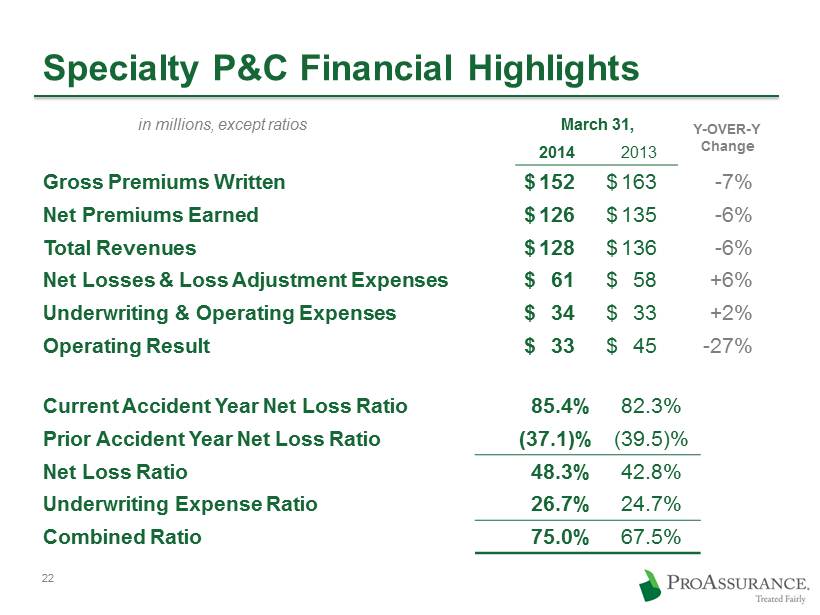
March 31, Y - OVER - Y Change 2014 2013 Gross Premiums Written $ 152 $ 163 - 7% Net Premiums Earned $ 126 $ 135 - 6% Total Revenues $ 128 $ 136 - 6% Net Losses & Loss Adjustment Expenses $ 61 $ 58 +6% Underwriting & Operating Expenses $ 34 $ 33 +2% Operating Result $ 33 $ 45 - 27% 22 Specialty P&C Financial Highlights in millions, except ratios Current Accident Year Net Loss Ratio 85.4% 82.3% Prior Accident Year Net Loss Ratio (37.1)% (39.5)% Net Loss Ratio 48.3% 42.8% Underwriting Expense Ratio 26.7% 24.7% Combined Ratio 75.0% 67.5%
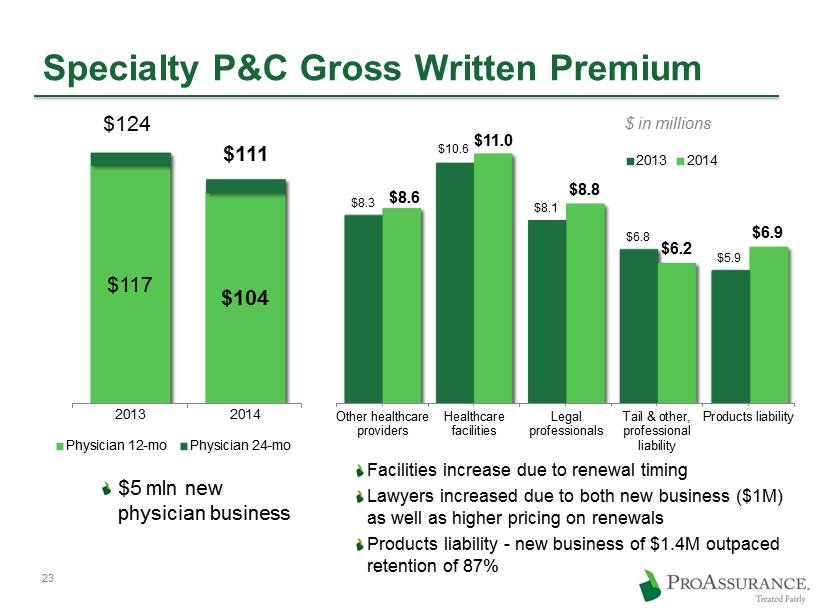
23 Specialty P&C Gross Written Premium $8.3 $10.6 $8.1 $6.8 $5.9 $8.6 $11.0 $8.8 $6.2 $6.9 Other healthcare providers Healthcare facilities Legal professionals Tail & other, professional liability Products liability 2013 2014 $5 mln new physician business $117 $104 $124 $111 2013 2014 Physician 12-mo Physician 24-mo $ in millions Facilities increase due to renewal timing Lawyers increased due to both new business ($1M) as well as higher pricing on renewals Products liability - new business of $1.4M outpaced retention of 87%
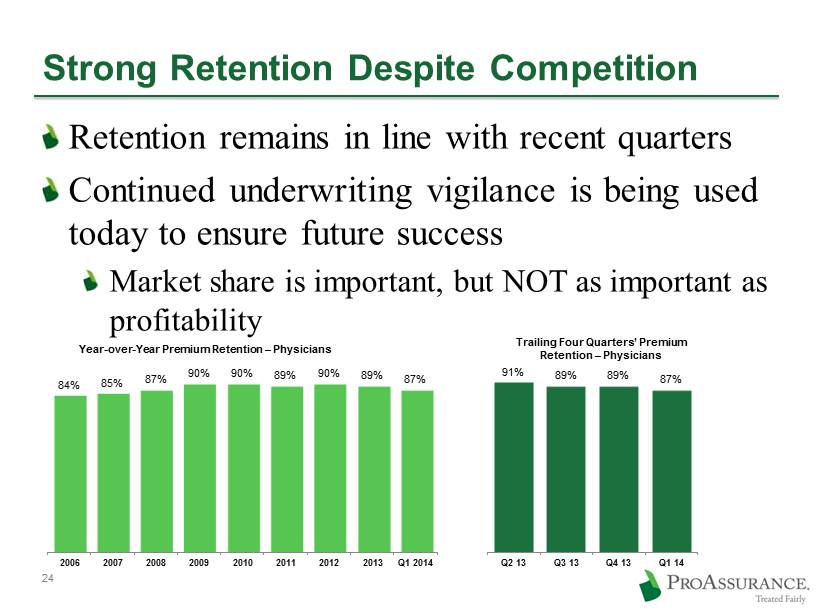
Strong Retention Despite Competition Retention remains in line with recent quarters Continued underwriting vigilance is being used today to ensure future success Market share is important, but NOT as important as profitability 24 84% 85% 87% 90% 90% 89% 90% 89% 87% 2006 2007 2008 2009 2010 2011 2012 2013 Q1 2014 Year - over - Year Premium Retention – Physicians 91% 89% 89% 87% Q2 13 Q3 13 Q4 13 Q1 14 Trailing Four Quarters’ Premium Retention – Physicians
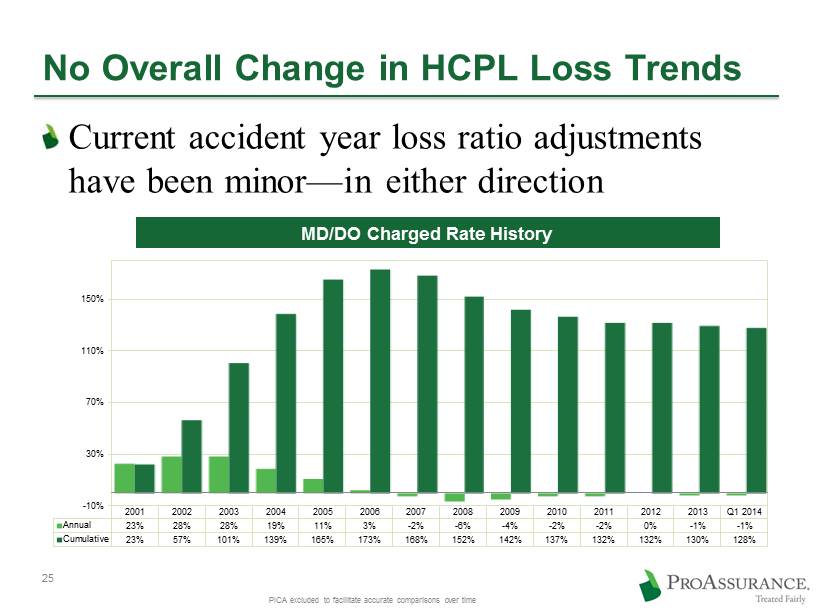
No Overall Change in HCPL Loss Trends Current accident year loss ratio adjustments have been minor — in either direction 25 2001 2002 2003 2004 2005 2006 2007 2008 2009 2010 2011 2012 2013 Q1 2014 Annual 23% 28% 28% 19% 11% 3% -2% -6% -4% -2% -2% 0% -1% -1% Cumulative 23% 57% 101% 139% 165% 173% 168% 152% 142% 137% 132% 132% 130% 128% -10% 30% 70% 110% 150% MD/DO Charged Rate History PICA excluded to facilitate accurate comparisons over time
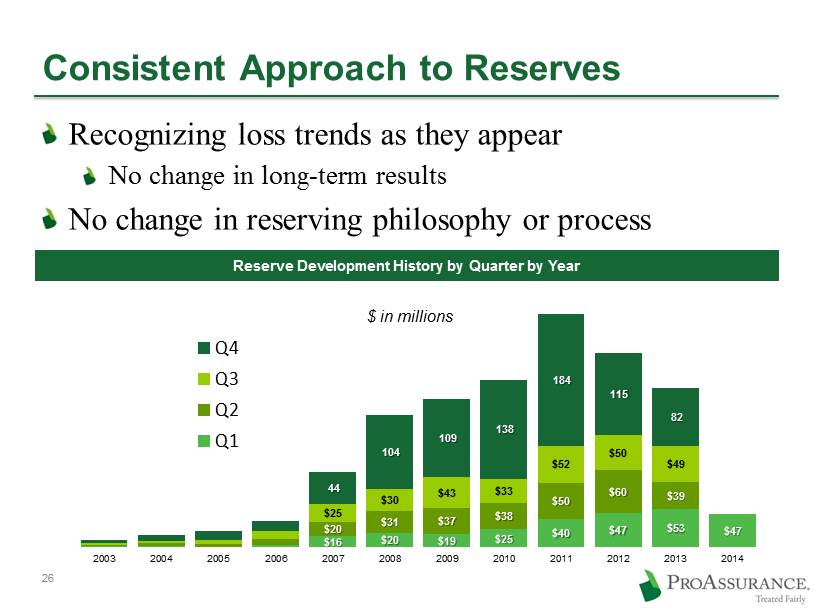
Consistent Approach to Reserves Recognizing loss trends as they appear No change in long - term results No change in reserving philosophy or process 26 Reserve Development History by Quarter by Year $16 $20 $19 $25 $40 $47 $53 $47 $20 $31 $37 $38 $50 $60 $39 $25 $30 $43 $33 $52 $50 $49 44 104 109 138 184 115 82 2003 2004 2005 2006 2007 2008 2009 2010 2011 2012 2013 2014 Q4 Q3 Q2 Q1 $ in millions
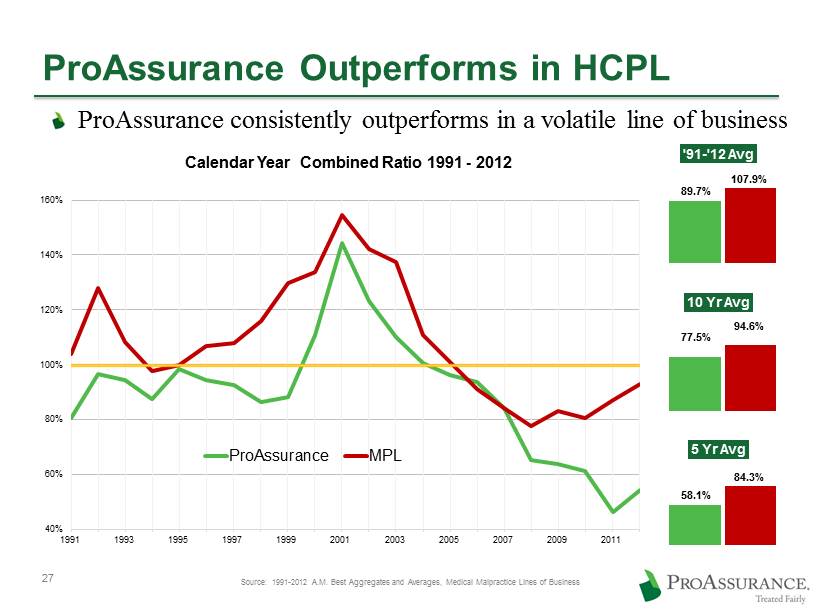
ProAssurance Outperforms in HCPL ProAssurance consistently outperforms in a volatile line of business 40% 60% 80% 100% 120% 140% 160% 1991 1993 1995 1997 1999 2001 2003 2005 2007 2009 2011 Calendar Year Combined Ratio 1991 - 2012 ProAssurance MPL Source: 1991 - 2012 A.M. Best Aggregates and Averages, Medical Malpractice Lines of Business '91 - '12 Avg 5 Yr Avg 89.7% 107.9% 10 Yr Avg 77.5% 94.6% 58.1% 84.3% 27

Segment Highlights We report results in three operational segments Specialty Property Casualty Insurance Workers’ Compensation Insurance Lloyd’s Syndicate 1729
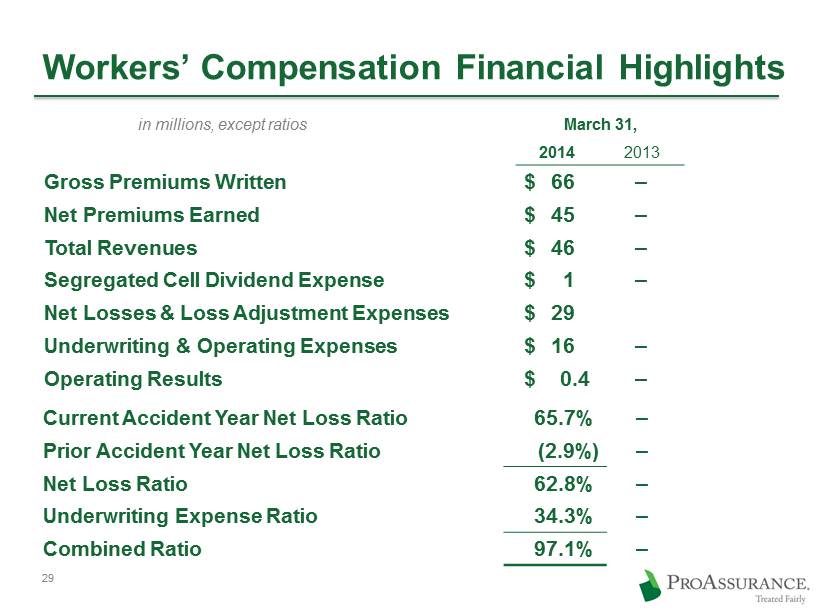
March 31, Y - OVER - Y Change 2014 2013 Gross Premiums Written $ 66 ‒ - 7% Net Premiums Earned $ 45 ‒ - 6% Total Revenues $ 46 ‒ - 6% Segregated Cell Dividend Expense $ 1 ‒ Net Losses & Loss Adjustment Expenses $ 29 Underwriting & Operating Expenses $ 16 ‒ +4% Operating Results $ 0.4 ‒ - 27% Workers’ Compensation Financial Highlights in millions, except ratios Current Accident Year Net Loss Ratio 65.7% ‒ Prior Accident Year Net Loss Ratio (2.9%) ‒ Net Loss Ratio 62.8% ‒ Underwriting Expense Ratio 34.3% ‒ Combined Ratio 97.1% ‒ 29

Consistent Profitability in Workers' Comp 79.1% 65.6% 80.2% 87.7% 96.0% 89.7% 91.8% 93.0% 97.1% 89.9% 2006 2007 2008 2009 2010 2011 2012 2013 Q1 2014 30 (1) 89.9% excluding intangible asset amortization and transaction - related and other one - time charges. Eastern 2006 - 2013 is Traditional Workers’ Compensation only (1)
How Eastern Differentiates Disciplined individual account underwriting with focus on rate adequacy in rural territories Understands market dynamics and regulatory concerns Use of local knowledge that has always differentiated ProAssurance 31
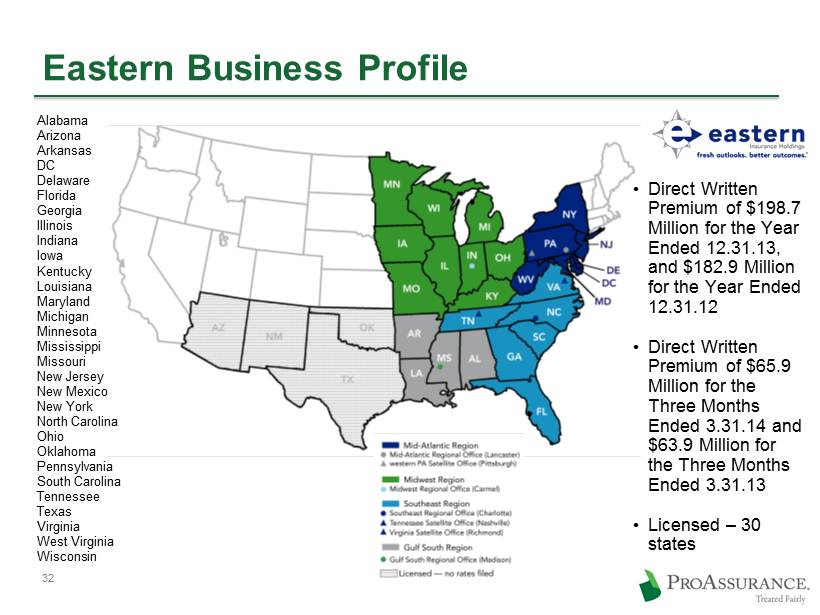
Eastern Business Profile • Direct Written Premium of $198.7 Million for the Year Ended 12.31.13, and $182.9 Million for the Year Ended 12.31.12 • Direct Written Premium of $65.9 Million for the Three Months Ended 3.31.14 and $63.9 Million for the Three Months Ended 3.31.13 • Licensed – 30 states Alabama Arizona Arkansas DC Delaware Florida Georgia Illinois Indiana Iowa Kentucky Louisiana Maryland Michigan Minnesota Mississippi Missouri New Jersey New Mexico New York North Carolina Ohio Oklahoma Pennsylvania South Carolina Tennessee Texas Virginia West Virginia Wisconsin 32
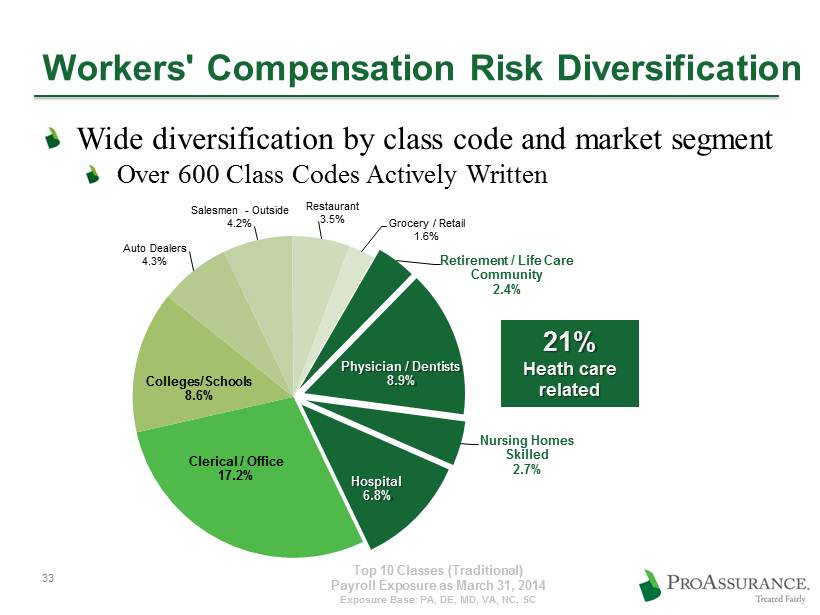
Top 10 Classes (Traditional) Payroll Exposure as March 31, 2014 Exposure Base: PA, DE, MD, VA, NC, SC Workers' Compensation Risk Diversification Retirement / Life Care Community 2.4% Physician / Dentists 8.9% Nursing Homes Skilled 2.7% Hospital 6.8% Clerical / Office 17.2% Colleges/Schools 8.6% Auto Dealers 4.3% Salesmen - Outside 4.2% Restaurant 3.5% Grocery / Retail 1.6% 21% Heath care related 33 Wide diversification by class code and market segment Over 600 Class Codes Actively Written
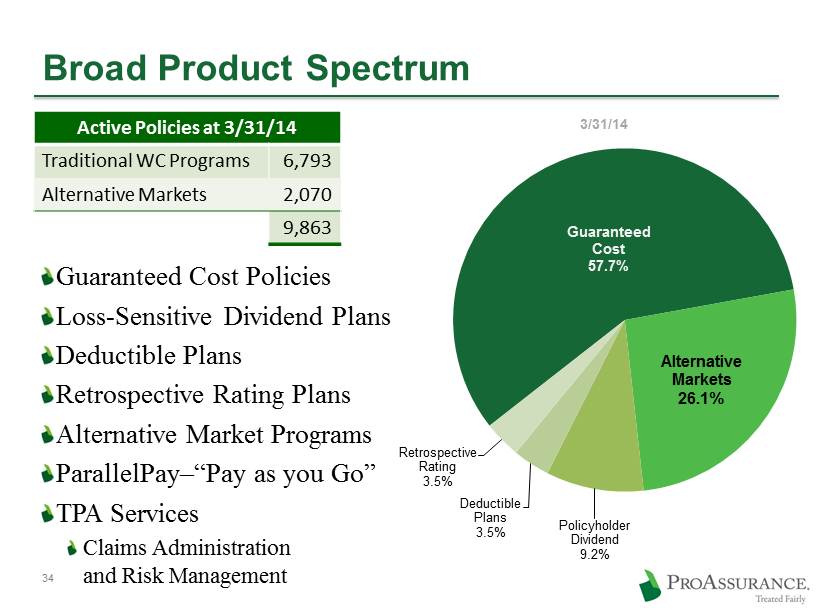
Guaranteed Cost 57.7% Alternative Markets 26.1% Policyholder Dividend 9.2% Deductible Plans 3.5% Retrospective Rating 3.5% 34 Broad Product Spectrum Guaranteed Cost Policies Loss - Sensitive Dividend Plans Deductible Plans Retrospective Rating Plans Alternative Market Programs ParallelPay – “ Pay as you Go” TPA Services Claims Administration and Risk Management 3/31/14 Active Policies at 3/31/14 Traditional WC Programs 6,793 Alternative Markets 2,070 9,863
How Eastern Differentiates Extensive medical cost containment strategies Proactive claims management and strategic use of return - to - wellness initiatives Use of a proactive, unique claims approach that has always differentiated ProAssurance 35
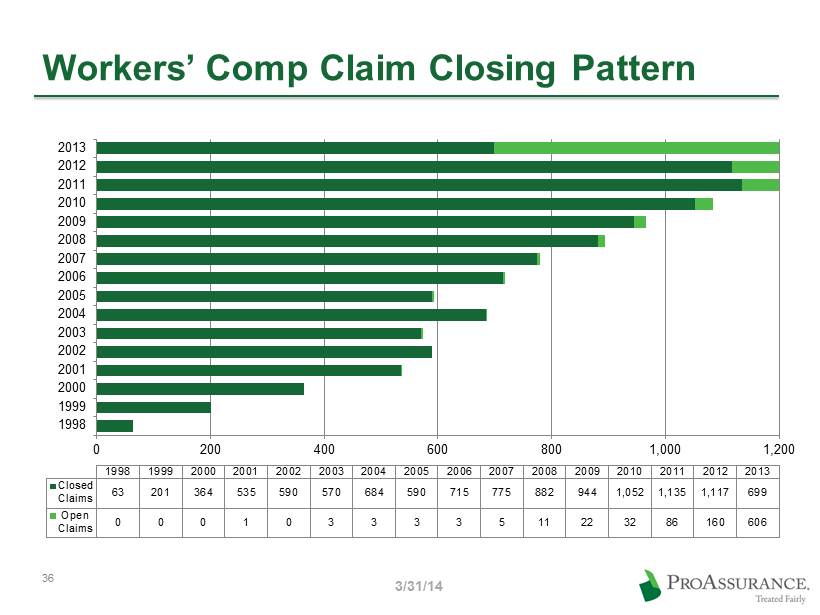
Workers’ Comp Claim Closing Pattern 0 200 400 600 800 1,000 1,200 1998 1999 2000 2001 2002 2003 2004 2005 2006 2007 2008 2009 2010 2011 2012 2013 1998 1999 2000 2001 2002 2003 2004 2005 2006 2007 2008 2009 2010 2011 2012 2013 Closed Claims 63 201 364 535 590 570 684 590 715 775 882 944 1,052 1,135 1,117 699 Open Claims 0 0 0 1 0 3 3 3 3 5 11 22 32 86 160 606 36 3/31/14

How Eastern Differentiates Value - added risk management services cements brand loyalty Strategic partnerships with select independent agencies that share philosophies on controlling workers’ compensation costs 37
Segment Highlights We report results in three operational segments Specialty Property Casualty Insurance Workers’ Compensation Insurance Lloyd’s Syndicate 1729
Lloyd’s Syndicate 1729 Writing business as of January 1, 2014 $875,000 in Q1 operating expenses Full results reported on a one - quarter lag except investments $5mln in Specialty P&C premium assumed by the Syndicate in Q1 2014 will be reported in Q2 2014 and will be subject to our 58% participation in the risk Investments ($15,000 investment income in Q1) reported on a current quarter basis 39
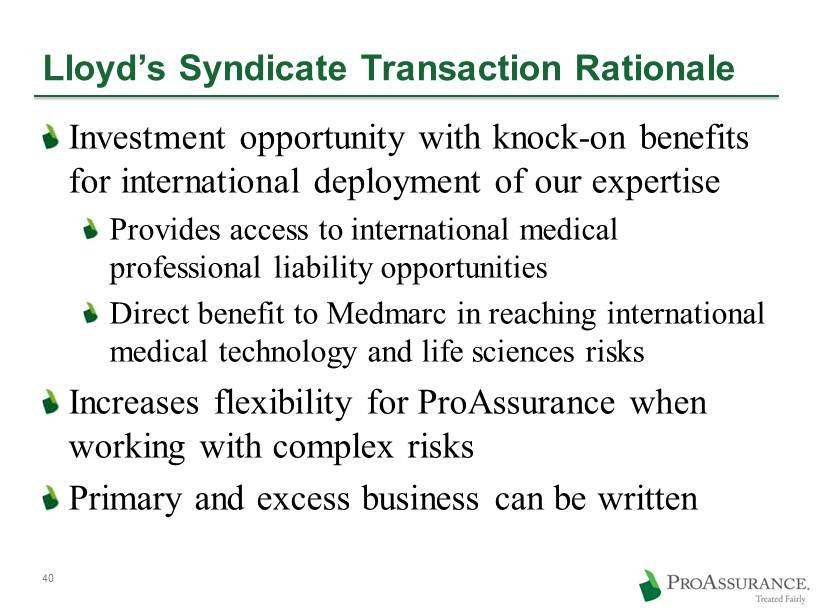
Lloyd’s Syndicate Transaction Rationale Investment opportunity with knock - on benefits for international deployment of our expertise Provides access to international medical professional liability opportunities Direct benefit to Medmarc in reaching international medical technology and life sciences risks Increases flexibility for ProAssurance when working with complex risks Primary and excess business can be written 40
Segment Highlights Corporate U.S. investing activities Non - premium revenues Corporate expenses U . S. taxes
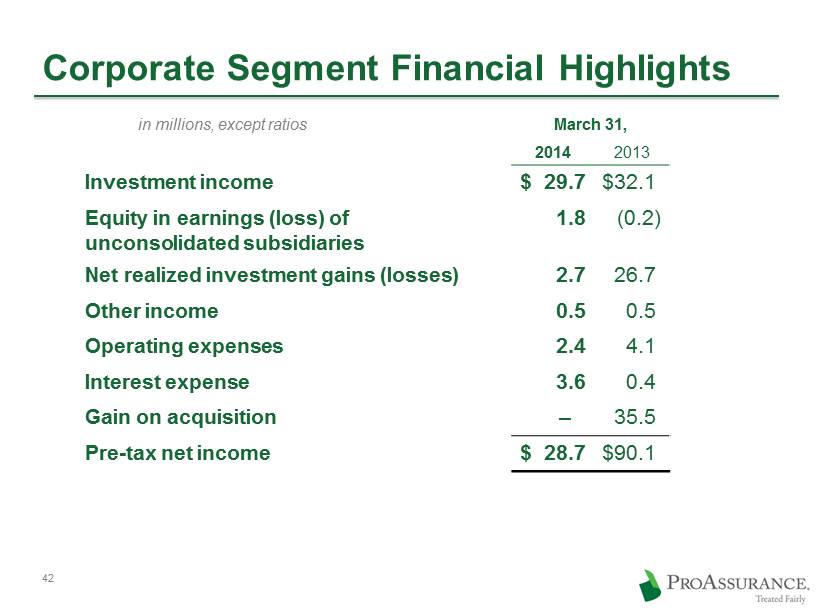
March 31, 2014 2013 Investment income $ 29.7 $ 32.1 Equity in earnings (loss) of unconsolidated subsidiaries 1.8 (0.2) Net realized investment gains (losses) 2.7 26.7 Other income 0.5 0.5 Operating expenses 2.4 4.1 Interest expense 3.6 0.4 Gain on acquisition ‒ 35.5 Pre - tax net income $ 28.7 $ 90.1 42 Corporate Segment Financial Highlights in millions, except ratios
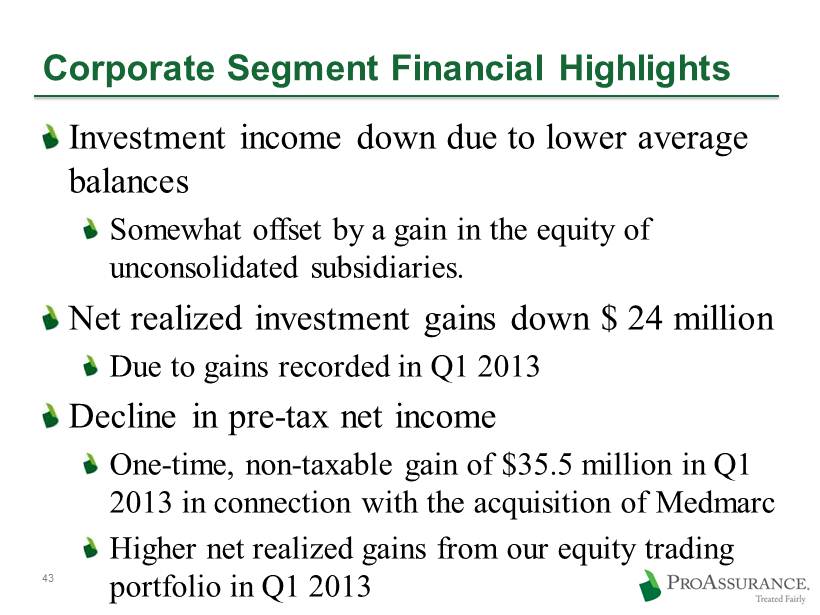
Corporate Segment Financial Highlights Investment income down due to lower average balances Somewhat offset by a gain in the equity of unconsolidated subsidiaries. Net realized investment gains down $ 24 million D ue to gains recorded in Q1 2013 Decline in pre - tax net income O ne - time , non - taxable gain of $ 35.5 million in Q1 2013 in connection with the acquisition of Medmarc Higher net realized gains from our equity trading portfolio in Q1 2013 43

Corporate Strategy Update Our vision for the future. We believe our successful experience and deep expertise uniquely qualify ProAssurance to insure the widest range of healthcare risks
American Healthcare Must Evolve Current costs are unsustainable Larger, geographically - diverse systems will attempt to create new delivery models and greater efficiency They will demand a broad range of coverages from companies with significant financial size, wide geographic reach and demonstrated expertise Care will be delivered by lower cost providers whose risk profile will increase Traditional small groups and solo practitioners will remain but will require innovative coverages as new risks emerge 45
Strategy for an Evolving Market We are building the platform that will allow us to serve the broad spectrum of healthcare Prudently leveraging our success and experience with the addition of specialized expertise Broad capabilities to meet evolving demands Eastern, Medmarc, PICA & Mid - Continent Traditional HCPL companies deepen our capabilities 46
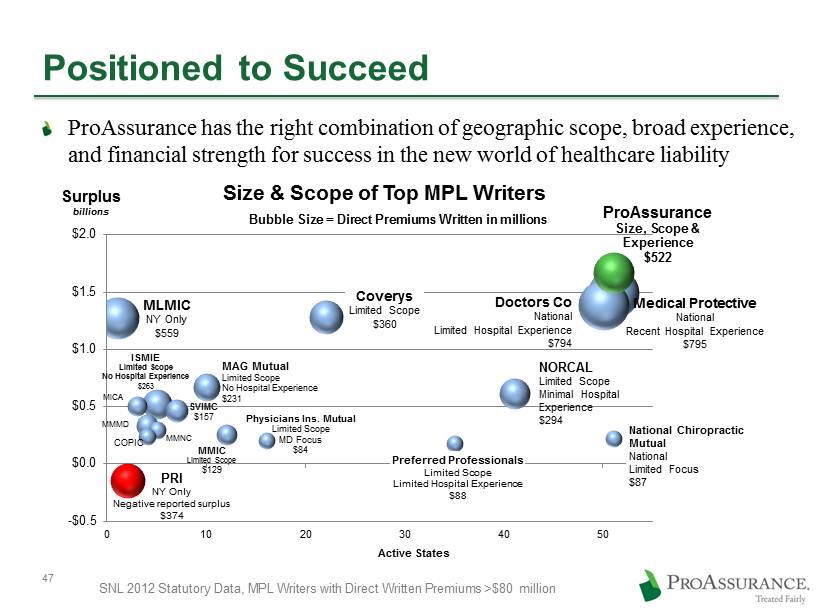
Positioned to Succeed ProAssurance has the right combination of geographic scope, broad experience, and financial strength for success in the new world of healthcare liability 47 Medical Protective National Recent Hospital Experience $795 Doctors Co National Limited Hospital Experience $794 MLMIC NY Only $559 ProAssurance Size, Scope & Experience $522 PRI NY Only Negative reported surplus $374 Coverys Limited Scope $360 NORCAL Limited Scope Minimal Hospital Experience $294 ISMIE Limited Scope No Hospital Experience $263 MAG Mutual Limited Scope No Hospital Experience $231 SVIMC $157 MMMD MMIC Limited Scope $129 MICA MMNC COPIC Preferred Professionals Limited Scope Limited Hospital Experience $88 National Chiropractic Mutual National Limited Focus $87 Physicians Ins. Mutual Limited Scope MD Focus $84 -$0.5 $0.0 $0.5 $1.0 $1.5 $2.0 0 10 20 30 40 50 Size & Scope of Top MPL Writers Surplus billions Active States Bubble Size = Direct Premiums Written in millions SNL 2012 Statutory Data, MPL Writers with Direct Written Premiums >$80 million

Strategic Successes Leveraging our reach, expertise and financial strength with The Certitude tm program in partnership with Ascension Health Largest non - profit healthcare system in the US Now in Michigan, Florida, Illinois, Indiana, and Texas Insuring Ascension - affiliated physicians through coordinated, jointly insured programs 48 *www.ascensionhealth.org/index.php?option=com_locations&view=locations&Itemid=148 Ascension Health’s Ministry Locations*
Strategic Successes Partnerships with existing physician - focused companies to leverage hospital expertise California venture with CAP - MPT : CAPAssurance Now writing large groups and facilities Joint physician/hospital insurance products to address the unique risk tolerance and claims - handling expectation of each insured 49
Strategic Opportunities Alternative risk and self - insurance opportunities Captive insurance programs allow large, sophisticated healthcare and workers’ compensation customers to control their own insurance programs Eastern Re brings proven experience and expertise in establishing and operating captives through segregated cells Risk sharing/high deductible programs Risk Retention Groups for specific specialties or regions 50
Strategic Opportunities ProAssurance Risk Solutions sm Newly formed unit brings proven expertise to address complex risk financing challenges in both healthcare and workers’ compensation Run - off liabilities in M&A transactions Assumption of existing reserve liabilities for large organizations seeking to repurpose capital resources Specialized self - insurance plans Offers financial flexibility through more efficient securitization/collateralization of self - funded risks 51
Key Investor Points ProAssurance has always evolved ahead of the curve in our industry — we continue that trend We have proven our ability to thrive across insurance cycles and produce significant returns for long - term shareholders Our long - term focus on financial strength and sustained value creation is central to our overall strategy Our management team is heavily invested — professionally and financially in our success 52

By the Numbers: Additional Financial Detail
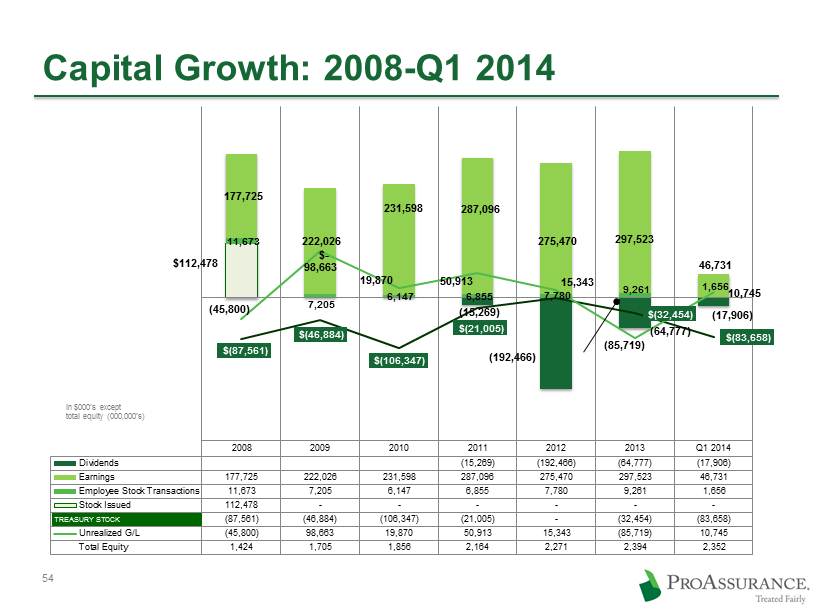
Capital Growth: 2008 - Q1 2014 2008 2009 2010 2011 2012 2013 Q1 2014 Dividends (15,269) (192,466) (64,777) (17,906) Earnings 177,725 222,026 231,598 287,096 275,470 297,523 46,731 Employee Stock Transactions 11,673 7,205 6,147 6,855 7,780 9,261 1,656 Stock Issued 112,478 - - - - - - Treasury Stock (87,561) (46,884) (106,347) (21,005) - (32,454) (83,658) Unrealized G/L (45,800) 98,663 19,870 50,913 15,343 (85,719) 10,745 Total Equity 1,424 1,705 1,856 2,164 2,271 2,394 2,352 $112,478 $ - 11,673 7,205 6,147 6,855 7,780 9,261 1,656 177,725 222,026 231,598 287,096 275,470 297,523 46,731 (15,269) (192,466) (64,777) (17,906) $(87,561) $(46,884) $(106,347) $(21,005) $(32,454) $(83,658) (45,800) 98,663 19,870 50,913 15,343 (85,719) 10,745 TREASURY STOCK in $000’s except total equity (000,000’s) 54
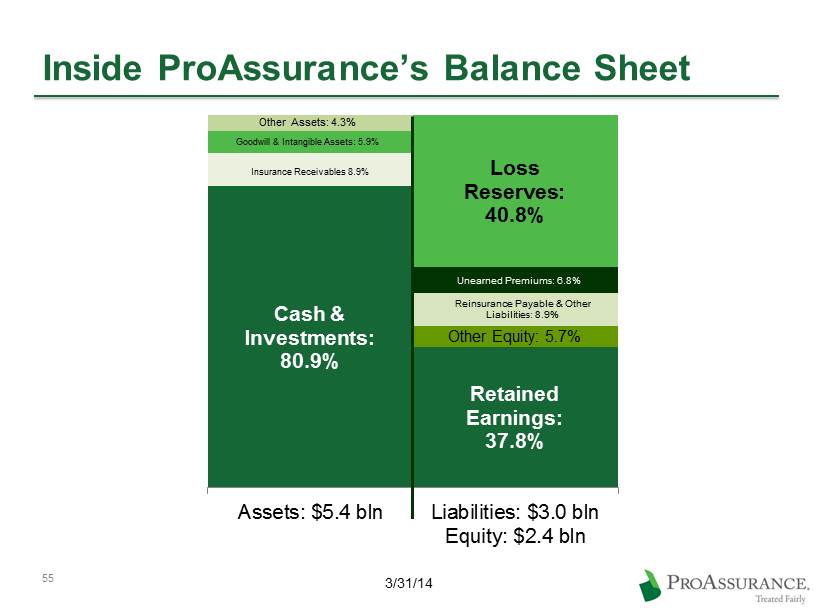
Inside ProAssurance’s Balance Sheet Cash & Investments: 80.9% Insurance Receivables 8.9% Goodwill & Intangible Assets: 5.9% Other Assets: 4.3% Retained Earnings: 37.8% Other Equity: 5.7% Reinsurance Payable & Other Liabilities: 8.9% Unearned Premiums: 6.8% Loss Reserves: 40.8% Assets: $5.4 bln Liabilities: $3.0 bln Equity: $2.4 bln 3/31/14 55

Inside ProAssurance’s Income Statement Net Premiums Earned: 82.5% Net Realized Investment Gains: 1.3% Net Investment Income: 14.3% Other: 1.9% Net Income: 22.5% Provision for Income Taxes: 7.1% Underwriting, Policy Acquisitions, Operating and Interest Expenses: 27.4% Net Losses and Loss Adjustment Expenses: 43.0% Revenues: $208 mln Expenses: $161 mln Net Income: $47 mln 56 3/31/14
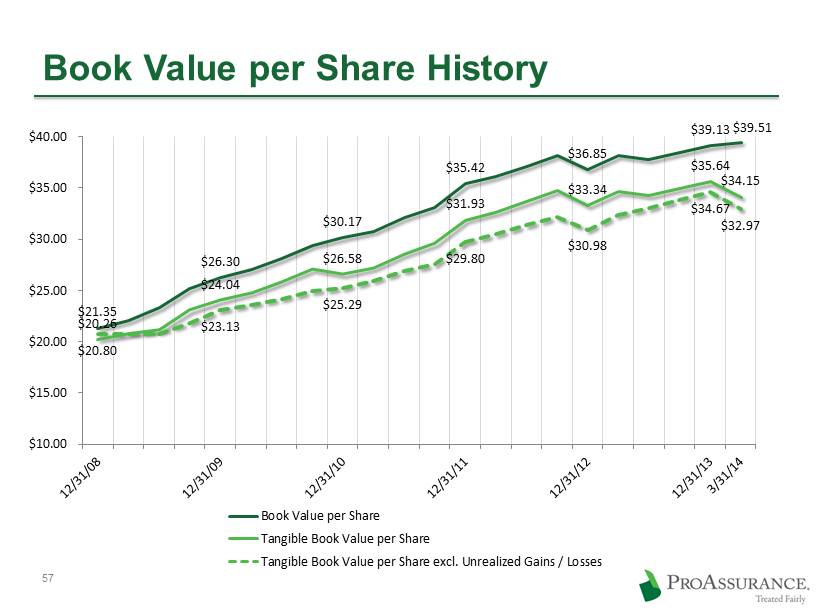
$21.35 $26.30 $30.17 $35.42 $36.85 $39.13 $39.51 $20.26 $24.04 $26.58 $31.93 $33.34 $35.64 $34.15 $20.80 $23.13 $25.29 $29.80 $30.98 $34.67 $32.97 $10.00 $15.00 $20.00 $25.00 $30.00 $35.00 $40.00 Book Value per Share Tangible Book Value per Share Tangible Book Value per Share excl. Unrealized Gains / Losses Book Value per Share History 57
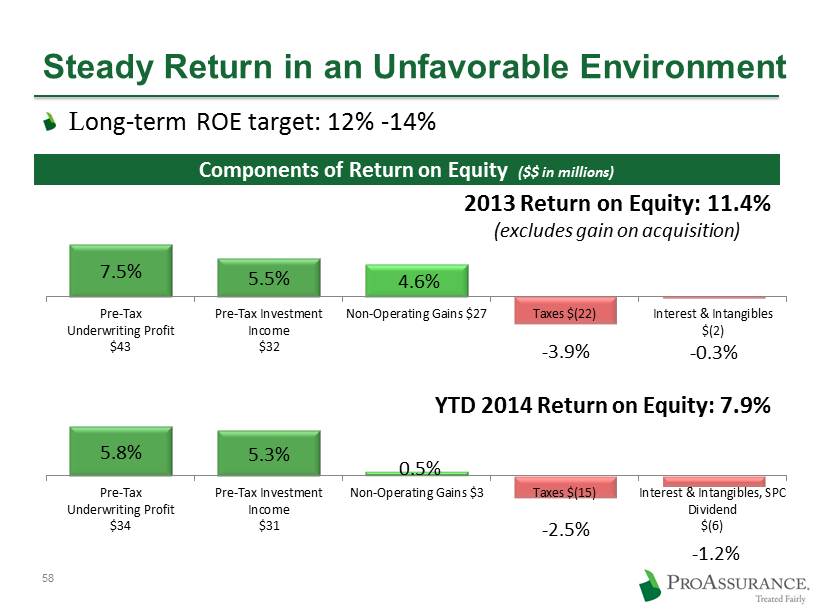
7.5% 5.5% 4.6% - 3.9% - 0.3% Pre-Tax Underwriting Profit $43 Pre-Tax Investment Income $32 Non-Operating Gains $27 Taxes $(22) Interest & Intangibles $(2) 2013 Return on Equity: 11.4% (excludes gain on acquisition) 58 Steady Return in an Unfavorable Environment L ong - term ROE target: 12% - 14% 5.8% 5.3% 0.5% - 2.5% - 1.2% Pre-Tax Underwriting Profit $34 Pre-Tax Investment Income $31 Non-Operating Gains $3 Taxes $(15) Interest & Intangibles, SPC Dividend $(6) YTD 2014 Return on Equity: 7.9% Components of Return on Equity ($$ in millions)

Investment Portfolio Detail ProAssurance remains conservatively invested to ensure our ability to keep our long - term promise of insurance protection
2014 Investment Developments Maintaining duration of approximately four years Book yield has stabilized 4.2% tax effective on a QTD and YTD basis Overall credit quality is up slightly to A+ 60 2014 Investment Strategy & Outlook Focusing on integration of Eastern Managing duration
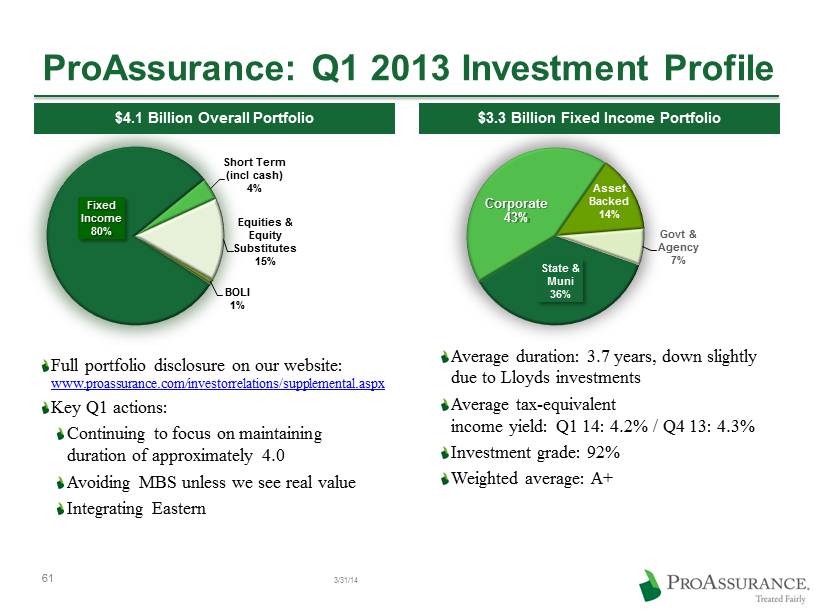
ProAssurance: Q1 2013 Investment Profile Fixed Income 80% Short Term (incl cash) 4% Equities & Equity Substitutes 15% BOLI 1% $4.1 Billion Overall Portfolio State & Muni 36% Corporate 43% Asset Backed 14% Govt & Agency 7% $ 3.3 Billion Fixed Income Portfolio Average duration: 3.7 years, down slightly due to Lloyds investments Average tax - equivalent income yield: Q1 14: 4.2% / Q4 13: 4.3% Investment grade: 92% Weighted average: A+ 3/31/14 Full portfolio disclosure on our website: www.proassurance.com/investorrelations/supplemental.aspx Key Q1 actions: Continuing to focus on maintaining duration of approximately 4.0 Avoiding MBS unless we see real value Integrating Eastern 61
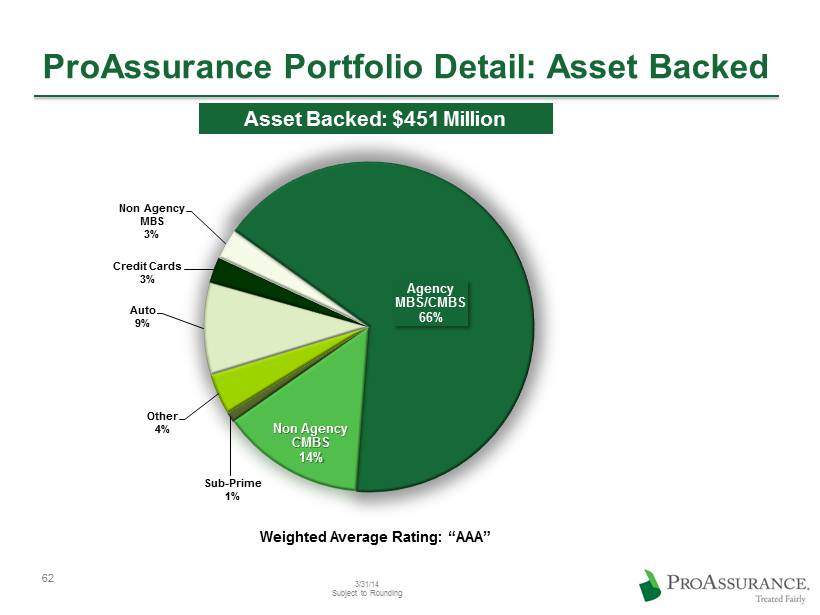
Sub - Prime 1% Other 4% Auto 9% Credit Cards 3% Non Agency MBS 3% Agency MBS/CMBS 66% Non Agency CMBS 14% ProAssurance Portfolio Detail: Asset Backed 3/31/14 Subject to Rounding Asset Backed: $451 Million Weighted Average Rating: “ AAA” 62
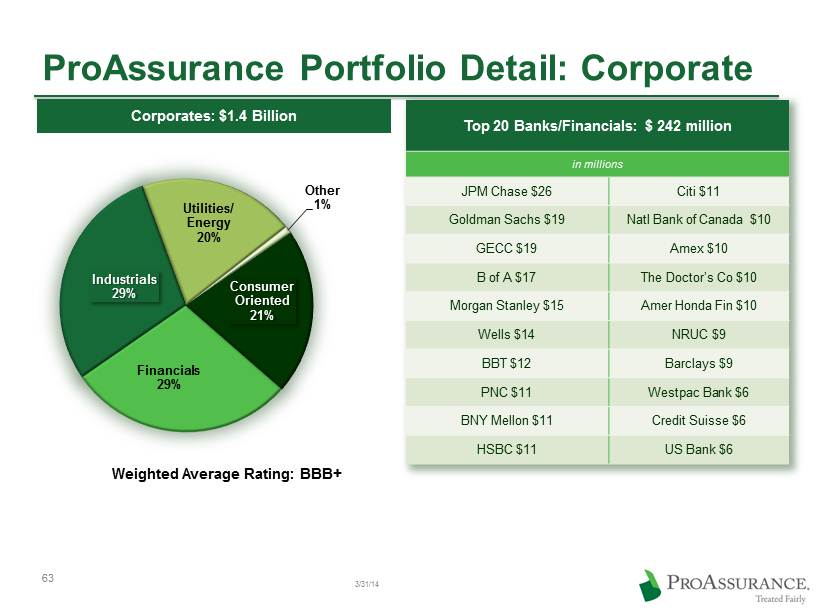
Financials 29% Industrials 29% Utilities/ Energy 20% Other 1% Consumer Oriented 21% ProAssurance Portfolio Detail: Corporate Corporates: $ 1.4 Billion Weighted Average Rating: BBB+ Top 20 Banks/Financials: $ 242 million in millions JPM Chase $26 Citi $11 Goldman Sachs $19 Natl Bank of Canada $10 GECC $19 Amex $10 B of A $17 The Doctor’s Co $10 Morgan Stanley $15 Amer Honda Fin $10 Wells $14 NRUC $9 BBT $12 Barclays $9 PNC $11 Westpac Bank $6 BNY Mellon $11 Credit Suisse $6 HSBC $11 US Bank $6 3/31/14 63
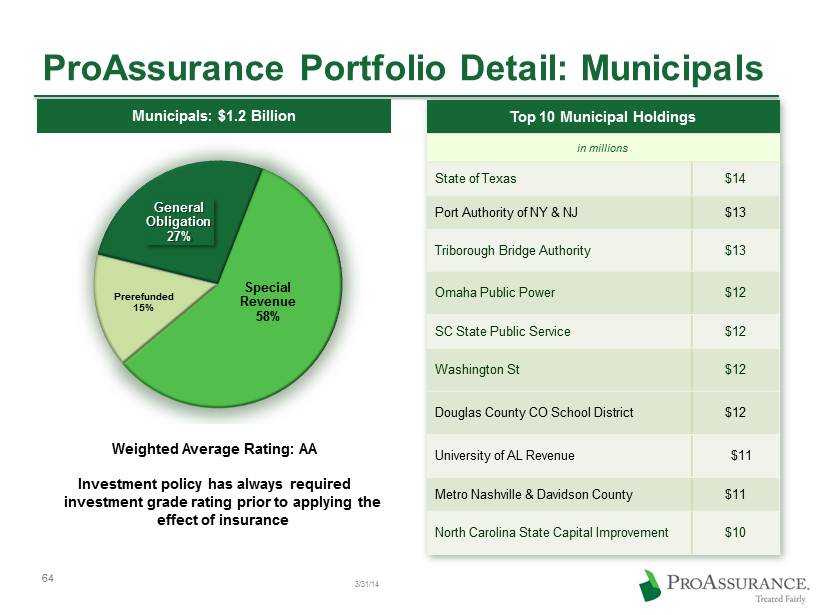
General Obligation 27% Special Revenue 58% Prerefunded 15% ProAssurance Portfolio Detail: Municipals Municipals: $ 1.2 Billion Investment policy has always required investment grade rating prior to applying the effect of insurance Top 10 Municipal Holdings in millions State of Texas $14 Por t Authority of NY & NJ $13 Triborough Bridge Authority $13 Omaha Public Power $12 SC State Public Service $12 Washington St $12 Douglas County CO School District $12 University of AL Revenue $11 Metro Nashville & Davidson County $11 North Carolina State Capital Improvement $10 Weighted Average Rating: AA 3/31/14 64
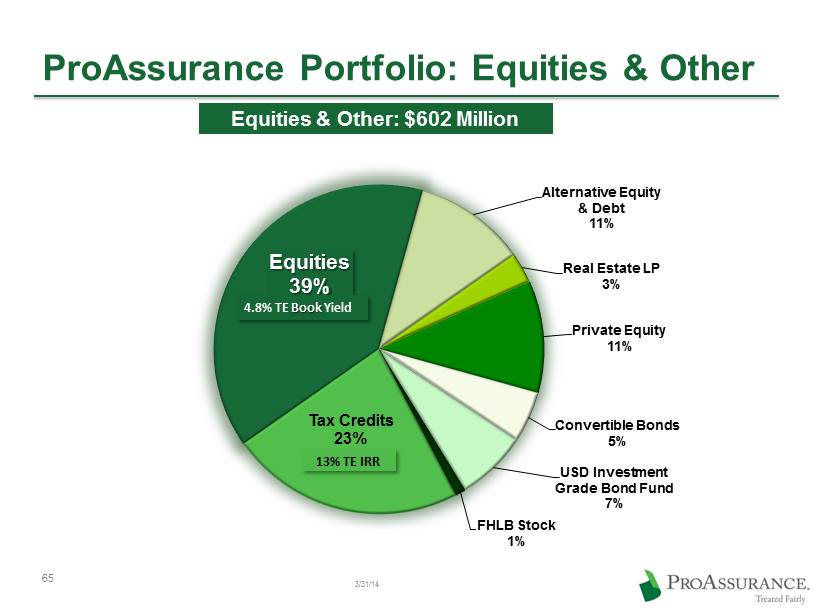
Equities 39% Alternative Equity & Debt 11% Real Estate LP 3% Private Equity 11% Convertible Bonds 5% USD Investment Grade Bond Fund 7% FHLB Stock 1% Tax Credits 23% ProAssurance Portfolio: Equities & Other 3/31/14 Equities & Other: $602 Million 4.8% TE Book Yield 13% TE IRR 65
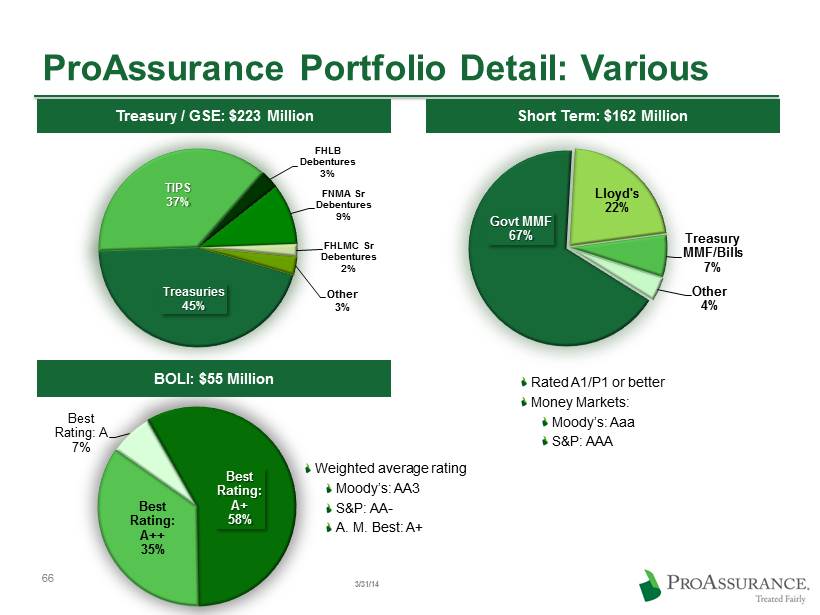
ProAssurance Portfolio Detail: Various Govt MMF 67% Lloyd's 22% Treasury MMF/Bills 7% Other 4% Best Rating: A 7% Best Rating: A+ 58% Best Rating: A++ 35% Rated A1/P1 or better Money Markets: Moody’s: Aaa S&P: AAA Weighted average rating Moody’s: AA3 S&P: AA - A. M. Best: A+ Treasuries 45% TIPS 37% FHLB Debentures 3% FNMA Sr Debentures 9% FHLMC Sr Debentures 2% Other 3% Treasury / GSE: $223 Million Short Term: $162 Million BOLI: $55 Million 3/31/14 66