Exhibit 99.2

March 16 - 17, 2015 2016 Insurance Conference Investor Meetings W. Stancil Starnes Chairman & Chief Executive Officer Edward L. Rand, Jr . Executive Vice President & Chief Financial Officer
Forward Looking Statements 2 This presentation contains Forward Looking Statements and other information designed to convey our projections and expectations regarding future results. There are a number of factors which could cause our actual results to vary materially from those projected in this presentation. The principal risk factors that may cause these differences are described in various documents we file with the Securities and Exchange Commission, such as our Current Reports on Form 8 - K, and our regular reports on Forms 10 - Q and 10 - K, particularly in “Item 1A, Risk Factors.” Please review this presentation in conjunction with a thorough reading and understanding of these risk factors. We especially identify statements concerning our acquisition of Eastern Insurance Holdings, Inc. and the establishment of Lloyd's Syndicate 1729 as Forward Looking Statements and direct your attention to our news releases issued on September 24, 2013, our Current Report on Form 8K, issued on September 24, 2013 and our subsequently filed Forms 10K and 10Q for discussion s of risk factors pertaining to these transactions and subsequent integration into ProAssurance. This presentation contains Non - GAAP measures, and we may reference Non - GAAP measures in our remarks and discussions. A reconciliation of these measures to GAAP measures is included in this presentation and is also available in our latest quarterly news release, which is available in the Investor Relations section of our website, www.ProAssurance.com, and in the related Current Report on Form 8K disclosing that release . N on - GAAP Measures

ProAssurance Corporate Profile Healthcare - centric specialty insurance writer Healthcare Professional Liability (HCPL) Only public company writing predominately HCPL Life sciences and medical device liability Workers' compensation Legal professional liability ProAssurance Mission Statement We Exist to Protect Others As a strong and trusted partner, we help our customers confront uncertainty through innovative loss transfer and loss mitigation solutions for liability risks, with an emphasis on healthcare. 3
Financial Results YTD Our commentary on YTD 2014 results and updates on recent transactions and strategy

2014 Income Statement Highlights Solid profitability in a challenging market in millions, except per share data December 31, Y - OVER - Y Change 2014 2013 Gross Premiums Written $ 780 $ 568 +37% Net Investment Result $ 130 $ 137 - 5% Total Revenues $ 852 $ 740 +15% Total Expenses (Includes Loss Costs) $ 590 $ 375 +57% Net Income (Includes Realized Investment Gains & Losses and Gain on Acquisition) $ 197 $ 298 - 34% Operating Income $ 186 $ 221 - 16% Net Income per Diluted Share $3.30 $4.80 - 31% Operating Income per Diluted Share $3.13 $3.56 - 12%

2014 Balance Sheet Highlights Split adjusted, in billions, except Book Value per share Shareholders’ Equity $ 2.2 $ 2.4 - 10 % Total Investments 4.0 3.9 + 2 % Total Assets 5.2 5.2 ̶ Policy Liabilities 2.4 2.4 + 2 % 2014 2013 CHANGE $1.15 $1.42 $1.70 $1.86 $2.16 $2.27 $ 2.39 $2.16 2007 2008 2009 2010 2011 2012 2013 2014 Shareholders’ Equity: 87% Increase Since 2007 Book Value per Share $ 38.17 $ 39.13 - 2% Maintaining the financial strength required to keep our insurance promise

Capital Discussion We focus on the creation of meaningful shareholder value through a disciplined approach to capital management
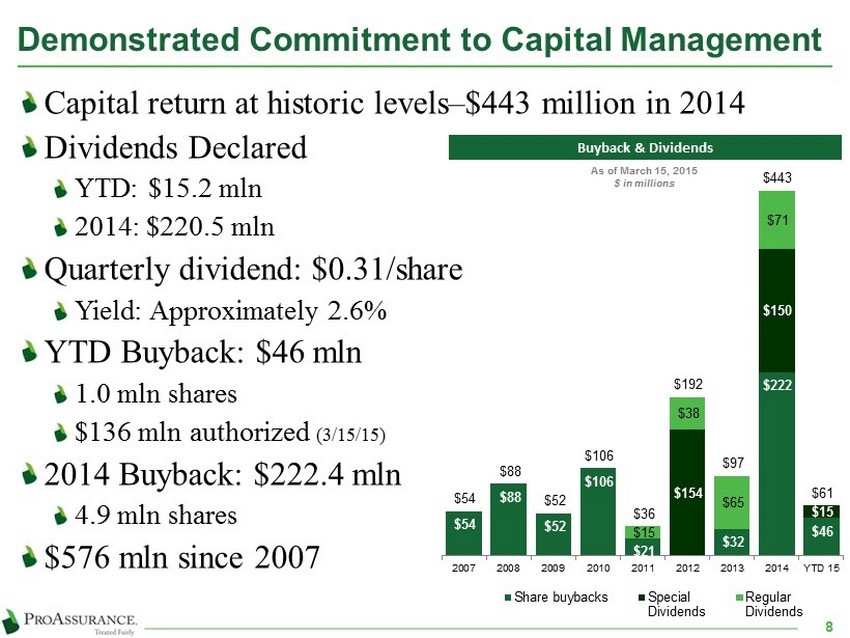
Demonstrated Commitment to Capital Management Capital return at historic levels – $443 million in 2014 Dividends Declared YTD: $15.2 mln 2014: $220.5 mln Quarterly dividend: $0.31/share Yield: Approximately 2.6% YTD Buyback: $46 mln 1.0 mln shares $ 136 mln authorized (3/15/15) 2014 Buyback: $222.4 mln 4.9 mln shares $576 mln since 2007 $46 $222 $32 $21 $ 106 $52 $88 $54 $15 $150 $154 $71 $ 65 $38 $15 $61 $443 $97 $192 $36 $ 106 $52 $88 $54 YTD 15 2014 2013 2012 2011 2010 2009 2008 2007 Share buybacks Special Dividends Regular Dividends As of March 15, 2015 $ in millions Buyback & Dividends 8
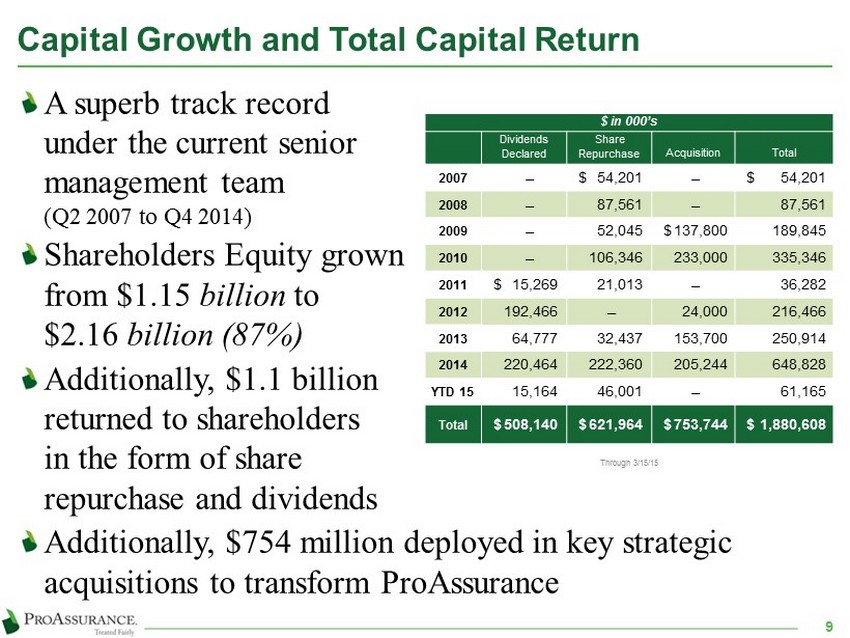
Capital Growth and Total Capital Return 9 A superb track record under the current senior management team ( Q2 2007 to Q4 2014) Shareholders Equity grown from $1.15 billion to $ 2.16 billion (87%) Additionally, $1.1 billion returned to shareholders in the form of share repurchase and dividends Additionally, $754 million deployed in key strategic acquisitions to transform ProAssurance $ in 000’s Dividends Declared Share Repurchase Acquisition Total 2007 ̶ $ 54,201 ̶ $ 54,201 2008 ̶ 87,561 ̶ 87,561 2009 ̶ 52,045 $ 137,800 189,845 2010 ̶ 106,346 233,000 335,346 2011 $ 15,269 21,013 ̶ 36,282 2012 192,466 ̶ 24,000 216,466 2013 64,777 32,437 153,700 250,914 2014 220,464 222,360 205,244 648,828 YTD 15 15,164 46,001 ̶ 61,165 Total $ 508,140 $ 621,964 $ 753,744 $ 1,880,608 Through 3 / 15 / 15
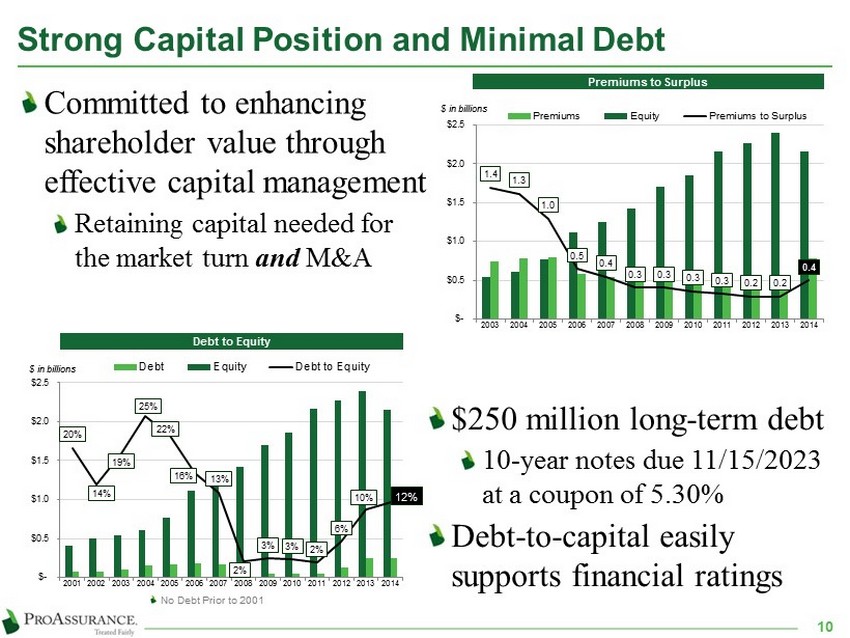
Strong Capital Position and Minimal Debt Committed to enhancing shareholder value through effective capital management R etaining capital needed for the market turn and M&A 12% 10% 6% 2% 3% 3 % 2% 13% 16% 22% 25% 19% 14% 20 % $- $0.5 $1.0 $1.5 $2.0 $2.5 2014 2013 2012 2011 2010 2009 2008 2007 2006 2005 2004 2003 2002 2001 $ in billions Debt Equity Debt to Equity No Debt Prior to 2001 Premiums to Surplus Debt to Equity $250 million long - term debt 10 - year notes due 11/15/2023 at a coupon of 5.30% Debt - to - capital easily supports financial ratings 10 1.4 1.3 1.0 0.5 0.4 0.3 0.3 0.3 0.3 0.2 0.2 0.4 $- $0.5 $1.0 $1.5 $2.0 $2.5 2014 2013 2012 2011 2010 2009 2008 2007 2006 2005 2004 2003 Premiums Equity Premiums to Surplus $ in billions
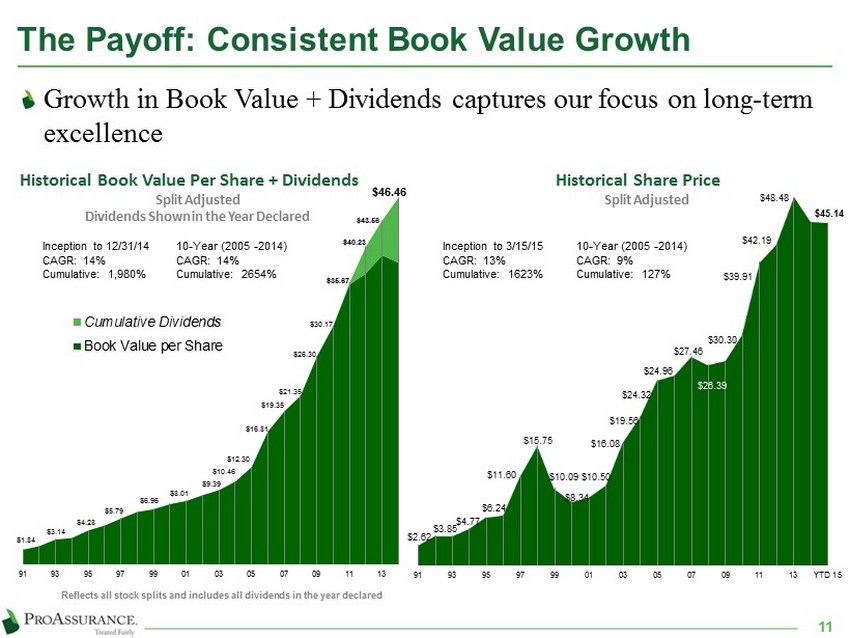
$2.62 $3.85 $4.77 $ 6.24 $11.60 $15.75 $10.09 $8.34 $10.50 $16.08 $19.56 $ 24.32 $24.96 $27.46 $26.39 $30.30 $39.91 $42.19 $48.48 $ 45.14 91 93 95 97 99 01 03 05 07 09 11 13 YTD 15 $1.84 $3.14 $4.28 $5.79 $6.96 $8.01 $9.39 $ 10.46 $12.30 $16.81 $19.35 $21.35 $26.30 $30.17 $35.67 $ 40.23 $43.56 $46.46 91 93 95 97 99 01 03 05 07 09 11 13 Cumulative Dividends Book Value per Share The Payoff: Consistent Book Value Growth Growth in Book Value + Dividends captures our focus on long - term excellence Inception to 12/31/14 10 - Year (2005 - 2014) CAGR: 14% CAGR: 14% Cumulative: 1,980% Cumulative: 2654 % Historical Book Value Per Share + Dividends Split Adjusted Dividends Shown in the Year Declared Reflects all stock splits and includes all dividends in the year declared Inception to 3 / 15 / 15 10 - Year ( 2005 - 2014 ) CAGR : 13 % CAGR: 9 % Cumulative : 1623 % Cumulative: 127 % Historical Share Price Split Adjusted 11

Focused on Shareholder Value Maintaining profitability and bottom line focus Continuing to grow book value per share Producing sustainable shareholder value 0.0 0.5 1.0 1.5 2.0 2.5 $- $10.00 $20.00 $30.00 $40.00 $50.00 Sep-91 May-93 Jan-95 Sep-96 May-98 Jan-00 Sep-01 May-03 Jan-05 Sep-06 May-08 Jan-10 Sep-11 May-13 Jan-15 Price to Book Stock Price $ BV/Share $ Current Prices Reflect the Solid Value of ProAssurance Stock Price at 3/15/15 to YE 2014 Book: 1.2x Average Since Inception: 1.4x Unadjusted for dividends Prices Adjusted for 2:1 Stock Split 12

Consolidated Operational Highlights Our commentary on YTD 2014 results and updates on recent transactions and strategy

2014 Corporate Update 14 Acquired Eastern Insurance effective 1/1/14 Integration into ProAssurance well underway Significant contributions to Q1 results Lloyd’s Syndicate 1729 began operations on 1/1/14 Business on the books as planned All senior staffing arrangement complete Medmarc and IND well integrated into ProAssurance operations

Strong Operational Results in 2014 Combined Ratio: 82.1 % (Avg Since 2009 : 66.6 %) Operating Ratio: 64.2 % (Avg Since 2009 : 41.5 %) 69.1% 68.0% 52.5% 57.3% 70.6% 82.1% 38.8% 39.8 % 27.6% 32.6% 46.1% 64.2% 2009 2010 2011 2012 2013 2014 Combined Ratio and Operating Ratio History Combined Ratio Operating Ratio 15
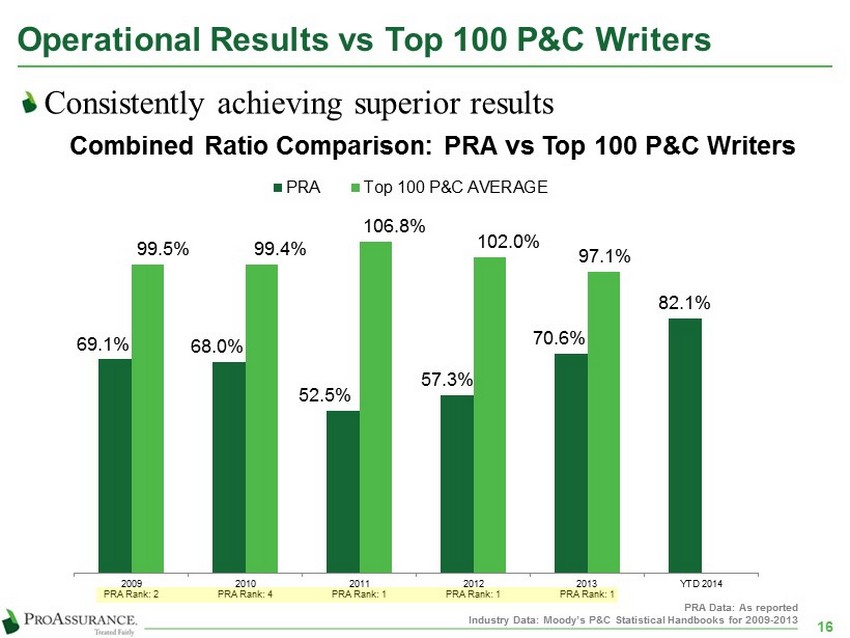
Operational Results vs Top 100 P&C Writers Consistently achieving superior results 69.1% 68.0% 52.5% 57.3% 70.6% 82.1 % 99.5% 99.4% 106.8% 102.0% 97.1% 2009 PRA Rank: 2 2010 PRA Rank: 4 2011 PRA Rank: 1 2012 PRA Rank: 1 2013 PRA Rank: 1 YTD 2014 PRA Top 100 P&C AVERAGE 16 PRA Data: As reported Industry Data: Moody’s P&C Statistical Handbooks for 2009 - 2013 Combined Ratio Comparison: PRA vs Top 100 P&C Writers
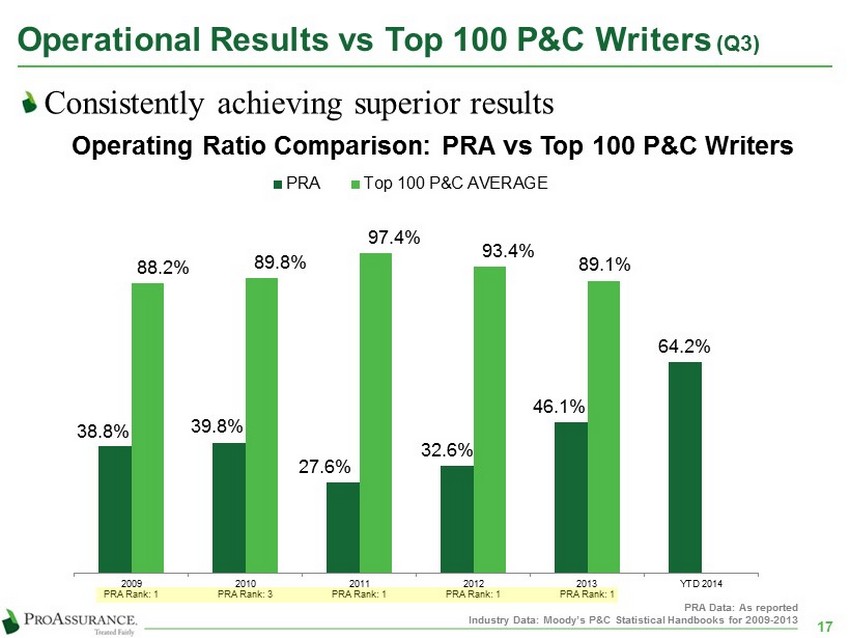
Operational Results vs Top 100 P&C Writers (Q3) Consistently achieving superior results 38.8% 39.8% 27.6% 32.6 % 46.1% 64.2% 88.2% 89.8% 97.4% 93.4% 89.1% 2009 PRA Rank: 1 2010 PRA Rank: 3 2011 PRA Rank: 1 2012 PRA Rank: 1 2013 PRA Rank: 1 YTD 2014 PRA Top 100 P&C AVERAGE 17 PRA Data: As reported Industry Data: Moody’s P&C Statistical Handbooks for 2009 - 2013 Operating Ratio Comparison: PRA vs Top 100 P&C Writers
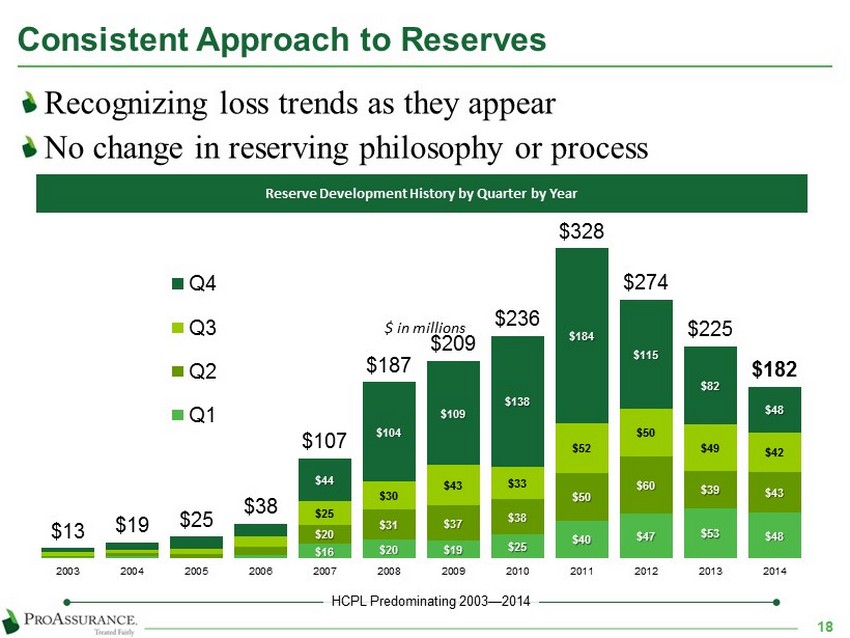
Consistent Approach to Reserves Recognizing loss trends as they appear No change in reserving philosophy or process Reserve Development History by Quarter by Year $16 $20 $ 19 $25 $40 $47 $53 $48 $20 $31 $ 37 $38 $50 $60 $39 $43 $25 $30 $ 43 $33 $52 $50 $49 $42 $44 $104 $ 109 $138 $184 $115 $82 $48 $13 $19 $ 25 $38 $107 $187 $209 $236 $328 $274 $ 225 $182 2003 2004 2005 2006 2007 2008 2009 2010 2011 2012 2013 2014 Total Q4 Q3 Q2 Q1 $ in millions 18 HCPL Predominating 2003 — 2014

1 2 Physician & Dental 51.2% Ancillary Healthcare 3.4% Life Sciences & Med Tech 4.5% Hospitals & Facilities 4.4 % Attorneys 3.6% Workers' Comp 28.5% Lloyd's 4.3% Other 0.2% Specialty P&C 2014 Policyholders: ~80,000 Physicians & Dentists 58.3% Ancillary Healthcare 11.5 % Life Sciences & Med Tech 1.5% Hospitals & Facilities 0.6% Attorneys 15.8% Workers' Comp 11.5% Other 0.9% 2014 Premiums, Policyholder & Distribution 2014 Premium: $780 mln Tail Premium Allocated by Line Distribution Sources at 12/31/14 HCPL LPL Life Sciences Workers’ Comp Agent / Broker 72% 77% 100% 100% Direct 28% 23% -- -- 19
Eastern Insurance Transaction Update Significant contributor to top line growth and bottom line profitability Expected cross selling opportunities are emerging Continues building the platform to serve the needs of larger integrated health systems and healthcare delivery organizations Workers’ compensation represents one of the single largest liability expenditures for healthcare entities Eastern and ProAssurance underwrite large healthcare books of business, which will continue to be a target market for both companies 20

Lloyd’s Syndicate Update First policies underwritten January 1, 2014 $32 mln in net premium written reported at 12/31/14 (reporting on a one - quarter lag) ProAssurance is providing 58% of underwriting capital Remaining capital from other corporates and private names ProAssurance has committed $78 mln in 2015 Six - Year commitment of up to $200 mln 21

Opportunities and Strategies ProAssurance is Evolving to Anticipate the Risks Facing an Increasingly Complex healthcare Delivery System

Healthcare Realities American healthcare is wrestling with the question of cost vs. care — we can deliver more care than we can afford Restructuring is producing profound changes in healthcare Healthcare delivery is being pushed down to lower cost providers The Affordable Care Act (ACA) is creating additional layers of complexity Healthcare delivery will be in continuous flux for years to come How will the addition of millions of insureds affect Medical Professional Liability? Patient frustration and unexpected outcomes Will additional coverage under the ACA help or hurt Worker’s Compensation writers? Will the healthcare burden shift 23
Insurance Marketplace Realities 24 Insurance companies are awash in capital Pressure is mounting to “do something” with it M&A — the hunter vs. the hunted Chase market share with low prices but disastrous long - term consequences Appease investors with unwise capital - return strategies
The ProAssurance Response 25 Our long - term focus on financial strength is central to our overall strategy and success ProAssurance has always evolved ahead of the curve We have proven our ability to thrive across insurance cycles We have an unmatched combination of financial strength and deep experience We are building the platform that will allow us to serve the broad spectrum of healthcare Prudently leveraging our success and experience with the addition of specialized expertise Broad capabilities to meet evolving demands Eastern, Medmarc, PICA & Mid - Continent Traditional HCPL companies deepen our capabilities
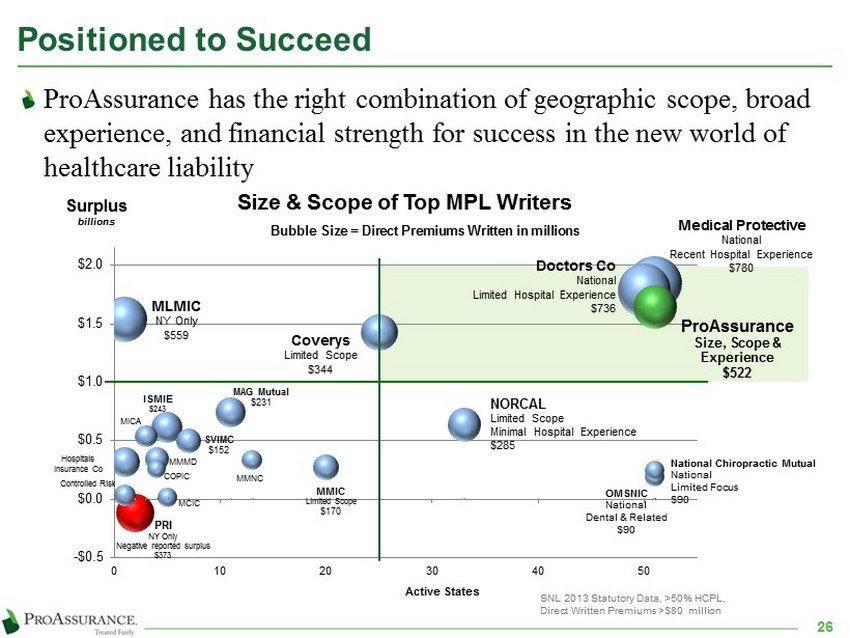
Positioned to Succeed 26 ProAssurance has the right combination of geographic scope, broad experience, and financial strength for success in the new world of healthcare liability Medical Protective National Recent Hospital Experience $780 Doctors Co National Limited Hospital Experience $736 MLMIC NY Only $559 ProAssurance Size, Scope & Experience $522 PRI NY Only Negative reported surplus $373 Coverys Limited Scope $344 NORCAL Limited Scope Minimal Hospital Experience $ 285 ISMIE $243 MAG Mutual $231 SVIMC $152 MMMD MMIC Limited Scope $170 MICA MMNC COPIC National Chiropractic Mutual National Limited Focus $90 Hospitals Insurance Co OMSNIC National Dental & Related $90 -$0.5 $0.0 $0.5 $1.0 $1.5 $2.0 0 10 20 30 40 50 Size & Scope of Top MPL Writers Surplus billions Active States Bubble Size = Direct Premiums Written in millions MCIC Controlled Risk SNL 2013 Statutory Data, >50% HCPL, Direct Written Premiums >$80 million
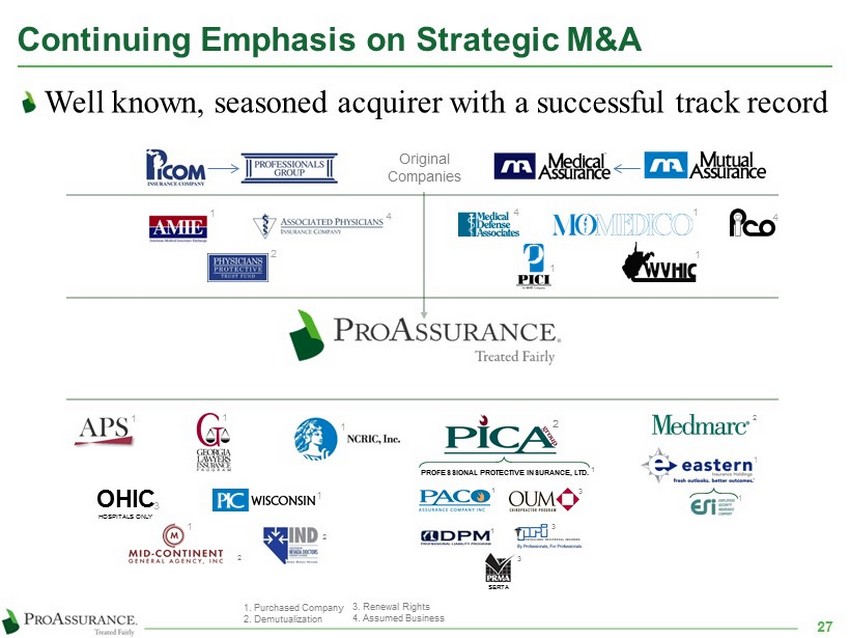
Continuing Emphasis on Strategic M&A 27 Well known, seasoned acquirer with a successful track record 1. Purchased Company 2. Demutualization Original Companies OHIC HOSPITALS ONLY 2 1 1 1 1 1 1 1 1 1 1 3 4 4 1 4 3. Renewal Rights 4. Assumed Business 2 2 † 2 3 1 3 3 1 SERTA 2 PROFESSIONAL PROTECTIVE INSURANCE, LTD . 1

Strategic Successes Leveraging our reach, expertise and financial strength $ 26 mln in annualized premium in the Certitude tm program in partnership with Ascension Health Insuring Ascension - affiliated physicians through coordinated, jointly insured programs Adding Ascension - employed physicians and facilities in select states Partnerships with existing physician - focused companies to leverage hospital expertise Venture with CAP - MPT: CAPAssurance Now writing large groups and facilities 28 *www.ascensionhealth.org/index.php?option=com_locations&view=locations&Itemid=148 States with Active Certitude Programs States with Ascension Health Ministry Locations* States with Active CAPAssurance Policies
Strategic Opportunities 29 Alternative risk and self - insurance opportunities Captive insurance programs allow large, sophisticated healthcare and workers’ compensation customers to control their own insurance programs Eastern Re brings proven experience and expertise in establishing and operating captives through segregated cells Risk sharing/high deductible programs Risk Purchasing Groups for specific specialties or regions Joint physician/hospital insurance products addressing the unique risk tolerance and claims expectations of each insured

Strategic Opportunities 30 ProAssurance Risk Solutions sm Newly formed unit brings proven expertise to address complex risk financing challenges in both healthcare and workers’ compensation Run - off liabilities in M&A transactions Assumption of existing reserve liabilities for large organizations seeking to repurpose capital resources Specialized self - insurance plans Offers financial flexibility through more efficient securitization/collateralization of self - funded risks ProAssurance Complex Medicine ( ProCxM ) Newly announced program for larger entities with self - insured retentions Proprietary analytics provides advanced underwriting & pricing capabilities in conjunction with Pro - Praxis, an underwriting agency capitalized by Cooper Gay Swett & Crawford Group
Strategic Opportunities Through Lloyd’s Syndicate 1729 is an investment opportunity with significant insurance benefits Potentially provides access to international medical professional liability opportunities Leverage Medmarc’s expertise to underwrite international medical technology and life sciences risks Increases flexibility for ProAssurance when working with complex risks Primary and excess business can be written 31

Strategic Opportunities Through Medmarc Medmarc is a market - leader in medical products and life sciences liability Increasing presence in device and drug development by larger healthcare organizations Increasing globalization of testing and development efforts are a natural fit with Lloyd’s Syndicate 1729 Provides ProAssurance and our agents with another arrow in our product quiver at the complex end of the healthcare delivery continuum 32
Strategic Opportunities Through Mid - Continent ProAssurance Mid - Continent Underwriters addresses the needs of ancillary healthcare providers This market is increasing rapidly as the push to reduce healthcare costs drives care through lower cost providers who are an important part of the healthcare continuum 33
Key Investor Points 34 ProAssurance has always evolved ahead of the curve in our industry — we continue that trend We have proven our ability to thrive across insurance cycles and produce significant returns for long - term shareholders Our long - term focus on financial strength and sustained value creation is central to our overall strategy Our management team is heavily invested — professionally and financially in our success

Segment Highlights We report results in three operational segments Specialty Property Casualty Insurance Workers’ Compensation Insurance Lloyd’s Syndicate 1729
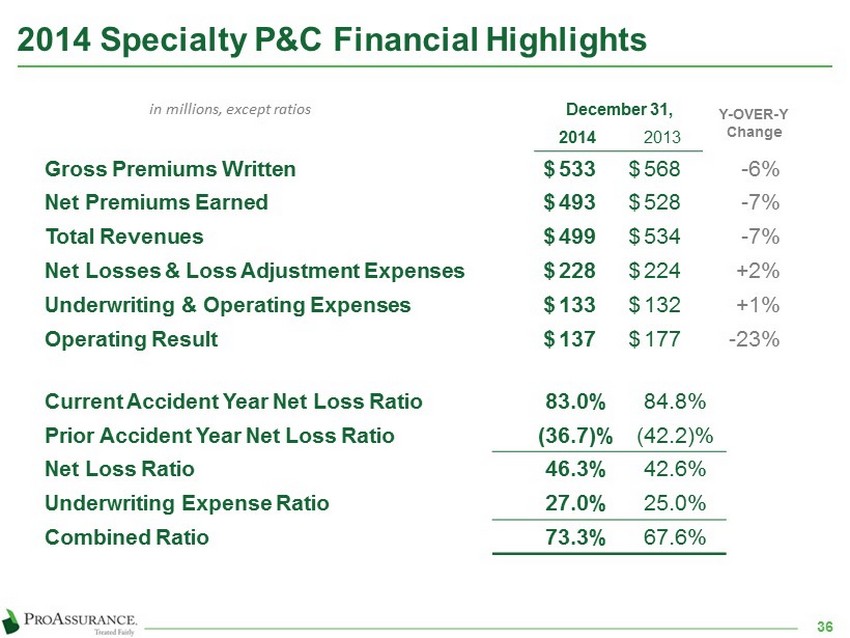
December 31, Y - OVER - Y Change 2014 2013 Gross Premiums Written $ 533 $ 568 - 6% Net Premiums Earned $ 493 $ 528 - 7% Total Revenues $ 499 $ 534 - 7% Net Losses & Loss Adjustment Expenses $ 228 $ 224 +2% Underwriting & Operating Expenses $ 133 $ 132 +1% Operating Result $ 137 $ 177 - 23% 2014 Specialty P&C Financial Highlights in millions, except ratios Current Accident Year Net Loss Ratio 83.0% 84.8% Prior Accident Year Net Loss Ratio (36.7)% (42.2)% Net Loss Ratio 46.3% 42.6% Underwriting Expense Ratio 27.0% 25.0% Combined Ratio 73.3% 67.6% 36
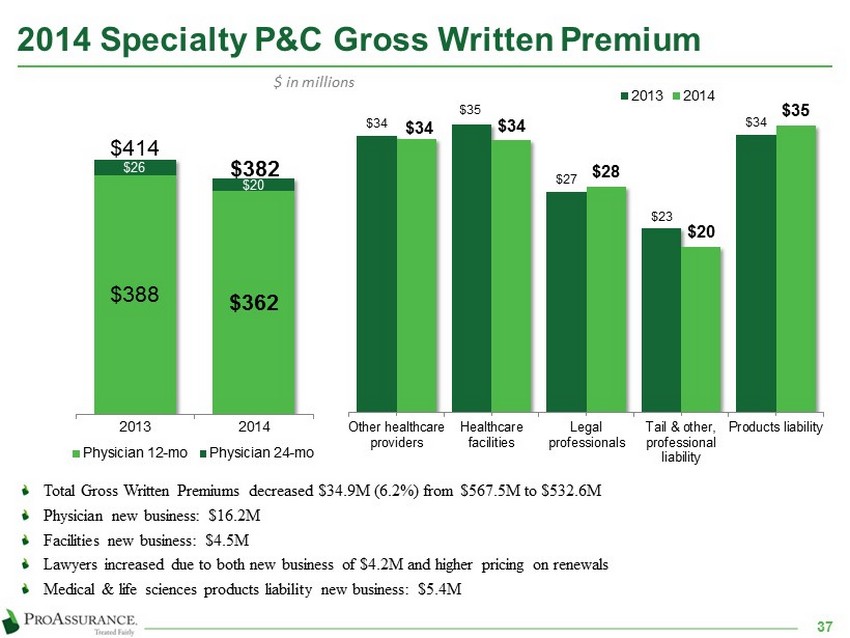
2014 Specialty P&C Gross Written Premium 37 Total Gross Written Premiums decreased $ 34.9 M ( 6.2 %) from $ 567.5 M to $ 532.6 M Physician new business: $ 16.2 M Facilities new business: $ 4.5 M Lawyers increased due to both new business of $ 4.2 M and higher pricing on renewals Medical & life sciences products liability new business: $ 5.4 M $34 $35 $27 $23 $34 $34 $34 $ 28 $20 $35 Other healthcare providers Healthcare facilities Legal professionals Tail & other, professional liability Products liability 2013 2014 $388 $362 $26 $20 $414 $ 382 2013 2014 Physician 12-mo Physician 24-mo $ in millions

Strong Retention Despite Competition Retention remains in line with recent quarters Continued underwriting vigilance is being used today to ensure future success Market share is important, but NOT as important as profitability 84% 85% 87% 90% 90% 89% 90% 88 % 89% 2006 2007 2008 2009 2010 2011 2012 2013 2014 Year - over - Year Premium Retention – Physicians 87% 89% 89% 90% Q1 14 Q2 14 Q3 14 Q4 14 Trailing Four Quarters’ Premium Retention – Physicians 38
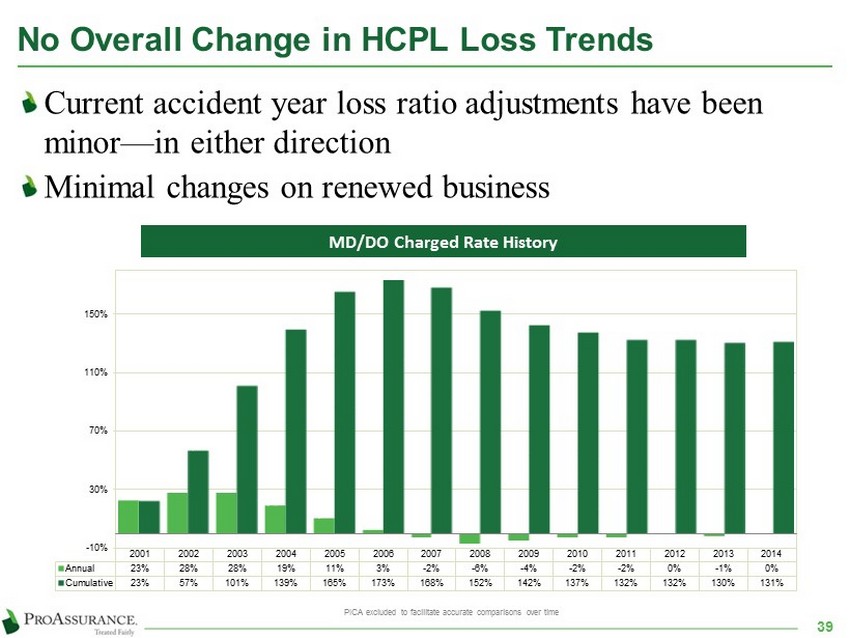
No Overall Change in HCPL Loss Trends Current accident year loss ratio adjustments have been minor — in either direction Minimal changes on renewed business 2001 2002 2003 2004 2005 2006 2007 2008 2009 2010 2011 2012 2013 2014 Annual 23% 28% 28% 19% 11% 3% -2% -6% -4% -2% -2% 0% -1% 0% Cumulative 23% 57% 101% 139% 165% 173% 168% 152% 142% 137% 132% 132% 130% 131% -10% 30% 70% 110% 150% MD/DO Charged Rate History PICA excluded to facilitate accurate comparisons over time 39

The Bottom Line Benefits of Strong Defense Our ability and willingness to defend claims allows us to achieve better results 21 % 32% 48% 42% 44% 18% 45% 28% 79 % 68% 52% 58% 56% 82% 55% 72% 2006 2007 2008 2009 2010 2011 2012 2013 PRA Industry 63 % 42% 37% 58% Source: Statutory Basis, A.M. Best Aggregates & Averages Some totals may not agree due to rounding ProAssurance vs. Industry Five - Year Average Loss Ratio ( 2009 - 2013) Legal Payments as a Percentage of Total Loss Ratio Loss Payments as a Percentage of Total Loss Ratio 61 % 34% ProAssurance Stand Alone Loss Ratio ( 2006 - 2013) Calendar Year 40 TOTAL LOSS RATIO 76% 64% 44% 42 % 37% 25% 31% 39% On average, 27 points better than the industry
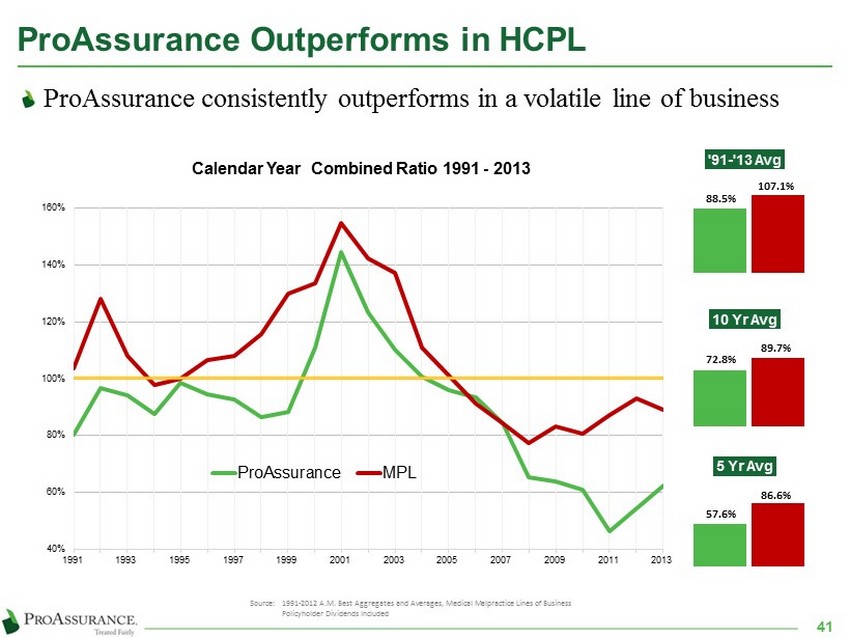
ProAssurance Outperforms in HCPL ProAssurance consistently outperforms in a volatile line of business 40% 60% 80% 100% 120% 140% 160% 1991 1993 1995 1997 1999 2001 2003 2005 2007 2009 2011 2013 Calendar Year Combined Ratio 1991 - 2013 ProAssurance MPL Source: 1991 - 2012 A.M. Best Aggregates and Averages, Medical Malpractice Lines of Business Policyholder Dividends Included '91 - '13 Avg 5 Yr Avg 88.5% 107.1% 10 Yr Avg 72.8% 89.7% 57.6% 86.6% 41

Segment Highlights We repo rt results in three operational segments Specialty Property Casualty Insurance Workers’ Compensation In surance Lloyd’s Syndicate 1729
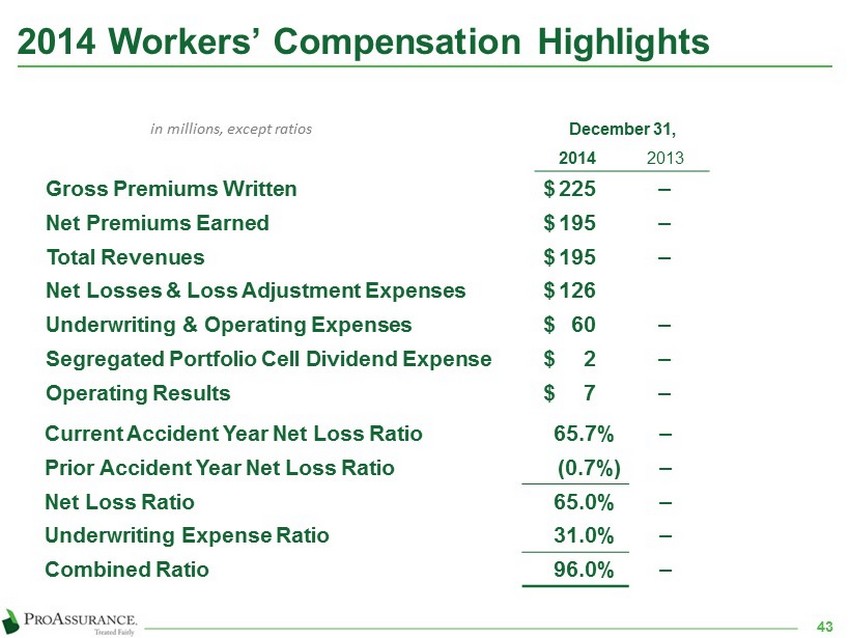
December 31, Y - OVER - Y Change 2014 2013 Gross Premiums Written $ 225 ‒ - 7% Net Premiums Earned $ 195 ‒ - 6% Total Revenues $ 195 ‒ - 6% Net Losses & Loss Adjustment Expenses $ 126 Underwriting & Operating Expenses $ 60 ‒ +4% Segregated Portfolio Cell Dividend Expense $ 2 ‒ Operating Results $ 7 ‒ - 27% 2014 Workers’ Compensation Highlights in millions, except ratios Current Accident Year Net Loss Ratio 65.7% ‒ Prior Accident Year Net Loss Ratio (0.7%) ‒ Net Loss Ratio 65.0% ‒ Underwriting Expense Ratio 31.0% ‒ Combined Ratio 96.0% ‒ 43

Consistent Profitability in Workers' Comp 44 Historical Combined Ratio ( 1 ) excluding fair value adjustment and intangible asset amortization, transaction - related and other one - time charges (1) 79.1% 65.6% 80.2% 87.7% 96.0% 89.7% 91.8 % 93.0% 96.0% 91.8% 2006 2007 2008 2009 2010 2011 2012 2013 2014 2006 – 2013 is Traditional Workers’ Compensation only

How Eastern Differentiates 45 Disciplined individual account underwriting with focus on rate adequacy in rural territories Dedicated to effective claims management and returning injured workers to wellness Understands market dynamics and regulatory concerns Use of local knowledge that has always differentiated ProAssurance
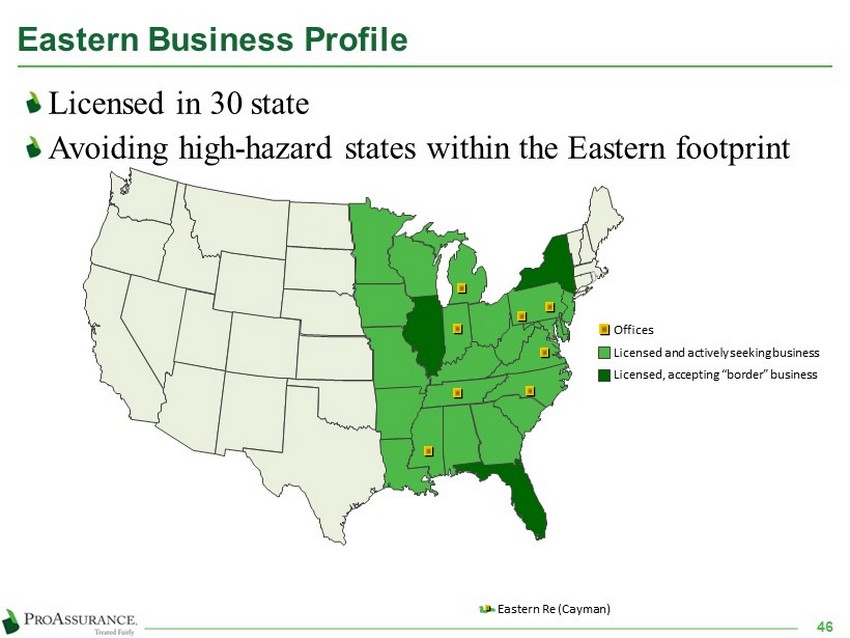
Eastern Business Profile 46 Offices Licensed and actively seeking business Licensed, accepting “border” business Eastern Re (Cayman) Licensed in 30 state Avoiding high - hazard states within the Eastern footprint
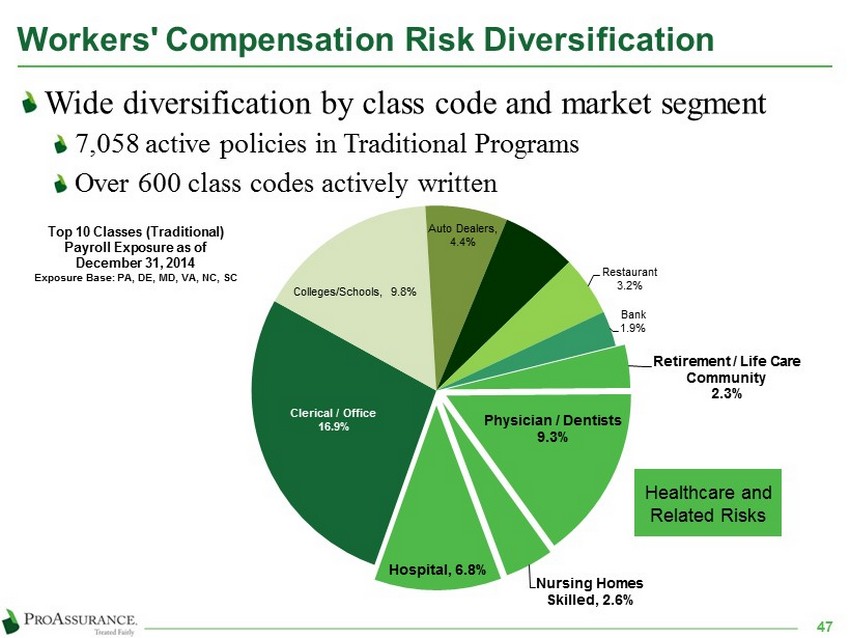
Workers' Compensation Risk Diversification Wide diversification by class code and market segment 7,058 active policies in Traditional Programs Over 600 class c odes a ctively written 47 Retirement / Life Care Community 2.3% Physician / Dentists 9.3% Nursing Homes Skilled , 2.6 % Hospital , 6.8% Clerical / Office 16.9% Colleges/Schools , 9.8% Auto Dealers , 4.4% Salesmen - Outside , 4.0% Restaurant 3.2% Bank 1.9% Healthcare and Related Risks Top 10 Classes (Traditional) Payroll Exposure as of December 31, 2014 Exposure Base: PA, DE, MD, VA, NC, SC
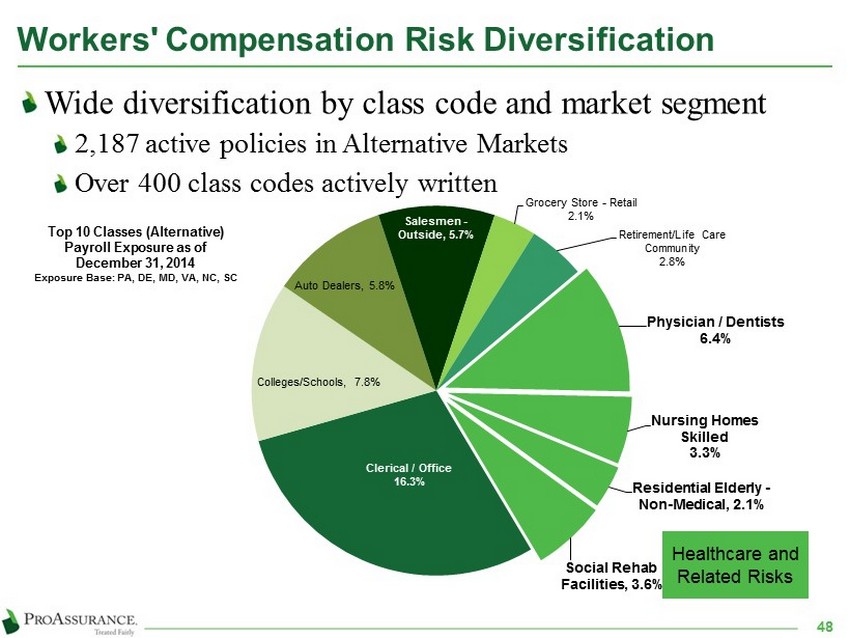
Workers' Compensation Risk Diversification Wide diversification by class code and market segment 2,187 active policies in Alternative Markets Over 4 00 class c odes a ctively written 48 Physician / Dentists 6.4% Nursing Homes Skilled 3.3% Residential Elderly - Non - Medical , 2.1% Social Rehab Facilities , 3.6% Clerical / Office 16.3% Colleges/Schools , 7.8 % Auto Dealers , 5.8% Salesmen - Outside , 5.7% Grocery Store - Retail 2.1% Retirement/Life Care Community 2.8% Healthcare and Related Risks Top 10 Classes (Alternative) Payroll Exposure as of December 31, 2014 Exposure Base: PA, DE, MD, VA, NC, SC

Broad Product Spectrum 49 Guaranteed Cost 55.0 % INOVA (Alternative Markets) 26.3% Policyholder Dividend 8.2% Deductible Plans 3.5% Retrospective Rating 3.6% Residual market 3.4% Guaranteed Cost Policies Loss - Sensitive Dividend Plans Deductible Plans Retrospective Rating Plans Alternative Market Programs ParallelPay – “ Pay as you Go” TPA Services Claims Administration and Risk Management 12 / 31 / 14 Active Policies at 12/31/14 Traditional WC Programs 7,058 Alternative Markets 2,187 9,219
How Eastern Differentiates Extensive medical cost containment strategies Average five - year medical cost inflation of 0.6% Proactive claims management Use of Compromise & Release where permitted by law Strategic use of return - to - wellness initiatives Use of a proactive, unique claims approach that has always differentiated ProAssurance 50
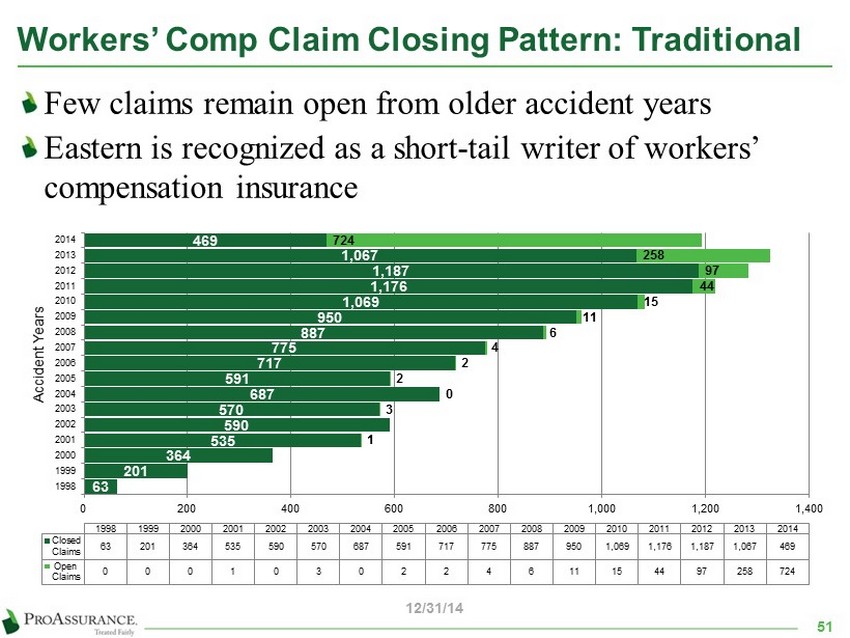
Workers’ Comp Claim Closing Pattern: Traditional 51 Few claims remain open from older accident years Eastern is recognized as a short - tail writer of workers’ compensation insurance 63 201 364 535 590 570 687 591 717 775 887 950 1,069 1,176 1,187 1,067 469 1 3 0 2 2 4 6 11 15 44 97 258 724 0 200 400 600 800 1,000 1,200 1,400 1998 1999 2000 2001 2002 2003 2004 2005 2006 2007 2008 2009 2010 2011 2012 2013 2014 Accident Years 1998 1999 2000 2001 2002 2003 2004 2005 2006 2007 2008 2009 2010 2011 2012 2013 2014 Closed Claims 63 201 364 535 590 570 687 591 717 775 887 950 1,069 1,176 1,187 1,067 469 Open Claims 0 0 0 1 0 3 0 2 2 4 6 11 15 44 97 258 724 12/31/14

Workers’ Comp Claim Closing Pattern: Alternative 52 Few claims remain open from older accident years Eastern is recognized as a short - tail writer of workers’ compensation insurance 35 66 103 175 267 407 423 310 324 334 383 401 493 474 478 250 1 2 2 3 6 8 27 104 324 0 100 200 300 400 500 600 1999 2000 2001 2002 2003 2004 2005 2006 2007 2008 2009 2010 2011 2012 2013 2014 Accident Years 1999 2000 2001 2002 2003 2004 2005 2006 2007 2008 2009 2010 2011 2012 2013 2014 Closed Claims 35 66 103 175 267 407 423 310 324 334 383 401 493 474 478 250 Open Claims 0 0 0 0 0 0 1 0 2 2 3 6 8 27 104 324 12/31/14

How Eastern Differentiates Captive insurance solutions provided through Eastern Re Segregated cell company based in Cayman Opens additional business opportunities for healthcare professional liability business Strategic partnerships with select independent agencies that share philosophies on controlling workers’ compensation costs Value - added risk management services cements brand loyalty 53
Segment Highlights We repo rt results in three operational segments Specialty Property Casualty Insurance Workers’ Compensation Insurance Lloyd’s Syndicate 1729
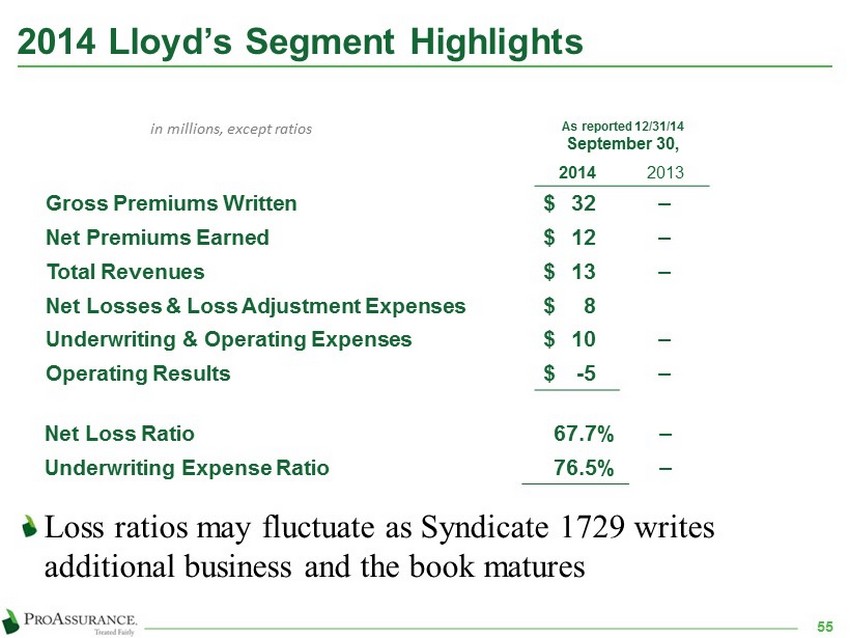
As reported 12/31/14 September 30, Y - OVER - Y Change 2014 2013 Gross Premiums Written $ 32 ‒ - 7% Net Premiums Earned $ 12 ‒ - 6% Total Revenues $ 13 ‒ - 6% Net Losses & Loss Adjustment Expenses $ 8 Underwriting & Operating Expenses $ 10 ‒ +4% Operating Results $ - 5 ‒ - 27% 2014 Lloyd’s Segment Highlights in millions, except ratios Net Loss Ratio 67.7% ‒ Underwriting Expense Ratio 76.5% ‒ 55 Loss ratios may fluctuate as Syndicate 1729 writes additional business and the book matures
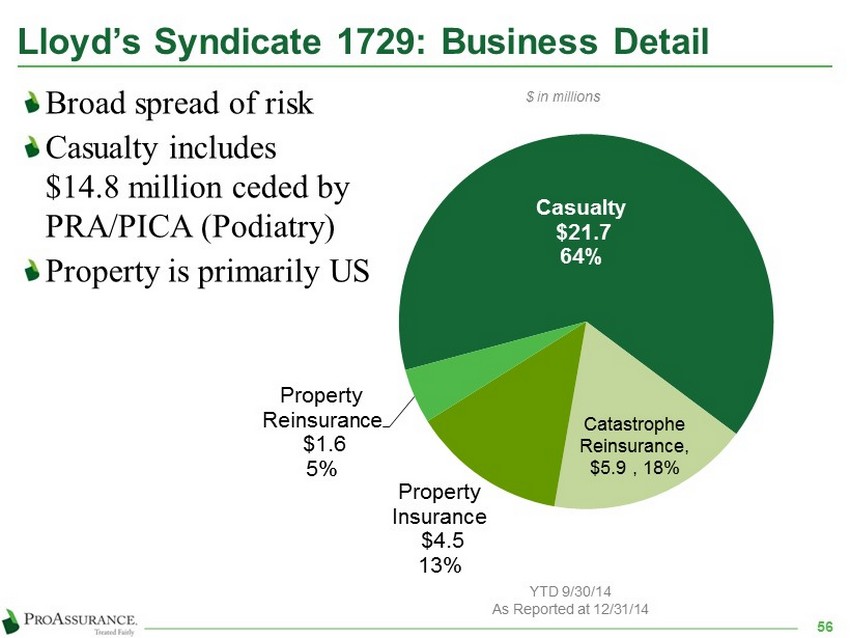
Lloyd’s Syndicate 1729: Business Detail Broad spread of risk Casualty includes $14.8 million ceded by PRA/PICA (Podiatry) Property is primarily US 56 YTD 9/30/14 As Reported at 12/31/14 $ in millions Casualty $21.7 64% Catastrophe Reinsurance , $ 5.9 , 18 % Property Insurance $4.5 13% Property Reinsurance $1.6 5%
Segment Highlights Corporate U.S. investing activities Non - premium revenues Corporate expenses U. S. taxes

December 31, Y - OVER - Y Change 2014 2013 Investment income $ 125.1 $ 129.3 - 3% Equity in earnings (loss) of unconsolidated subsidiaries 4.0 7.5 - 47% Net realized investment gains (losses) 14.6 67.9 - 78% Other income 2.4 1.9 +21% Operating expenses 8.8 15.7 - 44% Interest expense 14.1 2.8 >100% Income taxes 65.4 99.6 - 34% Gain on acquisition ‒ 32.3 >100% Segment Operating Result $ 57.8 $ 120.8 - 52% 2014 Corporate Segment Highlights in millions, except ratios 58

Corporate Segment Financial Highlights Overall investment result decreased 6% $3.6 million Y - O - Y decrease in Equity in Unconsolidated Subsidiaries $4.1 million reduction in investment income, primarily due to lower average balances on fixed income investments Net realized investment gains decreased $53.3 million Operating expenses declined Y - O - Y M&A and expansion costs incurred in 2013 and not in 2014 Interest expenses rose in 2014 due to issuance of debt in Q4 2013 One - time, non - taxable gain of $32.3 million in 2013 in connection with the acquisition of Medmarc 59

Additional Financial Detail
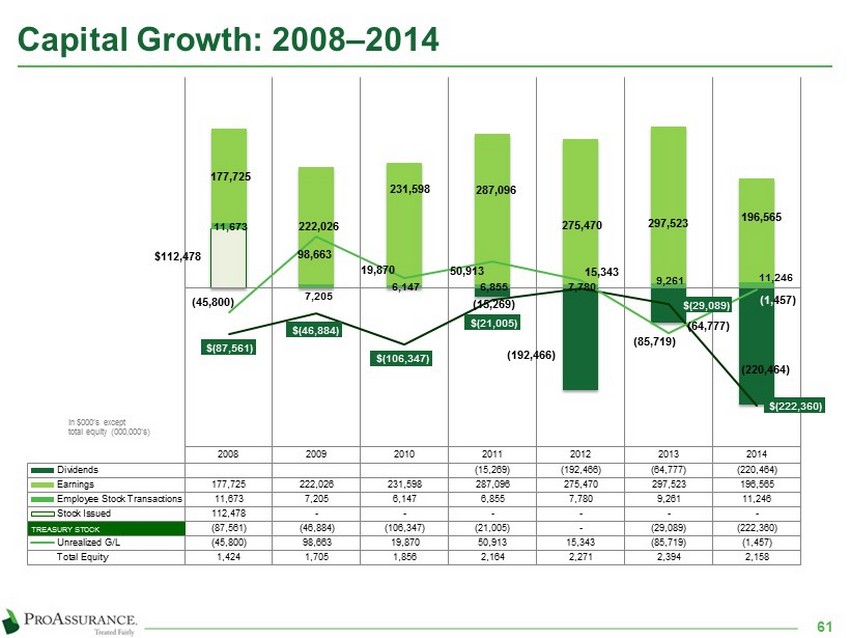
Capital Growth: 2008 ‒ 2014 2008 2009 2010 2011 2012 2013 2014 Dividends (15,269) (192,466) (64,777) (220,464) Earnings 177,725 222,026 231,598 287,096 275,470 297,523 196,565 Employee Stock Transactions 11,673 7,205 6,147 6,855 7,780 9,261 11,246 Stock Issued 112,478 - - - - - - Treasury Stock (87,561) (46,884) (106,347) (21,005) - (29,089) (222,360) Unrealized G/L (45,800) 98,663 19,870 50,913 15,343 (85,719) (1,457) Total Equity 1,424 1,705 1,856 2,164 2,271 2,394 2,158 $112,478 11,673 7,205 6,147 6,855 7,780 9,261 11,246 177,725 222,026 231,598 287,096 275,470 297,523 196,565 ( 15,269 ) (192,466) (64,777) (220,464) $(87,561) $(46,884) $(106,347) $(21,005) $( 29,089 ) $(222,360) (45,800) 98,663 19,870 50,913 15,343 (85,719) ( 1, 457 ) TREASURY STOCK in $000’s except total equity (000,000’s) 61
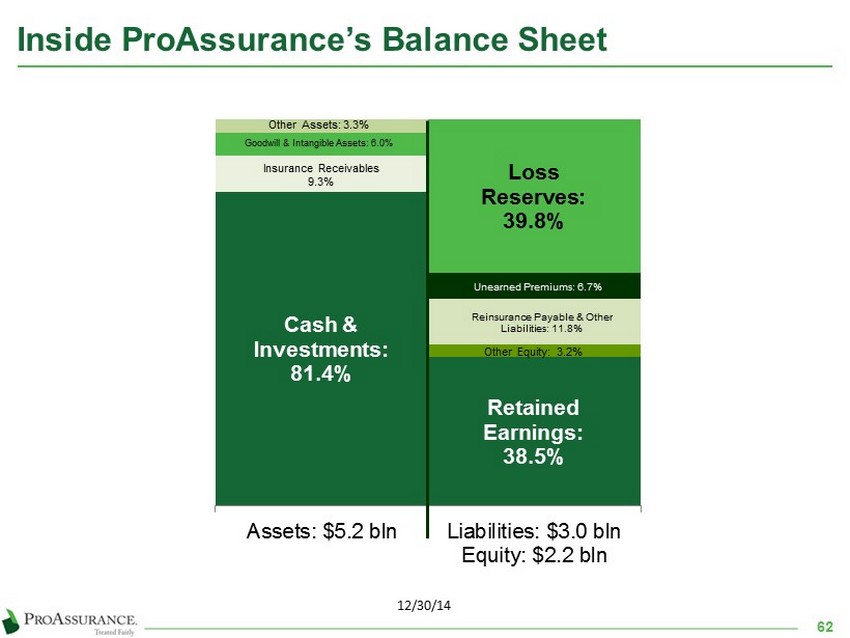
Inside ProAssurance’s Balance Sheet Cash & Investments: 81.4% Insurance Receivables 9.3% Goodwill & Intangible Assets: 6.0% Other Assets: 3.3% Retained Earnings: 38.5% Other Equity: 3.2 % Reinsurance Payable & Other Liabilities: 11.8% Unearned Premiums: 6.7% Loss Reserves: 39.8% Assets: $5.2 bln Liabilities: $3.0 bln Equity: $2.2 bln 12/30/14 62

Inside ProAssurance’s Income Statement - YTD 63 Net Premiums Earned: 82.1% Net Realized Investment Gains: 1.7% Net Investment Income: 15.2 % Other: 1.0% Net Income: 23.1% Provision for Income Taxes: 7.7% Underwriting, Policy Acquisitions, Operating and Interest Expenses: 26.6% Net Losses and Loss Adjustment Expenses: 42.6% Revenues: $852 mln Expenses: $655 mln Net Income: $197 mln 9 12/31/14
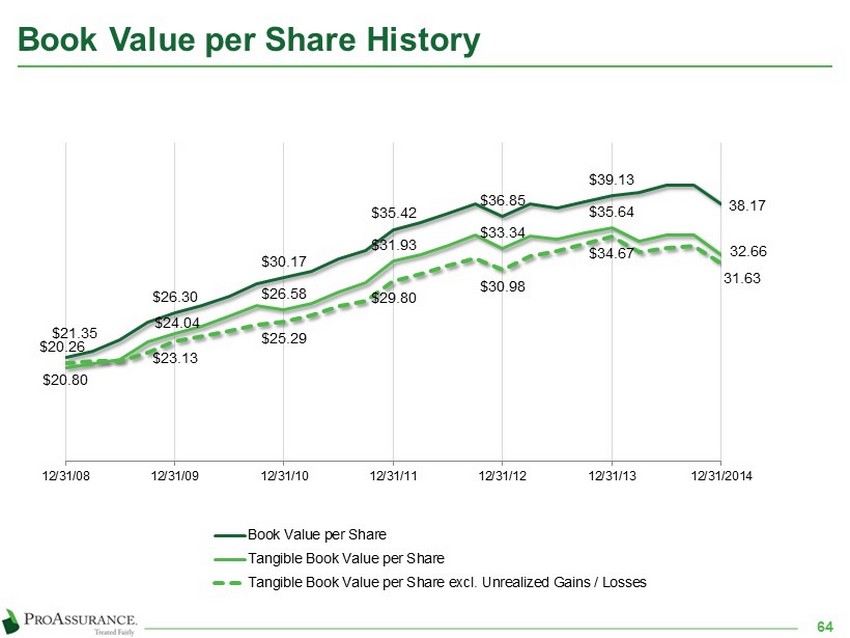
Book Value per Share History 64 $ 21.35 $26.30 $30.17 $35.42 $36.85 $39.13 38.17 $20.26 $ 24.04 $26.58 $31.93 $33.34 $35.64 32.66 $20.80 $23.13 $ 25.29 $29.80 $30.98 $34.67 31.63 12/31/08 12/31/09 12/31/10 12/31/11 12/31/12 12/31/13 12/31/2014 Book Value per Share Tangible Book Value per Share Tangible Book Value per Share excl. Unrealized Gains / Losses
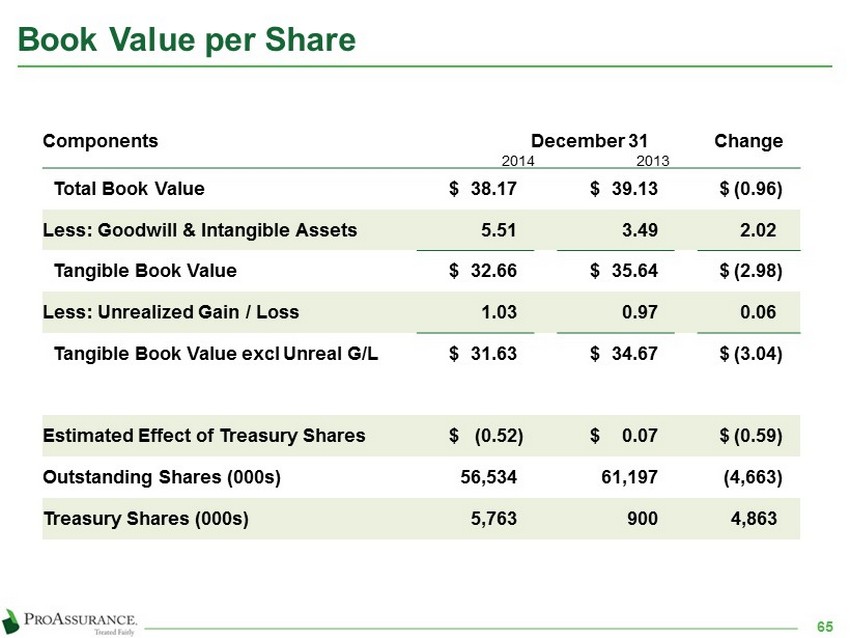
Book Value per Share 65 Components December 31 2014 2013 Change Total Book Value $ 38.17 $ 39.13 $ (0.96) Less: Goodwill & Intangible Assets 5.51 3.49 2.02 Tangible Book Value $ 32.66 $ 35.64 $ (2.98) Less: Unrealized Gain / Loss 1.03 0.97 0.06 Tangible Book Value excl Unreal G/L $ 31.63 $ 34.67 $ (3.04) Estimated Effect of Treasury Shares $ (0.52) $ 0.07 $ (0.59) Outstanding Shares (000s) 56,534 61,197 (4,663) Treasury Shares (000s) 5,763 900 4,863
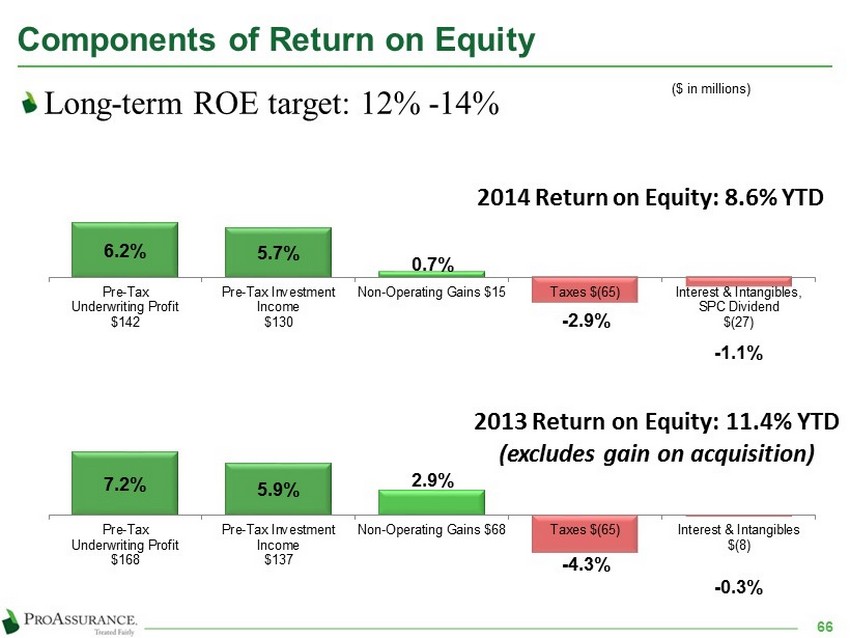
Components of Return on Equity 66 Long - term ROE target: 12% - 14% 6.2 % 5.7% 0.7% - 2.9% - 1.1% Pre-Tax Underwriting Profit $142 Pre-Tax Investment Income $130 Non-Operating Gains $15 Taxes $(65) Interest & Intangibles, SPC Dividend $(27) 2014 Return on Equity: 8.6% YTD ($ in millions) 2013 Return on Equity: 11.4% YTD (excludes gain on acquisition) 7.2 % 5.9% 2.9% - 4.3% - 0.3% Pre-Tax Underwriting Profit $168 Pre-Tax Investment Income $137 Non-Operating Gains $68 Taxes $(65) Interest & Intangibles $(8)

Investment Portfolio Detail ProAssurance remains conservatively invested to ensure our ability to keep our long - term promise of insurance protection
2014 Investment Developments Maintaining duration of approximately four years Book yield has stabilized Tax effective book yield: 4.2% Overall credit quality is stable at A+ 68 2015 Investment Strategy & Outlook Diversification and non - correlation of returns Managing duration
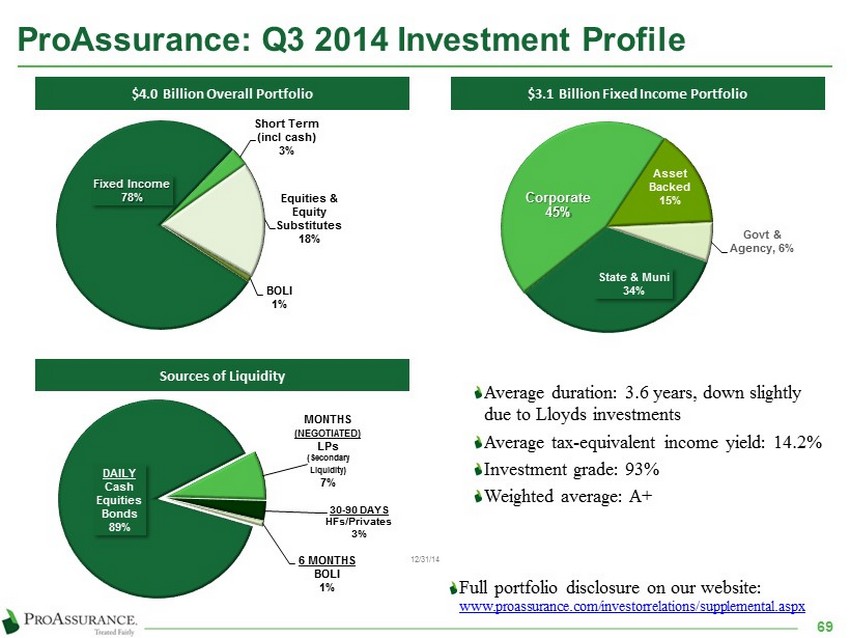
ProAssurance: Q3 2014 Investment Profile Fixed Income 78% Short Term (incl cash) 3% Equities & Equity Substitutes 18% BOLI 1% $ 4.0 Billion Overall Portfolio State & Muni 34% Corporate 45% Asset Backed 15% Govt & Agency , 6% $ 3.1 Billion Fixed Income Portfolio Average duration: 3.6 years, down slightly due to Lloyds investments Average tax - equivalent income yield: 14.2% Investment grade: 93% Weighted average: A+ Full portfolio disclosure on our website: www.proassurance.com/investorrelations/supplemental.aspx 69 DAILY Cash Equities Bonds 89% MONTHS (NEGOTIATED) LPs (Secondary Liquidity) 7% 30 - 90 DAYS HFs/Privates 3% 6 MONTHS BOLI 1% Sources of Liquidity 12/31/14
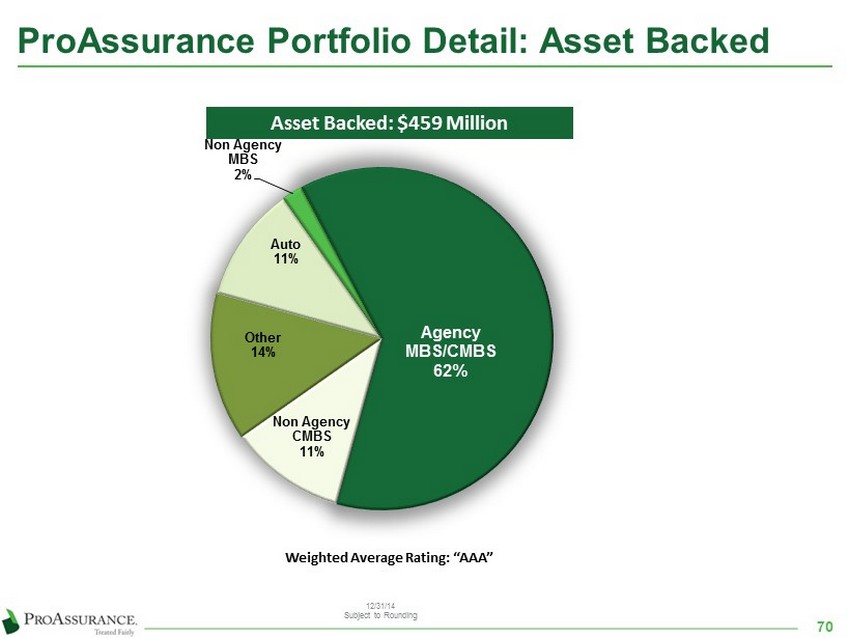
Other 14% Auto 11 % Non Agency MBS 2% Agency MBS/CMBS 62% Non Agency CMBS 11% ProAssurance Portfolio Detail: Asset Backed 12/31/14 Subject to Rounding Asset Backed: $459 Million Weighted Average Rating: “ AAA” 70
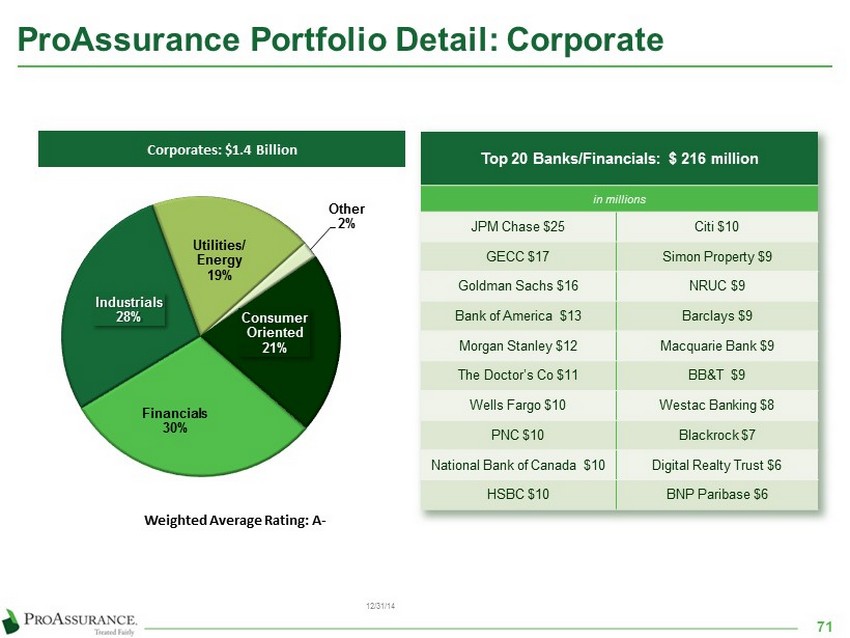
Financials 30% Industrials 28% Utilities/ Energy 19% Other 2% Consumer Oriented 21% ProAssurance Portfolio Detail: Corporate Corporates: $ 1.4 Billion Weighted Average Rating: A - Top 20 Banks/Financials: $ 216 million in millions JPM Chase $25 Citi $10 GECC $17 Simon Property $9 Goldman Sachs $16 NRUC $9 Bank of America $13 Barclays $9 Morgan Stanley $12 Macquarie Bank $9 The Doctor’s Co $11 BB&T $9 Wells Fargo $10 Westac Banking $8 PNC $10 Blackrock $7 National Bank of Canada $10 Digital Realty Trust $6 HSBC $10 BNP Paribase $6 12/31/14 71

General Obligation 23% Special Revenue 60% Prerefunded 17% ProAssurance Portfolio Detail: Municipals Municipals: $ 1.1 Billion Investment policy has always required investment grade rating prior to applying the effect of insurance Top 10 Municipal Holdings in millions State of Texas $15 Por t Authority of NY & NJ $15 Connecticut State Housing Authority $15 Triborough Bridge Authority $13 Missouri State Highways $13 Omaha Public Power $13 University of Alabama Revenue $12 So Carolina St Public Service $11 Pennsylvania State $11 Washington State $11 Weighted Average Rating: AA 12/31/14 72
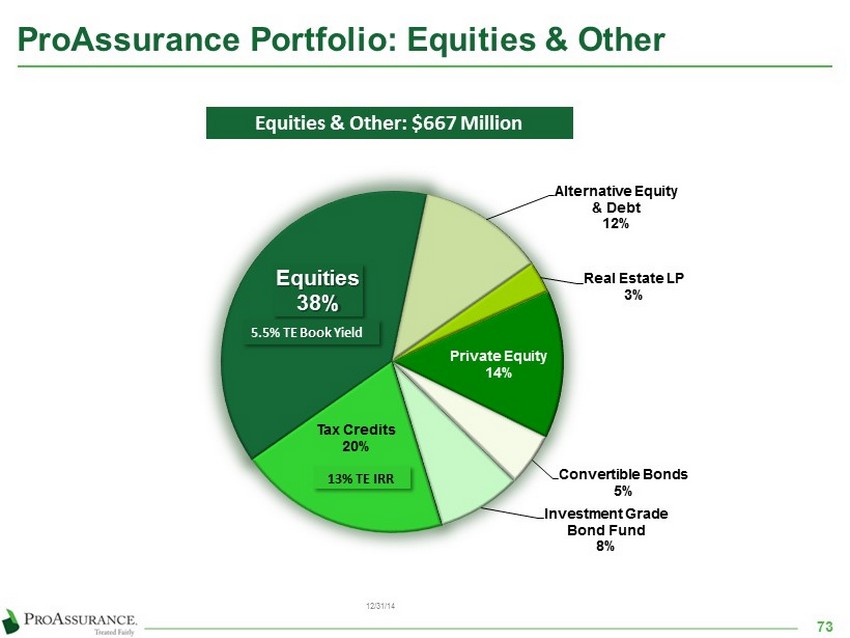
Equities 38% Alternative Equity & Debt 12% Real Estate LP 3% Private Equity 14% Convertible Bonds 5 % Investment Grade Bond Fund 8% Tax Credits 20% ProAssurance Portfolio: Equities & Other 12/31/14 Equities & Other: $667 Million 5.5% TE Book Yield 13% TE IRR 73
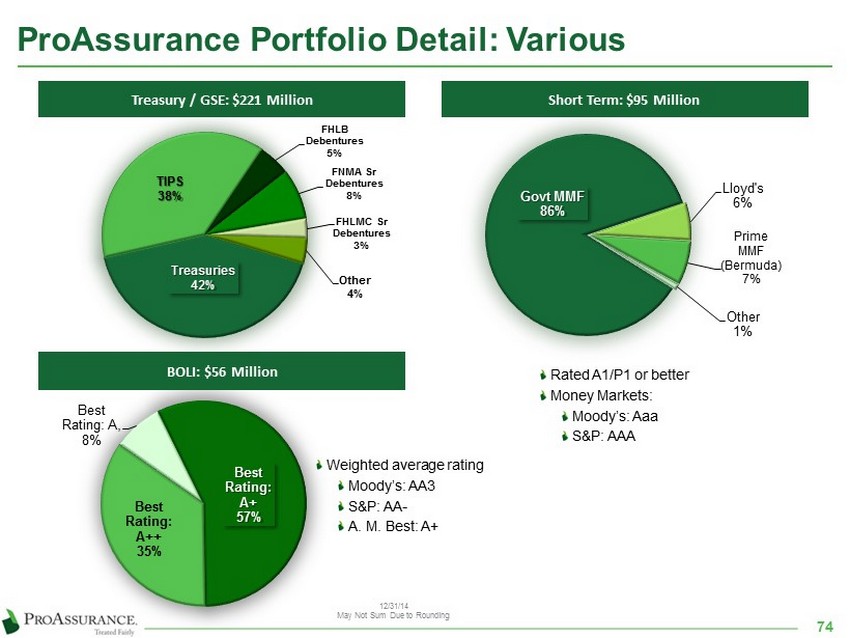
ProAssurance Portfolio Detail: Various Govt MMF 86% Lloyd's 6 % Prime MMF (Bermuda) 7% Other 1% Best Rating: A , 8% Best Rating: A+ 57% Best Rating: A++ 35% Rated A1/P1 or better Money Markets: Moody’s: Aaa S&P: AAA Weighted average rating Moody’s: AA3 S&P: AA - A. M. Best: A+ Treasuries 42 % TIPS 38% FHLB Debentures 5% FNMA Sr Debentures 8% FHLMC Sr Debentures 3% Other 4% Treasury / GSE: $221 Million Short Term: $95 Million BOLI: $ 56 Million 74 12/31/14 May Not Sum Due to Rounding

Additional Details

Now Reporting in Four Segments 76 • Healthcare Professional Liability • Products Liability • Lawyers’ Professional Liability Specialty P&C • Traditional • Captive Market Facility Workers’ Compensation • Syndicate 1729 (58%) (including investments & taxes) Lloyd’s • PRA Corp – parent company • Internal agency operations • Investments, except Lloyd’s • Taxes, except Lloyd’s • Debt Corporate / Other ProAssurance Consolidated

Q4 2014 Condensed Results by Segment 77 Specialty P&C Workers' Comp Lloyd's Syndicate Corporate / Other Elimination Q4 2014 Consol. Q4 2013 Gross premiums written $ 102,878 $ 44,233 $ 6,919 $ — $ (6,431 ) $ 147,599 $ 115,728 Net premiums written 87,618 37,713 7,945 — — 133,276 107,369 Net premiums earned $ 118,030 $ 50,579 $ 6,061 $ — $ — $ 174,670 $ 129,392 Net losses and LAE 36,937 34,471 4,033 — — 75,441 34,890 Underwriting, policy acquisition & operating expenses 32,087 14,977 3,537 1,942 (88 ) 52,455 42,226 Underwriting Result $ 49,006 $ 1,131 $ (1,509 ) $ (1,942 ) $ 88 $ 46,774 $ 52,276 % of total 104.8 % 2.4 % (3.2 )% (4.2 )% 0.2 % 100.0 % Net investment result — — 166 33,821 — 33,987 41,021 Net realized inv gains / (losses) — — 4 6,991 — 6,995 20,253 Other income 1,656 142 205 429 (88 ) 2,344 2,247 SPC dividend expense — (513 ) — — — (513 ) — Interest expense — — — 3,387 — 3,387 1,669 Gain on acquisition — — — — — — (3,672 ) Income tax expense — — — 22,112 — 22,112 39,592 Segment operating result $ 50,662 $ 1,786 $ (1,134 ) $ 13,800 $ — $ 65,114 $ 70,864 Net loss ratio 31.3 % 68.2 % 66.5 % n/a n/a 43.2 % 27.0 % Expense ratio 27.2 % 29.6 % 58.4 % n/a n/a 30.0 % 32.6 % Combined ratio 58.5 % 97.8 % 124.9 % n/a n/a 73.2 % 59.6 %
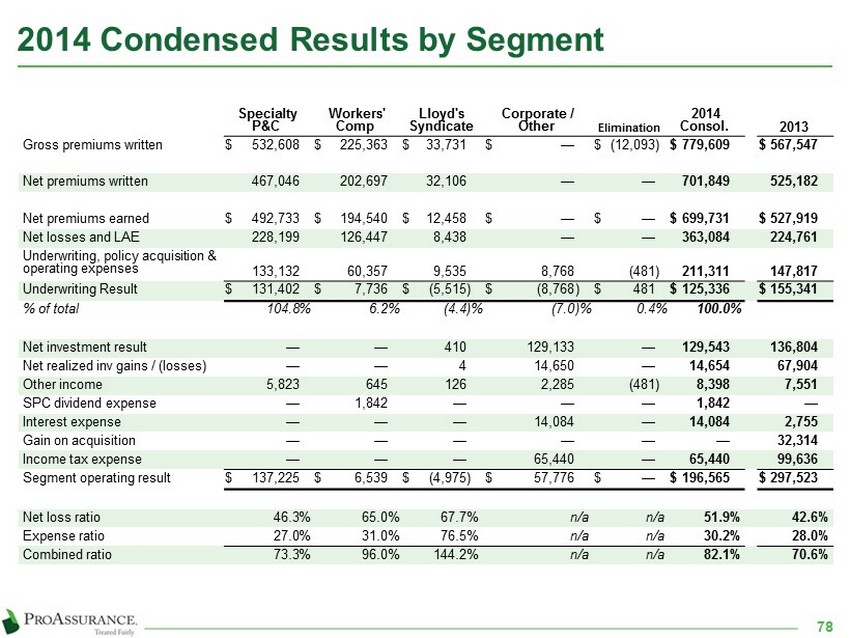
2014 Condensed Results by Segment 78 Specialty P&C Workers' Comp Lloyd's Syndicate Corporate / Other Elimination 2014 Consol. 2013 Gross premiums written $ 532,608 $ 225,363 $ 33,731 $ — $ (12,093 ) $ 779,609 $ 567,547 Net premiums written 467,046 202,697 32,106 — — 701,849 525,182 Net premiums earned $ 492,733 $ 194,540 $ 12,458 $ — $ — $ 699,731 $ 527,919 Net losses and LAE 228,199 126,447 8,438 — — 363,084 224,761 Underwriting, policy acquisition & operating expenses 133,132 60,357 9,535 8,768 (481 ) 211,311 147,817 Underwriting Result $ 131,402 $ 7,736 $ (5,515 ) $ (8,768 ) $ 481 $ 125,336 $ 155,341 % of total 104.8 % 6.2 % (4.4 )% (7.0 )% 0.4 % 100.0 % Net investment result — — 410 129,133 — 129,543 136,804 Net realized inv gains / (losses) — — 4 14,650 — 14,654 67,904 Other income 5,823 645 126 2,285 (481 ) 8,398 7,551 SPC dividend expense — 1,842 — — — 1,842 — Interest expense — — — 14,084 — 14,084 2,755 Gain on acquisition — — — — — — 32,314 Income tax expense — — — 65,440 — 65,440 99,636 Segment operating result $ 137,225 $ 6,539 $ (4,975 ) $ 57,776 $ — $ 196,565 $ 297,523 Net loss ratio 46.3 % 65.0 % 67.7 % n/a n/a 51.9 % 42.6 % Expense ratio 27.0 % 31.0 % 76.5 % n/a n/a 30.2 % 28.0 % Combined ratio 73.3 % 96.0 % 144.2 % n/a n/a 82.1 % 70.6 %

Capital Management Priorities 79 The manner in which capital is used has an effect on financial ratings Conceptual Model of Projected A. M. Best BCAR Scores if Premiums Increase Surplus is Reduced Excess Capital vs. Excess Capacity “A+” Rating Threshold
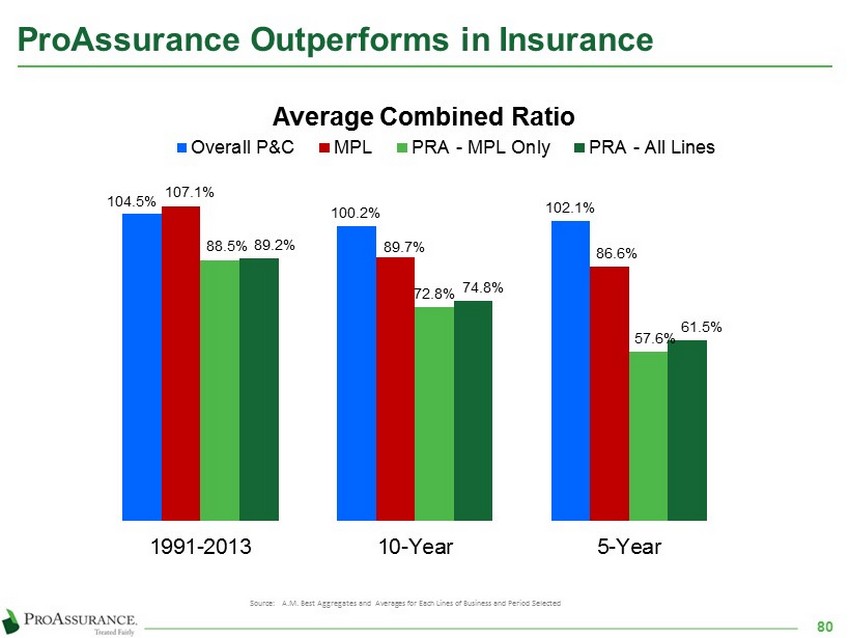
ProAssurance Outperforms in Insurance Source: A.M . Best Aggregates and Averages for Each Lines of Business and Period Selected 104.5% 100.2 % 102.1% 107.1% 89.7% 86.6% 88.5% 72.8% 57.6% 89.2 % 74.8% 61.5% 1991-2013 10-Year 5-Year Average Combined Ratio Overall P&C MPL PRA - MPL Only PRA - All Lines 80
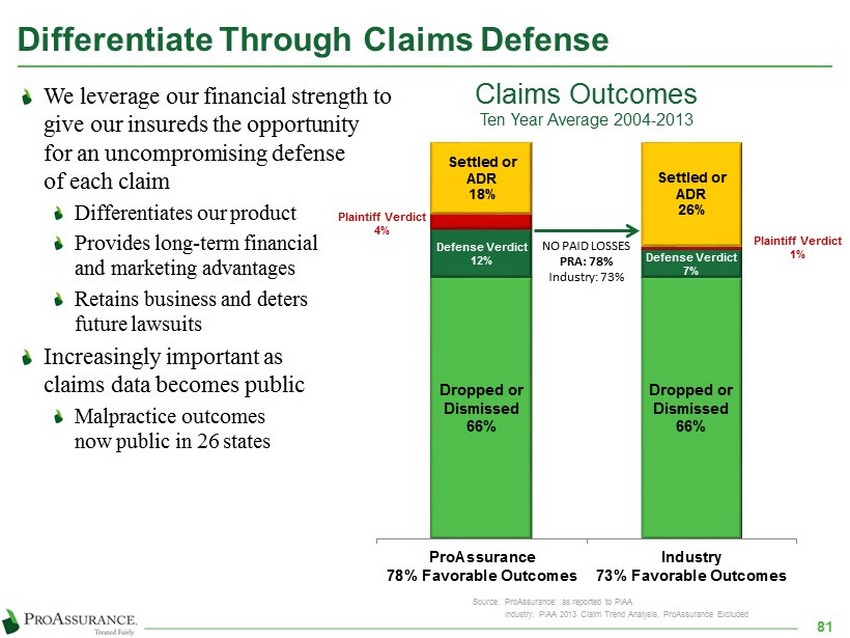
Differentiate Through Claims Defense 81 We leverage our financial strength to give our insureds the opportunity for an uncompromising defense of each claim Differentiates our product Provides long - term financial and marketing advantages Retains business and deters future lawsuits Increasingly important as claims data becomes public Malpractice outcomes now public in 26 states Dropped or Dismissed 66% Dropped or Dismissed 66% Defense Verdict 12% Defense Verdict 7% Plaintiff Verdict 4% Plaintiff Verdict 1 % Settled or ADR 18% Settled or ADR 26% ProAssurance 78% Favorable Outcomes Industry 73% Favorable Outcomes NO PAID LOSSES PRA: 78% Industry: 73% Source: ProAssurance: as reported to PIAA Industry: PIAA 2013 Claim Trend Analysis, ProAssurance Excluded Claims Outcomes Ten Year Average 2004 - 2013

The Ohio Example: 2006 – 2012 Data Comprehensive, reliable data provided by the Ohio Department of Insurance Broad range of competitors and business approaches www.insurance.ohio.gov/Legal/Reports/Documents/Ohio2012MedicalProfessionalLiabilityClosedClaimReport.pdf 92% 75% 8 % 25% ProAssurance All Others With Indemnity NO Indemnity More Claims Closed With No Indemnity 87% 96% 13% 4% ProAssurance All Others Closed With Trial Closed by Settlement, ADR or Without Trial More Claims Defended in Court $ 34,134 $68,983 ProAssurance All Others 2x Lower Average Indemnity Payment per Closed Claim 82