March 8, 2005
Association of Insurance and Financial Analysts
2005 Mid-Winter Conference
A. Derrill Crowe, M.D.
Edward L. Rand
Frank B. O’Neil
Chairman & CEO
Senior VP, Finance
Investor Relations Officer

Caution Regarding Forward Looking Statements
This presentation contains historical information as well as forward-looking statements that are based
upon our estimates and anticipation of future events, including our proposed transaction with NCRIC
Group, Inc. These estimates and events are subject to certain risks and uncertainties that could cause
actual results to vary materially from the expected results described in the forward-looking statements.
The words “anticipate,” “believe,” “estimate,” “expect,” “hopeful,” “intend,” “may,” “optimistic,”
“preliminary,” “project,” “should,” “will,” and similar expressions, whether used on a slide or in
speakers’ remarks, are intended to identify these forward-looking statements. There are numerous
important factors that could cause our actual results to differ materially from those in the forward-
looking statements. Thus, sentences and phrases that we use to convey our view of future events and
trends are expressly designated as Forward-Looking Statements as are sections of this presentation
clearly identified as giving our outlook on future business. The principal risk factors that may cause
actual results to differ materially from those expressed in the forward-looking statements are described
in various documents we file with the Securities and Exchange Commission, including the most recent
Form 10K for the year ended December 31, and Form 10Q for the most recent quarter. You should also
refer to our Form 8K filed February 28, 2005 for specific Cautions and Risk Factors regarding our
proposed transaction with NCRIC Group.
Financial data for the medical malpractice segment for all periods prior to June, 2001 reflects Medical
Assurance, Inc. data only, except where noted.
1

ProAssurance Overview
PROFESSIONAL LIABILITY
PERSONAL LINES
Overview
2
Market Cap: $1 Billion
Gross Premiums: $790 million
Assets: $3.2 billion
Specialty insurer diversified by
product and geography
Experienced, invested management
73% of Premiums
Fourth Largest Writer of Med Mal
The Industry’s Blue Chip Company
27% of Premiums
Targeting the Michigan Education
Community
Significantly Outperforms Peers

Experienced, Stable Management
12
0
Sr. Vice President / Finance
Ned Rand
Years in
Industry
Years at
Company
Position
Name
22
14
Average
20
10
Sr. Vice President / Claims
Darryl Thomas
25
12
Chief Financial Officer / MEEMIC
Christine Schmitt
17
17
Sr. Vice President / IR
Frank O'Neil
21
21
Chief Accounting Officer
James Morello
30
12
President & CEO - MEEMIC
Lynn Kalinowski
24
8
Chief Financial Officer
Howard Friedman
27
27
Vice Chairman
Paul Butrus
20
6
Sr. Vice President / Marketing
Jeff Bowlby
24
19
President & COO
Victor Adamo
28
28
Chairman & CEO
Derrill Crowe, M.D.
Management is aligned with shareholders–Directors & Officers own 11%
3

Professional Liability
The Core of ProAssurance
4
Creating a Leader Through Acquisitions
1994: Purchased:
West Virginia Hosp. Ins Co.
1995: Acquisition of;
Physicians Ins Co of Indiana
Assumed business of:
Physicians Ins Co of Ohio
1996: Acquisition of:
Missouri Medical Ins Co
1995: Assumed business of:
Associated Physicians Ins Co. (IL)
1998: Consolidation with:
Physicians Protective Trust Fund (FL)
1996: Assumed business of:
American Medical Ins Exchange (IN)
1997: Affiliated with:
MEEMIC
Founding in
the 1970’s
1999: Assumed business of:
Medical Defense Associates (MO)
2004: Purchased Selected Renewal Rights from:
OHIC Insurance Company
Mutual Assurance
Medical Assurance
Physicians Ins. Co. of Michigan
Professionals Group
Merger Created
June, 2001
2005: Proposed Acquisition of:
NCRIC Group
5
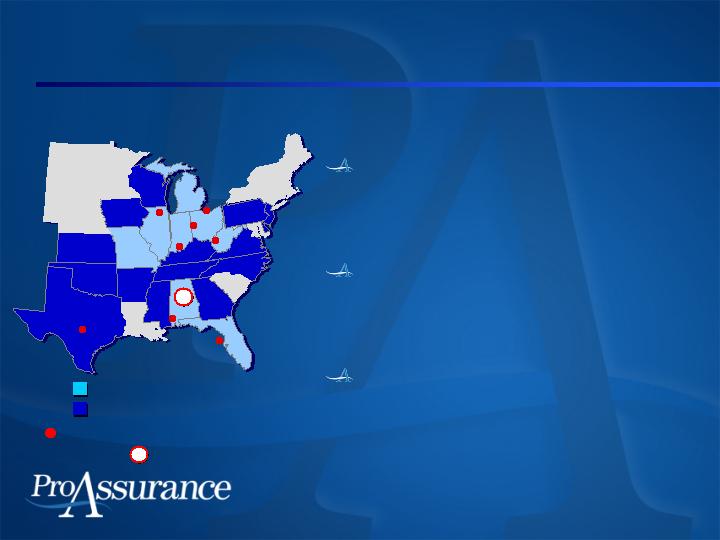
Regional Operating Structure
Corporate strategy
applied locally to
underwriting & claims
Local knowledge crucial
to understanding legal
environment
Local presence preserves
long-term customer
relationships
Consolidated Financial Strength With Local Operating Model
States of Origin or Acquisition
Expansion States
Professional Liability
+
+
+
+
+
6
Corporate Headquarters
Claims Offices
Claims / Underwriting Offices
+
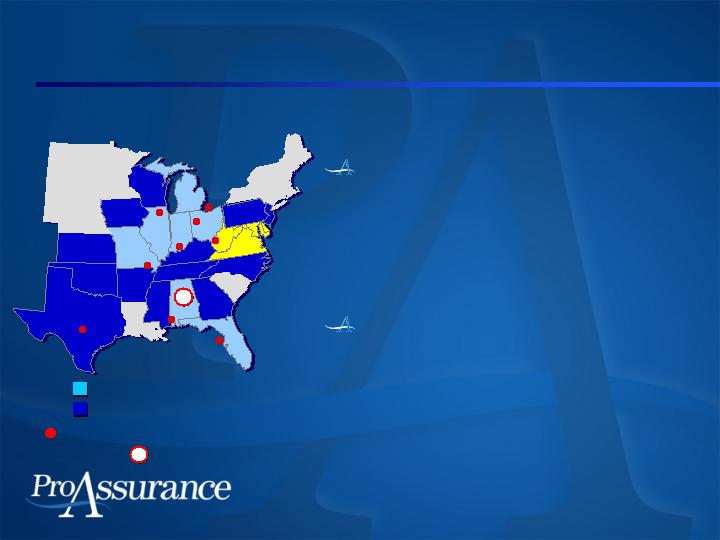
Regional Operating Structure
Strengthening our
business model by
merging NCRIC into
our operations
Adds Mid-Atlantic
presence
Consolidated Financial Strength With Local Operating Model
Corporate Headquarters
States of Origin or Acquisition
Expansion States
Professional Liability
Claims Offices
Claims / Underwriting Offices
+
+
+
+
+
NCRIC transaction subject to regulatory approvals and approval by NCRIC shareholders
7
+

NCRIC Transaction
Stock-for-stock transaction to close
early in Q3
Exchange ratio: One NCRIC share
receives 0.25 PRA shares, within collar
Transaction consideration will vary
within a 10% collar
The exchange ratio will float outside
of the 10% collar
8

Strategic Advantages
Ease of Integration
Similar backgrounds and operating models
Transaction is expected to be accretive
in 2005
Strengthens our business in states we
had targeted for growth
Strengthens PRA’s position as the
market leader
9
Insuring physicians,
hospitals, dentists and other
healthcare providers
Majority of insureds are smaller
groups and solo practitioners
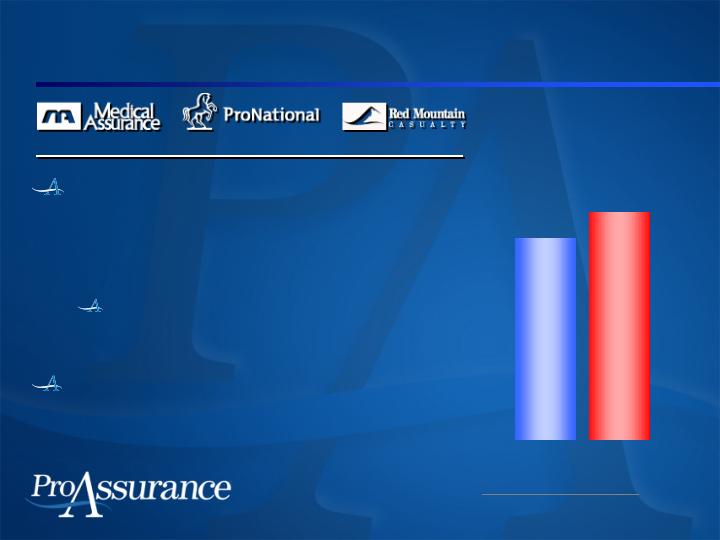
Professional Liability Snapshot
Three Year Average 2001-2003
Statutory Adjusted
Loss Ratio*
Medical Malpractice
*Source:A. M. Best Aggregates & Averages
Medial Malpractice Predominating
US Industry
124.3%
PRA
109.7%
Superior results through careful
underwriting, proper pricing and
effective claims handling
10

$349
$462
$543
$574
2001
2002
2003
2004
Gross Written Premiums*
(millions)
4 Year CAGR:
18.0%
We focus on bottom line results
but have been growing our top
line as well
Confident in current reserve
levels
Rated “A-” by A. M. Best,
S & P and Fitch
Professional Liability Snapshot
11

Market Leadership
Proven M& A capability
NCRIC transaction
We have advantages of size and scope
Ability to raise capital on a stand alone
basis to support growth
$ 198.5 million since 2002
Capital permits cost-effective use of
reinsurance
Professional Liability
12

Market Leadership
Specialty insurance with local operations
Venue-specific claims management
and underwriting knowledge
Proven track record of regional
operating success
Experienced management at all
levels of the organization
Professional Liability
13

Aggressive Claims Defense
Driven from the top of the organization
Our long-term competitive advantage
Aggressive defense of non-meritorious
claims
Cases Tried in 2004: 528
2002: 360; 2003:391
90% of closed claims resolved with no
indemnity payments
Generates lower costs and higher loyalty
Professional Liability
14
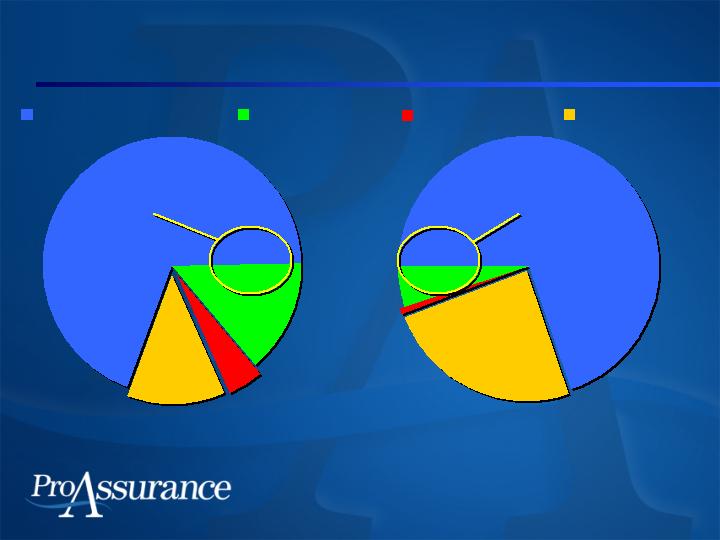
Closed Claim Outcome Comparison
Favorable
Outcomes: 83.3%
Favorable
Outcomes: 74.8%
15
14.0%
4.4%
12.3%
69.3%
24.4%
0.8%
5.1%
69.7%
Dropped or Dismissed
Defense Verdict
Plaintiff Verdict
Settled
ProAssurance 2004
Physician Insurers
Association, 2003
Latest Available Data
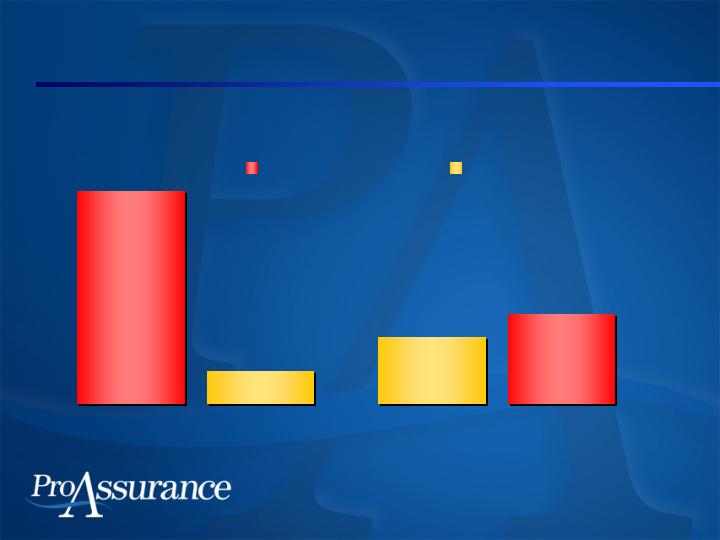
Closed Claim Cost Comparison
Reflects Results in All States with Various Policy Limits
16
$1,018,110
$153,145
$322,544
$430,601
Avg. Verdict
Avg. Settlement
ProAssurance 2004
Physician Insurers
Association, 2003
Latest Available Data
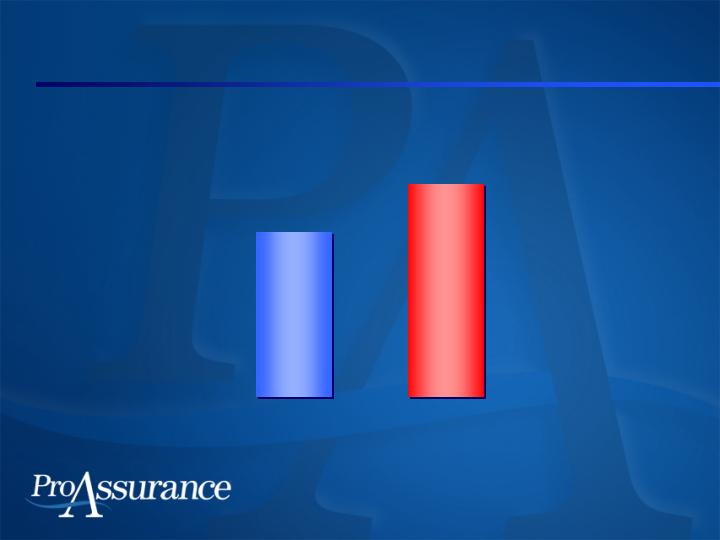
Average Indemnity Comparison
Weighted Average Indemnity Per Closed Claim
Latest Available Data
$63,399
$82,146
17
ProAssurance
PIAA 2003
2004
Three-Year Loss Ratio Comparisons
Our focus on
claims defense
allows us to
achieve better
results
Average Statutory Loss Ratio
2001-2003
US Industry
124.3%
PRA
109.7%
LEGAL
INDEMNITY
*Source:A. M. Best Aggregates & Averages
18
53.9%
88.3%
55.8%
36.0%
Medial Malpractice Predominating
Professional Liability Combined Ratio
Financial Overview
PRA PL Only
PL Industry
Source: ProAssurance Statutory Filings and A. M. Best Statutory Results
A. M. Best
Estimate
19
1999
2000
2001
2002
2003
2004
88.2%
109.4%
125.2%
124.5%
111.6%
104.8%
129.7%
133.8%
142.5%
135.2%
128.1%
154.2%

Pricing Remains Strong
Rate increases ensured higher
premium per unit of risk
19% in 2004
28% in 2003
28% in 2002
23% in 2001
Continuous re-underwriting of our book
New insureds balance out non-renewals
Professional Liability
20

Looking Ahead to 2005
Continued growth at adequate rates
Ensures proper margins on each policy
Adding insureds through growth in
existing markets and through M&A
Competitors’ capacity remains
constrained
Growth in Red Mountain Casualty
Our E & S market
21

Looking Ahead to 2005
The fragmented Professional Liability
market will provide acquisition
opportunities
Pursuing opportunistic acquisitions
Success not dependent on acquisitions
Professional Liability
22
ProAssurance will be invited to
participate in any major opportunities
Experienced consolidator
Acquisitions formed our foundation
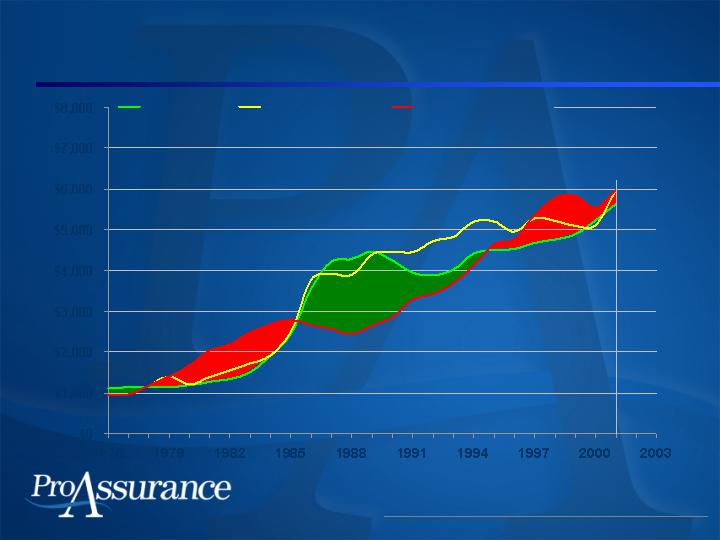
Will History Repeat Itself—Again?
Professional Liability
Millions
Source: A. M. Best Aggregates and Averages 1976 – 2001
At 12/31/2001
23
$0
$1,000
$2,000
$3,000
$4,000
$5,000
$6,000
$7,000
$8,000
Premium
Initial Reserve
(Estimated)
Developed Loss
(Actual)
1976
1979
1982
1985
1988
1991
1994
1997
2000
2003
Medical Malpractice Industry, Net Basis Occurrence and Claims-Made Combined
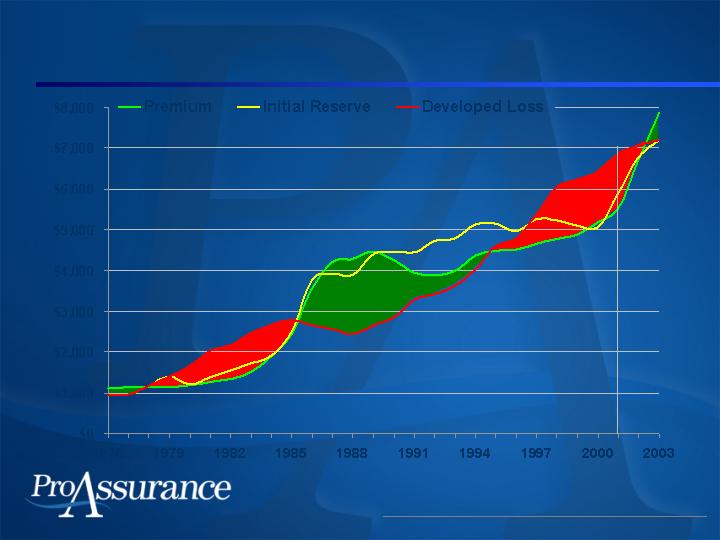
Will History Repeat Itself—Again?
Professional Liability
Millions
(Estimated)
(Actual)
Source: A. M. Best Aggregates and Averages 1976 – 2003
12/31/2001
24
$0
$1,000
$2,000
$3,000
$4,000
$5,000
$6,000
$7,000
$8,000
1976
1979
1982
1985
1988
1991
1994
1997
2000
2003
Premium
Initial Reserve
Developed Loss
Medical Malpractice Industry, Net Basis Occurrence and Claims-Made Combined

$1,000
$2,000
$3,000
$4,000
$5,000
$6,000
$7,000
$8,000
Premiums
In Millions
$0
$1,000
$2,000
$3,000
$4,000
$5,000
$6,000
$7,000
1976
1979
1982
1985
1988
1991
1994
1997
2000
2003
At 12/31/2001
Premium
Initial Reserve
Developed Loss
(Estimated)
(Actual)

Looking Ahead: Tort Reform
Federal tort reform faces Senate roadblock
even after Republican gains
State-by-state reforms
Passed in many states (GA,FL, OH, PA, TX & WV)
Long-term effectiveness yet to be proven
No judicial review yet—could be found
unconstitutional
Organizational efforts in many other states
ProAssurance’s business plans do not
depend on tort reform
Professional Liability
26

Personal Lines
The Overlooked Gem
Personal Lines Snapshot
MEEMIC targets teachers and
the educational community
Primarily personal auto (81%)
Also homeowners and boat
Overview
$130
$142
$174
$197
$216
2000
2001
2002
2003
2004
Direct Written Premiums
(millions)
5 Year CAGR:
13.5%
28
Personal Lines Snapshot
Careful underwriting in a
preferred market
Peer-to-peer selling model
provides a solid foundation
Incremental expansion underway
Rated “A-”
Overview
MI Industry
86.9%
MEEMIC
68.2%
*Source: A. M. Best
Statutory Adjusted Loss Ratio*
Private Passenger Auto
Superior Results
Five Year Average 1999-2003
29

MEEMIC’s Importance
2004 accomplishments
Combined ratio of 83.4%
Tenth straight year of underwriting
profitability
Growth in Premiums and
Policyholders
Consistent results
Personal Lines
30
Industry-Leading Results
65.2%
70.3%
64.6%
65.8%
61.3%
23.7%
23.8%
23.1%
22.1%
22.1%
2000
2001
2002
2003
2004
GAAP Combined Ratio
Expense Ratio
Loss Ratio
88.9%
94.1%
87.7%
87.9%
Personal Lines
Source: A. M. Best
83.4%
5 Year Average of 88.4%
31

MEEMIC: Steady Growth
Premiums continue to increase in a
softening market
Up 10% for 2004
Up 13% for 2003
Increasing value of cars and homes
insured
Sustained policyholder growth in all
lines
Personal Lines
32

Financial Overview
The Strength of ProAssurance
33
Financial Highlights
Cash flows at all time high
Consolidated Combined Ratio
below 100 for 2004
Solid bottom line growth
Continued growth
in top line as well
$36.3
$61.3
$177.0
$282.8
$373.5
2000
2001
2002
2003
2004
Merger Created ProAssurance in June 2001
Cash Flow from
Operations
34

Balance Sheet Comparison
in millions
Balance Sheet Strength Sets
ProAssurance Apart
December 31, 2004, Unaudited
35
Total Assets
$
3,240
$
2,879
13%
Cash & Invested Assets
$
2,485
$
2,103
21%
Reserves for Losses
and Loss Adjustment
Expenses
$
2,413
$
2,173
11%
Shareholders’ Equity
$
611
$
546
12%
Y-to-Y
2004
2003
Change
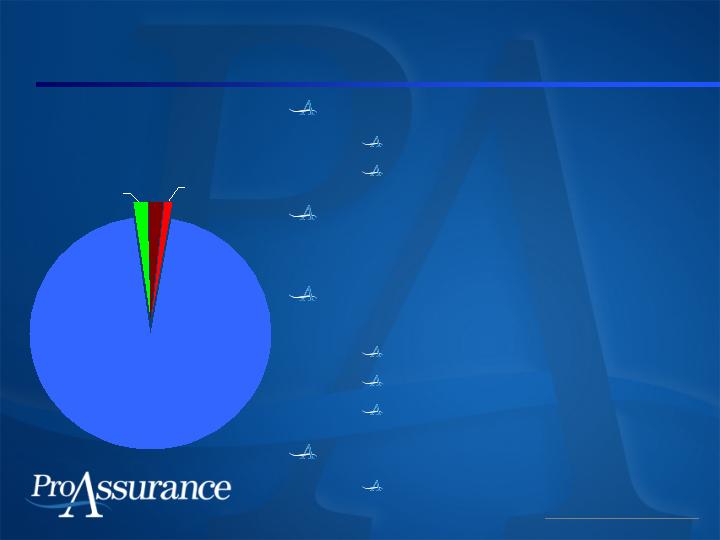
High Quality, Liquid Investment Portfolio
Financial Overview
December 31, 2004, Unaudited
Cash
2%
Equities
1%
Other
2%
Fixed
Securities*
95%
Total = $2.4 billion
* Includes Preferred Stock and Business-Owned Life Insurance
36
Conservative portfolio
No derivatives
Managed by outside advisors
Average fixed maturity duration
of 3.81 years
High quality fixed income
portfolio
Weighted average rating of “AA”
99.5% investment grade
Avg. tax-equivalent yield: 4.72%
Net unrealized gain: $37.5 mln
Affected by recent interest rate
movement

2004 Income Statement
in millions, except per share data
Financial Overview
December 31, 2004, Unaudited
37
Gross Premiums Written
$
573.6
$
216.1
$
789.7
Net Investment Income
75.0
10.9
87.2
Total Revenue
593.9
196.6
794.6
Total Expenses
537.6
153.0
697.1
Net Income
72.8
Professional
Personal
Liability
Lines
Consolidated
Cash from Operations
$
373.5
Net Income/Share (diluted)
$
2.37

2004 Income Statement vs. 2003
in millions, except per share data
Financial Overview
December 31, 2004, Unaudited
38
Gross Premiums Written
$
789.7
$
740.1
7%
Net Investment Income
87.2
73.6
19%
Total Revenue
794.6
709.6
12%
Total Expenses
697.1
659.3
6%
Net Income
$ 72.8
$
38.7
88%
2004
2003
Change
Cash from Operations
$
373.5
$
282.8
32%
Net Income/Share (diluted)
$
2.37
$
1.32
80%
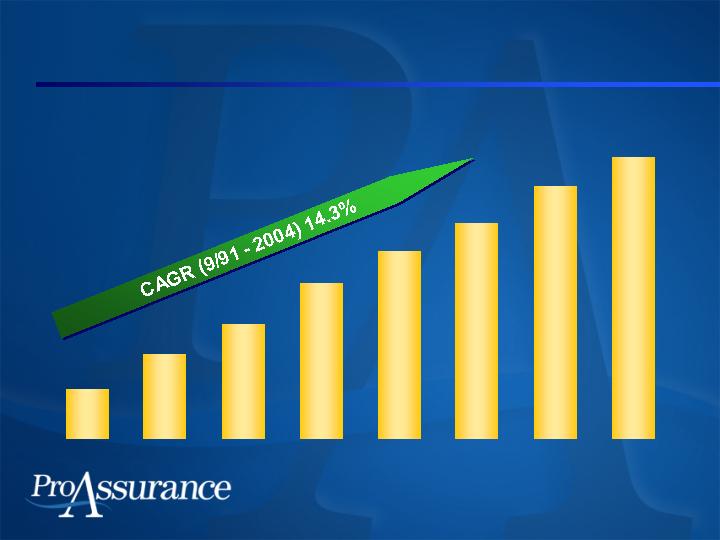
Consistent Growth in Book Value per Share
$3.67
$6.27
$8.56
$11.57
$13.92
$16.02
$18.77
$20.92
1991
1993
1995
1997
1999
2001
2003
2004
Annual stock price performance of
PRA and predecessors is 18.9%
since inception in September, 1991
Financial Overview
39

Key Objective: 12%-14% ROE
ROE targets drive our ultimate consolidated
combined ratio goals
Professional Liability: 96% or lower
Personal Lines: 94% or lower
Combined Ratio History
2005: <99.2% (goal)
2004: 99.2%
2003: 105.1%
2002: 113.0%
2004 Outlook
40

Our Opportunities
41
Leader in medical malpractice industry
Organic growth and M&A expansion
Proven platform with regional operating
approach
Attractive niche personal lines business
Experienced management team focused
on driving returns
Conservative financial position