Exhibit 99.1
 |
ProAssurance Midwest Investor Meetings November 9-10, 2005 A. Derrill Crowe, M.D. Chairman & Chief Executive Officer Mr. Frank B. O’Neil Investor Relations Officer |
 |
ProAssurance Contacts Travelling Available ProAssurance 1 |
 |
Caution Regarding Forward Looking Statements This presentation contains historical information as well as forward-looking statements that are based upon our estimates and anticipation of future events, including our proposed transaction with NCRIC Group, Inc. These estimates and events are subject to certain risks and uncertainties that could cause actual results to vary materially from the expected results described in the forward-looking statements. The words "anticipate," "believe," "estimate," "expect," "hopeful," "intend," "may," "optimistic," "preliminary," "project," "should," "will," and similar expressions, whether used on a slide or in speakers' remarks, are intended to identify these forward-looking statements. There are numerous important factors that could cause our actual results to differ materially from those in the forward-looking statements. Thus, sentences and phrases that we use to convey our view of future events and trends are expressly designated as Forward-Looking Statements as are sections of this presentation clearly identified as giving our outlook on future business. The principal risk factors that may cause actual results to differ materially from those expressed in the forward-looking statements are described in various documents we file with the Securities and Exchange Commission, including the most recent Form 10K for the year ended December 31, and Form 10Q for the most recent quarter. You should also refer to our Form 8K filed February 28, 2005 for specific Cautions and Risk Factors regarding our recent transaction with NCRIC Group. Financial data for the medical malpractice segment for all periods prior to June, 2001 reflects Medical Assurance, Inc. data only, except where noted. ProAssurance 2 |
 |
ProAssurance Overview o Market Cap: $1.4 Billion o Gross Premiums: $790 million in 2004 o Assets: $3.8 billion o Nation's fourth-largest medical professional liability insurer o Geographically diversified o Experienced, invested management o Sale of personal lines business expected to be complete in Q1, 2006 ProAssurance 3 |
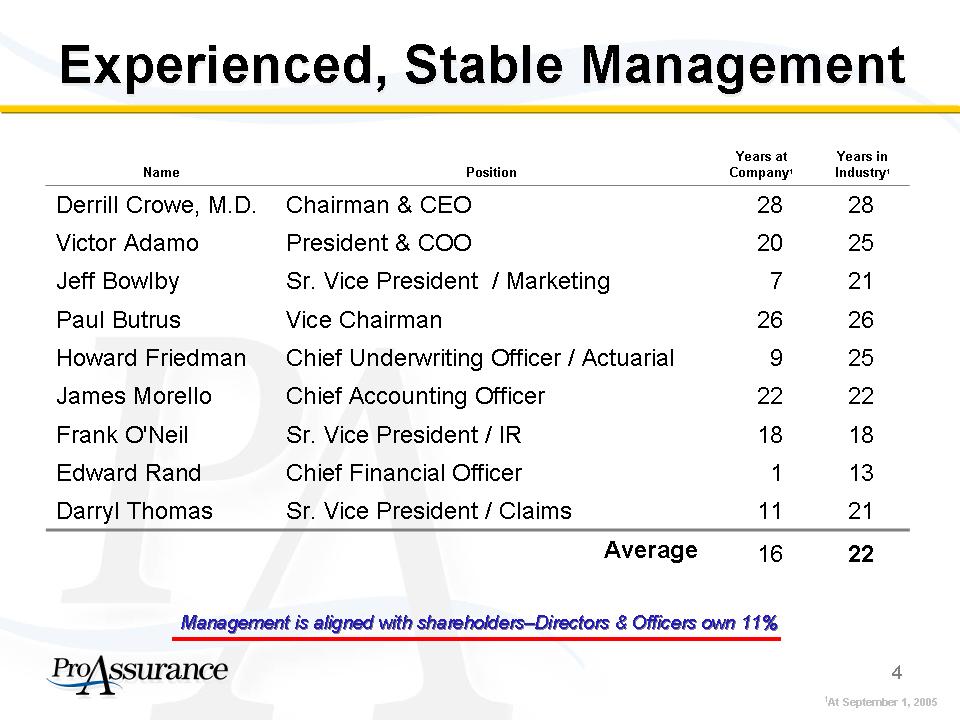 |
Experienced, Stable Management Name Position Years at Company(1) Years in Industry(1) Derrill Crowe, M.D. Chairman & CEO 28 28 Victor Adamo President & COO 20 25 Jeff Bowlby Sr. Vice President / Marketing 7 21 Paul Butrus Vice Chairman 26 26 Howard Friedman Chief Underwriting Officer / Actuarial 9 25 James Morello Chief Accounting Officer 22 22 Frank O'Neil Sr. Vice President / IR 18 18 Edward Rand Chief Financial Officer 1 13 Darryl Thomas Sr. Vice President / Claims 11 21 Average 16 22 Management is aligned with shareholders-Directors & Officers own 11% ProAssurance 4 |
 |
Professional Liability The Core of ProAssurance ProAssurance (R) |
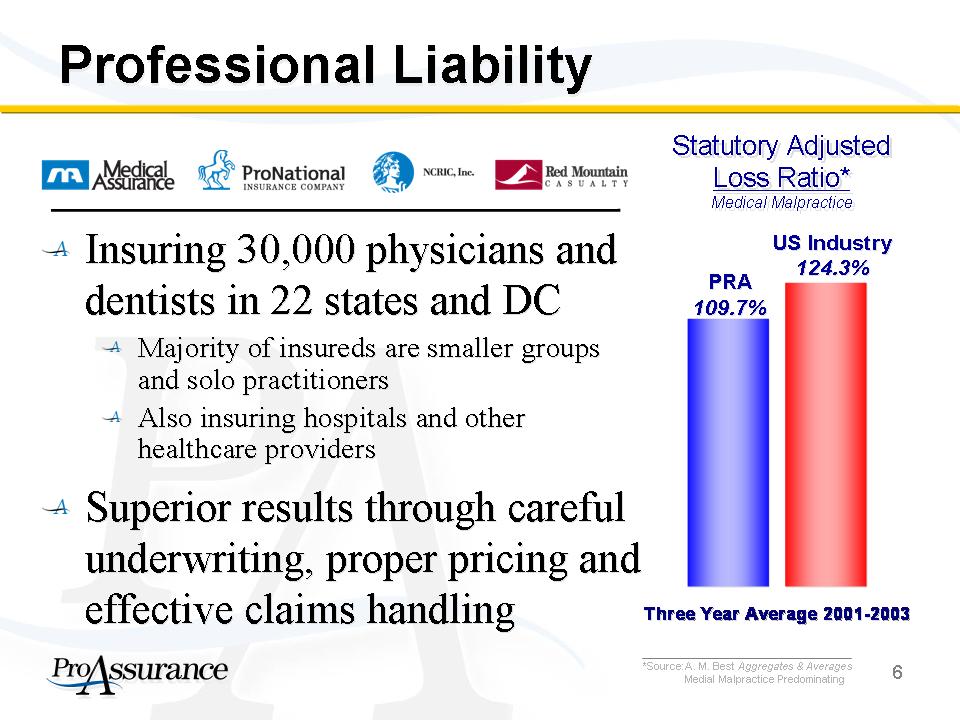 |
Professional Liability o Insuring 30,000 physicians and dentists in 22 states and DC o Majority of insureds are smaller groups and solo practitioners o Also insuring hospitals and other healthcare providers o Superior results through careful underwriting, proper pricing and effective claims handling Statutory Adjusted Loss Ratio* Medical Malpractice PRA 109.7% US Industry 124.3% Three Year Average 2001-2003 *Source: A. M. Best Aggregates & Averages Medial Malpractice Predominating ProAssurance 6 |
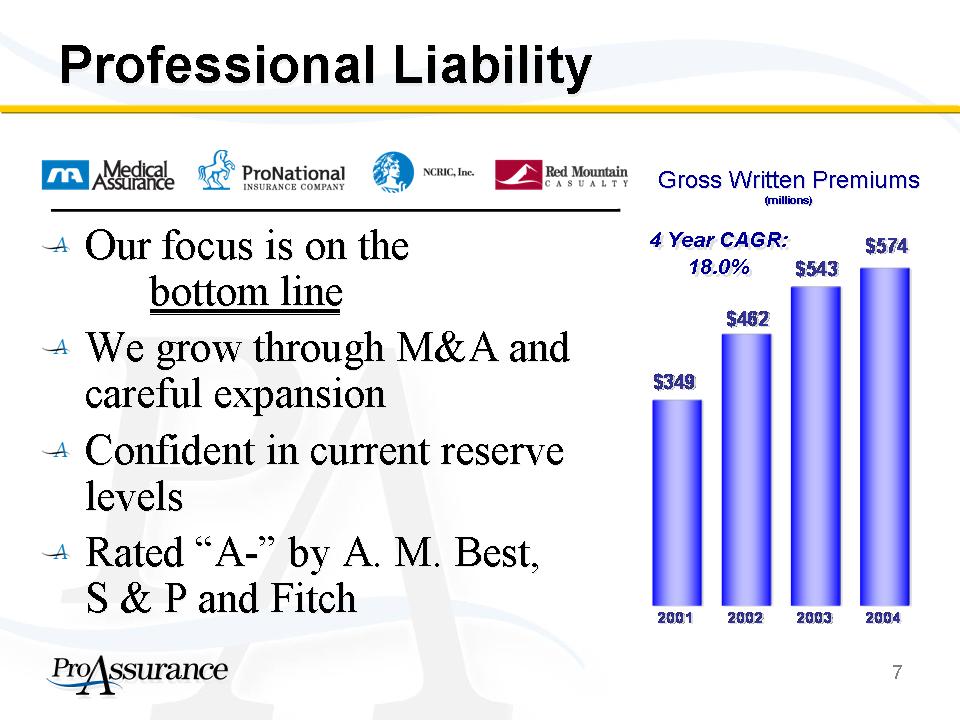 |
Professional Liability o Our focus is on the bottom line o We grow through M&A and careful expansion o Confident in current reserve levels o Rated "A-" by A. M. Best, S & P and Fitch Gross Written Premiums (millions) 4 Year CAGR: 18.0% 2001 2002 2003 2004 $349 $462 $543 $574 ProAssurance 7 |
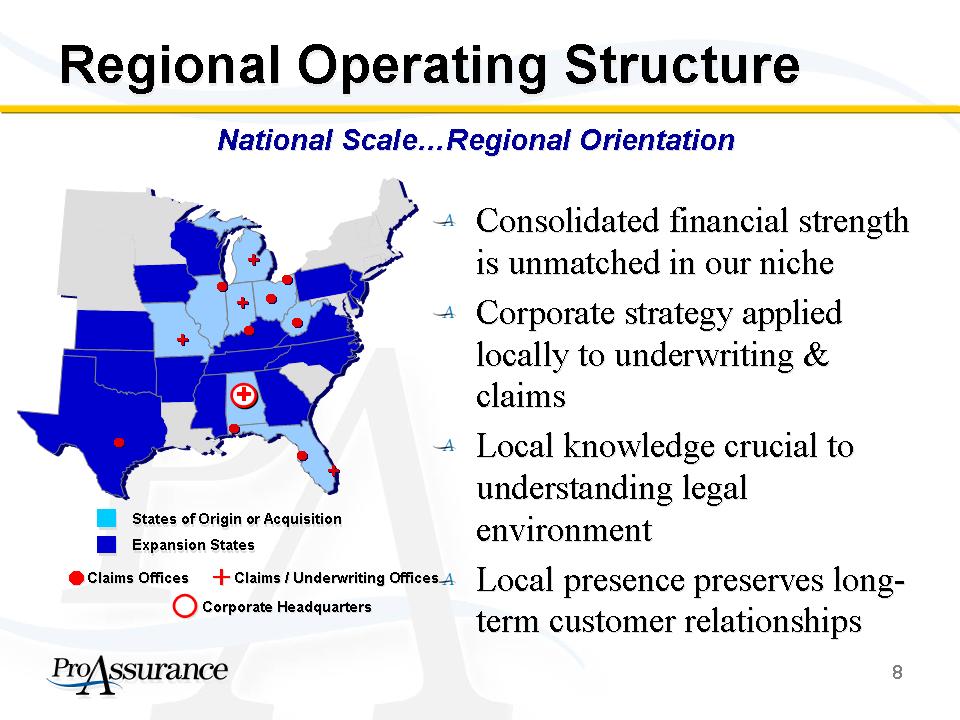 |
Regional Operating Structure National Scale...Regional Orientation o Consolidated financial strength is unmatched in our niche o Corporate strategy applied locally to underwriting & claims o Local knowledge crucial to understanding legal environment o Local presence preserves long-term customer relationships States of Origin or Acquisition Expansion States Claims Offices Claims / Underwriting Offices Corporate Headquarters ProAssurance 8 |
 |
NCRIC is an ideal fit in the ProAssurance operating model o Adding NCRIC strengthens our mid-Atlantic presence o ~4,000 policyholders o We retain local knowledge in key operational positions o Similar corporate culture eases integration States of Origin or Acquisition Expansion States NCRIC States Claims Offices Claims / Underwriting Offices Corporate Headquarters ProAssurance 9 |
 |
Market Leadership We are the foremost writer in our states of operation o We are market leaders in AL, DE, DC, OH and VA o We continue to grow within our market footprint o Opportunities for M&A will present themselves Leading Market Share Top 5 Market Share Top 10 Market Share Growing Market Share ProAssurance 10 |
 |
We Created a Leader Through Consolidation 1995: Consolidation of; Physicians Ins Co of Indiana Assumed business of: Physicians Ins Co of Ohio 1996: Consolidation of: Missouri Medical Ins Co 1994: Consolidation of: West Virginia Hosp. Ins Co. 1999: Assumed business of: Medical Defense Associates (MO) Mutual Assurance Medical Assurance Founding in the 1970's 1997: Affiliated with: MEEMIC 2005: Consolidation of: NCRIC Group Physicians Ins. Co. of Michigan Professionals Group 1995: Assumed business of: Associated Physicians Ins Co. (IL) 1998: Consolidation of: Physicians Protective Trust Fund (FL) 1996: Assumed business of: American Medical Ins Exchange (IN) 2004: Purchased Selected Renewal Rights from: OHIC Insurance Company ProAssurance June, 2001 ProAssurance 11 |
 |
Claims Defense Drives Us o Driven from the top of the organization o Our long-term competitive advantage o Aggressive defense of non-meritorious claims o Generates lower costs and higher loyalty We try more cases than any company is our line of business 2002 2003 2004 360 391 528 12 |
 |
Closed Claim Outcome Comparison Favorable Outcomes: 83.3% Favorable Outcomes: 76.4% ProAssurance, 2004 Industry Data, 2004* Dropped or Dismissed 69.3% Defense Verdict 14.0% Plaintiff Verdict 4.4% Settled 12.3% 70.80% 22.50% 1.10% 5.60% ProAssurance *Source: Physician Insurers Association Data Sharing Project 13 |
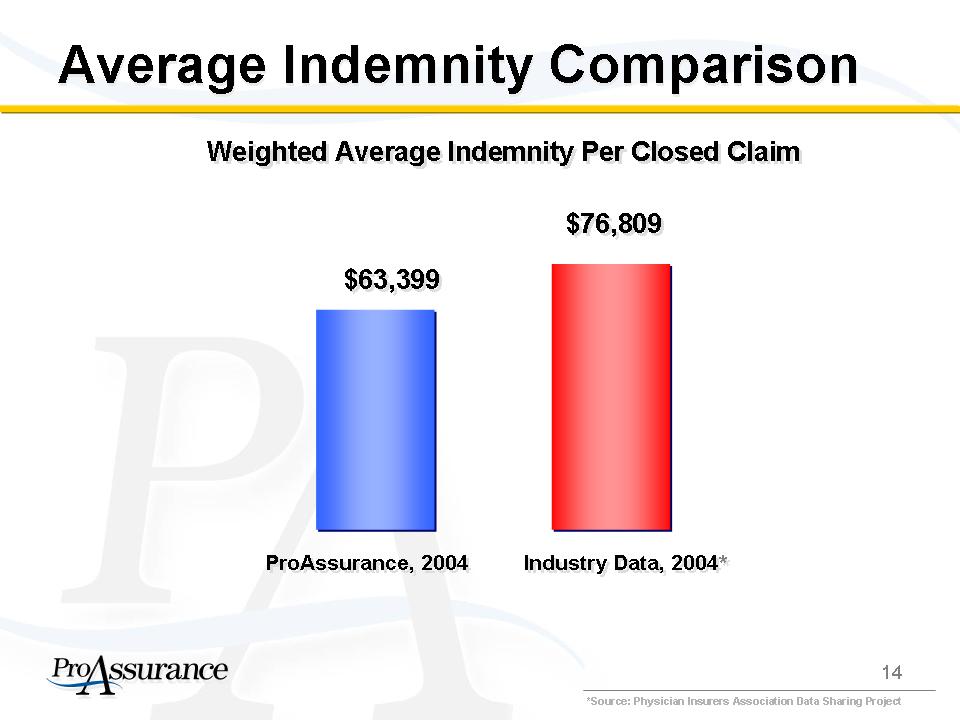 |
Average Indemnity Comparison Weighted Average Indemnity Per Closed Claim $63,399 $76,809 ProAssurance, 2004 Industry Data, 2004 *Source: Physician Insurers Association Data Sharing Project ProAssurance 14 |
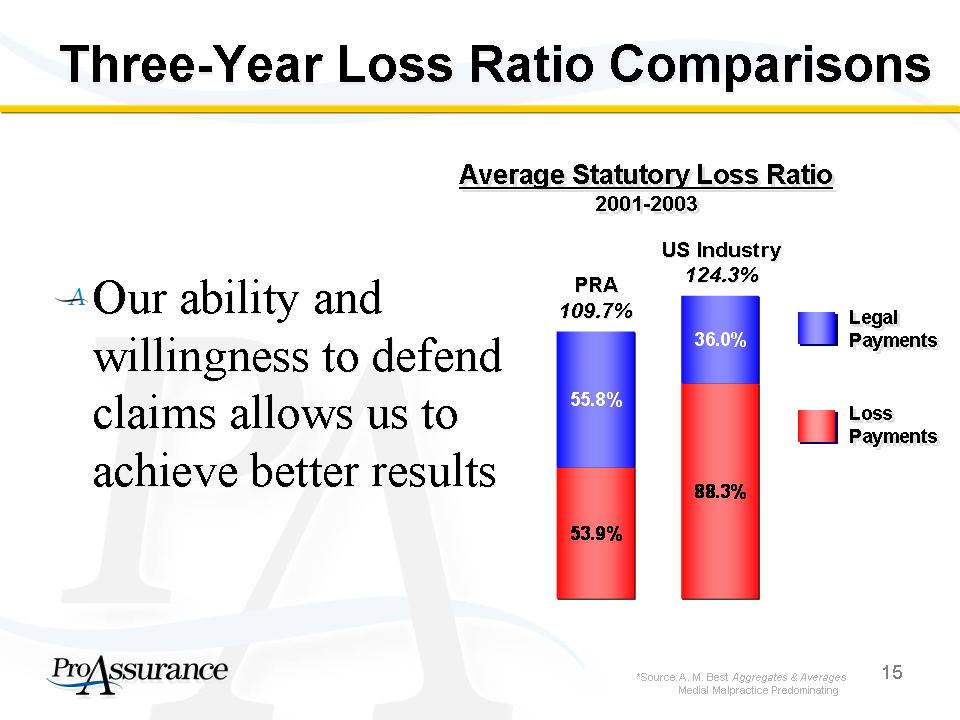 |
Three-Year Loss Ratio Comparisons Average Statutory Loss Ratio 2001-2003 Our ability and willingness to defend claims allows us to achieve better results PRA 109.7% US Industry 124.3% Legal Payments Loss Payments 53.90% 55.80% 88.30% 36.00% *Source: A. M. Best Aggregates & Averages Medial Malpractice Predominating ProAssurance 15 |
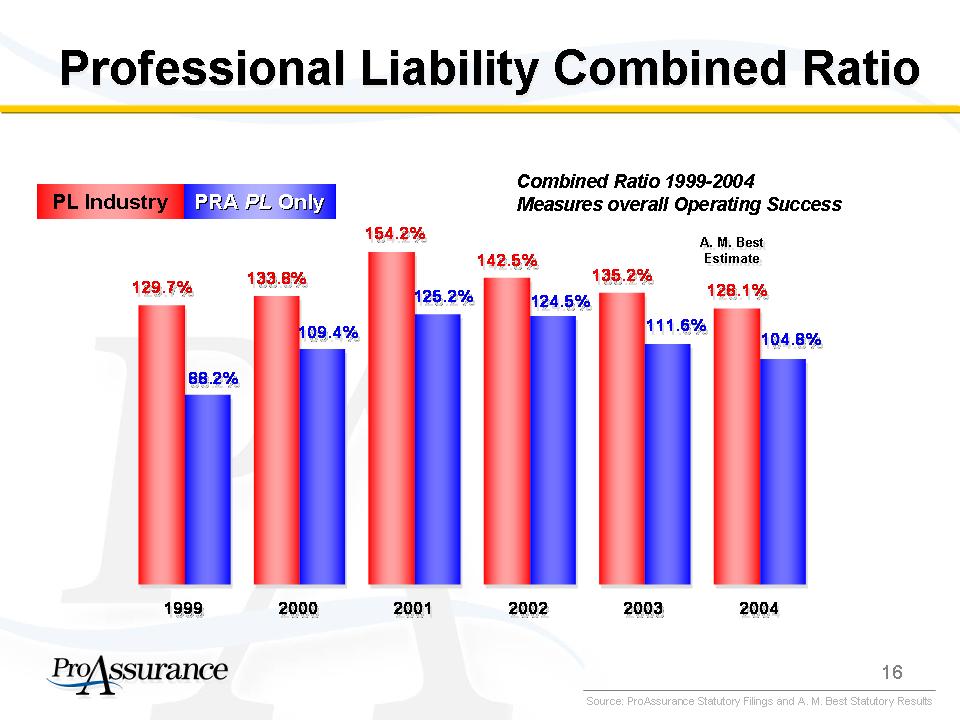 |
Professional Liability Combined Ratio PL Industry PRA PL Only Combined Ratio 1999-2004 Measures overall Operating Success A. M. Best Estimate 1999 2000 2001 2002 2003 2004 129.7% 133.8% 154.2% 142.5% 135.2% 128.1% 88.2% 109.4% 125.2% 124.5% 111.6% 104.8% Source: ProAssurance Statutory Filings and A. M. Best Statutory Results ProAssurance 16 |
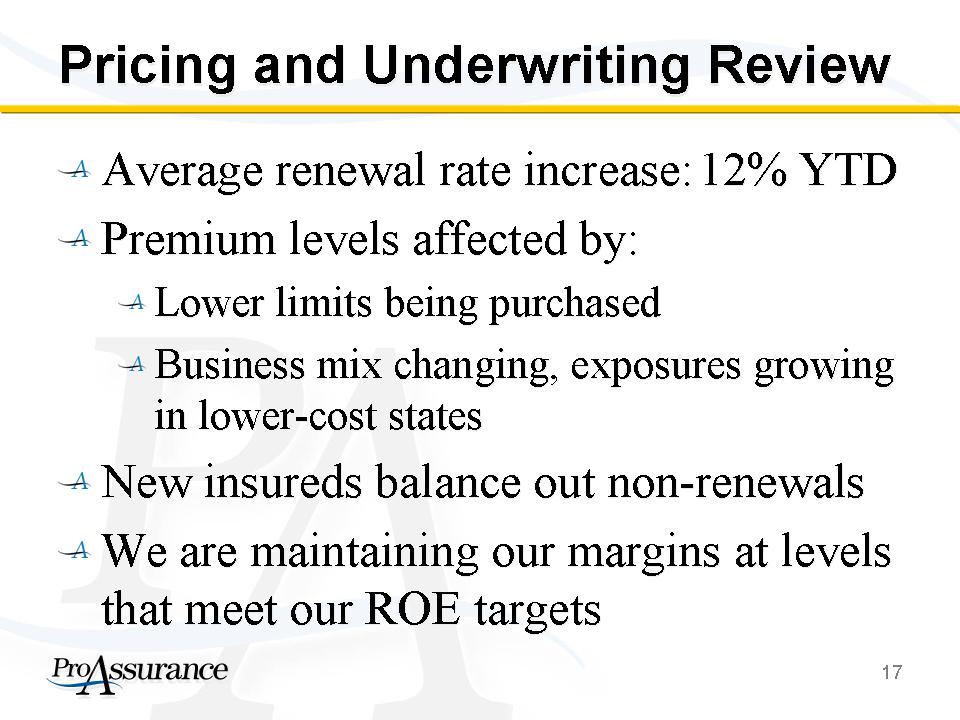 |
Pricing and Underwriting Review o Average renewal rate increase: 12% YTD o Premium levels affected by: o Lower limits being purchased o Business mix changing, exposures growing in lower-cost states o New insureds balance out non-renewals o We are maintaining our margins at levels that meet our ROE targets ProAssurance 17 |
 |
Looking Ahead o Adding insureds through careful growth in existing markets o M&A opportunities are being created now o Start-ups are underpricing to win business o Many companies remain undercapitalized o We are generating capital to sustain expected growth ProAssurance 18 |
 |
Looking Ahead o Federal tort reform remains uncertain o State-by-state reforms o Passed in many forms in many states o GA, FL, OH, PA, TX & WV) o Long-term effectiveness yet to be proven o No judicial review yet--could be found unconstitutional o Wisconsin's were recently struck down after ten years o Reforms under discussion in many states o ProAssurance's business plans do not depend on tort reform ProAssurance 19 |
 |
Professional Liability Summary o Financial Strength o Permits cost-effective reinsurance decisions o Secures high ratings and customer confidence o Industry leading defense results o Proven reserve integrity o Management's experience o Demonstrated M & A capability ProAssurance 20 |
 |
Behind the Sale of Our Personal Lines Business ProAssurance MEEMIC |
 |
MEEMIC Transaction Background o Personal Lines business is near its peak o MEEMIC's outstanding margins may erode as larger competitors target affinity markets o Our choice: o Current earnings vs. a premium valuation o Our decision: o Think long-term o Focus on core competency in med mal ProAssurance 22 |
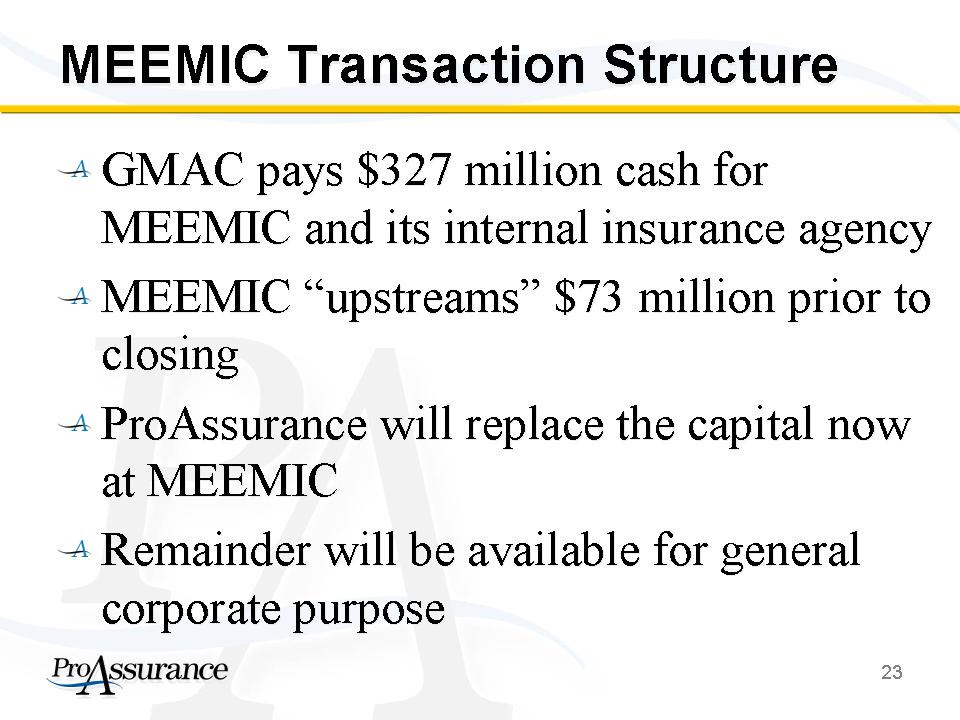 |
MEEMIC Transaction Structure o GMAC pays $327 million cash for MEEMIC and its internal insurance agency o MEEMIC "upstreams" $73 million prior to closing o ProAssurance will replace the capital now at MEEMIC o Remainder will be available for general corporate purpose ProAssurance 23 |
 |
MEEMIC Transaction Timing o Completion expected in Q1, 2006 o No anti-trust concerns in our view o State regulators have indicated support ProAssurance 24 |
 |
Financial Overview The Heart of ProAssurance ProAssurance |
 |
Financial Highlights o Consolidated Combined Ratio continues to decrease o 92.5% YTD(1) o Return on Equity exceeding our targets o 15.6% YTD(1) o Solid bottom line growth and strong cash flows Cash Flow from Operations Merger Created ProAssurance in June 2001 2000 $36.3 2001 $61.3 2002 $177.0 2003 $282.8 2004 $373.5 ProAssurance 26 |
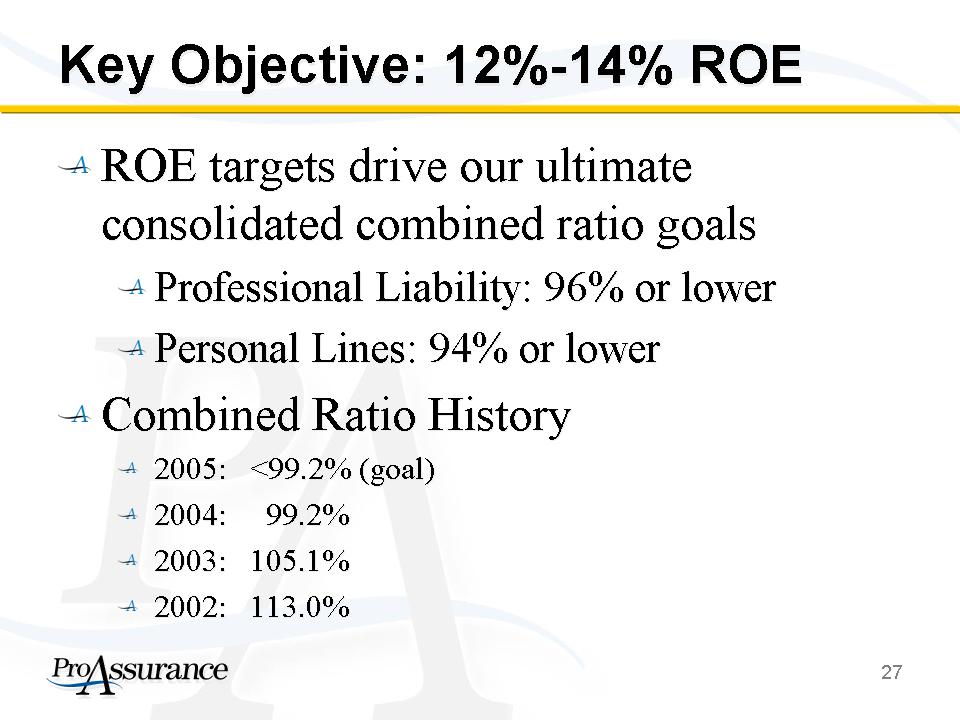 |
Key Objective: 12%-14% ROE o ROE targets drive our ultimate consolidated combined ratio goals o Professional Liability: 96% or lower o Personal Lines: 94% or lower o Combined Ratio History o 2005: <99.2% (goal) o 2004: 99.2% o 2003: 105.1% o 2002: 113.0% ProAssurance 27 |
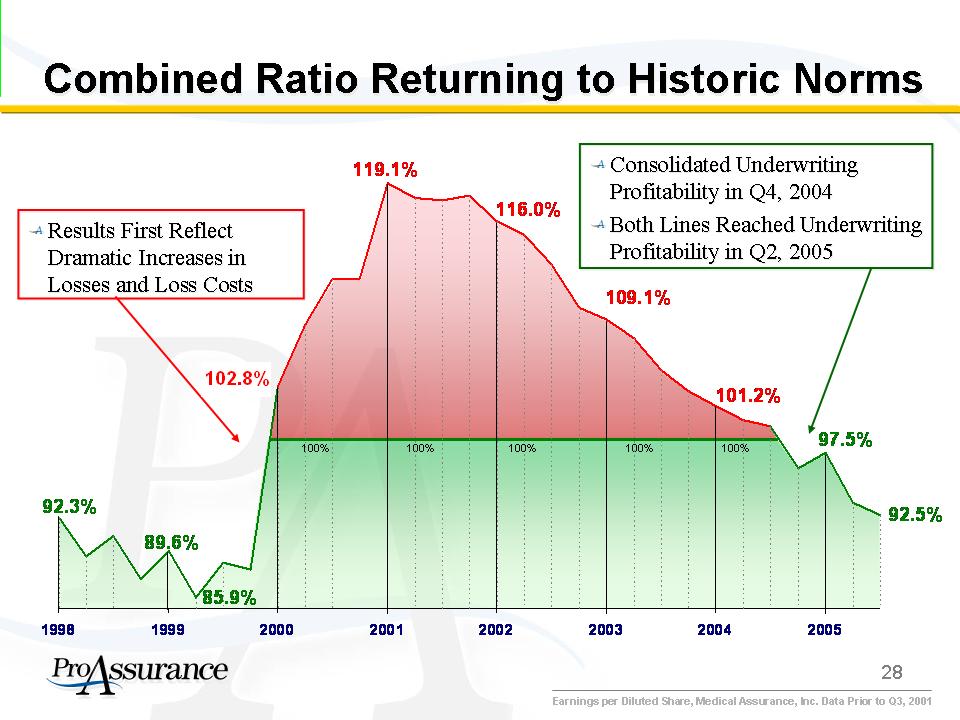 |
Combined Ratio Returning to Historic Norms 1998 92.3% 89.2% 90.8% 87.4% 1999 89.6% 85.9% 88.7% 88.1% 2000 102.8% 107.7% 111.4% 111.4% 2001 119.1% 117.9% 117.7% 118.1% 2002 116.0% 114.9% 112.6% 109.1% 2003 108.2% 106.7% 104.1% 102.4% 2004 101.2% 100.1% 99.6% 96.2% 2005 97.5% 93.5% 92.5% Results First Reflect Dramatic Increases in Losses and Loss Costs - Consolidated Underwriting Profitability in Q4, 2004 - Both Lines Reached Underwriting Profitability in Q2, 2005 Earnings per Diluted Share, Medical Assurance, Inc. Data Prior to Q3, 2001 ProAssurance 29 |
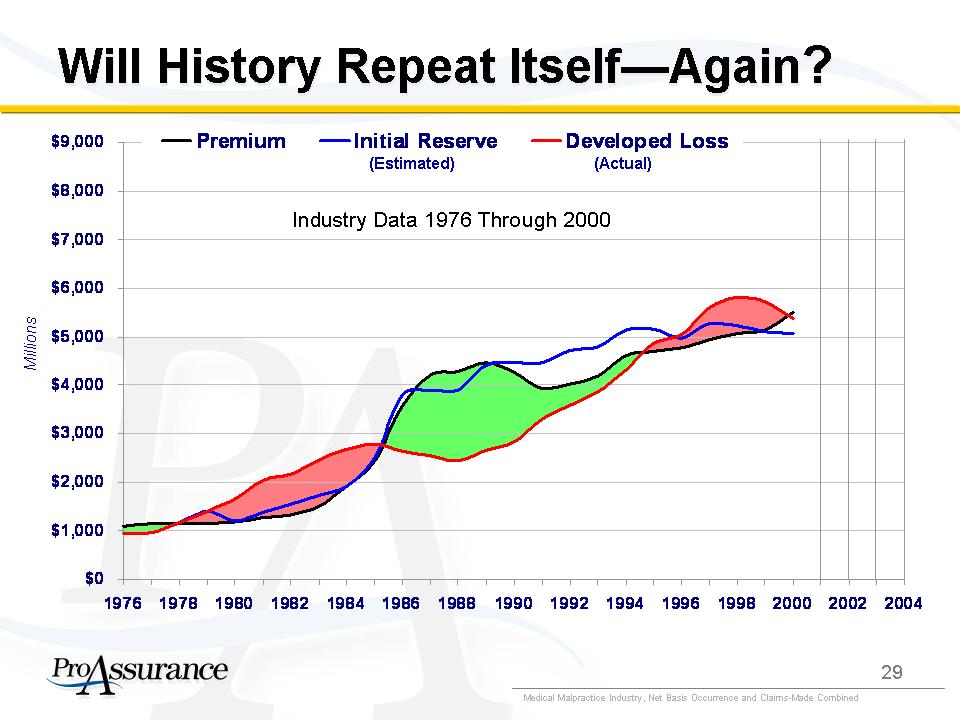 |
Will History Repeat Itself--Again? Industry Data 1976 Through 2000 Millions C/A Yr Premium Initial Reserve Developed Loss 1976 1,100 $950 $950 1977 1,142 $960 $960 1978 1,148 $1,171 $1,171 1979 1,141 $1,398 $1,398 1980 1,184 1,209 1,659 1981 1,268 1,387 2,032 1982 1,333 1,546 2,166 1983 1,509 1,723 2,464 1984 1,911 1,921 2,676 1985 2,448 2,510 2,784 1986 3,574 3,782 2,649 1987 4,212 3,904 2,551 1988 4,281 3,892 2,437 1989 4,461 4,402 2,654 1990 4,256 4,470 2,844 1991 3,935 4,455 3,296 1992 4,019 4,727 3,587 1993 4,195 4,786 3,863 1994 4,607 5,131 4,325 1995 4,693 5,152 4,873 1996 4,769 4,973 5,041 1997 4,937 5,259 5,597 1998 5,061 5,234 5,808 1999 5,130 5,098 5,716 2000 5,494 5,066 5,368 2001 2002 2003 2004 Medical Malpractice Industry, Net Basis Occurrence and Claims-Made Combined ProAssurance 29 |
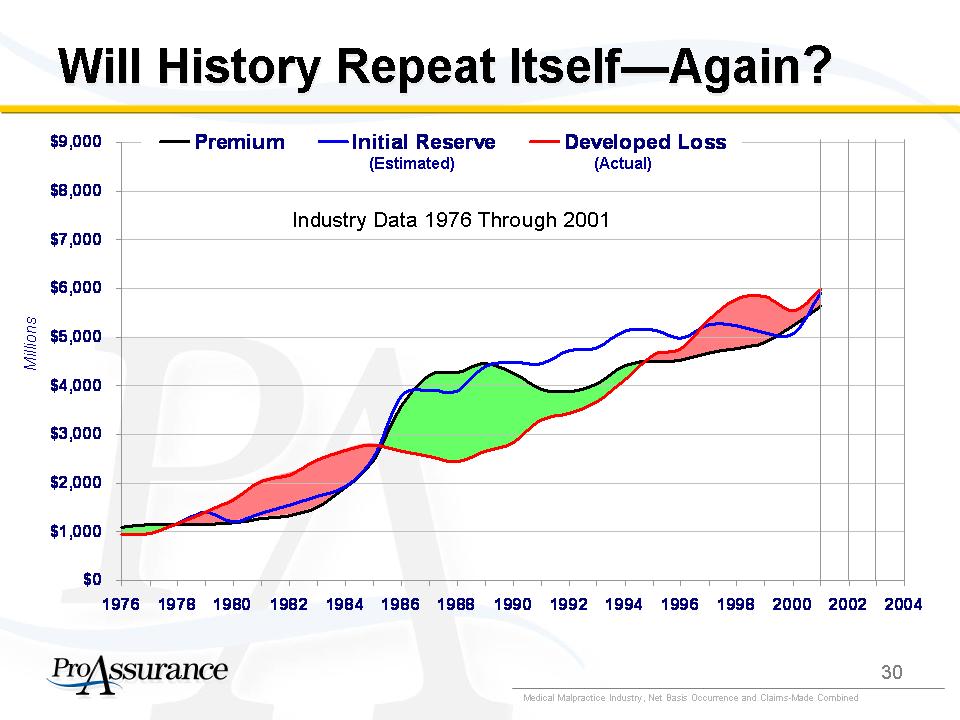 |
Will History Repeat Itself--Again? Industry Data 1976 Through 2001 Millions C/A Yr Premium Initial Reserve Developed Loss 1976 1,100 $950 $950 1977 1,142 $960 $960 1978 1,148 $1,171 $1,171 1979 1,141 $1,398 $1,398 1980 1,184 1,209 1,659 1981 1,268 1,387 2,032 1982 1,333 1,546 2,166 1983 1,509 1,723 2,464 1984 1,911 1,921 2,676 1985 2,448 2,510 2,784 1986 3,574 3,782 2,649 1987 4,212 3,904 2,551 1988 4,281 3,892 2,437 1989 4,461 4,402 2,654 1990 4,256 4,470 2,844 1991 3,935 4,455 3,296 1992 3,879 4,727 3,429 1993 4,032 4,786 3,678 1994 4,414 5,131 4,128 1995 4,513 5,152 4,638 1996 4,528 4,973 4,765 1997 4,670 5,259 5,365 1998 4,761 5,234 5,785 1999 4,888 5,098 5,829 2000 5,228 5,066 5,538 2001 5,641 5,915 5,985 2002 2003 2004 Medical Malpractice Industry, Net Basis Occurrence and Claims-Made Combined ProAssurance 30 |
 |
Will History Repeat Itself--Again? Industry Data 1976 Through 2002 Millions C/A Yr Premium Initial Reserve Developed Loss 1976 1,100 $950 $950 1977 1,142 $960 $960 1978 1,148 $1,171 $1,171 1979 1,141 $1,398 $1,398 1980 1,184 1,209 1,659 1981 1,268 1,387 2,032 1982 1,333 1,546 2,166 1983 1,509 1,723 2,464 1984 1,911 1,921 2,676 1985 2,448 2,510 2,784 1986 3,574 3,782 2,649 1987 4,212 3,904 2,551 1988 4,281 3,892 2,437 1989 4,461 4,402 2,654 1990 4,256 4,470 2,844 1991 3,935 4,455 3,296 1992 3,879 4,727 3,429 1993 3,991 4,786 3,637 1994 4,344 5,131 4,028 1995 4,451 5,152 4,562 1996 4,472 4,973 4,725 1997 4,617 5,259 5,365 1998 4,713 5,234 5,872 1999 4,841 5,098 5,961 2000 5,182 5,066 6,030 2001 5,604 5,915 6,324 2002 6,785 6,777 6,834 2003 2004 Medical Malpractice Industry, Net Basis Occurrence and Claims-Made Combined ProAssurance 31 |
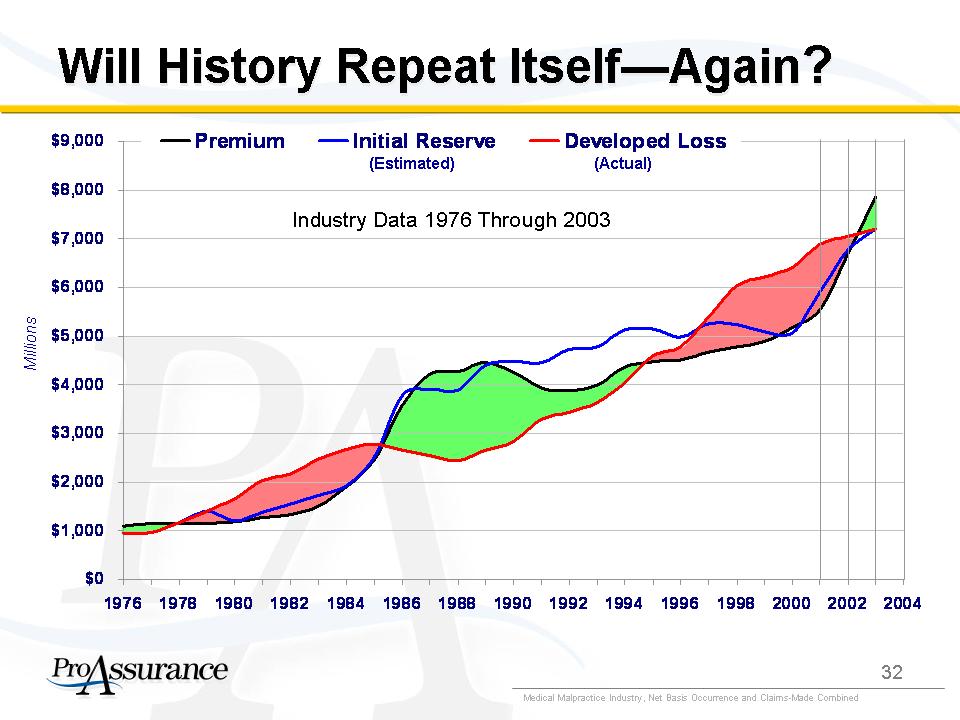 |
Will History Repeat Itself--Again? Industry Data 1976 Through 2003 Millions C/A Yr Premium Initial Reserve Developed Loss 1976 1,100 $950 $950 1977 1,142 $960 $960 1978 1,148 $1,171 $1,171 1979 1,141 $1,398 $1,398 1980 1,184 1,209 1,659 1981 1,268 1,387 2,032 1982 1,333 1,546 2,166 1983 1,509 1,723 2,464 1984 1,911 1,921 2,676 1985 2,448 2,510 2,784 1986 3,574 3,782 2,649 1987 4,212 3,904 2,551 1988 4,281 3,892 2,437 1989 4,461 4,402 2,654 1990 4,256 4,470 2,844 1991 3,935 4,455 3,296 1992 3,879 4,727 3,429 1993 3,991 4,786 3,637 1994 4,360 5,131 4,039 1995 4,477 5,152 4,594 1996 4,514 4,973 4,787 1997 4,668 5,259 5,399 1998 4,775 5,234 6,041 1999 4,893 5,098 6,225 2000 5,180 5,066 6,427 2001 5,538 5,915 6,882 2002 6,709 6,777 7,063 2003 7,863 7,198 7,198 2004 Medical Malpractice Industry, Net Basis Occurrence and Claims-Made Combined ProAssurance 32 |
 |
Will History Repeat Itself--Again? Industry Data 1976 Through 2004 Millions C/A Yr Premium Initial Reserve Developed Loss 1976 1,100 $950 $950 1977 1,142 $960 $960 1978 1,148 $1,171 $1,171 1979 1,141 $1,398 $1,398 1980 1,184 1,209 1,659 1981 1,268 1,387 2,032 1982 1,333 1,546 2,166 1983 1,509 1,723 2,464 1984 1,911 1,921 2,676 1985 2,448 2,510 2,784 1986 3,574 3,782 2,649 1987 4,212 3,904 2,551 1988 4,281 3,892 2,437 1989 4,461 4,402 2,654 1990 4,256 4,470 2,844 1991 3,935 4,455 3,296 1992 3,879 4,727 3,429 1993 3,991 4,786 3,637 1994 4,360 5,131 4,039 1995 4,431 5,152 4,554 1996 4,472 4,973 4,733 1997 4,632 5,259 5,356 1998 4,699 5,234 5,971 1999 4,793 5,098 6,114 2000 5,075 5,066 6,232 2001 5,472 5,915 6,815 2002 6,704 6,777 7,208 2003 7,985 7,198 7,259 2004 8,346 7,049 7,049 Medical Malpractice Industry, Net Basis Occurrence and Claims-Made Combined ProAssurance 33 |
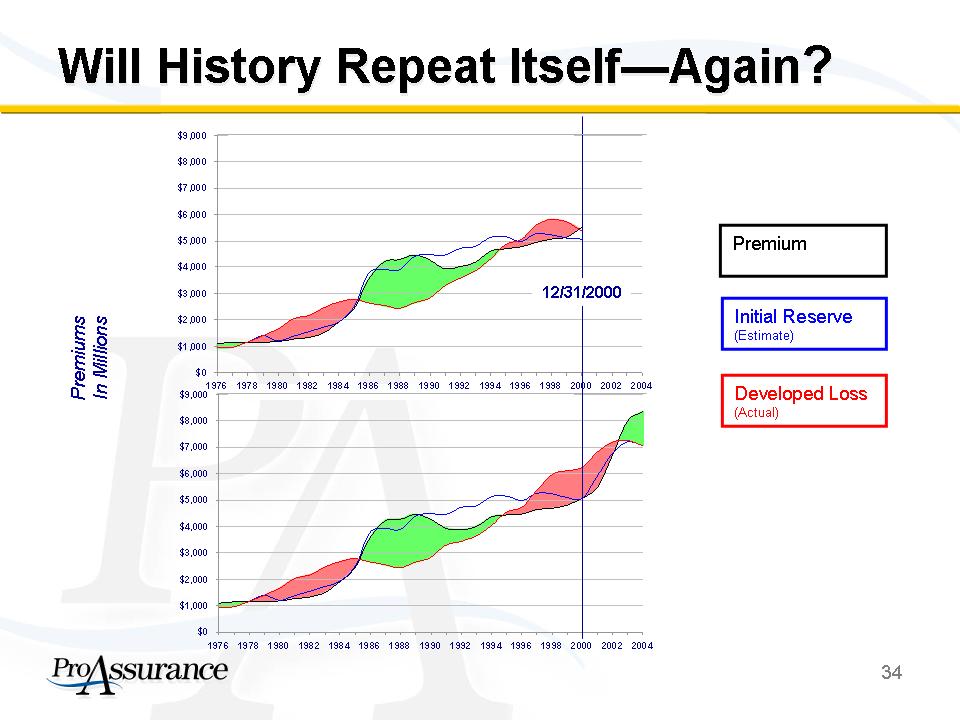 |
Will History Repeat Itself--Again? Premium Initial Reserve (Estimate) Developed Loss (Actual) Premiums In Millions 12/31/2000 ProAssurance 34 |
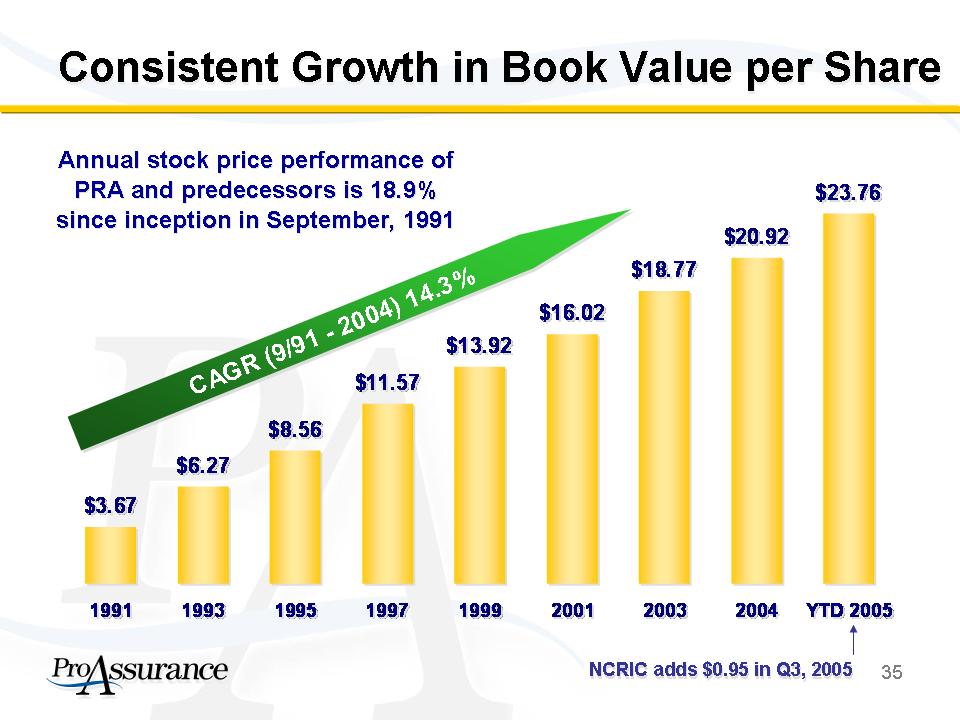 |
Consistent Growth in Book Value per Share Annual stock price performance of PRA and predecessors is 18.9% since inception in September, 1991 CAGR (9/91 - 2004) 14.3% 1991 $3.67 1993 $6.27 1995 $8.56 1997 $11.57 1999 $13.92 2001 $16.02 2003 $18.77 2004 $20.92 YTD 2005 $23.76 NCRIC adds $0.95 in Q3, 2005 ProAssurance 35 |
 |
Consistent Growth in Our Asset Base Total Assets in Millions o Assets Increased Dramatically When ProAssurance Was Created in 2001 1991 $3.67 1993 $6.27 1995 $8.56 1997 $11.57 1999 $13.92 2001 $16.02 2003 $18.77 2004 $20.92 YTD 2005 $23.76 Adds NCRIC At December 31 Each Year, Audited except for YTD 2005 ProAssurance 36 |
 |
EPS Reflect Pricing and Underwriting Actions o Results First Reflect Dramatic Increases in Losses and Loss Costs o Results First Reflect ProAssurance's Pricing and Underwring Discipline Q3, 2001 $0.11 Q1, 2002 $0.14 -$0.18 Q1, 2003 $0.22 Q1, 2004 $0.52 Q1, 2005 $0.71 $0.90 Attributable to One Time Securities Impairment Earnings per Diluted Share ProAssurance 37 |
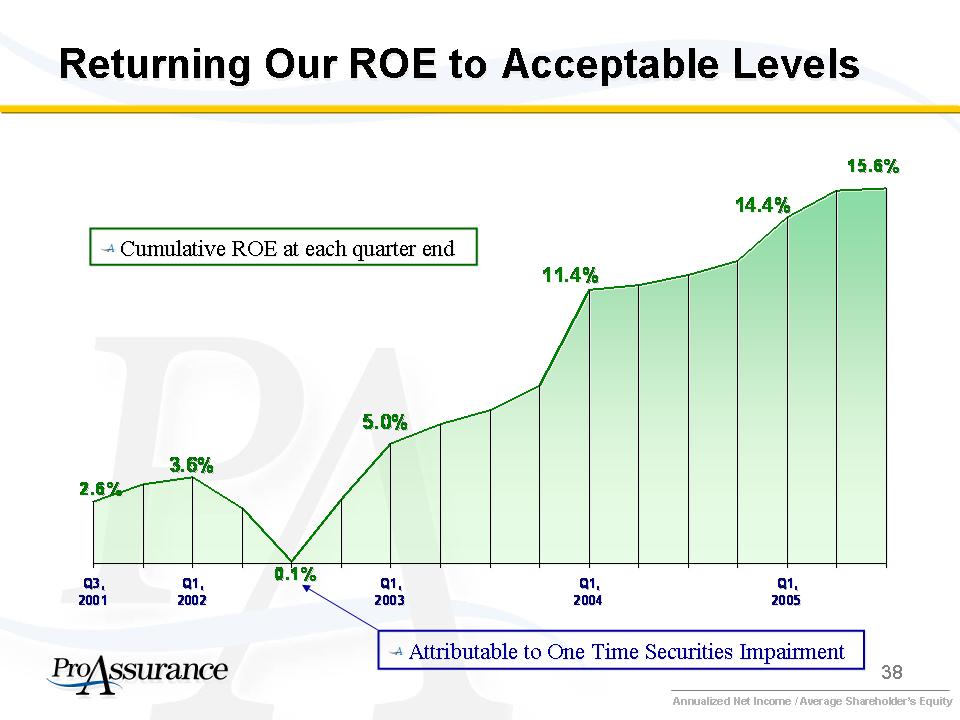 |
Returning Our ROE to Acceptable Levels o Cumulative ROE at each quarter end Q3, 2001 2.6% Q1, 2002 3.6% 0.1% Q1, 2003 5.0% Q1, 2004 11.4% Q1, 2005 14.4% 15.6% o Attributable to One Time Securities Impairment Annualized Net Income / Average Shareholder's Equity ProAssurance 38 |
 |
Our Opportunities o Leader in medical malpractice industry o Organic growth and M&A expansion o Proven platform with regional operating approach o Divesting niche personal lines business in a $400 million transaction o Experienced management team focused on driving returns o Conservative financial position ProAssurance 39 |
 |
Supplemental Financial Data ProAssurance |
 |
High Quality, Liquid Investment Portfolio o Conservative portfolio o No derivatives o Managed by outside advisors o Average fixed maturity duration of 3.9 years o High quality fixed income portfolio o Weighted average rating of "AA" o 98.0% investment grade o Avg. tax-equivalent yield: 5.0% o Net unrealized loss: $0.2 mln o No meaningful hurricane exposure Total = $2.9 billion Cash 5% Other 2% Equities 1% Fixed Securities* 92% September 30, 2005, Unaudited ProAssurance 41 |
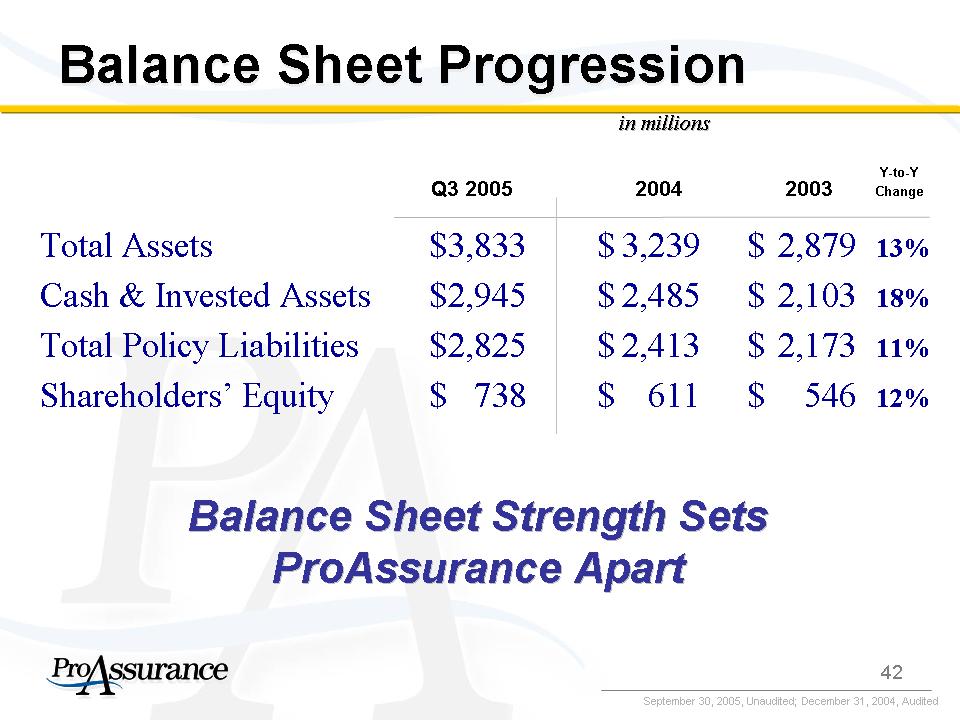 |
Balance Sheet Progression Balance Sheet Strength Sets ProAssurance Apart in millions Y-to-Y Q3 2005 2004 2003 Change Total Assets $ 3,833 $ 3,239 $ 2,879 13% Cash & Invested Assets $ 2,945 $ 2,485 $ 2,103 18% Total Policy Liabilities $ 2,825 $ 2,413 $ 2,173 11% Shareholders' Equity $ 738 $ 611 $ 546 12% September 30, 2005, Unaudited; December 31, 2004, Audited ProAssurance 42 |
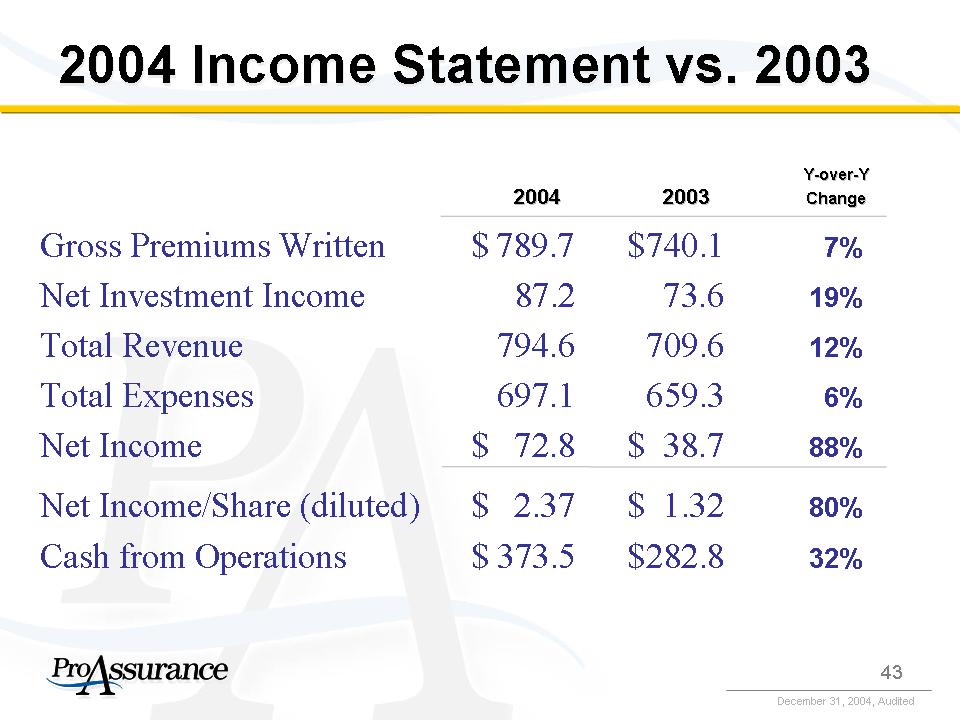 |
2004 Income Statement vs. 2003 Y-over-Y 2004 2003 Change Gross Premiums Written $ 789.7 $ 740.1 7% Net Investment Income 87.2 73.6 19% Total Revenue 794.6 709.6 12% Total Expenses 697.1 659.3 6% Net Income $ 72.8 $ 38.7 88% Net Income/Share (diluted) $ 2.37 $ 1.32 80% Cash from Operations $ 373.5 $ 282.8 32% December 31, 2004, Audited ProAssurance 43 |
 |
YTD Income Statement Comparison in millions, except per share data Y-over-Y 9/30/05 9/30/04 Change Gross Premiums Written $ 601.6 $ 600.3 0% Net Investment Income 76.6 63.2 21% Total Revenue 622.6 582.7 7% Total Expenses 513.4 515.2 0% Net Income $ 78.7 $ 51.3 53% Net Income/Share (diluted) $ 2.49 $ 1.67 49% Cash from Operations $ 282.4 $ 284.8 -1% September 30, 2005, Unaudited ProAssurance 44 |
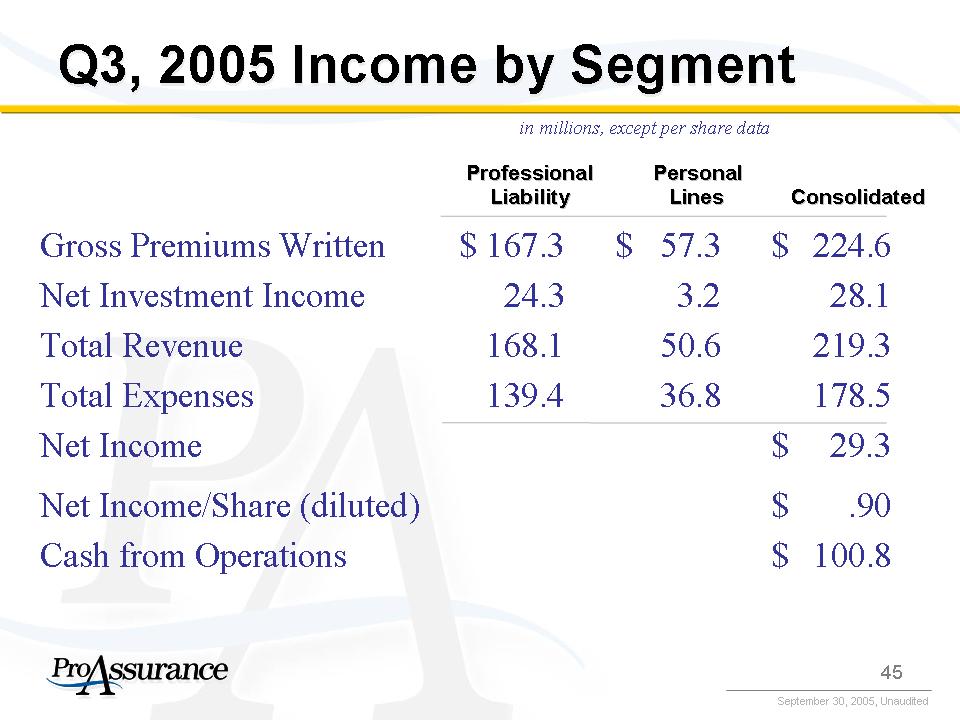 |
Q3, 2005 Income by Segment in millions, except per share data Professional Personal Liability Lines Consolidated Gross Premiums Written $ 167.3 $ 57.3 $ 224.6 Net Investment Income 24.3 3.2 28.1 Total Revenue 168.1 50.6 219.3 Total Expenses 139.4 36.8 178.5 Net Income $ 29.3 Net Income/Share (diluted) $ .90 Cash from Operations $ 100.8 September 30, 2005, Unaudited ProAssurance 45 |