Exhibit 99.1
0 Caution Regarding Forward Looking Statements Caution Regarding Forward Looking Statements This presentation will communicate historical information as well as forward-looking statements that are based upon ourstimates and anticipation of future events that are subject to certain risks and uncertainties
Caution Regarding Forward Looking Statements Caution Regarding Forward Looking Statements This presentation will communicate historical information as well as forward-looking statements that are based upon our estimates and anticipation of future events that are subject to certain risks and uncertainties that could cause actual results to vary materially from the expected results described in the forward-looking statements. The words “anticipate,” “believe,” “estimate,” “expect,” “hope,” “hopeful,” “intend,” “may,” “optimistic,” “preliminary,” “project,” “should,” “will” and similar expressions are intended to identify these forwardlooking statements. There are numerous important factors that could cause our actual results to differ materially from those in the forwardlooking statements. Thus, sentences and phrases that we use to convey our view of future events and trends are expressly designated as forward-looking statements as are sections of this news release clearly identified as giving our outlook on future business. These forwardlooking statements are subject to significant risks, assumptions and uncertainties that could affect the actual outcome of future events. Our results may differ materially from those we expect and discuss in any forward-looking statements. The principal risk factors that may cause these differences are described in various documents we file with the Securities and Exchange Commission, including the Registration Statement filed on February 15, 2006 and updated on June 2, 2006 as well as in our most recent Forms 10K and 10Q. Relating to the transaction with PIC Wisconsin, we add the following specific cautions: The business of ProAssurance and PIC Wisconsin may not be combined successfully, or such combination may take longer to accomplish than expected; the cost savings from the merger may not be fully realized or may take longer to realize than expected; and operating costs, customer loss and business disruption following the merger, including adverse effects on relationships with employees, may be greater than expected. We wish to caution readers not to place undue reliance on any such forward-looking statements, which speak only as of the date made. We do not undertake and specifically decline any obligation to publicly release the result of any revisions that may be made to any forwardlooking statements to reflect events or circumstances after the date of such statements or to reflect the occurrence of anticipated or unanticipated events. Financial data for the medical malpractice segment for all periods prior to June, 2001 reflects Medical Assurance, Inc. data only, except where noted. This presentation will communicate historical information as well as forward-looking statements that are based upon our estimates and anticipation of future events that are subject to certain risks and uncertainties that could cause actual results to vary materially from the expected results described in the forward-looking statements. The words “anticipate,” “believe,” “estimate,” “expect,” “hope,” “hopeful,” “intend,” “may,” “optimistic,” “preliminary,” “project,” “should,” “will” and similar expressions are intended to identify these forwardlooking statements. There are numerous important factors that could cause our actual results to differ materially from those in the forwardlooking statements. Thus, sentences and phrases that we use to convey our view of future events and trends are expressly designated as forward-looking statements as are sections of this news release clearly identified as giving our outlook on future business. These forwardlooking statements are subject to significant risks,
EXHIBIT 99.1
Strategic Overview Strategic Overview Highlights Highlights Professional Liability Specialist Proven Track Record of Planning and Execution Market Leadership 1
EXHIBIT 99.1
Setting The Stage Setting The Stage Specialty insurance focus Growing the top and bottom line through careful growth and effective management Positioned for long-term success Specialty insurance focus Growing the top and bottom line through careful growth and effective management Positioned for long-term success 2001-2005 CAGR: 16.0% 2001-2005 CAGR: 16.0% $396 $462 $543 $577 $573 $267 $289 2001 2002 2003 2004 2005 YTD 2005 YTD 2006 Gross Written Premiums (Continuing Operations, in millions) Gross Written Premiums (Continuing Operations, in millions) 2
EXHIBIT 99.1
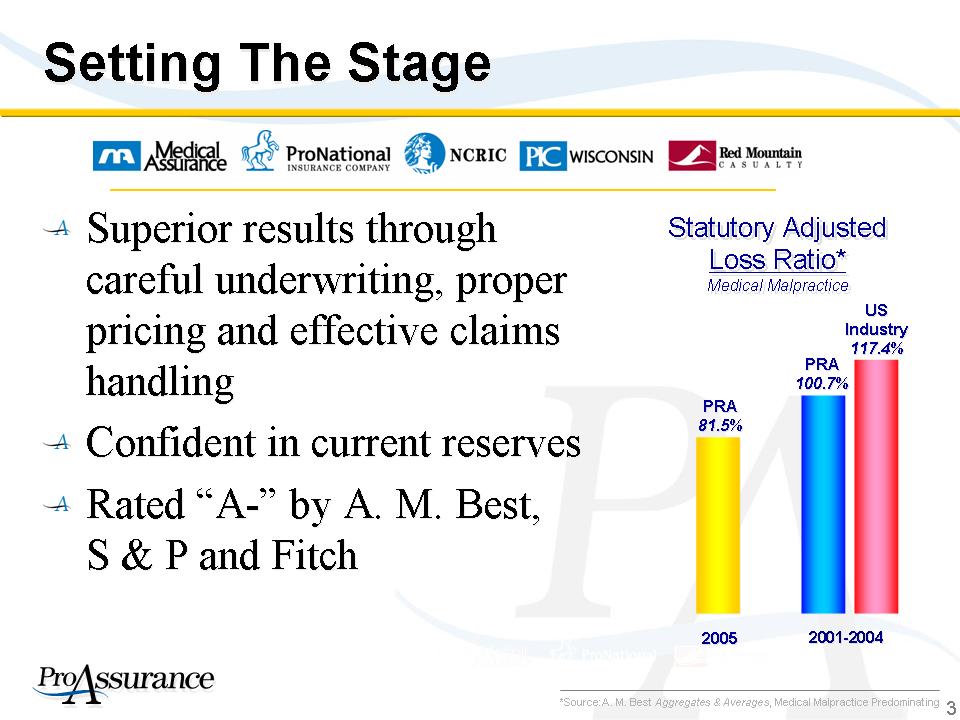
Setting The Stage Setting The Stage Superior results through careful underwriting, proper pricing and effective claims handling Confident in current reserves Rated “A-” by A. M. Best, S & P and Fitch Superior results through careful underwriting, proper pricing and effective claims handling Confident in current reserves Rated “A-” by A. M. Best, S & P and Fitch 2001-2004 2001-2004 Statutory Adjusted Loss Ratio* Medical Malpractice Statutory Adjusted Loss Ratio* Medical Malpractice *Source:A. M. Best Aggregates & Averages, Medical Malpractice Predominating US Industry 117.4% US Industry 117.4% PRA 100.7% PRA 100.7% PRA 81.5% PRA 81.5% 2005 3
EXHIBIT 99.1
Setting The Stage Setting The Stage Nation’s fourth largest writer of medical liability Insuring over 31,500 policyholders* More than 24,000 physicians PIC Wisconsin adds almost 11,000 policyholders* More than 7,500 physicians Retention at 87% YTD 2006 NCRIC and new insureds balance out non-renewals Nation’s fourth largest writer of medical liability Insuring over 31,500 policyholders* More than 24,000 physicians PIC Wisconsin adds almost 11,000 policyholders* More than 7,500 physicians Retention at 87% YTD 2006 NCRIC and new insureds balance out non-renewals 4
EXHIBIT 99.1
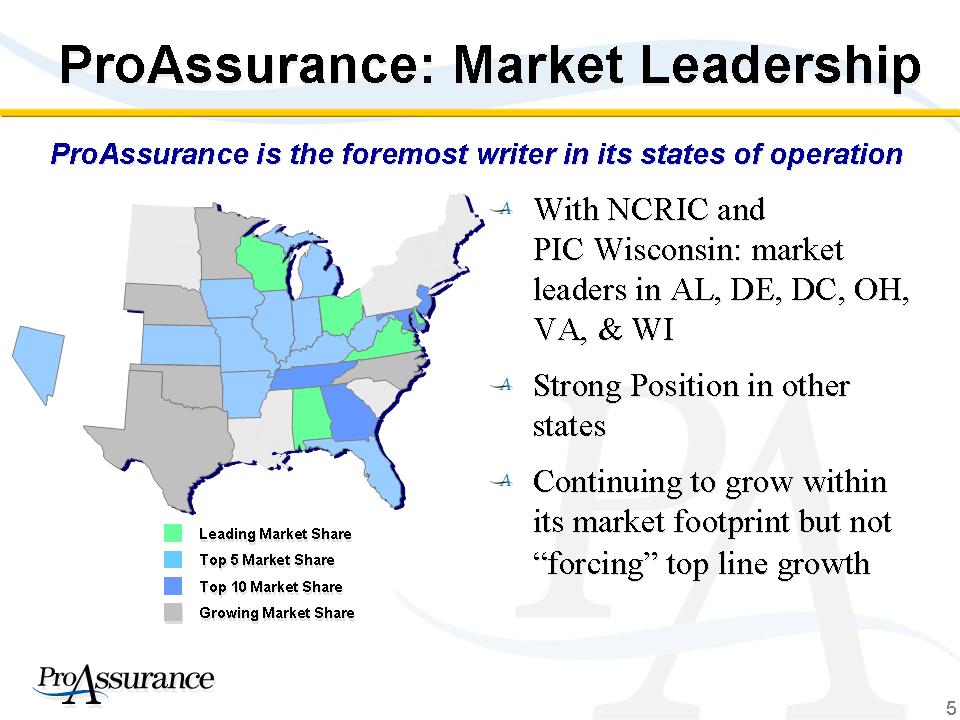
5 ProAssurance is the foremost writer in its states of operation ProAssurance is the foremost writer in its states of operation ProAssurance: Market Leadership ProAssurance: Market Leadership With NCRIC and PIC Wisconsin: market leaders in AL, DE, DC, OH, VA, & WI Strong Position in other states Continuing to grow within its market footprint but not “forcing” top line growth With NCRIC and PIC Wisconsin: market leaders in AL, DE, DC, OH, VA, & WI Strong Position in other states Continuing to grow within its market footprint but not “forcing” top line growth • Leading Market Share Leading Market Share Top 5 Market Share Top 5 Market Share Top 10 Market Share Top 10 Market Share Growing Market Share Growing Market Share
EXHIBIT 99.1
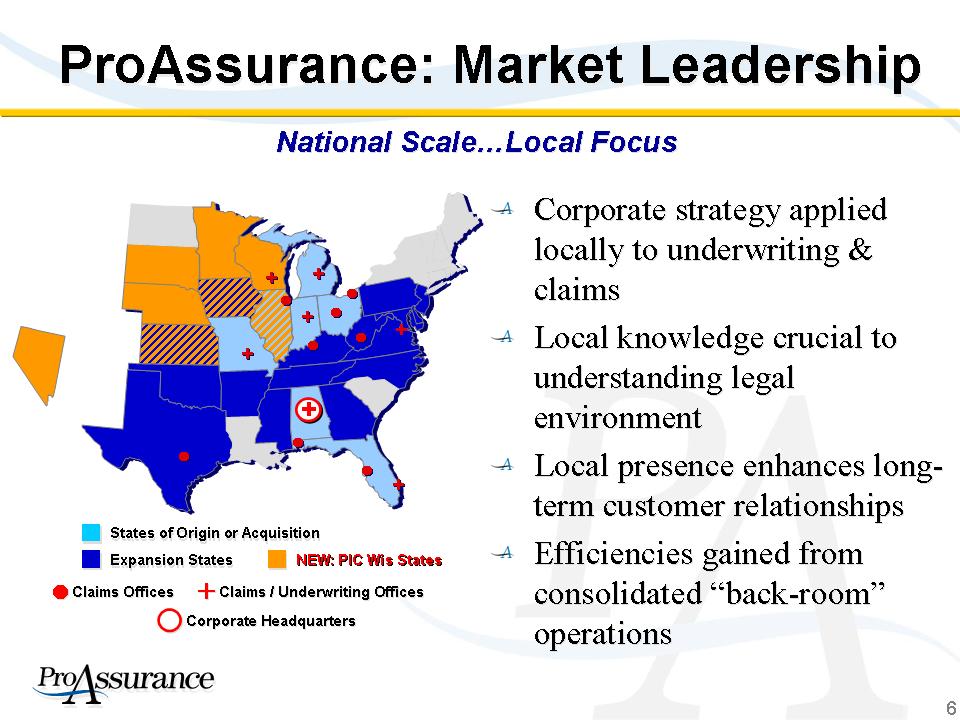
ProAssurance: Market Leadership Corporate strategy applied locally to underwriting & claims Local knowledge crucial to understanding legal environment Local presence enhances longterm customer relationships Efficiencies gained from consolidated “back-room” operations Corporate strategy applied locally to underwriting & claims Local knowledge crucial to understanding legal environment Local presence enhances longterm customer relationships Efficiencies gained from consolidated “back-room” operations Corporate Headquarters Corporate Headquarters States of Origin or Acquisition States of Origin or Acquisition Expansion States Expansion States •Claims Offices Claims Offices Claims / Underwriting Offices Claims / Underwriting Offices + NEW: PIC Wis States NEW: PIC Wis States • • + • • + • • + • • • + + • + + National Scale…Local Focus National Scale…Local Focus 6
EXHIBIT 99.1
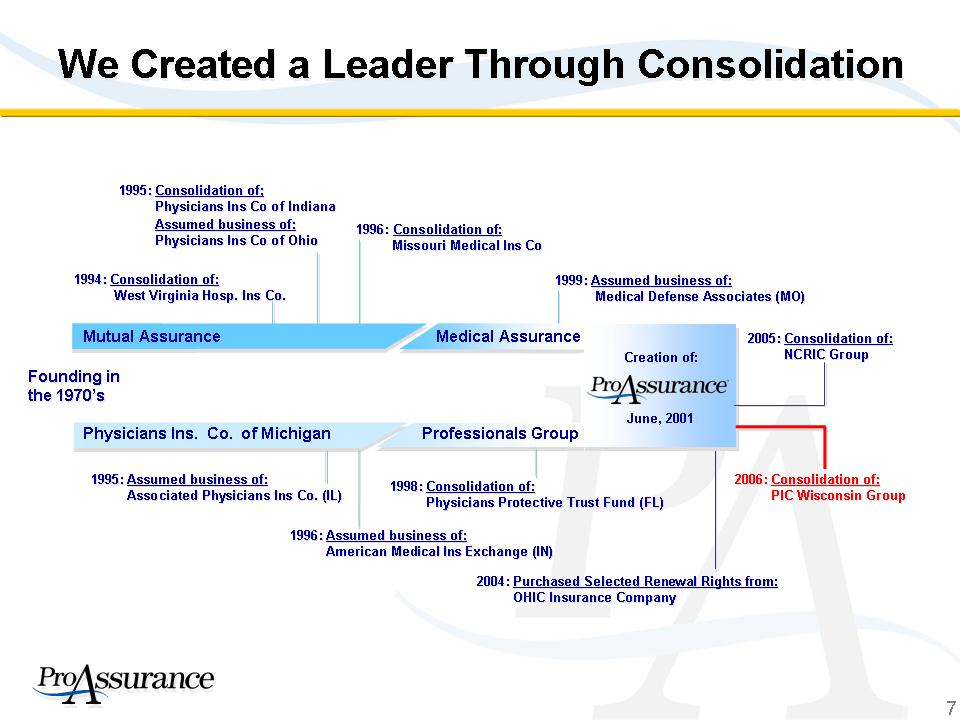
We Created a Leader Through Consolidation We Created a Leader Through Consolidation 1994:Consolidation of: West Virginia Hosp. Ins Co. 1994:Consolidation of: West Virginia Hosp. Ins Co. 1995:Consolidation of; Physicians Ins Co of Indiana Assumed business of: Physicians Ins Co of Ohio 1995:Consolidation of; Physicians Ins Co of Indiana Assumed business of: Physicians Ins Co of Ohio 1996: Consolidation of: Missouri Medical Ins Co 1996: Consolidation of: Missouri Medical Ins Co 1995:Assumed business of: Associated Physicians Ins Co. (IL) 1995:Assumed business of: Associated Physicians Ins Co. (IL) 1998:Consolidation of: Physicians Protective Trust Fund (FL) 1998:Consolidation of: Physicians Protective Trust Fund (FL) 1996:Assumed business of: American Medical Ins Exchange (IN) 1996:Assumed business of: American Medical Ins Exchange (IN) Founding in the 1970’s Founding in the 1970’s 1999:Assumed business of: Medical Defense Associates (MO) 1999:Assumed business of: Medical Defense Associates (MO) Mutual Assurance Physicians Ins. Co. of Michigan Professionals Group Creation of: June, 2001 Creation of: June, 2001 2005:Consolidation of: NCRIC Group 2005:Consolidation of: NCRIC Group Medical Assurance Medical Assurance 2006: Consolidation of: PIC Wisconsin Group 2006:Consolidation of: PIC Wisconsin Group 2004:Purchased Selected Renewal Rights from: OHIC Insurance Company 2004: 7
EXHIBIT 99.1
8 Experienced & Integrated at the Top Experienced & Integrated at the Top 14 2 Chief Financial Officer Ned Rand Years in Industry Years at Company Position Name 23 17 Average 22 12 Liability Group President / Chief Claims Officer Darryl Thomas 19 19 Sr. Vice President / IR Frank O'Neil 22 22 Chief Accounting Officer James Morello 26 10 Liability Group President / Chief Underwriting Officer Howard Friedman 27 27 Vice Chairman Paul Butrus 22 8 Chief Marketing Officer Jeff Bowlby 26 21 President & COO Victor Adamo 29 29 Chairman & CEO Derrill Crowe, M.D. Joined PRA from Medical Assurance Joined PRA after merger Joined PRA From Professionals Group Our Team Understands Integration Officers, Directors & Employees Own 10% of ProAssurane 8
EXHIBIT 99.1
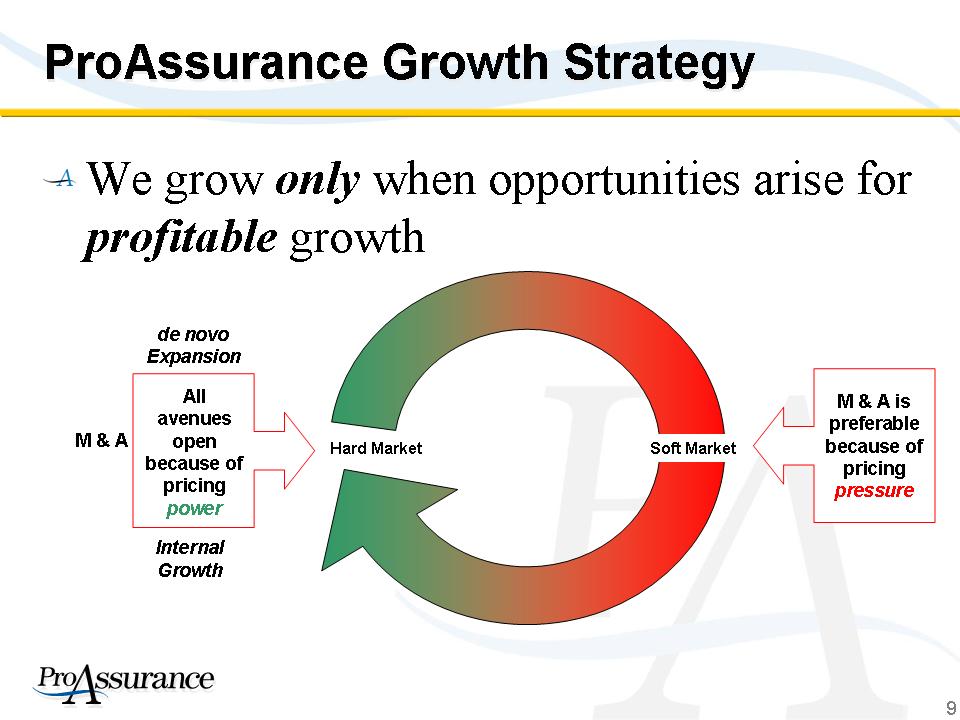
ProAssurance Growth Strategy We grow only when opportunities arise for profitable growth Hard Market Soft Market M & A de novo Expansion Internal Growth M & A is preferable because of pricing pressure All avenues open because of pricing power 9
EXHIBIT 99.1
ProAssurance Growth Strategy ProAssurance Growth Strategy We must have a strategic fit in medical liability Doctor-founded companies with similar culture The legal and regulatory environment must be favorable Understanding why companies are available Not all M&A opportunities should be pursed We don’t “bet the farm” and can acquire without “breaking the bank” Stock trading at ~1.75x book value Cash flow remains strong We must have a strategic fit in medical liability Doctor-founded companies with similar culture The legal and regulatory environment must be favorable Understanding why companies are available Not all M&A opportunities should be pursed We don’t “bet the farm” and can acquire without “breaking the bank” Stock trading at ~1.75x book 10
EXHIBIT 99.1
Focusing on Success in 2006 Focus on adequate pricing, strict underwriting and claims defense Focus on profitable states in an evolving market Taking advantage of our geographic diversification 2006 is a pivotal year in evaluating frequency and severity data Focus on adequate pricing, strict underwriting and claims defense Focus on profitable states in an evolving market Taking advantage of our geographic diversification 2006 is a pivotal year in evaluating frequency and severity data 11
EXHIBIT 99.1
Operational Overview Operational Overview Highlights Highlights Operational Discipline Across all Stages of the Insurance Cycle Operational
EXHIBIT 99.1
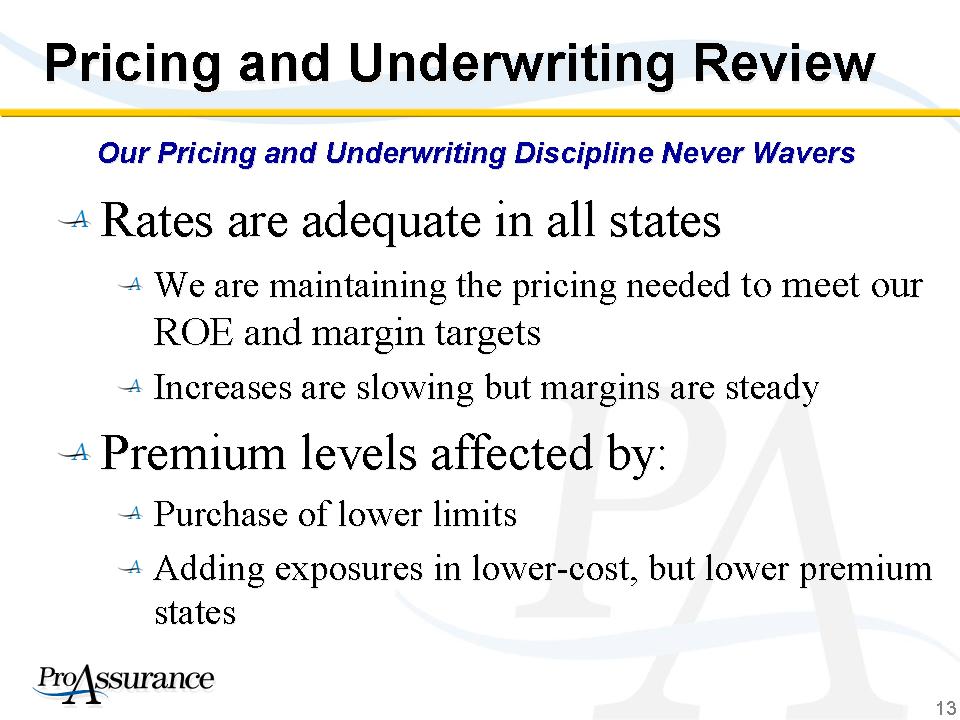
13 Pricing and Underwriting Review Pricing and Underwriting Review Rates are adequate in all states We are maintaining the pricing needed to meet our ROE and margin targets Increases are slowing but margins are steady Premium levels affected by: Purchase of lower limits Adding exposures in lower-cost, but lower premium states Rates are adequate in all states We are maintaining the pricing needed to meet our ROE and margin targets Increases are slowing but margins are steady Premium levels affected by: Purchase of lower limits Adding exposures in lower-cost, but lower premium Our Pricing and Underwriting Discipline Never Wavers 13
EXHIBIT 99.1
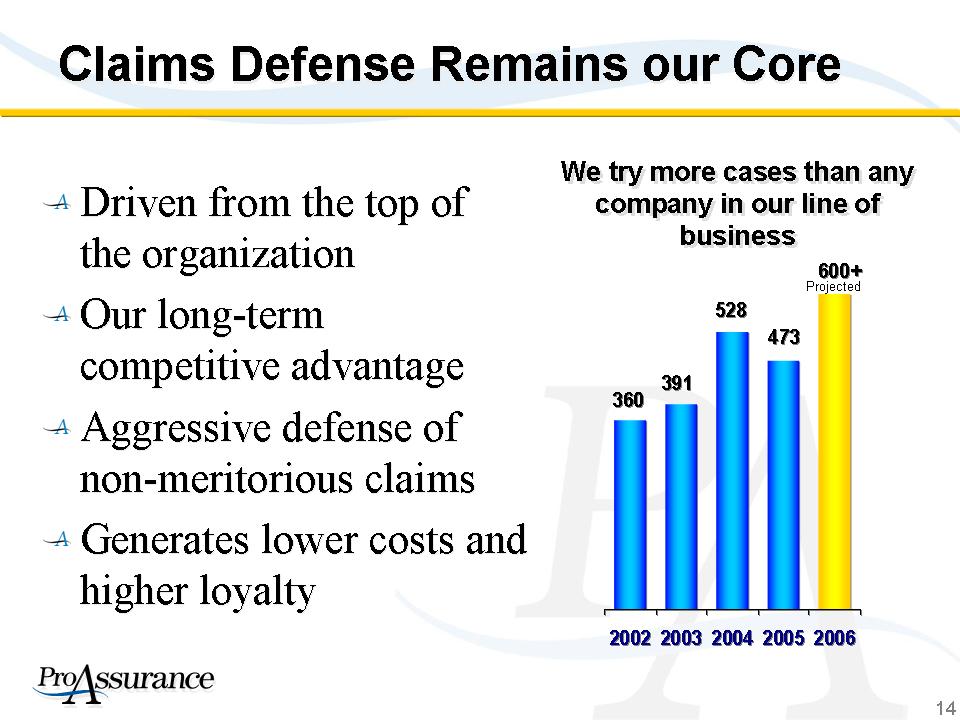
Claims Defense Remains our Core Claims Defense Remains our Core Driven from the top of the organization Our long-term competitive advantage Aggressive defense of non-meritorious claims Generates lower costs and higher loyalty Driven from the top of the organization Our long-term competitive advantage Aggressive defense of non-meritorious claims Generates lower costs and higher loyalty 600 473 528 391 360 2002 2003 2004 2005 2006 + 600 473 528 391 360 2002 2003 2004 2005 2006 + We try more cases than any company in our line of business We try more cases than any company in our line of business Projected 14
EXHIBIT 99.1
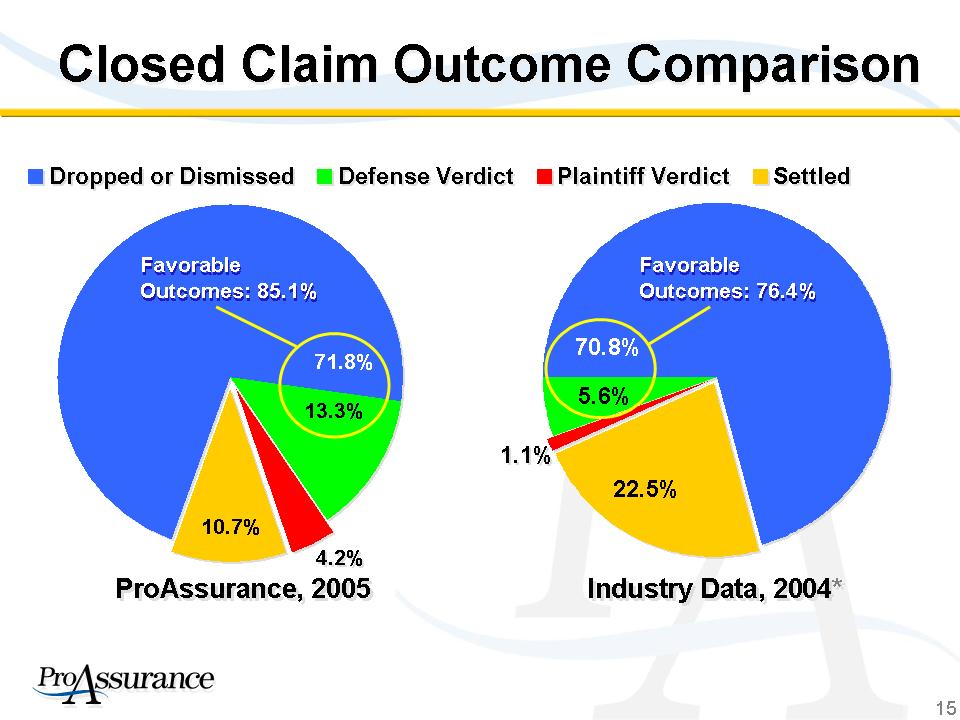
Closed Claim Outcome Comparison Closed Claim Outcome Comparison 13.3% 4.2% 10.7% 71.8% Dropped or Dismissed Defense Verdict Plaintiff Verdict Settled 13.3% 4.2% 10.7% 71.8% Dropped or Dismissed Defense Verdict Plaintiff Verdict Settled 22.5% 1.1% 5.6% 70.8% 22.5% 1.1% 5.6% 70.8% Favorable Outcomes: 85.1% Favorable Outcomes: 85.1% Favorable Outcomes: 76.4% Favorable Outcomes: 76.4% ProAssurance, 2005 Industry Data, 2004* ProAssurance, 2005 Industry Data, 2004* 15
EXHIBIT 99.1
Four-Year Loss Ratio Comparisons Our ability and willingness to defend claims allows us to achieve better results Our ability and willingness to defend claims allows us to achieve better results 47.5% 81.5% 56.6% 53.1% 35.9% 24.9% 56.6% 53.1% 35.9% Average Statutory Loss Ratio 2001-2004 Average Statutory Loss Ratio 2001-2004 US Industry 117.4% US Industry 117.4% Legal Payments Legal Payments Loss Payments 16
EXHIBIT 99.1
Financial Overview Highlights Highlights Ongoing Earnings Power Balance Sheet Strength Ongoing 17
EXHIBIT 99.1
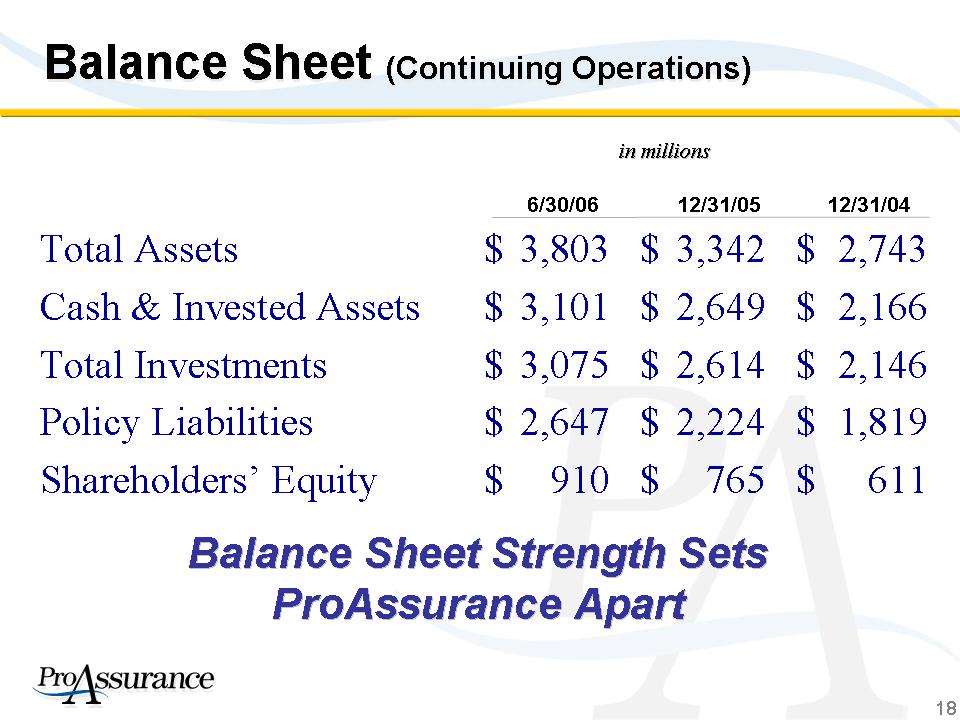
Balance Sheet (Continuing Operations) Balance Sheet (Continuing Operations) Total Assets $ 3,803 $ 3,342 $ 2,743 Cash & Invested Assets $ 3,101 $ 2,649 $ 2,166 Total Investments $ 3,075 $ 2,614 $ 2,146 Policy Liabilities $ 2,647 $ 2,224 $ 1,819 Shareholders’ Equity $ 910 $ 765 $ 611 in millions in millions 6/30/06 12/31/05 12/31/04 Balance Sheet Strength Sets ProAssurance Apart 18
EXHIBIT 99.1
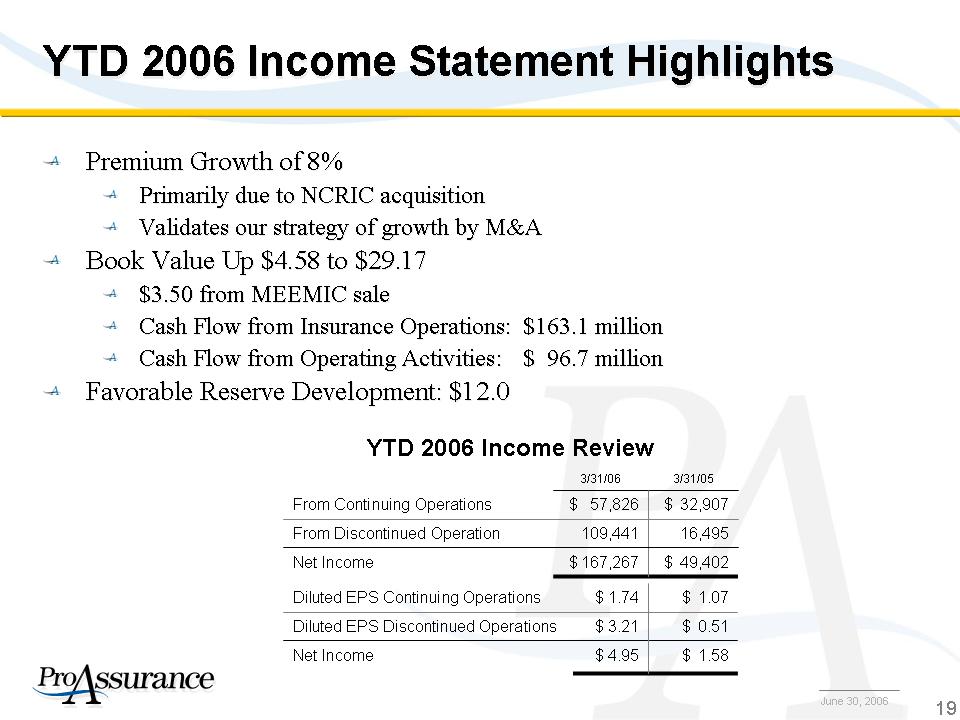
YTD 2006 Income Statement Highlights YTD 2006 Income Statement Highlights Premium Growth of 8% Primarily due to NCRIC acquisition Validates our strategy of growth by M&A Book Value Up $4.58 to $29.17 $3.50 from MEEMIC sale Cash Flow from Insurance Operations: $163.1 million Cash Flow from Operating Activities: $ 96.7 million Favorable Reserve Development: $12.0 Premium Growth of 8% Primarily due to NCRIC acquisition Validates our strategy of growth by M&A Book Value Up $4.58 to $29.17 $3.50 from MEEMIC sale Cash Flow from Insurance Operations: $163.1 million Cash Flow from Operating Activities: $ 96.7 million Favorable Reserve Development: $12.0 June 30, 2006 3/31/05 3/31/06 $ 49,402 $ 167,267 Net Income 16,495 109,441 From Discontinued Operation $ 32,907 $ 57,826 From Continuing Operations YTD 2006 Income Review $ 1.58 $ 4.95 Net Income $ 0.51 $ 3.21 Diluted EPS Discontinued Operations $ 1.07 $ 1.74 Diluted EPS Continuing Operations 19
EXHIBIT 99.1
Focused on Shareholder Return Focused on Shareholder Return Five-year return to shareholders: 179% Annualized five-year return: 22.8% Steady increase in Return on Equity Created more than $1 billion in shareholder value Built Book Value per Share even as interest rates have risen Management incentives aligned with shareholders’ interests Five-year return to shareholders: 179% Annualized five-year return: 22.8% Steady increase in Return on Equity Created more than $1 billion in shareholder value Built Book Value per Share even as interest rates have risen Management incentives aligned with shareholders’ interests Since the formation of ProAssurance / (7/1/2001—6/30/2006) Since the formation of ProAssurance / (7/1/2001—6/30/2006) 20
EXHIBIT 99.1
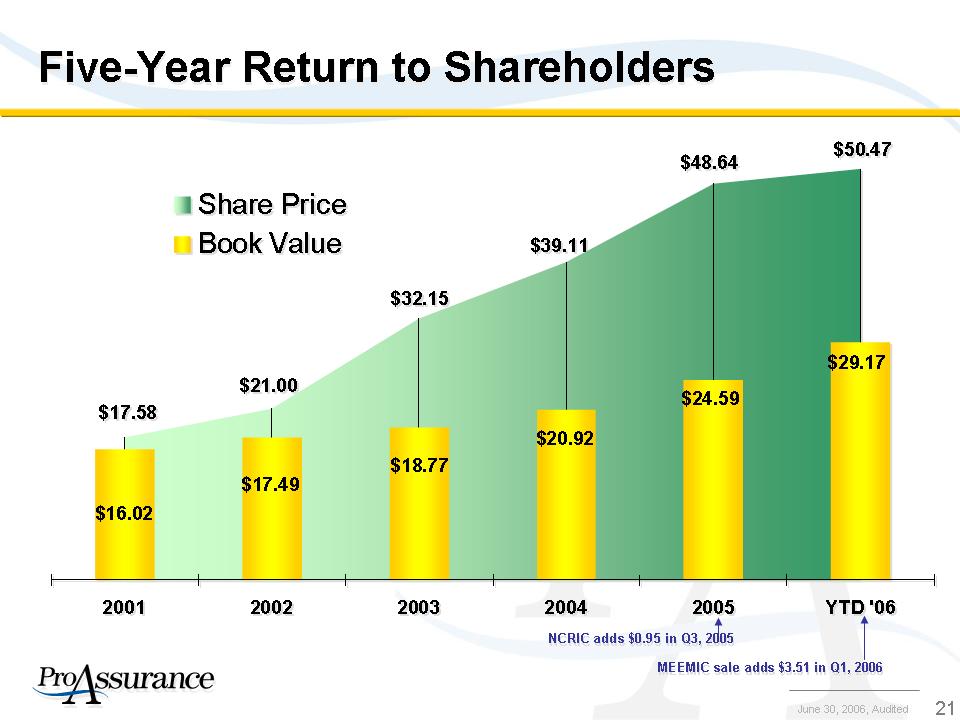
Five-Year Return to Shareholders Five-Year Return to Shareholders $17.58 $21.00 $32.15 $39.11 $48.64 $50.47 $29.17 $24.59 $20.92 $18.77 $17.49 $16.02 2001 2002 2003 2004 2005 YTD '06 Share Price Book Value $17.58 $21.00 $ 2004 2005 YTD '06 Share Price Book Value NCRIC adds $0.95 in Q3, 2005 NCRIC adds $0.95 in Q3, 2005 June 30, 2006, Audited MEEMIC sale adds $3.51 in Q1, 2006 21
EXHIBIT 99.1
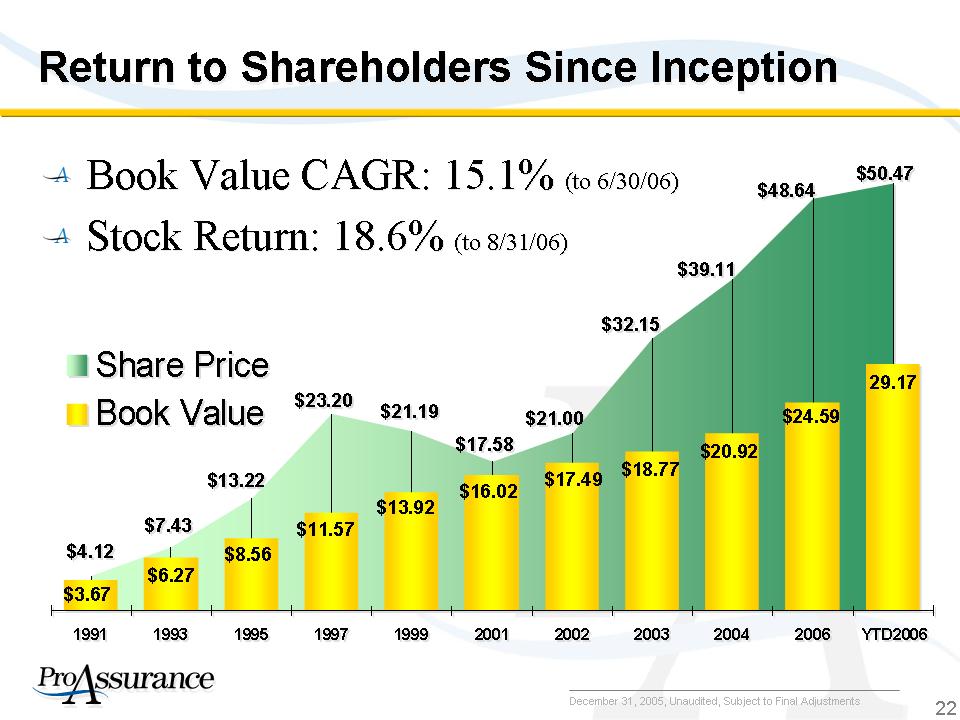
Return to Shareholders Since Inception $21.00 $32.15 $39.11 $48.64 $50.47 $4.12 $7.43 $13.22 $23.20 $21.19 $17.58 29.17 $24.59 $20.92 $18.77 $17.49 $16.02 $13.92 $11.57 $8.56 $6.27 $3.67 1991 1993 1995 1997 1999 2001 2002 2003 2004 2006 YTD2006 Share Price Book Value $21.00 $32.15 $39.11 $48.64 $50.47 $4.12 $7.43 $13.22 $23.20 $21.19 $17.58 29.17 $24.59 $20.92 $18.77 $17.49 $16.02 $13.92 $11.57 $8.56 $6.27 $3.67 1991 1993 1995 1997 1999 2001 2002 2003 2004 2006 YTD2006 Share Price Book Value December 31, 2005, Unaudited, Subject to Final Adjustments Book Value CAGR: 15.1% (to 6/30/06) Stock Return: 18.6% (to 8/31/06) Book Value CAGR: 15.1% (to 6/30/06) Stock 22
EXHIBIT 99.1
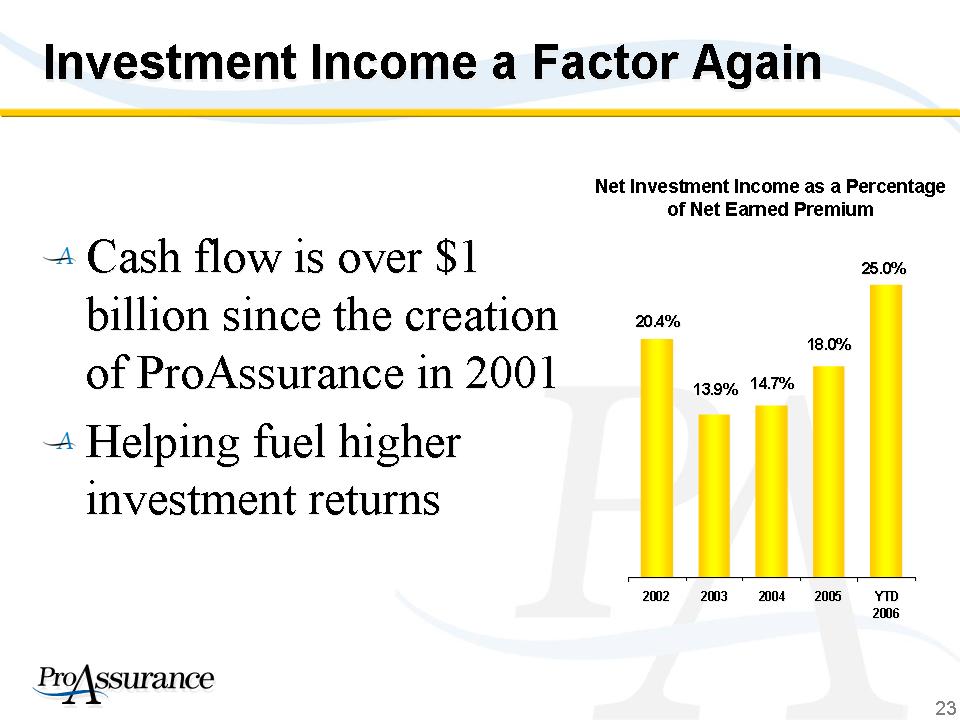
Investment Income a Factor Again Investment Income a Factor Again Cash flow is over $1 billion since the creation of ProAssurance in 2001 Helping fuel higher investment returns Cash flow is over $1 billion since the creation of ProAssurance in 2001 Helping fuel higher investment returns Net Investment Income as a Percentage of Net Earned Premium 14.7% 18.0% 25.0% 13.9% 20.4% 2002 2003 2004 2005 YTD 2006 14.7% 18.0% 25.0% 13.9% 20.4% 2002 2003 2004 2005 YTD 2006 23
EXHIBIT 99.1
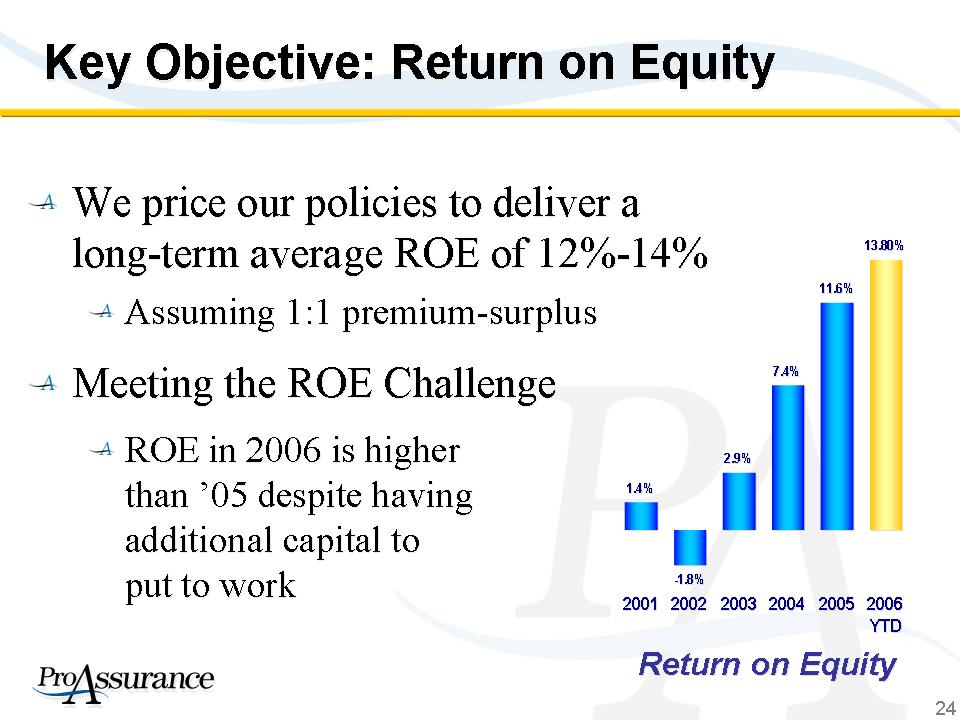
Key Objective: Return on Equity Key Objective: Return on Equity We price our policies to deliver a long-term average ROE of 12%-14% Assuming 1:1 premium-surplus Meeting the ROE Challenge ROE in 2006 is higher than ’05 despite having additional capital to put to work We price our policies to deliver a long-term average ROE of 12%-14% Assuming 1:1 premium-surplus Meeting the ROE Challenge ROE in 2006 is higher than ’05 despite having additional capital to put to work -1.8% 7.4% 11.6% 13.80% 2.9% 1.4% 2001 2002 2003 2004 2005 2006 YTD -1.8% 7.4% 11.6% 13.80% 2.9% 1.4% 2001 2002 2003 2004 2005 2006 YTD Return on Equity 24
EXHIBIT 99.1
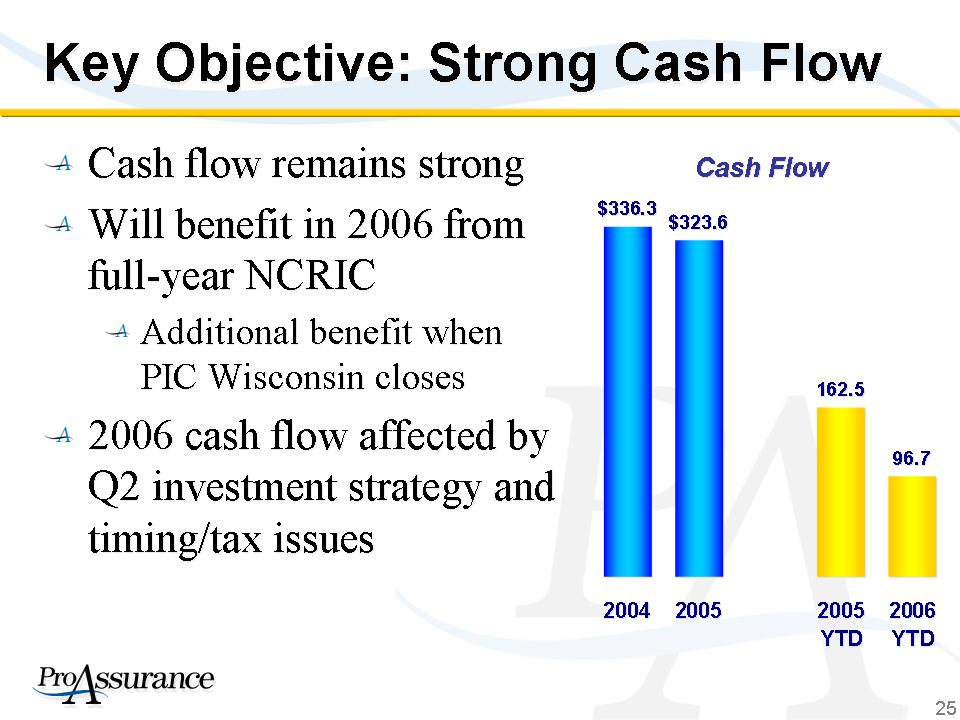
Key Objective: Strong Cash Flow Key Objective: Strong Cash Flow Cash flow remains strong Will benefit in 2006 from full-year NCRIC Additional benefit when PIC Wisconsin closes 2006 cash flow affected by Q2 investment strategy and timing/tax issues Cash flow remains strong Will benefit in 2006 from full-year NCRIC Additional benefit when PIC Wisconsin closes 2006 cash flow affected by Q2 investment strategy and timing/tax issues $323.6 162.5 96.7 $336.3 2004 2005 2005 YTD 2006 YTD 25
EXHIBIT 99.1
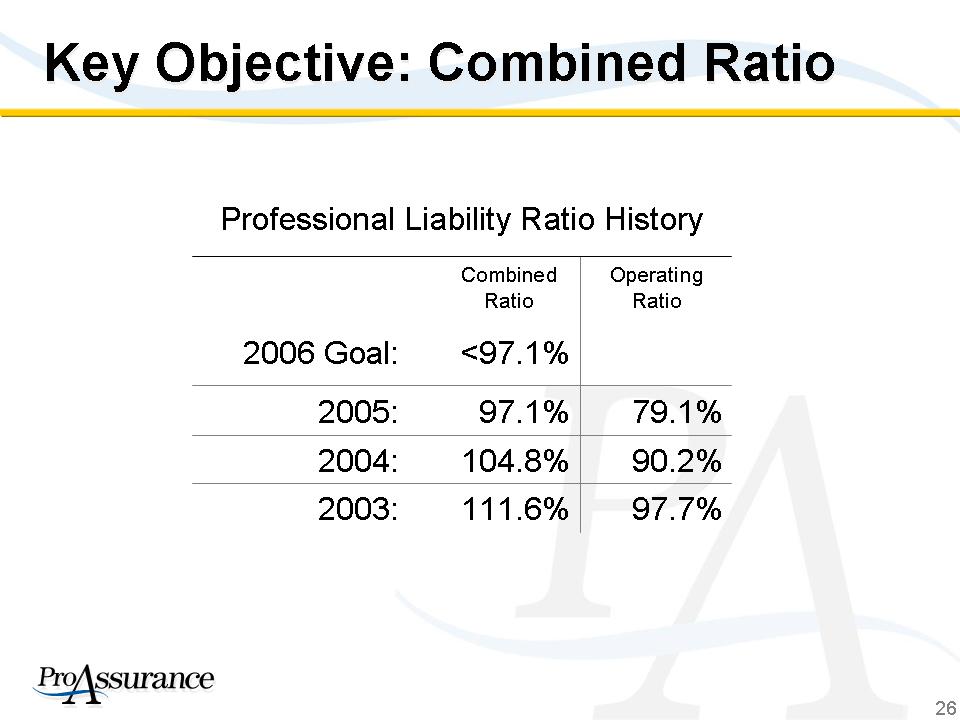
Key Objective: Combined Ratio Key Objective: Combined Ratio <97.1% 2006 Goal: 79.1% 97.1% 2005: Professional Liability Ratio History 97.7% 111.6% 2003: 90.2% 104.8% 2004: Operating Ratio Combined Ratio 26
EXHIBIT 99.1
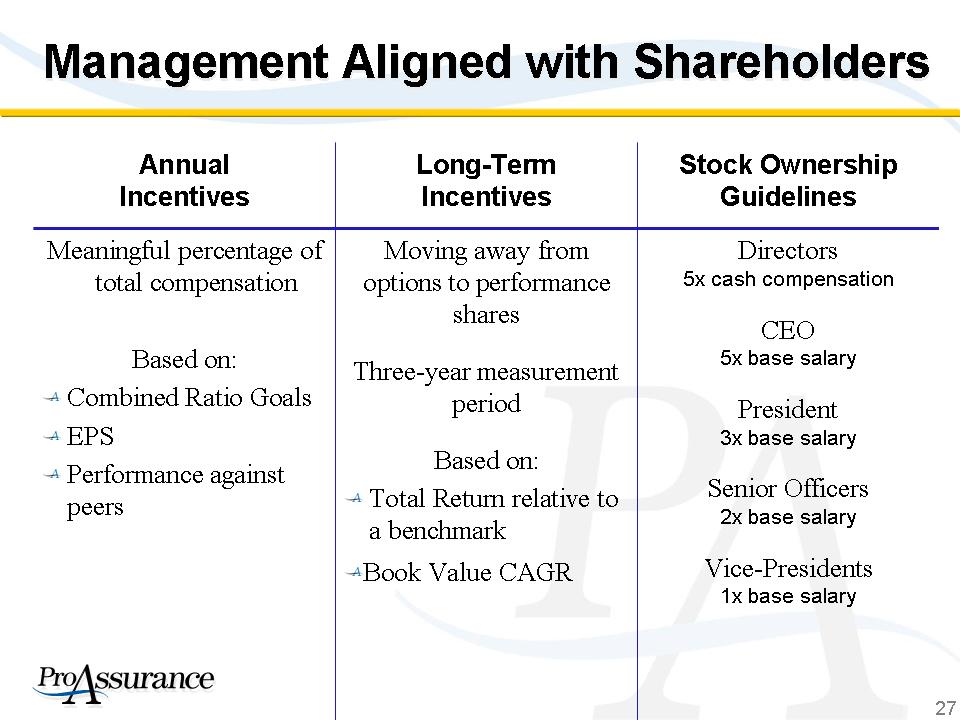
Management Aligned with Shareholders Management Aligned with Shareholders Book Value CAGR Based on: Total Return relative to a benchmark Three-year measurement period Directors 5x cash compensation CEO 5x base salary President 3x base salary Senior Officers 2x base salary Vice-Presidents 1x base salary Moving away from options to performance shares Meaningful percentage of total compensation Based on: Combined Ratio Goals EPS Performance against peers Stock Ownership Guidelines Long-Term Incentives Annual Incentives 27
EXHIBIT 99.1
Playing to Our Strengths Playing to Our Strengths Successful track record of market leadership We plan, execute and deliver Our plan for the future Proven platform with regional operating approach Organic growth and M&A expansion Our experienced and invested management team is focused on driving returns Successful track record of market leadership We plan, execute and deliver Our plan for the future Proven platform with regional operating approach Organic growth and M&A expansion Our experienced and invested management team is focused on driving returns 28
EXHIBIT 99.1
Supplemental Data Supplemental 29
EXHIBIT 99.1
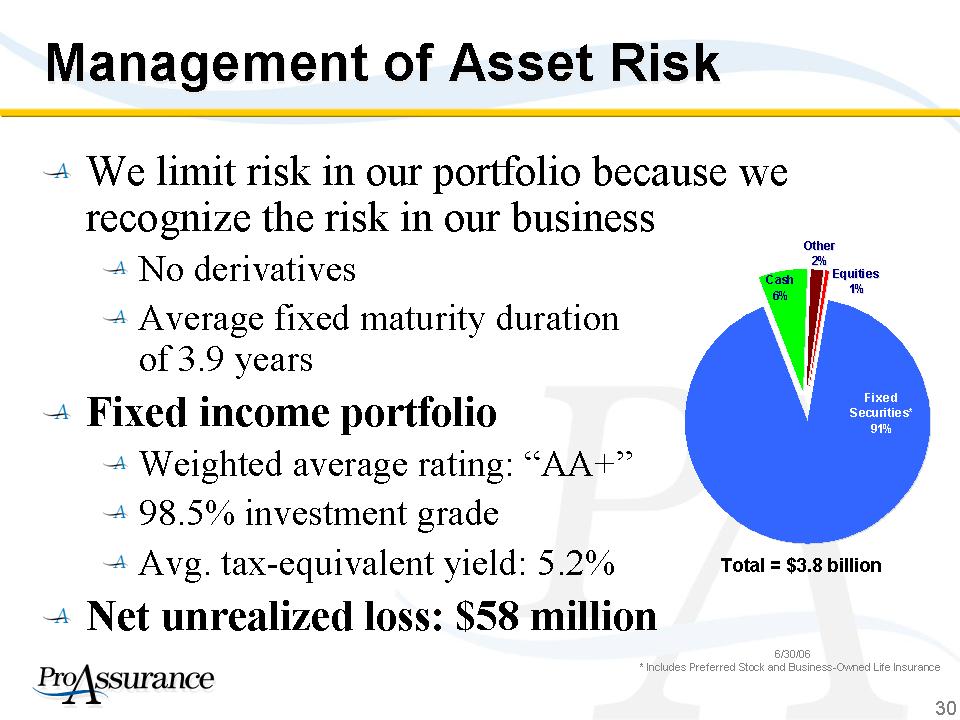
Management of Asset Risk We limit risk in our portfolio because we recognize the risk in our business No derivatives Average fixed maturity duration of 3.9 years Fixed income portfolio Weighted average rating: “AA+” 98.5% investment grade Avg. tax-equivalent yield: 5.2% Net unrealized loss: $58 million 6/30/06 * Includes Preferred Stock and Business-Owned Life Insurance Cash 6% Equities 1% Other 2% Fixed Securities* 91% Cash 6% Equities 1% Other 2% Fixed Securities* 91% Total = $3.8 billion 30
EXHIBIT 99.1
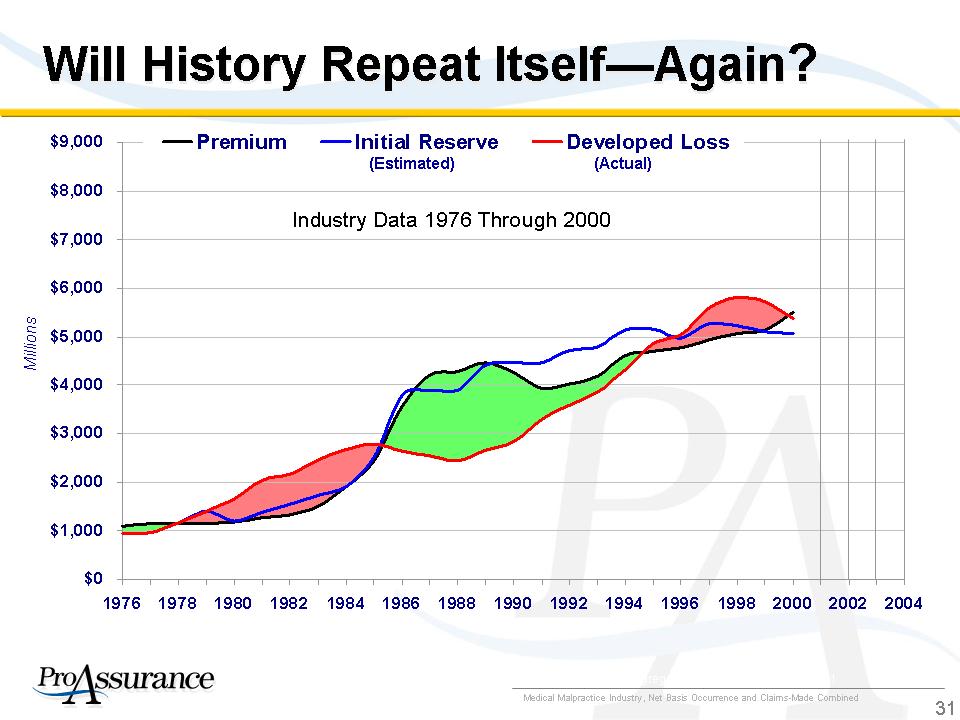
Will History Repeat Itself—Again? $0 $1,000 $2,000 $3,000 $4,000 $5,000 $6,000 $7,000 $8,000 $9,000 1976 1978 1980 1982 1984 1986 1988 1990 1992 1994 1996 1998 2000 2002 2004 Premium Initial Reserve Developed Loss Millions Source: A. M. Best Aggregates and Averages 1976 - 2001 Medical Malpractice Industry, Net Basis Occurrence and Claims-Made Combined Industry Data 1976 Through 2000 (Estimated) (Actual) 31
EXHIBIT 99.1
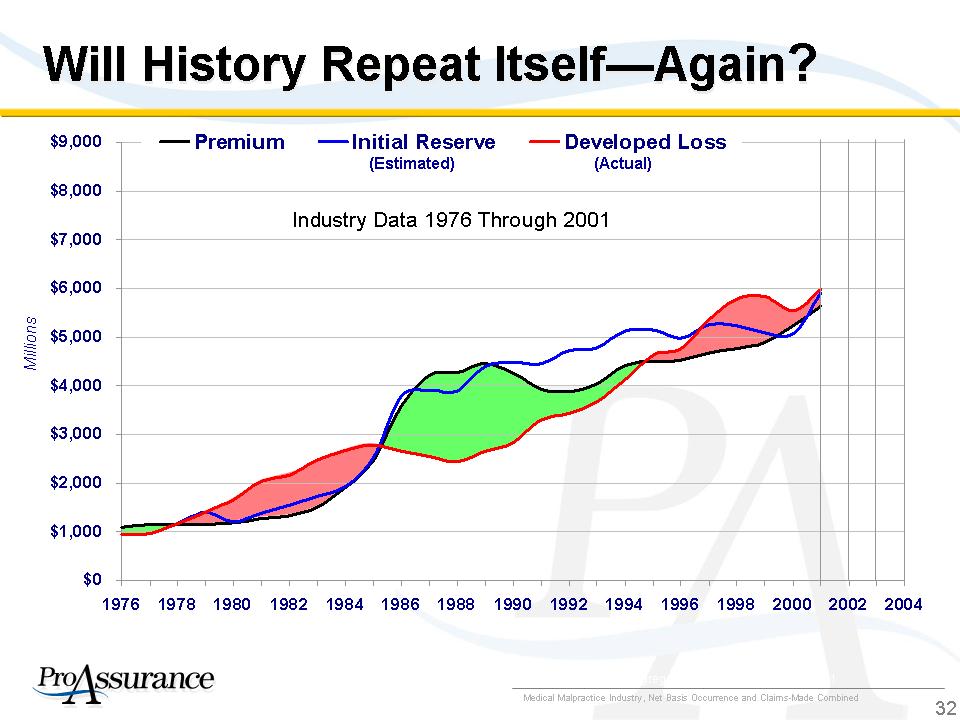
Will History Repeat Itself—Again? Will History Repeat Itself—Again? $0 $1,000 $2,000 $3,000 $4,000 $5,000 $6,000 $7,000 $8,000 $9,000 1976 1978 1980 1982 1984 1986 1988 1990 1992 1994 1996 1998 2000 2002 2004 Premium Initial Reserve Developed Loss Millions Source: A. M. Best Aggregates and Averages 1976 - 2001 Medical Malpractice Industry, Net Basis Occurrence and Claims-Made Combined Industry Data 1976 Through 2001 (Estimated) (Actual) 32
EXHIBIT 99.1
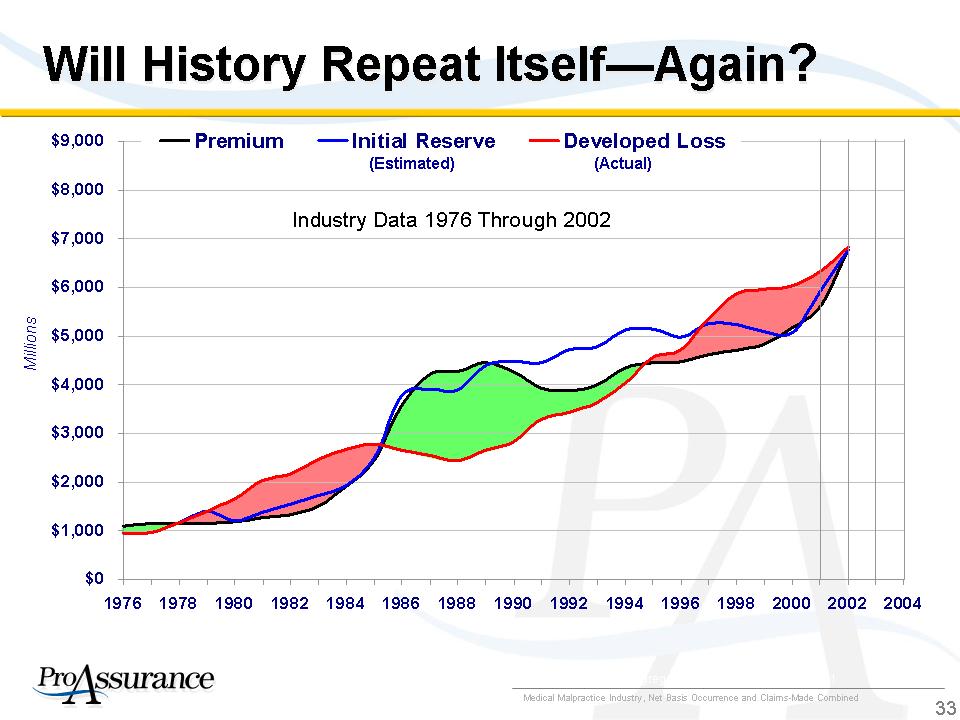
Will History Repeat Itself—Again? Will History Repeat Itself—Again? $0 $1,000 $2,000 $3,000 $4,000 $5,000 $6,000 $7,000 $8,000 $9,000 1976 1978 1980 1982 1984 1986 1988 1990 1992 1994 1996 1998 2000 2002 2004 Premium Initial Reserve Developed Loss Millions Source: A. M. Best Aggregates and Averages 1976 - 2001 Medical Malpractice Industry, Net Basis Occurrence and Claims-Made Combined Industry Data 1976 Through 2002 (Estimated) (Actual) 33
EXHIBIT 99.1
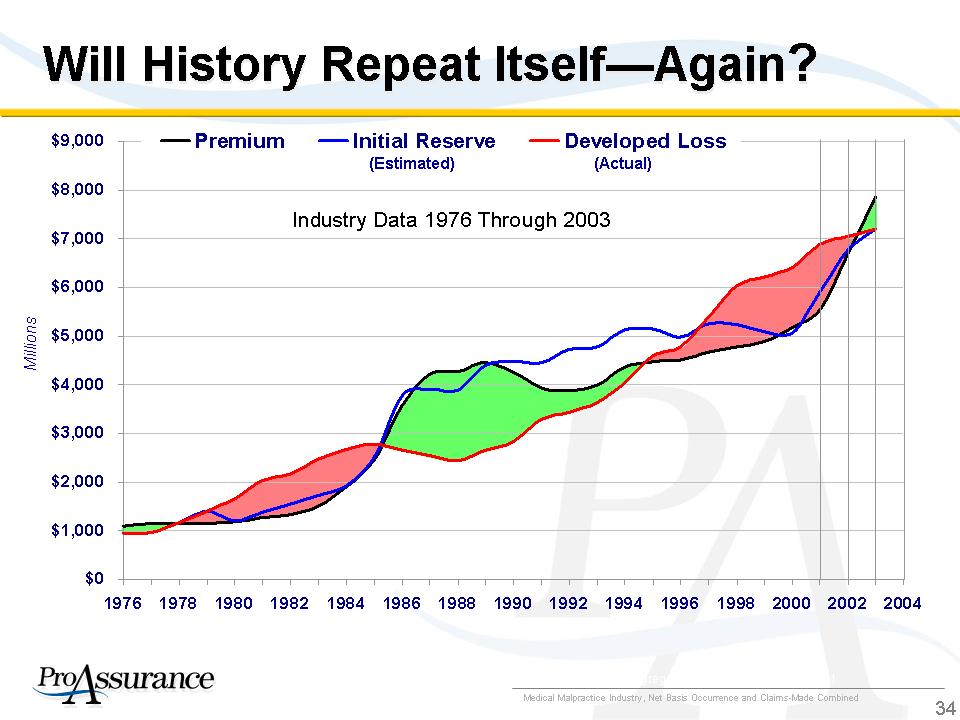
Will History Repeat Itself—Again? Will History Repeat Itself—Again? $0 $1,000 $2,000 $3,000 $4,000 $5,000 $6,000 $7,000 $8,000 $9,000 1976 1978 1980 1982 1984 1986 1988 1990 1992 1994 1996 1998 2000 2002 2004 Premium Initial Reserve Developed Loss Millions Source: A. M. Best Aggregates and Averages 1976 - 2001 Medical Malpractice Industry, Net Basis Occurrence and Claims-Made Combined Industry Data 1976 Through 2003 (Estimated) (Actual) 34
EXHIBIT 99.1
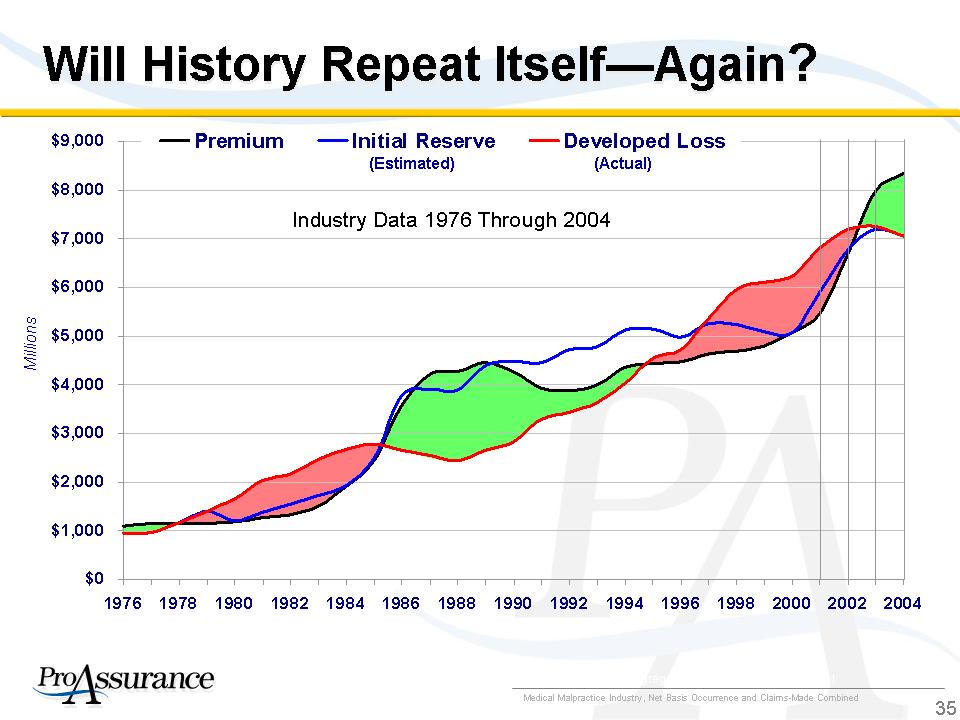
Will History Repeat Itself—Again? Will History Repeat Itself—Again? $0 $1,000 $2,000 $3,000 $4,000 $5,000 $6,000 $7,000 $8,000 $9,000 1976 1978 1980 1982 1984 1986 1988 1990 1992 1994 1996 1998 2000 2002 2004 Premium Initial Reserve Developed Loss Millions Source: A. M. Best Aggregates and Averages 1976 - 2001 Medical Malpractice Industry, Net Basis Occurrence and Claims-Made Combined Industry Data 1976 Through 2004 (Estimated) (Actual) 35
EXHIBIT 99.1
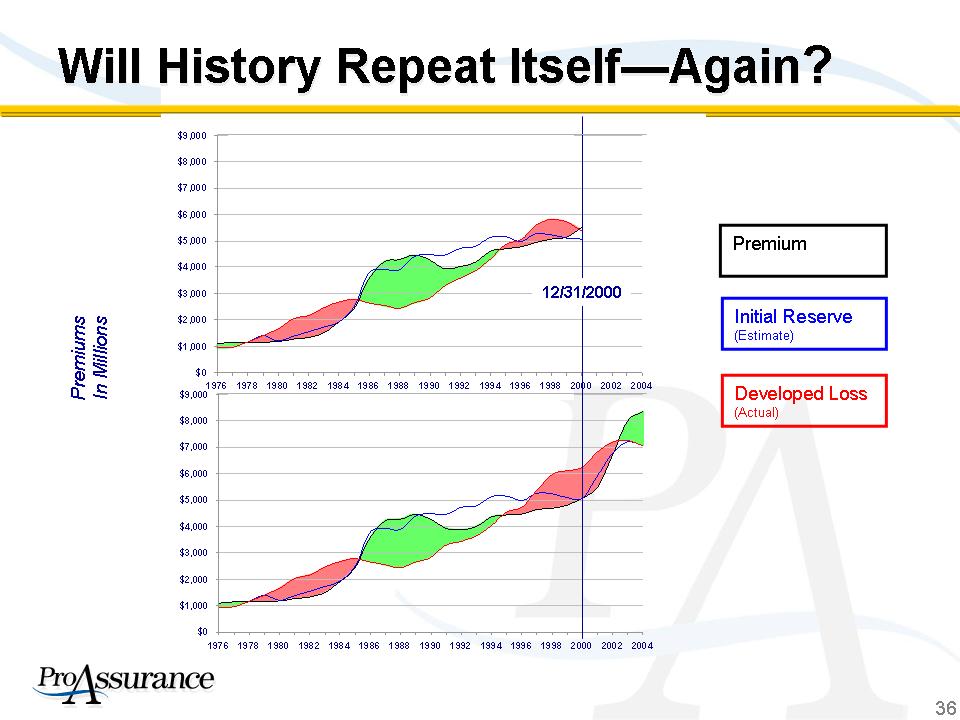
$2,000 $3,000 $4,000 $5,000 $6,000 $7,000 $8,000 $9,000 1976 1978 1980 1982 1984 1986 1988 1990 1992 1994 1996 1998 2000 2002 2004 Premium Initial Reserve Developed Loss $0 $1,000 $2,000 $3,000 $4,000 $5,000 $6,000 $7,000 $8,000 $9,000 1976 1978 1980 1982 1984 1986 1988 1990 1992 1994 1996 1998 2000 2002 2004 Premium Initial Reserve Developed Loss Premiums In Millions Will History Repeat Itself—Again? Will Premium Initial Reserve (Estimate) Developed Loss (Actual) 36
EXHIBIT 99.1
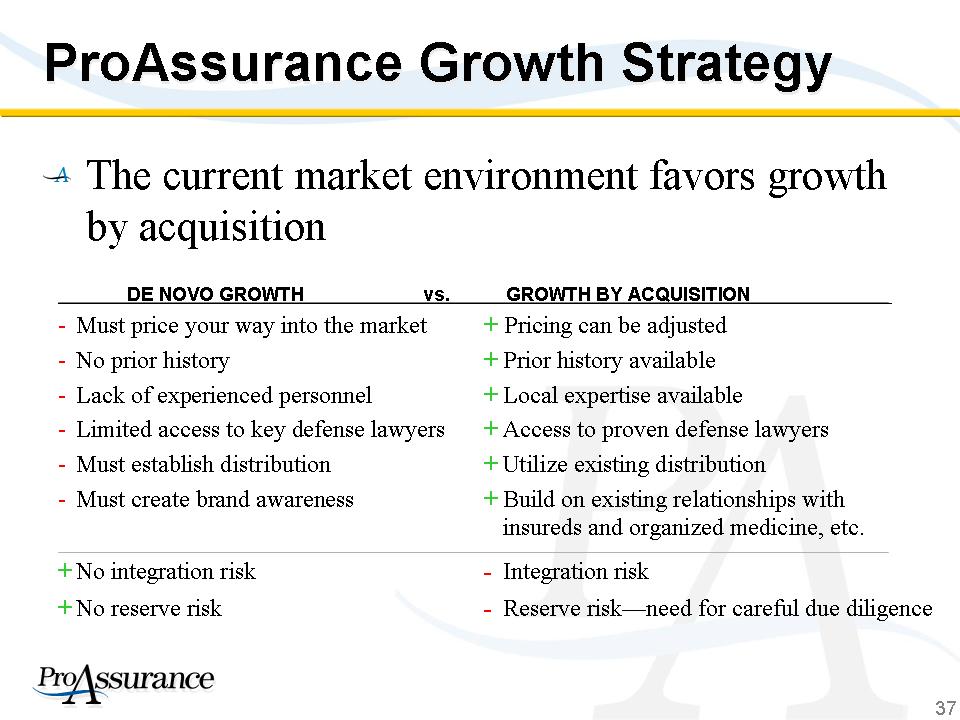
ProAssurance Growth Strategy The current market environment favors growth by acquisition The current market environment favors growth by acquisition DE NOVO GROWTH vs. GROWTH BY ACQUISITION - Must price your way into the market + Pricing can be adjusted - No prior history + Prior history available - Lack of experienced personnel + Local expertise available - Limited access to key defense lawyers + Access to proven defense lawyers - Must establish distribution + Utilize existing distribution - Must create brand awareness + Build on existing relationships with insureds and organized medicine, etc. + No integration risk - Integration risk + No reserve risk - Reserve risk—need for careful due diligence DE NOVO GROWTH vs. GROWTH BY ACQUISITION - Must price your way into the market + Pricing can be adjusted - No prior history + Prior history available - Lack of experienced personnel + Local expertise available - Limited access to key defense lawyers + Access to proven defense lawyers - Must establish distribution + Utilize existing distribution - Must create brand awareness + Build on existing relationships with insureds and organized medicine, etc. + No integration risk - Integration 37