Exhibit 99.2
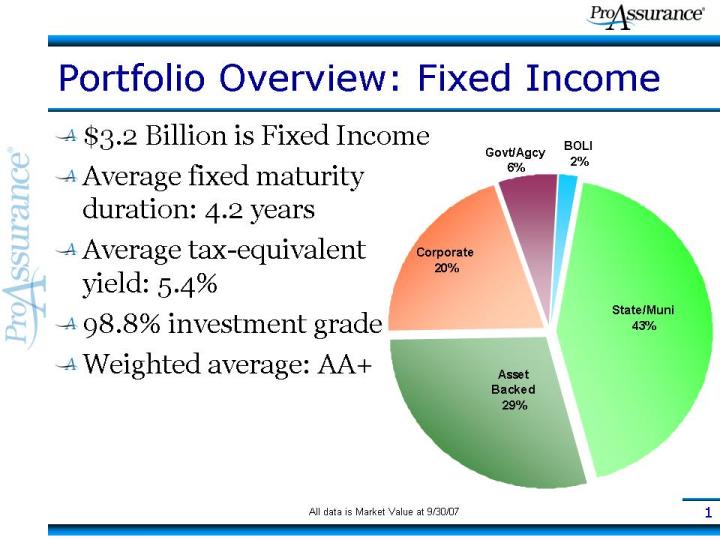
1 Portfolio Overview: Fixed Income $3.2 Billion is Fixed Income Average fixed maturity duration: 4.2 years Average tax-equivalent yield: 5.4% 98.8% investment grade Weighted average: AA+ All data is Market Value at 9/30/07
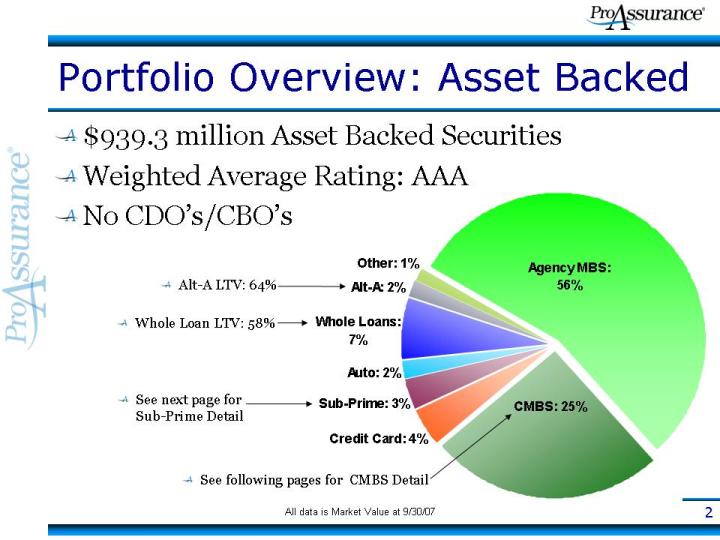
2 Portfolio Overview: Asset Backed $939.3 million Asset Backed Securities Weighted Average Rating: AAA No CDO’s/CBO’s Alt-A LTV: 64% Whole Loan LTV: 58% See next page for
Sub-Prime Detail See following pages for CMBS Detail All data is Market Value at 9/30/07
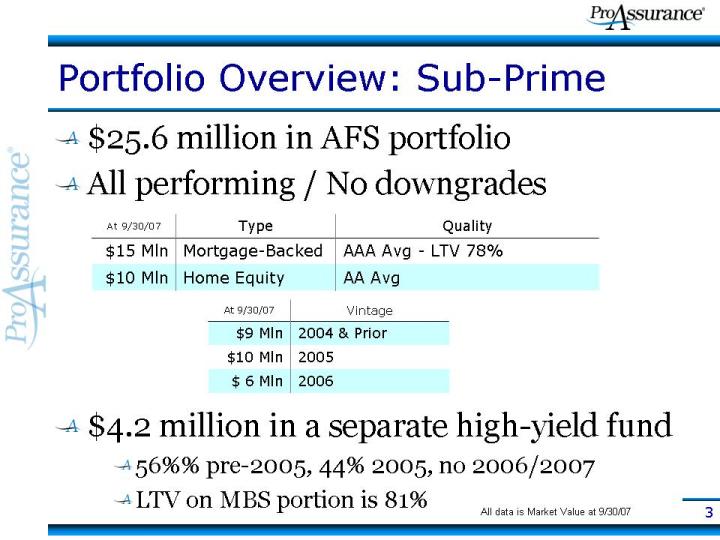
3 Portfolio Overview: Sub-Prime $25.6 million in AFS portfolio All performing / No downgrades $4.2 million in a separate high-yield fund 56%% pre-2005, 44% 2005, no 2006/2007 LTV on MBS portion is 81% All data is Market Value at 9/30/07
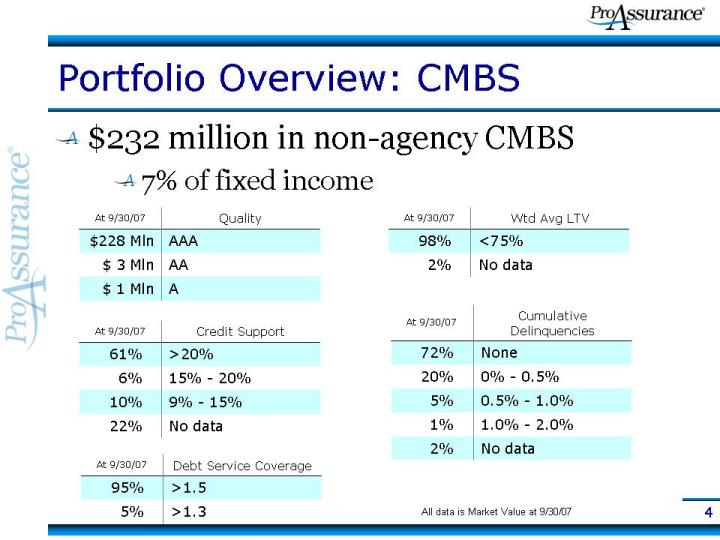
4 Portfolio Overview: CMBS $232 million in non-agency CMBS 7% of fixed income All data is Market Value at 9/30/07
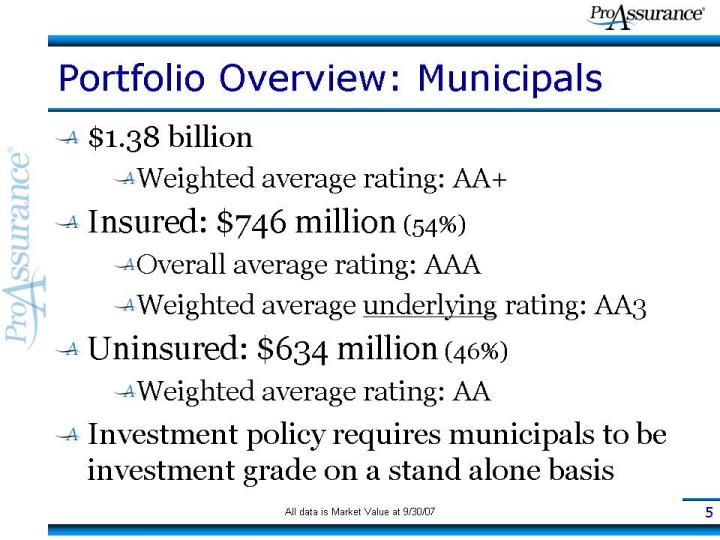
5 Portfolio Overview: Municipals $1.38 billion Weighted average rating: AA+ Insured: $746 million (54%) Overall average rating: AAA Weighted average underlying rating: AA3 Uninsured: $634 million (46%) Weighted average rating: AA Investment policy requires municipals to be investment grade on a stand alone basis All data is Market Value at 9/30/07
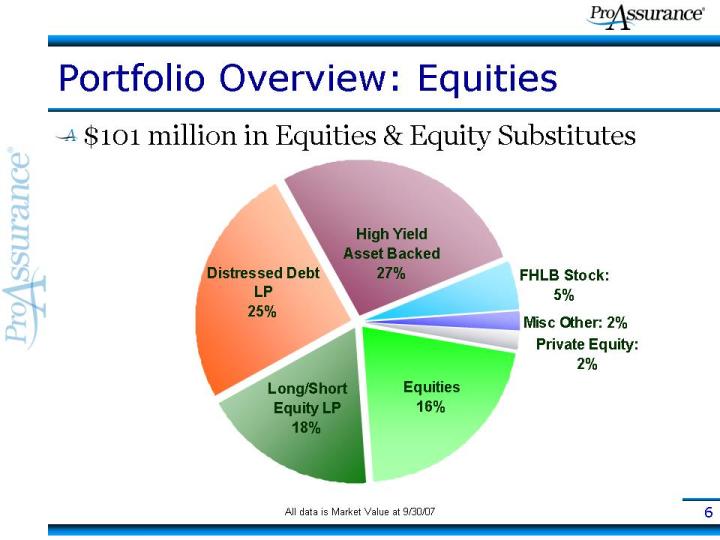
6 Portfolio Overview: Equities $101 million in Equities & Equity Substitutes All data is Market Value at 9/30/07