February 11, 2008 SubTitle: W. Stancil Starnes, Chief Executive Officer Edward L. Rand, Jr., Chief Financial Officer Frank B. O’Neil, Investor Relations Officer New York Society of Security Analysts
1 Title: Caution Regarding Forward Looking Statements Body: This presentation communicates historical information as well as forward-looking statements that are based upon our estimates and anticipation of future events; any items in this presentation that are not historical information are specifically identified as forward-looking statements. These forward-looking statements are identified by words such as, but not limited to, “anticipate,” “believe,” “estimate,” “expect,” “hope,” “hopeful,” “intend,” “may,” “optimistic,” “preliminary,” “project,” “should,” “will” and other analogous expressions. There are numerous important factors that could cause our actual results to differ materially from the expected results described in the forward-looking statements. Thus, sentences and phrases that we use to convey our view of future events and trends are expressly designated as forward-looking statements as are sections of this presentation clearly identified as giving our outlook on future business. Forward-looking statements relating to our business include, among other things: statements concerning liquidity and capital requirements, return on equity, financial ratios, net income, premiums, losses and loss reserves, premium rates and retention of current business, competition and market conditions, the expansion of product lines, the development or acquisition of business in new geographical areas, the availability of acceptable reinsurance, actions by regulators and rating agencies, payment or performance of obligations under indebtedness, payment of dividends, and other matters. These forward-looking statements are subject to significant risks, assumptions and uncertainties, including, among other things, the following important factors that could affect the actual outcome of future events: general economic conditions, either nationally or in our market area, that are worse than anticipated; regulatory and legislative actions or decisions that adversely affect our business plans or operations; inflation and changes in the interest rate environment; performance of financial markets and/or changes in the securities markets that adversely affect the fair value of our investments or operations; changes in laws or government regulations affecting medical professional liability insurance; changes to our ratings assigned by rating agencies; the effects of health care changes, including managed care; uncertainties inherent in the estimate of loss and loss adjustment expense reserves and reinsurance, and changes in the availability, cost, quality, or collectibility of reinsurance; bad faith litigation which may arise from our involvement in the settlement of claims; post-trial motions which may produce rulings adverse to us and/or appeals we undertake that may be unsuccessful; significantly increased competition among insurance providers and related pricing weaknesses in some markets; our ability to achieve continued growth through expansion into other states or through acquisitions or business combinations; the expected benefits from acquisitions may not be achieved or may be delayed longer than expected due to, among other reasons, business disruption, loss of customers and/or employees, increased operating costs or inability to achieve cost savings, and assumption of greater than expected liabilities; changes in accounting policies and practices that may be adopted by our regulatory agencies and the Financial Accounting Standards Board; changes in our organization, compensation and benefit plans; and any other factors listed or discussed in the reports we file with the Securities and Exchange Commission, including the Registration Statement filed on February 15, 2006 and updated on June 2, 2006, as well as in our periodic reports filed with the Securities and Exchange Commission, such as our current reports on Form 8-K, and our regular reports on Forms 10-Q and 10-K, particularly in “Item 1A, Risk Factors.” Except as required by law or regulations, we do not undertake and specifically decline any obligation to publicly release the result of any revisions that may be made to any forward-looking statements to reflect events or circumstances after the date of such statements or to reflect the occurrence of anticipated or unanticipated events.
2Title: ProAssurance 101
3Title: ProAssurance: The Basics Body: Market Cap: $1.8 Billion Equity: $1.2 Billion Fourth largest writer of medical liability Over 35,000 policyholders More than 30,000 physicians & dentists Majority in small or solo practice Writing business in 28 jurisdictions Highly rated by Best and Fitch All Data as of September 30, 2007
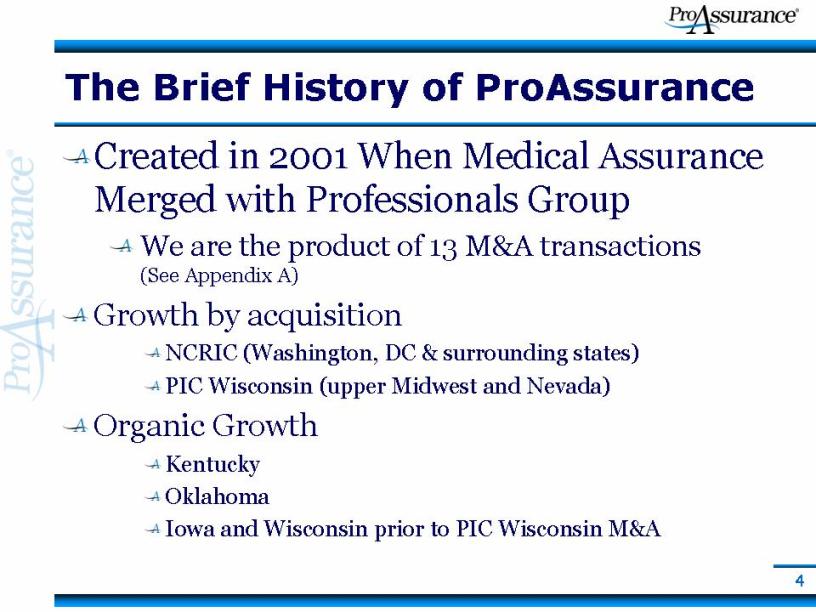
44 Title: The Brief History of ProAssurance Body: Created in 2001 When Medical Assurance Merged with Professionals Group We are the product of 13 M&A transactions(See Appendix A) Growth by acquisition NCRIC (Washington, DC & surrounding states) PIC Wisconsin (upper Midwest and Nevada) Organic Growth Kentucky Oklahoma Iowa and Wisconsin prior to PIC Wisconsin M&A

5Title: National Scale…Local Focus Body: Corporate strategy applied locally to underwriting & claims Local knowledge crucial to understanding legal environment Local presence enhances long-term customer relationships Efficiencies gained from consolidated “back-room” operations Corporate Headquarters States of Origin or Acquisition Expansion States Claims Offices Claims / Underwriting Offices
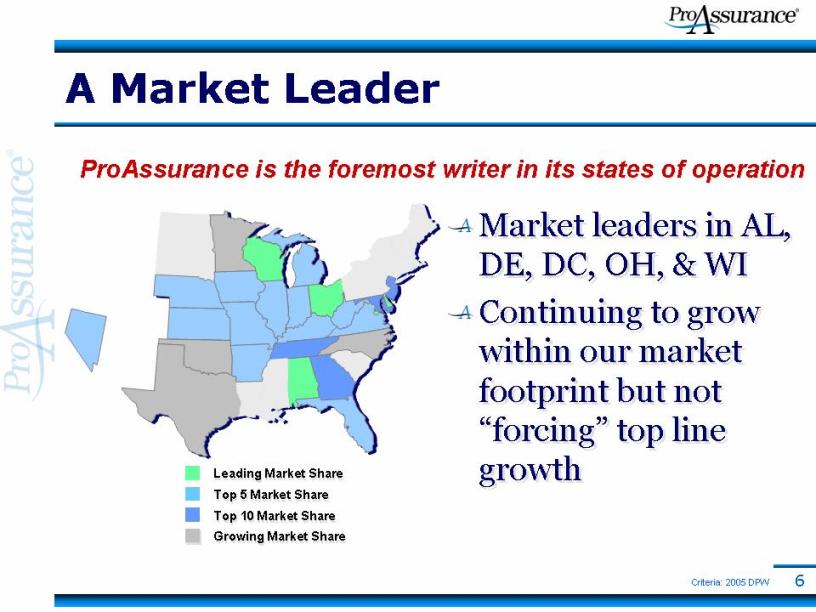
6Leading Market Share Top 5 Market Share Top 10 Market Share Growing Market Share Title: A Market Leader Body: Market leaders in AL, DE, DC, OH, & WI Continuing to grow within our market footprint but not “forcing” top line growth Criteria: 2005 DPW ProAssurance is the foremost writer in its states of operation
7Title: ProAssurance Mission Body: We will be the preferred source of professional liability protection by providing unparalleled claims defense, highly responsive customer service, and innovative risk management, while maintaining our commitment to long-term financial strength
8Title: ProAssurance Core Values Body: Integrity in all we do Commitment to the needs of insureds, employees and shareholders Respect for those we encounter Perpetuation of doctor involvement in our core activities Collaboration and Communication throughout our organization Enthusiasm every day
9Title: ProAssurance Body: Recognized as one of the 50 top performing property casualty insurance companies in America by Ward’s Recognized by The Principal as one of the Ten Best Companies for Employee Financial Security

10Title: The Medical Liability Market Today
11Title: Market Review Body: Frequency moderating, severity manageable “Shock losses” continue to occur so claims
management is even more important Companies view loss trends differently Market pricing has softened considerably Unrealistic pricing only in isolated areas Optimists see a “new” environment Realists know the cycle always swings Retention though nine months is 86% Terms and conditions are largely holding
12Title: ProAssurance’s Response? Body: Maintaining margin remains more important than top-line volume Consistent strategy tailored for individual states Variation even between territories in states Loss trends allowing retention programs in long-term markets Unmatched geographical diversification spreads risk Targeting profitable states as the market evolves
13Title: ProAssurance’s Response? Body: Concentrating on shareholder value Growing Book Value per Share Average increase of $2.92/year in last ten years Average increase of $1.95/year since inception Focused on the long-term Maintaining leading market position Protecting the balance sheet Building strength for the next cycle turn Evaluating all M & A opportunities
14Title: You Can’t Hide from The Market Cycle But You Can Survive
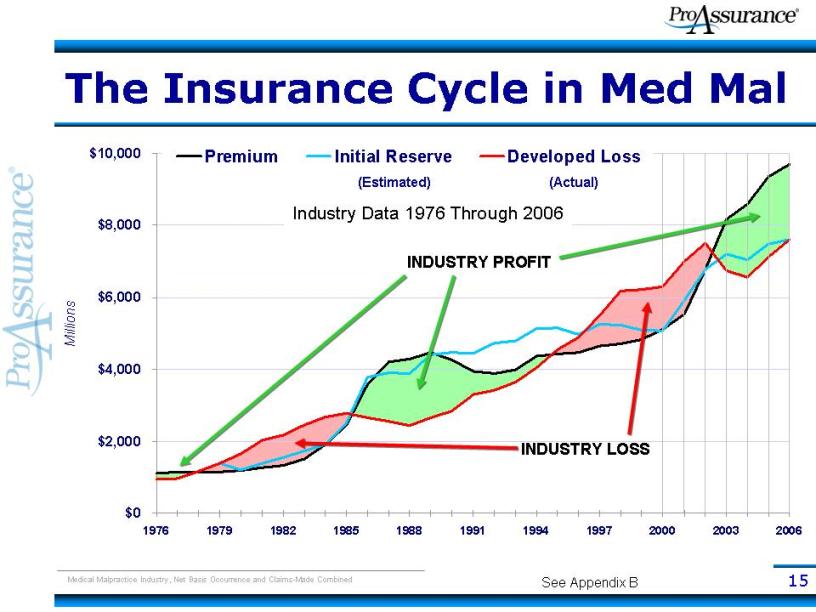
15Title: The Insurance Cycle in Med Mal Millions Source: A. M. Best Aggregates and Averages 1976 – 2001Medical Malpractice Industry, Net Basis Occurrence and Claims-Made Combined (Estimated) (Actual) Industry Data 1976 Through 2006 See Appendix B INDUSTRY PROFIT INDUSTRY LOSS
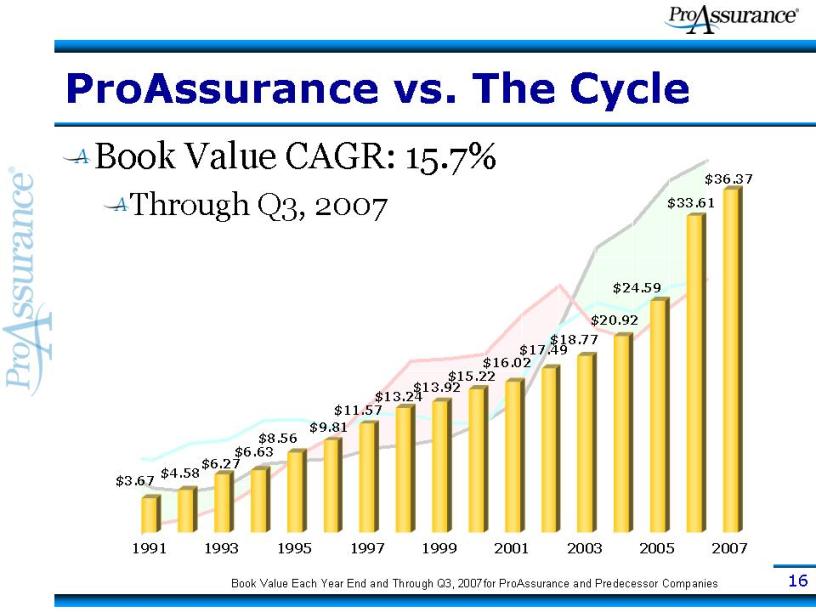
16Title: ProAssurance vs. The Cycle Book Value CAGR: 15.7% Through Q3, 2007 Book Value Each Year End and Through Q3, 2007for ProAssurance and Predecessor Companies

17Title: ProAssurance vs. The Cycle Net Combined Ratio Source: A. M. Best Aggregates and Averages
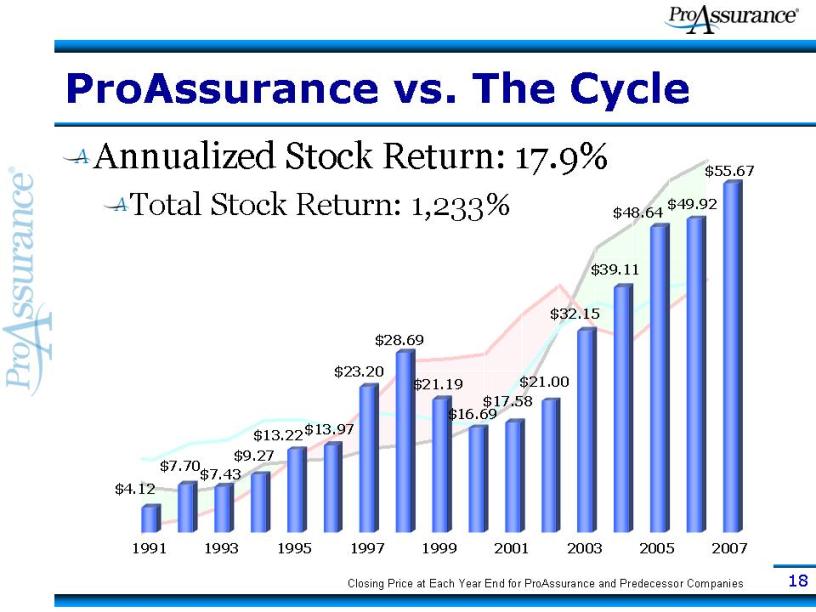
18Title: ProAssurance vs. The Cycle Annualized Stock Return: 17.9% Total Stock Return: 1,233% Closing Price at Each Year End for ProAssurance and Predecessor Companies
19Title: Navigating The Cycle Body: Experience IS the best teacher We have managed through several cycles and understand the pitfalls Average industry/related experience is 22 years Executives and VP’s average tenure is 12 years We are owners, not just managers Directors, officers and employees own approximately 10% of the company Share ownership guidelines down to VP level
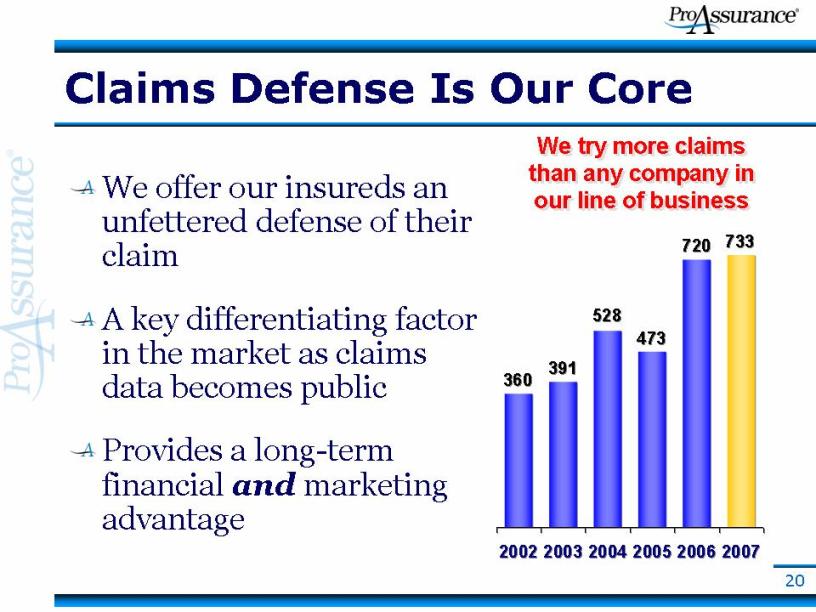
20Title: Claims Defense Is Our Core Body: We offer our insureds an unfettered defense of their claim A key differentiating factor in the market as claims data becomes public Provides a long-term financial and marketing advantage We try more claims than any company in our line of business
21Title: Our Competitive Advantage
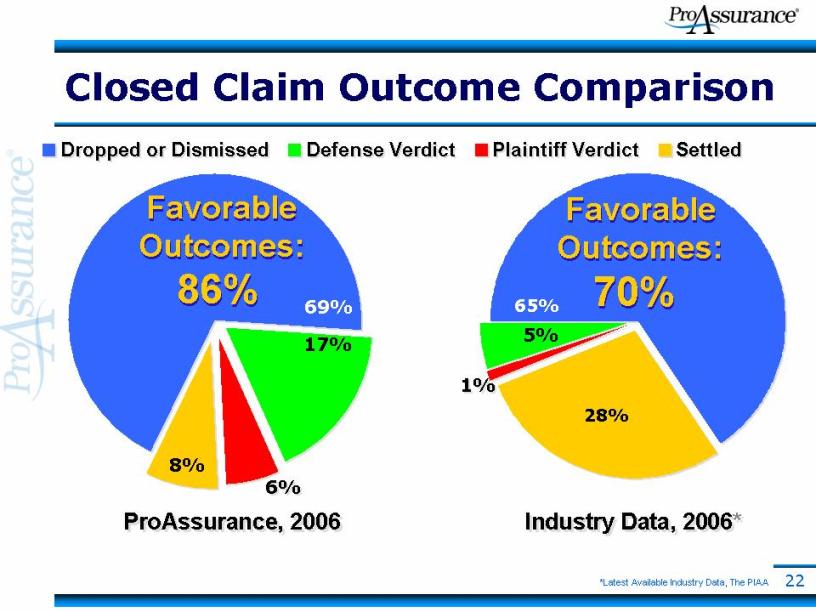
22Title: Closed Claim Outcome Comparison Favorable Outcomes: 86% Favorable Outcomes: 70% ProAssurance, 2006 Industry Data, 2006* *Latest Available Industry Data, The PIAA
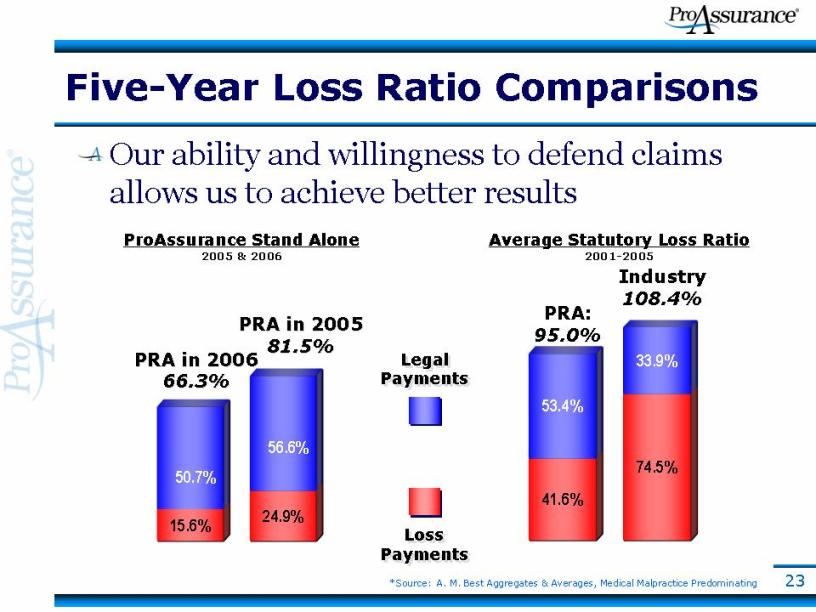
23Title: Five-Year Loss Ratio Comparisons Body: Our ability and willingness to defend claims allows us to achieve better results Average Statutory Loss Ratio 2001-2005 Industry 108.4% Legal Payments Loss Payments PRA: 95.0% PRA in 2005 81.5% ProAssurance Stand Alone 2005 & 2006 PRA in 2006 66.3% *Source: A. M. Best Aggregates & Averages, Medical Malpractice Predominating
24Title: Underwriting Discipline Body: Pricing based on ROE and margin targets No market share or top line goals/incentives Focused on profitable business Selling from strength Balance sheet Defense of non-meritorious claims Risk management expertise Physician-connections
25Title: Physician Heritage: Our Real Edge Body: Physician involvement throughout promotes a direct relationship with our insureds Regional Advisory Boards involve more than 500 leadership physicians Physician Claims/Underwriting Committees in 16 key states Quarterly meetings, attended by senior management Provides claims and underwriting insight Creates physician “Ambassadors” Risk management seminars involve more than half our insureds each year

26Title: Financial Overview
27Title: Income Statement Highlights Body: Premiums now trending down Growth from PIC Wisconsin offset declining premiums until Q3 Favorable Net Reserve Development continues to drive earnings Q3: $25.0 mln YTD: $60.6 mln Investment Income continues to be a plus Cash flow is strong, but has slowed
28Title: Balance Sheet Highlights Body: Continuing growth in Book Value/Share Conservative investment strategy Seeking incremental additional return Using capital for share repurchase and debt reduction Repurchased 764,330 shares YTD for $41.3 ml $108.7 million remaining in our authorization $16 million used to redeem NCRIC debentures Likely early call of convertibles in July 2008
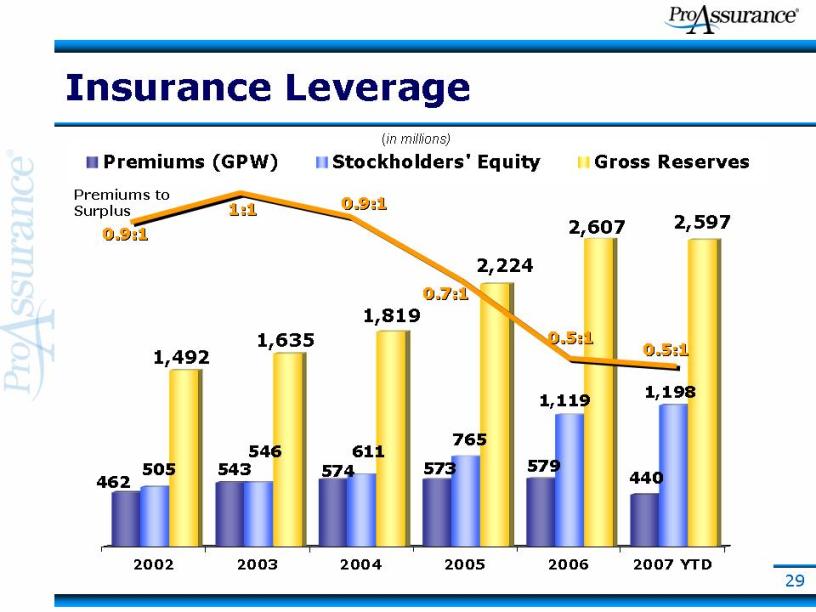
29Title: Insurance Leverage (in millions) 0.9:1 Premiums to Surplus 0.9:1 1:1 0.7:1 0.5:1 0.5:1
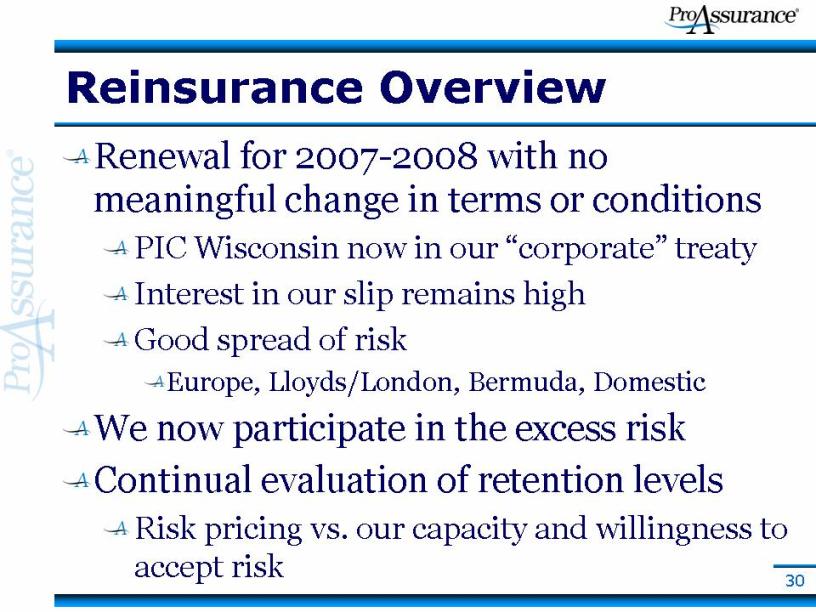
30Title: Reinsurance Overview Body: Renewal for 2007-2008 with no meaningful change in terms or conditions PIC Wisconsin now in our “corporate” treaty Interest in our slip remains high Good spread of risk Europe, Lloyds/London, Bermuda, Domestic We now participate in the excess risk Continual evaluation of retention levels Risk pricing vs. our capacity and willingness to accept risk
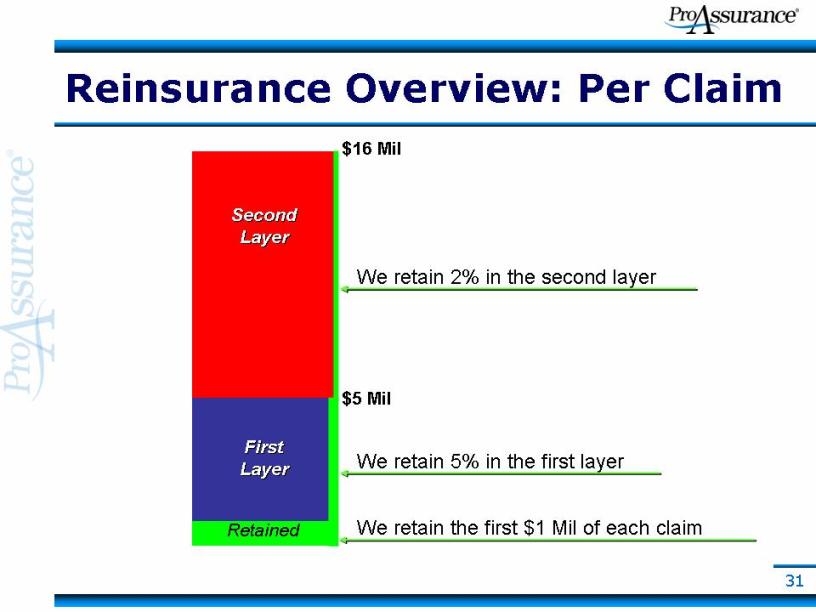
31Title: Reinsurance Overview: Per Claim Retained First Layer $5 Mil $16 Mil Second Layer We retain 5% in the first layer We retain 2% in the second layer We retain the first $1 Mil of each claim
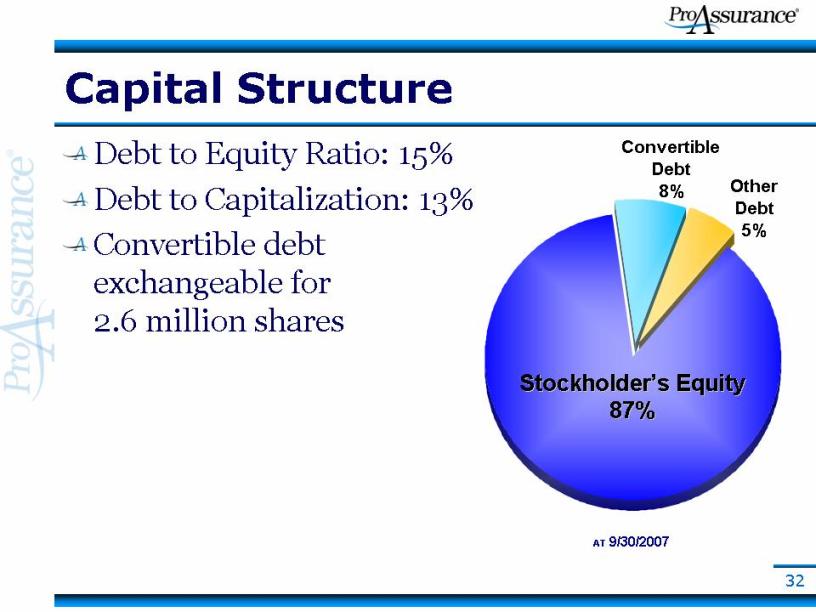
32Title: Capital Structure Body: Debt to Equity Ratio: 15% Debt to Capitalization: 13% Convertible debt exchangeable for 2.6 million shares Stockholder’s Equity 87% Convertible Debt 8% Other Debt 5% AT 9/30/2007
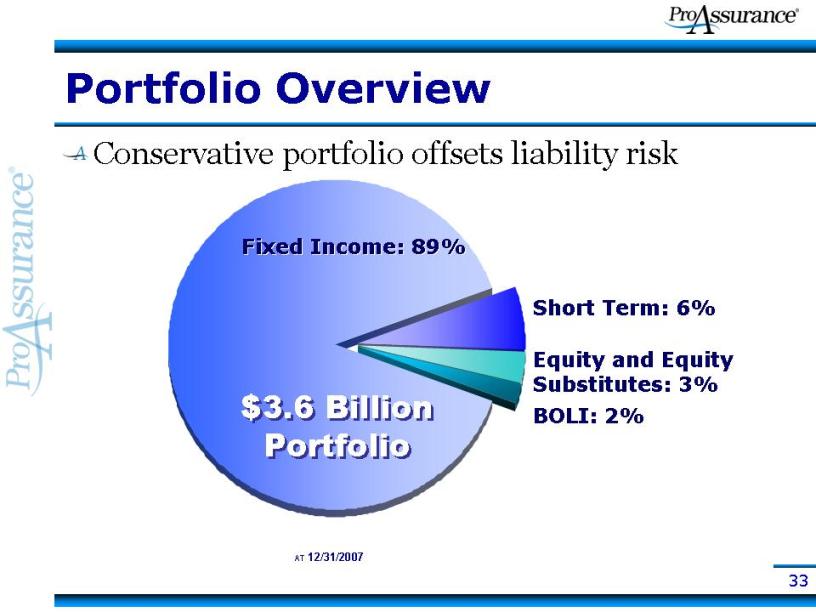
33Title: Portfolio Overview Body: Conservative portfolio offsets liability risk $3.6 Billion Portfolio AT 12/31/2007 Fixed Income: 89% Short Term: 6% Equity and Equity Substitutes: 3% BOLI: 2%
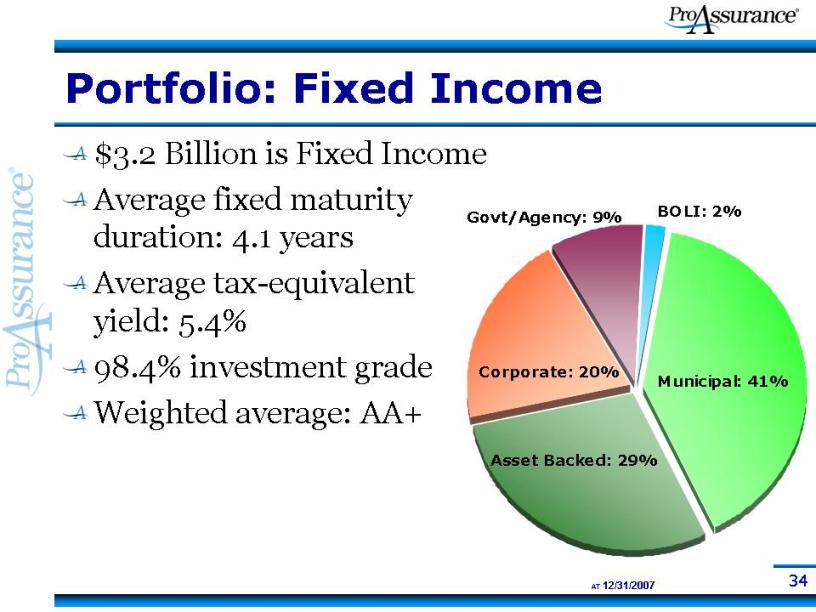
34Title: Portfolio: Fixed Income Body: $3.2 Billion is Fixed Income Average fixed maturity duration: 4.1 years Average tax-equivalent yield: 5.4% 98.4% investment grade Weighted average: AA+ AT 12/31/2007
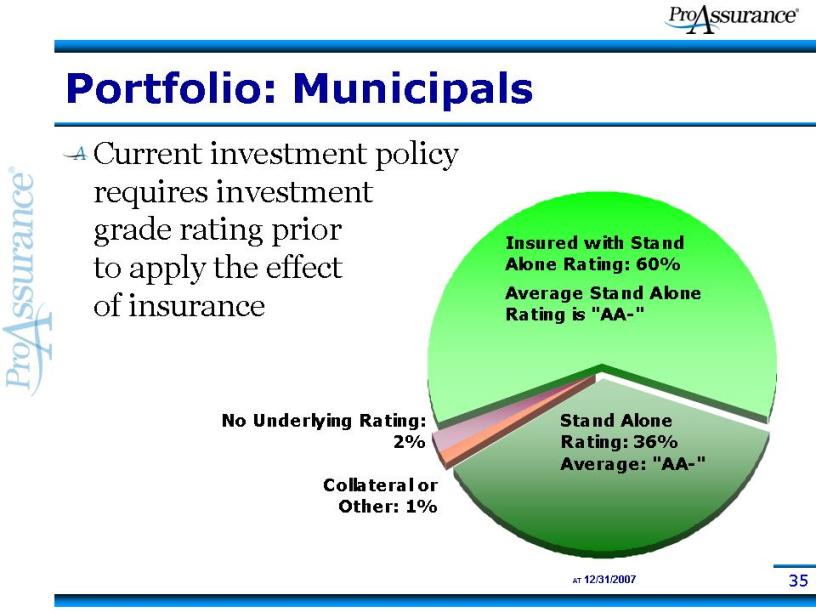
35Title: Portfolio: Municipals Body: Current investment policy requires investment grade rating prior to apply the effect of insurance AT 12/31/2007
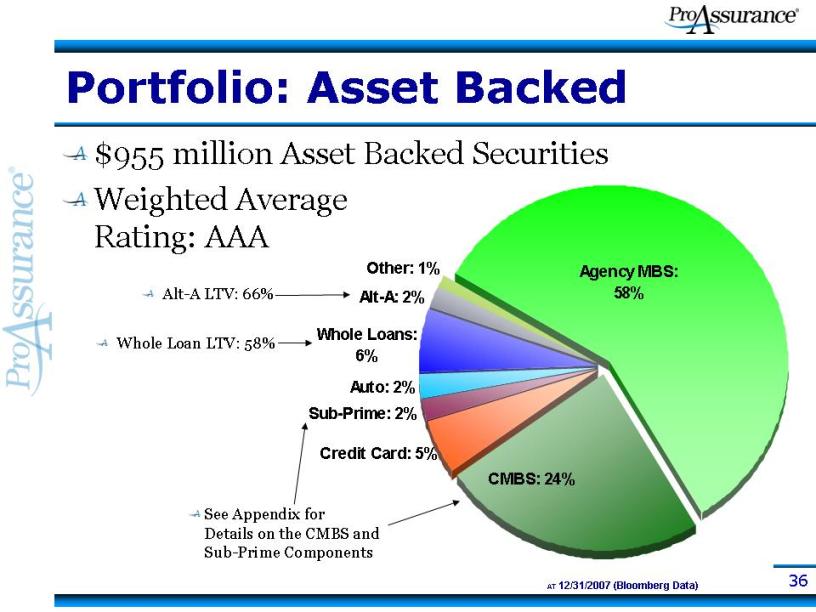
36Title: Portfolio: Asset Backed Body: $955 million Asset Backed Securities Weighted Average Rating: AAA AT 12/31/2007 (Bloomberg Data) Alt-A LTV: 66% Whole Loan LTV: 58% See Appendix for Details on the CMBS and Sub-Prime Components
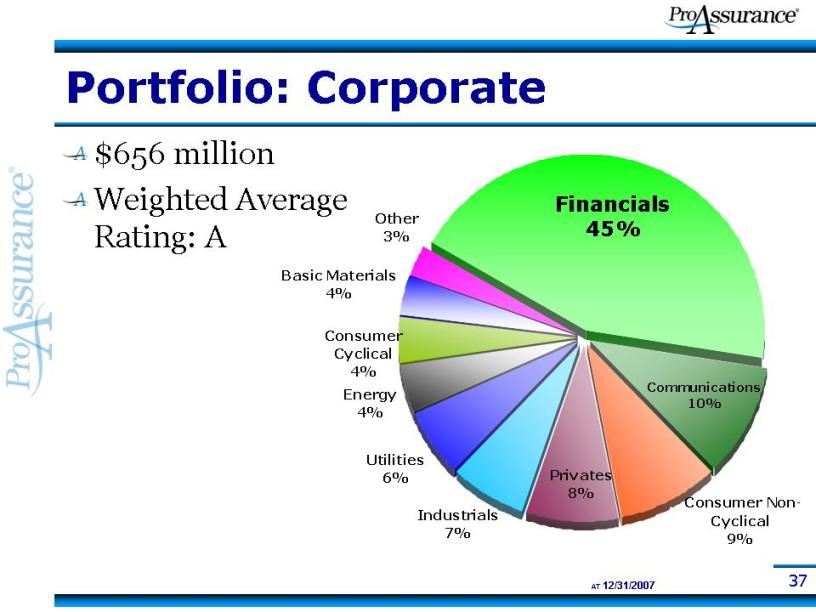
37Title: Portfolio: Corporate Body: $656 million Weighted Average Rating: A AT 12/31/2007
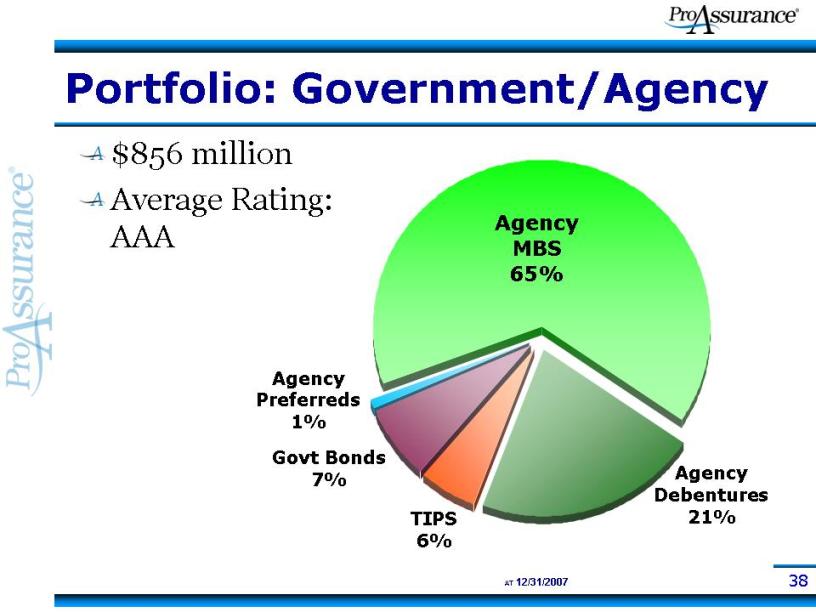
38Title: Portfolio: Government/Agency Body: $856 million Average Rating: AAA AT 12/31/2007

39Title: Portfolio Overview: Equities Body: $103 million in Equities & Equity Substitutes AT 12/31/2007
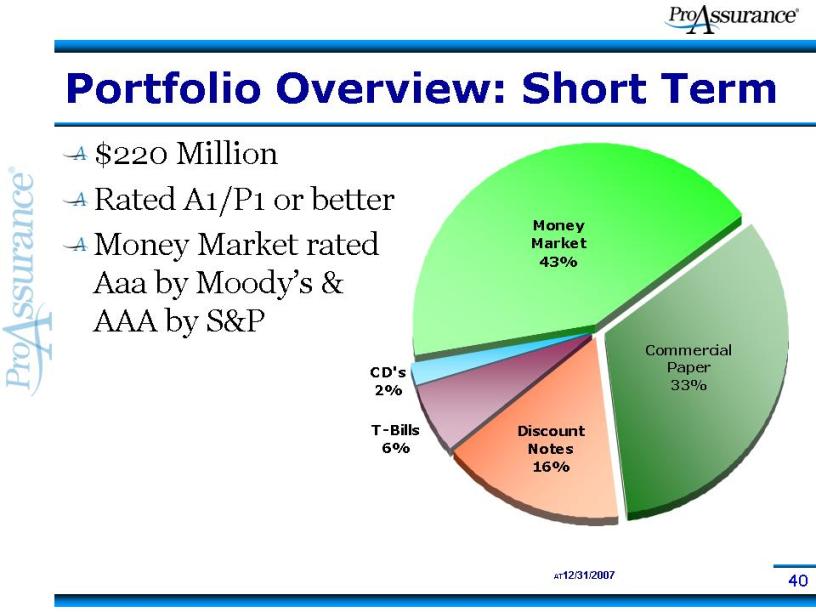
40Title: Portfolio Overview: Short Term Body: $220 Million Rated A1/P1 or better Money Market rated Aaa by Moody’s & AAA by S&P AT12/31/2007
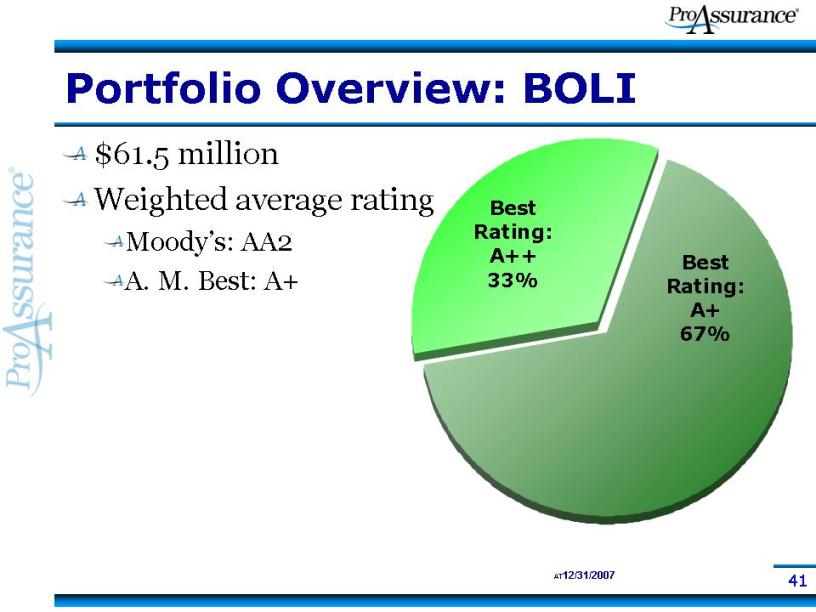
41Title: Portfolio Overview: BOLI Body: $61.5 million Weighted average rating Moody’s: AA2 A. M. Best: A+ AT12/31/2007
42Title: Appendix A. Acquisition History B. Full Market Cycle Data C. Growth Strategy Highlights D. Further Investment Disclosure

43 43 2004: Purchased Selected Renewal Rights from: OHIC Insurance Company Title: We Created a Leader Through Consolidation 1994: Consolidation of: West Virginia Hosp. Ins Co. 1995: Consolidation of; Physicians Ins Co of Indiana Assumed business of: Physicians Ins Co of Ohio 1996: Consolidation of: Missouri Medical Ins Co 1995: Assumed business of: Associated Physicians Ins Co. (IL) 1998: Consolidation of: Physicians Protective Trust Fund (FL) 1996: Assumed business of: American Medical Ins Exchange (IN) Founding in the 1970’s 1999: Assumed business of: Medical Defense Associates (MO) Mutual Assurance Physicians Ins. Co. of Michigan Professionals Group Creation of: June, 2001 2005: Acquisition of: NCRIC Group Medical Assurance 2006: Acquisition of: PIC Wisconsin Group
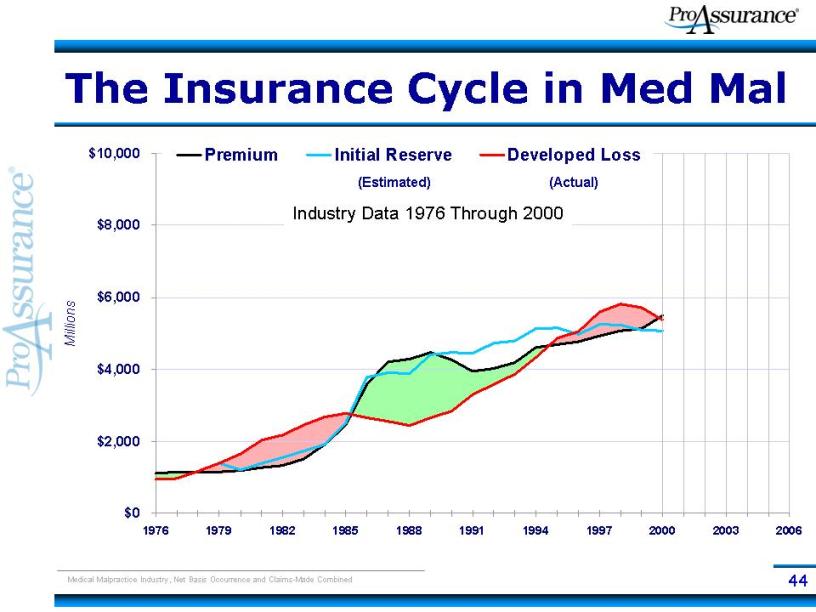
44Title: The Insurance Cycle in Med Mal Millions Source: A. M. Best Aggregates and Averages 1976 – 2001 Medical Malpractice Industry, Net Basis Occurrence and Claims-Made Combined (Estimated) (Actual) Industry Data 1976 Through 2000
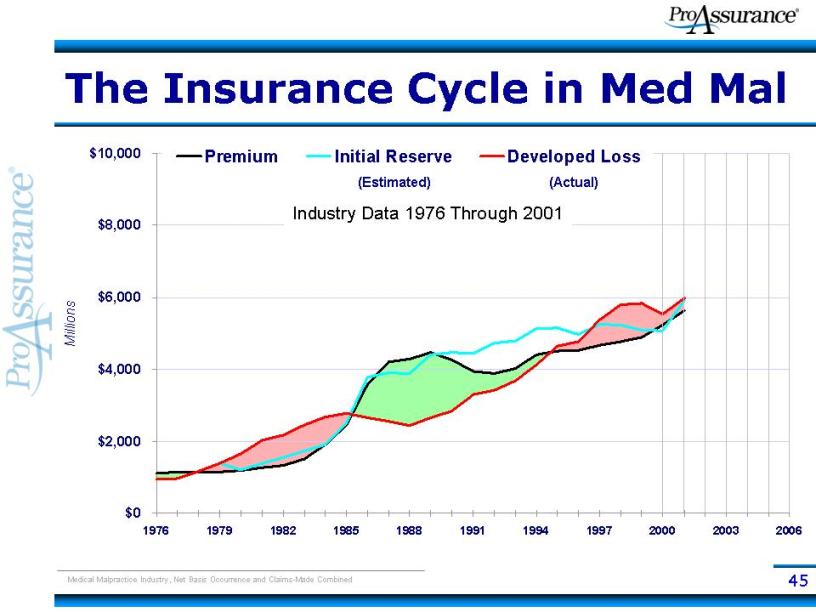
45Title: The Insurance Cycle in Med Mal Millions Source: A. M. Best Aggregates and Averages 1976 – 2001 Medical Malpractice Industry, Net Basis Occurrence and Claims-Made Combined (Estimated) (Actual) Industry Data 1976 Through 2001
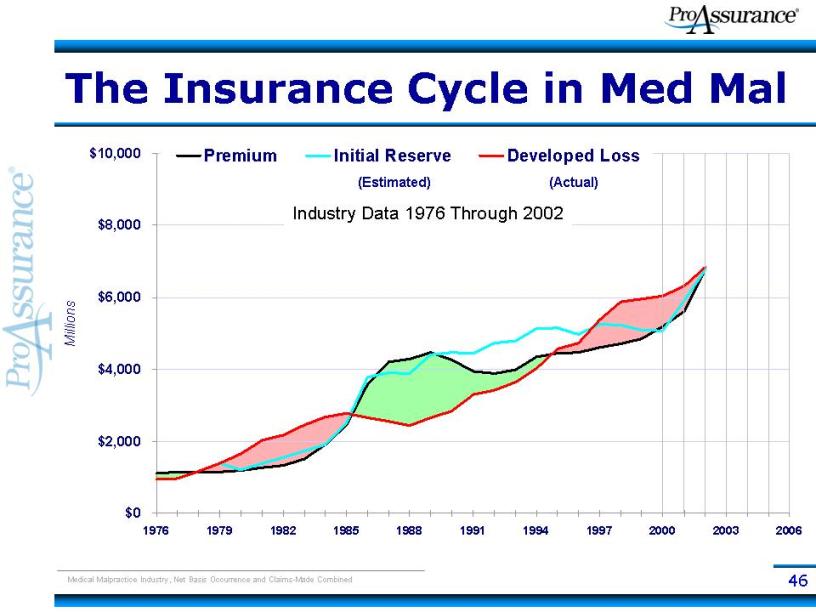
46Title: The Insurance Cycle in Med Mal Millions Source: A. M. Best Aggregates and Averages 1976 – 2001 Medical Malpractice Industry, Net Basis Occurrence and Claims-Made Combined (Estimated) Industry Data 1976 Through 2002 (Actual)
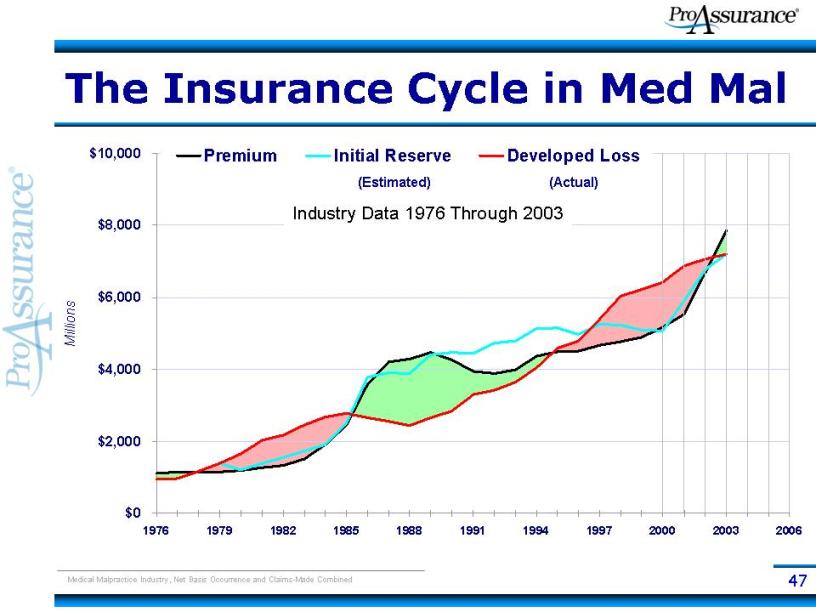
47Title: The Insurance Cycle in Med Mal Millions Source: A. M. Best Aggregates and Averages 1976 – 2001 Medical Malpractice Industry, Net Basis Occurrence and Claims-Made Combined (Estimated) Industry Data 1976 Through 2003 (Actual)

48Title: The Insurance Cycle in Med Mal Millions Source: A. M. Best Aggregates and Averages 1976 – 2001 Medical Malpractice Industry, Net Basis Occurrence and Claims-Made Combined (Estimated) (Actual) Industry Data 1976 Through 2004
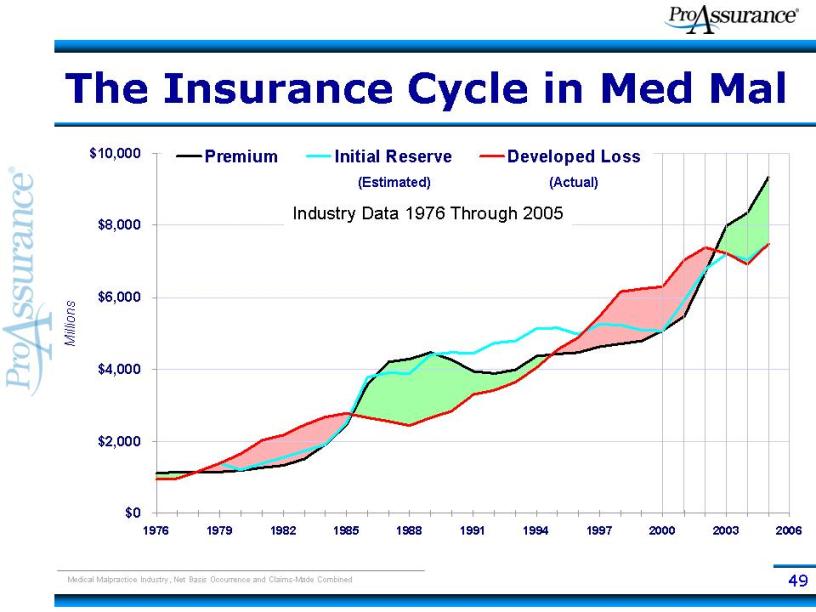
49Title: The Insurance Cycle in Med Mal Millions Source: A. M. Best Aggregates and Averages 1976 – 2001 Medical Malpractice Industry, Net Basis Occurrence and Claims-Made Combined (Estimated) (Actual) Industry Data 1976 Through 2005
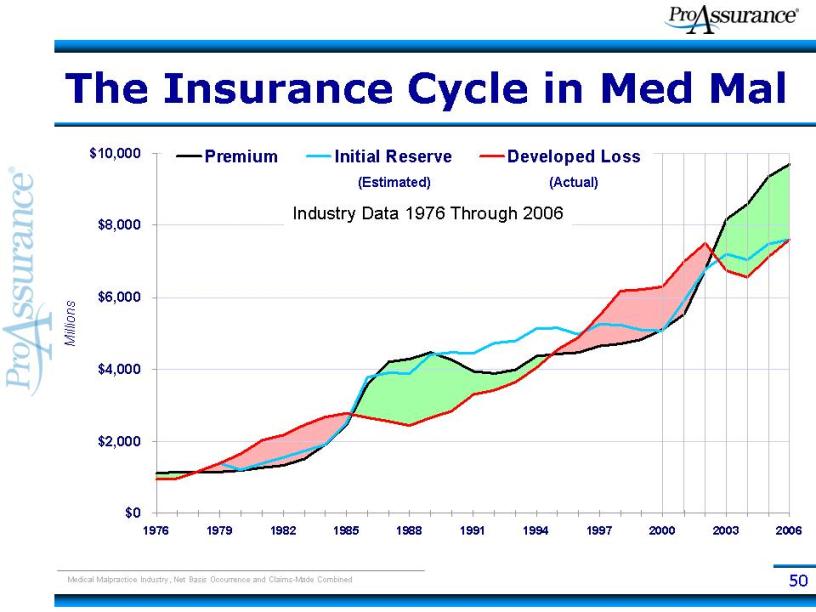
50Title: The Insurance Cycle in Med Mal Millions Source: A. M. Best Aggregates and Averages 1976 – 2001 Medical Malpractice Industry, Net Basis Occurrence and Claims-Made Combined (Estimated) (Actual) Industry Data 1976 Through 2006

51Title: ProAssurance Growth Strategy Body: We grow only when opportunities arise for profitable growth Hard Market Soft Market M & A de novo Expansion Internal Growth (Gp:) M & A is preferable because of pricing pressure All avenues open because of pricing power
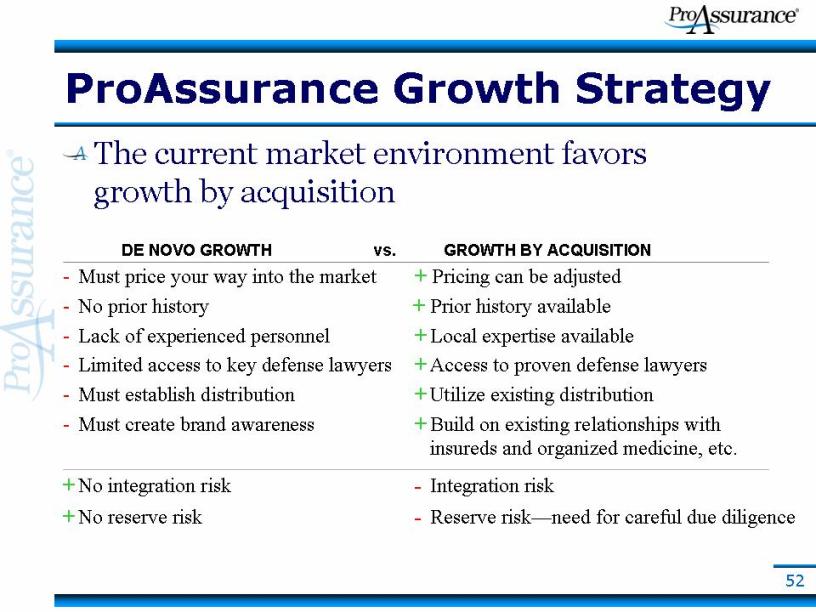
52Title: ProAssurance Growth Strategy Body: The current market environment favors growth by acquisition DE NOVO GROWTH vs. GROWTH BY ACQUISITION - Must price your way into the market + Pricing can be adjusted - No prior history + Prior history available - Lack of experienced personnel + Local expertise available - Limited access to key defense lawyers + Access to proven defense lawyers - Must establish distribution + Utilize existing distribution - Must create brand awareness + Build on existing relationships with insureds and organized medicine, etc. + No integration risk - Integration risk + No reserve risk - Reserve risk—need for careful due diligence
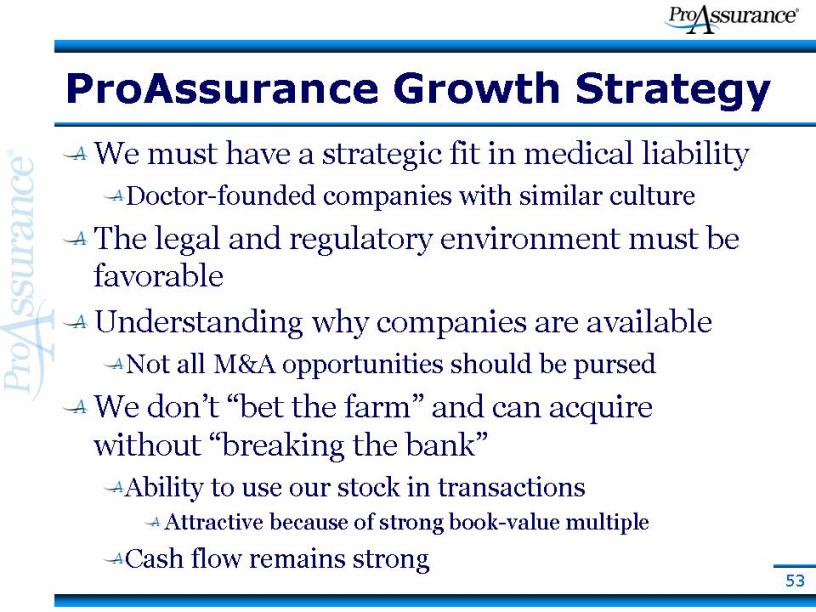
53Title: ProAssurance Growth Strategy Body: We must have a strategic fit in medical liability Doctor-founded companies with similar culture The legal and regulatory environment must be favorable Understanding why companies are available Not all M&A opportunities should be pursed We don’t “bet the farm” and can acquire without “breaking the bank” Ability to use our stock in transactions Attractive because of strong book-value multiple Cash flow remains strong
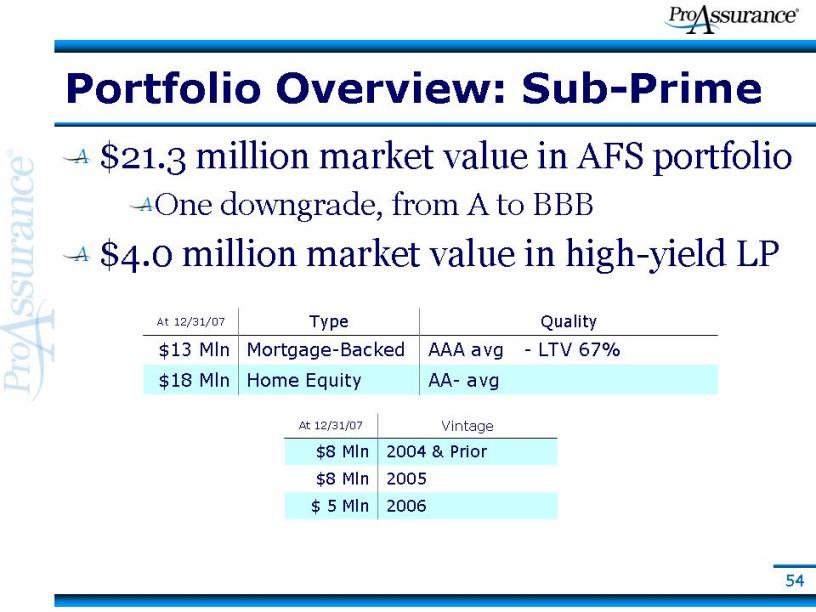
54Title: Portfolio Overview: Sub-Prime Body: $21.3 million market value in AFS portfolio One downgrade, from A to BBB $4.0 million market value in high-yield LP
55
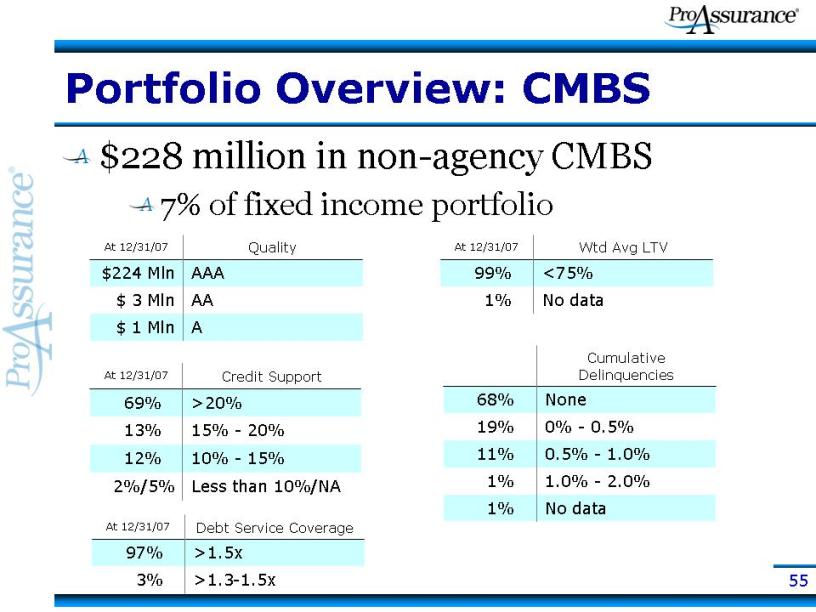
Title: Portfolio Overview: CMBS Body: $228 million in non-agency CMBS 7% of fixed income portfolio