
1
Non-GAAP Measures
Forward Looking Statements
This presentation contains Forward Looking Statements and other information designed
to convey our projections and expectations regarding future results. There are a number
of factors which could cause our actual results to vary materially from those projected in
this presentation. The principal risk factors that may cause these differences are
described in various documents we file with the Securities and Exchange Commission,
such as our current reports on Form 8-K, and our regular reports on Forms 10-Q and 10-
K, particularly in “Item 1A, Risk Factors.” Please review this presentation in
conjunction with a thorough reading and understanding of these risk factors.
This presentation contains Non-GAAP measures, and we may reference
Non-GAAP measures in our remarks. A reconciliation of these measures to GAAP
measures is available in our latest quarterly news release, which is available in the
Investor Relations section of our website, www.ProAssurance.com, and in
the related Current Reports on Form 8K disclosing that release.
Non-GAAP measures in our remarks. A reconciliation of these measures to GAAP
measures is available in our latest quarterly news release, which is available in the
Investor Relations section of our website, www.ProAssurance.com, and in
the related Current Reports on Form 8K disclosing that release.

2
ProAssurance: Quick Facts
Market Cap: $1.9 Billion / Equity: $1.3 Billion
Fifth largest writer of medical liability
Writing business in 30 jurisdictions
Approximately 39,000 policyholders
Approximately 33,000 physicians & dentists
Approximately 5,400 attorneys
Majority in small or solo practice
Highly rated by A. M. Best and Fitch

3
ProAssurance: Our Challenges
The soft market
Finding profitable growth opportunities
Maintaining operational discipline in the face of
irrational competitors
irrational competitors
The financial markets
Balancing risk vs. return
Ensuring enduring balance sheet strength

The Soft Market Challenge:
Finding Profitable Growth
Finding Profitable Growth
The Soft Market Challenge:
Finding Profitable Growth
Finding Profitable Growth

5
Finding Profitable Growth
The Challenges
We take a long-term view
We focus on the bottom line
We will reluctantly turn away unprofitable business
We understand Wall Street’s expectation
for top line growth
for top line growth
But not at any price

6
ProAssurance was
formed by the
combination of two
successful companies
with a history of M & A
formed by the
combination of two
successful companies
with a history of M & A
Profitable Growth Through M & A
ProAssurance has been built through M & A

7
Each company brought
multiple transactions
into ProAssurance at
our founding in 2001
multiple transactions
into ProAssurance at
our founding in 2001
Profitable Growth Through M & A
ProAssurance has been built through M & A

8
We have continued to
grow through M & A
grow through M & A
NCRIC in the mid-
Atlantic
Atlantic
PIC-Wisconsin in the
upper Midwest
upper Midwest
Profitable Growth Through M & A
ProAssurance has been built through M & A

9
We carefully evaluate
the medical and legal
climate of each state
before entering
the medical and legal
climate of each state
before entering
We are the market
leaders in AL, DE, DC,
OH, & WI
leaders in AL, DE, DC,
OH, & WI
Denovo Growth Also Plays a Role
We have added states as opportunities arose

10
New Transactions Strengthen Us
The PICA Group
Leading insurer of podiatric physicians nationwide
Market share: approximately 70%
2007 Premiums: $99 million
Profitable
Well managed
Low integration risk
Joining PRA through a sponsored demutualization
Will operate as a stand-alone subsidiary

11
9,800 DPMs
6,800 other providers
93% Direct
Largest States:
CA, FL, NY, IL, TX
11%
7%
9%
7%
8%
PICA’s Business Profile
PICA’s Business Profile
Adding the PICA Group
Expands our footprint nationwide
Adds ~$99 mln premium and 16,600 insureds

12
New Transactions Strengthen Us
Georgia Lawyers Insurance Company
A leading insurer of Georgia attorneys
2007 Premiums: $5.5 million
Solidifies our presence in the legal professional
liability market
liability market
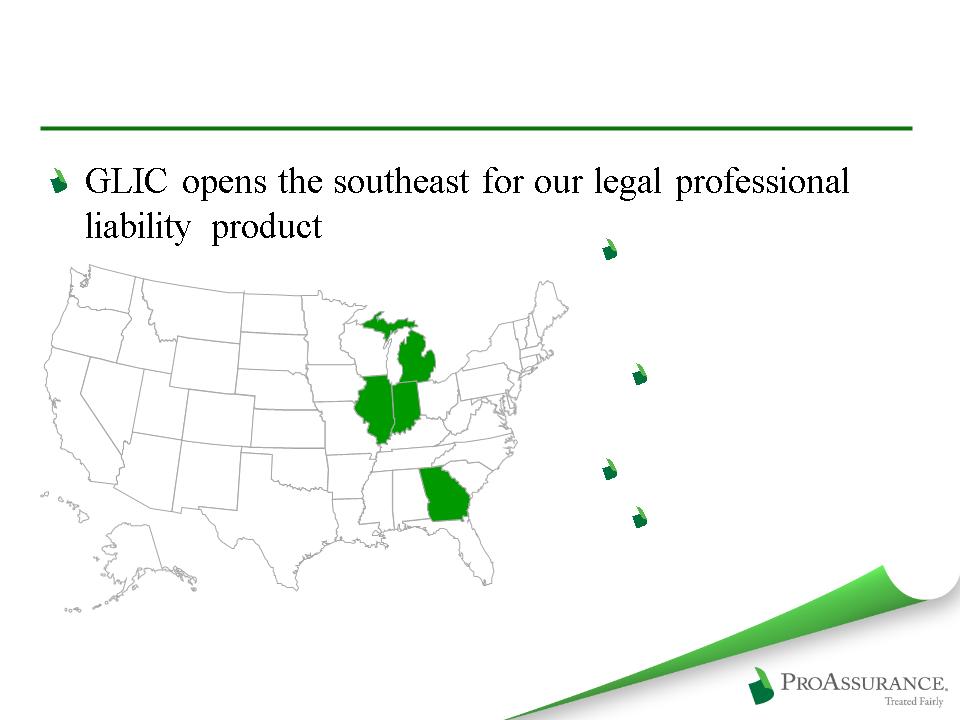
13
GLIC: 2,700 lawyers
Most small and
mid-size firms
mid-size firms
Existing legal book is
5,400 attorneys in 2,8oo
law firms
5,400 attorneys in 2,8oo
law firms
2007 Premium:
$10.4 million
$10.4 million
Adding Georgia Lawyers Insurance
14
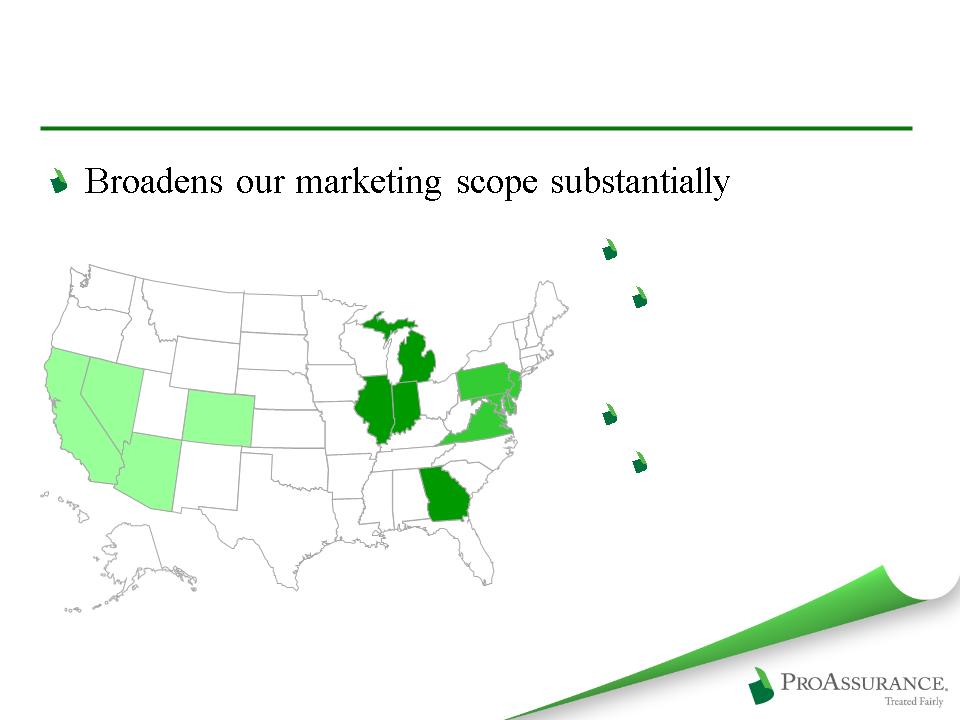
Greyhawk (Phoenix)
AZ, CA, CO, NV,
WA
WA
ProLawyer (Philadelphia)
DE, DC, MD, NJ,
PA, VA
PA, VA
Adding Dedicated Agents for Lawyers

The Soft Market Challenge:
Maintaining Operational Discipline
Maintaining Operational Discipline
The Soft Market Challenge:
Maintaining Operational Discipline
Maintaining Operational Discipline

16
Maintain Operational Discipline
The Challenge
Irrational competitors price their product to protect
their top line and market share
their top line and market share
Mortgaging their future for the status quo
We compete by offering real service and solid
financial security
financial security

17
Our local presence
retains the benefits of
our M & A transactions
through long-term
customer relationships
retains the benefits of
our M & A transactions
through long-term
customer relationships
Efficiencies gained
from consolidated
“back-room” operations
from consolidated
“back-room” operations
Claims / Underwriting Offices
Claims / Underwriting Offices
Operational Discipline: Strategy
Local knowledge remains the key to profitable
professional liability insurance
professional liability insurance

18
Operational Discipline: Strategy
Apply an overall corporate strategy that
recognizes state-by-state differences
recognizes state-by-state differences
Loss trends allowing more aggressive strategies in
long-term markets
long-term markets
Spread risk through geographical
diversification
diversification
Maintain margin
More important than top-line volume
Protect the balance sheet

19
Operational Discipline: Strategy
Charge adequate an adequate premium for
every risk
every risk
Loss-trends drive rates
Retain historical reserving practices
Be prepared when the cycle turns

20
Insureds
Reserves in millions
Strict Underwriting as Claims Peaked.
The Hard Market
The Hard Market
NCRIC
Policyholders
Policyholders
PIC Wis
Policyholders
Policyholders
Market Softening
Maintaining Historical Reserving

21
We try more claims
than any company in
our line of business
than any company in
our line of business
We try more claims
than any company in
our line of business
than any company in
our line of business
Focus on Claims Defense: Our Core
We offer our insureds the
option of an unfettered defense
of their claim
option of an unfettered defense
of their claim
Provides a long-term financial
and marketing advantage
and marketing advantage
A key differentiating factor in
the market as claims data
becomes public
the market as claims data
becomes public

22
Favorable
Outcomes:
83%
Outcomes:
83%
Favorable
Outcomes:
83%
Outcomes:
83%
Favorable
Outcomes:
74%
Outcomes:
74%
Favorable
Outcomes:
74%
Outcomes:
74%
ProAssurance Industry Data
Source: The PIAA
Five Year Average
2003 - 2008
2003 - 2008
Why Claims Strategy Matters
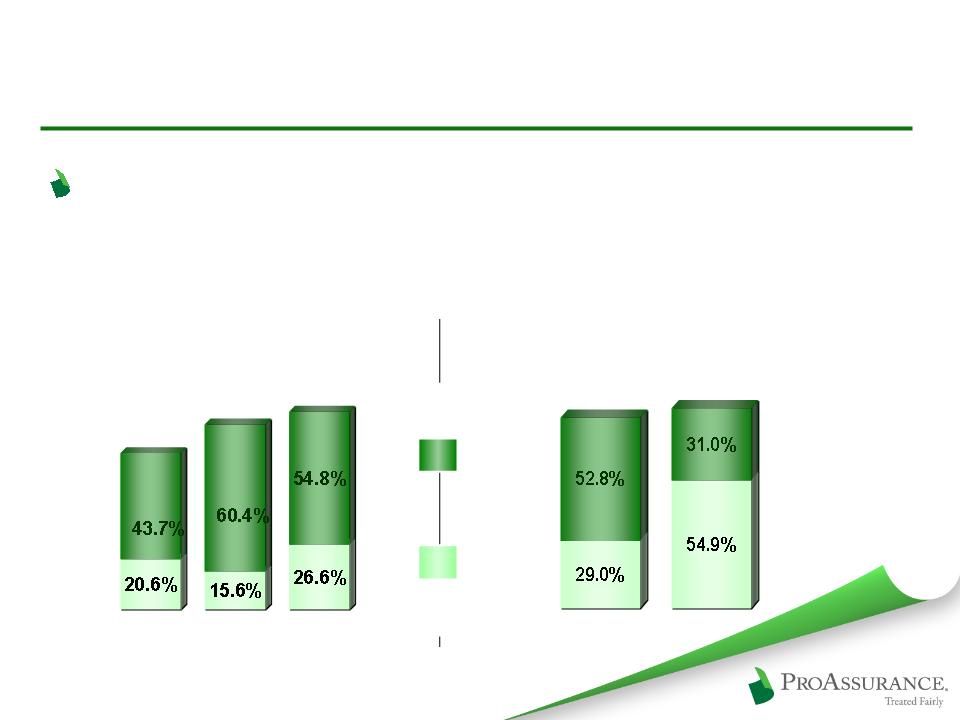
23
Average Statutory Loss Ratio
2003-2007
Industry
85.9%
85.9%
Legal
Payments
Payments
Loss
Payments
Payments
PRA:
81.8%
81.8%
2005
81.4%
ProAssurance Stand Alone
2005 - - 2007
2006
76.0%
*Source: A. M. Best Aggregates & Averages, Medical Malpractice Predominating
2007
64.3%
Why Claims Strategy Matters
Our ability and willingness to defend claims
allows us to achieve better results
allows us to achieve better results

24
Board / Discipline
Board / Discipline / Med Mal
Med Mal disclosure
legislation proposed
legislation proposed
P
P
P
P
P
The Age of Transparency

25
http://12.150.185.184/dca/simple_search.jsp
The Age of Transparency

The Financial Challenge:
Balancing Risk vs. Return
Balancing Risk vs. Return
The Financial Challenge:
Balancing Risk vs. Return
Balancing Risk vs. Return

27
Navigating the Financial Markets
The Challenges
Balancing risk vs. return
Ensuring enduring balance sheet strength
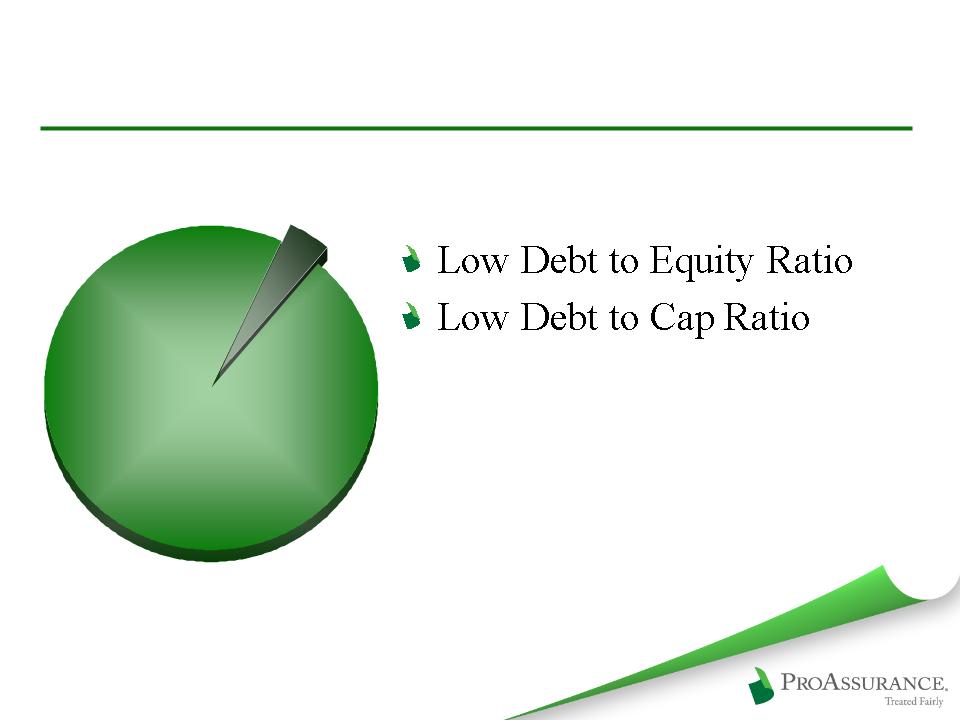
28
AT
9/30/2008
9/30/2008
Stockholder’s Equity
Stockholder’s Equity
96%
96%
Other
Debt
Debt
4%
Balancing Risk vs. Return

29
$3.5 Billion
$3.5 Billion
Portfolio
Portfolio
Fixed Income: 86%
Fixed Income: 86%
Short Term: 9%
Short Term: 9%
Equity and Other
Investments: 3%
Investments: 3%
Equity and Other
Investments: 3%
Investments: 3%
BOLI: 2%
BOLI: 2%
AT
9/30/2008
9/30/2008
Balancing Risk vs. Return

30
Asset
Backed:
Backed:
28%
State/Muni:
44%
Corporate:
19%
BOLI: 2%
Govt/Agency:7%
AT
9/30/2008
9/30/2008
Portfolio: Fixed Income
$3.1 Billion is Fixed Income
Average fixed maturity
duration: 4.4 years
duration: 4.4 years
Average tax-equivalent
yield: 5.41%
yield: 5.41%
97.6% investment grade
Weighted average: AA

31
AT
9/30/2008
9/30/2008

The Financial Challenge:
Ensuring Balance Sheet Strength
Ensuring Balance Sheet Strength
The Financial Challenge:
Ensuring Balance Sheet Strength
Ensuring Balance Sheet Strength

33
All $ amounts in billions
AT
9/30/2008
9/30/2008

34
Y-T-D 2008 Income Statement Highlights
in millions, except per share data
Gross Premiums Written $ 374 $ 440 -15%
Net Investment Income 122 128 -5%
Operating Income $ 127 $ 118 8%
Operating Income/Diluted Share $ 3.73 $ 3.36 11%
Operating Cash Flow $ 142 $ 207 -31%
September 30, Y-OVER-Y
2008 2007 CHANGE

35
Insurance Leverage
(in millions)
0.9:1
0.9:1
Premiums
to Surplus
to Surplus
Premiums
to Surplus
to Surplus
0.9:1
0.9:1
1:1
1:1
0.7:1
0.7:1
0.5:1
0.5:1
0.5:1
0.5:1
0.3:1
0.3:1

36
Book Value Each Year End for ProAssurance and Predecessor Companies
Stock Price
Book Value
CAGR
Since 1991: 14.4%
As PRA: 12.5%
Steady Growth Throughout The Cycles
CAGR
Since 1991: 15.7%
As PRA: 15.8%
Return
Total: 1331%
5 Yr: 140%
10 Yr: 240%

Summary:
Prepared to Meet the Challenges
Prepared to Meet the Challenges
Summary:
Prepared to Meet the Challenges
Prepared to Meet the Challenges

38
ProAssurance
Concentrating on shareholder value
Growing Book Value per Share
Focused on the long-term
Maintaining leading market position
Protecting the balance sheet
Building strength for the next cycle turn
Evaluating all M & A opportunities

39
ProAssurance
Proven success throughout the cycles
Disciplined pricing and underwriting
Consistent reserving policy
Proven claims strategy
Balance sheet strength
Significant share ownership throughout the
company
company
Demonstrated commitment to a long-term
view of a complicated business
view of a complicated business

40
Appendix: Investments
Appendix: Investments

41
$ in 000’s
Performance by Quarter Q1, 2005 - Q3, 2008
AT
9/30/2008
9/30/2008
Equities & Other Investments

42
AT
9/30/2008
9/30/2008
Portfolio: Municipals $1.4B
Current investment policy
requires investment grade
rating prior to apply the
effect of insurance
requires investment grade
rating prior to apply the
effect of insurance

43
Whole Loan LTV: 59%
Alt-A LTV: 63%
Further Details Provided
on Sub-Prime and
CMBS in our handouts
and today’s 8K
on Sub-Prime and
CMBS in our handouts
and today’s 8K
AT
9/30/2008
9/30/2008
44
AT
9/30/2008
9/30/2008
Further Details Provided
on Sub-Prime and
CMBS in our handouts
and today’s 8K
on Sub-Prime and
CMBS in our handouts
and today’s 8K
Portfolio: Corporate

45
Tax Notes are private
placements guaranteed by
banks & secured by Sec 42 tax
credits
placements guaranteed by
banks & secured by Sec 42 tax
credits
AT
9/30/2008
9/30/2008
Further Details Provided
on Sub-Prime and
CMBS in our handouts
and today’s 8K
on Sub-Prime and
CMBS in our handouts
and today’s 8K
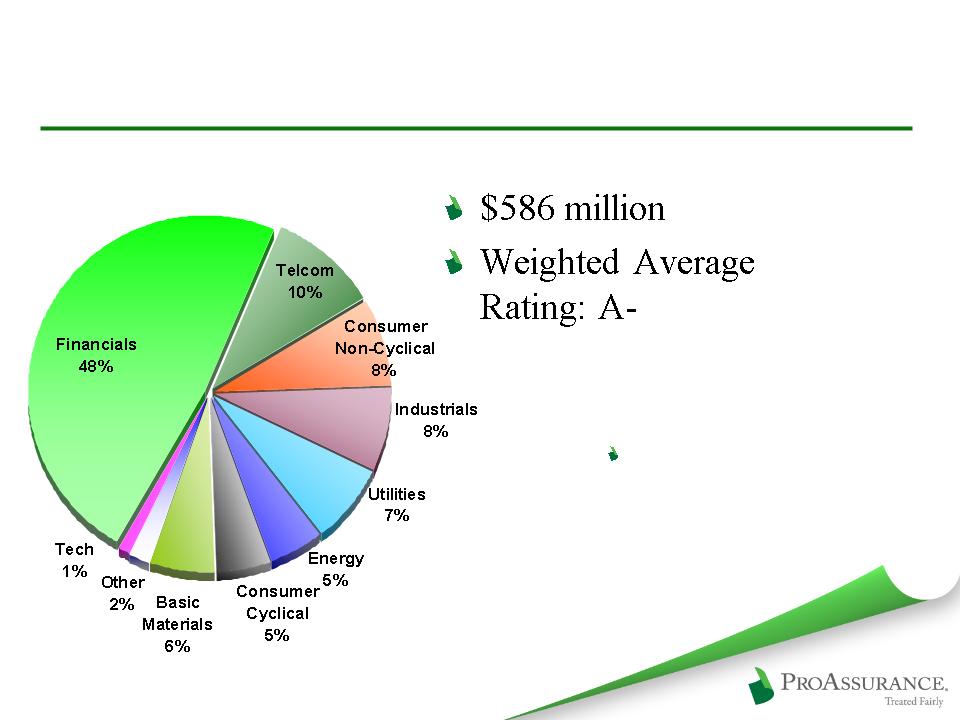
Portfolio: Corporate-Financials

46
AT
9/30/2008
9/30/2008
Portfolio: Treasury/GSE

47
$524 million
Average Rating:
AAA
AAA
AT
9/30/2008
9/30/2008
Portfolio: FRE and FNM

48
AT
9/30/2008
9/30/2008
Portfolio Overview: Short Term

49
AT
9/30/2008
9/30/2008
Portfolio Overview: BOLI

50
At 9/30/08 | Type | Quality |
$8.7Mln | Mortgage-Backed | AA+ avg - LTV 73% |
$6.1Mln | Home Equity | AA avg |
At 09/30/08 | Vintage |
$7.2 Mln | 2004 & Prior |
$4.4 Mln | 2005 |
$2.6 Mln | 2006 |
$0.6 Mln | 2007 |
Portfolio Overview: Sub-Prime
$13.4 million market value in AFS portfolio
$1.4 million market value in high-yield LP

51
At 9/30/08 | Quality |
$191 Mln | AAA |
$2 Mln | AA |
At 9/30/08 | Wtd Avg LTV |
85% | <70% |
15% | <72% |
At 9/30/08 | Credit Support |
80% | >20% |
5% | 15% - 20% |
13% | 10% - 15% |
2% | Less than 10% |
At 9/30/08 | Deal Cumulative Delinquencies |
45% | None |
27% | 0% - 0.5% |
20% | 0.5% - 1.0% |
7% | 1.0% - 2.0% |
1% | 2.0% - 2.2% |
At 9/30/08 | Debt Service Coverage |
78% | >1.5x |
22% | >1.3-1.5x |
Portfolio Overview: CMBS
$193 million in non-agency CMBS
6% of fixed income portfolio

52
AT
9/30/2008
9/30/2008
BofA/ML $25 | NRUC $6 |
Wells/Wach $19 | Depfa ACS $5 |
Morgan Stanley $16 | DeutscheBk $5 |
Citigroup $14 | BONY $5 |
GECC $13 | Unilever Cap $4 |
American Exp $11 | Deere Cap $4 |
JP Morgan $9 | FMCC $3 |
Goldman $8 | Boeing Cap $3 |
Hypotheken Essn $8 | Met Life $3 |
Credit Suisse $7 | Blackrock $3 |
Portfolio: Corporate-Financials
Top 20 Largest Banks & Financials
($ 171 million)

Appendix: Industry History
Appendix: Industry History


