
March 9-11, 2009
W. Stancil Starnes Chairman and Chief Executive Officer
Edward L. Rand, Jr. Chief Financial Officer
Frank B. O’Neil Investor Relations Officer
Raymond James & Associates
Raymond James & Associates
30th Annual Institutional Investors Conference
30th Annual Institutional Investors Conference

2
Forward Looking Statements
This presentation contains Forward Looking Statements and other information designed
to convey our projections and expectations regarding future results. There are a number
of factors which could cause our actual results to vary materially from those projected in
this presentation. The principal risk factors that may cause these differences are
described in various documents we file with the Securities and Exchange Commission,
such as our current reports on Form 8-K, and our regular reports on Forms 10-Q and 10-
K, particularly in “Item 1A, Risk Factors.” Please review this presentation in
conjunction with a thorough reading and understanding of these risk factors.
This presentation contains Non-GAAP measures, and we may reference
Non-GAAP measures in our remarks. A reconciliation of these measures to GAAP
measures is available in our latest quarterly news release, which is available in the
Investor Relations section of our website, www.ProAssurance.com, and in
the related Current Reports on Form 8K disclosing that release.
Non-GAAP measures in our remarks. A reconciliation of these measures to GAAP
measures is available in our latest quarterly news release, which is available in the
Investor Relations section of our website, www.ProAssurance.com, and in
the related Current Reports on Form 8K disclosing that release.
Non-GAAP Measures

3
ProAssurance: Quick Facts
Market Cap: $1.4 Billion / Equity: $1.4 Billion
Fifth largest writer of medical liability
Writing business in 30 jurisdictions
Approximately 39,000 policyholders
32,500 physicians & dentists
8,100 attorneys
Majority in small or solo practice
Highly rated by A. M. Best and Fitch

4
ProAssurance: Long-Term Success
Our Balance Sheet remains strong
Conservative investments
Little debt
Low leverage
Solid stock performance over time
Growing organically and through M & A
Adding over $100 million to our top line in 2009
through M & A
through M & A
Diversifying our risk profile
5
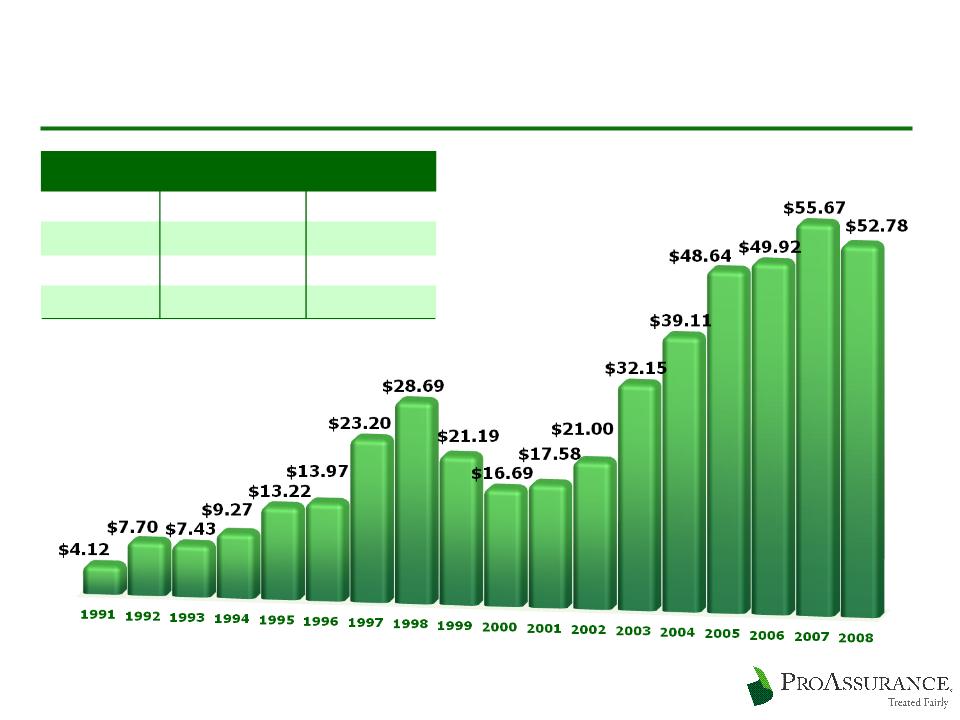
ProAssurance: Long-Term Success
NYSE Closing Price at Each year-End
Stock Price Performance
Cumulative
CAGR
10 year
249%
10%
5 year
135%
6%
1 year
-5%
-5%
6
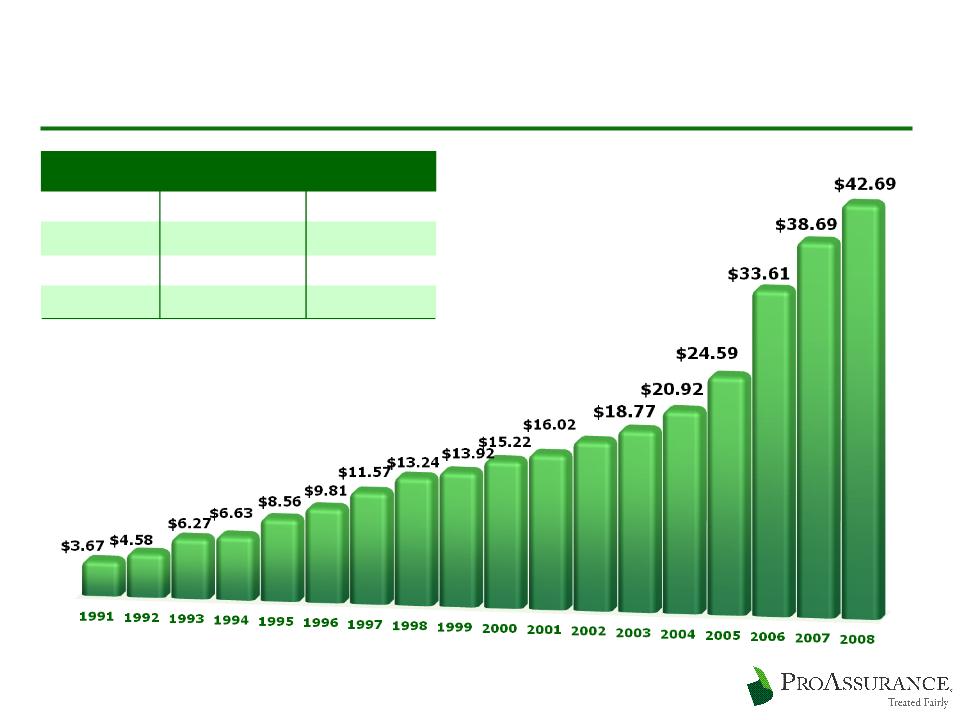
ProAssurance: Long-Term Success
NYSE Closing Price at Each year-End
Book Value Growth
Cumulative
CAGR
10 year
67%
13%
5 year
51%
10%
1 year
10%
10%

7
ProAssurance: 2008 Highlights
Increased Shareholders’ Equity
and Book Value per Share
and Book Value per Share
Significantly increased profits
Announced three M&A transactions
Major brand enhancement project
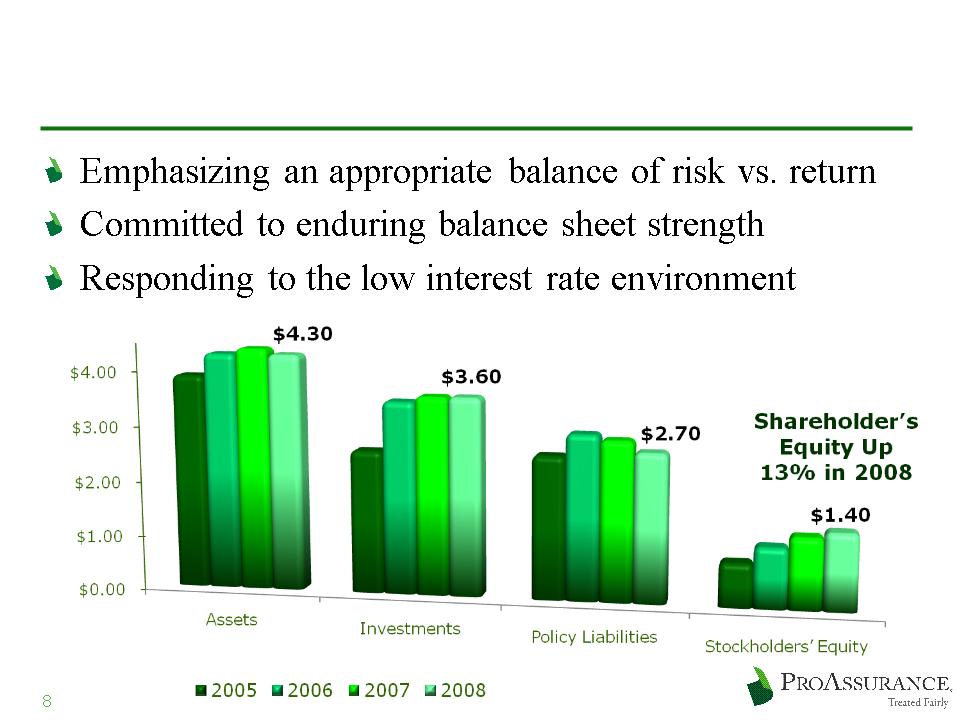
Entering 2009 in a Strong Position
$ amounts
in Billions
in Billions

9
ProAssurance 2008 highlights
in millions, except per share data
Gross Premiums Written $ 472 $ 549 - 14%
Net Investment Income 158 171 - 8%
Total Revenue 567 706 - 20%
Total Expenses 470 561 -16%
Operating Income $ 207 $ 172 20%
Net Income (Includes Investment Losses) $ 178 $ 168 6%
Operating Income/Diluted Share $ 6.07 $ 4.90 24%
Operating Cash Flow $ 165 $ 244 -32%
December 31, Y-OVER-Y
2008 2007 CHANGE
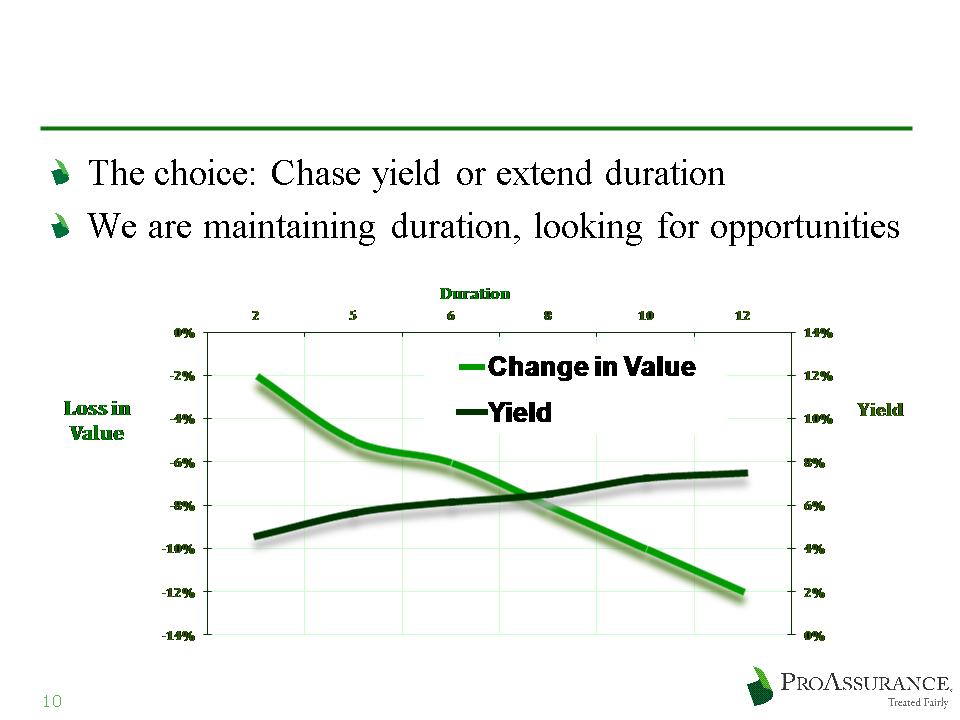
Responding to Low Interest Rates
Loss in value assuming a 100 basis point shift in the yield curve
Yields based on Single A composite corporate debt
11
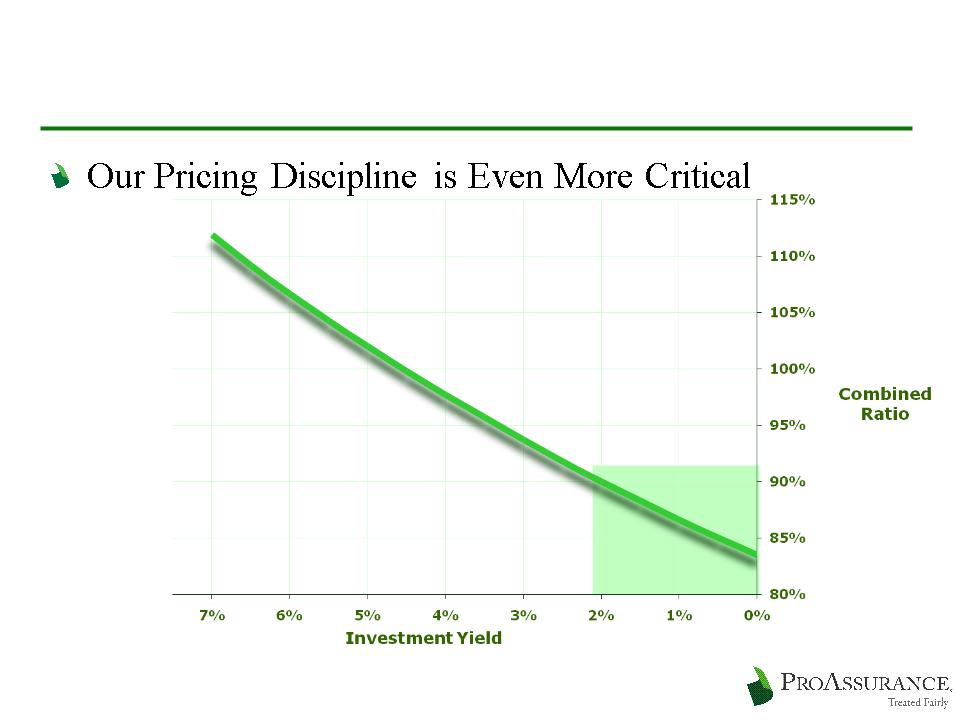
Responding to Low Interest Rates
Loss ratio required
to generate a 13%
after-tax ROE
to generate a 13%
after-tax ROE
Assumes a 1:1 premium to surplus ratio for physicians professional
liability claims-made coverages
liability claims-made coverages
(in millions)
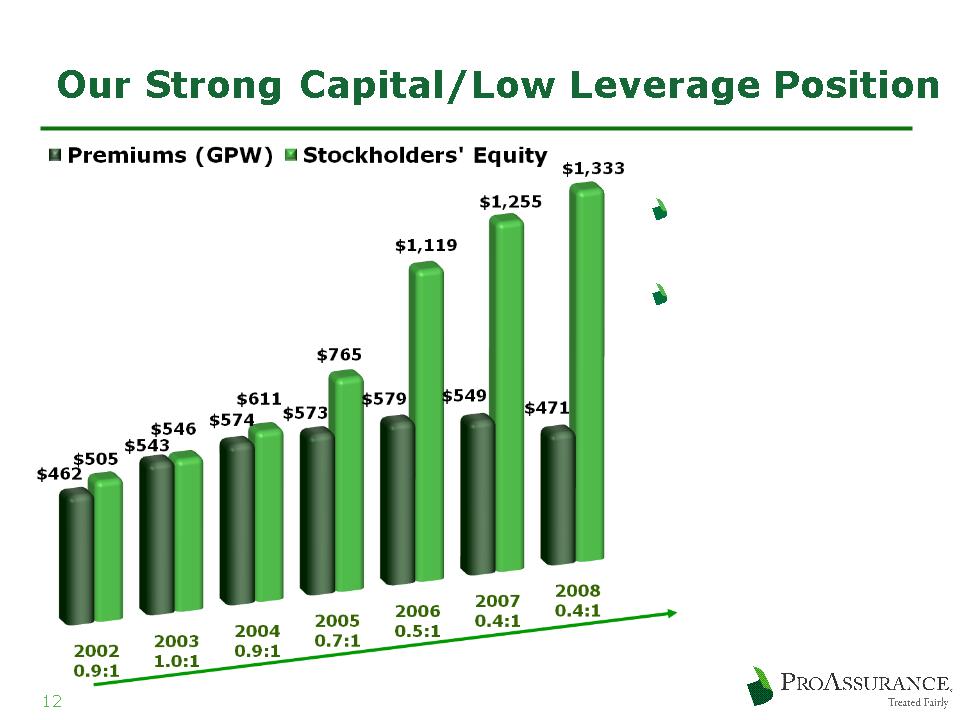
Prepared for an
improving market
improving market
Prudent capital
management
management
Premiums to Surplus
for Each year
for Each year
13
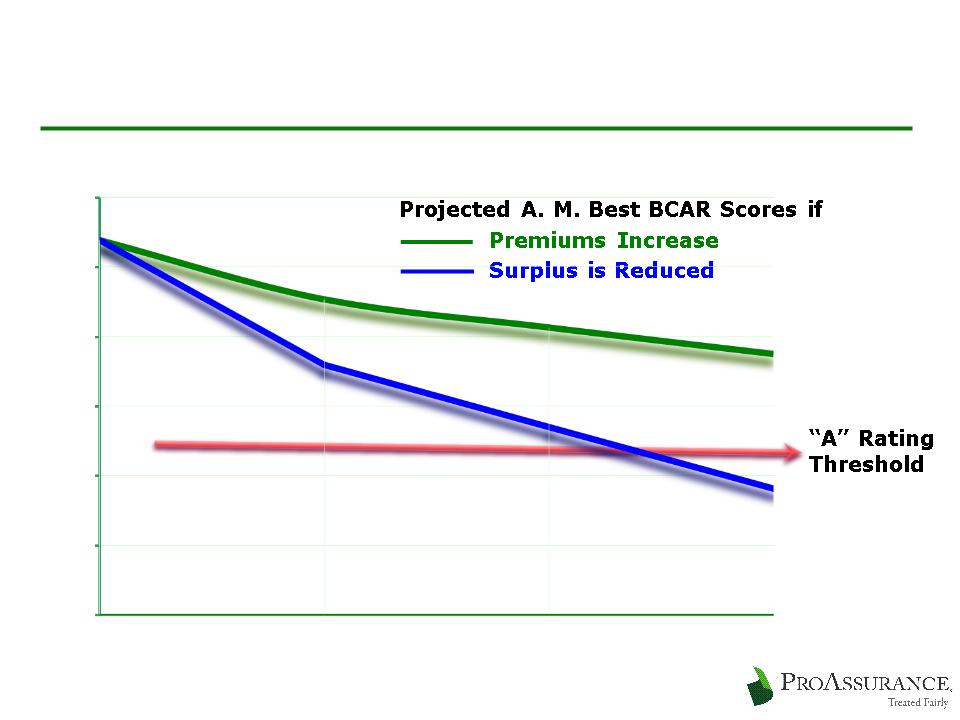
Excess Capital vs. Excess Capacity
14
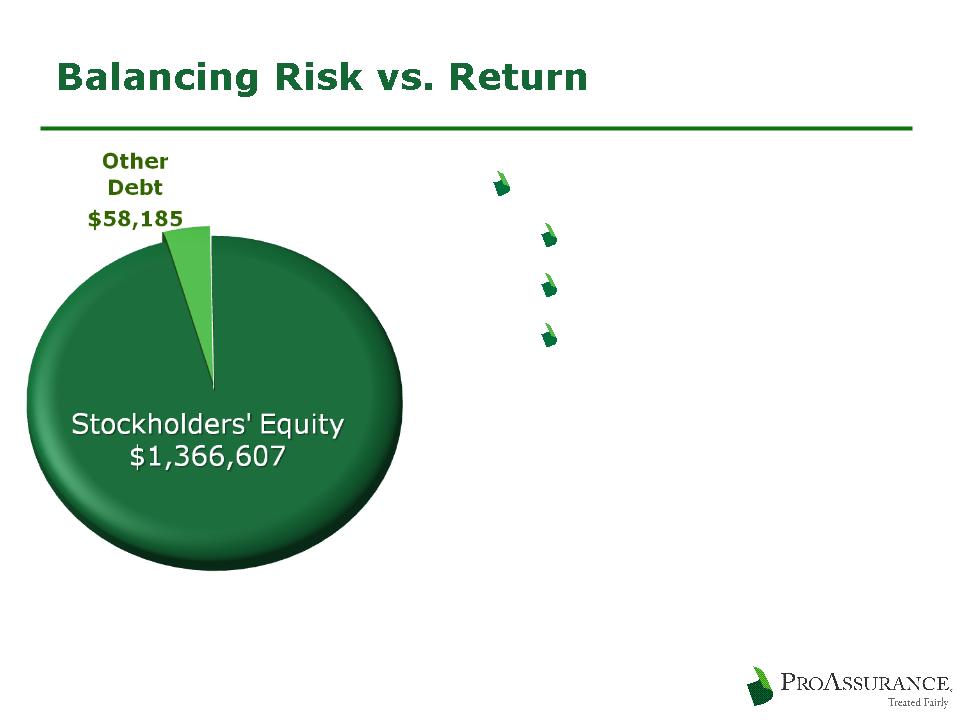
Little Dependence on Debt
Low Debt to Cap Ratio
Little strain on cash flow
Repurchased additional
$22 million of debt in Q4
$22 million of debt in Q4
12/31/2008

Balancing Risk vs. Return
15
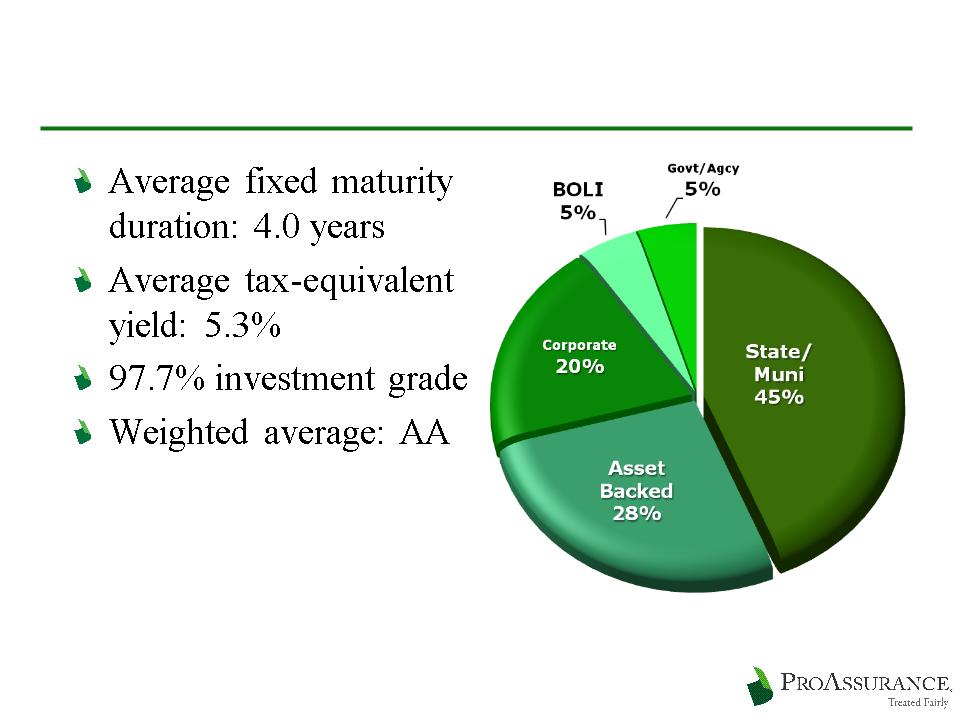
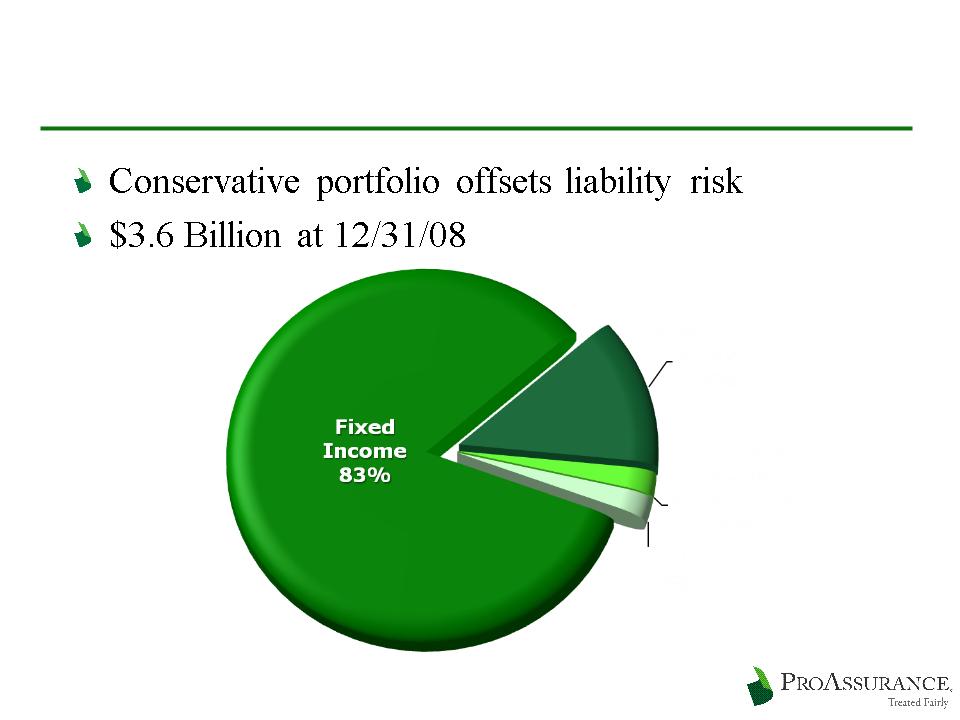
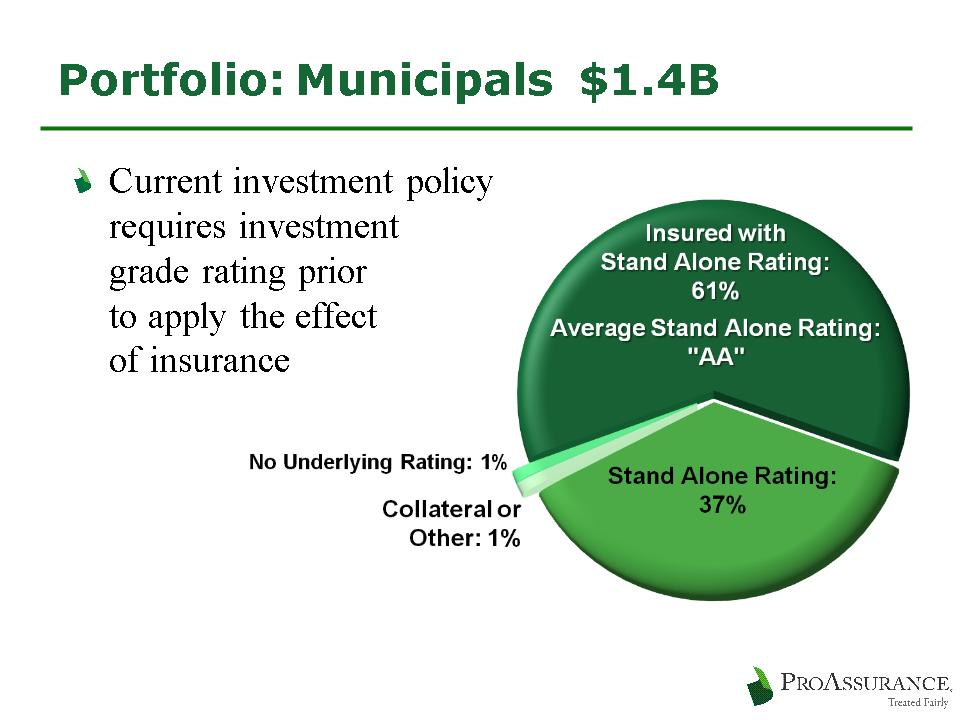
Our conservative investment
philosophy balances
risk and return
philosophy balances
risk and return
We are building cash and short-
term balances as we look to the
future
term balances as we look to the
future
Low equity allocation helps
mute the impact of the volatile
equity markets
mute the impact of the volatile
equity markets
$3.6 Billion
$3.6 Billion
Portfolio
Portfolio
Fixed Income:
83%
83%
Fixed Income:
83%
83%
Short
Term: 13%
Term: 13%
Short
Term: 13%
Term: 13%
Equity and Other
Investments: 2%
Investments: 2%
Equity and Other
Investments: 2%
Investments: 2%
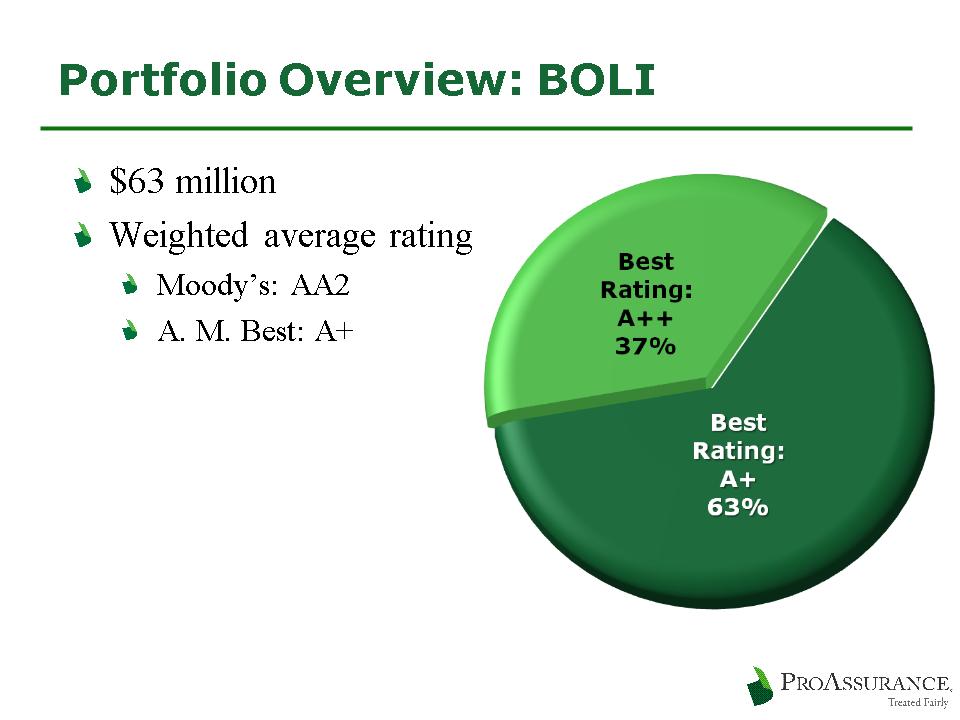
BOLI: 2%
BOLI: 2%
12/31/2008
16
Fixed Income: $3.0 Billion
12/31/2008

19
Operation Discipline: Claims
Our balance sheet strength and deep expertise
ensures our insureds have the option of an
uncompromising defense of their claim
ensures our insureds have the option of an
uncompromising defense of their claim
We defend our insureds at trial more often
than any other company in our line
than any other company in our line
Provides a long-term financial and marketing
advantage
advantage
A key differentiating factor in the market
as claims data becomes public
as claims data becomes public
20
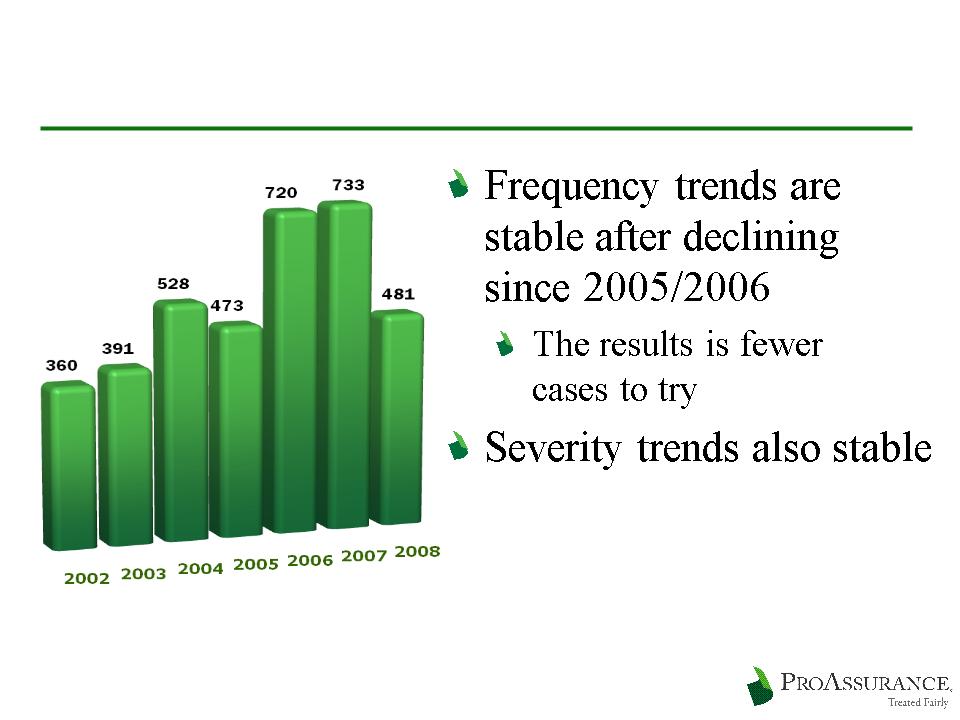
Claims Trends Remain Favorable
ProAssurance Claims Tried
21
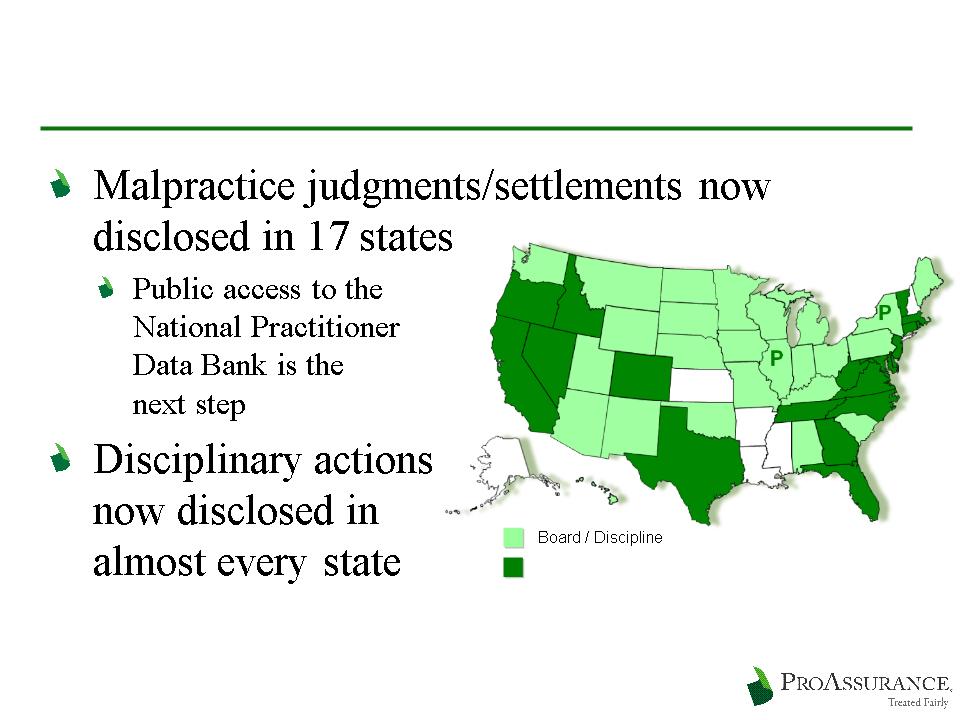
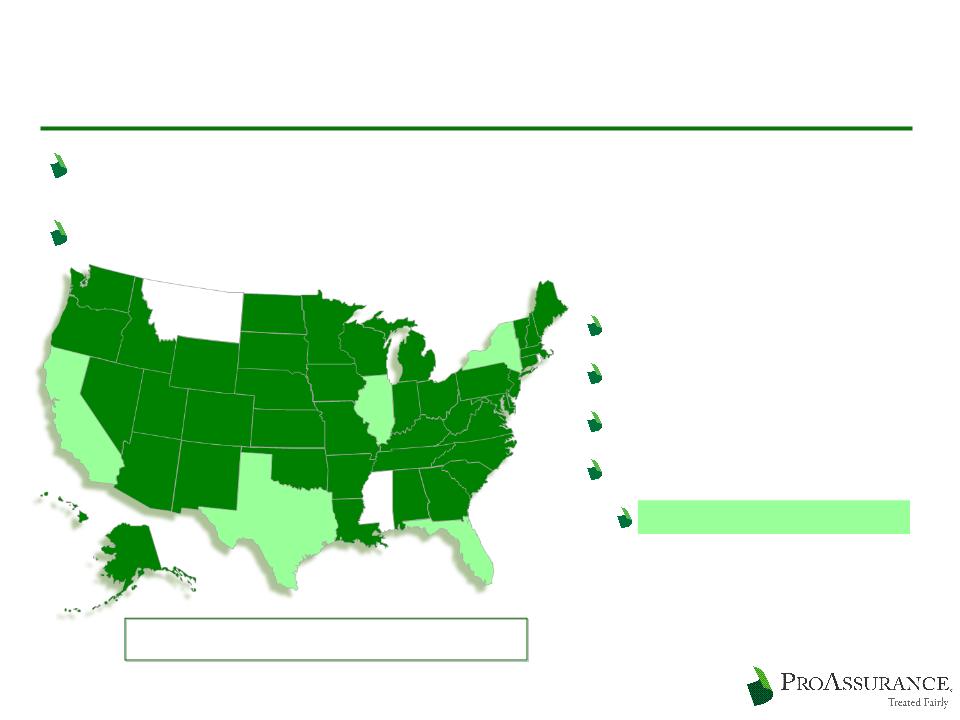
The Age of Transparency
Board / Discipline / Med Mal
Med Mal disclosure
legislation proposed
legislation proposed
P

22
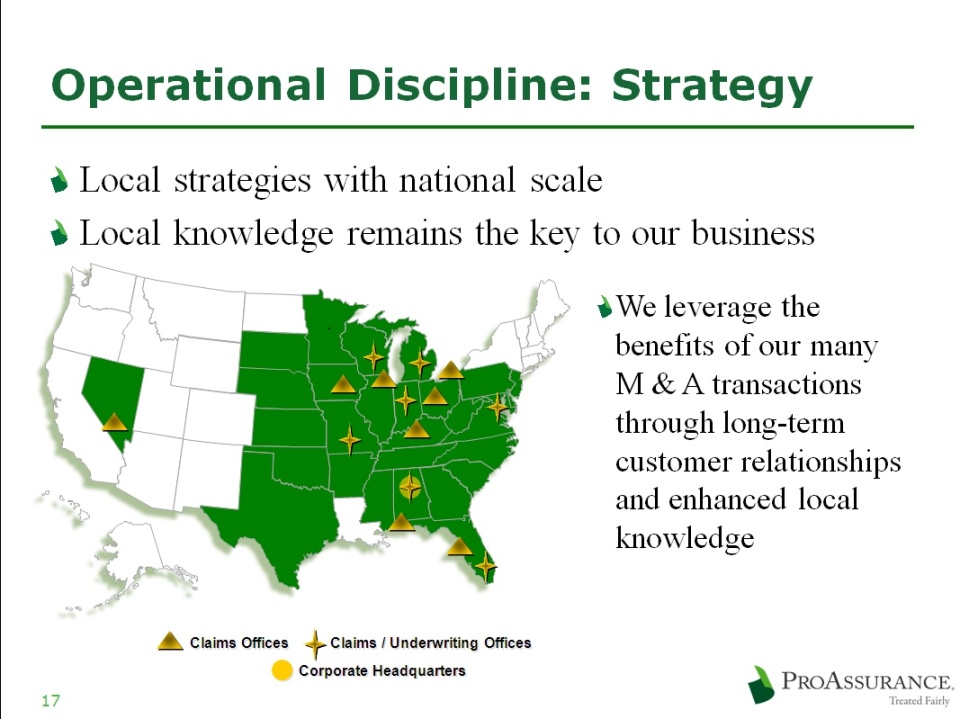
Operational Discipline: Underwriting
Pricing Discipline
Rates on renewing business down less than 10%
from the peak of pricing in 2006
from the peak of pricing in 2006
Rates down 2% in 2007
Rates down 7% in 2008
Use of credits allows us to maintain existing
rate filings
rate filings
Pricing developed using multiple years
Not unduly influenced by current market
conditions
conditions
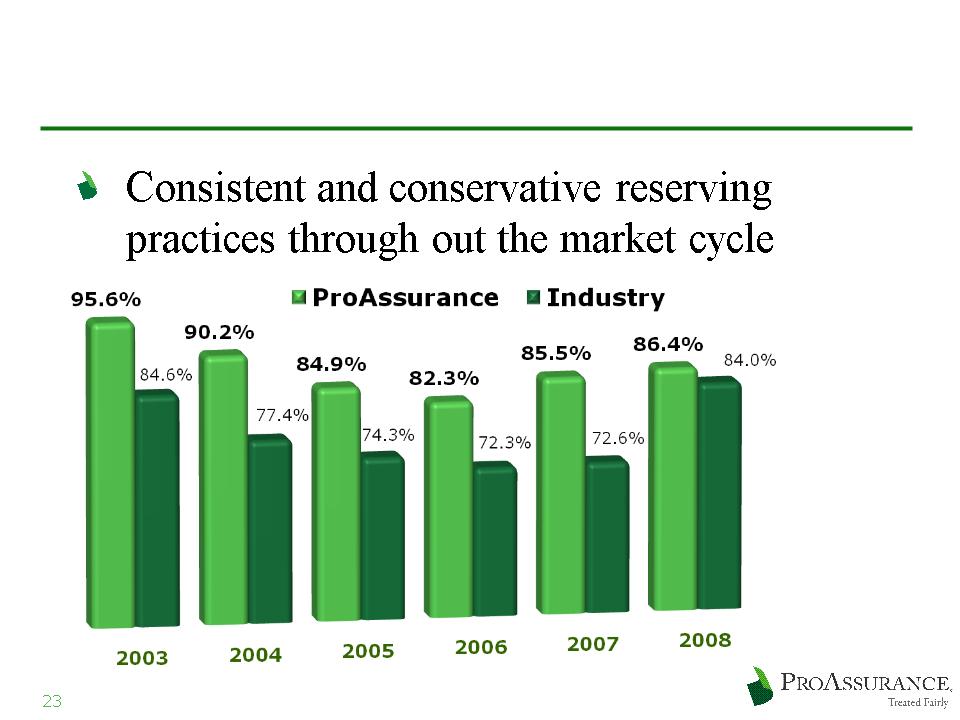
Operational Discipline: Actuarial
Initial Accident Year Loss Ratios
2008 Industry is
A. M. Best Data
Through Q3 2008
A. M. Best Data
Through Q3 2008
24
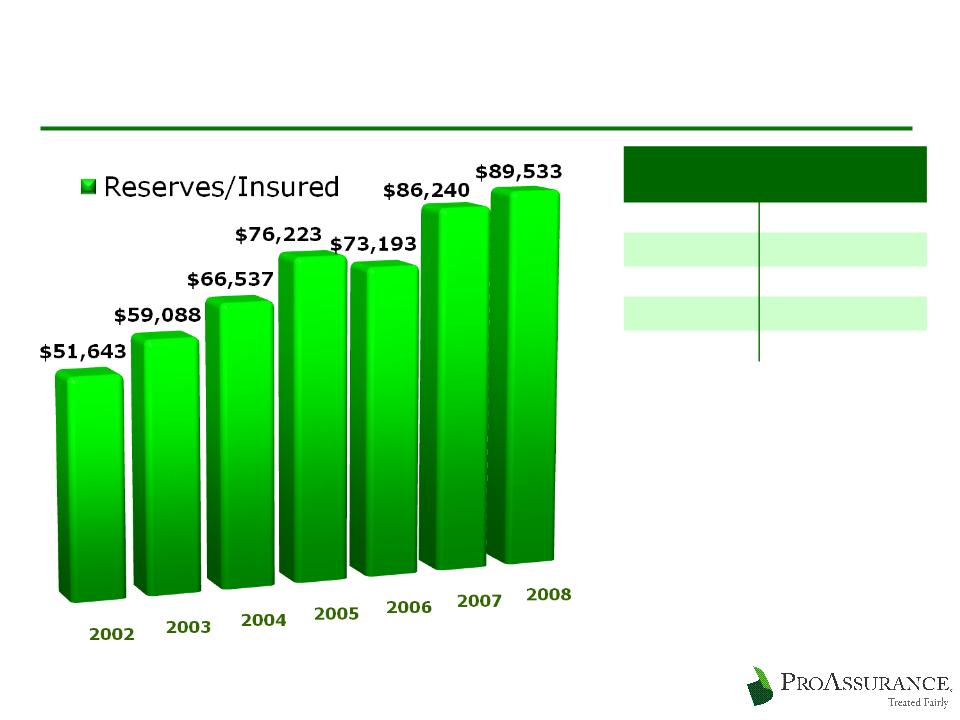
Operational Discipline: Actuarial
Reserve History
(billions)
(billions)
2008
$ 2.7
2007
$ 2.9
2006
$ 2.6
2005
$ 2.2
2004
$ 1.8

25
Growth Opportunities in 2009
We have announced three transactions that
diversify and add significant premium
diversify and add significant premium
We are incrementally expanding our footprint
Wyoming and South Carolina
Taking advantage of improving conditions in
selected markets within our footprint
selected markets within our footprint

26
New Transactions to Strengthen Us
The PICA Group
Leading insurer of podiatric physicians nationwide
National market share: approximately 70%
2008 Premiums: $97 million
Profitable
Well managed
Low integration risk
Joining PRA through a sponsored demutualization
27
Adding the PICA Group
Expands our footprint nationwide
Adds ~16,600 insureds
9,800 DPMs
6,800 other providers
93% Direct
Largest States:
CA, FL, NY, IL, TX
PICA’s Business Profile
PICA’s Business Profile
11%
7%
9%
7%
8%

28
New Transactions to Strengthen Us
Mid-Continent General Agency
Growing market for ancillary healthcare
professional liability
professional liability
Produced $26 million of premium in 2008
Georgia Lawyers Insurance Company
A leading insurer of Georgia attorneys
2008 Premium: $5.7 million
Solidifies our presence in the legal professional
liability market
liability market
Both drive growth in key areas

Summary:
Successfully Executing a Proven,
Disciplined Strategy
Successfully Executing a Proven,
Disciplined Strategy
Summary:
Successfully Executing a Proven,
Disciplined Strategy
Successfully Executing a Proven,
Disciplined Strategy

30
The Promise of Treat Fairly
Treated Fairly is our brand enhancement initiative
Affirms our existing, enduring commitment to
every stakeholder
every stakeholder
Insureds
Agents
Investors
The public
We run our business as owners who are
rewarded for long-term success
rewarded for long-term success

31
ProAssurance
Concentrating on shareholder value
Growing Book Value per Share
Focused on the long-term
Maintaining leading market position
Protecting the balance sheet
Building strength for the next cycle turn
Evaluating all M & A opportunities

32
ProAssurance
Proven success throughout the cycles
Disciplined pricing and underwriting
Consistent reserving policy
Proven claims strategy
Balance sheet strength
Significant share ownership throughout the
company
company
Demonstrated commitment to a long-term
view of a complicated business
view of a complicated business

Appendix: Claims Data
Appendix: Claims Data
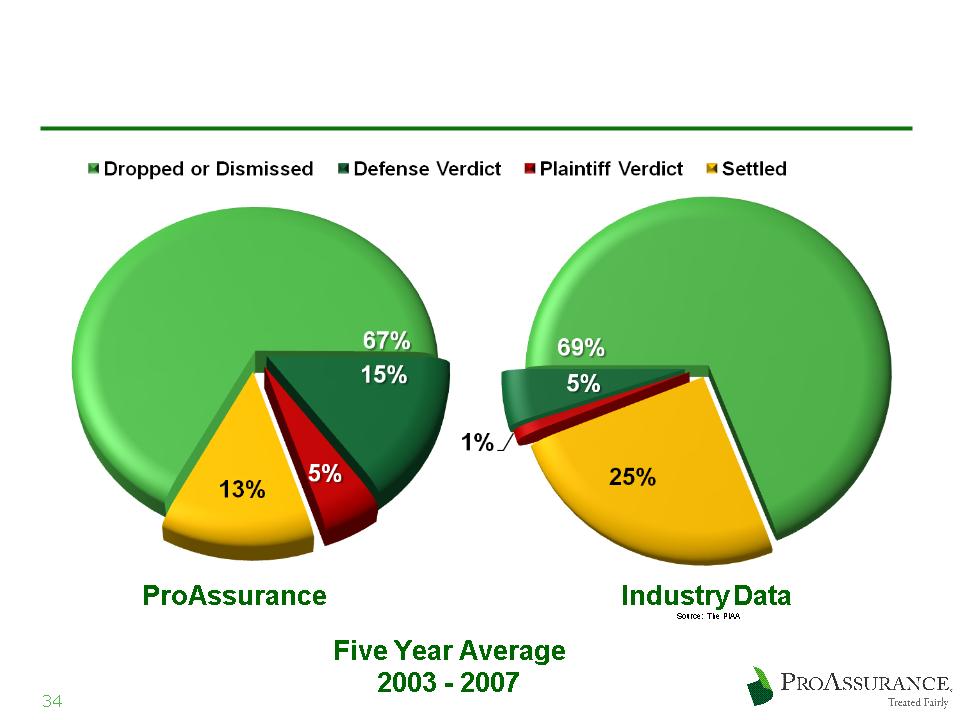
Why Claims Strategy Matters
Favorable
Outcomes:
82%
Outcomes:
82%
Favorable
Outcomes:
82%
Outcomes:
82%
Favorable
Outcomes:
74%
Outcomes:
74%
Favorable
Outcomes:
74%
Outcomes:
74%
Why Claims Strategy Matters
Our ability and willingness to defend claims
allows us to achieve better results
allows us to achieve better results
81.4%
ProAssurance Stand Alone
2005 - - 2007
76.0%
64.3%

Appendix: Investments
Appendix: Investments
37
Portfolio Overview
12/31/2008
38
12/31/2008
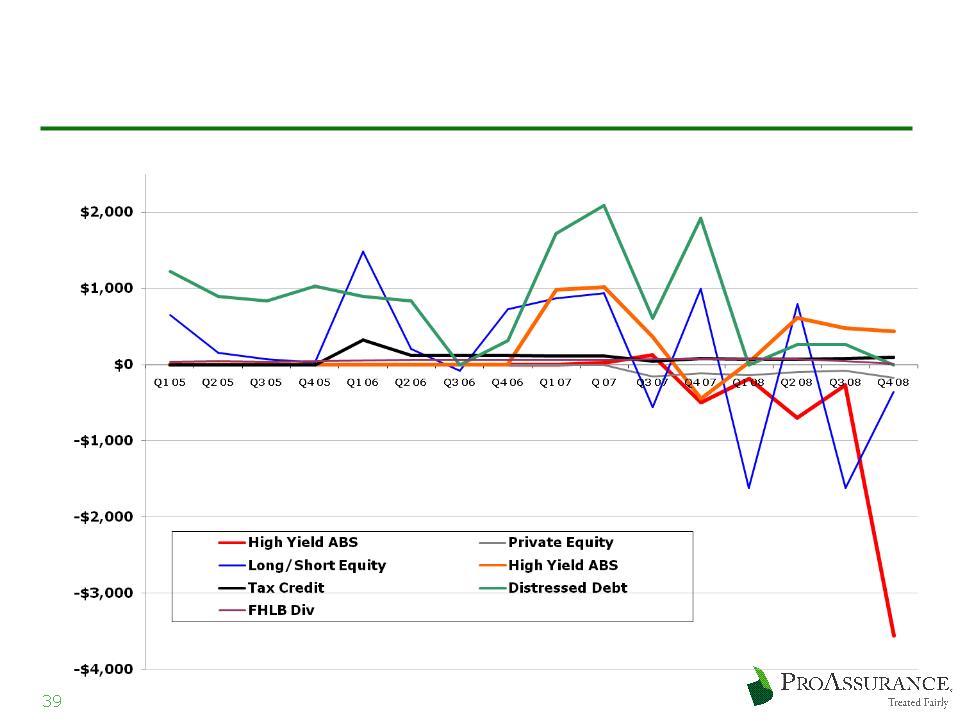
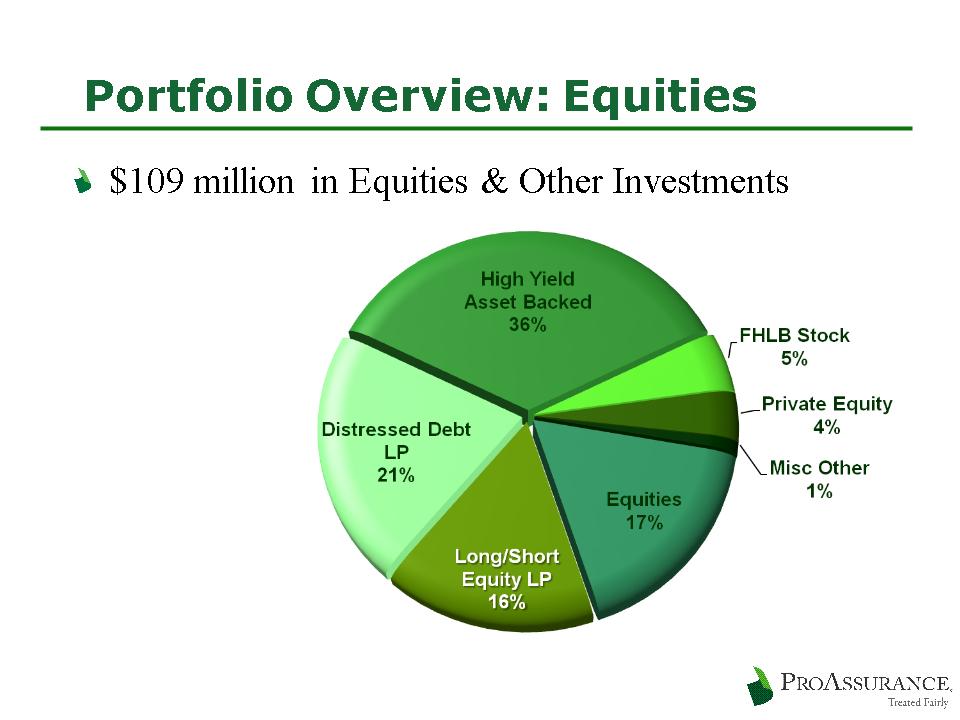
Equities & Other Investments
$ in 000’s
Performance Q1, 2005 - Q4, 2008
40
12/31/2008
41
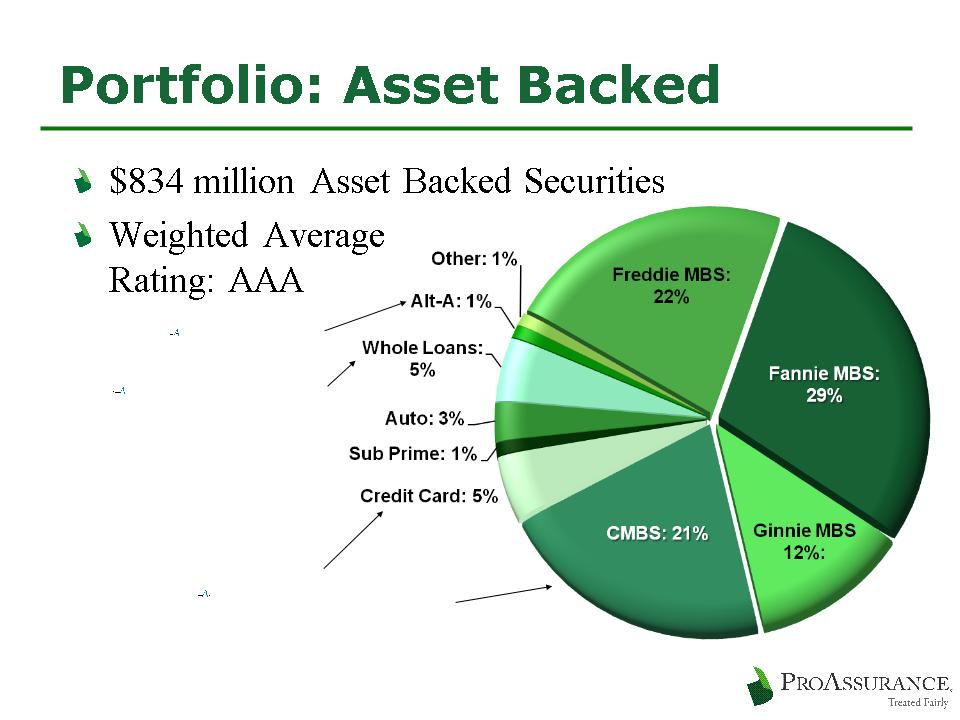
Alt-A LTV: 62%
Whole Loan LTV: 57%
Further Details Provided on
Sub-Prime and CMBS on
following pages
Sub-Prime and CMBS on
following pages
Bloomberg Data
12/31/2008
12/31/2008
42
Portfolio Overview: Sub-Prime
$11.7 million market value in AFS portfolio
$2.5 million unrealized loss)
$5.0 million market value in high-yield LP
rated BB
rated BB
LP’s focus is distressed ABS)
At 12/31/08
Type
Quality
$6.9Mln
Mortgage-Backed
AA+ avg - LTV 72%
$4.7Mln
Home Equity
AA avg
At 12/31/08
Vintage
$6.2 Mln
2004 & Prior
$3.7 Mln
2005
Quality & Vintage information only on direct holdings
12/31/08
12/31/08
43
Portfolio Overview: CMBS
$171 million Fair Value in non-agency CMBS
Book Value: $194 Book Value
6% of fixed income portfolio
At 12/31/08
Quality
$169 Mln
AAA
$2 Mln
AA
At 12/31/08
Wtd Avg LTV
85%
<70%
15%
<72%
At 12/31/08
Credit Support
78%
>20%
7%
15% - 20%
12%
10% - 15%
3%
Less than 10%
At 12/31/08
Deal Cumulative Delinquencies
32%
None
36%
0% - 0.5%
16%
0.5% - - 1.0%
14%
1.0% - - 2.0%
2%
2.0% - - 2.6%
At 12/31/08
Debt Service Coverage
89%
>1.5x
11%
>1.2-1.5x
AT
12/31/2008
12/31/2008
44
12/31/2008

45
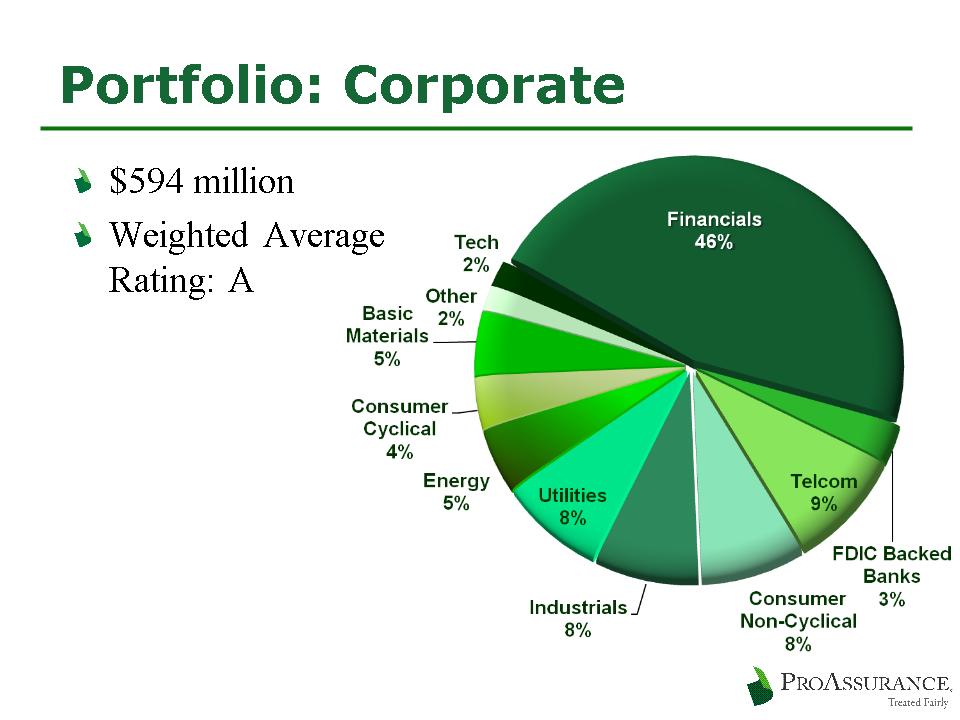
Portfolio: Corporate-Financials
Top 20 Largest Banks/Financials: $ 200 million
$17 mm FDIC
BoA/ML $27 ($1)
Credit Suisse $7
Wells/Wachovia $21
Depfa ACS $5
M Stanley $24 ($4)
DeutscheBk $5
JPM Chase $20 ($10)
BONY $5
GECC $13
Unilever Cap $4
Amer Exp $12
John Deere Cap $4
Citi $11
CIT $4
Goldman $9
Met Life $4
Hypotheken Essn $9
FMCC $4
NRUC $9
CAT Fin $3
FDIC backed listed in parentheses
12/31/2008
46
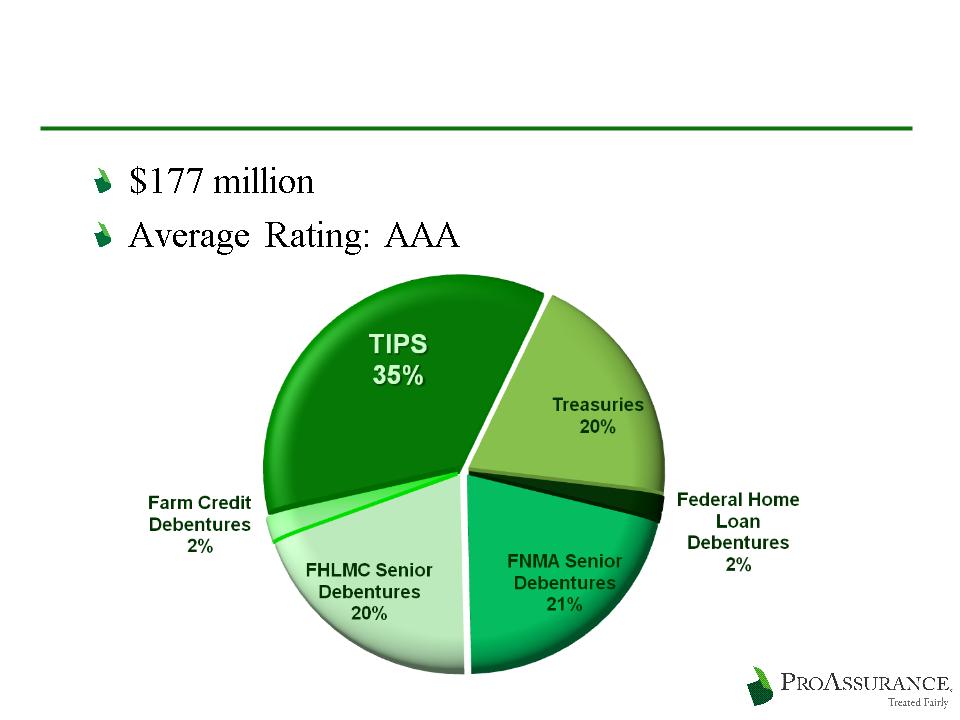
Portfolio: Treasury/GSE
12/31/2008
47
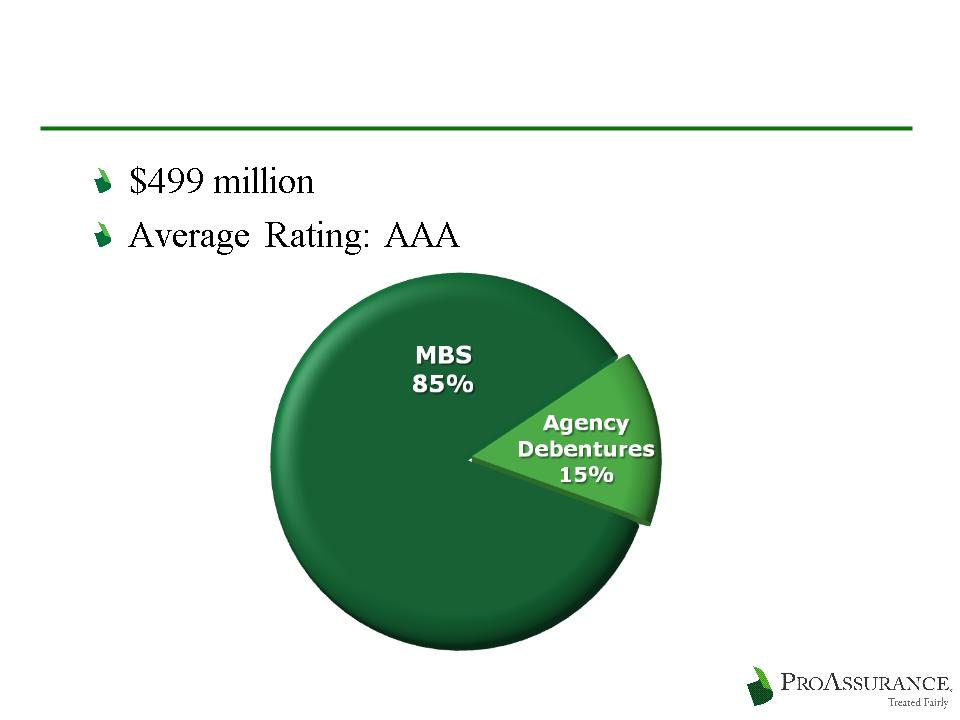
Portfolio: FRE and FNM
12/31/2008
48
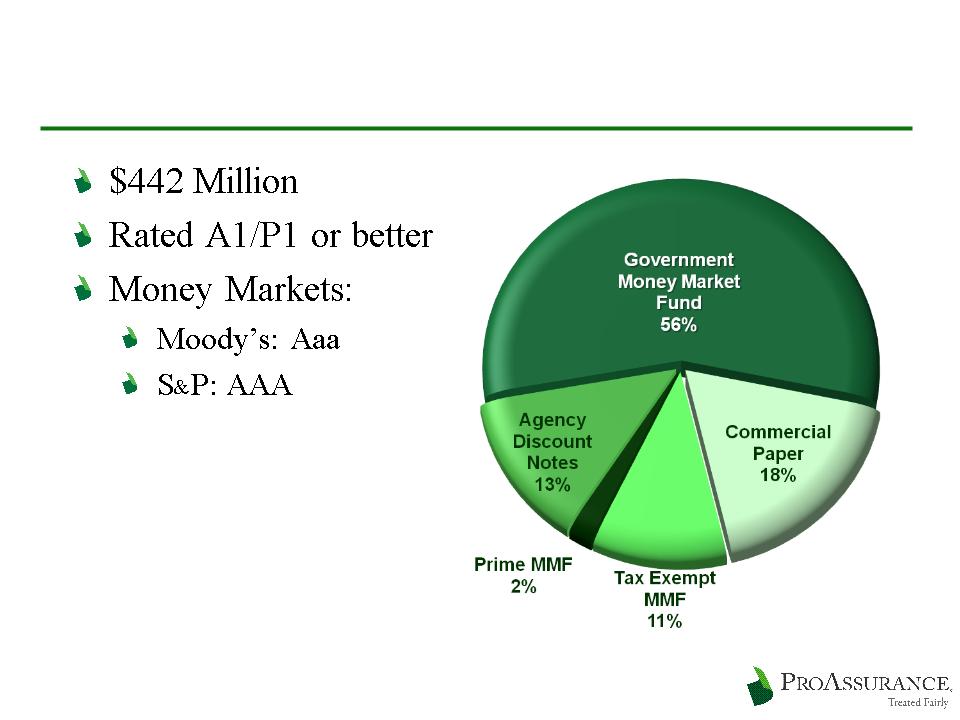
Portfolio Overview: Short Term
12/31/2008
49
12/31/2008

Appendix: Industry History
Appendix: Industry History
51
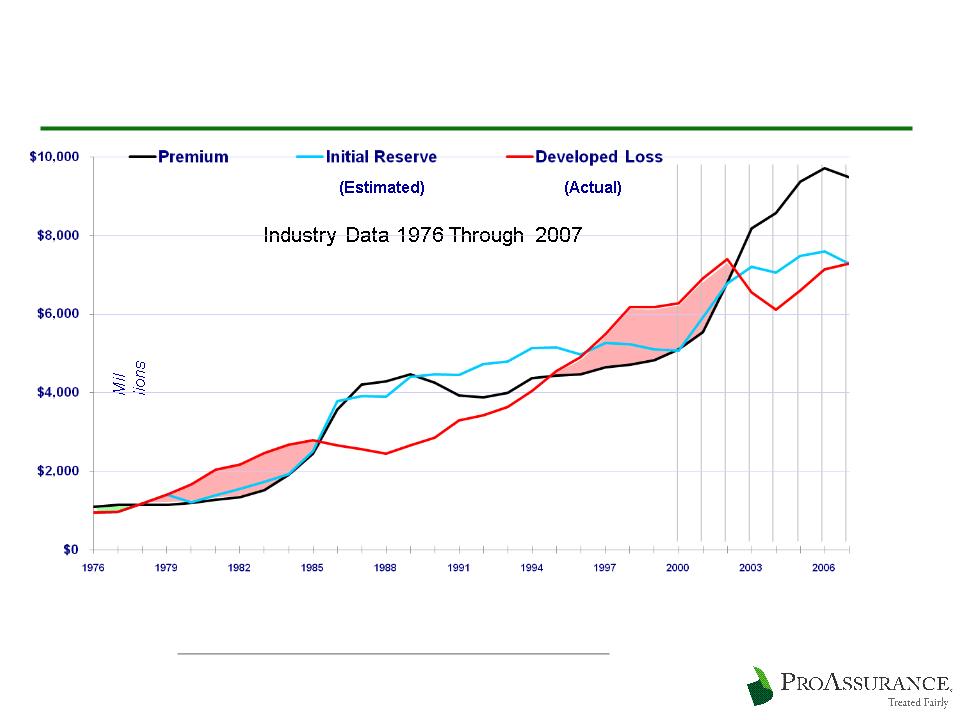
Will History Repeat Itself—Again?
Source: A. M. Best Aggregates and Averages 1976 - 2001
Medical Malpractice Industry, Net Basis Occurrence and Claims-Made Combined
Medical Malpractice Industry, Net Basis Occurrence and Claims-Made Combined

Appendix: M & A History
Appendix: M & A History
53
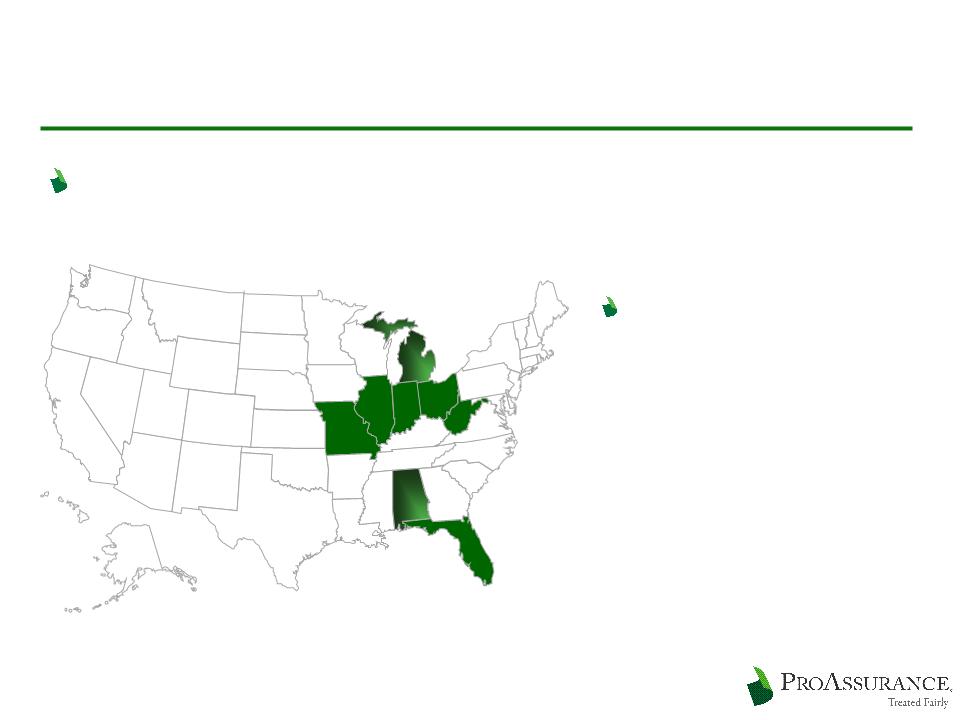
Profitable Growth Through M & A
ProAssurance has been built through M & A
ProAssurance was
formed by the
combination of two
successful companies
with a history of M & A
formed by the
combination of two
successful companies
with a history of M & A
54
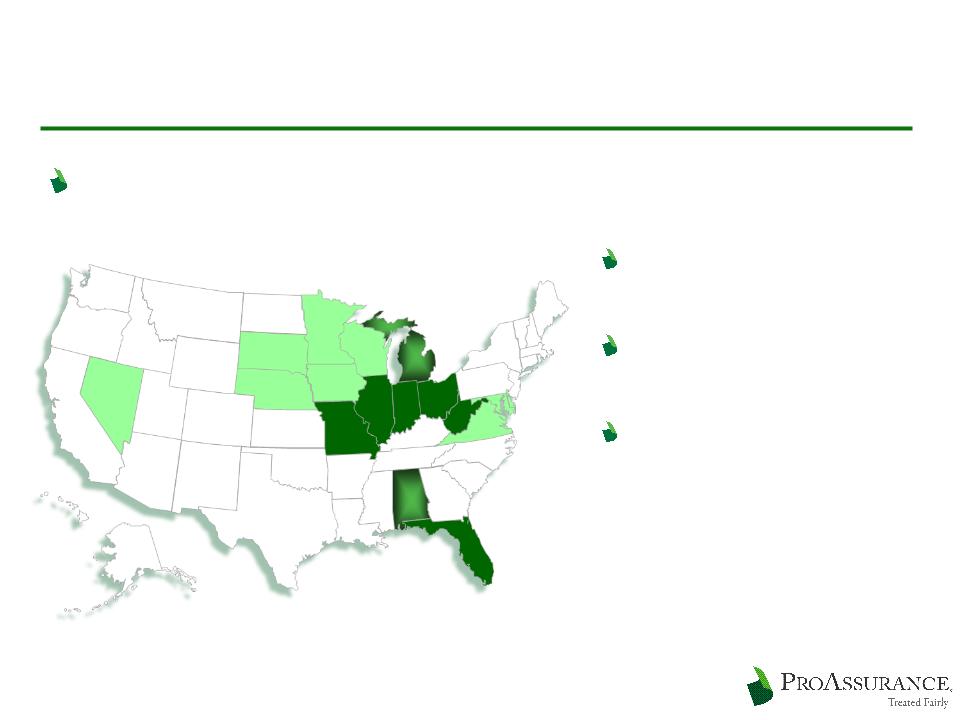
Profitable Growth Through M & A
ProAssurance has been built through M & A
Each company brought
multiple transactions
into ProAssurance at
our founding in 2001
multiple transactions
into ProAssurance at
our founding in 2001
55
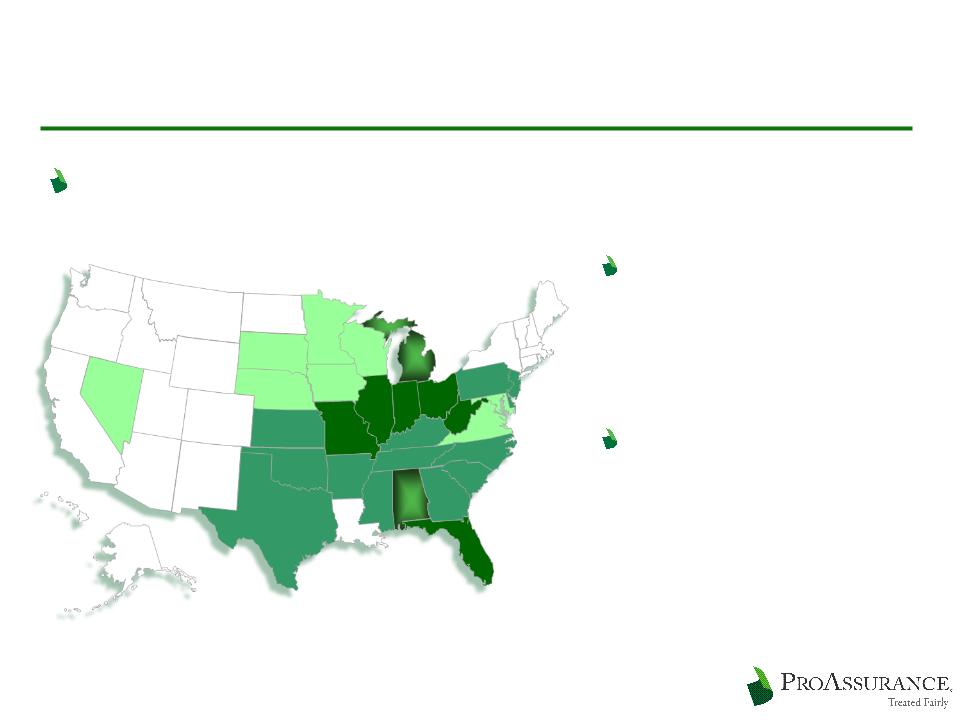
Profitable Growth Through M & A
ProAssurance has been built through M & A
We have continued to
grow through M & A
grow through M & A
NCRIC in the mid-
Atlantic
Atlantic
PIC-Wisconsin in the
upper Midwest
upper Midwest
56
Denovo Growth Also Plays a Role
We have added states as opportunities arose
We carefully evaluate
the medical and legal
climate of each state
before entering
the medical and legal
climate of each state
before entering
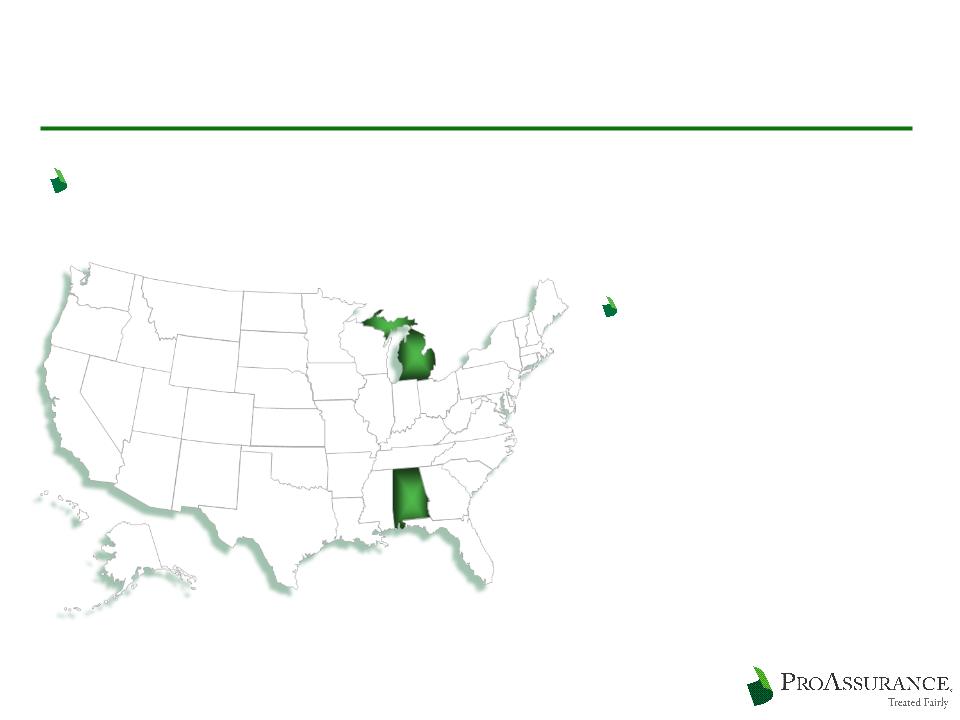
We are the market
leaders in AL, DE, DC,
OH, & WI
leaders in AL, DE, DC,
OH, & WI