
Forward Looking Statements
This presentation contains Forward Looking Statements and other information designed
to convey our projections and expectations regarding future results. There are a number
of factors which could cause our actual results to vary materially from those projected in
this presentation. The principal risk factors that may cause these differences are
described in various documents we file with the Securities and Exchange Commission,
such as our current reports on Form 8-K, and our regular reports on Forms 10-Q and 10-
K, particularly in “Item 1A, Risk Factors.” Please review this presentation in
conjunction with a thorough reading and understanding of these risk factors.
This presentation contains Non-GAAP measures, and we may reference
Non-GAAP measures in our remarks. A reconciliation of these measures to GAAP
measures is available in our latest quarterly news release, which is available in the
Investor Relations section of our website, www.ProAssurance.com, and in
the related Current Reports on Form 8K disclosing that release.
Non-GAAP measures in our remarks. A reconciliation of these measures to GAAP
measures is available in our latest quarterly news release, which is available in the
Investor Relations section of our website, www.ProAssurance.com, and in
the related Current Reports on Form 8K disclosing that release.
1
Non-GAAP Measures

ProAssurance: Quick Facts
Market Cap: $1.5 Billion / Equity: $1.4 Billion
Fifth largest1 writer of medical liability
Writing business in 491 jurisdictions
More than 60,0002 policyholders
45,000 physicians and dentists
7,000 ancillary and other healthcare professionals
8,100 attorneys
Majority in small or solo practice
Highly rated by A. M. Best and Fitch
2
1 Includes PICA 2 Includes PICA and Georgia
Lawyers
Lawyers

ProAssurance: Long-Term Success
Successful performance in a challenging financial
market and a difficult line of insurance
market and a difficult line of insurance
Maintaining profitability
Completion of three M&A transactions in 2009
that will allow us to grow the top line
that will allow us to grow the top line
3

ProAssurance: Long-Term Success
Our Balance Sheet remains strong
Conservative investments
Little debt
Low leverage
Solid stock performance over time
Growing organically and through M & A
Adding over $100 million in annualized premium
to our top line in 2009 through M & A
to our top line in 2009 through M & A
Diversifying our risk profile
4
ProAssurance: Long-Term Success
5
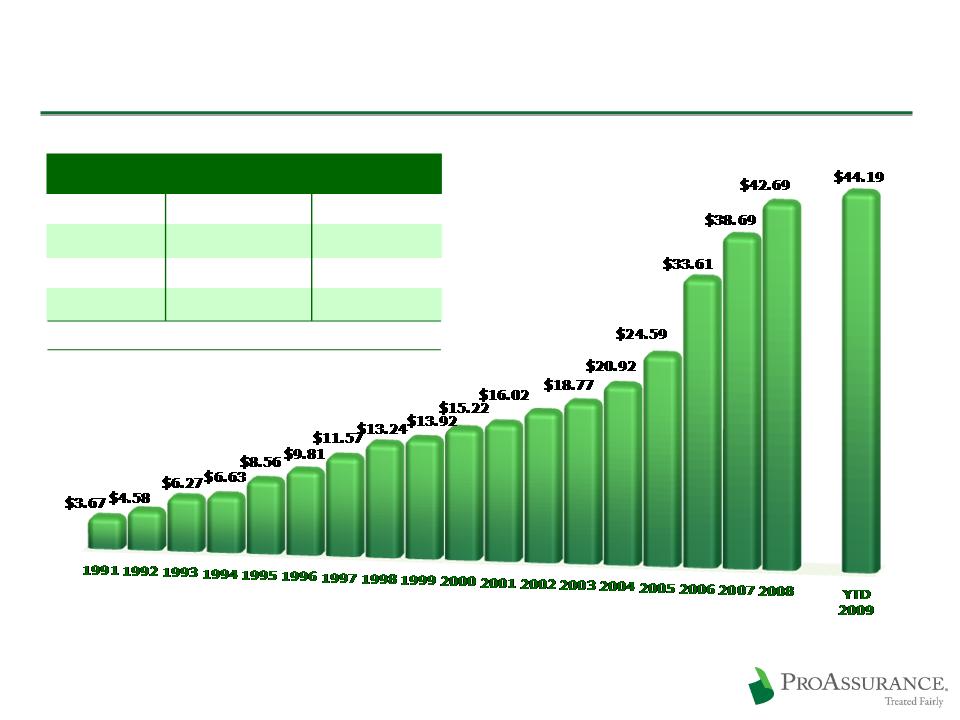
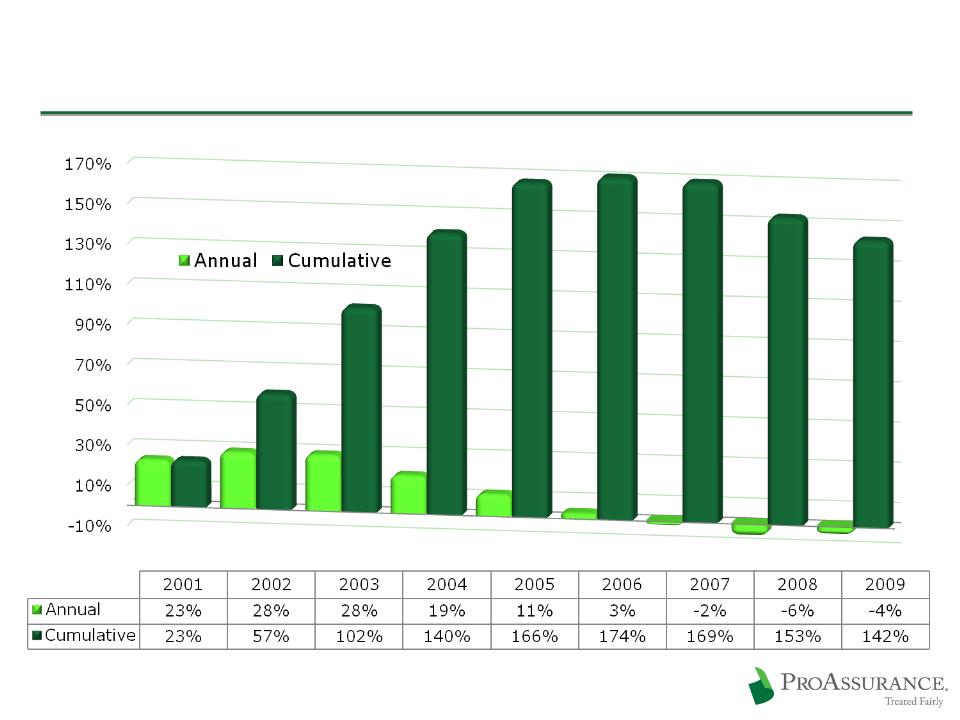
Book Value per Share
Book Value Growth
Cumulative
CAGR
10 year
222%
12%
5 year
127%
18%
1 year
10%
10%
Measured through Year-End 2008
Current Industry Status

Opportunities & Strategies

Key Opportunities
New insurance buyers will emerge as
healthcare reform evolves
healthcare reform evolves
The outcome of medical liability claims will
become more transparent
become more transparent
Financial issues will highlight the need for
successful, long-term companies with superior
balance sheets strength and outstanding ratings
successful, long-term companies with superior
balance sheets strength and outstanding ratings
8

Strategy: Targeted M & A
Podiatry Insurance Company of America (PICA)
Dominant (70%), profitable, national company
~$96 million Direct Premium in 2008
Podiatry is growing in importance as a specialty
Involved in treating complications in a population with an
increasing prevalence of diabetes
increasing prevalence of diabetes
Increases our understanding of policies that are
higher volume, lower cost
higher volume, lower cost
9

Strategy: Targeted M & A
Mid-Continent General Agency
Large writer of ancillary healthcare
Healthcare reform will emphasize care delivery from a
larger array of lower-cost providers
larger array of lower-cost providers
Home health care
Physician-extenders
~$26 million in total premium in 2008
$20 million healthcare related
PRA will write most of this business
Commission derived from business we choose not to write
10
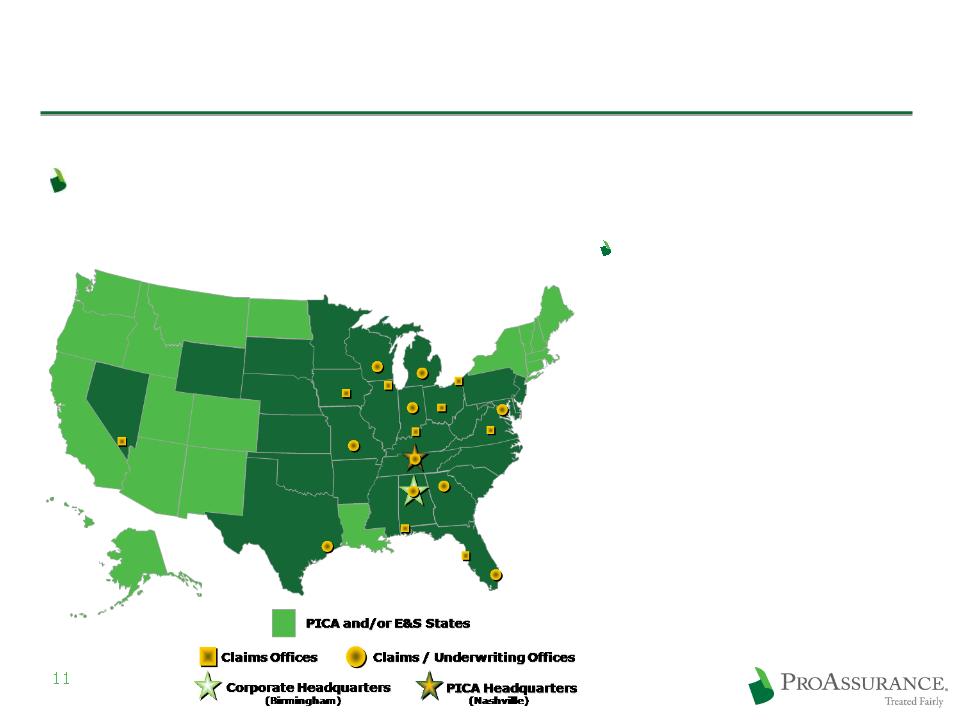
Local Strategy on a National Scale
Local knowledge remains the key to our business
We leverage the
benefits of our many
M & A transactions
through long-term
customer relationships
and enhanced local
knowledge
benefits of our many
M & A transactions
through long-term
customer relationships
and enhanced local
knowledge

Spreading Risk is Vital
Broad geographic diversification provides an
unmatched spread of risk
unmatched spread of risk
Our spread of risk
provides better market
awareness and more
data points to gauge loss
trends
provides better market
awareness and more
data points to gauge loss
trends
Our internal actuarial
depth allows us to assess
emerging trends and
respond quickly
depth allows us to assess
emerging trends and
respond quickly

Strategy: We Dare to Defend
Our balance sheet strength and deep expertise
ensures our insureds have the option of an
uncompromising defense of their claim
ensures our insureds have the option of an
uncompromising defense of their claim
We defend our insureds at trial more often
than any other company in our line
than any other company in our line
Provides a long-term financial and marketing
advantage
advantage
A key differentiating factor in the market
as claims data becomes public
as claims data becomes public
13
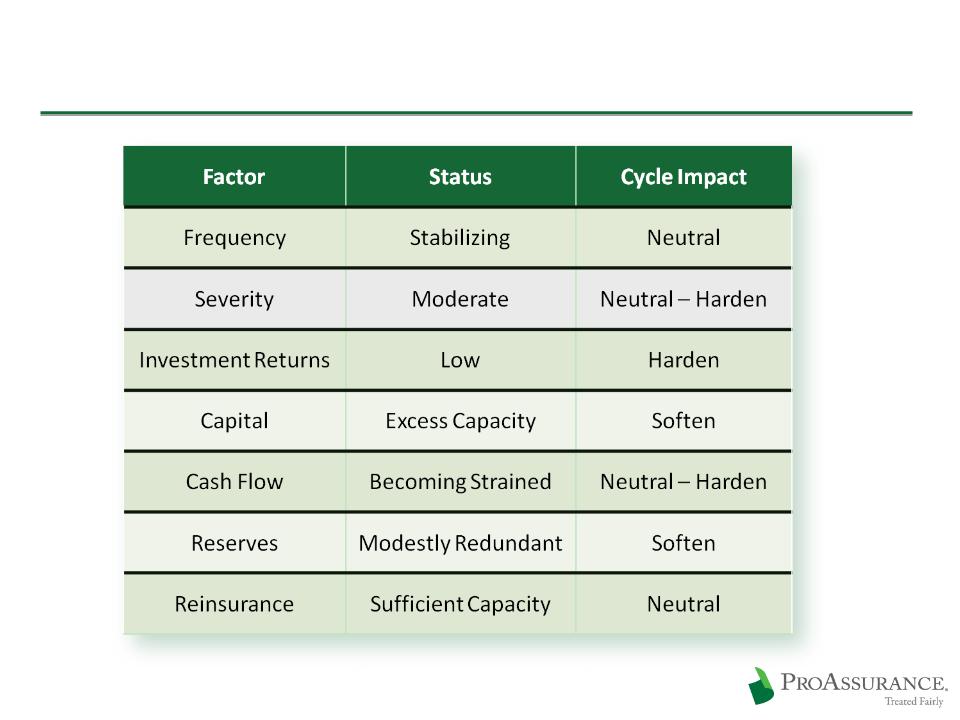
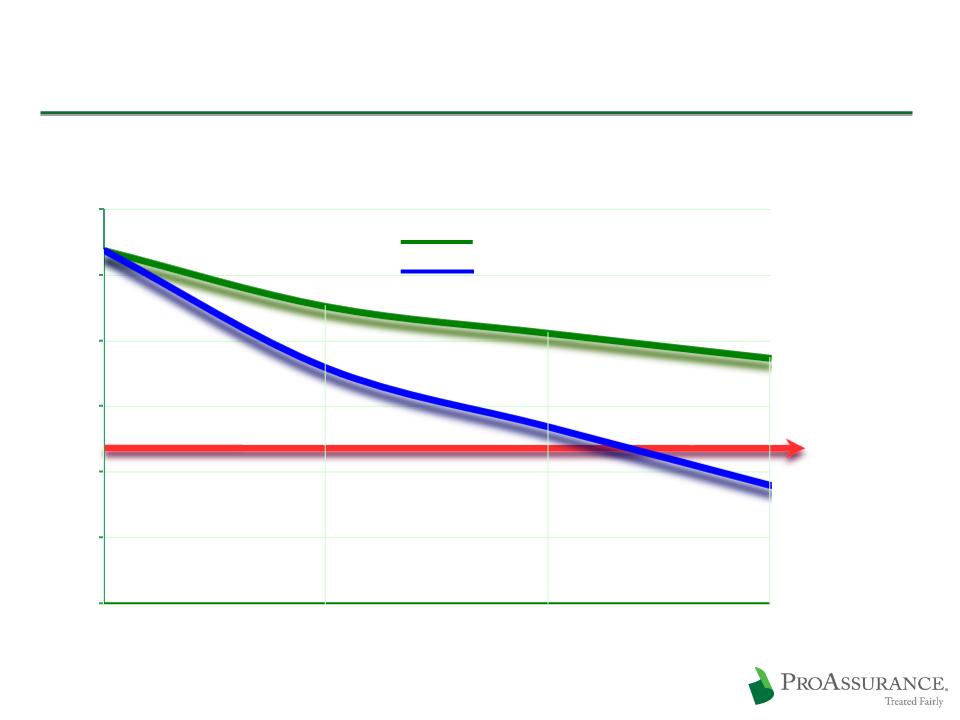
Claims Trends Remain Favorable
14
Frequency trends are
stable after declining
since 2005/2006
stable after declining
since 2005/2006
The results is fewer
cases to try
cases to try
Severity trends also stable
Trends are much the same
in states with or without
Tort Reform
in states with or without
Tort Reform
ProAssurance Claims Tried

The Tort Reform Question
Obama signaled a willingness to consider limited
reforms in his recent speech to the AMA
reforms in his recent speech to the AMA
Unlikely that Washington will provide the full
reforms physicians seek
reforms physicians seek
Major decisions likely left up to each state
Illinois, Florida and Ohio rulings expected this year
We set prices and reserves as if there is no tort
reform, until results reflect otherwise
reform, until results reflect otherwise
We are prepared, operationally and financially, if
reforms are struck down in our states
reforms are struck down in our states
15
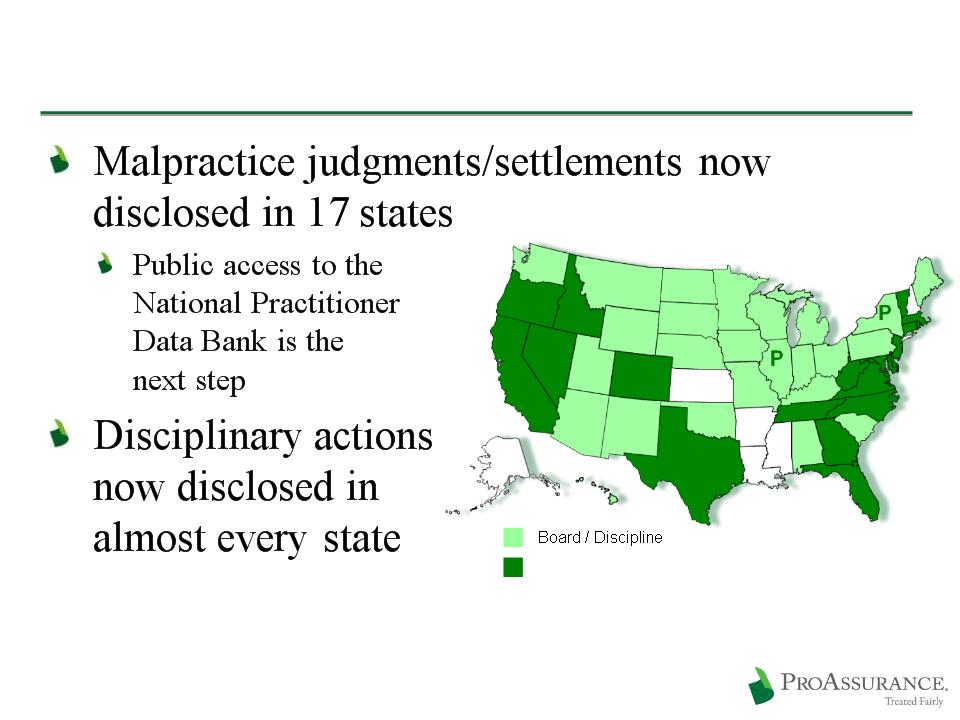
Strategy: Respond to Transparency
16
Board / Discipline / Med Mal
Med Mal disclosure
legislation proposed
legislation proposed
P

Strategy: Maintain Discipline
17
Pricing Discipline
Using credits allows us to maintain existing
rate filings
rate filings
Pricing developed using multiple years
Not unduly influenced by current market
conditions
conditions
Rates on renewing physician business down
less than 10% from peak pricing in 2006
less than 10% from peak pricing in 2006
Rates down 2% in 2007
Rates down 6% in 2008
Rate Change History
18
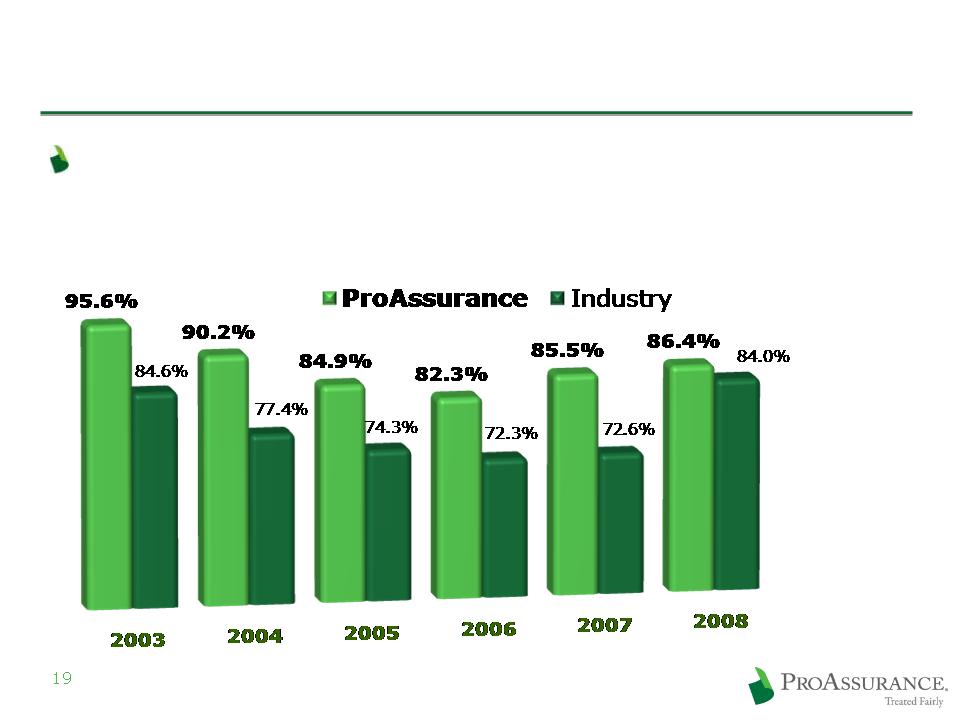
Strategy: Actuarial Conservatism
Consistent and conservative reserving
practices throughout the market cycle
practices throughout the market cycle
Initial Accident Year Loss Ratios
2008 Industry is
A. M. Best Data
Through Q3 2008
A. M. Best Data
Through Q3 2008
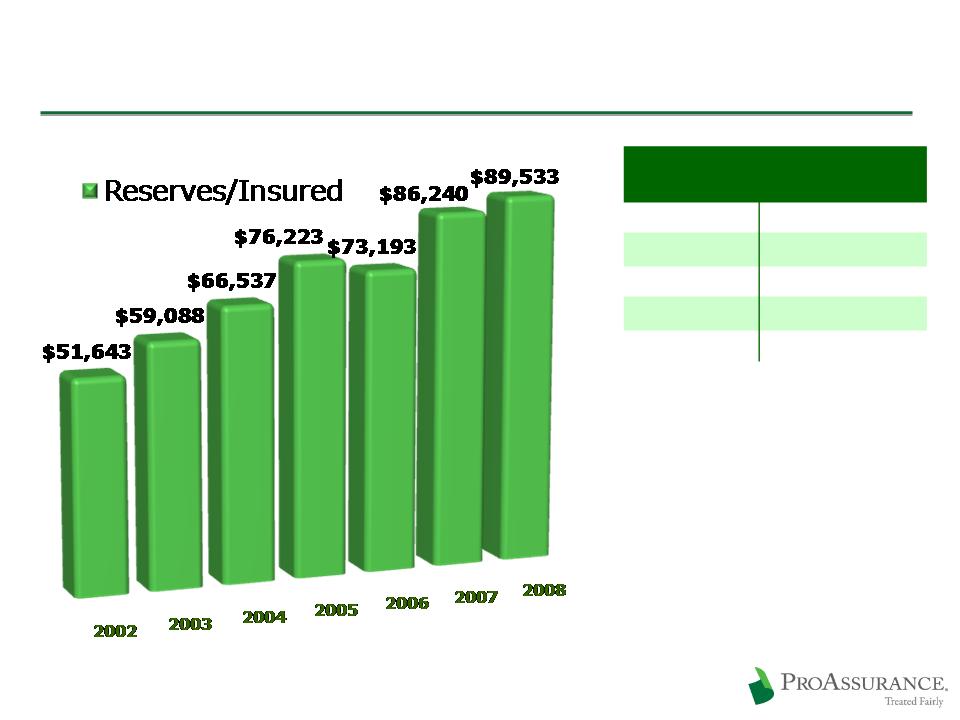
Strategy: Actuarial Conservatism
20
Reserve History
(billions)
(billions)
2008
$ 2.4
2007
$ 2.6
2006
$ 2.6
2005
$ 2.2
2004
$ 1.8

Strategy: Treated Fairly
Treated Fairly is our brand enhancement initiative
Affirms our existing, enduring commitment to
every stakeholder
every stakeholder
Insureds
Agents
Investors
The public
We run our business as owners who are
rewarded for long-term success
rewarded for long-term success
21

Financial Highlights
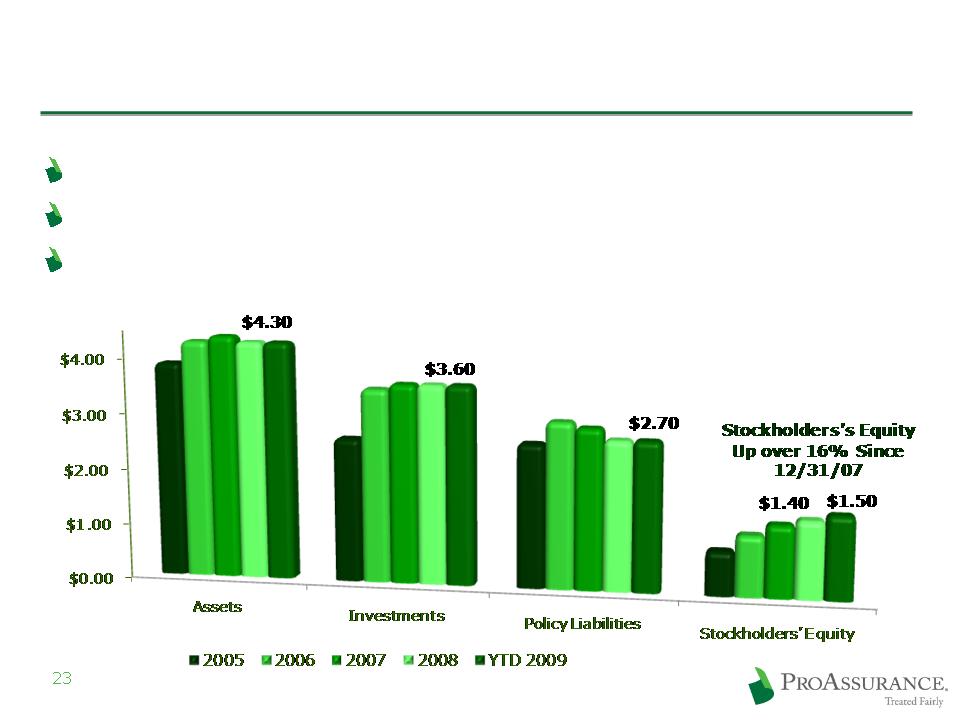
Strategy: Enduring Financial Strength
Emphasizing an appropriate balance of risk vs. return
Committed to enduring balance sheet strength
Responding to the low interest rate environment
$ amounts
in Billions
in Billions

Strategy: Use Capital Prudently
Using capital to build through M&A
Preserving capital for future opportunities
Enhancing shareholder value by repurchasing shares
at prices that build Book Value
at prices that build Book Value
24
Source: SNL Financial
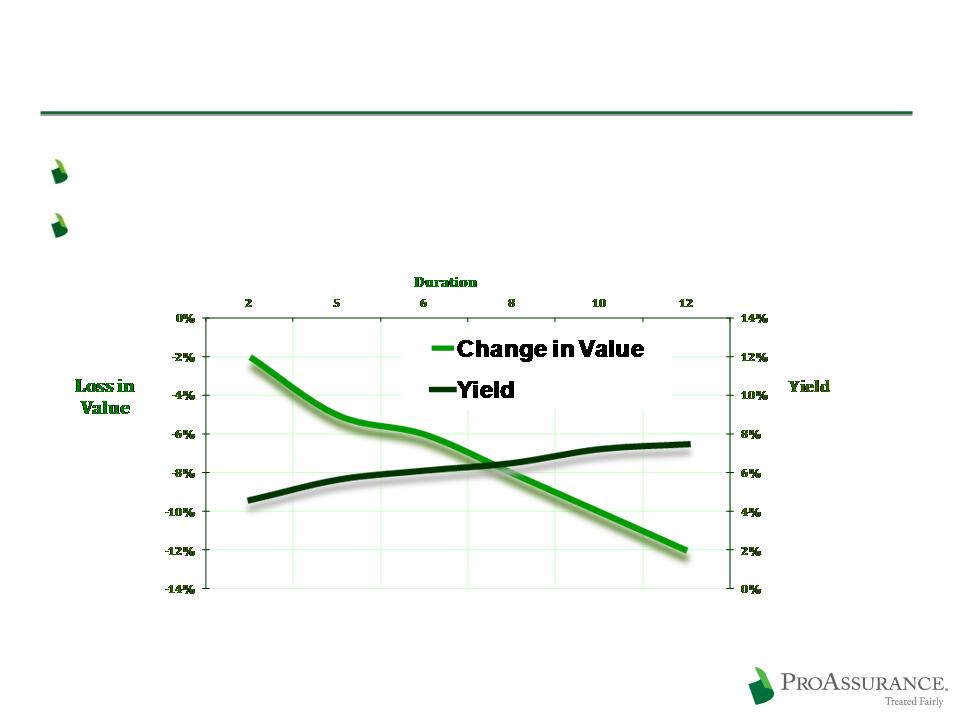
Strategy: Investment Discipline
The choice: Chase yield or extend duration
We are maintaining duration, looking for opportunities
25
Loss in value assuming a 100 basis point shift in the yield curve
Yields based on Single A composite corporate debt
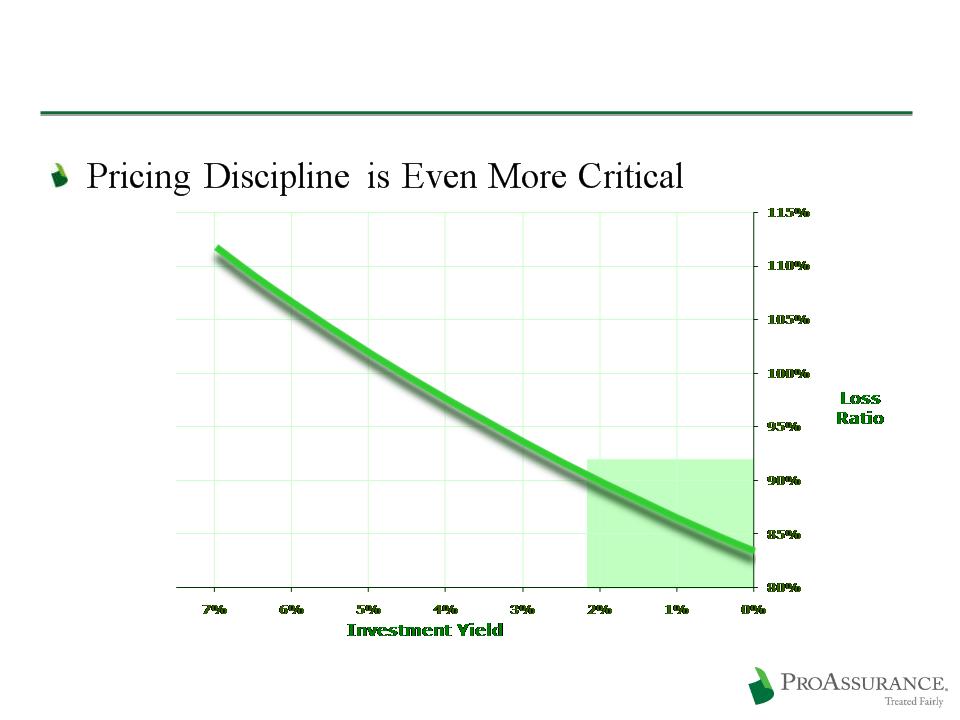
Responding to Low Interest Rates
26
Assumes a 1:1 premium to surplus ratio for physicians professional
liability claims-made coverages
liability claims-made coverages
Loss ratio required
to generate a 13%
after-tax ROE
to generate a 13%
after-tax ROE
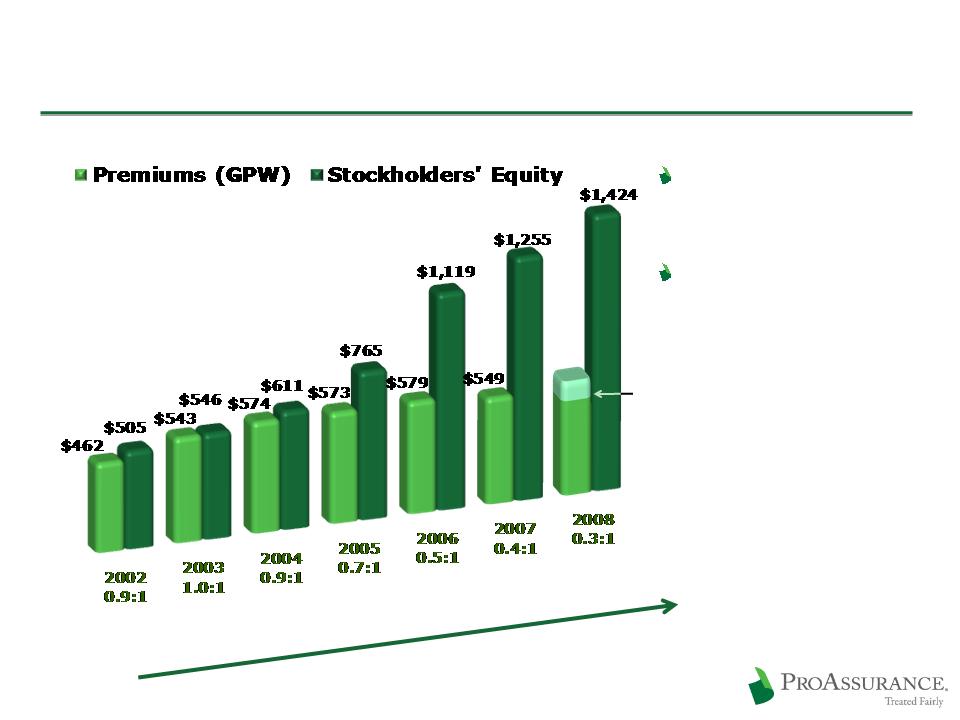
Our Strong Capital/Low Leverage Position
27
(in millions)
Prepared for an
improving market
improving market
Prudent capital
management
management
Premiums to Surplus
for Each year
for Each year
$ 96 (PICA pro forma)
$471
$567
Excess Capital vs. Excess Capacity
28
“A” Rating
Threshold
Threshold
Projected A. M. Best BCAR Scores if
Premiums Increase
Surplus is Reduced
29
Little Dependence on Debt
Low Debt to Cap Ratio
Little strain on cash flow
Repurchased additional
$23 million of debt in Q4
$23 million of debt in Q4
$25 million debt added in
the PICA transaction
the PICA transaction
Includes $7 million in
surplus notes
surplus notes
Evaluating potential call
later this year
later this year
3/31/2009
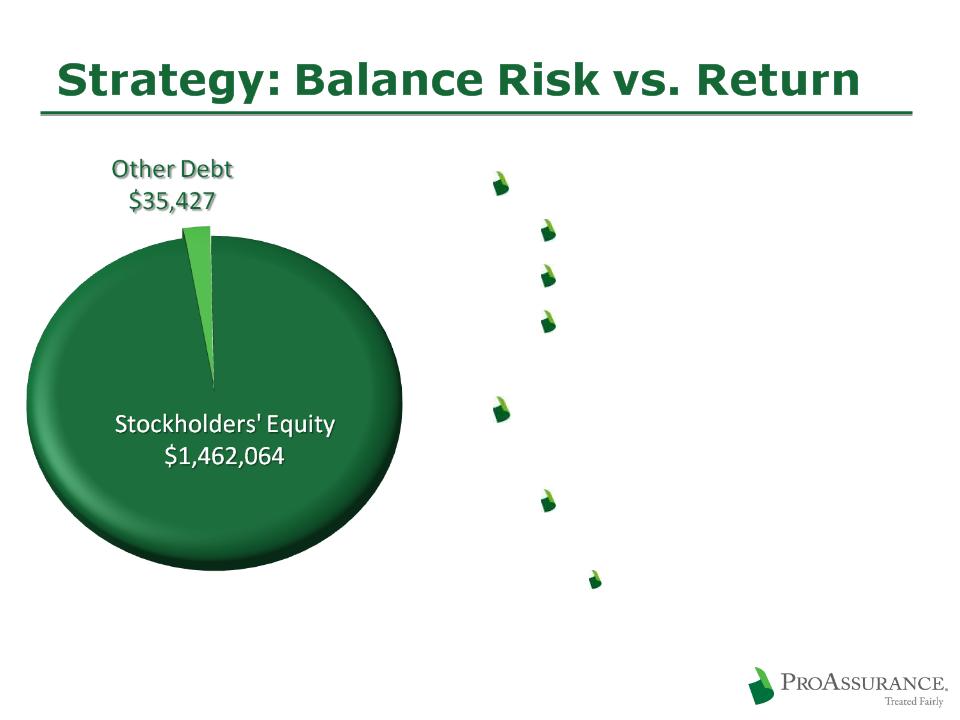
Strategy: Balance Risk vs. Return
30
We will reduce cash and short-term
balances as we see improving
credit environment
balances as we see improving
credit environment
Low equity allocation helps mute
the impact of the volatile equity
markets
the impact of the volatile equity
markets
Complete portfolio disclosure on
our website:
www.proassurance.com/investorrelations/supplemental.aspx
our website:
www.proassurance.com/investorrelations/supplemental.aspx
$3.6 Billion
Portfolio
Portfolio
$3.6 Billion
Portfolio
Portfolio
Fixed Income: 85%
Short Term: 10%
Short Term: 10%
Equity and Other Investments: 3%
Equity and Other Investments: 3%
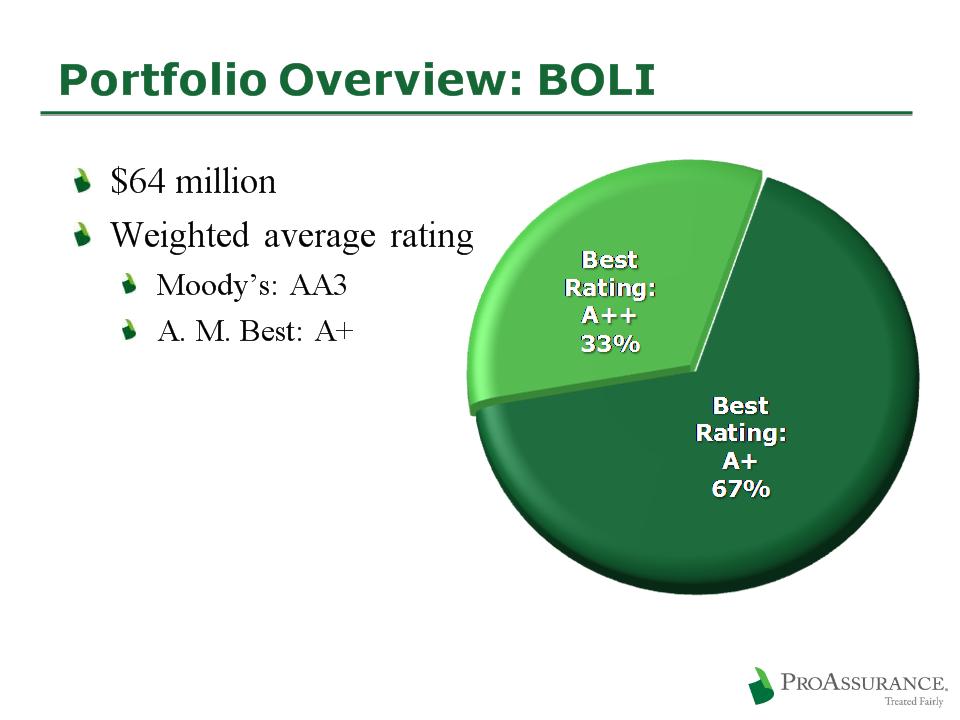
BOLI: 2%
BOLI: 2%
3/31/2009
Fixed Income: $3.1 Billion
31
3/31/2009

Summary

ProAssurance
Producing sustainable shareholder value
Growing Book Value per Share
Finding the right M & A opportunities
Significant share ownership at all levels
Focusing on long-term
Preparing for a changing market
Leveraging financial strength
Protecting the balance sheet
Maintain our leading market position
Building strength for the next cycle turn
33
Appendix: Claims
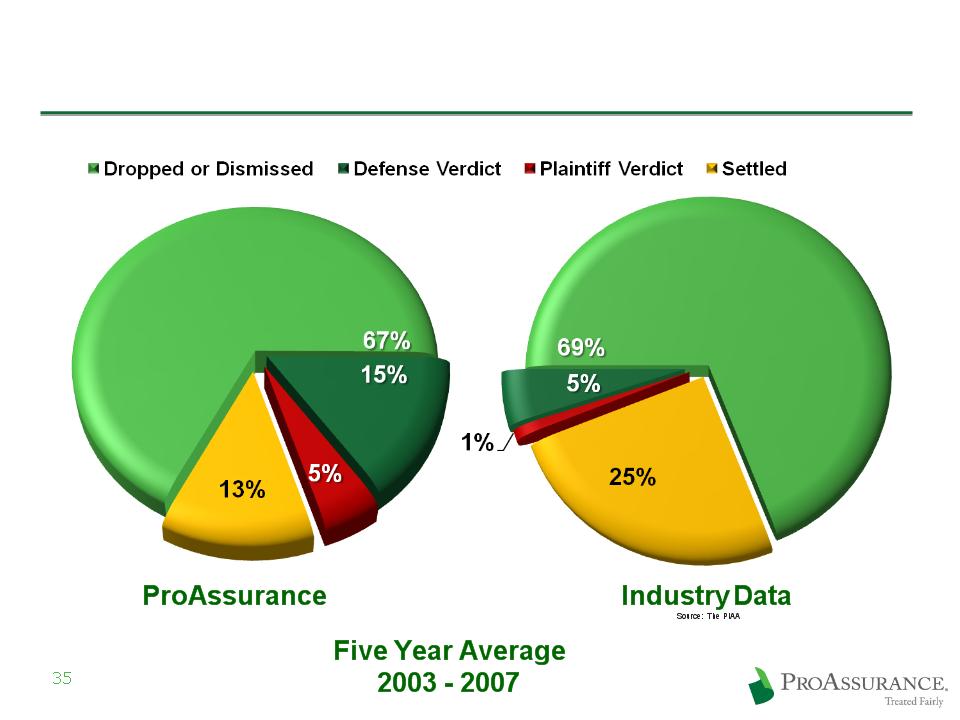
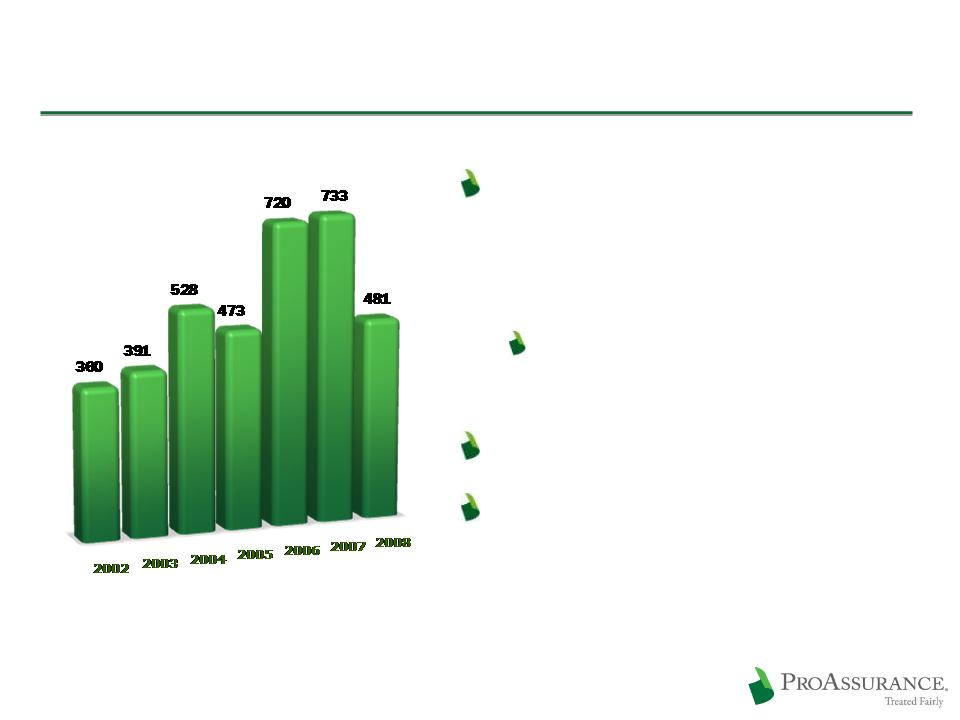
Why Claims Strategy Matters
Favorable
Outcomes:
82%
Outcomes:
82%
Favorable
Outcomes:
82%
Outcomes:
82%
Favorable
Outcomes:
74%
Outcomes:
74%
Favorable
Outcomes:
74%
Outcomes:
74%
Why Claims Strategy Matters
Our ability and willingness to defend claims
allows us to achieve better results
allows us to achieve better results
81.4%
ProAssurance Stand Alone
2005 - - 2007
76.0%
64.3%
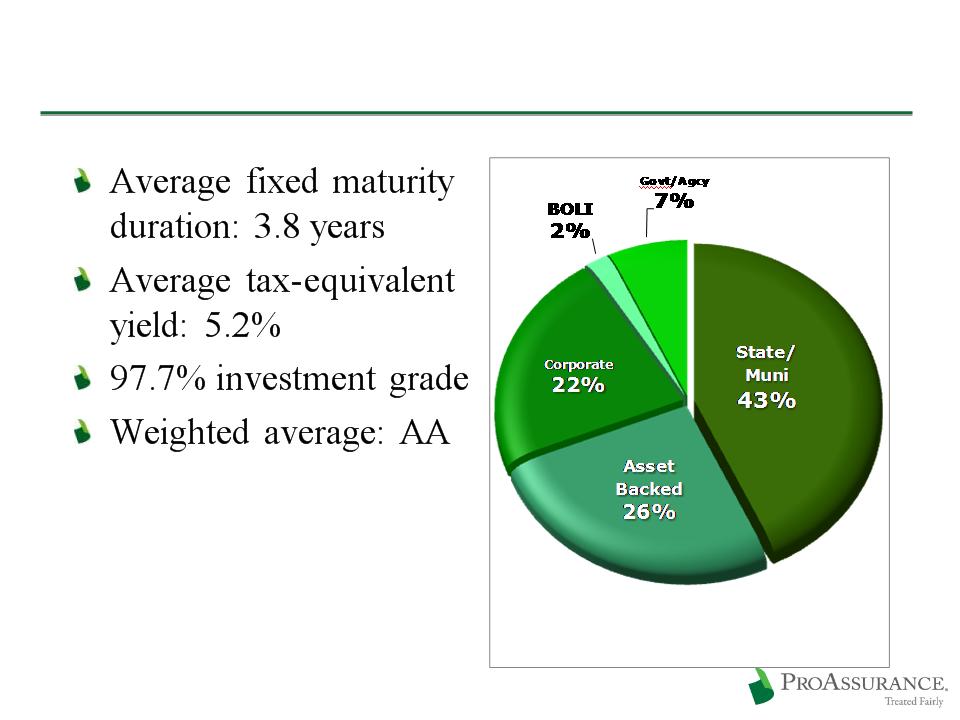
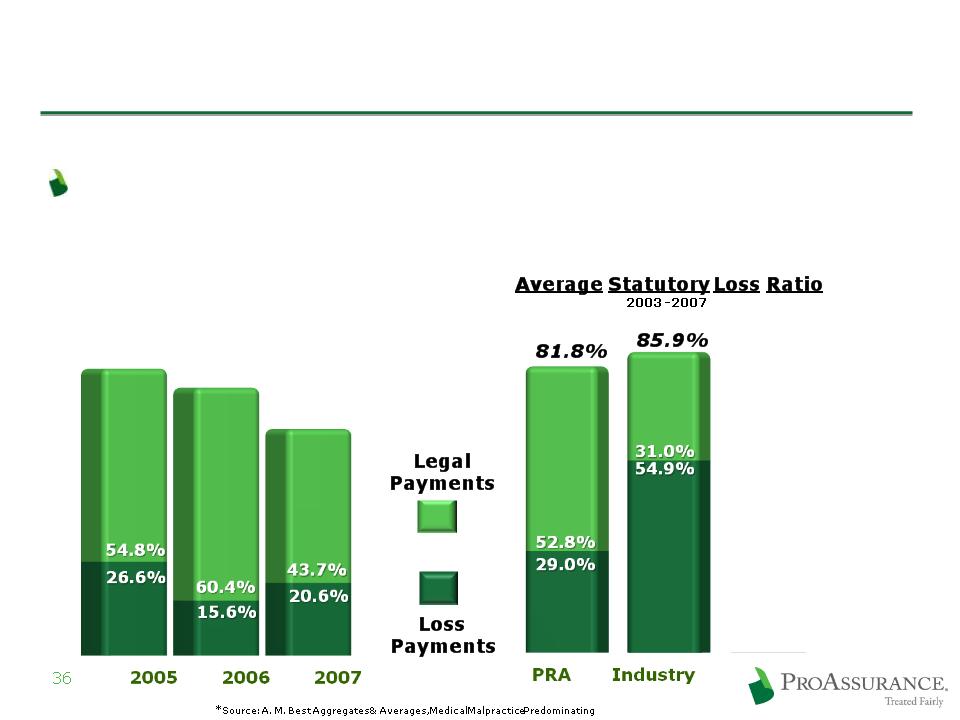
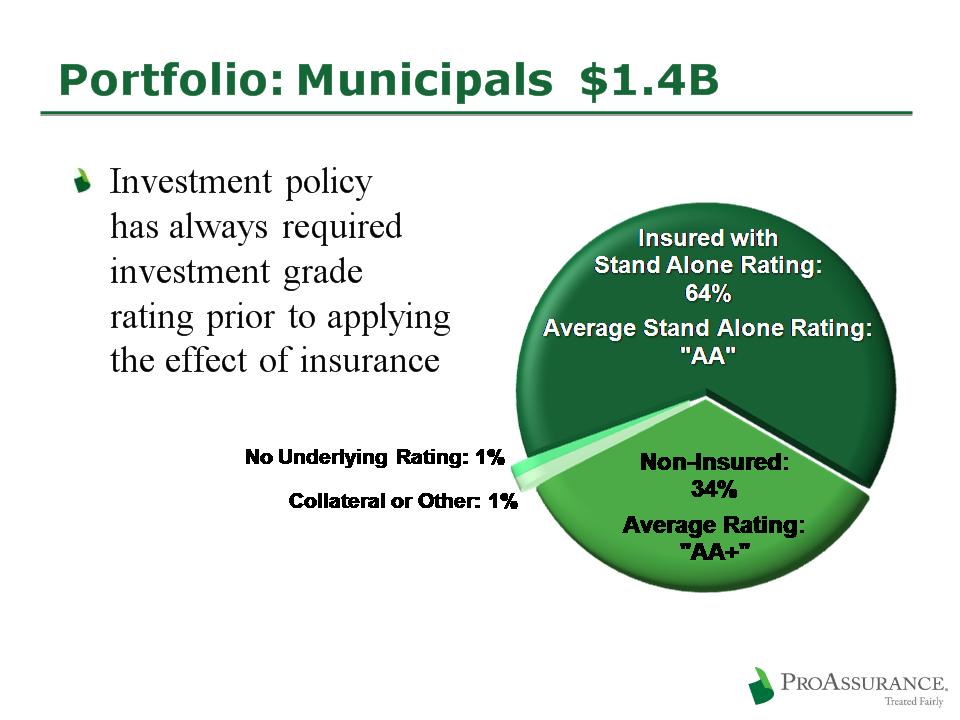
Appendix: Investments
Portfolio Overview: Equities
38
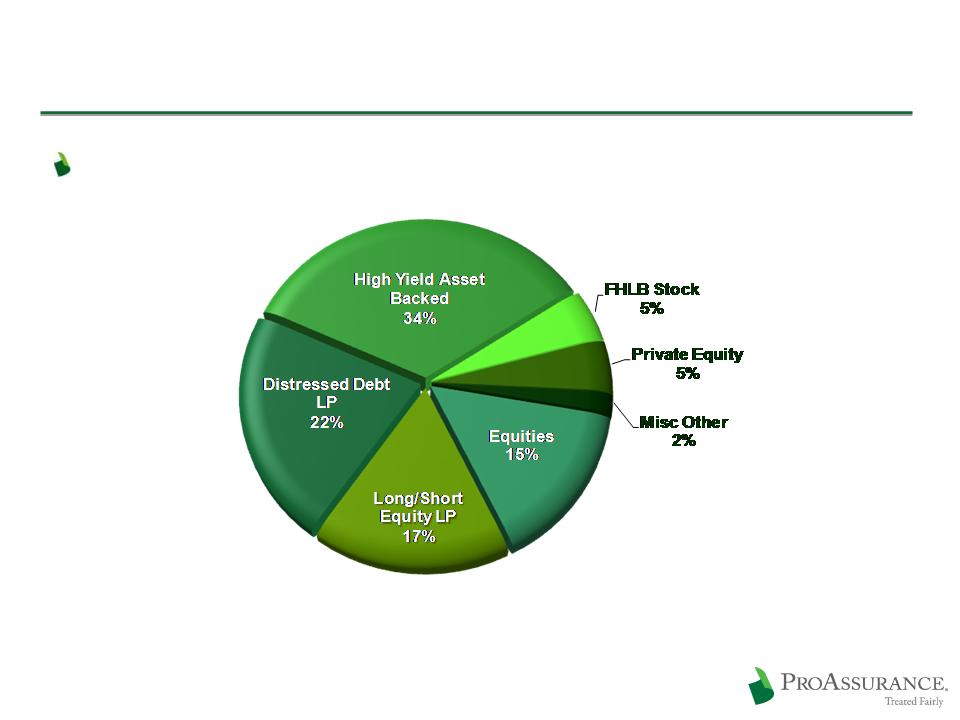
$106 million in Equities & Other Investments
3/31/09
Equities & Other Investments
39
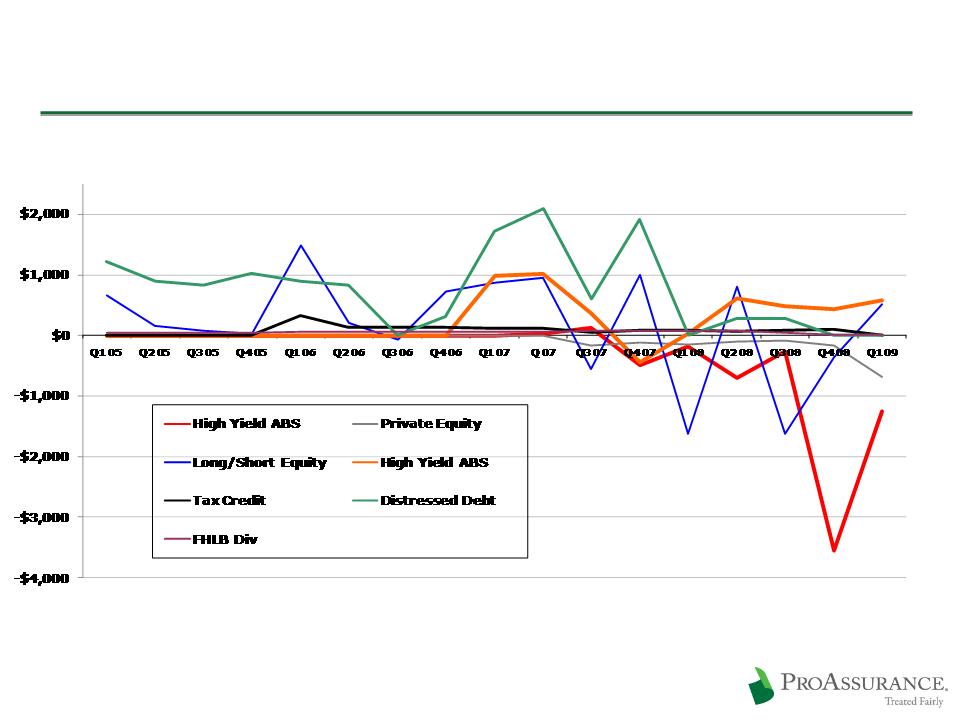
$ in 000’s
Performance Q1, 2005 - Q1, 2009
40
3/31/09

41
Alt-A LTV: 63%
Whole Loan LTV: 56%
Further Details Provided
on Sub-Prime and CMBS
on following pages
on Sub-Prime and CMBS
on following pages
Bloomberg Data
3/31/09
3/31/09
Portfolio Overview: Sub-Prime
42
$8.1 million market value in AFS portfolio
$4.4 million unrealized loss
$5.0 million market value in
high-yield LP rated BB
high-yield LP rated BB
LP’s focus is distressed ABS)
At 3/31/09
Vintage
$4.8 Mln
2004 & Prior
$2.4 Mln
2005
$0.9 Mln
2006
Quality & Vintage information only on direct holdings at 3/31/09
At 3/31/09
Type
Quality
$4.2 Mln
Mortgage-Backed
AA+ avg - LTV 70%
$3.9 Mln
Home Equity
AA avg
Portfolio Overview: CMBS
$163 million Fair Value in non-agency CMBS
Book Value: $186 Book Value
5% of fixed income portfolio
43
At 3/31/09
Quality
$161 Mln
AAA
$2 Mln
AA
At 3/31/09
Wtd Avg LTV
94%
<70%
6%
<72%
At 3/31/09
Credit Support
30%
>30%
48%
20% - 30%
20%
10% - 20%
2%
Less than 10%
At 3/31/09
Deal Cumulative Delinquencies
23%
None
21%
0% - 0.5%
28%
0.5% - - 1.0%
20%
1.0% - - 2.0%
8%
2.0% - - 3.9%
At 3/31/09
Debt Service Coverage
93%
>1.5x
7%
>1.4x
AT
3/31/09
3/31/09

Portfolio Overview: CMBS
Top Property Types
Retail-Anchored: 47% of CMBS portfolio
Exposure: 23% - 40% of individual security value
Office: 39% of CMBS portfolio
Exposure: 23% - 46% of individual security value
Retail-Unanchored: 7% of CMBS portfolio
Mixed Use: 3% of CMBS portfolio
Multi Family: 2% of CMBS portfolio
45
3/31/09

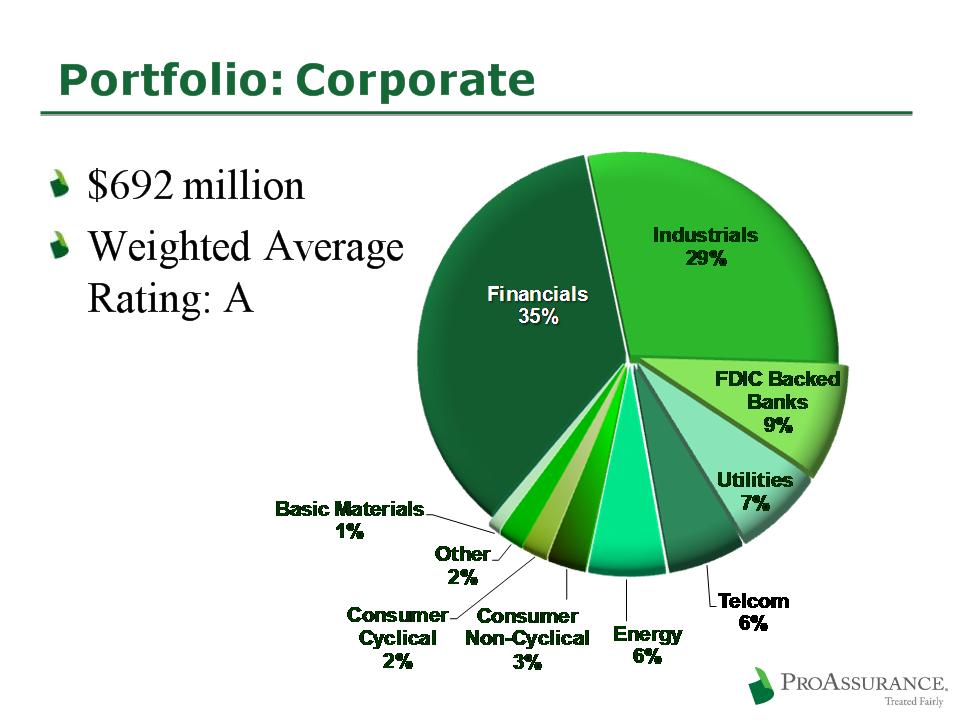
Portfolio: Corporate-Financials
Top 20 Largest Banks/Financials: $ 210 million
$52 mm FDIC backing
M Stanley $26 ($6)
Natl Rural Util $6
Amer Exp $23 ($12)
HSBC $6 ($1)
BoA/ML $20 ($1)
Deutsche Bank $5
JPM Chase $20 ($13)
John Deere Cap $5 ($1)
Wells/Wachovia $19
BONY $5
Citi $15($5)
Fifth Third $5
PNC $13 ($1)
Uniliver Cap $4
Key $13 ($13)
Depfa Bank $4
Goldman $9
FMCC $4
Credit Suisse $7
BP Capital $3
FDIC backed amounts listed in parentheses
46
3/31/2009
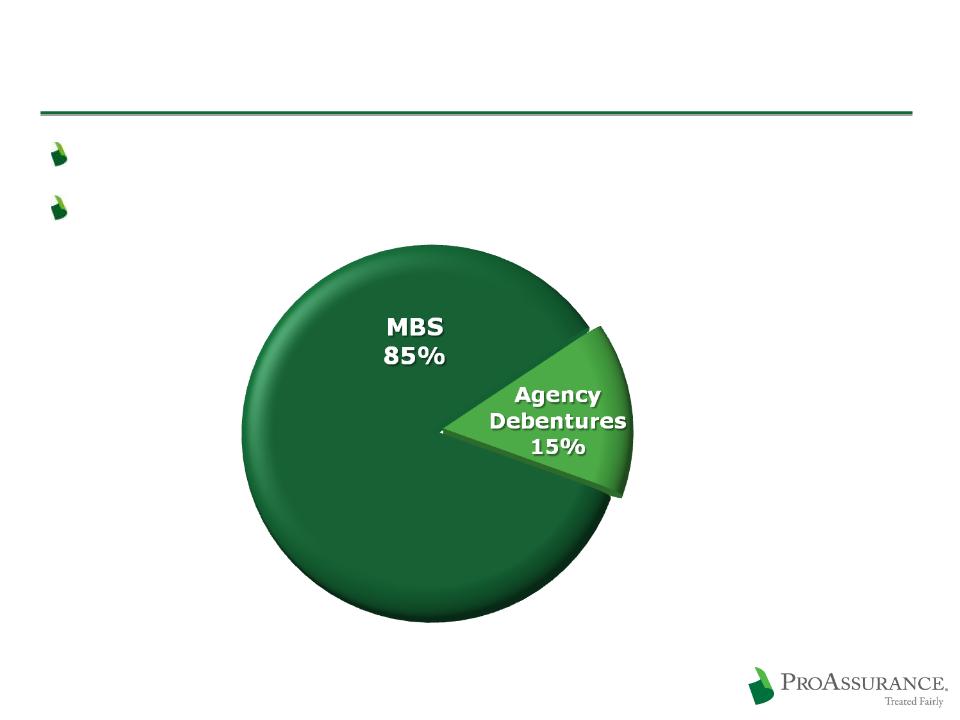
Portfolio: Treasury/GSE
47
$209 million
Average Rating: AAA
3/31/09
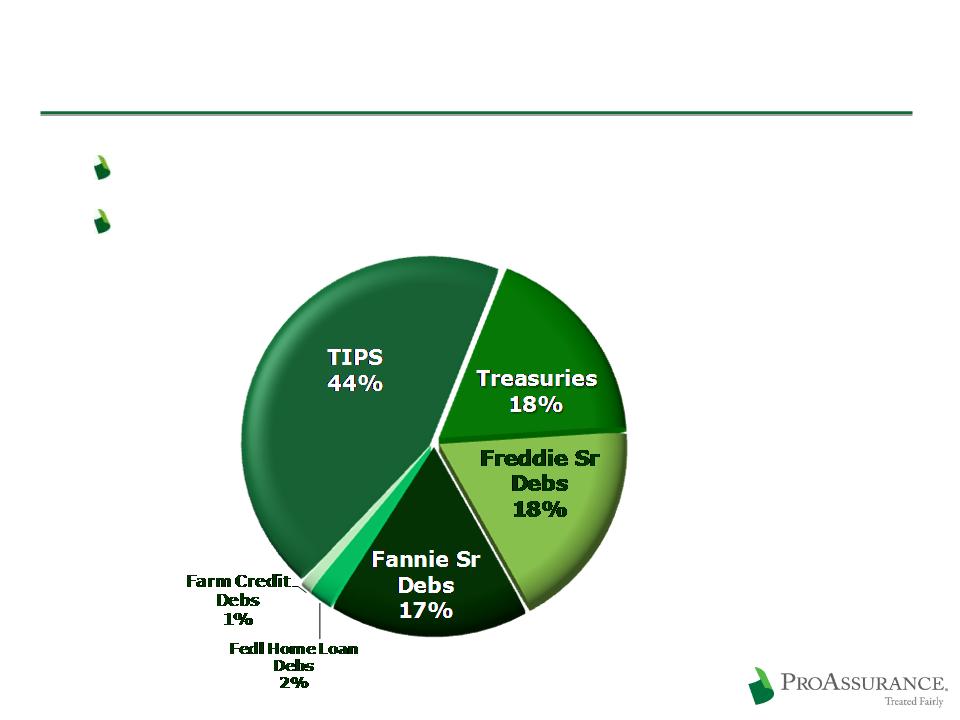
Portfolio: FRE and FNM
48
$476 million
Average Rating: AAA
3/31/09
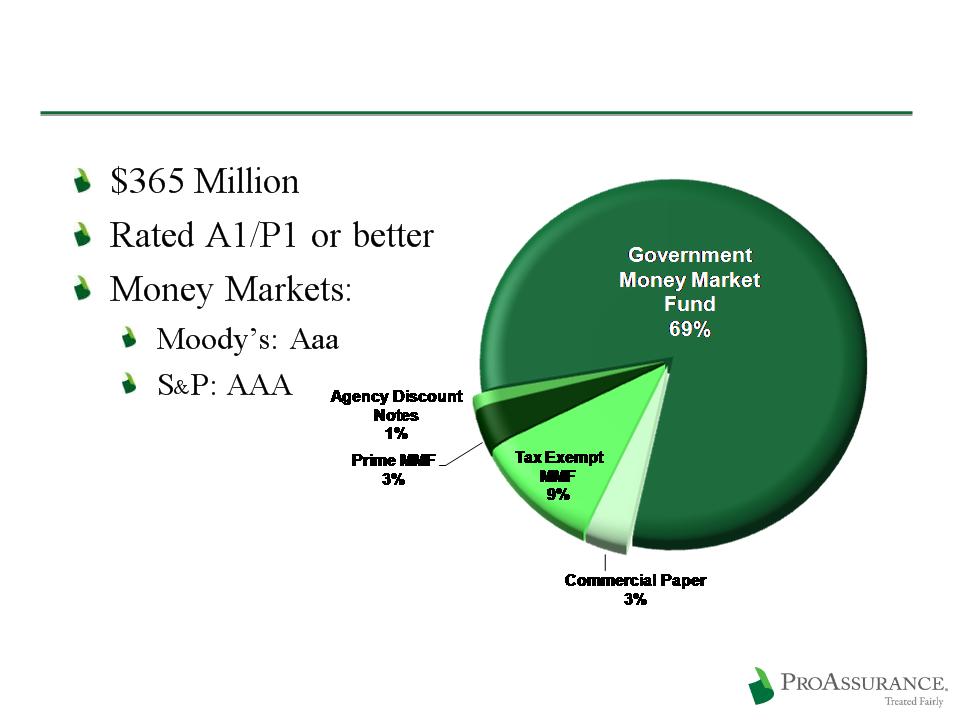
Portfolio Overview: Short Term
49
3/31/09
50
3/31/09

Appendix: Industry History
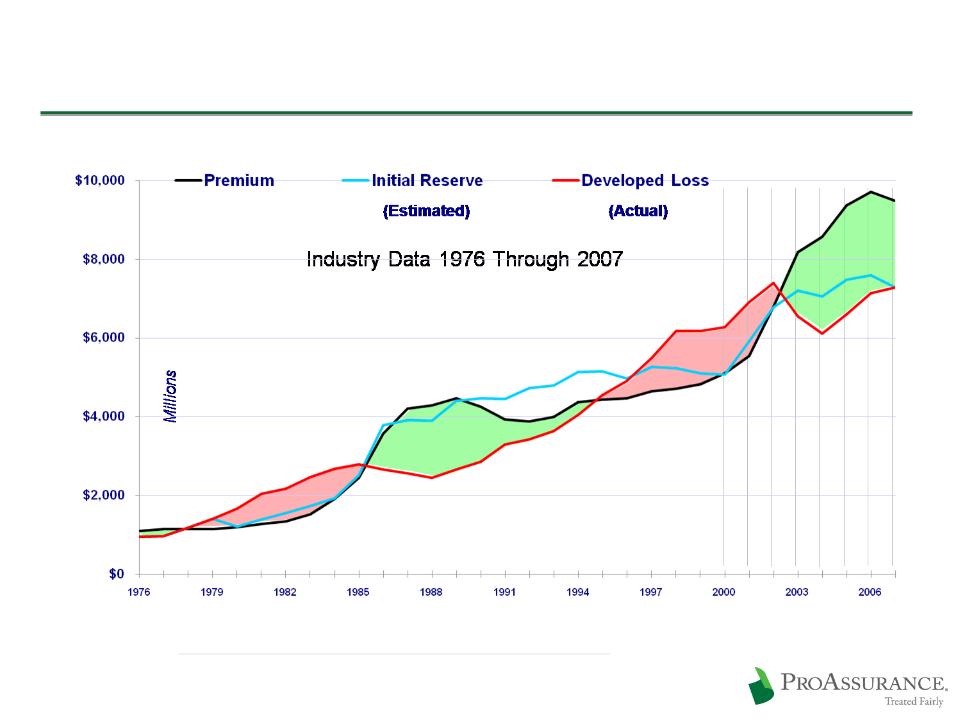
Will History Repeat Itself—Again?
52
Source: A. M. Best Aggregates and Averages 1976 - 2001
Medical Malpractice Industry, Net Basis Occurrence and Claims-Made Combined
Medical Malpractice Industry, Net Basis Occurrence and Claims-Made Combined

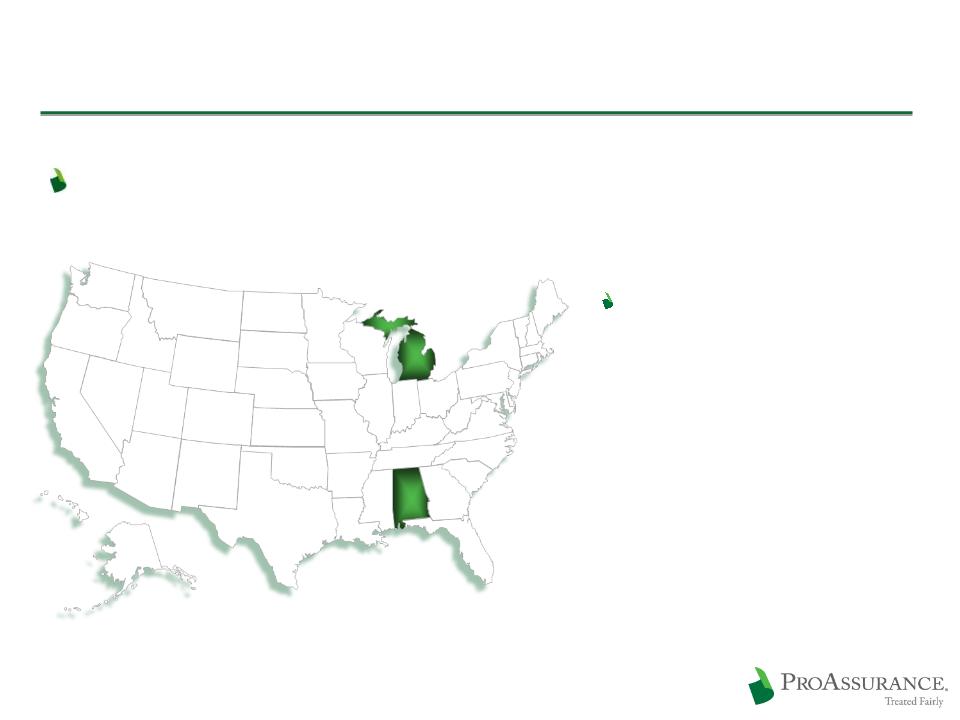
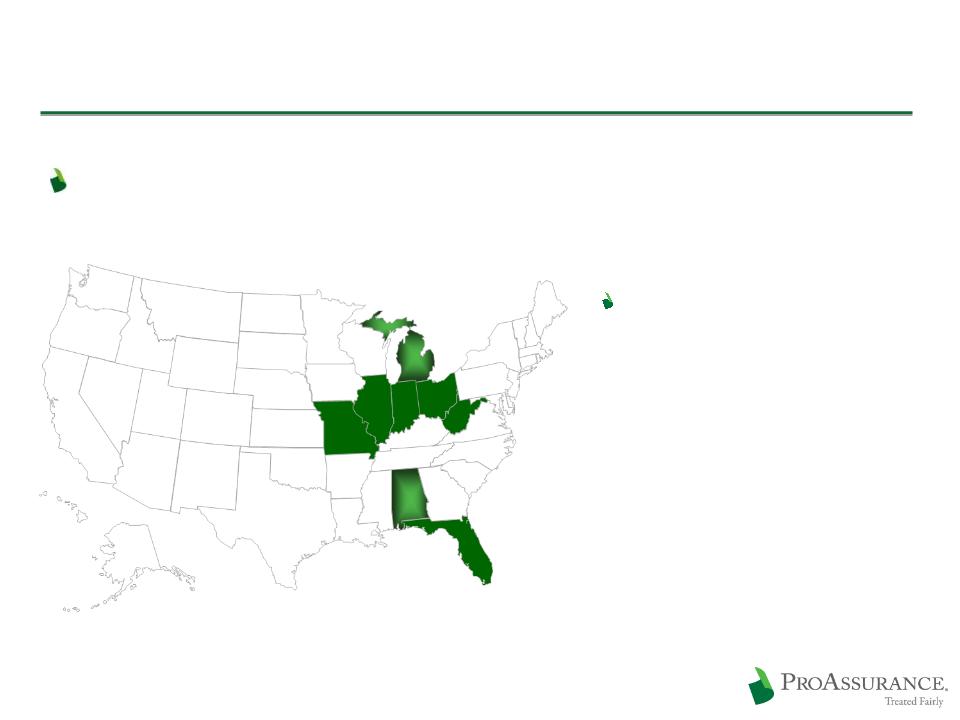
Appendix: Our M & A History
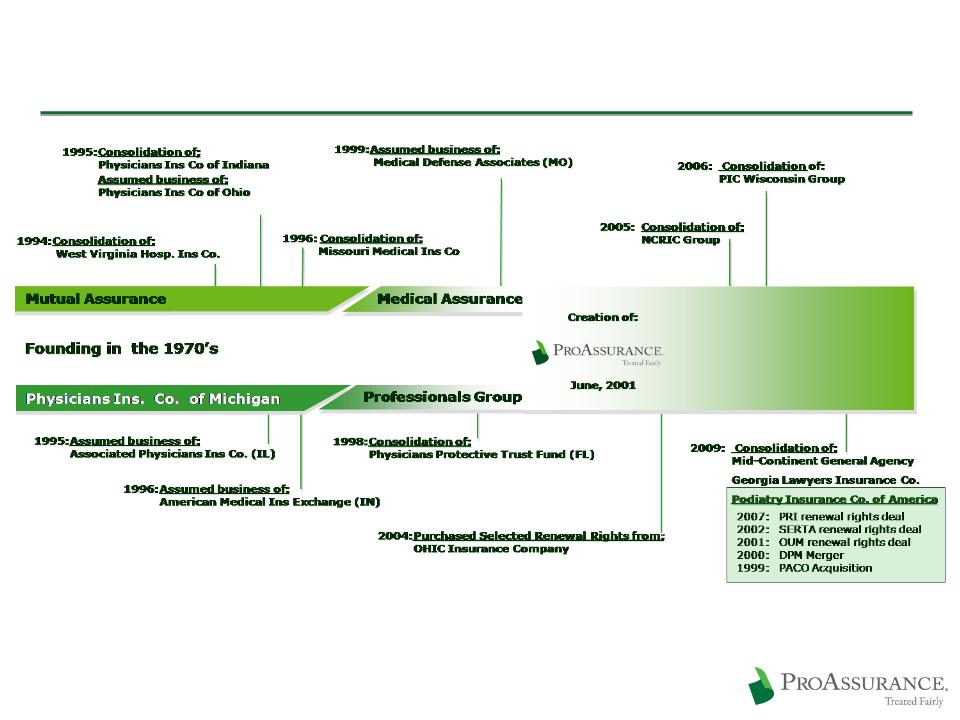
We Created a Leader Through Consolidation
54
Profitable Growth Through M & A
ProAssurance has been built through M & A
55
ProAssurance was formed by
the combination of two
successful companies with a
history of M & A
the combination of two
successful companies with a
history of M & A
Profitable Growth Through M & A
ProAssurance has been built through M & A
56
Each company brought
multiple transactions into
ProAssurance at our founding
in 2001
multiple transactions into
ProAssurance at our founding
in 2001
Profitable Growth Through M & A
ProAssurance has been built through M & A
57
We have continued to grow
through M & A
through M & A
NCRIC in the mid-Atlantic
PIC-Wisconsin in the upper
Midwest
Midwest
PICA Nationwide
Denovo Growth Also Plays a Role
We have added states as opportunities arose
58
We carefully evaluate the
medical and legal climate of
each state before entering
medical and legal climate of
each state before entering
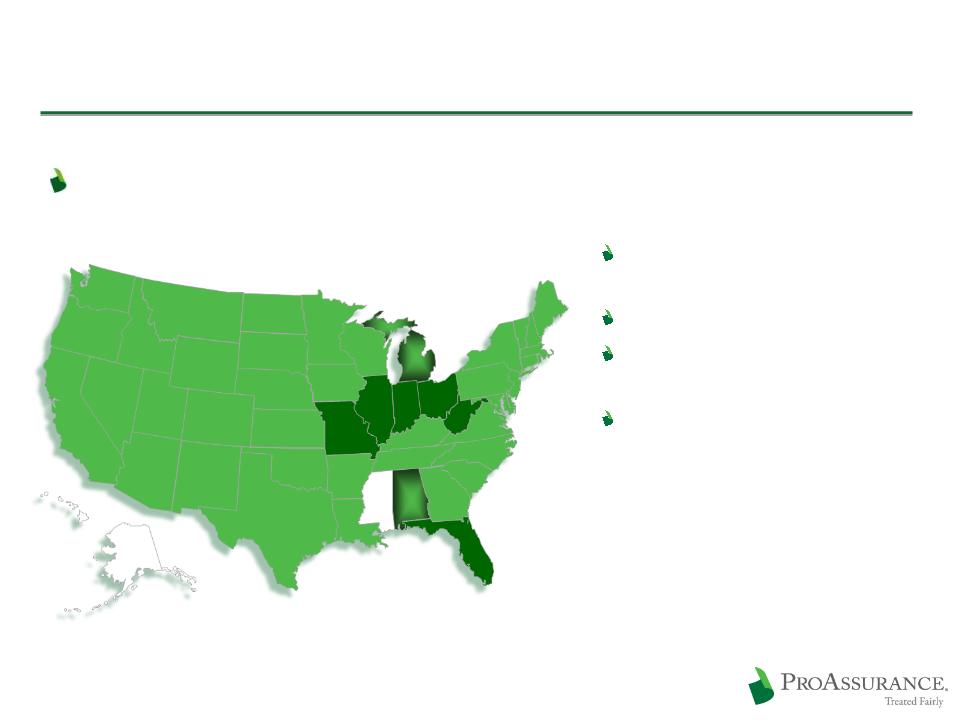
We are the market leaders in
AL, DE, DC, OH, & WI
AL, DE, DC, OH, & WI