
Forward Looking Statements
This presentation contains Forward Looking Statements and other information designed
to convey our projections and expectations regarding future results. There are a number
of factors which could cause our actual results to vary materially from those projected in
this presentation. The principal risk factors that may cause these differences are
described in various documents we file with the Securities and Exchange Commission,
such as our current reports on Form 8-K, and our regular reports on Forms 10-Q and 10-
K, particularly in “Item 1A, Risk Factors.” Please review this presentation in
conjunction with a thorough reading and understanding of these risk factors.
This presentation contains Non-GAAP measures, and we may reference
Non-GAAP measures in our remarks. A reconciliation of these measures to GAAP
measures is available in our latest quarterly news release, which is available in the
Investor Relations section of our website, www.ProAssurance.com, and in
the related Current Reports on Form 8K disclosing that release.
Non-GAAP measures in our remarks. A reconciliation of these measures to GAAP
measures is available in our latest quarterly news release, which is available in the
Investor Relations section of our website, www.ProAssurance.com, and in
the related Current Reports on Form 8K disclosing that release.
1
Non-GAAP Measures
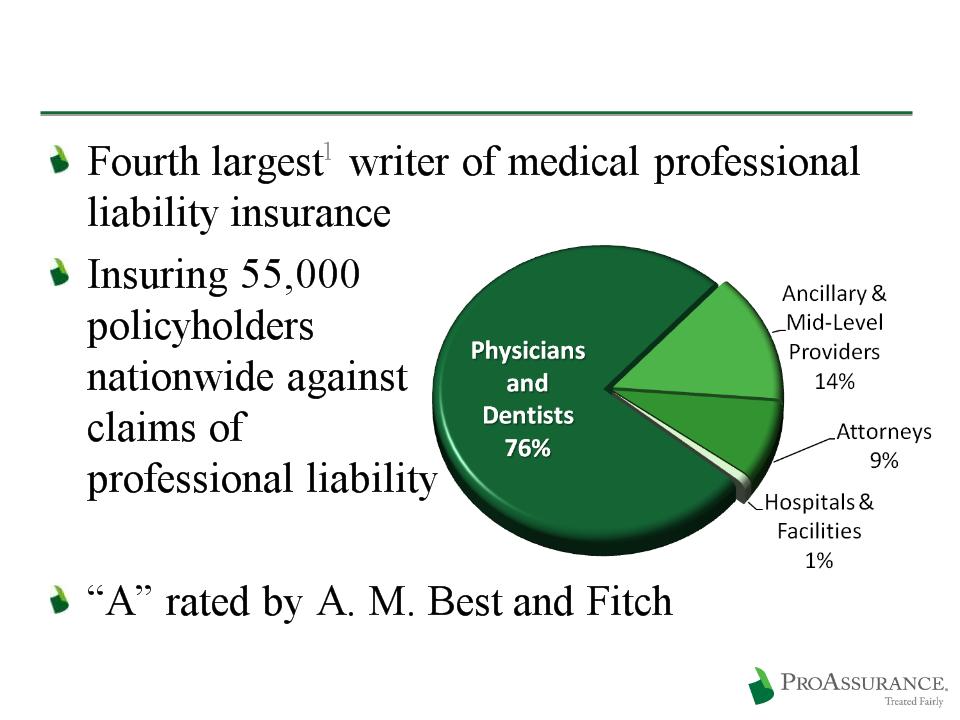
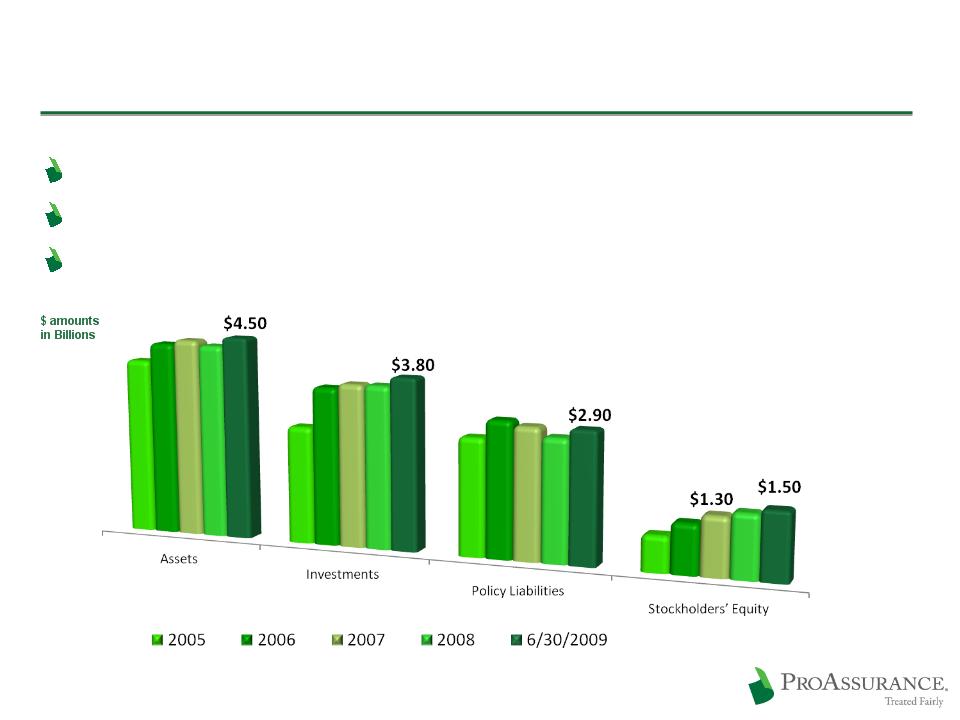
ProAssurance: Quick Facts
2
1 9/30/2009 Statutory Filings

2009 Highlights
Three M&A transactions completed
Provides potential premium growth of
approximately $100 million on an annualized basis
approximately $100 million on an annualized basis
GROWING the top line
Existing markets grew modestly through Q3 2009
Maintaining our profitability
Outstanding performance in a challenging
financial market and a demanding line of
insurance
financial market and a demanding line of
insurance
3
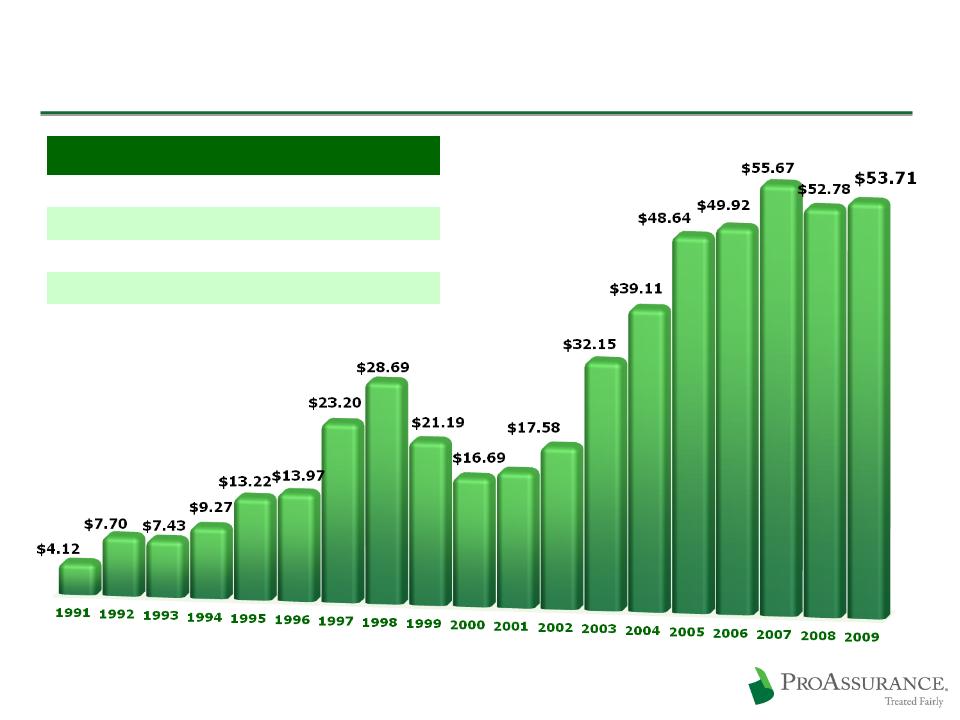
Outstanding Performance: Stock Price
Share Price Growth | ||
Cumulative | CAGR | |
10 year | 149% | 10% |
5 year | 35% | 7% |
1 year | 2% | 2% |
Measured through Year-End 2009 | ||
4
Share Price at Year End Since Inception
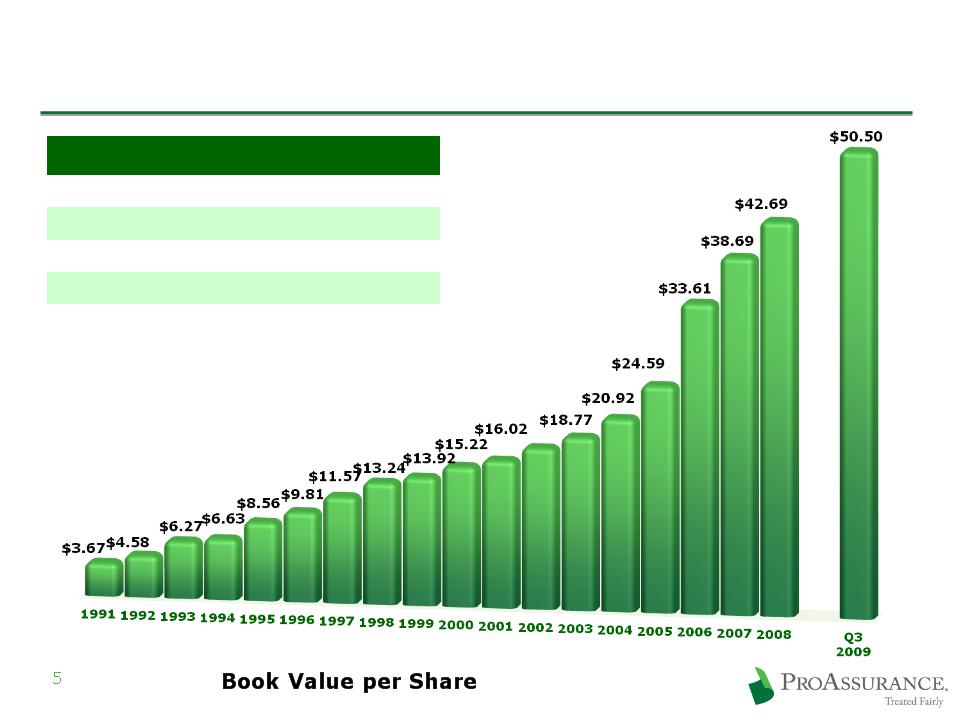
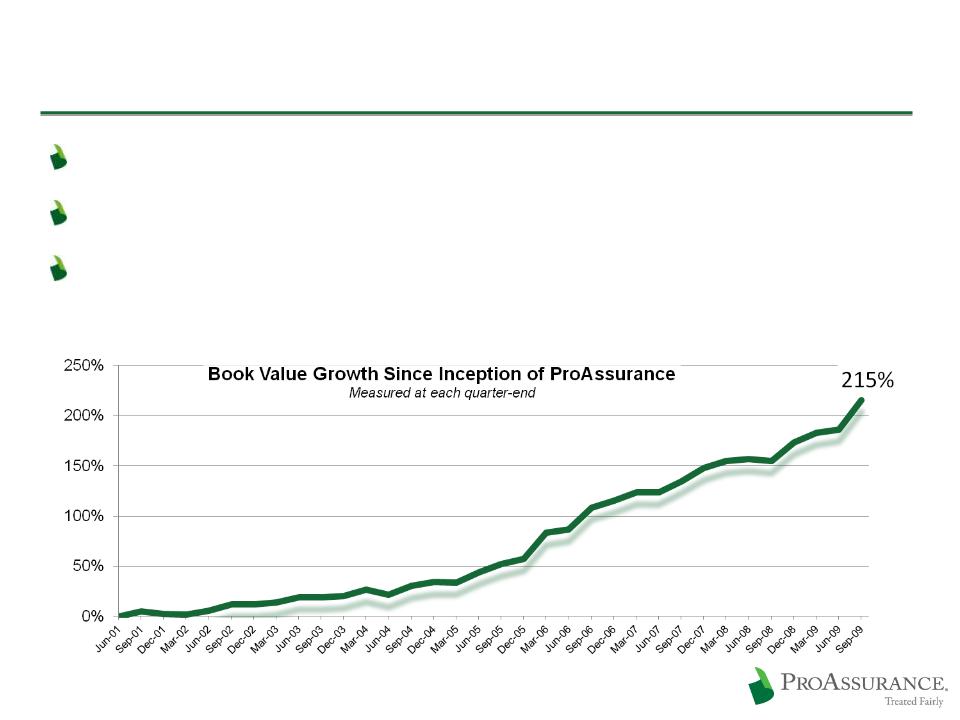
Outstanding Performance: Book Value
Book Value Growth | ||
Cumulative | CAGR | |
10 year | 222% | 12% |
5 year | 127% | 18% |
1 year | 10% | 10% |
Measured through Q3 2009 | ||
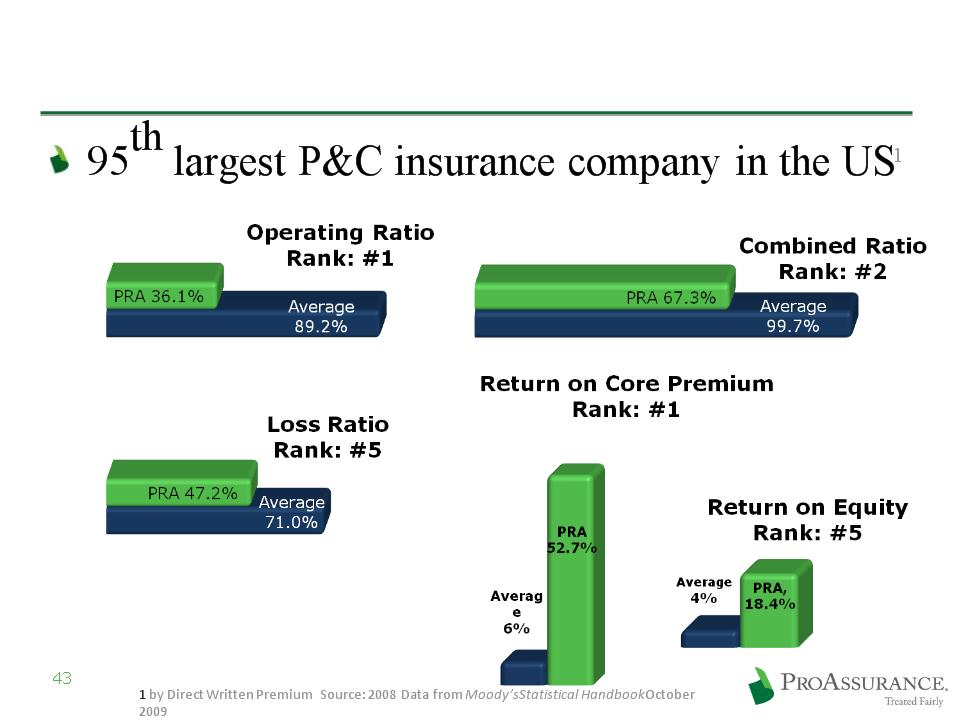
Outstanding Performance vs Industry
Moody’s rankings of the top 100 P&C
insurance companies by premium volume
insurance companies by premium volume
6
1 by Direct Written Premium Source: 2008 Data from Moody’s Statistical Handbook October
2009
2009
Category | Ranking |
Direct Written Premiums | 95 |
Operating Ratio | 1 |
Combined Ratio | 2 |
Loss Ratio | 5 |
ROE | 5 |
Recent Business Highlights
Third straight year as one of the
50 top performing property casualty
insurance companies
50 top performing property casualty
insurance companies
Top 3% of all P&C companies
Upgrade to “A” (Excellent)
by A. M. Best
by A. M. Best
Positive outlook
assigned by S & P
assigned by S & P
7
2009: Consolidation of:
Mid-Continent General Agency
Mid-Continent General Agency
2009: Consolidation of:
Mid-Continent General Agency
Mid-Continent General Agency
Georgia Lawyers Insurance Co.
Georgia Lawyers Insurance Co.
2004: Purchased Selected Renewal Rights from:
OHIC Insurance Company
OHIC Insurance Company
2004: Purchased Selected Renewal Rights from:
OHIC Insurance Company
OHIC Insurance Company
Success Through M&A
We’ve built a leading platform through M&A
8
1994: Consolidation of:
West Virginia Hosp. Ins Co.
West Virginia Hosp. Ins Co.
1994: Consolidation of:
West Virginia Hosp. Ins Co.
West Virginia Hosp. Ins Co.
1995: Consolidation of;
1995: Consolidation of;
Physicians Ins Co of Indiana
Physicians Ins Co of Indiana
Assumed business of:
Physicians Ins Co of Ohio
Physicians Ins Co of Ohio
Assumed business of:
Physicians Ins Co of Ohio
Physicians Ins Co of Ohio
1996: Consolidation of:
1996: Consolidation of:
Missouri Medical Ins Co
Missouri Medical Ins Co
1995: Assumed business of:
Associated Physicians Ins Co. (IL)
Associated Physicians Ins Co. (IL)
1995: Assumed business of:
Associated Physicians Ins Co. (IL)
Associated Physicians Ins Co. (IL)
1998: Consolidation of:
Physicians Protective Trust Fund (FL)
Physicians Protective Trust Fund (FL)
1998: Consolidation of:
Physicians Protective Trust Fund (FL)
Physicians Protective Trust Fund (FL)
1996: Assumed business of:
American Medical Ins Exchange (IN)
American Medical Ins Exchange (IN)
1996: Assumed business of:
American Medical Ins Exchange (IN)
American Medical Ins Exchange (IN)
Founding in the 1970’s
Founding in the 1970’s
1999: Assumed business of:
Medical Defense Associates (MO)
Medical Defense Associates (MO)
1999: Assumed business of:
Medical Defense Associates (MO)
Medical Defense Associates (MO)
Mutual Assurance
Physicians Ins. Co. of Michigan
Professionals Group
Creation of:
Creation of:
2005: Consolidation of:
NCRIC Group
NCRIC Group
2005: Consolidation of:
NCRIC Group
NCRIC Group
2006: Consolidation of:
PIC Wisconsin Group
PIC Wisconsin Group
2006: Consolidation of:
PIC Wisconsin Group
PIC Wisconsin Group
2007: PRI renewal rights deal
2002: SERTA renewal rights deal
2001: OUM renewal rights deal
2000: DPM Merger
1999: PACO Acquisition
2009 M & A Transactions
9
2008 Premium: $98 million
Significant growth in our core business
Nationwide geographical expansion
2008 Healthcare Premium: $20 million
Extends our core business
Broadens our medically-related range
Geographical expansion
Broadens our medically-related range
Geographical expansion
2008 Premium: $5.7 million
Adds to our lawyers’ book
Geographical expansion
Affirms our interest in this line

Responding to Changes in HealthCare
Projected sector growth through 20181
Podiatrists 9%
Physician’s Assistants 39%
Physicians and Surgeons 22%
Chiropractors ; 31%
Medical Assistants 36%
Licensed Nurses 34%
1Bureau of Labor Statistics 2008 to 2018 Projections

Our Focus in 2010

Maintain Profitability
Ensure pricing discipline
Rates based on loss data across multiple years
Not unduly influenced by current market
conditions
conditions
Using credits allows us to maintain existing
rate filings
rate filings
Rates on renewing physician business down
less than 12% from peak pricing in 2006
less than 12% from peak pricing in 2006
12
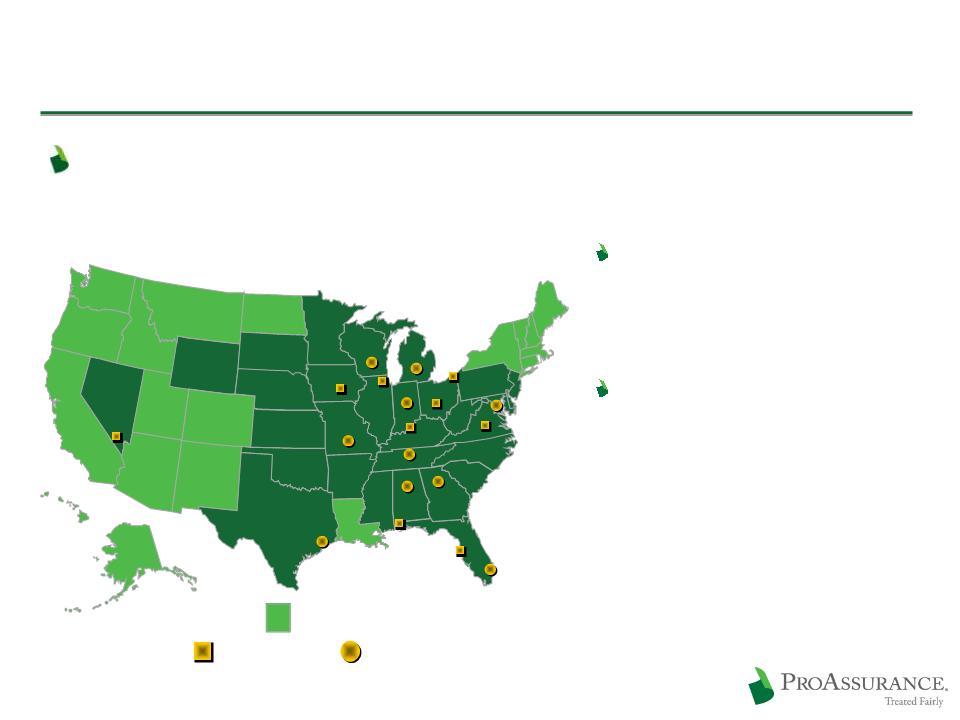
Spread Risk
Broad geographic diversification provides an
unmatched spread of risk
unmatched spread of risk
13
Our spread of risk provides
better market awareness and
more data points to gauge
loss trends
better market awareness and
more data points to gauge
loss trends
Our internal actuarial depth
allows us to assess emerging
trends and respond quickly
allows us to assess emerging
trends and respond quickly
Corporate Headquarters
Corporate Headquarters
Claims Offices
Claims Offices
Claims / Underwriting Offices
Claims / Underwriting Offices
PICA and/or E&S States
PICA and/or E&S States
(Birmingham)

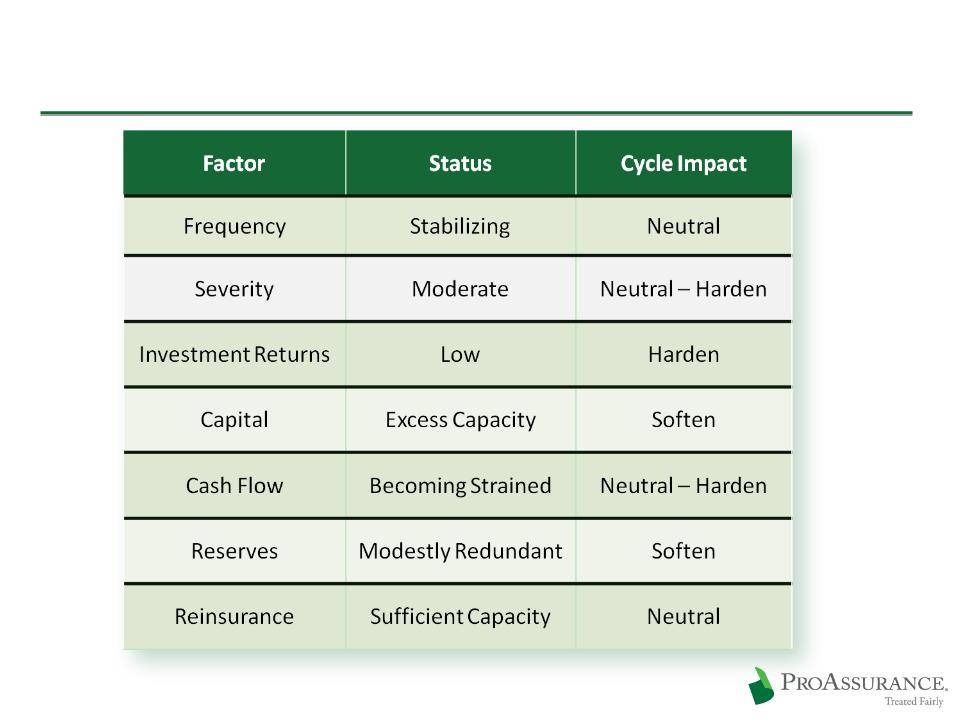
Claims Trends Drive the Business
Frequency
Stabilized in 2009
After Three Years of Decline
Our operational plans leverage our financial strength,
spread of risk and expertise to address potential changes
spread of risk and expertise to address potential changes
Severity
Rising at 4%-5% per Year
An Expected, Manageable Level
An Expected, Manageable Level
Driven by:
Unexpected outcomes
Patient frustration
Influenced by:
Tort reform
Driven by:
Medical Costs
Jury Awards
Tort Reform
Damage Caps

Differentiate In Claims Management
Claims management has always set us apart
We combine financial strength with deep expertise
Give our insureds the option of an uncompromising
defense of their claim
defense of their claim
Allows us to defend our insureds at trial more often
than any other company in our line
than any other company in our line
Provides long-term financial and marketing
advantages
advantages
A key differentiating factor in the market
as claims data becomes public
as claims data becomes public
15

Keep an Eye on Washington
Health care reform is in limbo
We expect no major changes in the tort system
Demonstration projects do not provide meaningful
reform or immediate data
reform or immediate data
Signals a desire to leave the tort system in
the hands of each state
the hands of each state
16

Prepare for State Changes
Tort reforms under attack in many states
We are prepared, operationally and financially,
if reforms are struck down in our states
if reforms are struck down in our states
We set prices and reserves as if there is no tort
reform, until results reflect otherwise
reform, until results reflect otherwise
17

Financial Highlights
Strategy: Enduring Financial Strength
19
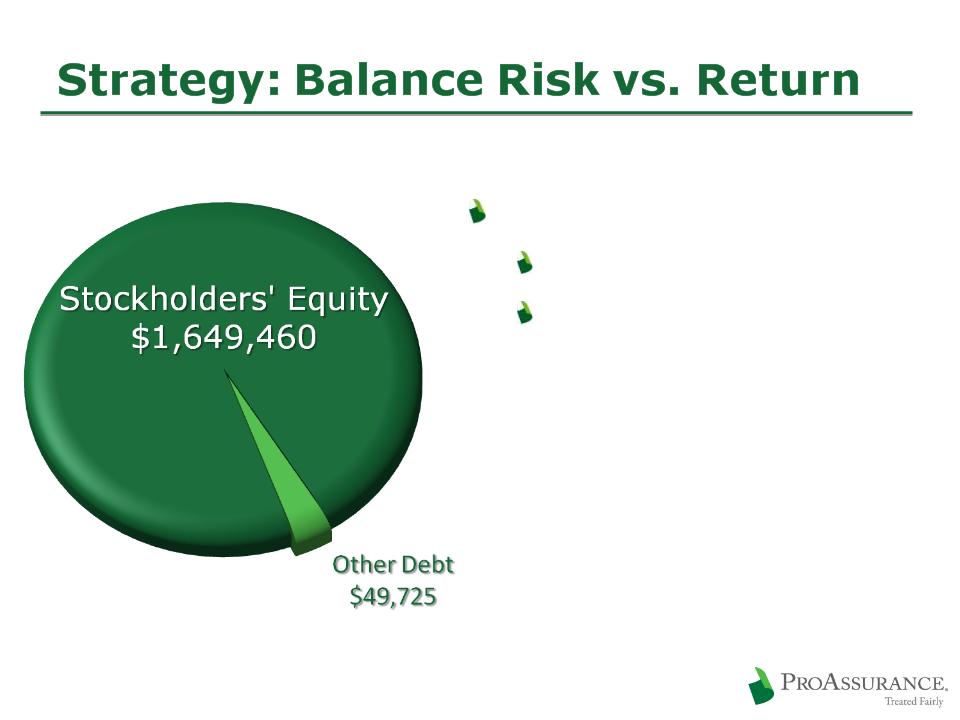
Emphasizing an appropriate balance of risk vs. return
Committed to enduring balance sheet strength
Responding to the low interest rate environment
Stockholder’s Equity Up
Over 16% Since 12/31/07
Over 16% Since 12/31/07
Strategy: Balance Risk vs. Return
Key Investment Actions in Q3 09
Reduced cash and short-term
balances
balances
Added to corporate bonds
CUSIP-level portfolio disclosure
on our website:
www.proassurance.com/investorrelations/supplemental.aspx
on our website:
www.proassurance.com/investorrelations/supplemental.aspx
$3.9 Billion
Portfolio
Portfolio
$3.9 Billion
Portfolio
Portfolio
Fixed Income: 91%
Short Term: 4%
Short Term: 4%
Equity and Other Investments: 3%
Equity and Other Investments: 3%
BOLI: 2%
BOLI: 2%
20
9/30/09
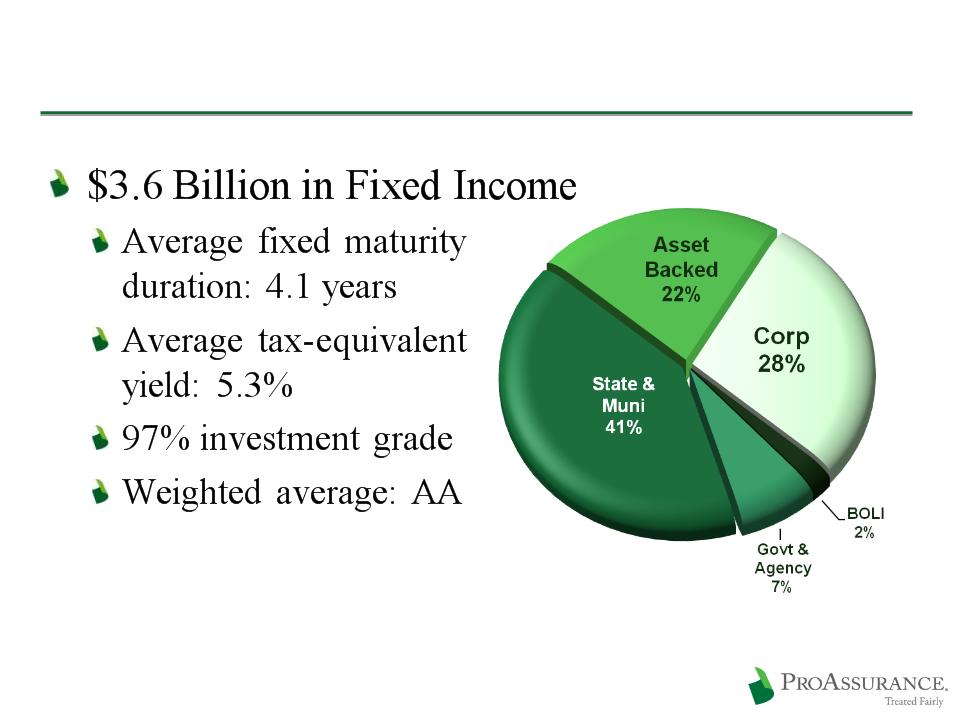
Fixed Income: $3.6 Billion
21
9/30/09
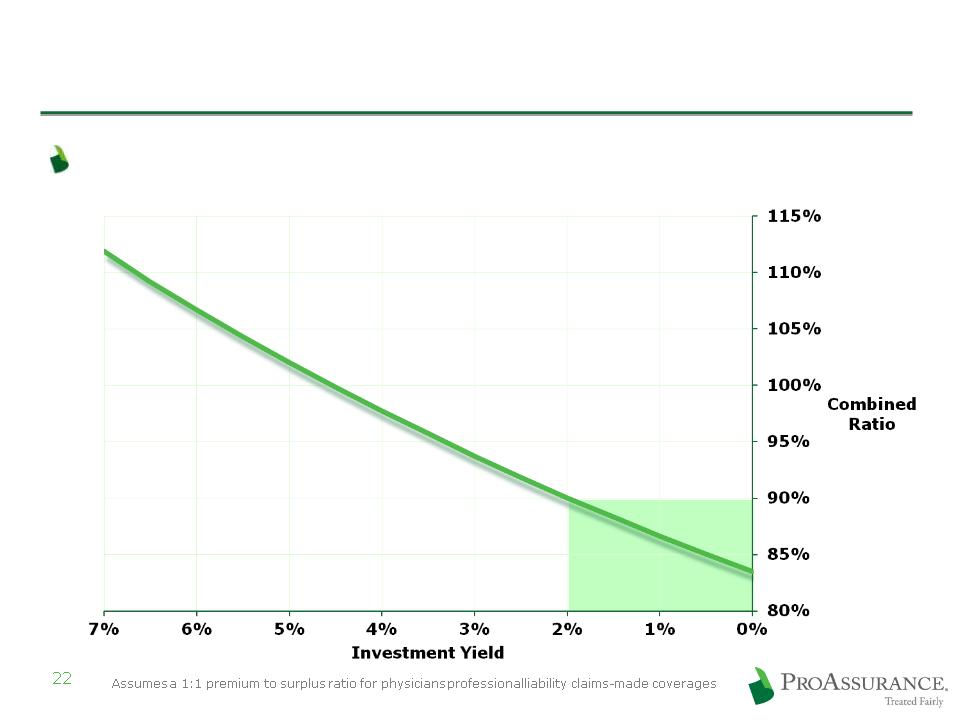
The Importance of Investment Income
Pricing discipline is even more critical
Combined Ratio
required to generate
a 13% after-tax ROE
required to generate
a 13% after-tax ROE

The Importance of Investment Income
Year
1
1
Year
2
2
Year
3
3
Year
4
4
Year
5
5
Year
6
6
Year
7
7
Year
8
8
Incident
Occurs
Occurs
Discovery
and
Preparation
and
Preparation
Claim
Reported
Reported
Trial
and
Appeals
Appeals
Resolution
5-6 Years
After
Claim
Reported
After
Claim
Reported
Life Cycle of a Typical Claim
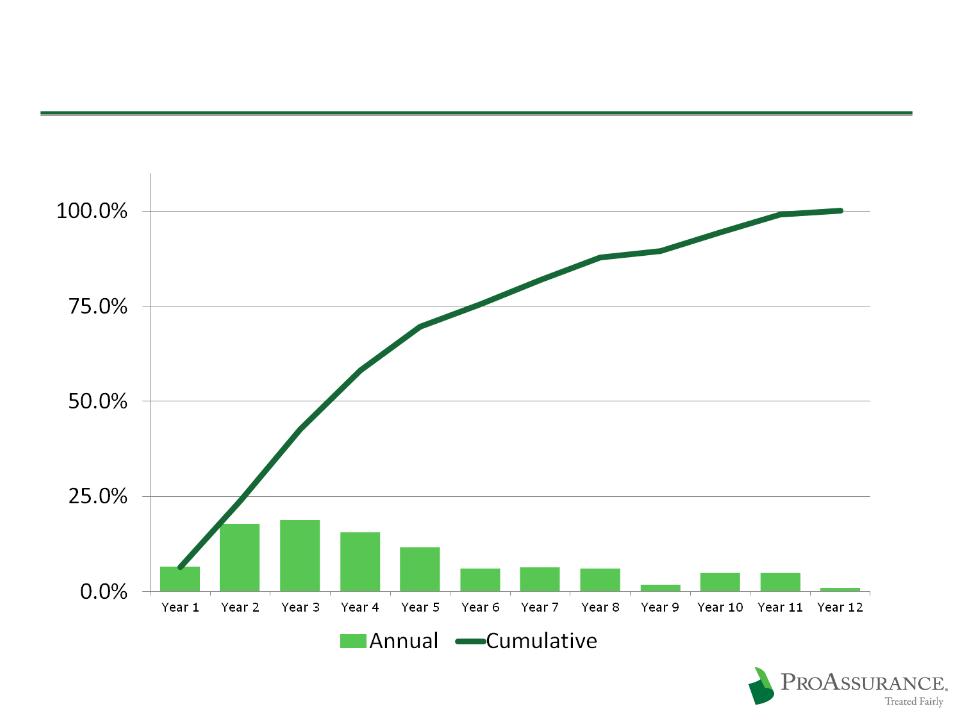
The Importance of Investment Income
Typical Claims Payout Pattern
Strategy: Use Capital Prudently
Using capital to build through M&A
Preserving capital for future opportunities
Enhancing shareholder value by repurchasing shares
at prices that build Book Value
at prices that build Book Value
25
Source: SNL Financial
26
Little Dependence on Debt
Low Debt to Cap Ratio
Little strain on cash flow
9/30/2009
Our Strong Capital/Low Leverage Position
27
(in millions)
Prepared for an
improving market
improving market
Prudent capital
management
management
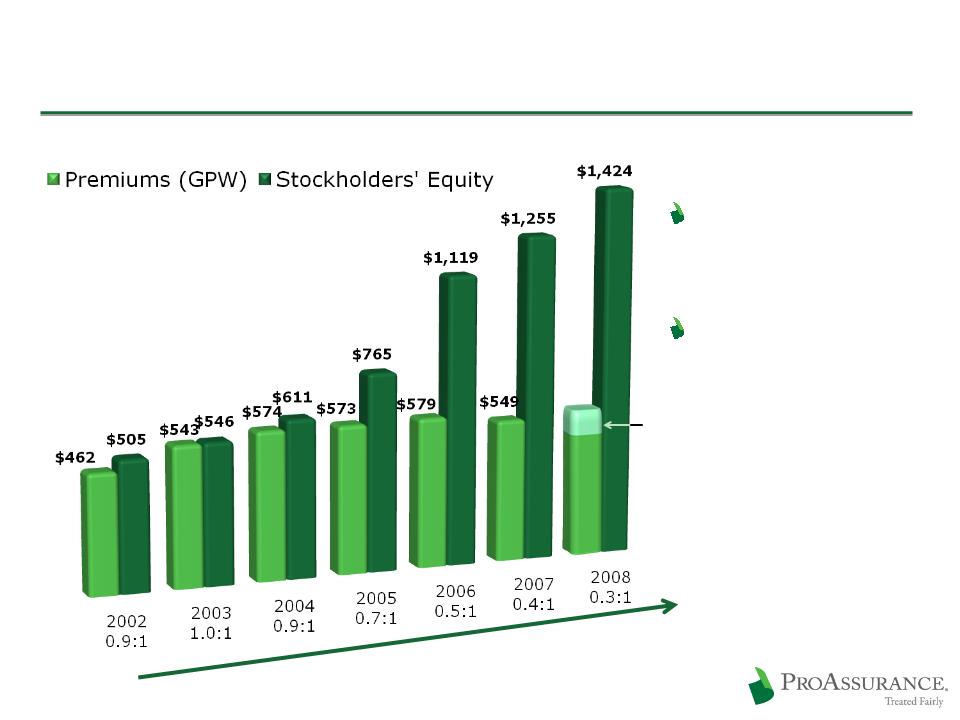
Premiums to Surplus
for Each year
for Each year
$567
$ 96 (PICA pro forma)
$471
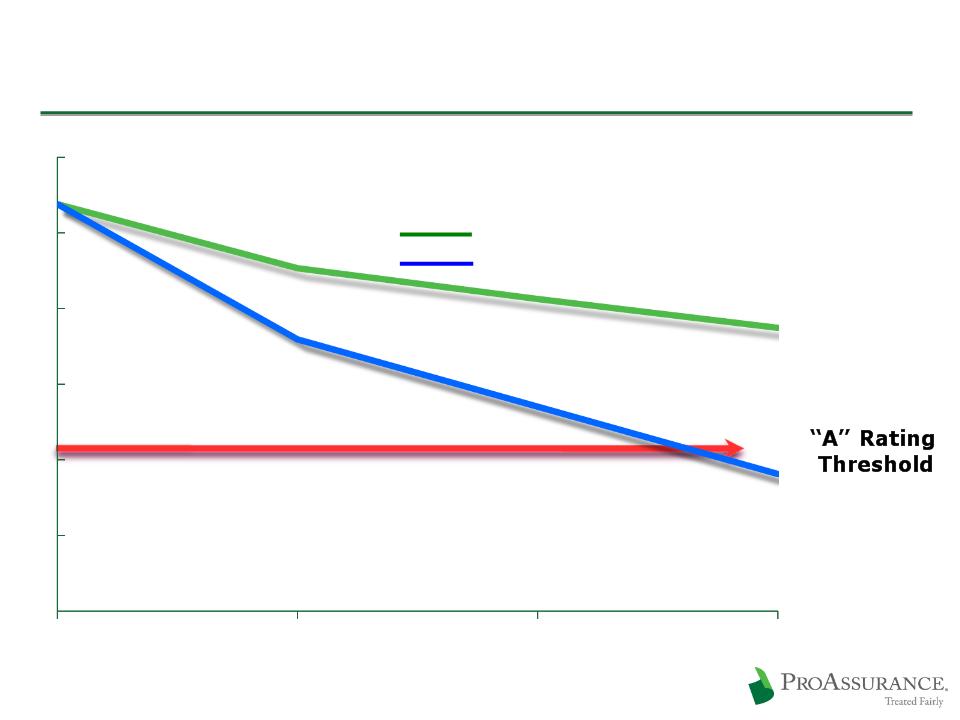
Excess Capital vs. Excess Capacity
28
Conceptual Model of Projected
A. M. Best BCAR Scores if
A. M. Best BCAR Scores if
Premiums Increase
Surplus is Reduced

2009 YTD Income Statement Highlights
29
in millions, except per share data
Gross Premiums Written $ 435 $ 374 $ 472
Net Investment Income 113 122 158
Total Revenue 489 431 567
Total Expenses 295 294 470
Operating Income $ 136 $ 127 207
Net Income (Includes Investment Losses) $ 137 $ 101 178
Operating Income/Diluted Share $ 4.08 $ 3.73 $ 6.07
September 30, Year-End
2009 2008 2008
Premium is growing with new business from
PICA, Mid-Continent and Georgia Lawyers
PICA, Mid-Continent and Georgia Lawyers

Summary

ProAssurance
Producing sustainable shareholder value
Growing Book Value per Share
Finding the right M & A opportunities
Significant share ownership at all levels
Focusing on long-term
Preparing for a changing market
Leveraging financial strength
Protecting the balance sheet
Maintain our leading market position
Building strength for the next cycle turn
31

Appendix: Market Conditions

The State of the Market
Prices have been falling yet profitability remains high
Continued low interest rates must enforce discipline
sooner or later
sooner or later
Frequency is no longer declining
Only a matter of time before frequency moves higher
But when?
Severity is trending upward at expected, manageable
rates (4%-5%) in most states
rates (4%-5%) in most states
The State of the Market
34

Appendix: Claims
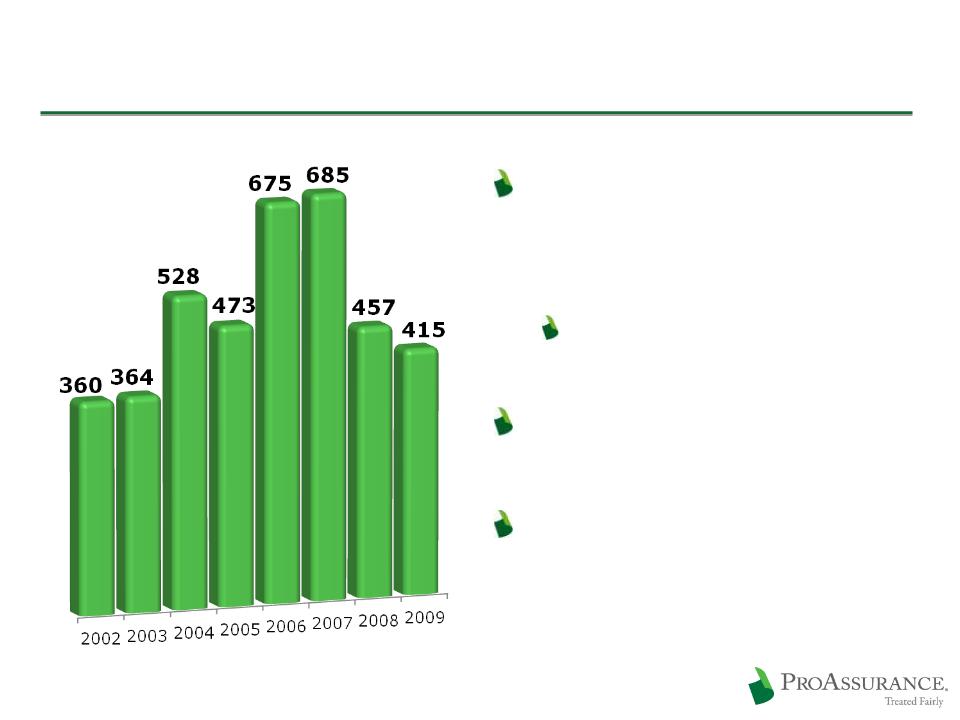
Claims Trends Remain Favorable
Frequency trends are
stable after declining
since 2005/2006
stable after declining
since 2005/2006
The result is fewer
cases to try
cases to try
Severity trends also
stable
stable
Trends are much the
same in states with or
without Tort Reform
same in states with or
without Tort Reform
36
ProAssurance Claims Tried
to a Verdict
to a Verdict
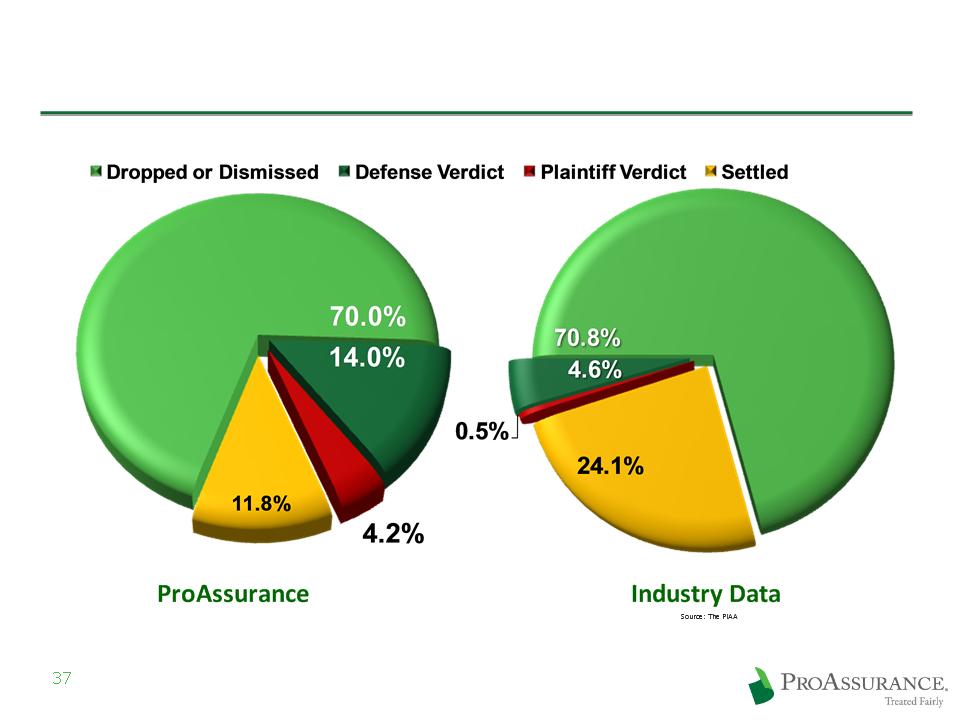
Why Claims Strategy Matters
Favorable
Outcomes:
84.0%
Outcomes:
84.0%
Favorable
Outcomes:
84.0%
Outcomes:
84.0%
Five Year Average
2004 - 2008
2004 - 2008
Favorable
Outcomes:
75.4%
Outcomes:
75.4%
Favorable
Outcomes:
75.4%
Outcomes:
75.4%
Why Claims Strategy Matters
Our ability and willingness to defend claims
allows us to achieve better results
allows us to achieve better results
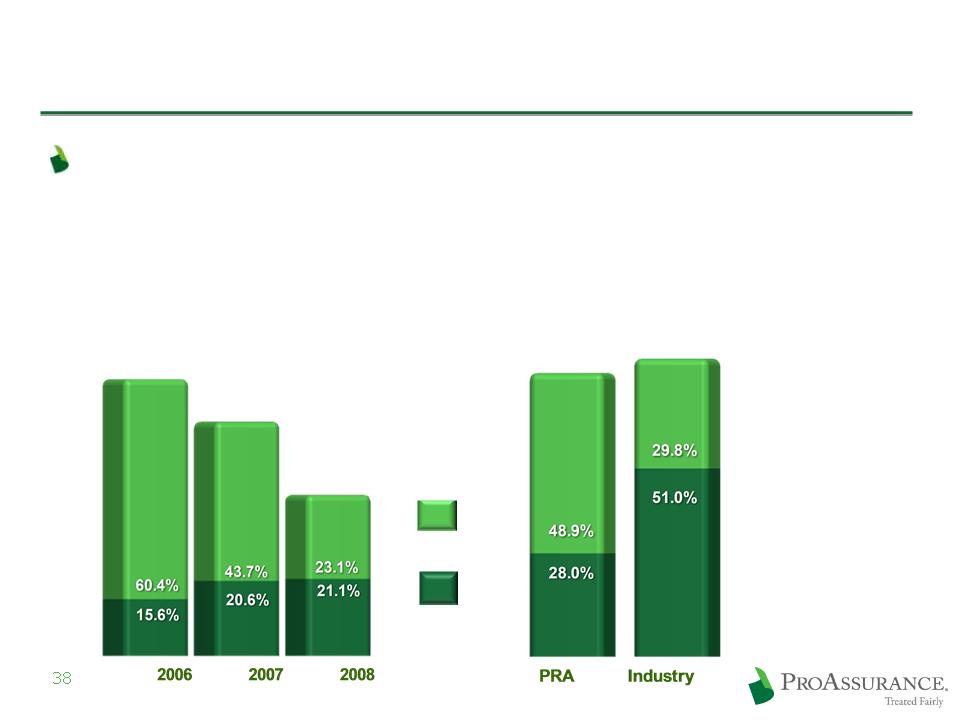
ProAssurance vs. Industry
Average Statutory Loss Ratio
Average Statutory Loss Ratio
2003-2008
Legal
Payments
Payments
Loss
Payments
Payments
Trend for ProAssurance
Stand Alone Statutory Loss Ratio
Stand Alone Statutory Loss Ratio
2006 - - 2008
76.0%
*Source: A. M. Best Aggregates & Averages, Medical Malpractice Predominating
64.3%
80.8%
76.9%
44.2%

Appendix: Underwriting/Actuarial
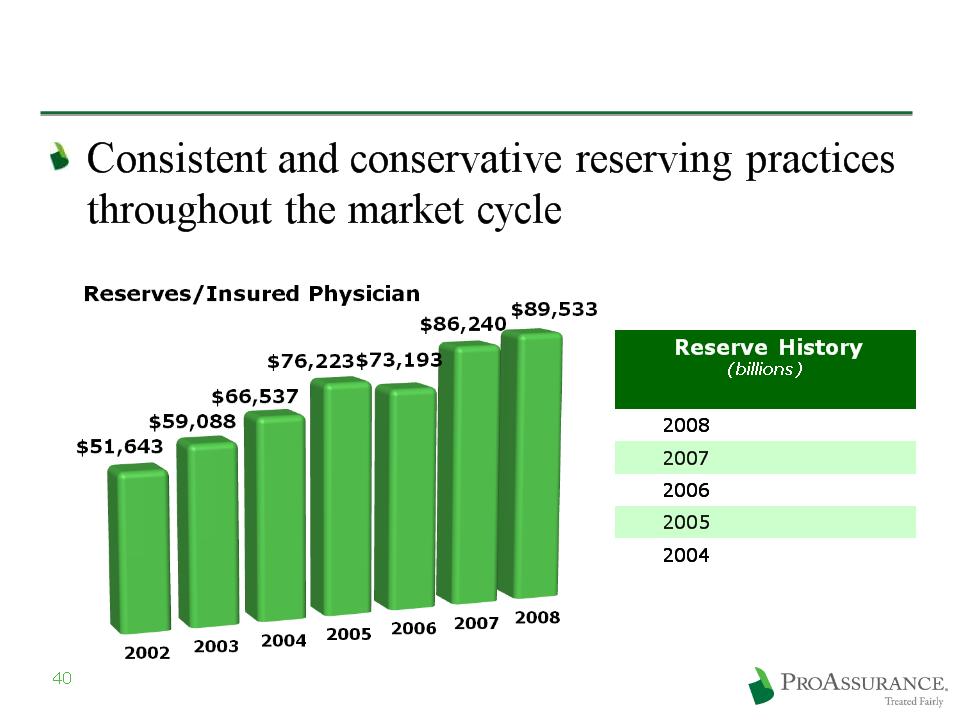
Enforce Actuarial Conservatism
$ 2.4 | |
$ 2.6 | |
$ 2.6 | |
$ 2.2 | |
$ 1.8 | |
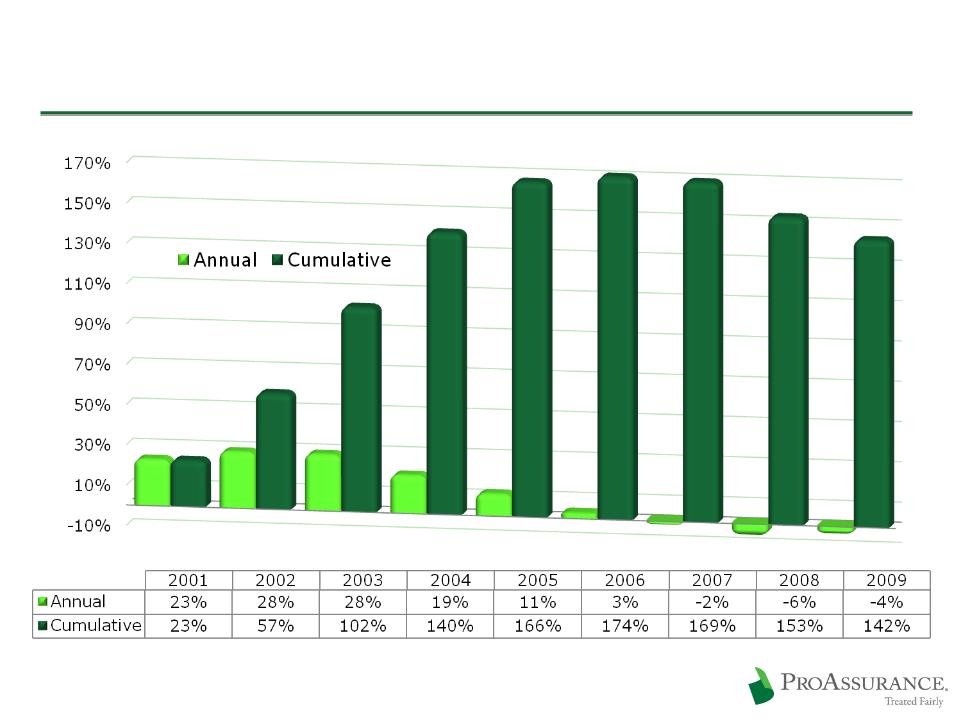
Rate Change History
41

Appendix: Moody’s Rankings
Moody’s Top 100 Ranking Data

Appendix: Investments
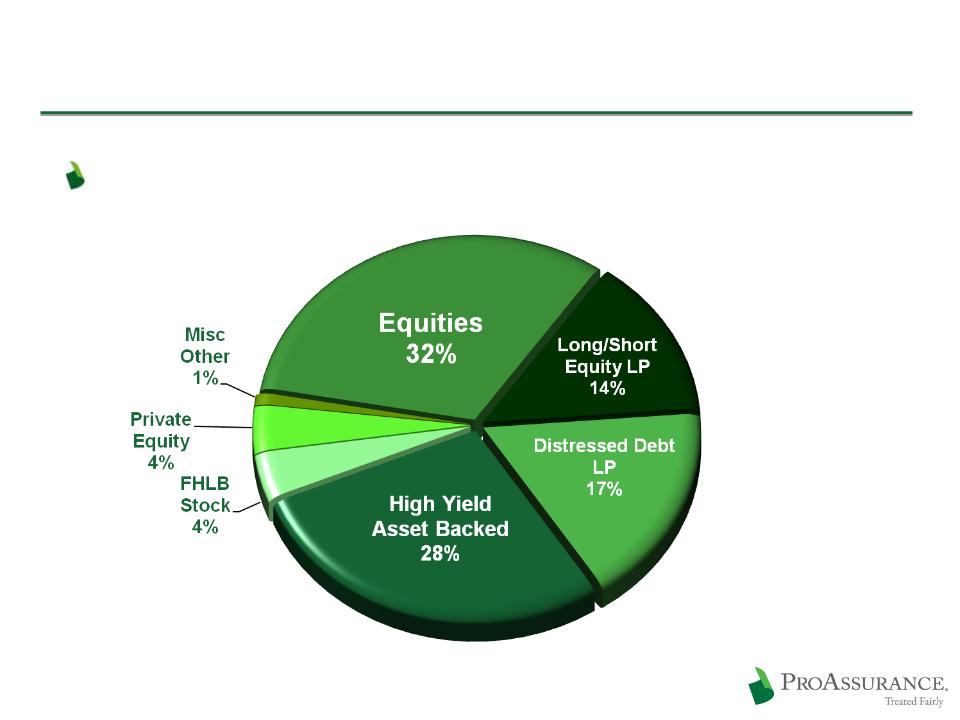
Equities & Other: $136 Million
45
9/30/09
Represents 3.5% of our Total Investments
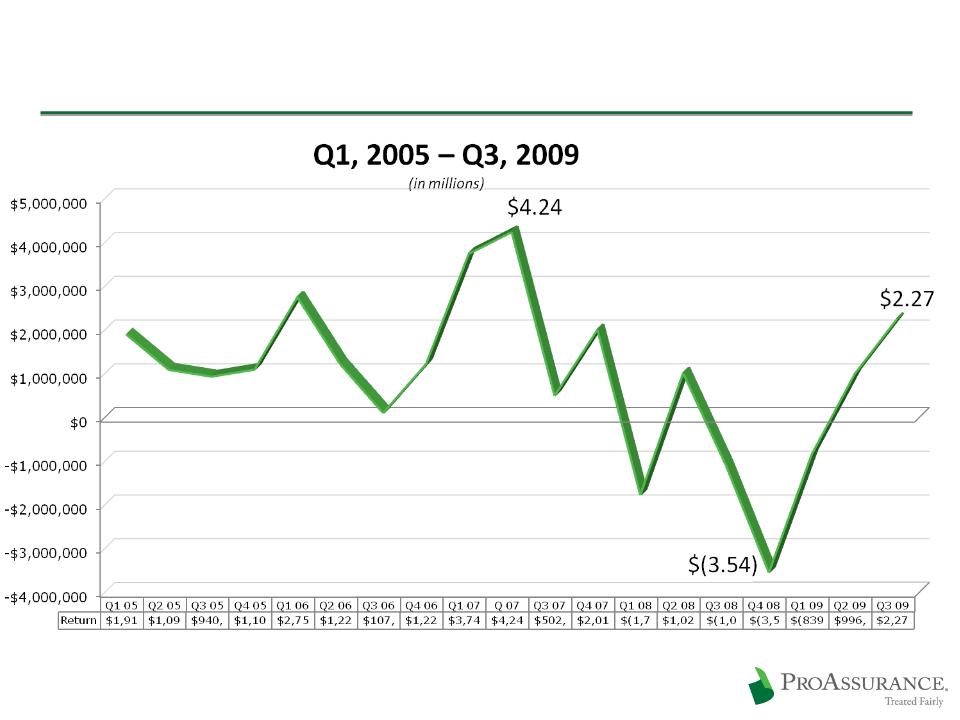
Return by Quarter: Equities & Other
46
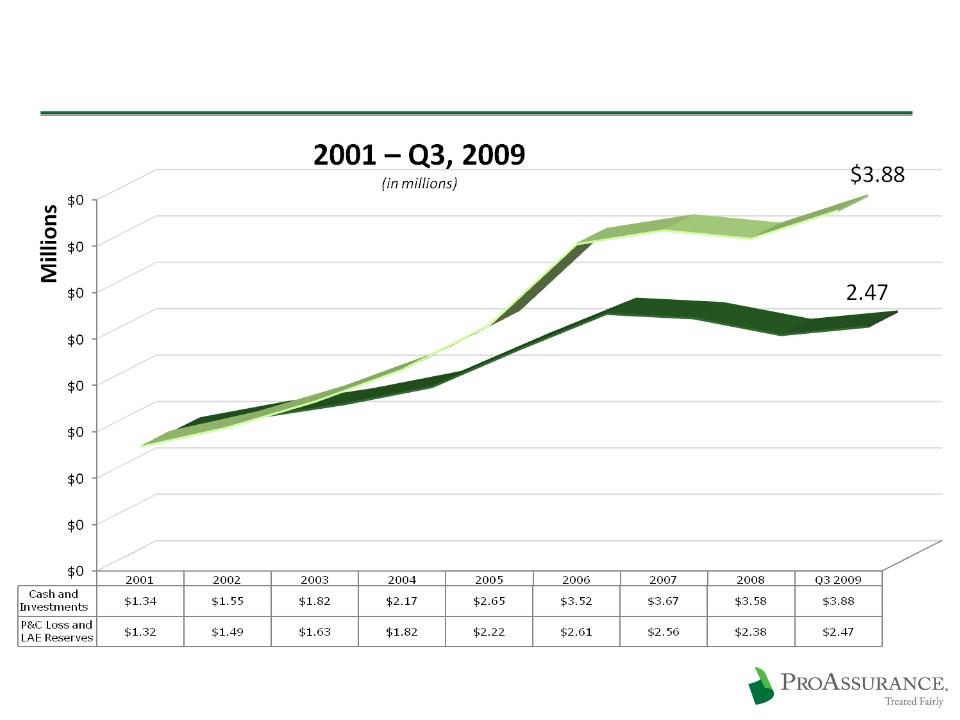
Growth in Investment vs. Reserves
47
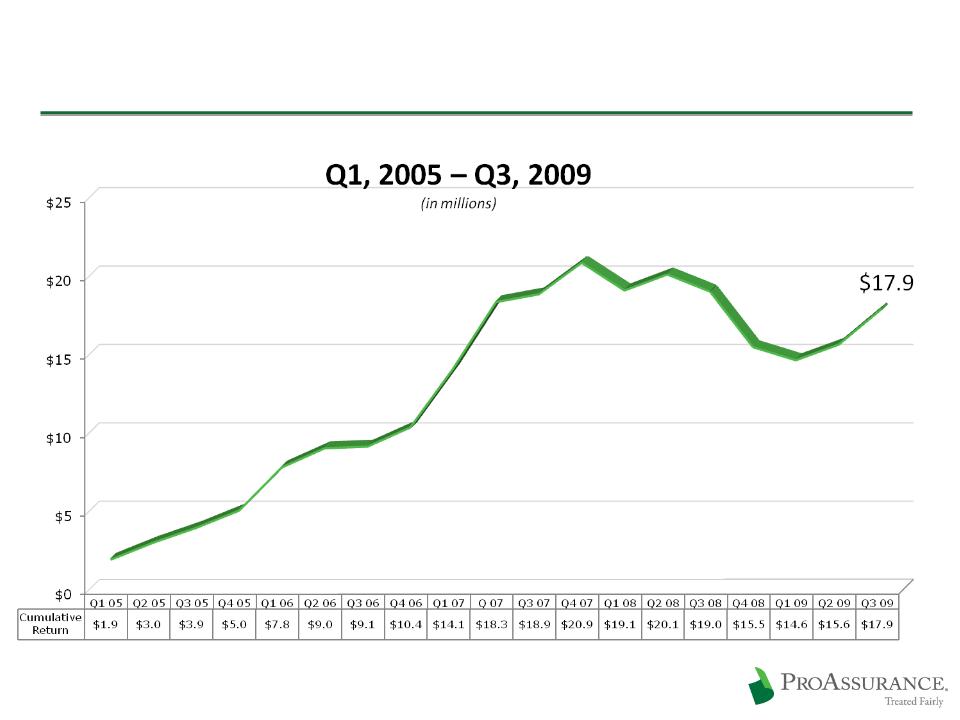
Cumulative Return: Equities & Other
48
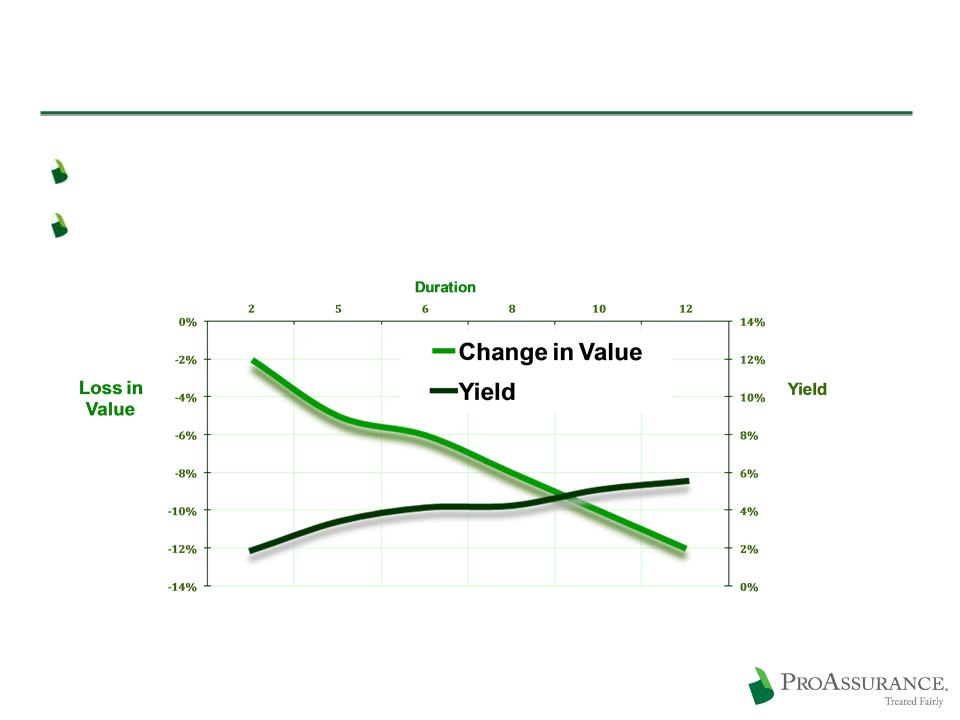
Strategy: Investment Discipline
The choice: Chase yield or extend duration
We are maintaining duration, looking for opportunities
49
Loss in value assuming a 100 basis point shift in the yield curve
Yields based on Single A composite corporate debt
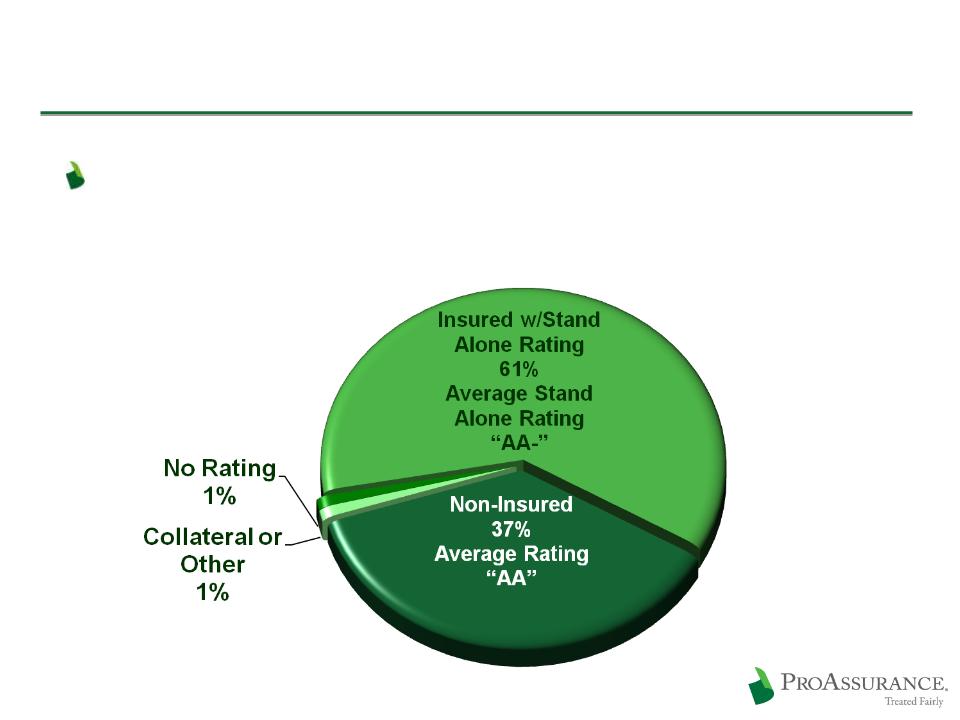
Municipals: $1.5 Billion
50
9/30/09
Investment policy has always required
investment grade rating prior to applying the
effect of insurance
investment grade rating prior to applying the
effect of insurance
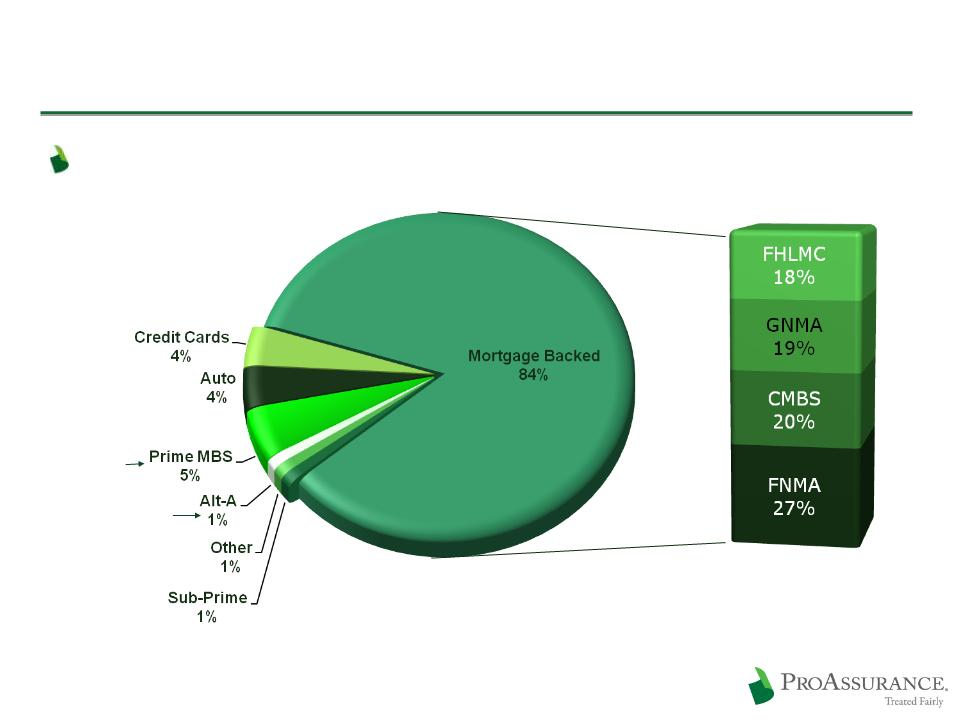
Asset Backed: $805 Million
Weighted average rating: “AAA”
Bloomberg Data
9/30/09
9/30/09
Alt-A
LTV 63%
LTV 63%
Prime MBS
LTV 56%
LTV 56%
Further Details Provided
on Sub-Prime and CMBS
on following pages
on Sub-Prime and CMBS
on following pages
51

Sub-Prime Detail
52
$6.7 million market value in AFS portfolio
$4.2 million unrealized loss
$9.6 million market value in
high-yield LP rated B
high-yield LP rated B
LP’s focus is distressed ABS
At 9/30/09 | Vintage |
$4.8 Mln | 2004 & Prior |
$1.9 Mln | 2005 |
Quality & Vintage information only on direct holdings at 9/30/09
At 9/30/09 | Type | Quality |
$2.9 Mln | Mortgage-Backed | AA avg - LTV 68% |
$3.8 Mln | Home Equity | A+ avg |

CMBS Detail
Vintages
2005 & Prior- $136 million
2006- $23 million
2007- $3 million
Top Property Types
Retail-Anchored: 45% of CMBS portfolio
Exposure: 19% - 44% of underlying occupancies
Office: 44% of CMBS portfolio
Exposure: 23% - 49% of underlying occupancies
Multi Family: 4% of CMBS portfolio
Mixed Use: 3% of CMBS portfolio
Other: 4% of CMBS Portfolio
53

CMBS Detail
$162 million Fair Value in non-agency CMBS
Book Value: $164 million
5% of fixed income portfolio
54
At 9/30/09 | Quality |
$160 Mln | AAA |
$ 2.0 Mln | AA |
At 9/30/09 | Wtd Avg LTV |
24% | <65% |
43% | =65-70% |
21% | <70-75% |
12% | =75-85% |
At 9/30/09 | Credit Support |
26% | >30% |
52% | 20% - 30% |
20% | 10% - 20% |
2% | Less than 10% |
At 9/30/09 | Deal Cumulative Delinquencies |
27% | 0.0% - 0.5% |
3% | 0.5% - 1.0% |
32% | 1.0% - 2.0% |
4% | 2.0% - 3.0% |
22% | 3.0% - 5.0% |
12% | 5.0% - 9.0% |
At 9/30/09 | Debt Service Coverage |
69% | =>1.5x |
25% | 1.4x-1.5x |
6% | 1.3x-1.4x |
AT
9/30/09
9/30/09

CMBS Since September 30, 2009
Since 9/30/09:
Sold $50.0 million CMBS
Paydowns of $8.0 million
As of November 30, 2009 CMBS:
Market value: $108 million
Book value: $110 million
Expecting pay down of $19 million
by year-end 2009
by year-end 2009
Projecting ~$90 million exposure at year-end
55

Corporates: $1.0 Billion
56
9/30/09

Corporate: Detail on Financials
Top 20 Largest Banks/Financials: $ 294 million
$75 mm FDIC backing
BA $44 ($23) | BNY Mellon $10 |
MS $27 ($6) | Credit Suisse $9 |
BP Cap $25 | Eurohypo $8 |
GECC $25 ($8) | KEY $6 ($6) |
JPM $24 ($14) | NRUC $6 |
CITI $20 ($7) | Deutsche Bank $5 |
Wells $20 | FMCC $5 |
GS $16 ($2) | NY Commt’y Bank $5 ($5) |
PNC $15 ($2) | Depfa ACS Covered $5 |
Amex $14 | John Deere Cap $5 ($2) |
FDIC backed amounts listed in parentheses | |
57
9/30/2009
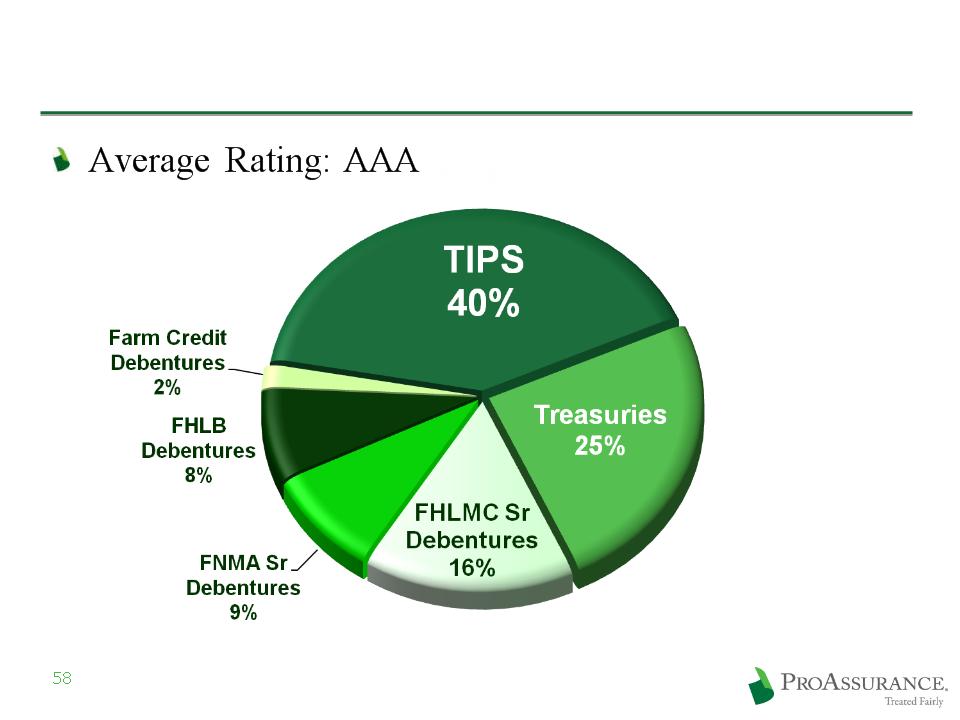
Treasury/GSE: $228 Million
9/30/09

59
9/30/09
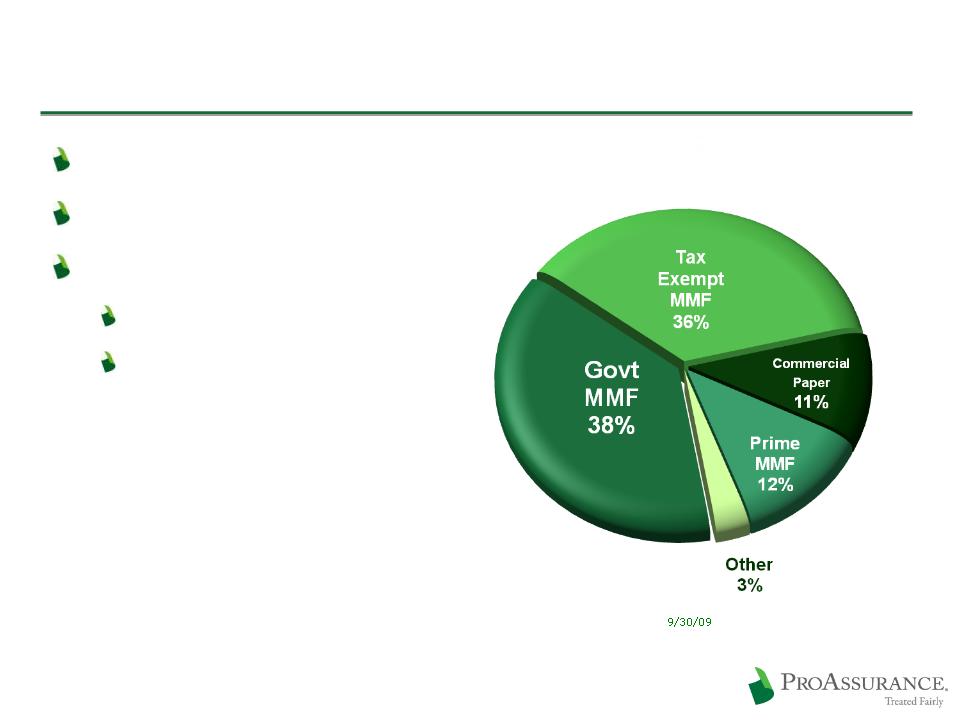
Portfolio Overview: Short Term
$138 Million
Rated A1/P1 or better
Money Markets:
Moody’s: Aaa
S&P: AAA
60
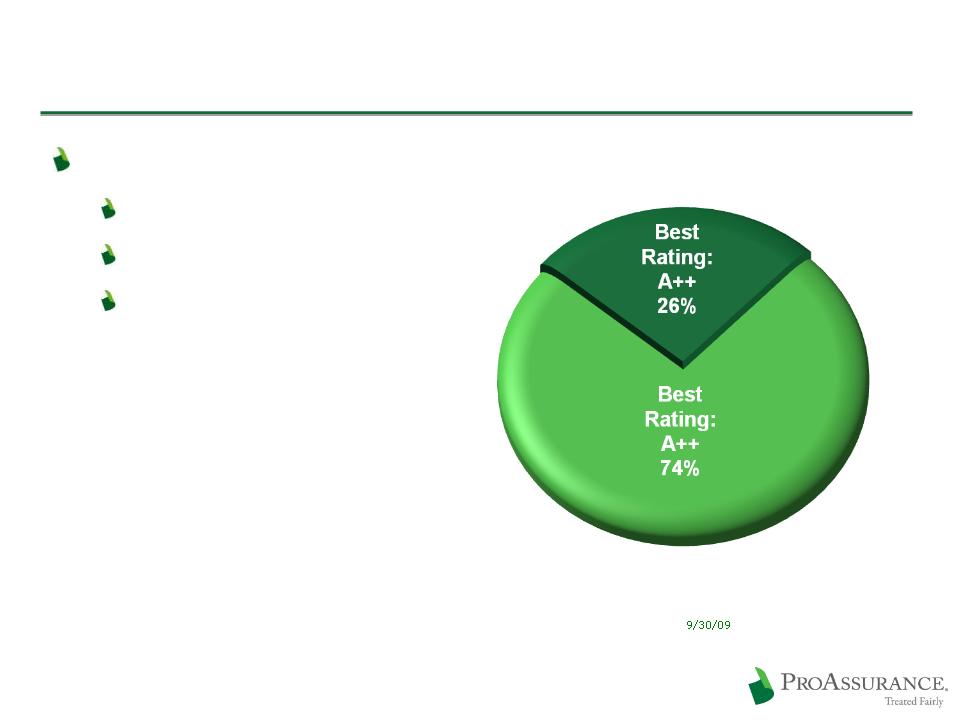
BOLI: $65 Million
Weighted average rating
Moody’s: AA3
S&P: AA
A. M. Best: A+
61