
June 16, 2010
Frank B. O’Neil Investor Relations Officer |

Forward Looking Statements
This presentation contains Forward Looking Statements and other information designed
to convey our projections and expectations regarding future results. There are a number
of factors which could cause our actual results to vary materially from those projected in
this presentation. The principal risk factors that may cause these differences are
described in various documents we file with the Securities and Exchange Commission,
such as our current reports on Form 8-K, and our regular reports on Forms 10-Q and 10-
K, particularly in “Item 1A, Risk Factors.” Please review this presentation in
conjunction with a thorough reading and understanding of these risk factors.
This presentation contains Non-GAAP measures, and we may reference
Non-GAAP measures in our remarks. A reconciliation of these measures to GAAP
measures is available in our latest quarterly news release, which is available in the
Investor Relations section of our website, www.ProAssurance.com, and in
the related Current Reports on Form 8K disclosing that release.
Non-GAAP measures in our remarks. A reconciliation of these measures to GAAP
measures is available in our latest quarterly news release, which is available in the
Investor Relations section of our website, www.ProAssurance.com, and in
the related Current Reports on Form 8K disclosing that release.
2
Non-GAAP Measures
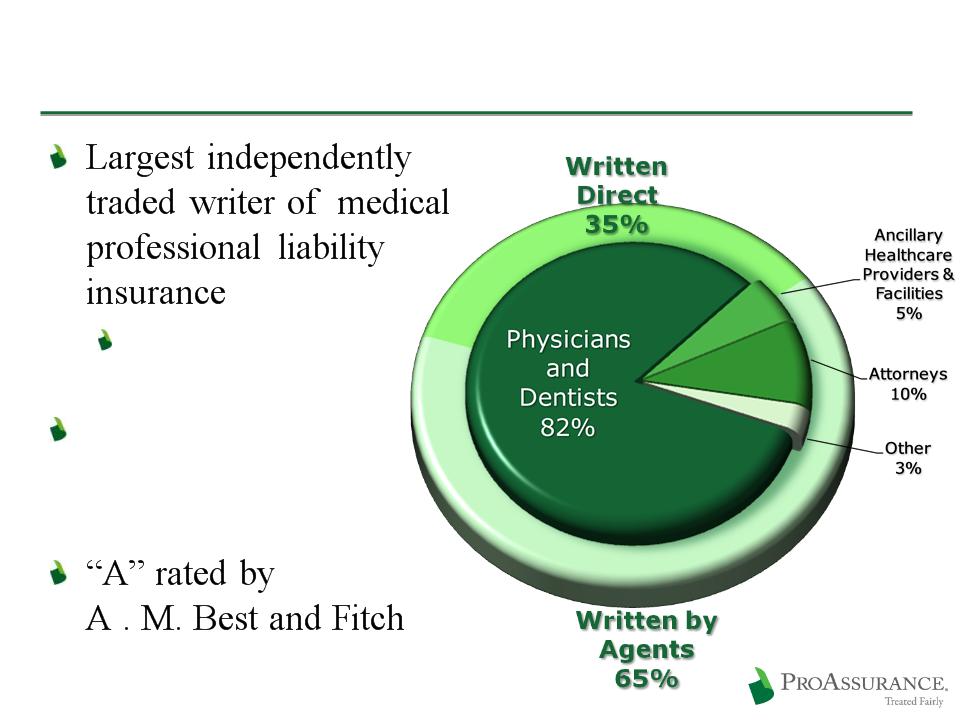
ProAssurance: Quick Facts
Fourth largest
overall writer
overall writer
Insuring 62,500
policyholders
nationwide
policyholders
nationwide
3

Effective & Experienced Management
4
W. Stancil Starnes, J.D. Chairman & Chief Executive Officer sstarnes@proassurance.com (205) 877-4400 Company Tenure: 3 Years Prior MPL Experience: 29 Years Industry & Related Experience: 32 Years Formerly in the private practice of law in MPL defense and complex corporate litigation. | Victor T. Adamo, J.D., CPCU President vadamo@proassurance.com (205) 877-4400 Company Tenure: 25 Years Prior MPL Experience: 5 Years Industry & Related Experience: 30 Years Formerly in the private practice of corporate law. | Jeffrey L. Bowlby, A.R.M. Sr. Vice-President & Chief Marketing Office jbowlby@proassurance.com (517) 347-6306 Company Tenure: 12 Years Prior MPL Experience: - Industry & Related Experience: 26 Years Career-long experience in insurance sales and marketing, most recently as SVP for Marketing with Meadowbrook. |
Howard H. Friedman, F.C.A.S. Sr. Vice-President & Chief Underwriting Officer hfriedman@proassurance.com (205) 802-4796 Company Tenure: 14 Years Prior MPL Experience: 16 Years Industry & Related Experience: 30 Years Career-long experience in MPL company operations and management. Former ProAssurance CFO. | Jeffrey P. Lisenby, J.D. Sr. Vice-President, General Counsel & Secretary jlisenby@proassurance.com (205) 445-2668 Company Tenure: 9 Years Prior MPL Experience: - Industry & Related Experience: 9 Years Formerly in the private practice of law. | Frank B. O’Neil Sr. Vice-President & Chief Communications Officer foneil@proassurance.com (205) 877-4461 Company Tenure: 23 Years Prior MPL Experience: - Industry & Related Experience: 23 Years Formerly a television news executive and anchor. |
Edward L. Rand, Jr., CPA Sr. Vice-President & Chief Financial Officer erand@proassurance.com (205) 802-4718 Company Tenure: 6 Years Prior MPL Experience: - Industry & Related Experience: 18 Years Career-long experience in insurance finance and accounting. Most recently Chief Accounting Officer for Partner Re. | Darryl K. Thomas, J.D. Sr. Vice-President & Chief Claims Officer dthomas@proassurance.com (205) 445-2668 Company Tenure: 12 Years Prior MPL Experience: 10 Years Industry & Related Experience: 22 Years Career-long experience in MPL claims management. | Hayes V. Whiteside, M.D. Sr. Vice-President & Chief Medical Officer hwhiteside@proassurance.com (205) 445-2670 Company Tenure: 6 Years MPL Experience: - Industry & Related Experience: 27 Years Formerly in the private practice of Urology. |
Average executive tenure through VP level is 16 years

Recognition and Rating Highlights
Third straight year as one of the
50 top performing property casualty
insurance companies
50 top performing property casualty
insurance companies
Top 3% of all P&C companies
Affirmed at “A” (Excellent)
by A. M. Best
by A. M. Best
Positive Outlook
by S & P
by S & P
5

Recent Business Highlights
Maintaining our profitability and book value growth
GROWING the top line
Three M&A transactions completed in 2009 -
Provided approximately $100 million in annualized
premium growth
Provided approximately $100 million in annualized
premium growth
Existing markets grew modestly in 2009
Outstanding performance in a challenging
financial market and a demanding line of
insurance
financial market and a demanding line of
insurance
6

How We Define Success
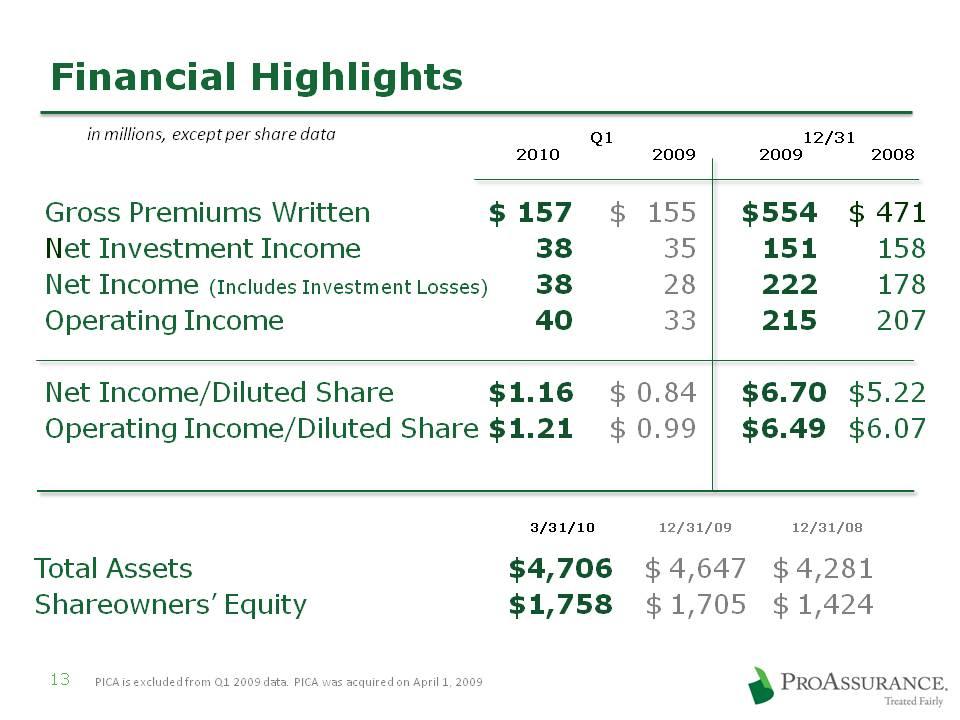
23% Increase in Book Value per Share in 2009
19% Increase in Revenue vs. 2008
28% Increase in Diluted EPS
Top Line Growth in 2009
$28 million of new business in our historical book
Outstanding performance in a challenging
financial market and a demanding line of
insurance
financial market and a demanding line of
insurance
7
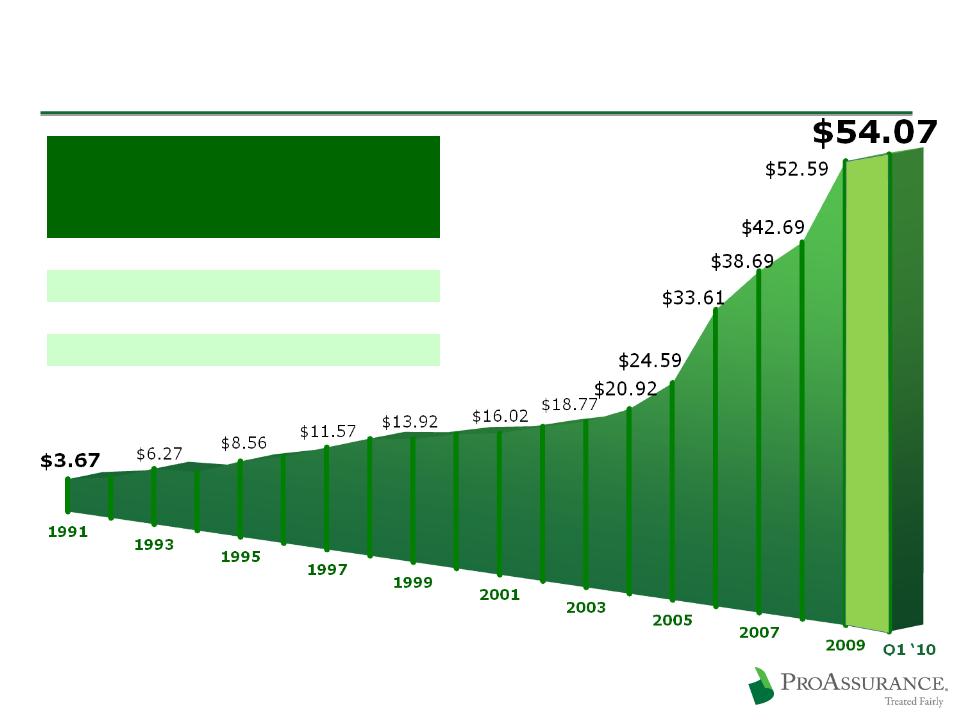
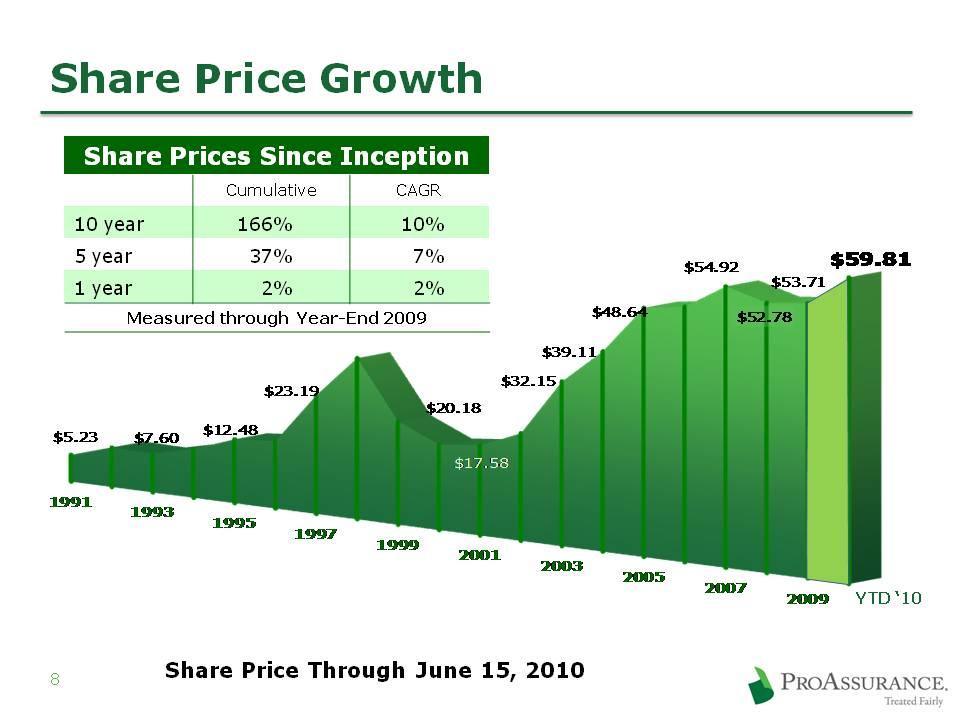
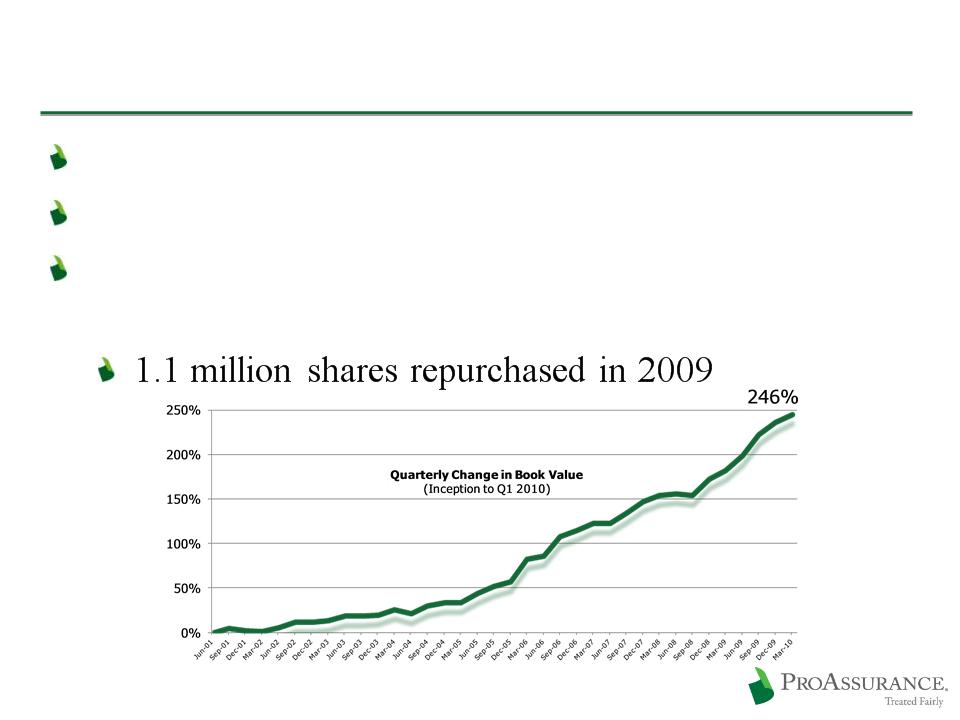
Book Value Growth Through Q1 2010
Book Value Growth EVERY Year Since Inception | ||
Cumulative | CAGR | |
10 year | 278% | 14% |
5 year | 151% | 20% |
1 year | 23% | 23% |
Measured through Year-End 2009 | ||
8
Book Value per Share
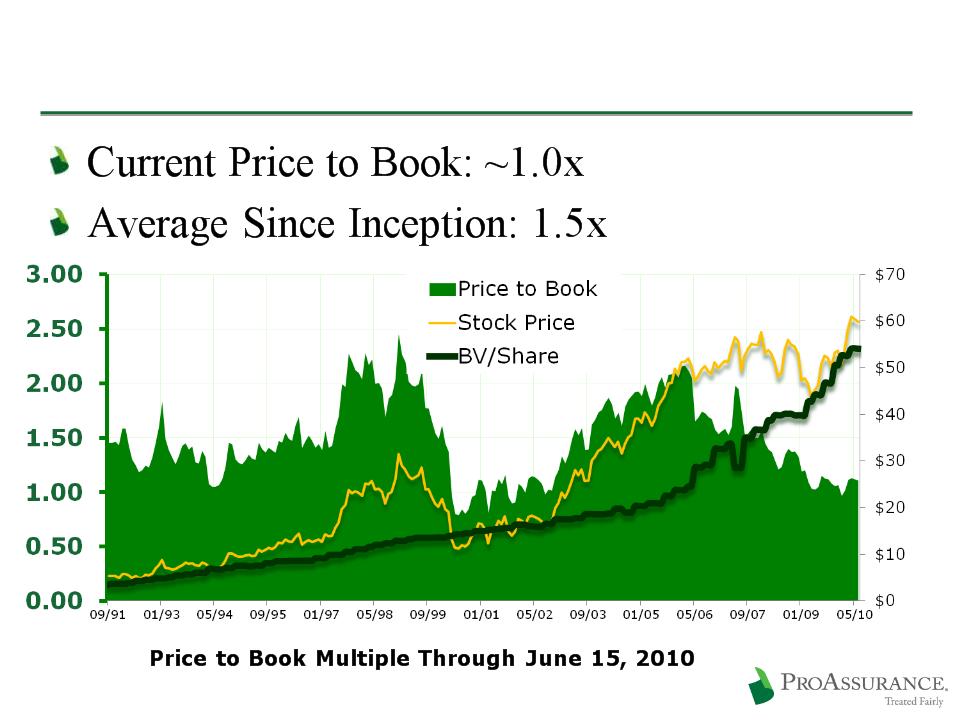
Trading Below Historic BV Multiple
10

Key Advantages
Enduring Financial Strength
12
Emphasizing an appropriate balance of risk vs. return
Committed to enduring balance sheet strength
Responding to the low interest rate environment
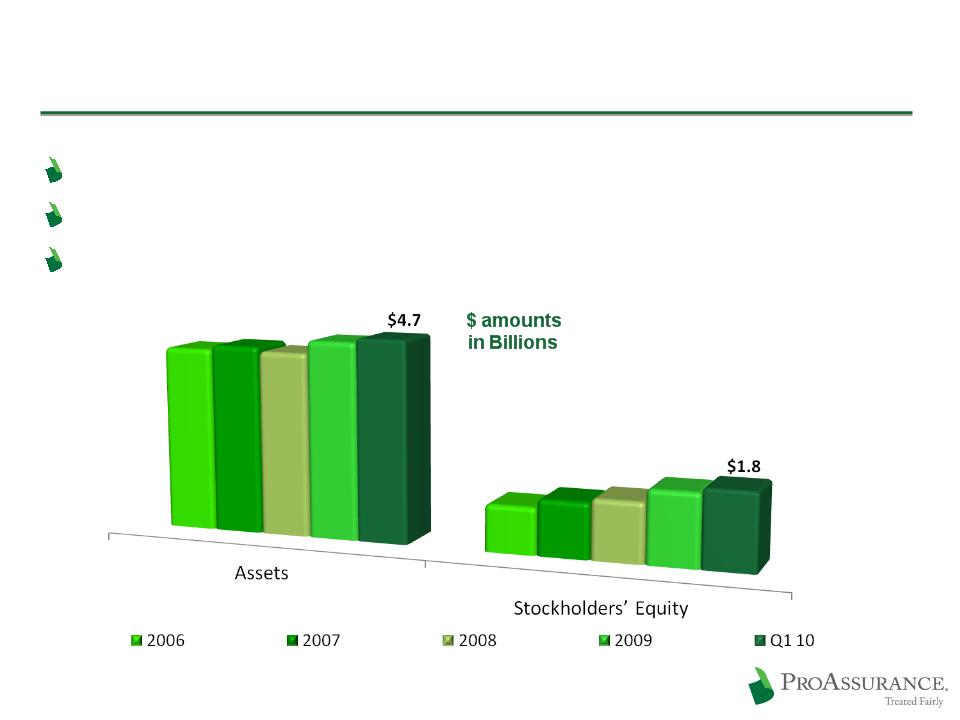
Stockholder’s Equity Up
Over >16% Since
12/31/07
Over >16% Since
12/31/07

Investments Balance Risk vs. Return
Key Investment Actions in Q1 10
Further reduction of cash and short-
term balances
term balances
Added to corporate bond holdings
CUSIP-level portfolio disclosure
on our website:
www.proassurance.com/investorrelations/supplemental.aspx
on our website:
www.proassurance.com/investorrelations/supplemental.aspx
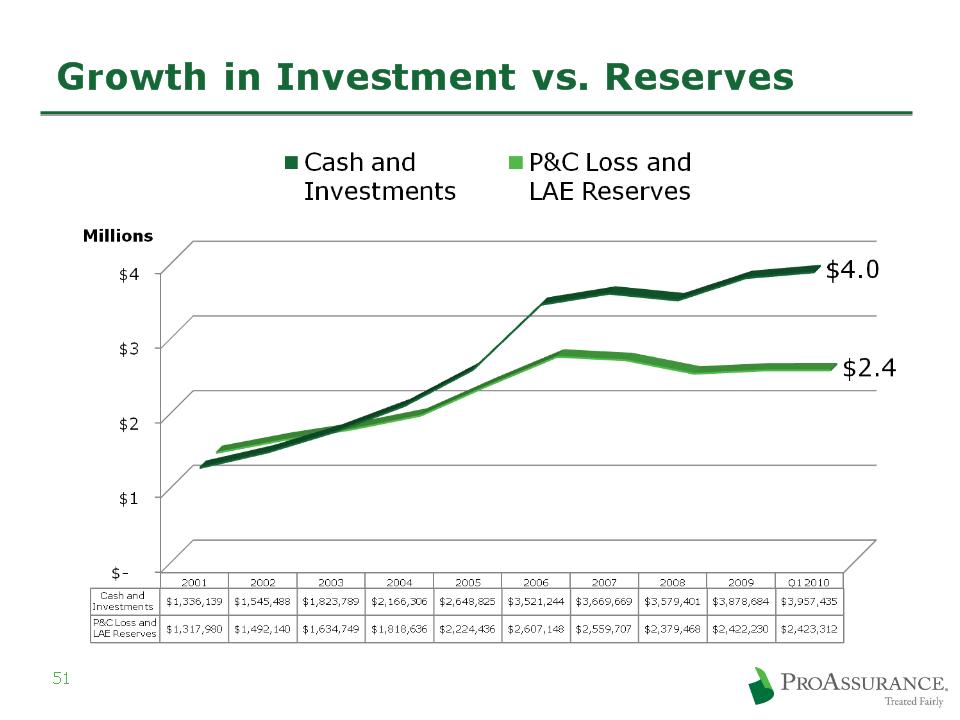
$3.9 Billion
Portfolio
Portfolio
$3.9 Billion
Portfolio
Portfolio
Fixed Income: 90%
Short Term: 4%
Short Term: 4%
Equity and Other Investments: 4%
Equity and Other Investments: 4%
BOLI: 2%
BOLI: 2%
13
3/31/10
Using capital to build through M&A
Preserving capital for future opportunities
Enhancing shareholder value by repurchasing shares
at prices that build Book Value
at prices that build Book Value
Capital Management
15
Source: SNL Financial
Our Strong Capital/Low Leverage Position
16
(in millions)
Prepared for an
improving market
improving market
Prudent capital
management
management
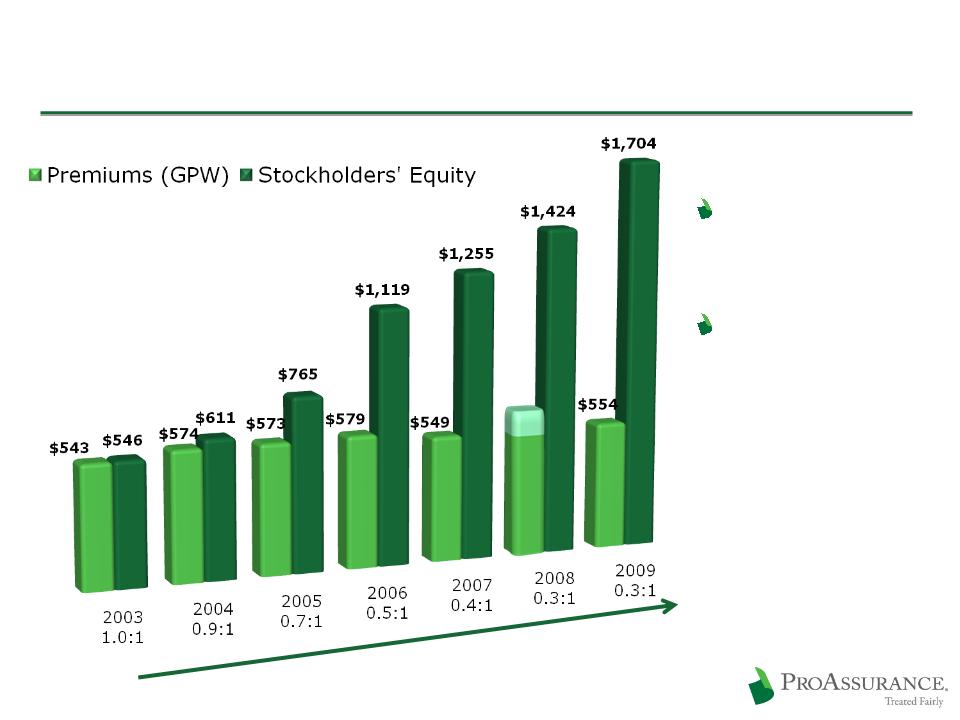
Premiums to Surplus
for Each year
for Each year
$567
$ 96
$471
($96 mil PICA pro forma in 2008)

Maintain Profitability Through the Cycle
Ensure pricing discipline
Rates based on loss data across multiple years
Not unduly influenced by current market
conditions
conditions
Using credits allows us to maintain existing
rate filings
rate filings
17
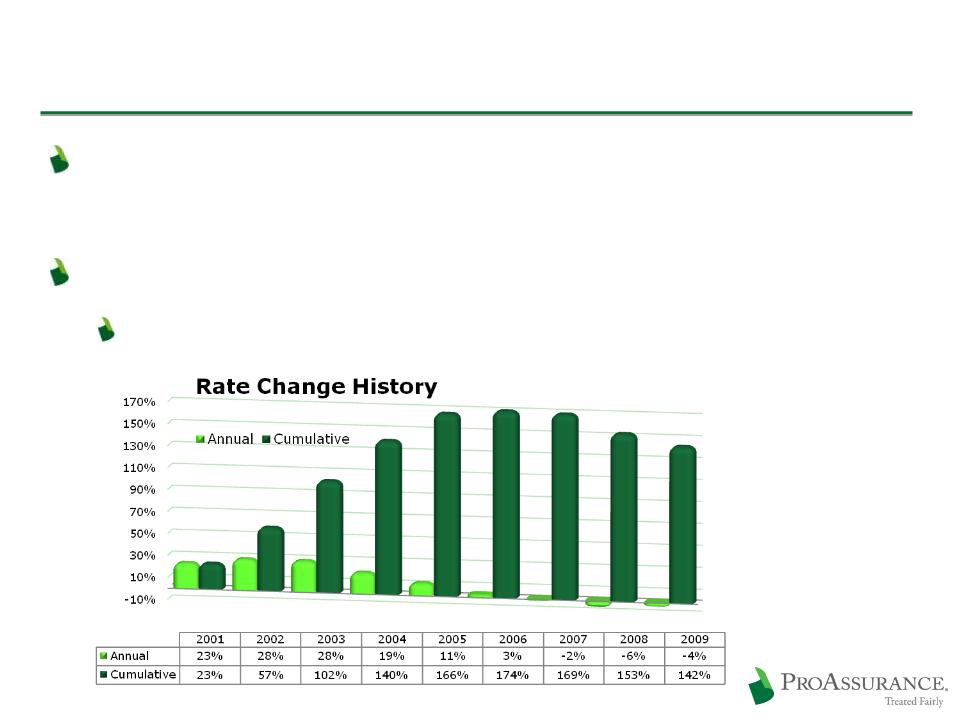
Rate Discussion
Rates on renewing physician business down
less than 12% from peak pricing in 2006
less than 12% from peak pricing in 2006
Recent rate filings are really minor adjustments
Slight increases in Arkansas, Illinois and Indiana
18
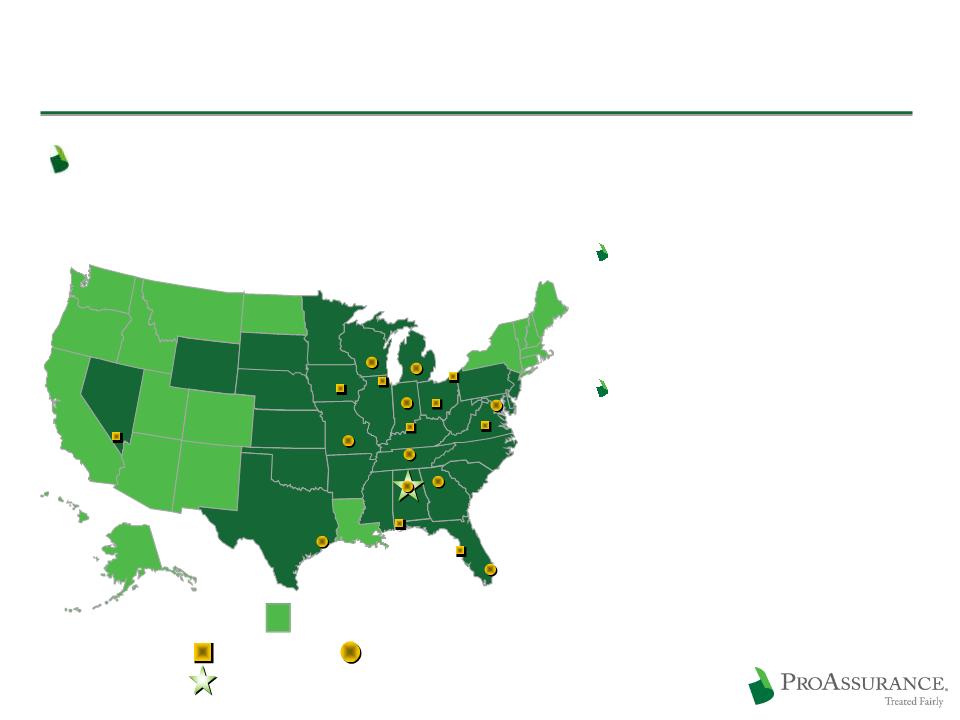
Spread Risk
Broad geographic diversification provides an
unmatched spread of risk
unmatched spread of risk
19
Our spread of risk provides
better market awareness and
more data points to gauge
loss trends
better market awareness and
more data points to gauge
loss trends
Our internal actuarial depth
allows us to assess emerging
trends and respond quickly
allows us to assess emerging
trends and respond quickly
Corporate Headquarters
Corporate Headquarters
Claims Offices
Claims Offices
Claims / Underwriting Offices
Claims / Underwriting Offices
PICA and/or E&S States
PICA and/or E&S States
(Birmingham)

Differentiate In Claims Management
Claims management has always set us apart
We combine financial strength with deep expertise
Give our insureds the option of an uncompromising
defense of their claim
defense of their claim
Allows us to defend our insureds at trial more often
than any other company in our line
than any other company in our line
Provides long-term financial and marketing
advantages
advantages
A key differentiating factor in the market
as claims data becomes public
as claims data becomes public
20
Claims Trends Remain Favorable
Frequency trends are
stable after declining
since 2006
stable after declining
since 2006
The result is fewer
cases to try
cases to try
Severity trends also
stable
stable
Trends are much the
same in states with or
without Tort Reform
same in states with or
without Tort Reform
21
ProAssurance Claims Tried
to a Verdict
to a Verdict

The Ohio Example
Exhaustive, reliable data provided by the Ohio
Department of Insurance
Department of Insurance
Broad range of competitors and business
approaches
approaches
Pricing
Underwriting
Claims handling
22
www.insurance.ohio.gov/Legal/Reports/Documents/MedMal_Closed_Claim_2008.pdf

ProAssurance closes more claims
with NO indemnity payments
with NO indemnity payments
Ohio Closed Claims 2005-2008
Source: Ohio Department of Insurance: www.insurance.ohio.gov/Legal/Reports/Documents/MedMal_Closed_Claim_2008.pdf

ProAssurance closes more claims at trial—offering our
insureds the chance for vindication
insureds the chance for vindication
Ohio Closed Claims 2005-2008
Excludes Trials that Ended with a Directed Verdict
Source: Ohio Department of Insurance: www.insurance.ohio.gov/Legal/Reports/Documents/MedMal_Closed_Claim_2008.pdf
Ohio Closed Claims 2005-2008
Source: Ohio Department of Insurance: www.insurance.ohio.gov/Legal/Reports/Documents/MedMal_Closed_Claim_2008.pdf

Prepare for State Changes
We are prepared, operationally and financially,
if Tort Reforms are struck down in our states
if Tort Reforms are struck down in our states
We never give advance credit for untested
reforms unless required by law or regulation
reforms unless required by law or regulation
Prices are set and reserves established as if there
is no tort reform, until results reflect otherwise
is no tort reform, until results reflect otherwise
26

Maximizing Our Potential
2009: Consolidation of:
Mid-Continent General Agency
Mid-Continent General Agency
2009: Consolidation of:
Mid-Continent General Agency
Mid-Continent General Agency
Georgia Lawyers Insurance Co.
Georgia Lawyers Insurance Co.
2004: Purchased Selected Renewal Rights from:
OHIC Insurance Company
OHIC Insurance Company
2004: Purchased Selected Renewal Rights from:
OHIC Insurance Company
OHIC Insurance Company
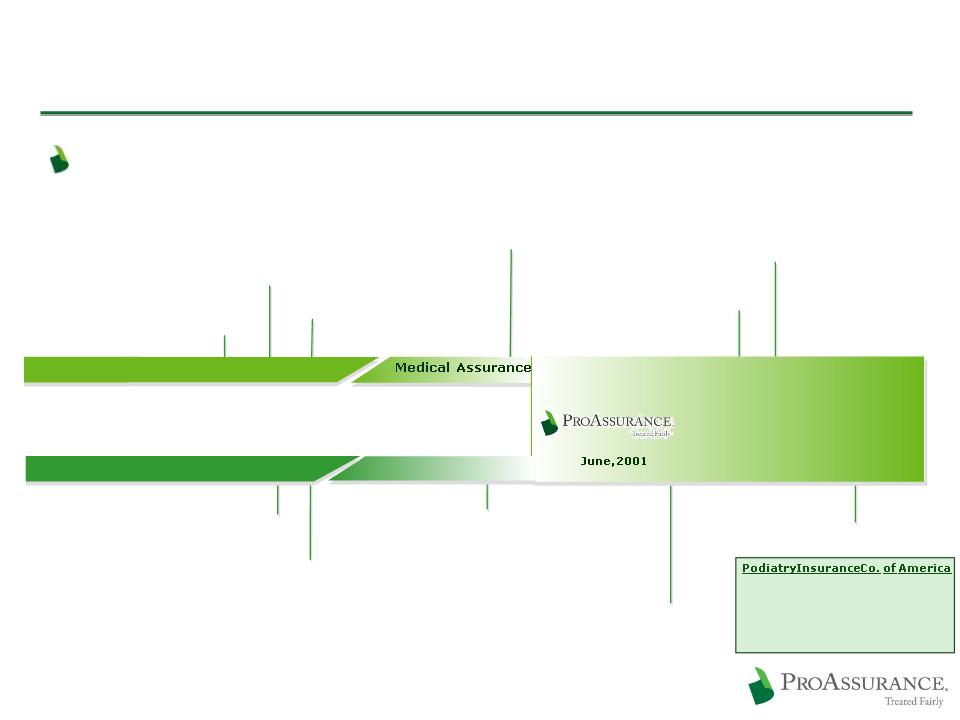
Success Through M&A
We’ve built a leading platform through M&A
28
1994: Consolidation of:
West Virginia Hosp. Ins Co.
West Virginia Hosp. Ins Co.
1994: Consolidation of:
West Virginia Hosp. Ins Co.
West Virginia Hosp. Ins Co.
1995: Consolidation of;
1995: Consolidation of;
Physicians Ins Co of Indiana
Physicians Ins Co of Indiana
Assumed business of:
Physicians Ins Co of Ohio
Physicians Ins Co of Ohio
Assumed business of:
Physicians Ins Co of Ohio
Physicians Ins Co of Ohio
1996: Consolidation of:
1996: Consolidation of:
Missouri Medical Ins Co
Missouri Medical Ins Co
1995: Assumed business of:
Associated Physicians Ins Co. (IL)
Associated Physicians Ins Co. (IL)
1995: Assumed business of:
Associated Physicians Ins Co. (IL)
Associated Physicians Ins Co. (IL)
1998: Consolidation of:
Physicians Protective Trust Fund (FL)
Physicians Protective Trust Fund (FL)
1998: Consolidation of:
Physicians Protective Trust Fund (FL)
Physicians Protective Trust Fund (FL)
1996: Assumed business of:
American Medical Ins Exchange (IN)
American Medical Ins Exchange (IN)
1996: Assumed business of:
American Medical Ins Exchange (IN)
American Medical Ins Exchange (IN)
Founding in the 1970’s
Founding in the 1970’s
1999: Assumed business of:
Medical Defense Associates (MO)
Medical Defense Associates (MO)
1999: Assumed business of:
Medical Defense Associates (MO)
Medical Defense Associates (MO)
Mutual Assurance
Physicians Ins. Co. of Michigan
Professionals Group
Creation of:
Creation of:
2005: Consolidation of:
NCRIC Group
NCRIC Group
2005: Consolidation of:
NCRIC Group
NCRIC Group
2006: Consolidation of:
PIC Wisconsin Group
PIC Wisconsin Group
2006: Consolidation of:
PIC Wisconsin Group
PIC Wisconsin Group
2007: PRI renewal rights deal
2002: SERTA renewal rights deal
2001: OUM renewal rights deal
2000: DPM Merger
1999: PACO Acquisition

2009 M & A Transactions
29
2008 Premium: $98 million
Significant growth in our core business
Nationwide geographical expansion
2008 Healthcare Premium: $20 million
Extends our core business
Broadens our medically-related range
Geographical expansion
Broadens our medically-related range
Geographical expansion
2008 Premium: $5.7 million
Adds to our lawyers’ book
Geographical expansion
Affirms our interest in this line

Responding to Changes in HealthCare
Projected sector growth through 20181
Physician’s Assistants 39%
Medical Assistants 36%
Licensed Nurses 34%
Chiropractors 31%
Physicians and Surgeons 22%
Podiatrists 9%
1Bureau of Labor Statistics 2008 to 2018 Projections
30

Keep an Eye on Washington
Effects of Healthcare Reform
No immediate effect—no Tort Reform in the bill
More patients will ultimately require more
physicians and ancillary providers
physicians and ancillary providers
Known: More customers for us
Unknown: Effect on the medical/legal environment
More frustration in the system?
More unexpected outcomes?
Demonstration projects do not provide meaningful
reform or immediate data
reform or immediate data
Signals a desire to leave the tort system in
the hands of each state
the hands of each state
31

Summary

ProAssurance
Producing sustainable shareholder value
Growing Book Value per Share
Finding the right M & A opportunities
Significant share ownership at all levels
Focusing on long-term
Preparing for a changing market
Leveraging financial strength
Protecting the balance sheet
Maintain our leading market position
Building strength for the next cycle turn
33

June 16, 2010
Frank B. O’Neil Investor Relations Officer |

Additional Slides for Meetings

General Information
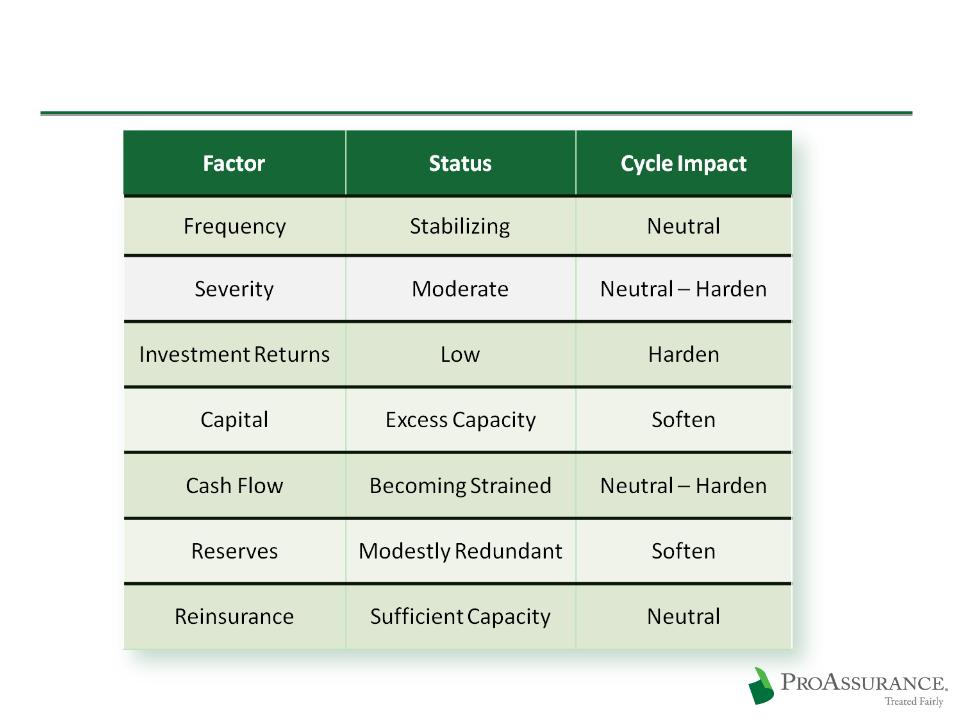
The State of the Market
37

The State of the Market
Prices have been falling yet profitability
remains high
remains high
Continued low interest rates must enforce
discipline sooner or later
discipline sooner or later
Frequency is no longer declining
Only a matter of time before frequency moves
higher
higher
But when?
Severity is trending upward at expected,
manageable rates (4%-5%) in most states
manageable rates (4%-5%) in most states
38

Reserve adequacy
39
Net favorable development continues
We remain confident in current reserve levels
Our levels compare favorably to external
actuarial reviews from Tillinghast and E&Y
actuarial reviews from Tillinghast and E&Y

Excess Capital vs. Excess Capacity
40
Conceptual Model of Projected
A. M. Best BCAR Scores if
A. M. Best BCAR Scores if
Premiums Increase
Surplus is Reduced
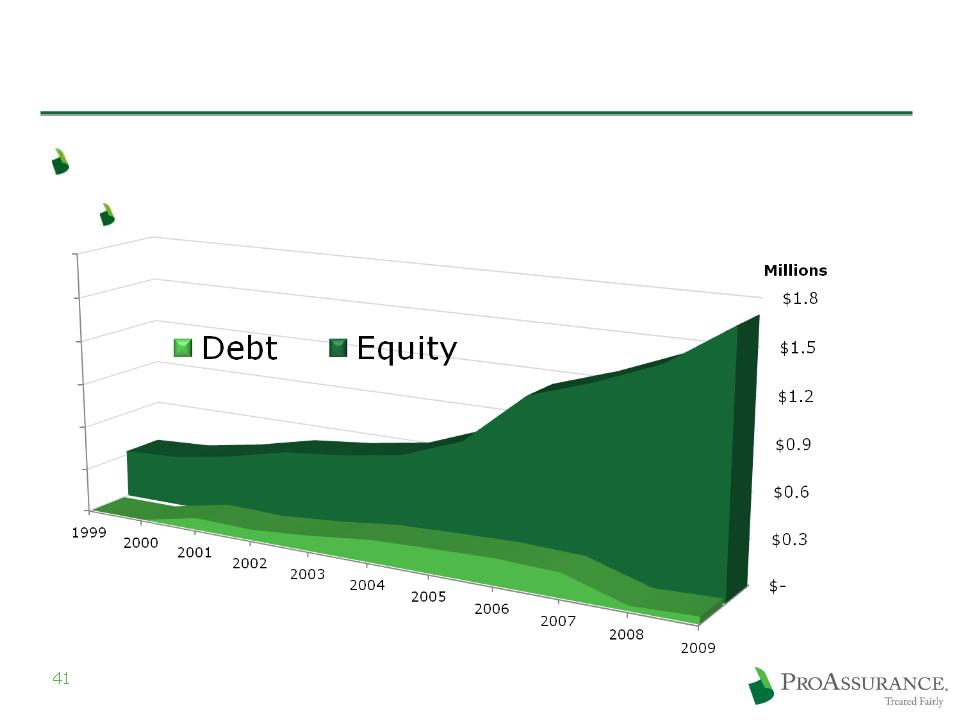
Conservative Use of Debt
Low Debt to Cap Ratio
No strain on cash flow

Investments
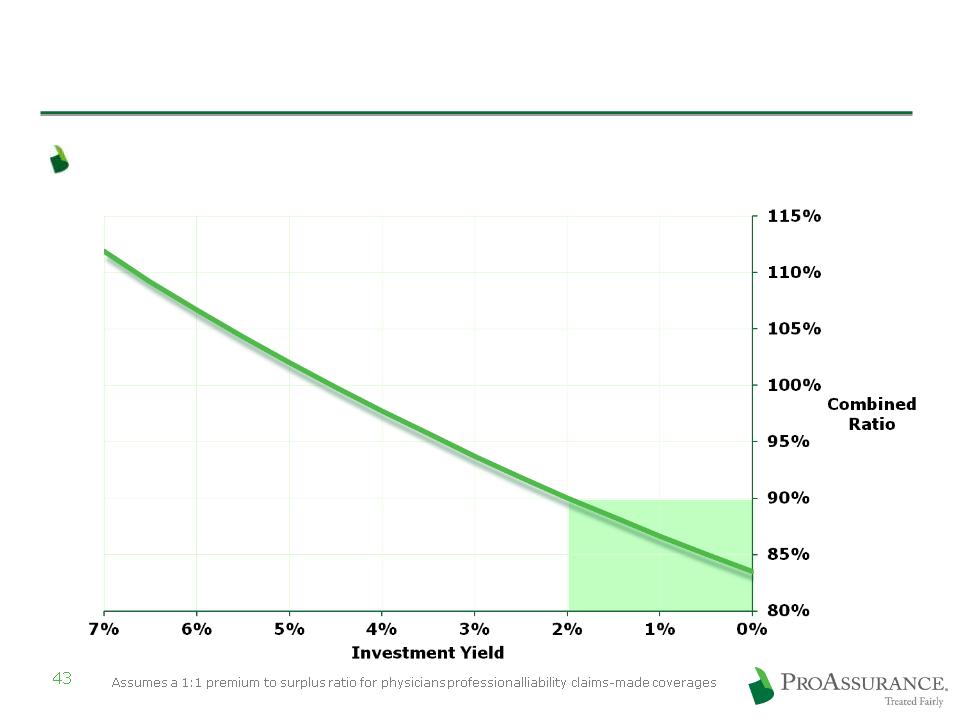
Investment Income Provides No Cushion
Pricing discipline is even more critical
Combined Ratio
required to generate
a 13% after-tax ROE
required to generate
a 13% after-tax ROE
The Importance of Investment Income
44
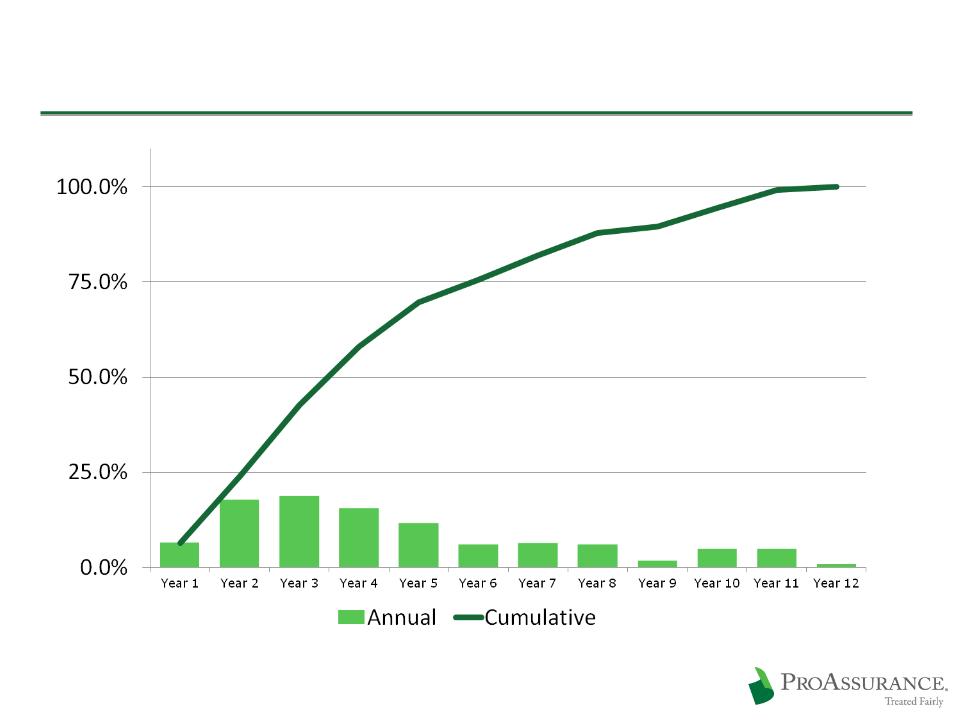
Typical Claims Payout Pattern

The Importance of Investment Income
45
Year
1
1
Year
2
2
Year
3
3
Year
4
4
Year
5
5
Year
6
6
Year
7
7
Year
8
8
Incident
Occurs
Occurs
Discovery
and
Preparation
and
Preparation
Claim
Reported
Reported
Trial
and
Appeals
Appeals
Resolution
5-6 Years
After
Claim
Reported
After
Claim
Reported
Life Cycle of a Typical Claim

No Change to Investment Strategy
Our focus is on protecting the balance sheet and
growing book value
growing book value
We are not extending duration for yield
Main pressures in investments are declining yield and
lower cash balances
lower cash balances
Cash put to work in 2009 as we gained confidence
2009 net realized investment gains: $12.8 million
2008 net realized investment losses: $51 million
Includes $47 million in OTTI
Q1 2010 net realized investment losses: < $1 million
46
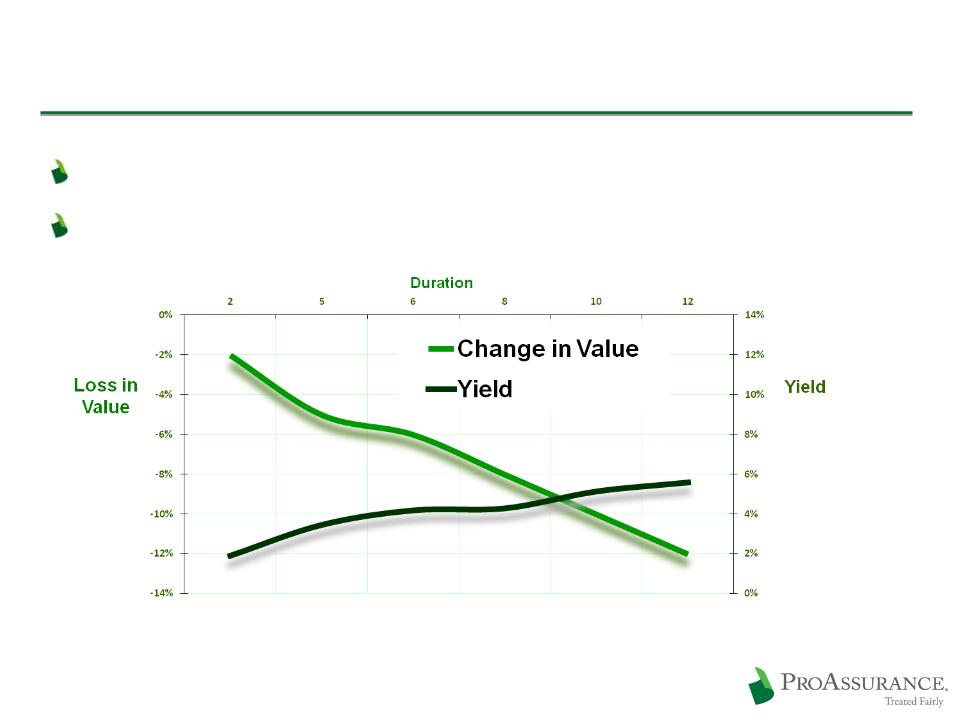
Strategy: Investment Discipline
The choice: Chase yield or extend duration
We are maintaining duration, looking for opportunities
47
Loss in value assuming a 100 basis point shift in the yield curve
Yields based on Single A composite corporate debt
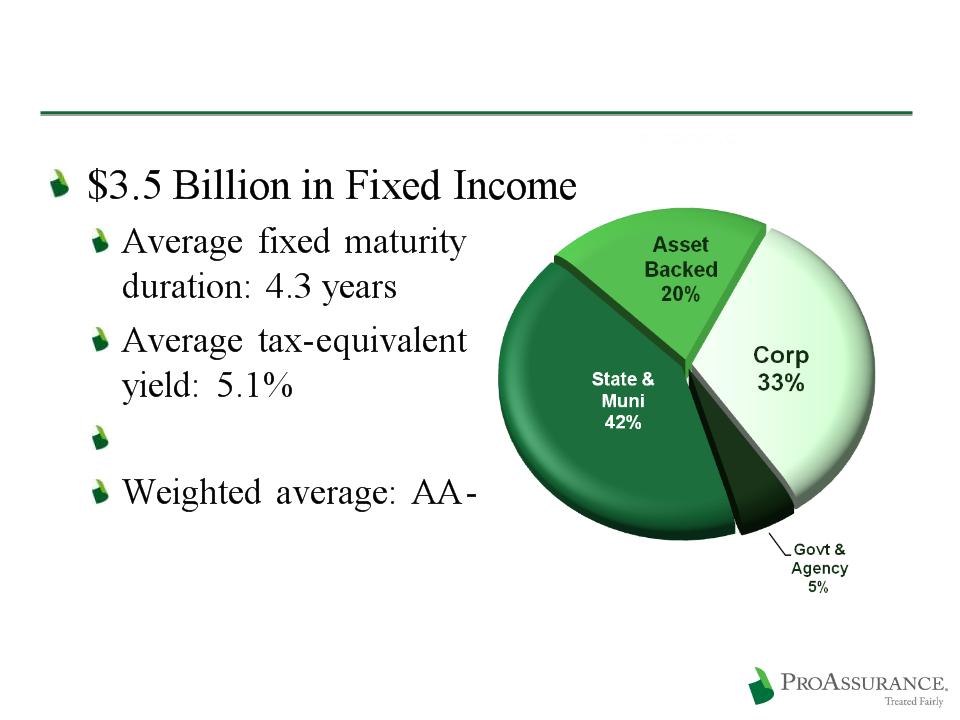
Fixed Income Breakdown
97% investment grade
48
3/31/10

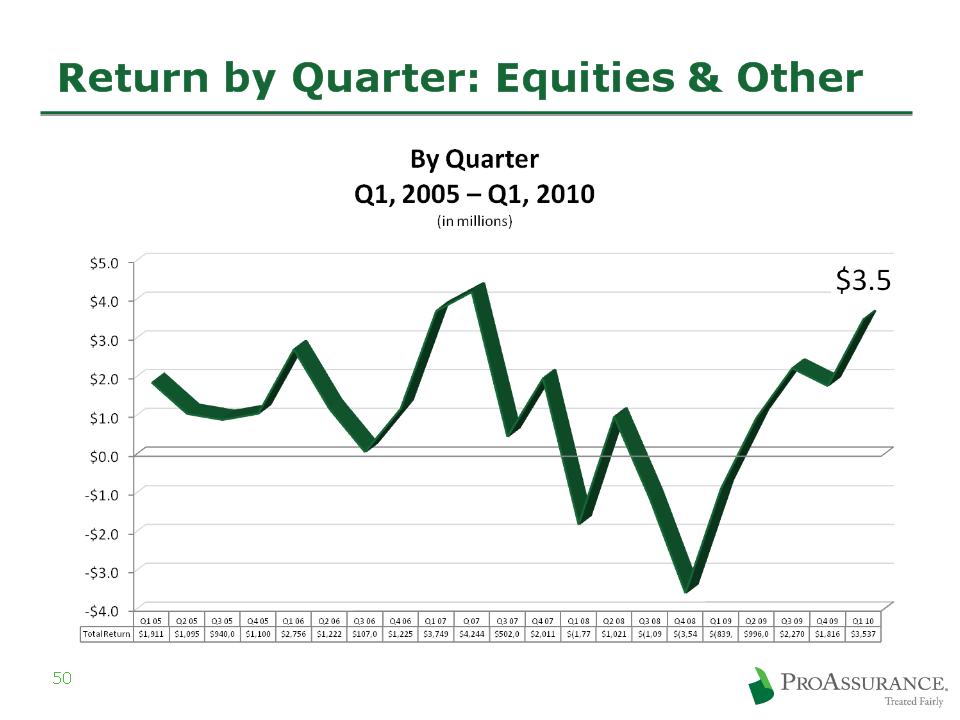
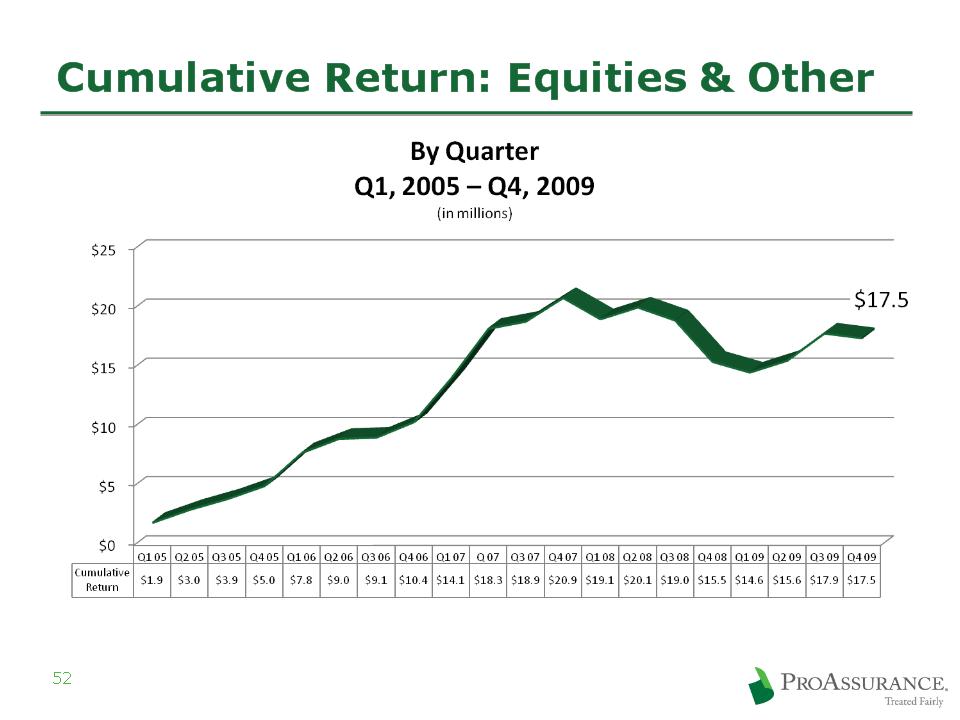
Equities & Other: $160 Million
49
3/31/10

Municipals: $1.5 Billion
53
3/31/10
Investment policy has always required
investment grade rating prior to applying the
effect of insurance
investment grade rating prior to applying the
effect of insurance
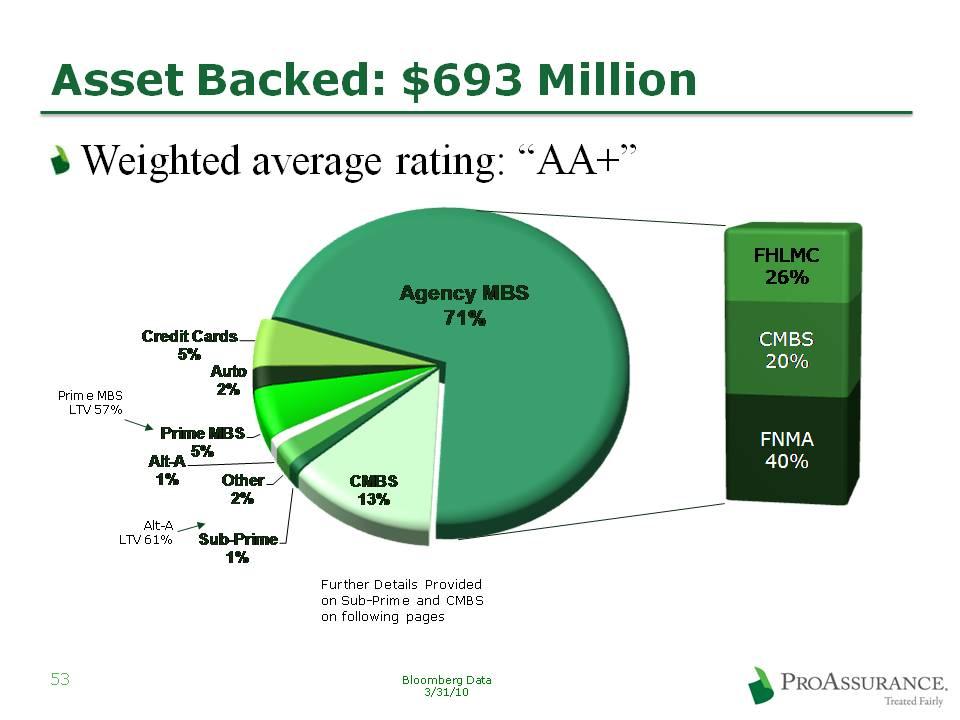

Sub-Prime Detail
55
$8.1 million market value in AFS portfolio
$2.5 million unrealized loss
$15.8 million market value in
high-yield LP rated “A”
high-yield LP rated “A”
LP’s focus is distressed ABS
At 3/31/10 | Vintage |
$5.1 Mln | 2004 & Prior |
$3.0 Mln | 2005 |
Quality & Vintage information only on direct holdings at 3/31/10

CMBS Detail
Vintages
2005 & Prior- $65 million
2006- $23 million
Top Property Types
Office: 58% of CMBS portfolio
Retail Anchored: 29% of CMBS portfolio
Mixed Use: 8% of CMBS portfolio
Other: 5% of CMBS Portfolio
56

CMBS Detail
$88 million Fair Value in non-agency CMBS
Book Value: $86 million (2% of fixed income portfolio)
57
At 3/31/2010 | Quality |
$ 83.0 Mln | AAA |
$ 3.0 Mln | AA |
$ 0.7 Mln | A |
$ 0.9 Mln | BB+ |
At 3/31/2010 | Wtd Avg LTV |
14% | <65% |
46% | =65-70% |
21% | <70-75% |
19% | =75-85% |
At 3/31/2010 | Credit Support |
35% | >30% |
47% | 20% - 30% |
12% | 10% - 20% |
6% | Less than 10% |
At 3/31/2010 | Deal Cumulative Delinquencies |
18% | 0.0% - 1.0% |
22% | 1.0% - 3.0% |
10% | 3.0% - 5.0% |
23% | 5.0% - 10.0% |
27% | >10.0% |
At 3/31/2010 | Debt Service Coverage |
80% | =>1.5x |
14% | 1.4x-1.5x |
6% | 1.3x-1.4x |
3/31/10
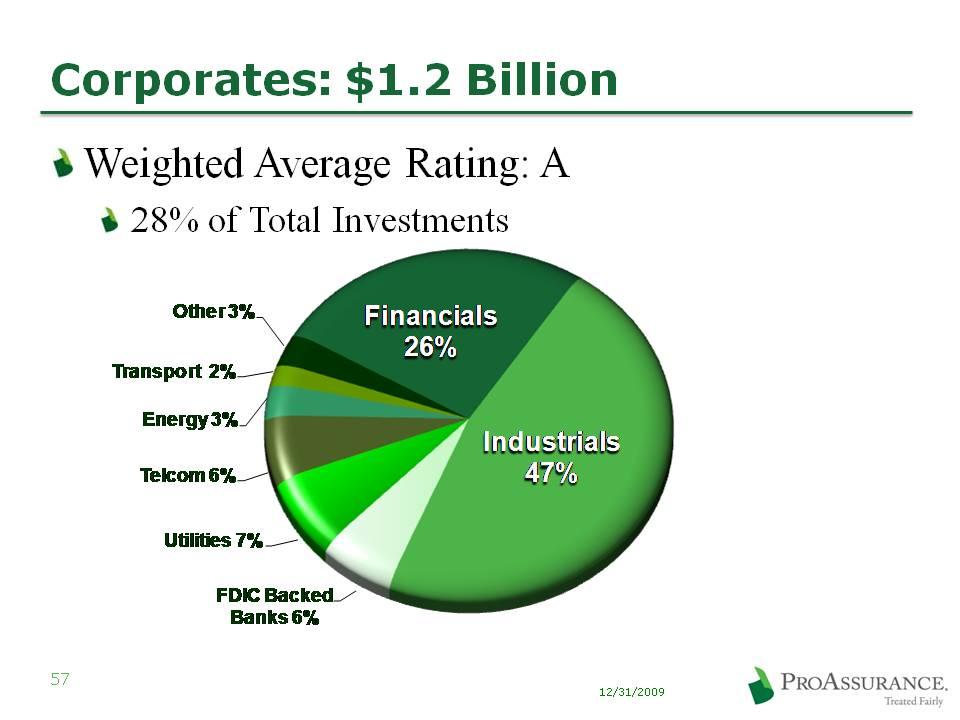

Corporate: Detail on Financials
Top 20 Largest Banks/Financials: $ 269 million
$57 mm FDIC backing
BA $40 ($22) | Eurohypo $8 |
BP Cap $26 | Boeing Cap $7 |
JPM $23 ($14) | US Bank $7 |
GECC $22 ($4) | Credit Suisse $7 |
MS $20 ($6) | PNC $6 ($2) |
Wells $20 | Natl Rural $6 |
GS $18 ($2) | Deutsche Bank $5 |
Amex $16 | Depfa ACS -Covered $5 |
Citi $13 ($5) | FMCC $5 |
BNY $10 | John Deere Cap $5 ($2) |
FDIC backed amounts listed in parentheses | |
59
12/31/2009
Treasury/GSE: $206Million
60
3/31/2010
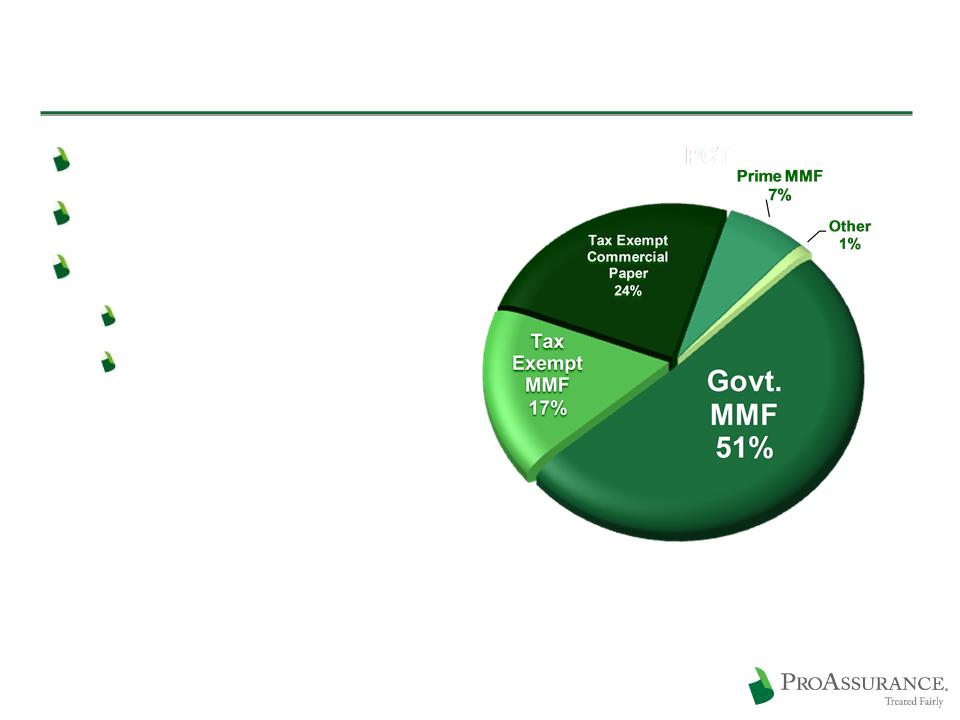
Portfolio Overview: Short Term
$152 Million
Rated A1/P1 or better
Money Markets:
Moody’s: Aaa
S&P: AAA
61
3/31/2010
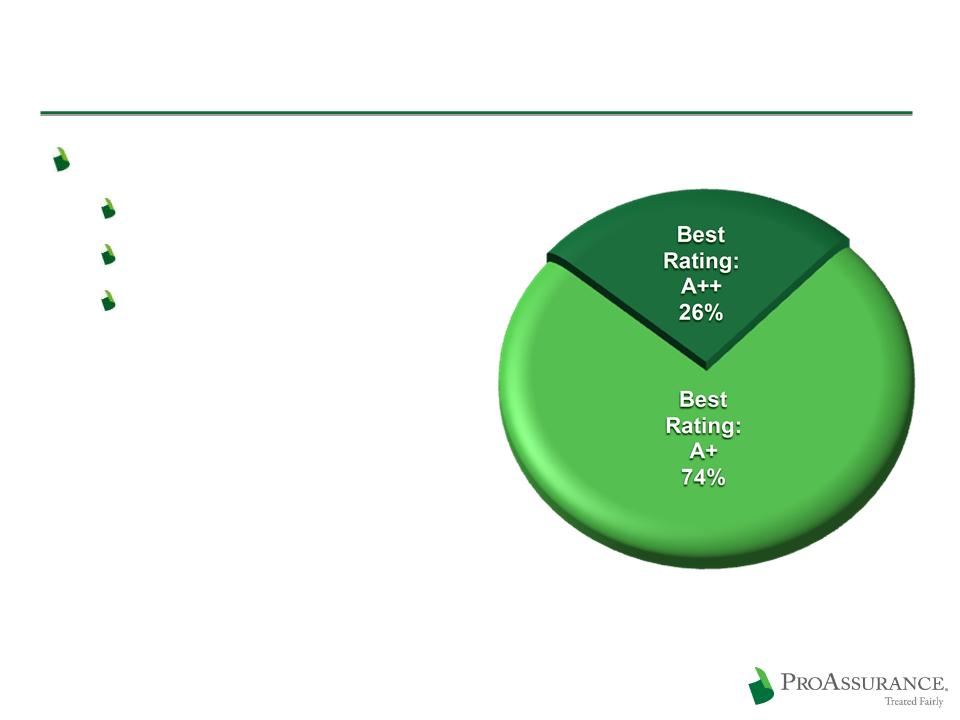
BOLI: $65 Million
Weighted average rating
Moody’s: AA3
S&P: AA-
A. M. Best: A+
62
3/31/2010

Moody’s 2008 Rankings

Outstanding Performance vs Industry
Moody’s rankings of the top 100 P&C
insurance companies by premium volume
insurance companies by premium volume
64
1 by Direct Written Premium Source: 2008 Data from Moody’s Statistical Handbook October
2009
2009
Category | Ranking |
Direct Written Premiums | 95 |
Operating Ratio | 1 |
Combined Ratio | 2 |
Loss Ratio | 5 |
ROE | 5 |
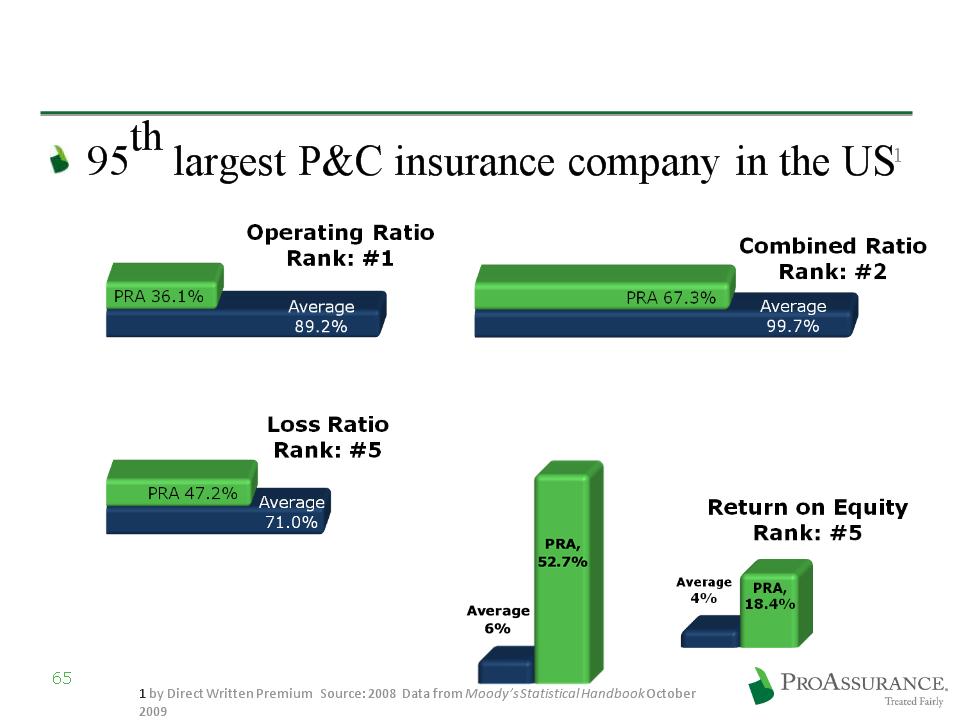
Moody’s Top 100 Ranking Data
Return on Premium
Rank: #1

Sales & Marketing Highlights

Distribution Sources
We remain primarily agent-driven
Direct in Alabama, Florida and in all states for
Podiatric business
Podiatric business
Dual distribution working in DC and parts of
Missouri
Missouri
67

New Business Acquisition Trends
Profitable new business can be found
New business added in a number of states
Retention is at historical highs
The market is equal parts pricing sanity and
insanity
insanity
68

Retention trends
Retention was 88% in Q1 2010
Retention was 88% overall in 2009
Despite competitors' pricing we are retaining
business
business
69

Competition
We have see no new large scale competitors
Greatest competition is physicians moving into
hospital captives and large clinic alternative risk
transfer programs
hospital captives and large clinic alternative risk
transfer programs
We will address these issues through new products
and new approaches to our business partners
and new approaches to our business partners
Some consolidation among start-ups
Pricing largely a non-factor due to the soft market
70

Terms and Conditions
One-off concessions by many carriers
Tail coverage
Prior acts
Slot rating
71

Lawyers Professional Liability
Historical book performing as expected
MGA’s producing new business as expected in
market previously unserved
market previously unserved
Primarily western US (Greyhawk) and
mid-Atlantic (ProLawyer)
mid-Atlantic (ProLawyer)
72

Reinsurance

Reinsurance Overview
74
No real change in pricing
Somewhat surprising to us
Interest remains high in our program
Aspen, Hannover and Transatlantic lead our
program
program
Solid mix of London, US and Bermudan
companies
companies

Additional Claims Highlights

Loss Trends
Frequency remains at historically low levels
No longer declining
Some signs of frequency returning
Severity is manageable
Fewer cases for us to try
We are trying the same percentage of our
claims inventory
claims inventory
76
77
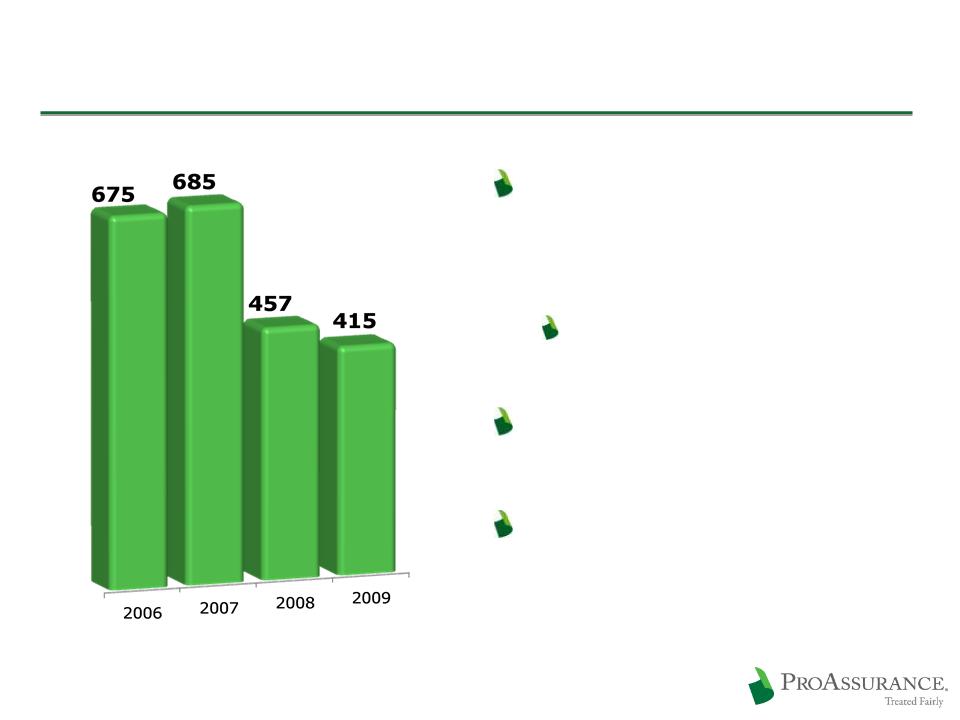
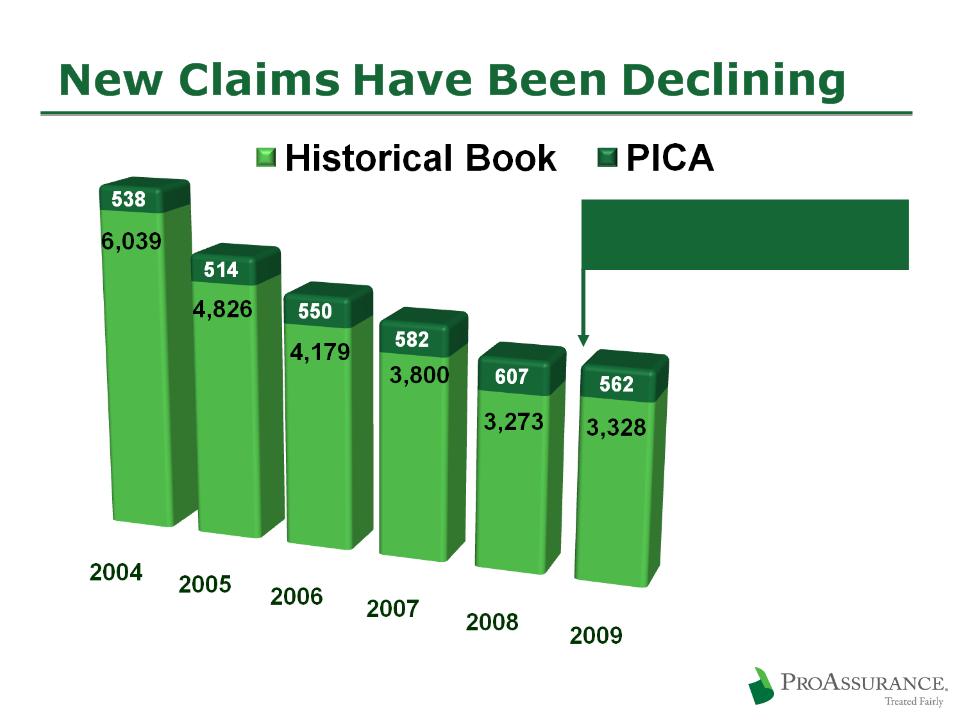
New Claims Opened Each Year
New Claims Opened Each Year
6,577
5,340
4,729
4,382
3,880
Claims are level from
2008 to 2009
2008 to 2009
3,890

No Emerging Claim Hotspots
No unexpected claims trends are emerging by
specialty
specialty
Greater public access to claims outcome data
should fuel renewed attention to claims defense
should fuel renewed attention to claims defense
78

Risk Management Highlights

We Are a Doctor-Focused Company
We value physician input and seek partnerships
with organized medicine
with organized medicine
Endorsed in Alabama, D.C., Indiana and Wisconsin
Physician involvement at all levels of the
organization
organization
Led by Hayes Whiteside, M.D., SVP and Chief
Medical Officer
Medical Officer
We actively participate in national and state tort
reform efforts
reform efforts
80

Risk Management Scope
Approximately 80% of insureds are “touched”
by risk management programs each year
by risk management programs each year
Risk management publications provide
specialty-specific advice
specialty-specific advice
State-specific publications target current event
issues
issues
Risk Resource center provides immediate
access to risk management advice in dynamic
situations
access to risk management advice in dynamic
situations
81