UNITED STATES
SECURITIES AND EXCHANGE COMMISSION
Washington, D.C. 20549
FORM 10-K
(Mark One)
| | | | | |
| ☒ | ANNUAL REPORT PURSUANT TO SECTION 13 OR 15(d) OF THE SECURITIES EXCHANGE ACT OF 1934 |
For the fiscal year ended December 31, 2024,
or
| | | | | |
| ☐ | TRANSITION REPORT PURSUANT TO SECTION 13 OR 15(d) OF THE SECURITIES EXCHANGE ACT OF 1934 |
For the transition period from to .
Commission file number: 001-16533
ProAssurance Corporation
(Exact name of registrant as specified in its charter)
| | | | | | | | | | | | | | | | | | | | | | | | | | | | | |
| Delaware | | | 63-1261433 |
(State or other jurisdiction of
incorporation or organization) | | | (I.R.S. Employer Identification No.) |
| | | | | | | | | |
| 100 Brookwood Place, | Birmingham, | AL | | | | | | 35209 |
| (Address of principal executive offices) | | | (Zip Code) |
| | | | | | | | | |
| (205) | 877-4400 | | | |
(Registrant’s telephone number,
including area code) | | | |
Securities registered pursuant to Section 12(b) of the Act:
| | | | | | | | |
| Title of each class | Trading Symbol(s) | Name of each exchange on which registered |
| Common Stock, par value $0.01 per share | PRA | New York Stock Exchange |
Securities registered pursuant to Section 12(g) of the Act: None.
Indicate by check mark if the registrant is a well-known seasoned issuer, as defined in Rule 405 of the Securities Act. Yes ☒ No ☐
Indicate by check mark if the registrant is not required to file reports pursuant to Section 13 or Section 15(d) of the Act. Yes ☐ No ☒
Indicate by check mark whether the registrant (1) has filed all reports required to be filed by Section 13 or 15(d) of the Securities Exchange Act of 1934 during the preceding 12 months (or for such shorter period that the registrant was required to file such reports), and (2) has been subject to such filing requirements for the past 90 days. Yes ☒ No ☐
Indicate by check mark whether the registrant has submitted electronically every Interactive Data File required to be submitted pursuant to Rule 405 of Regulation S-T (§232.405 of this chapter) during the preceding 12 months (or for such shorter period that the registrant was required to submit such files). Yes ☒ No ☐
Indicate by check mark whether the registrant is a large accelerated filer, an accelerated filer, a non-accelerated filer, a smaller reporting company, or an emerging growth company. See the definitions of “large accelerated filer,” “accelerated filer,” “smaller reporting company,” and "emerging growth company" in Rule 12b-2 of the Exchange Act. | | | | | | | | | | | | | | | | | | | | |
| Large accelerated filer | | ☒ | | Accelerated filer | | ☐ |
| Non-accelerated filer | | ☐ | | Smaller reporting company | | ☐ |
| | | | Emerging growth company | | ☐ |
If an emerging growth company, indicate by check mark if the registrant has elected not to use the extended transition period for complying with any new or revised financial accounting standards provided pursuant to Section13(a) of the Exchange Act. ☐
Indicate by check mark whether the registrant has filed a report on and attestation to its management’s assessment of the effectiveness of its internal control over financial reporting under Section 404(b) of the Sarbanes-Oxley Act (15 U.S.C. 7262(b)) by the registered public accounting firm that prepared or issued its audit report. ☒
If securities are registered pursuant to Section 12(b) of the Act, indicate by check mark whether the financial statements of the registrant included in the filing reflect the correction of an error to previously issued financial statements. ☐
Indicate by check mark whether any of those error corrections are restatements that required a recovery analysis of incentive-based compensation received by any of the registrant’s executive officers during the relevant recovery period pursuant to §240.10D-1(b). ☐
Indicate by check mark whether the registrant is a shell company (as defined in Rule 12b-2 of the Act). Yes ☐ No ☒
The aggregate market value of voting stock held by non-affiliates of the registrant at June 30, 2024 was $617,056,208. As of February 20, 2025, the registrant had outstanding approximately 51,156,821 shares of its common stock.
Documents incorporated by reference in this Form 10-K
(i)The definitive proxy statement for the 2025 Annual Meeting of the Stockholders of ProAssurance Corporation (File No. 001-16533) is incorporated by reference into Part III of this report.
Glossary of Terms and Acronyms
When the following terms and acronyms appear in the text of this report, they have the meanings indicated below. | | | | | |
| Term | Meaning |
| AAD | Annual aggregate deductible |
| |
| ALAE | Allocated loss adjustment expense |
| AOCI | Accumulated other comprehensive income (loss) |
| ASU | Accounting Standards Update |
| |
| Board | Board of Directors of ProAssurance Corporation |
| BOLI | Business owned life insurance |
| CARES Act | Coronavirus Aid, Relief and Economic Security Act |
| CCPA | California Consumer Privacy Act of 2018, as amended |
| CIMA | Cayman Islands Monetary Authority |
| CODM | Chief Operating Decision Maker |
| COSO | Committee of Sponsoring Organizations of the Treadway Commission |
| |
| COVID-19 | Coronavirus Disease 2019 |
| CPRA | California Privacy Rights Act of 2020, as amended |
| DDR | Death, disability and retirement |
| Dodd-Frank Act | The Dodd-Frank Wall Street Reform and Consumer Protection Act |
| DPAC | Deferred policy acquisition costs |
| Eastern Re | Eastern Re, LTD, S.P.C. |
| EBUB | Earned but unbilled premium |
| |
| |
| ERC | Employee Retention Credit |
| ERM | Enterprise Risk Management |
| |
| |
| FAL | Funds at Lloyd's |
| FASB | Financial Accounting Standards Board |
| FHLB | Federal Home Loan Bank |
| FHLMC | Federal Home Loan Mortgage Corporation |
| FIO | Federal Insurance Office |
| FNMA | Federal National Mortgage Association |
| GAAP | Generally accepted accounting principles in the United States of America |
| |
| |
| GNMA | Government National Mortgage Association |
| IBNR | Incurred but not reported |
| Inova Re | Inova Re, LTD, S.P.C. |
| Interest Rate Swaps | ProAssurance's two forward-starting interest rate swap agreements associated with its Revolving Credit Agreement and Term Loan |
| IRS | Internal Revenue Service |
| LAE | Loss adjustment expense |
| |
| LLC | Limited liability company |
| Lloyd's | Lloyd's of London market |
| |
| LP | Limited partnership |
| |
| Medical Technology Liability | Medical technology and life sciences products liability |
| MICRA | Medical Injury Compensation Reform Act |
| Model Holding Co. Law | Model Insurance and Holding Company System Regulatory Act and Regulation |
| |
| MPL | Medical professional liability |
| NAIC | National Association of Insurance Commissioners |
| NAV | Net asset value |
| | | | | |
| Term | Meaning |
| NFIP | National Flood Insurance Program |
| NOL | Net operating loss |
| |
| NORCAL | NORCAL Insurance Company, formerly known as NORCAL Mutual Insurance Company |
| NRSRO | Nationally recognized statistical rating organization |
| NYDFS | New York Department of Financial Services |
| NYSE | New York Stock Exchange |
| OCI | Other comprehensive income (loss) |
| ORSA | Risk Management and Own Risk and Solvency Assessment Model Act |
| PBO | Projected benefit obligations |
| PCAOB | Public Company Accounting Oversight Board |
| PDR | Premium deficiency reserve |
| PPM RRG | Preferred Physicians Medical Risk Retention Group, a Mutual Insurance Company |
| PICA | ProAssurance Insurance Company of America |
| |
| ProAssurance Plan | Executive non-qualified excess plan |
| ProAssurance Savings Plan | ProAssurance Group savings and retirement plan |
| Revolving Credit Agreement | ProAssurance's $250 million revolving credit agreement |
| ROE | Return on equity |
| ROU | Right-of-use |
| |
| SAP | Statutory accounting principles |
| SEC | Securities and Exchange Commission |
| SOC | Security Oversight Committee |
| SOFR | Secured Overnight Financing Rate |
| |
| SPC | Segregated portfolio cell |
| Specialty P&C | Specialty Property and Casualty |
| Syndicate 1729 | Lloyd's of London Syndicate 1729 |
| Syndicate 6131 | Lloyd's of London Syndicate 6131 was a Special Purpose Arrangement with Lloyd's of London Syndicate 1729. |
| |
| TCJA | Tax Cuts and Jobs Act H.R.1 of 2017 |
| Term Loan | ProAssurance's $125 million delayed draw term loan |
| TRIA | Federal Terrorism Risk Insurance Act |
| U.K. | United Kingdom of Great Britain and Northern Ireland |
| ULAE | Unallocated loss adjustment expenses |
| VIE | Variable interest entity |
| VOBA | Value of business acquired |
General Information
Throughout this report, references to "ProAssurance," "ProAssurance Group," "PRA," "Company," "organization," "we," "us" and "our" refer to ProAssurance Corporation and its consolidated subsidiaries. Because ProAssurance is an insurance holding company and certain terms and phrases common to the insurance industry are used in this report that carry special and specific meanings, we encourage you to read the Glossary of Selected Insurance and Related Financial Terms posted on our website on the Investor Relations page (investor.proassurance.com) under Other Information. In addition, throughout this discussion we use certain terms and abbreviations, which can be found in the Glossary of Terms and Acronyms provided at the beginning of this report.
Caution Regarding Forward-Looking Statements
Any statements in this Form 10-K that are not historical facts or explicitly stated as an opinion are specifically identified as forward-looking statements. These statements are based upon our estimates and anticipation of future events and are subject to significant risks, assumptions and uncertainties that could cause actual results to vary materially from the expected results described in the forward-looking statements. Forward-looking statements are identified by words such as, but not limited to, "anticipate," "believe," "estimate," "expect," "hope," "hopeful," "intend," "likely," "may," "optimistic," "possible," "potential," "preliminary," "project," "should," "will" and other analogous expressions. There are numerous factors that could cause our actual results to differ materially from those in the forward-looking statements. Thus, sentences and phrases that we use to convey our view of future events and trends are expressly designated as forward-looking statements as are sections of this Form 10-K that are identified as giving our outlook on future business.
Forward-looking statements relating to our business include among other things: statements concerning future liquidity and capital requirements, investment valuation and performance, return on equity, financial ratios, net income, premiums, losses and loss reserve, premium rates and retention of current business, competition and market conditions, the expansion of product lines, the development or acquisition of business in new geographical areas, the pricing or availability of acceptable reinsurance, actions by regulators and rating agencies, court actions, legislative actions, payment or performance of obligations under indebtedness, payment of dividends and other matters.
These forward-looking statements are subject to significant risks, assumptions and uncertainties, including, among other things, the following factors that could affect the actual outcome of future events:
| | | | | |
| l | changes in general economic conditions, including the impact of inflation, including medical and social inflation, and unemployment; |
| |
| l | regulatory, legislative and judicial actions or decisions that could affect our business plans or operations; |
| l | the enactment or repeal of tort reforms; |
| l | formation or dissolution of state-sponsored insurance entities providing coverages now offered by ProAssurance which could remove or add sizable numbers of insureds from or to the private insurance market; |
| l | changes in the interest, tax and foreign currency exchange rate environment; |
| l | resolution of uncertain tax matters and changes in tax laws; |
| l | changes in laws or government regulations regarding financial markets or market activity that may affect our business; |
| l | changes in the ability, or perception thereof, of the U.S. government to meet its obligations that may affect the U.S. economy and our business; |
| l | performance of financial markets affecting the fair value of our investments or making it difficult to determine the value of our investments; |
| l | changes in requirements or accounting policies and practices that may be adopted by our regulatory agencies, the governments of states in which we are domiciled, the FASB, the SEC, the PCAOB or the NYSE that may affect our business; |
| l | changes in laws or government regulations affecting the financial services industry, the property and casualty insurance industry, the workers' compensation insurance industry or particular insurance lines underwritten by our subsidiaries; |
| l | the effect on our insureds, particularly the insurance needs of our insureds, and our loss costs, of changes in the healthcare delivery system and/or changes in the U.S. political climate that may affect healthcare policy or our business; |
| | | | | |
| l | consolidation of our insureds into or under larger entities which may be insured by competitors, or may not have a risk profile that meets our underwriting criteria or which may not use external providers for insuring or otherwise managing substantial portions of their liability risk; |
| l | the effect of cyclical insurance industry trends on our underwriting, including demand and pricing in the insurance and reinsurance markets in which we operate; |
| l | uncertainties inherent in the estimate of our loss and loss adjustment expense reserve and reinsurance recoverable; |
| l | changes in the availability, cost, quality or collectability of insurance/reinsurance; |
| l | the results of litigation, including pre- or post-trial motions, trials and/or appeals we undertake; |
| l | effects on our claims costs from mass tort litigation that are different from that anticipated by us; |
| l | allegations of bad faith which may arise from our handling of any particular claim, including failure to settle; |
| l | loss or consolidation of independent agents, agencies, brokers or brokerage firms; |
| l | changes in our organization, compensation and benefit plans; |
| l | changes in the business or competitive environment may alter or limit the effectiveness of our business strategy and impact our revenues; |
| l | our ability to retain and recruit senior management and other qualified personnel; |
| l | the availability, integrity and security of our technology infrastructure and that of our third-party providers, including any susceptibility to cyber-attacks which might result in a loss of information, operating capability or actual monetary loss; |
| l | the impact of new systems or systems consolidation on our information technology infrastructure; |
| l | the impact of machine learning and artificial intelligence on the insurance industry as well as on our insureds and risks we insure; |
| l | the impact of a catastrophe, natural or man-made, including a pandemic event, as it relates to our business and insurance operations, investment results as well as on our insureds' operations and the risks for which we insure; |
| |
| l | the impact of a catastrophic man-made event, such as acts of terrorism, acts of war and civil and political unrest; |
| l | the effects of terrorism-related insurance legislation and laws; |
| l | the impact of guaranty funds and other state assessments; |
| |
| |
| l | changes to the ratings assigned by a rating agency to our holding company or insurance subsidiaries, individually or as a group; |
| l | provisions in our charter documents, Delaware law and state insurance laws may impede attempts to replace or remove management or may impede a takeover; |
| l | state insurance restrictions may prohibit assets held by our insurance subsidiaries, including cash and investment securities, from being used for general corporate purposes; and |
| l | taxing authorities can take exception to our tax positions and cause us to incur significant amounts of legal and accounting costs and, if our defense is not successful, additional tax costs, including interest and penalties. |
| |
|
| |
| |
| |
| |
| |
Our results may differ materially from those we expect and discuss in any forward-looking statements. The principal risk factors that may cause these material differences are described in "Item 1A, Risk Factors" in this report and other documents we file with the SEC, such as our quarterly reports on Form 10-Q.
We caution readers not to place undue reliance on any such forward-looking statements, which are based upon conditions existing only as of the date made, and advise readers that these factors could affect our financial performance and could cause actual results for future periods to differ materially from any opinions or statements expressed with respect to future periods in any current statements. Except as required by law or regulations, we do not undertake and specifically decline any obligation to publicly release the result of any revisions that may be made to any forward-looking statements to reflect events or circumstances after the date of such statements or to reflect the occurrence of anticipated or unanticipated events.
PART I
ITEM 1. BUSINESS
Overview
ProAssurance Corporation is a holding company for property and casualty insurance companies. For the year ended December 31, 2024, our net premiums written totaled $1.0 billion, and at December 31, 2024 we had total assets of $5.6 billion and $1.2 billion of shareholders' equity.
Our Mission
We Protect Others
Our Vision
We will be the best in the world at understanding and providing solutions for the risks our customers encounter as healers, innovators, employers and professionals. Through an integrated family of specialty companies, products and services, we will be a trusted partner enabling those we serve to focus on their vital work.
As the Employer of Choice, we embrace every day as a singular opportunity to reach for extraordinary outcomes, build and deepen superior relationships, advance diversity, equity and inclusion, and accomplish our mission with infectious enthusiasm and unbending integrity.
Our Values
Integrity, Leadership, Relationships, Enthusiasm
ProAssurance is a U.S. based specialty property and casualty and workers' compensation insurance carrier. Our specialty property and casualty insurance products primarily include medical professional liability insurance and liability insurance for medical technology and life sciences risks.
Our executive offices are located at 100 Brookwood Place, Birmingham, Alabama 35209 and our telephone number is (205) 877-4400. Our stock trades on the NYSE under the symbol “PRA.” Our website is www.proassurancegroup.com, and we maintain a dedicated Investor Relations section on that website (investor.proassurance.com) to provide resources for investors and others seeking to learn more about us.
As part of our disclosure, through the Investor Relations section of our website, we provide access to our annual report on Form 10-K, our quarterly reports on Form 10-Q, our current reports on Form 8-K and all other public SEC filings as soon as reasonably practicable after the report is electronically filed with, or furnished to, the SEC. These SEC filings can be found on our website at investor.proassurance.com/SEC-Filings. The Investor Relations section of our website also includes information regarding stock trading by corporate insiders by providing access to SEC Forms 3, 4 and 5 when they are filed with the SEC. In addition to federal filings on our website, we make available other documents that provide important additional information about our financial condition and operations. Documents available on our website include the financial statements we file with state regulators (compiled under SAP as required by regulation), news releases that we issue, a listing of our investment holdings and certain investor presentations. The Corporate Information section of our website provides copies of the charters for our governing committees and many of our governing policies. Printed copies of these documents may be obtained from our Investor Relations department, by email at InvestorRelations@ProAssurance.com, by mail at P.O. Box 590009, Birmingham, Alabama 35259-0009, or by telephone at (205) 776-3028 or (800) 282-6242.
Our History
We were incorporated in Delaware in 2001 as the successor to Medical Assurance, Inc, in conjunction with its merger with Professionals Group, Inc. ProAssurance has a history of growth through acquisitions; the most recent and significant of which was the acquisition of NORCAL Insurance Company on May 5, 2021.
Our Strategy
Our strategy is to provide best-in-class risk solutions for the markets in which we operate through superior relationships with our distribution partners. This is accomplished by fostering an Employer of Choice culture for our team members. This strategy enables us drive and deliver on our long-term goal to generate an attractive long-term total return for our shareholders
while maintaining financial strength and adequate capital. The basic components of our strategy for achieving this objective are as follows:
•Pursue profitable underwriting opportunities. We emphasize profitability, not market share, and our long-term objective is to achieve a consistent level of underwriting profit over the various economic and insurance cycles. Key elements of our approach are adhering to disciplined underwriting principles, including prudent risk selection, adequate pricing and product structure, as well as adjusting our business mix as necessary to effectively utilize capital and achieve long-term profit objectives.
•Focus on culture and people. Through a unifying culture, we strive to be the Employer of Choice by attracting, retaining and developing a diverse group of team members who embody our Mission, Vision and Values. We are committed to ensuring a supportive and safe environment for all team members, that fosters an inclusive workplace where variety of thought, creativity and innovation fuel team member engagement and ultimately increases shareholder return. See further discussion on our team members and culture within this section under the heading "Human Capital Resources."
•Provide specialized healthcare-centric expertise and thought leadership to meet the evolving demands in the healthcare and medical technology markets. We provide traditional liability products and services to both markets. We also leverage our national geographic footprint, broad product spectrum, expertise and financial strength to provide innovative and customized products to address the changing needs of customers in those dynamic markets.
•Provide superior workers' compensation products and services. We provide workers' compensation products and services that focus on increasing an organization's productivity while reducing costs. We do this by providing innovative programs and solutions that address the specific needs of our customers and return injured workers to wellness and the dignity of work.
•Provide superior customer service. Our goal is to deliver an exceptional service experience that is consistent, responsive and provides value to customers through a regional business model. Our valued team members demonstrate our core values of integrity, leadership, relationships and enthusiasm every day and are focused on meeting the needs of our customers.
•Focus on innovation to achieve operational excellence. We are committed to the pursuit of continuous improvement through careful and constant examination of our business processes which will allow us to improve our competitive position through operational excellence and productivity gains. We are investing in innovation solutions, including artificial intelligence and process automation, to enhance risk selection, decision making and workflows. Further, we are leveraging our data science and predictive analytics capabilities to support growth in profitable markets and sub-sectors.
•Effectively manage capital. We carefully monitor use of our capital and consider various options for capital deployment, such as business expansion by our existing subsidiaries, opportunities that arise for mergers or acquisitions, investment portfolio diversification to maximize yield and share repurchases.
•Manage claims effectively. Our industry leading claims professionals bring extensive industry and insurance experience, along with local jurisdictional knowledge to resolve claims in a cost effective manner. Additionally, we aim to utilize data analytics and artificial intelligence to enhance outcomes, improve decision making and lighten administrative burdens for claims professionals.
•Strategically manage our investment portfolio. Our investment strategy is designed to emphasize the preservation of our capital and provide adequate liquidity for the prompt payment of claims. Our investment portfolio consists primarily of investment-grade, fixed-maturity securities of short-to medium-term duration.
Organization and Segment Information
We operate through multiple insurance organizations and report our financial results in four segments which are based on our internal management reporting structure for which financial results are regularly evaluated by our Chief Executive Officer (our CODM) to determine resource allocation and assess operating performance: Specialty P&C, Workers' Compensation Insurance, Segregated Portfolio Cell Reinsurance and Corporate. Additional information on our four operating and reportable segments is included in Note 16 of the Notes to Consolidated Financial Statements and in the segment discussions that follows.
Gross Premiums Written
Gross premiums written for the years ended December 31, 2024, 2023 and 2022 were comprised as follows:
| | | | | | | | | | | | | | | | | | | | | | | | | | |
| Year Ended December 31 |
| ($ in thousands) | 2024 | | 2023 | | 2022 |
| Specialty P&C | $ | 807,463 | | 77 | % | | $ | 835,430 | | 77 | % | | $ | 856,861 | | 78 | % |
| Workers' Compensation Insurance | 243,404 | | 23 | % | | 246,857 | | 23 | % | | 247,132 | | 22 | % |
Segregated Portfolio Cell Reinsurance (1) | 57,904 | | 6 | % | | 70,259 | | 7 | % | | 78,937 | | 7 | % |
| | | | | | | | |
Inter-segment revenues (1) | (57,904) | | (6 | %) | | (70,267) | | (7 | %) | | (78,937) | | (7 | %) |
| Total | $ | 1,050,867 | | 100 | % | | $ | 1,082,279 | | 100 | % | | $ | 1,103,993 | | 100 | % |
(1) Premiums in our Segregated Portfolio Cell Reinsurance segment are assumed from either our Workers' Compensation Insurance or Specialty P&C segments. We eliminate this inter-segment revenue.
Additional detailed information regarding premium by individual product type within each of our insurance segments is provided in Item 7, Management's Discussion and Analysis, in the Results of Operations section, under the heading "Premiums Written."
Our insurance exposures are primarily within the U.S. In our Specialty P&C segment, we had net written premium of $39.3 million in 2024, $38.1 million in 2023 and $39.2 million in 2022 associated with international insurance exposures, primarily related to our strategic partnership with an international medical professional liability insurer and, to a lesser extent, exposures from our participation in Lloyd's Syndicates 1729 and 6131.
Specialty Property and Casualty Segment
Our Specialty P&C segment focuses on professional liability insurance and medical technology liability insurance. Professional liability insurance is primarily offered to healthcare providers and institutions. Medical technology liability insurance is offered to medical technology and life sciences companies that manufacture or distribute products including entities conducting human clinical trials. The Specialty P&C segment also includes the underwriting results from our participation in Syndicate 1729 and Syndicate 6131 at Lloyd's London, which is currently in run-off. We normally report results from our involvement in Lloyd's Syndicates on a quarter lag, except when information is available that is material to the current period.
Professional Liability Insurance
Our professional liability business is focused on providing medical professional liability insurance to healthcare providers and facilities. We target the full spectrum of the medical professional liability market, covering multiple categories of healthcare professionals, institutions (which includes hospitals, surgery centers and miscellaneous medical facilities) and, to a lesser extent, facilities specializing in long term residential care. While a majority of our business is written in the standard market, we also offer medical professional liability insurance on an excess and surplus lines basis, and we offer alternative risk and self-insurance products on a customized basis.
Our custom alternative risk solutions include loss portfolio transfer programs for healthcare entities who, most commonly, are exiting a line of business, and assumed reinsurance for healthcare entities who, most commonly, are changing an insurance approach or simply looking for a more tailored solution for transferring risk. Our assumed reinsurance is primarily comprised of premiums assumed on a quota share basis from our strategic partnership with an international medical professional liability insurer. Our custom alternative risk solutions also include a turnkey captive solution whereby we cede all or a portion of the healthcare premium, net of reinsurance, to two SPCs of our wholly owned Cayman Islands reinsurance subsidiary, Inova Re, which is reported in our Segregated Portfolio Cell Reinsurance segment. Each SPC is owned, fully or in part, by an individual company, agency, group or association, and we currently have a 25% participation interest in the results of one of the SPCs. See further discussion that follows under the heading "Segregated Portfolio Cell Reinsurance Segment." The portion not ceded to the SPCs is retained within our Specialty P&C segment. Total gross premiums written in this segment in our alternative market captive cell program were approximately $4.2 million, $6.7 million and $11.8 million during 2024, 2023 and 2022, respectively.
Underwriting MPL contemplates many factors including, but not limited to, the specific exposures, loss history, coverage scope/terms, level of the insured's retention, policy limits and operational venues. We utilize independent agencies and brokers as well as an internal business development team to write our MPL business. For the year ended December 31, 2024, approximately 66% of our MPL gross premiums written were produced through independent insurance agencies or brokers. The agencies and brokers we use typically sell through healthcare insurance specialists who are able to convey the factors that
differentiate our insurance products. In 2024, our ten largest agents or brokers produced approximately 29% of our MPL premium; individually, no one agency or broker produced more than 8% of our MPL premium.
In marketing our MPL products we emphasize our financial strength, breadth of product offerings and excellent claims, underwriting and risk management services. We market our insurance products through our business development team and through our agents as well as direct mailings and advertising in industry-related publications. We also are involved in professional societies and related organizations and support legislation that will have a positive effect on healthcare liability issues. We maintain a regional business model which permits us to consistently provide a high level of services to customers on a local basis.
We have widely distributed claims management staff with concentrations in key geographic locations to monitor and adjudicate MPL claims. We engage experienced, independent litigation attorneys in each venue to assist with the claims process as we believe this practice aids us in providing a defense that is aggressive, effective and cost-efficient. We evaluate the merit of each claim and determine the appropriate strategy for resolution of the claim, either seeking a reasonable good faith settlement appropriate for the circumstances of the claim or aggressively defending the claim. As part of the evaluation and preparation process for MPL claims, we meet regularly with medical advisory committees in our key markets to examine claims, attempt to evaluate practice patterns and make recommendations to our underwriting and risk management team members for implementation with customers.
Medical Technology and Life Sciences Insurance
Our Medical Technology Liability business offers products-completed operations and errors and omissions liability coverage for medical technology and life sciences companies. The vast majority of these insureds and the products they manufacture and/or distribute are regulated by the U.S. Food and Drug Administration or similar regulatory authorities in foreign jurisdictions. The products we insure cover a broad array of medical devices, pharmaceuticals and biologics including, but not limited to, infusion systems, operating room surgical instruments and disposables, laboratory equipment and supplies, in vitro diagnostic test kits and instruments, patient mobility aids, respiratory and anesthesia products, cardiovascular devices, vaccines or cancer therapeutics, laser surgical instruments, non-invasive diagnostic imaging systems, orthopedic implants, human and veterinary branded and generic drugs and biologics. We provide coverage for commercialized products and all phases of clinical trials. Our products-completed operations and errors and omissions liability coverage offerings are provided on both a primary or excess basis.
Underwriting analysis for Medical Technology Liability contemplates many factors including, but not limited to, the product's risk profile, loss history, the amount of coverage being sought, level of the insured's retention, policy limits, applicant's management experience, regulatory compliance record and volume of sales. Almost all of our Medical Technology Liability business is written through independent brokers. In 2024, our top ten largest brokers generated approximately 45% of our Medical Technology Liability gross written premium, with no one broker representing more than 11%. We work with licensed property and casualty insurance brokerages across the country and do not require an appointment except where required by law. We defend our Medical Technology Liability claims vigorously, with a negotiated settlement being the most frequent means of resolution.
Lloyd's Syndicates Operations (Participation Discontinued)
Our Lloyd's Syndicates business is currently in run-off, and our Specialty P&C segment includes the results from our participation in underwriting years that remain open in Syndicate 1729 and Syndicate 6131 at Lloyd's of London (approximately 1% of our 2024 gross premiums written). Lloyd's of London generally operates on a three year accounting system for final distribution of results generated by each underwriting year; however certain underwriting years can remain open after the three year period. The 2021 underwriting year for Syndicate 6131 remained open due to remaining exposures related to aviation coverages in connection with Russia's invasion of Ukraine. Effective September 2023, we elected to discontinue our participation in the results of Syndicate 1729 beginning with the 2024 underwriting year and due to the one quarter lag, was not reflected in our results until the second quarter of 2024. For the 2023 underwriting year, our participation in the results of Syndicate 1729 was approximately 5%. For Syndicate 6131, we ceased participation beginning with the 2022 underwriting year which was not reflected in our results until the second quarter of 2022.
We have also provided capital to Syndicate 1729 at Lloyd's of London to support our previous participation. The results from our participation in Syndicate 1729 from open underwriting years prior to 2024 will continue to earn out pro rata over the entire policy period of the underlying business.
Workers' Compensation Insurance Segment
Our Workers' Compensation Insurance segment offers workers' compensation products in 19 core states in the East, South and Midwest regions of the continental U.S. Our Workers' Compensation Insurance segment consists of two major business activities:
•Traditional workers' compensation insurance coverages provided to employers, generally those with 1,000 employees or less. Types of policies offered include guaranteed cost policies, policyholder dividend policies, retrospectively-rated policies and deductible policies.
•Alternative market workers' compensation solutions are 100% ceded, less a ceding commission, to either the SPCs at Inova Re, which are reported in our Segregated Portfolio Cell Reinsurance segment, or captive insurers unaffiliated with ProAssurance for two programs. The ceding commission charged to the SPCs consists of an amount for fronting fees, cell rental fees, commissions, premium taxes, claims administration fees and risk management fees.
All of our workers' compensation products are distributed through appointed independent agents.
We utilize an individual account underwriting strategy for our workers' compensation business that is focused on selecting quality accounts. Our goal is to underwrite a diverse book of business with respect to risk classification, hazard level and geographic location. We target accounts with strong return to wellness and safety programs in primarily low to middle hazard levels such as clerical offices, light manufacturing, healthcare, auto dealers and service industries and maintain a strong risk management unit in order to better serve our customers' needs.
We actively seek to reduce our workers' compensation loss costs by placing a concentrated focus on returning injured workers to wellness and the dignity of work as quickly as possible. We emphasize early intervention and aggressive disability management, utilizing in-house and third-party specialists as well as innovation solutions for case management, including medical care and cost management. Strategic vendor relationships have been established to reduce medical claim costs and include preferred provider, physical therapy, prescription drug and catastrophic medical services. We continue to implement and invest in innovation solutions, such as artificial intelligence along with underwriting and claims data analytics, to address various aspects of escalating medical costs and support operational decisions. These solutions include technologies that are expected to improve and maximize medical bill savings as well as assisting our claim professionals in directing medical care for our injured workers to achieve the best possible medical outcomes.
Segregated Portfolio Cell Reinsurance Segment
Our Segregated Portfolio Cell Reinsurance segment includes the results (underwriting profit or loss, plus investment results, net of U.S. federal income taxes) of SPCs at Inova Re and Eastern Re, our Cayman Islands SPC operations. Each SPC is owned, fully or in part, by an individual company, agency, group or association and the results of the SPCs are attributable to the participants of that cell. We participate to a varying degree in the results of certain SPCs and, for the SPCs in which we participate, our participation interest ranges from a low of 15% to a high of 85% as of December 31, 2024. Each SPC is operated solely for the benefit of its cell participants, and the pool of assets of one SPC are statutorily protected from the creditors of any other SPC. The results of the SPCs are allocated among the cell participants in accordance with the terms of the cell agreements. SPC results attributable to external cell participants are reflected as an SPC dividend expense (income) in our Segregated Portfolio Cell Reinsurance segment. In addition, the Segregated Portfolio Cell Reinsurance segment includes the investment results of the SPCs as the investments are solely for the benefit of the cell participants. The segment results also reflect our share of the results of the SPCs in which we participate. The SPCs assume workers' compensation insurance, medical professional liability insurance or a combination of the two from our Workers' Compensation Insurance and Specialty P&C segments.
The underwriting, marketing and distribution of policies written in alternative market programs are the same as that of the segment from which the policy was assumed: Workers' Compensation Insurance or Specialty P&C segments.
Corporate Segment
Our Corporate segment includes our investment operations excluding those reported in our Segregated Portfolio Cell Reinsurance segment. In addition, this segment includes corporate expenses, interest expense, U.S. and U.K. income taxes and non-premium revenues generated outside of our insurance entities. This segment focuses on supporting the operations of our insurance subsidiaries through strategically managing our investment portfolio and providing certain administrative services. The expertise our corporate team brings to our insurance subsidiaries contributes to operating profitability through investment returns and helps improve the efficiency and effectiveness of our entire organization. As it relates to our entire investment portfolio, we apply a consistent strategy managed at the corporate level. Accordingly, we report those investment results and net investment gains and losses within our Corporate segment. Our overall investment strategy is to maximize current income from our investment portfolio while maintaining appropriate credit risk, liquidity, duration, portfolio diversification and capital efficiency. The portfolio is generally managed by professional third-party asset managers whose results we monitor and
evaluate. The asset managers typically have the authority to make investment decisions within the asset classes they are responsible for managing, subject to our investment policy and oversight, including a requirement that available-for-sale securities in a loss position cannot be sold without specific authorization from us. See Note 3 of the Notes to Consolidated Financial Statements for more information on our investments.
Competition
The marketplace for most of our lines of business is very competitive, though competition does vary among the different product lines and healthcare sectors. Within the U.S., our competitors are primarily domestic insurance companies ranging from large national insurers whose financial strength and resources may be greater than ours to smaller insurance entities that concentrate on a single state and as a result have an extensive knowledge of the local markets, or smaller unrated organizations who are targeting growth aggressively in multiple jurisdictions. Further, in many instances the coverage we offer is also offered through mutual entities whose ROE objectives may be lower than ours, and thus may be able to price their products more aggressively given current levels of excess capital. Additionally, there are many providers, domestic and international, of alternative risk management solutions. Competitive distinctions include pricing, size, name recognition and reputation, service quality, market commitment, market conditions, breadth and flexibility of coverage, method of sale, new technologies, financial stability, ratings assigned by rating agencies and regulatory conditions.
The healthcare environment in the U.S. is continuing to consolidate, which brings competitive challenges and opportunities to the Specialty P&C segment, our largest segment. This consolidation initially took the form of hospitals acquiring physician practices and later the growth of physician groups owned by outside investors. As these trends continue, most physicians no longer practice medicine as owners of an independent practice. Healthcare delivery settings are changing with the growth of retail delivery by allied healthcare professionals as well as physicians practicing in distributed clinics, pharmacies, large consumer stores and online. These larger commercial enterprises have differing risk management needs from traditional small physician practices. As such, we have enhanced our coverage offerings to fit the needs of combined hospital/physician entities, multi-state medical groups, telemedicine companies, miscellaneous medical facilities, allied healthcare professionals and self-insured entities, even as we continue to service that portion of the market maintaining more traditional practice structures. Our SPCs at Inova Re can provide a unique captive solution for insureds large enough to have credible claims data, yet too small to have their own captive arrangement.
The workers’ compensation industry is highly competitive. New business opportunities, renewal pricing and retention continue to be a challenge as a result of intense competition, especially from multi-line insurers that appear to be willing to underprice their workers’ compensation products in order to gain access to write other coverages that may be more lucrative and we expect this trend to continue in 2025. We believe our product offerings allow us to provide flexibility in offering workers’ compensation solutions to our customers at a competitive price. In addition, we believe that our claims handling and risk management services are attractive to our customers and provide us with a competitive advantage, even when our pricing is higher than our competitors.
For all of our business, we recognize the importance of providing our products at competitive rates, and we believe that we price our products at rates that help us move toward our long-term profit targets over the life of the insurance cycle. We base our rates on current loss projections, maintaining a long-term focus even when this approach may reduce our top line growth. Such loss projections could also result in us not meeting profit targets during certain phases of the insurance cycle. We believe that our size, reputation for effective claims management, unique customer service focus, multi-state presence and broad spectrum of coverages offered provides us with competitive advantages, even as the needs of our insureds change.
Rating Agency
Our claims paying ability is regularly evaluated and rated by AM Best. In developing their claims paying rating, this agency makes an independent evaluation of an insurer’s ability to meet its obligations to policyholders. The following table presents the claims paying rating of our insurance subsidiaries as of February 24, 2025.
| | | | | | | | | | |
| | | Rating Agency |
| | | AM Best (1) (www.ambest.com) | | |
| | | | |
| ProAssurance Indemnity Company, Inc. | | A (Excellent) | | |
| ProAssurance Specialty Insurance Company | | A (Excellent) | | |
| ProAssurance Insurance Company of America | | A (Excellent) | | |
| Medmarc Casualty Insurance Company | | A (Excellent) | | |
| NORCAL Insurance Company | | A (Excellent) | | |
| NORCAL Specialty Insurance Company | | A (Excellent) | | |
| Medicus Insurance Company | | A (Excellent) | | |
| FD Insurance Company | | A (Excellent) | | |
| Preferred Physician Medical RRG, a Mutual Insurance Company | | A (Excellent) | | |
| ProAssurance American Mutual, A RRG | | A (Excellent) | | |
| Allied Eastern Indemnity Company | | A (Excellent) | | |
| Eastern Advantage Assurance Company | | A (Excellent) | | |
| Eastern Alliance Insurance Company | | A (Excellent) | | |
| Eastern Re Ltd., SPC | | NR | | |
| Inova Re Ltd., SPC | | NR | | |
Lloyd's Syndicate 1729 (2) | | A+ (Superior) | | |
(1) NR indicates that the subsidiary has not been rated by the listed rating agency. |
|
(2) Rating provided is the rating applicable to all Lloyd's syndicates. |
Our ability to service current debt and potential debt is regularly evaluated and rated by AM Best. In 2024, AM Best maintained ProAssurance's debt rating of "A+" with a stable outlook. The debt rating reflects the agency’s independent evaluation of our ability to meet our obligation to holders of our debt, if any.
While the debt rating may be of greater interest to investors than our claims paying rating, this rating is not an evaluation of our equity securities nor a recommendation to buy, hold or sell our equity securities.
Insurance Regulatory Matters
We are subject to regulation under the insurance and insurance holding company statutes of various jurisdictions, including the domiciliary states of our insurance subsidiaries and other states in which our insurance subsidiaries do business. Our insurance subsidiaries are primarily domiciled in the U.S. Our states of domicile include Alabama, California, Delaware, Illinois, Missouri, Pennsylvania, Texas and Vermont. Our foreign jurisdictions include our reinsurance operations based in the Cayman Islands and our insurance and reinsurance operations based in the U.K. that we support through our previous participation in underwriting years that remain open at Syndicate 1729 and Syndicate 6131.
United States
Our insurance subsidiaries are required to file detailed annual statements in their states of domicile with the NAIC and, in some cases, with the state insurance regulators in each of the states in which they do business. The laws of the various states establish agencies with broad authority to regulate, among other things, licenses to transact business, premium rates for certain types of coverage, trade practices, agent licensing, policy forms, underwriting and claims practices, reserve adequacy, transactions with affiliates and insurer solvency. Such regulations may hamper our ability to meet operating or profitability goals, including preventing us from establishing premium rates for some classes of insureds that adequately reflect the level of risk assumed for those classes. Many states also regulate investment activities on the basis of quality, distribution and other quantitative criteria. States have also enacted legislation, typically based in whole or in part on NAIC model laws, which regulates insurance holding company systems, including acquisitions, the payment of dividends, the terms of affiliate transactions, enterprise risk and solvency management and other related matters.
Applicable state insurance laws, rather than federal bankruptcy laws, apply to the liquidation or reorganization of insurance companies.
Insurance companies are also subject to state and federal legislative and regulatory measures and judicial decisions. These could include new or updated definitions of risk exposure and limitations on business practices.
Insurance Regulation Concerning Change or Acquisition of Control
The insurance regulatory codes in each of the domiciliary states of our operating subsidiaries contain provisions (subject to certain variations) to the effect that the acquisition of “control” of a domestic insurer or of any person that directly or indirectly controls a domestic insurer cannot be consummated without the prior approval of the domiciliary insurance regulator. In general, a presumption of “control” arises from the direct or indirect ownership, control or possession with the power to vote or possession of proxies with respect to 10% (5% in Alabama) or more of the voting securities of a domestic insurer or of a person that controls a domestic insurer. Because of these regulatory requirements, any party seeking to acquire control of ProAssurance or any other domestic insurance company, whether directly or indirectly, would usually be required to obtain such approvals.
In addition, certain state insurance laws contain provisions that require pre-acquisition notification to state agencies of a change in control of a non-domestic insurance company admitted in that state. While such pre-acquisition notification statutes do not authorize the state agency to disapprove the change of control, such statutes do authorize certain remedies, including the issuance of a cease and desist order with respect to the non-domestic admitted insurers doing business in the state if certain conditions exist, such as undue market concentration.
Insurance Regulation Concerning Cybersecurity and Data Privacy
In March 2017, the New York Cybersecurity Regulation took effect for financial institutions, insurers and other companies regulated by the NYDFS. The intent of the regulation is to encourage the protection of consumer information, as well as the technology systems of NYDFS regulated entities. The regulation was subsequently amended, with the most recent changes being adopted effective November 1, 2023. In similar efforts, the NAIC adopted the Insurance Data Security Model Law in October 2017, which created rules for insurers, agents and other licensed entities. The data security laws require an information security program based on an ongoing risk assessment, overseeing third-party service providers, investigating data breaches and notifying regulators of a cybersecurity event.
In June 2018, California adopted the California Consumer Privacy Act of 2018, which provided comprehensive data privacy protections to California residents. These data privacy laws establish numerous consumer rights, such as the right to be notified of privacy practices and the right to know, delete, or correct certain personal information.
Each of the domiciliary states of our insurance subsidiaries and affiliates, excluding Missouri, has enacted data security or data privacy laws. Within the past few years, the following domiciliary states of our insurance subsidiaries and affiliates have enacted or amended data security or data privacy laws:
•Alabama enacted the Insurance Data Security Law, effective May 1, 2019.
•California enacted the California Consumer Privacy Act of 2018, effective January 1, 2020, and the California Privacy Rights Act of 2020, effective January 1, 2023. The CPRA amends and expands the CCPA.
•Delaware enacted the Delaware Personal Data Privacy Act, effective January 1, 2025.
•The District of Columbia enacted the Security Breach Protection Amendment Act of 2020, effective June 17, 2020.
•Illinois amended its Personal Information Protection Act, effective January 1, 2020, and enacted the Insurance Data Security Law, effective January 1, 2024.
•Pennsylvania enacted the Insurance Data Security Law, effective December 11, 2023.
•Texas enacted the Texas Data Privacy and Security Act, effective July 1, 2024.
•Vermont amended its Security Breach Notice Act, effective July 1, 2020, and enacted the Vermont Insurance Data Security Law, effective January 1, 2023.
We expect that additional states will continue to adopt data security and data privacy laws and regulations. We do not expect compliance with the various data security or data privacy acts to have a material impact on our financial condition or results of operations, as they closely resemble the NAIC Model Law, the NYDFS Cybersecurity Regulations and the CCPA.
Statutory Accounting and Reporting
Insurance companies are required to file detailed quarterly and annual reports with state insurance regulators in their state of domicile and each of the states in which they do business. Their business and accounts are subject to examination by such regulators at any time. The financial information in these reports is prepared in accordance with SAP. Insurance regulators periodically examine each insurer’s adherence to SAP, financial condition and compliance with insurance department rules and regulations.
Regulation of Dividends and Other Payments from Our Operating Subsidiaries
Our U.S. operating subsidiaries are subject to various state statutory and regulatory restrictions that limit the amount of dividends or distributions an insurance company may pay to its shareholders, including our insurance holding company, without prior regulatory approval. Generally, dividends may be paid only out of unassigned earned surplus. In every case, surplus subsequent to the payment of any dividends must be reasonable in relation to an insurance company’s outstanding liabilities and must be adequate to meet its financial needs.
State insurance holding company regulations generally require domestic insurers to obtain prior approval of extraordinary dividends. Insurance holding company regulations that govern our principal operating subsidiaries deem a dividend as extraordinary if the combined dividends and distributions to the parent holding company in any twelve-month period exceed prescribed thresholds. Such thresholds are statutorily prescribed by the state of domicile and currently are based on either net income for the prior fiscal year (reduced by realized capital gains in certain domiciliary states) or a percentage of unassigned surplus at the end of the prior fiscal year, depending upon the wording of the statute.
If insurance regulators determine that payment of a dividend or any other payments within a holding company group, (such as payments under a tax-sharing agreement or payments for employee or other services) would, because of the financial condition of the paying insurance company or otherwise, be a detriment to such insurance company’s policyholders, the regulators may prohibit such payments that would otherwise be permitted.
Risk-Based Capital and Risk Assessment
In order to enhance the regulation of insurer solvency, each state of domicile in accordance with an NAIC-defined formula specifies risk-based capital requirements for property and casualty insurance companies. At December 31, 2024, the Company estimates that all of ProAssurance’s insurance subsidiaries will exceed the minimum required risk-based capital levels.
In late 2010, the NAIC adopted the Model Holding Co. Law. The Model Holding Co. Law, as compared to previous NAIC guidance, increases regulatory oversight of and reporting by insurance holding companies, including reporting related to non-insurance entities, and requires reporting of risks affecting the holding company group. Additionally, in 2012 the NAIC adopted ORSA, which requires insurers to maintain a framework for identifying, assessing, monitoring, managing and reporting on the “material and relevant risks” associated with the insurer's (or insurance group's) current and future business plans. ORSA requires larger insurers, generally those with annual written premium volume greater than $1 billion as a group or $500 million as an individual insurer, to file an internal assessment of solvency with insurance regulators annually beginning in 2015. Although no specific capital adequacy standard is currently articulated in ORSA, it is possible that such standard will be developed over time. The Model Holding Co. Law and ORSA will be binding only if adopted by state legislatures and/or state insurance regulatory authorities and actual regulations adopted by any state may differ from that adopted by the NAIC. As of December 31, 2024, all states have adopted the Model Holding Co. Law and 49 states have adopted ORSA. Due to our written premium volume for the year ended December 31, 2023, ProAssurance filed its internal assessment of solvency under the ORSA criteria during 2024.
Also, the NAIC subsequently revised the Model Holding Co. Law to include provisions which allow regulatory supervision of the holding company group through supervisory colleges and which require reporting of risk and solvency assessments for the group. Certain states in which we operate adopted these revisions early, and we began filing our risk and solvency assessment in 2014.
Investment Regulation
Our operating subsidiaries are subject to state laws and regulations that require diversification of investment portfolios and that limit the amount of investments in certain investment categories. Failure to comply with these laws and regulations may cause non-conforming investments to be treated as non-admitted assets for purposes of measuring statutory surplus and, in some instances, would require divestiture of investments. We monitor the practices used by our operating subsidiaries for compliance with applicable state investment regulations and take corrective measures when deficiencies are identified.
Assessment Funds
Admitted insurance companies are required to be members of guaranty associations which administer state guaranty funds. To fund the payment of claims (up to prescribed limits) against insureds of insurance companies that become insolvent, these associations levy assessments on all member insurers in a particular state on the basis of the proportionate share of the premiums written by member insurers in the covered lines of business in that state. Maximum assessments permitted by law in any one year generally vary between 1% and 2% of annual premiums written by a member in that state, although state regulations may permit larger assessments if insolvency losses reach specified levels. Some states permit member insurers to recover assessments paid through surcharges on policyholders or through full or partial premium tax offsets, while other states
permit recovery of assessments through the rate filing process. In recent years, participation in guaranty funds has not had a material effect on our results of operations.
Certain states in which we write workers’ compensation insurance have established administrative and/or second injury funds that levy assessments against insurers that write business in their state. The assessments are generally based on insurer’s proportionate share of premiums or losses in a particular state, and the assessment rate can vary from year to year.
Shared Markets
State insurance regulations may force us to participate in mandatory property and casualty shared market mechanisms or pooling arrangements that provide certain insurance coverage to individuals or other entities that are otherwise unable to purchase such coverage in the commercial insurance marketplace. Our operating subsidiaries’ participation in such shared markets or pooling mechanisms is not material to our business at this time.
Federal Regulation
The Dodd-Frank Act was enacted in July 2010 and established additional regulatory oversight of financial institutions. To date, the Dodd-Frank Act has not materially affected our business. However, development of regulations is not complete, and there could yet be changes in the regulatory environment that affect the way we conduct our operations or the cost of compliance, or both.
One of the federal government bodies created by the Dodd-Frank Act was the FIO which in December 2013 released a proposal on insurance modernization and improvement of the system of insurance regulation in the U.S. Although the FIO is prohibited from directly regulating the business of insurance, it has authority to represent the U.S. in international insurance matters and has limited power to preempt certain types of state insurance laws. The proposal advocates significantly greater federal involvement in insurance regulation and identifies necessary reforms by the states to preclude further consideration of direct federal regulation. While the proposal does not necessarily imply that the federal government will displace state regulation completely, it does recommend more of a hybrid approach to insurance regulation. In response to the FIO proposal, the NAIC and a number of state legislatures have considered or adopted legislative proposals that alter and, in many cases, increase the authority of state agencies to regulate insurance companies and insurance holding company systems. We cannot predict whether the proposals will be adopted or what impact, if any, subsequently enacted laws might have on our business, financial condition or results of operations.
In June 2012, Congress passed the Biggert-Waters Bill, which provided for a five-year renewal of the NFIP and, among other things, authorized the Federal Emergency Management Agency to carry out initiatives to determine the capacity of private insurers, reinsurers, and financial markets to assume a greater portion of the flood risk exposure in the U.S. and to assess the capacity of the private reinsurance market to assume some of the program’s risk. In August 2017, the President of the U.S. signed an executive order revoking the establishment of a federal flood risk management standard. In November 2017, the U.S. House of Representatives adopted a bill to reauthorize the NFIP for five years and implement several reforms, including provisions designed to spur additional private insurer involvement in covering flood risk, but the U.S. Senate has yet to vote on the measure. Due to the 2017 hurricane season, Congress adopted a short-term extension to fund the NFIP which has subsequently received multiple short-term extensions and currently expires on March 14, 2025. We cannot predict whether the proposals will be adopted or extended or what impact, if any, subsequently enacted laws might have on our business, financial condition or results of operations.
Terrorism Risk Insurance Act
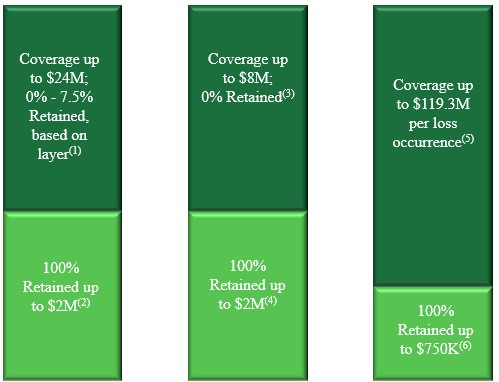
TRIA, initially enacted in 2002 and reauthorized in 2007, 2015 and 2019 ensures the availability of insurance coverage for certain acts of terrorism, as defined in the legislation. The 2019 reauthorization extended the program through 2027. TRIA currently provides that during 2022 and in any year thereafter a loss event must exceed $200 million to trigger coverage and that the federal government will reimburse 80% of an insurer’s losses in excess of the insurer’s deductible, up to the maximum annual federal liability of $100 billion. TRIA requires that we offer terrorism coverage to our commercial policyholders in our workers' compensation line of business, for which we may, when warranted, charge an additional premium. The policyholders may or may not accept such coverage.
International
Cayman Islands
Our SPC business operates through our subsidiaries, Inova Re and Eastern Re, which are organized and licensed as Cayman Islands unrestricted Class B insurance companies. Inova Re and Eastern Re are subject to regulation by the CIMA. Applicable laws and regulations govern the types of policies that Inova Re and Eastern Re can insure or reinsure, the amount of capital they must maintain and the way it can be invested, and the payment of dividends. Inova Re and Eastern Re are required
to maintain minimum capital of approximately $200,000 and must receive approval from the CIMA before they can pay any dividends.
Human Capital Resources
Our people are the most critical element in assuring we deliver our promise of protecting others. As such, the commitment we extend to and the investment we make in our employees (or team members) is of the highest priority. We are determined in our goal to attract, develop, and retain a diverse group of team members who embody our Mission, Vision and Values and this goal drives the programs and resources we proudly offer.
We are committed to providing a safe and healthy working experience where all team members are treated with dignity and respect, allowing them to do their best work. Further, we seek to provide equal opportunities while fostering a diverse and inclusive workplace that promotes team member engagement. To ensure our workforce is comprised of a diverse group of highly-qualified individuals, we are committed to advertising job openings and sourcing candidates through broad-reaching techniques. We are committed to this strategy starting with our Board and extending through all levels within our organization. Further, we seek to provide a fulfilling work experience through the creation of well-documented career paths and opportunities for advancement, robust training and development programs and the management of transparent salary administration practices. Our competitive pay and benefit programs are designed to reward, support and retain our team members. To further illustrate the significance of our commitment to our team members and being the Employer of Choice, the Board regularly reviews the Company’s human capital management strategies and outcomes, including matters related to the Company's culture, talent management and development, talent acquisition and team member engagement and satisfaction.
We are committed to facilitating and fostering team member engagement. To support those objectives, we conduct quarterly “Pulse” surveys that gain real-time feedback from our team members on key issues. We regularly monitor and evaluate turnover metrics to ensure we are responsive to the evolving, competitive market for top talent.
Some examples of key programs and initiatives that are focused on attracting, developing and retaining our diverse workforce include:
•Diversity, Equity and Inclusion - To advance our commitment to fostering a diverse, inclusive and equitable workplace, our Diversity, Equity and Inclusion Council, comprised of team members from across the organization and supported by a Diversity, Equity and Inclusion Program Manager, are focused on three key strategic areas, including:
◦building and sustaining a diverse workforce that is inclusive and representative of the insureds we serve and the communities in which we work;
◦providing learning and engagement opportunities that enables every team member to succeed; enhancing overall morale and performance, while recognizing and addressing the distinct challenges faced by diverse populations; and
◦fostering a Company culture where every individual can bring their authentic self to work and feels a deep sense of belonging by sustaining an environment that prioritizes inclusivity, respect and shared success.
•Team Member and Leadership Development - We invest in training and development programs that support our Mission, Vision and Values, encourage continuous learning, equip team members for advancement and encourage a long-term partnership with the Company. We provide career paths for team members to continue to advance their technical skills. To grow the skills of our current managers and plan for future succession needs, we provide a tiered leadership development program, Leadership That Works, that includes both in-person group and self-led content.
•Team Member Health and Welfare - We recognize the importance of a comprehensive benefits strategy to support the unique needs of all team members. During our 2024 benefits open enrollment process, we expanded our health insurance program to include fertility benefits. We continue to leverage our wellness platform to support the physical, emotional and financial health of our team members.
•Flexible Workplace - The majority of our team members are either fully-remote or working in a flexible work arrangement that supports healthy work-life balance while capitalizing on opportunities to bring team members together to foster relationships, fuel innovation and facilitate engagement.
ProAssurance Corporation and our subsidiaries are equal opportunity employers and we do not discriminate either directly or indirectly against employees or prospective employees on the basis of race, color, religion, sex, sexual preference/orientation, citizenship, marital status, veteran status, national origin, age or disability, or any other attribute protected by applicable law or regulation. At December 31, 2024, we had 1,036 employees, none of whom were represented by a labor union. We consider our employee relations to be good.
Enterprise Risk Management
As a property and casualty insurance provider, we are exposed to many risks stemming from both our insurance operations and the environments in which we operate. Since certain risks can be correlated with other risks, an event or a series of events can impact multiple areas of the Company simultaneously and have a material effect on the Company's results of operations, financial position and/or liquidity. In response to these exposures we have implemented an ERM program. Our ERM program consists of numerous processes and controls that have been designed by our senior management with oversight by our Board and implemented across our organization. We utilize our ERM program to identify potential risks from all aspects of our operations and to evaluate these risks in a manner that is both prudent and balanced. Our primary objective is to develop a risk appetite that creates and preserves value for all of our stakeholders.
Management Risk Oversight
We have a risk management framework that recognizes the risks inherent in our operating segments as well as the risks associated with the operations of our holding company that is overseen by our Chief Executive Officer. The risk management process is managed by corporate executives in each line of business who are responsible for our key risk areas, including adequacy of loss reserves; defense of claims and the litigation process; the quality of investments supporting our reserves and capital; compliance with regulatory and financial reporting requirements; concentration in our insurance lines of business; and information privacy and data security. Our Chief Executive Officer and members of executive management are responsible for identifying material risks associated with these and other risk areas and for establishing and monitoring risk management solutions that address levels of risk appetite and risk tolerance that are recommended by management and reviewed by our Board. Our Internal Audit department is responsible for reviewing and testing these risk management solutions.
Board of Directors Role in Risk Oversight
Our Board is responsible for ensuring that our ERM process is in place and functioning. It reviews the ERM process established by management and monitors the functioning of the process, including management’s assessment of the most significant enterprise-level risks identified in the ERM process.
Our Audit Committee has the primary oversight responsibility for risks relating to financial reporting and cybersecurity. We have established lines of communication between our Audit Committee, our independent auditor, internal auditor and management that enable our Audit Committee to perform its oversight function.
ITEM 1A. RISK FACTORS.
There are a number of factors, many beyond our control, which may cause results to differ significantly from our expectations. Through our ERM program, as previously discussed, we have attempted to identify and understand the nature, caliber and sensitivity of material foreseeable risks, mitigate or avoid those risks and determine a course of action necessary to address such risks. These risk factors generally fall under the following five categories:
1. Insurance
2. Financial
3. Regulatory and Compliance
4. Operational
5. Technology, Data Security and Privacy.
Any factor described in this report could by itself, or together with one or more other factors, have a negative effect on our business, results of operations, liquidity and/or financial condition. There may be factors not described in this report that could also cause results to differ from our expectations.
Insurance
Insurance market conditions may alter or limit the effectiveness of our current business strategy and impact our revenues.
The property and casualty insurance business is highly competitive. We compete in a fragmented market comprised of many insurers, ranging from large national insurers whose financial strength and resources may be greater than ours to smaller insurance entities that concentrate on a single state and as a result have an extensive knowledge of the local markets or smaller unrated organizations who are targeting growth aggressively in multiple jurisdictions. In many instances, coverage we offer is also available through mutual entities whose ROE objectives may be lower than ours. The healthcare environment in the U.S. is continuing to consolidate, which initially took the form of hospitals acquiring physician practices and later the growth of physician groups owned by outside investors. As these trends continue most physicians no longer practice medicine as owners of an independent practice. Also, there are many opportunities for self-insurance and for participation in an alternative risk transfer mechanism, such as a captive insurer or a risk retention group.
Competition in the property and casualty insurance business is based on many factors, including premiums charged and other terms and conditions of coverage, services provided, financial ratings assigned by independent rating agencies, claims services, reputation, geographic scope, local presence, agent and client relationships, financial strength and the experience of the insurance company in the line of insurance to be written. Actions of competitors could adversely affect our ability to attract and retain business at current premium levels, impact our market share and reduce the profits that would otherwise arise from operations.
The cyclicality in the property and casualty insurance industry could have a material adverse effect on our ability to improve or maintain underwriting profits or to grow or maintain premium volume.
The insurance and reinsurance markets have historically been cyclical, characterized by extended periods of intense price competition and other periods of reduced capacity. The medical professional liability market has been particularly affected by these cycles. Underwriting cycles are driven, among other reasons, by excess capacity available to compete for business. This action drives pricing down. Since the insurance industries in which we operate have a long development period, particularly the medical professional liability industry, prices typically fall too far resulting in poor underwriting results for a period of time. The reaction is then a withdrawal of capacity, reduced availability of coverage offerings and price increases. In past cycles, these actions improve profitability over a few years inviting new capital into the market again which causes the cycle to repeat. Events other than price can also have a material effect on the duration and depth of the underwriting cycles, such as severity spikes, tort reforms, abrupt frequency changes or reinsurance availability. Changes in the frequency and severity of losses may affect the cycles of the insurance and reinsurance markets significantly. During "soft markets" where price competition is high and underwriting profits are poor, growth and retention of business become challenging which may result in reduced premium volume. During the initial stages of "hard markets", premium volumes rise for existing business and retention levels fall. As more carriers enter this action phase, underwriting profits begin to improve, although their achievement may take several years to materialize. As the cycle progresses, opportunities may then be presented to grow profitably at the higher premium levels.
The Company's results of operations could be adversely impacted by catastrophes, both natural and man-made, pandemics, severe weather conditions, climate change or closely related series of events.
Catastrophes can be caused by unpredictable natural events such as hurricanes, windstorms, severe storms, tornadoes, floods, hailstorms, severe winter weather, earthquakes, explosions and fire, and by other natural and man-made events, such as terrorist attacks, civil and political unrest, as well as pandemics and other similar outbreaks in many parts of the world. Insurance companies are not permitted to reserve for a catastrophe until it has occurred. Although we purchase reinsurance protection for risks we believe bear a significant level of catastrophe exposure, actual losses resulting from a catastrophic event or events may exceed our reinsurance protection. Furthermore, for significant catastrophic exposure, the inability or unwillingness of the reinsurer to make timely payments under the terms of the reinsurance agreement could impact our liquidity. These events may have a material adverse effect on our workforce and business operations as well as the workforce and operations of our insureds and independent agents. Some of the assets in our investment portfolio may be adversely affected by declines in the equity markets, changes in interest rates, reduced liquidity and economic activity caused by large-scale catastrophes, pandemics, terrorist attacks or similar events which could have a material adverse effect on our financial position, results of operations and liquidity.
The incidence, frequency and severity of catastrophes are inherently unpredictable. While we use historical data and modeling tools to assess our potential exposure to catastrophic losses under various conditions and probability scenarios, such assessments do not necessarily accurately predict future losses or accurately measure our potential exposure. The extent of losses from a catastrophe is a function of both the total amount of insured exposure in the area affected by the event and the severity of the event.
Our loss exposure for a terrorist act meeting the TRIA definition is mitigated by our coverage provided by this program as described in Part I under the heading "Insurance Regulatory Matters." Congress has the ability to alter or repeal the provisions of TRIA at its discretion, and if altered or repealed, our exposure could increase and result in premium increases for those types of coverages. Workers' compensation coverages cannot exclude damages related to an act of terrorism, and if TRIA were repealed or the benefits were substantially reduced, this might affect our ability to offer these coverages at a reasonable rate. In addition, the program currently expires at the end of 2027, and the failure to extend the program could adversely affect our business through increased exposure to a catastrophic level of terrorism losses.
Our results of operations and financial condition may be affected if actual insured losses differ from our loss reserves or if actual amounts recoverable under reinsurance agreements differ from our estimated recoverables.
We establish reserves as balance sheet liabilities, representing our estimates of amounts needed to resolve reported and unreported losses and pay related loss adjustment expenses. Our largest liability is our reserve for losses and loss adjustment expenses. Due to the size of our reserve for losses and loss adjustment expenses, even a small percentage adjustment to our reserve can have a material effect on our results of operations for the period in which the change is made.
The process of estimating loss reserves is complex and highly judgmental. Significant periods of time may elapse between the occurrence of an insured loss, the reporting of the loss by the insured and payment of that loss. Ultimate loss costs, even for claims with similar characteristics, can vary significantly depending upon many factors including but not limited to the nature of the claim, including whether the claim is an individual or a mass tort claim, the personal situation of the claimant or the claimant’s family, the outcome of jury trials, the legislative and judicial climate where the insured event occurred, general economic conditions and, for claims involving bodily injury, the trend of healthcare costs. Consequently, the loss cost estimation process requires actuarial skill and the application of judgment and such estimates require periodic revision. As part of the reserving process, we review the known facts surrounding reported claims as well as historical claims data and consider the impact of various factors such as:
•for reported claims, the nature of the claim and the jurisdiction in which the claim occurred;
•trends in paid and incurred loss development;
•trends in claim frequency and severity;
•emerging economic and social trends;
•trends in healthcare costs for claims involving bodily injury;
•monetary, social and medical inflation and levels of employment; and
•changes in the regulatory, legal and political environment.
Our reserving process assumes that past experience, adjusted for the effects of current developments and anticipated trends, is an appropriate, but not necessarily accurate, basis for predicting future events. There is no precise method for evaluating the impact of any specific factor on the adequacy of reserves, and actual results are likely to differ from original estimates. We evaluate our reserves each period and increase or decrease reserves as necessary based on our estimate of future claims payments. An increase to reserves has a negative effect on our results of operations in the period of increase whereas a reduction to reserves has a positive effect on our results of operations in the period of reduction.
Our loss reserves also may be affected by court decisions that expand liability of our policies after they have been issued. Further, a significant jury award or series of awards against one or more of our insureds could require us to pay large sums of money in excess of our reserved amounts. Due to uncertainties inherent in the jury system, in the unlikely event that we incur a jury verdict in excess of our reinsurance agreements and other protections we have in place, for which we are required to pay, we may incur a loss that could have a material adverse effect on our results of operations. Additionally, our loss reserves may be impacted by social inflation, which is generally described as the rising costs of insurance claims resulting from factors including, but not limited to, increasing litigation, broader definitions of liability, more plaintiff-friendly legal decisions, jury behavior, third-party litigation financing and larger compensatory jury awards and non-economic damages. These factors could lead to greater than anticipated claims and claim handling expenses which could exceed our established reserves causing us to increase our loss reserves, as discussed above.
Both the effects of inflation overall as well as medical inflation could cause the cost of claims to rise in the future. Our loss reserves include assumptions about future payments for settlement of claims and claims handling expenses, such as medical treatments and litigation costs. For our workers' compensation reserves, healthcare wage inflation and medical advancements may also increase the cost of claims. To the extent inflation causes these costs to increase above reserves established for these claims, we will be required to increase our loss reserves with a corresponding reduction in our financial results in the period in which the need for additional reserves is identified.
We purchase reinsurance to mitigate the effect of large losses. Our receivable from reinsurers on unpaid losses and loss adjustment expenses represents our estimate of the amount of our reserve for losses that will be recoverable under our reinsurance programs. We base our estimate of funds recoverable upon our expectation of ultimate losses and the portion of those losses that we estimate to be allocable to reinsurers based upon the terms and conditions of our reinsurance agreements. Given the uncertainty of the ultimate amounts of our losses, our estimates of losses and related amounts recoverable may vary significantly from the eventual outcome. Also, for certain of our reinsurance agreements, we estimate premiums ceded to the reinsurer, subject to certain maximums and minimums, based in part on losses reimbursed or to be reimbursed under the agreement. Due to the size of our reinsurance balances, changes to our estimate of the amount of reinsurance that is due to us could have a material effect on our results of operations in the period for which the change is made.
We use analytical models to assist our decision-making in key areas such as pricing and reserving and may be adversely affected if actual results differ materially from the model outputs and related analyses.
We use various modeling techniques and data analytics to analyze and estimate exposures, loss trends and other risks associated with our assets and liabilities. This includes both proprietary and third-party modeled outputs and related analyses to assist us in decision-making (e.g., underwriting, pricing, claims, reserving, reinsurance and catastrophe risk) and to maintain a competitive advantage. Since there is no industry standard for assumptions and preparation of insured data for use in these models, our modeled losses may not be comparable to estimates made by other companies. The modeled outputs and related analyses from both proprietary and third parties are subject to various assumptions, uncertainties, model design errors and the
inherent limitations of any statistical analysis, including those arising from the use of historical internal and industry data and assumptions. The loss of use of such proprietary models could impact our competitive advantage in certain aspects of our business and impact future financial performance. Changes in the social, judicial or economic environments in which we operate may make modeled outcomes less reliable or produce new, non-modeled risks. In addition, the effectiveness of any model can be degraded by operational risks including, but not limited to, the improper use of the model. Consequently, actual results may differ materially from our modeled results. If actual losses exceed assumptions that were made when our products were priced or our models fail to appropriately estimate the risks we are exposed to, our business, financial condition, results of operations or liquidity may be adversely affected. Furthermore, our results may be adversely affected if actual losses exceed assumptions that were made when pricing products that also include features such as an option to purchase extended reporting endorsement or "tail" coverage, which are offered at rates that are tied to expiring premiums charged. The profitability and financial condition of the Company substantially depends on the extent to which our actual experience is consistent with assumptions we use in our models and ultimate model outputs.
We are exposed to and may face adverse developments involving mass tort claims arising from coverages provided to our insureds.
Establishing reserves for mass tort claims is subject to uncertainties due to many factors, including expanded theories of liability, geographical location and jurisdiction of the lawsuits. Moreover, it is difficult to estimate our ultimate liability for such claims due to evolving judicial interpretations of various tort theories of liability and defense theories, such as federal preemption and joint and several liability, as well as the application of insurance coverage to these claims.
If market conditions cause reinsurance to be more costly or unavailable, we may be required to bear increased risk or reduce the level of our underwriting commitments.
As part of our overall risk and capacity management strategy, we purchase reinsurance for significant amounts of risk underwritten by our insurance subsidiaries. Market conditions beyond our control determine the availability and cost of the reinsurance. We may be unable to maintain current reinsurance coverage or to obtain other reinsurance coverage in adequate amounts and at favorable rates. If we are unable to renew our expiring coverage or to obtain new reinsurance coverage, either our net exposure to risk would increase or, if we are unwilling to bear an increase in net risk exposures, we would need to reduce the amount of our underwritten risk.
Our claims handling could result in a bad faith claim against us.
We have been sued from time to time for allegedly acting in bad faith during our handling of a claim. The damages claimed in actions for bad faith may include amounts owed by the insured in excess of the policy limits as well as consequential and punitive damages. Awards above policy limits are possible whenever a case is taken to trial. These actions have the potential to have a material and adverse effect on our financial condition and results of operations.
If we are unable to maintain a favorable financial strength rating, it may be more difficult for us to write new business or renew our existing business.
Independent rating agencies assess and rate the claims-paying ability and the financial strength of insurers based upon criteria established by the agencies. Periodically AM Best evaluates us to confirm that we continue to meet the criteria of our previously assigned rating. The financial strength ratings assigned by rating agencies to insurance companies represent independent opinions of financial strength and ability to meet policyholder and debt obligations and are not directed toward the protection of equity investors.
Our principal operating subsidiaries hold a favorable claims paying rating with AM Best. Claims-paying ratings are used by agents, brokers and customers as an important means of assessing the financial strength and quality of insurers. If our financial position deteriorates or AM Best significantly changes the rating criteria used to determine the rating, we may not maintain our favorable financial strength rating from this rating agency. A downgrade or involuntary withdrawal of any such rating could limit or prevent us from writing desirable business. See previous discussion under the heading "Rating Agency" for a table presenting the claims paying rating of our principal insurance operations.
In addition to the evaluation of our claims-paying ability, AM Best evaluates and rates our ability to service current and potential debt. This debt rating reflects the agency’s independent evaluation of our ability to meet our obligation to holders of our debt, if any. While this rating may be of greater interest to investors than our claims paying rating, this is not a rating of our equity securities nor a recommendation to buy, hold or sell our equity securities. A rating downgrade could also have a material adverse effect on our liquidity, including the ability to refinance long term debt on favorable terms and potentially limit our access to capital markets. We previously maintained Fitch, S&P and Moody's ratings for the purpose of issuing registered public debt but no longer require or receive public ratings from these rating agencies. See previous discussion under the heading "Rating Agency" for additional information on our debt rating.
Our business could be adversely affected by the loss or consolidation of independent agents, agencies, brokers or brokerage firms.
We heavily depend on the services of independent agents and brokers in the marketing of our insurance products. We face competition from other insurance companies for their services and allegiance. These agents and brokers may choose to direct business to competing insurance companies.
As a member of the Lloyd's market and a participant in open underwriting years in certain Lloyd's Syndicates we are subject to certain risks which could affect us.
Prior to the 2024 and 2022 underwriting years, we participated in the results of Syndicate 1729 and Syndicate 6131, respectively. Lloyd's of London generally operates on a three year accounting system for final distribution of results generated by each underwriting year; however certain underwriting years can remain open after the three year period. The 2021 underwriting year for Syndicate 6131 remained open due to remaining exposures related to aviation coverages in connection with Russia's invasion of Ukraine. At the end of each underwriting year, the liabilities of the Syndicates are reinsured into the Syndicate's following underwriting year. As such, we are still exposed to adverse loss development on certain large claims in open underwriting years in which we participated, primarily catastrophe and aviation related losses. Further, we are obligated to maintain FAL to support those open underwriting years and risk-based capital requirements which are assessed periodically by Lloyd's and subject to variation.
Financial
We cannot guarantee that our reinsurers will pay in a timely fashion or at all, and as a result, we could experience losses.
We transfer part of our risks to reinsurance companies in exchange for part of the premium we receive in connection with the risk. Although our reinsurance agreements make the reinsurer liable to us to the extent the risk is transferred, our liability to our policyholders remains our responsibility. Reinsurers may periodically dispute our demand for reimbursement from them based upon their interpretation of the terms of our agreements or may fail to pay us for financial or other reasons. If reinsurers refuse or fail to pay us or fail to pay on a timely basis, our financial results and/or cash flows could be adversely affected and could have a material effect on our results of operations in the period in which uncollectible amounts are identified.
At December 31, 2024, our receivable from reinsurers on unpaid losses and loss adjustment expenses was $409 million, our receivable from reinsurers on paid losses and loss adjustment expenses was $18 million and our expected credit losses associated with our reinsurance receivables (related to both paid and unpaid losses) were nominal in amount. As of December 31, 2024, no reinsurer, on an individual basis, had an estimated net amount due which exceeded $55 million.
If our businesses do not perform well, we may be required to recognize an impairment of our indefinite lived intangible assets or long-lived assets, which could have a material adverse effect on our results of operations and financial condition.
Indefinite lived intangible assets are evaluated for impairment on an annual basis or upon the occurrence of certain triggering events or substantive changes in circumstances that indicate the asset may be impaired. We review our long-lived assets for impairment when events or changes in circumstances indicate that the carrying value may not be recoverable. If we determine that such assets are impaired, we would be required to write down the asset by the amount of the impairment, with a corresponding charge to net income (loss). Such write downs could have a material adverse effect on our results of operations or financial position.
Our investment results may be impacted by changes in interest rates, U.S. monetary and fiscal policies as well as broader economic conditions.
Changes in interest rates and U.S. fiscal, monetary and trade policies as well as broader economic conditions could have a material adverse effect on our investment results. Fluctuations in the value of our investment portfolio can occur as a result of these changes. Our investment portfolio is primarily comprised of interest-earning assets, marked to fair value each period. Thus, prevailing economic conditions, particularly changes in market interest rates, may significantly affect our results of operations, our financial position and our book value per share. Significant movements in interest rates potentially expose us to lower yields or lower asset values. Changes in market interest rate levels generally affect our financial results to the extent that reinvestment yields are different than the yields on maturing securities. Changes in interest rates also can affect the value of our interest-earning assets, which are principally comprised of fixed and adjustable-rate investment securities. Our equity portfolio is primarily bond funds which will fluctuate directionally with changes in interest rates, not equity markets, impacting the overall value of these holdings. Conversely, the values of fixed-rate investment securities generally fluctuate inversely with changes in interest rates. Since 2022, the significant rise in interest rates has reduced the market value of our existing fixed maturity portfolio impacting our book value per share. While the Federal Reserve recently reduced interest rates in the second half of 2024 and more interest rate cuts are expected in 2025, interest rates remain elevated as compared to current book yields.
As we have both the intent and ability to hold the vast majority of these investments until maturity, we consider this negative impact to be temporary.
Our investments are subject to credit, prepayment and other risks.
At December 31, 2024 our investment portfolio accounts for $4.4 billion or 78% of our total assets. The value of financial instruments in our portfolio can be significantly affected by economic and market factors beyond our control including, among others, the unemployment rate, the strength of the domestic housing market, the price of oil, changes in interest rates and spreads, consumer confidence, investor confidence regarding the economic prospects of the entities in which we invest, corrective or remedial actions taken by the entities in which we invest, including mergers, spin-offs and bankruptcy filings, the actions of the U.S. government and global perceptions regarding the stability of the U.S. economy. Adverse economic and market conditions could cause investment losses or impairment of our securities, which could affect our financial condition, results of operations or cash flows.
At December 31, 2024 approximately 26% of our investment portfolio was invested in mortgage and asset-backed securities. We utilize ratings determined by NRSROs (Moody’s, Standard & Poor’s and Fitch) as an element of our evaluation of the creditworthiness of our securities. The ratings are subject to error by the agencies; therefore, we may be subject to additional credit exposure should the rating be misstated.
Our asset-backed securities are also subject to prepayment risk. A prepayment is the unscheduled return of principal. When rates decline, the propensity for refinancing may increase and the period of time we hold our asset-backed securities may shorten due to prepayments. Prepayments may cause us to reinvest cash proceeds at lower yields than the retired security. Conversely, as rates increase and motivations for prepayments lessen, the period of time over which our asset-backed securities are repaid may lengthen, causing us to not reinvest cash flows at higher available yields.
At December 31, 2024 the fair value of our state/municipal portfolio was $446.6 million (amortized cost basis of $471.0 million). While our state/municipal portfolio had a high credit rating (AA on average), which indicates a strong ability to pay, there is no assurance that there will not be a credit related event which would cause fair values to decline. An economic downturn could lessen tax receipts and other revenues in many states and their municipalities.
In a period of market illiquidity and instability, the fair values of our investments are more difficult to assess, and our assessments may prove to be greater or less than amounts received in actual transactions.
At December 31, 2024 and in accordance with applicable GAAP, we valued 97% of our investments at fair value and the remaining 3% at cost, equity, or cash surrender value. See Notes 1, 2 and 3 of the Notes to Consolidated Financial Statements for additional information.
We determine the fair value of our investments using quoted exchange or over-the-counter prices, when available. At December 31, 2024, we valued approximately 7% of our investments in this manner. When exchange or over-the-counter quotes are not available, we estimate fair values based on broker dealer quotes and various other valuation methodologies, which may require us to choose among various input assumptions and utilize judgment. At December 31, 2024, approximately 85% of our investments were valued in this manner. When markets exhibit significant volatility, there is more risk that we may utilize a quoted market price, broker dealer quote, valuation technique or input assumption that results in a fair value estimate that is either over or understated as compared to actual amounts that would be received upon disposition of the security. At December 31, 2024, approximately 5% of our investments are investment funds which measure fund assets at fair value on a recurring basis and provide us with a NAV for our interest. As a practical expedient, we consider the NAV provided to approximate the fair value of the interest. NAV is provided by the asset managers, and in some cases, estimates are used for valuation and are subject to variations depending on those estimates. Our funds valued at NAV have various redemption requirements and lock-up provisions (see Note 2 of the Notes to Consolidated Financial Statements for further information).
Our ability to issue debt or letters of credit or other types of indebtedness on terms consistent with current debt is subject to market conditions, economic conditions at the time of proposed issuance, result of rating review and the inclusion in certain bond indices of past and future issues. Also, certain of our current debt agreements include financial covenants, and the issuance of debt by one of our insurance subsidiaries requires regulatory approval, both of which may limit or prohibit the issuance of additional debt.
Our Revolving Credit Agreement, which expires in April 2028, permits borrowings of up to $300 million and includes an additional $125 million delayed draw term loan ("Term Loan"). The agreement requires that our consolidated debt to capital ratio (0.26 to 1.0 at December 31, 2024) be 0.35 to 1.0 or less and that we maintain a minimum net worth, excluding AOCI, of at least $912 million which represented 65% of consolidated shareholders' equity, excluding AOCI, determined as of December 31, 2022.
Our outstanding debt at December 31, 2024 includes a Revolving Credit Agreement, Term Loan and Contribution Certificates. See Note 10 of the Notes to Consolidated Financial Statements for additional information. There is no guarantee
that additional debt could be issued on similar terms in the future as rates available to us may change due to changes in the economic climate, or shifts in the yield curve may occur, or an increase in our level of debt may result in rating agencies lowering our debt rating.
Our outstanding debt is exposed to fluctuations in interest rates, which could adversely impact our results. We utilize cash flow hedge instruments to mitigate this risk, however our hedge instruments could be ineffective.
We utilize derivative instruments as part of our risk management strategy to reduce the market risk related to fluctuations in future interest rates associated with a portion of our variable-rate debt. To manage our exposure to variability in cash flows of forecasted interest payments attributable to variability in the selected base rates on borrowings under both the Revolving Credit Agreement and Term Loan, ProAssurance entered into two forward-starting interest rate swap agreements on May 2, 2023, each with an effective date of December 29, 2023 and maturity date of March 31, 2028. See Note 11 of the Notes to Consolidated Financial Statements for additional information.
Our interest rate swaps are designated and qualify as highly effective cash flow hedges. However, there is a possibility that our cash flow hedge instruments may be ineffective. The effectiveness of our cash flow hedges depends on our ability to execute interest renewal terms that mirror the previously contracted swap agreements. If our exposure to interest rate fluctuations exceeds what we are able to hedge against, we could incur significant losses. We assess the effectiveness of our hedge instruments quarterly.
We are exposed to fluctuations in foreign currency exchange rates, which could have an adverse effect on our results of operations and financial condition.
Fluctuations in foreign currency exchange rate changes primarily relate to foreign currency denominated available-for-sale fixed maturities and loss reserves associated with our strategic partnership with an international medical professional liability insurer. Our participation in this program has grown in recent years which has led to greater volatility in our results of operations even with nominal movements in exchange rates given the size of the reserve. We mitigate foreign exchange exposure and manage market risks that arise in the normal course of business by generally matching the currency and duration of associated investments to the corresponding loss reserves as well as utilizing foreign currency forward contracts. There is no guarantee that these mitigation efforts will be effective due to factors such as volatility, currency variations and timing of foreign currency cash flows which could result in significant losses incurred.
Our provision for income taxes, our recorded tax liabilities and net deferred tax assets, including any valuation allowances, are recorded based on estimates and actual tax amounts may be different than we have estimated, both with regard to amounts recognized and the timing of recognition. Such differences could affect our results of operations or cash flows.
Our provision for income taxes, our recorded tax liabilities and net deferred tax assets, including any valuation allowances, are recorded based on estimates. These estimates require us to make significant judgments regarding a number of factors, including, among others, the applicability of various federal and state laws, the interpretations given to those tax laws by taxing authorities, courts and the Company, the timing of future income and deductions, our tax planning strategies and our expected levels and sources of future taxable income. Projections about our future operations and taxable income are inherently subject to significant risks, assumptions, estimates and uncertainties and may therefore differ materially from our actual financial results, which could have a material adverse effect on our tax positions. We believe our tax positions, except for our uncertain tax positions, are supportable under current tax laws and that our estimates are prepared in accordance with GAAP. Resolution of uncertain tax positions could result in an actual tax benefit or deduction that is different than we have estimated. Additionally, from time to time, due to changes in economic and/or political conditions, there are changes in tax laws and interpretations of tax laws which could significantly change our estimates of the amount of tax benefits or deductions expected to be available to us in future periods. Changes to our prior estimates in these cases would be reflected in the period changed and could have a material effect on our effective tax rate, financial position, results of operations and cash flows. As the Company has reinsurance operations domiciled in the Cayman Islands, changes in the tax laws of the Cayman Islands as well as the change in U.S. federal tax law as a result of the TCJA regarding outbound cross border affiliate reinsurance could result in the loss of profitability of that business.
We are subject to U.S. federal and various state income taxes as well as U.K. related taxes. We are periodically under examination by federal, state and local authorities regarding income tax matters, and our tax positions could be successfully challenged; the costs of defending our tax positions could be considerable. Our estimate of our potential liability for known uncertain tax positions is reflected in our financial statements. As of December 31, 2024 we had a net deferred tax asset of approximately $163.9 million and a net federal income tax payable of approximately $1.0 million, which included a nominal liability for unrecognized current tax benefits.
Regulatory and Compliance
Changes due to financial reform legislation could have a material effect on our operations.
The U.S. federal government generally has not directly regulated the insurance industry except for certain areas of the market, such as insurance for flood, nuclear and terrorism risks. However, the federal government has undertaken initiatives or considered legislation in several areas that may affect the insurance industry. The Dodd-Frank Act was enacted in July 2010 and established additional regulatory oversight of financial institutions (see previous discussion under the heading "Insurance Regulatory Matters"). Our business could be affected by changes to the U.S. system of insurance regulation including legislative or regulatory requirements imposed by or promulgated in connection with the Dodd-Frank Act.
The passage of tort reform or other legislation, and the subsequent review of such laws by the courts, could have a material impact on our operations.
Tort reforms generally protect the rights of a defendant by, among other limitations, eliminating certain claims that may be heard in a court, limiting the amount or types of damages, changing statutes of limitation or the period of time to make a claim, and limiting venue or court selection. A number of states in which we do business previously enacted tort reform legislation in an effort to reduce escalating loss trends.
Challenges to tort reform have been undertaken in most states where tort reforms have been enacted, and in some states the reforms have been fully or partially overturned. Additional challenges to tort reform may be undertaken. We cannot predict with any certainty how state appellate courts will rule on these laws. While the effects of tort reform have been generally beneficial to our business in states where these laws have been enacted, there can be no assurance that such reforms will be ultimately upheld by the courts. Furthermore, if tort reforms are effective, the business of providing professional liability insurance may become more attractive, thereby causing an increase in competition. In addition, the enactment of tort reforms could be accompanied by legislation or regulatory actions that may be detrimental to our business because of expected benefits which may or may not be realized. These expectations could result in regulatory or legislative action limiting the ability of professional liability insurers to maintain rates at adequate levels.
Coverage mandates or other expanded insurance requirements could also be imposed. States may also consider state-sponsored insurance entities that could remove our potential insureds from the private insurance market.
In 1975, California enacted MICRA which, among other things, established a $250,000 cap on non-economic damages in medical cases. In May 2022, California's Governor signed an amendment to MICRA which substantially changed many aspects of MICRA, including, but not limited to, an increase in the cap on non-economic damages and an increase in caps on attorney's fees. For a non-death case, the cap increased from $250,000 to $350,000 on January 1, 2023, with an incremental increase over the next 10 years to $750,000. For a wrongful death case, the cap increased from $250,000 to $500,000 on January 1, 2023, with an incremental increase over the next 10 years to $1.0 million. After the caps reach $750,000/$1.0 million in 2033, they will increase by 2% per annum thereafter effective January 1, 2034. These increases could have a material adverse effect on our financial condition, results of operations and cash flows given our concentration in California.
On August 25, 2022 the Supreme Court of Pennsylvania invalidated a statutory provision that required medical liability claims to be filed in the county where the alleged malpractice occurred. Effective January 1, 2023, Pennsylvania healthcare providers can be sued in any county where they regularly conduct business or have significant contacts, regardless of where the actual care took place. To the extent that this change in law results in adjudication of more claims in venues favorable to plaintiffs, our loss costs may increase due to higher jury verdicts, larger settlement payments, and more non-meritorious claims.
We continue to monitor developments on a state-by-state basis and make business decisions accordingly.
Regulatory requirements or changes to regulatory requirements could have a material effect on our operations.
Our insurance businesses are subject to extensive regulation by state insurance authorities in each state in which they operate. Regulation is intended for the benefit of policyholders rather than shareholders. In addition to the amount of dividends and other payments that can be made to a holding company by insurance subsidiaries, these regulatory authorities have broad administrative and supervisory power relating to:
•licensing requirements;
•trade practices;
•capital and surplus requirements;
•investment practices; and
•rates charged to insurance customers.
These regulations may impede or impose burdensome conditions on rate changes or other actions that we may desire to take in order to benefit our results of operations. In addition, we may incur significant costs in the course of complying with regulatory requirements. Most states also regulate insurance holding companies like us in a variety of matters such as
acquisitions, solvency and risk assessment, changes of control and the terms of affiliated transactions. In addition, rules and regulations have recently been introduced in the area of information security, which may also affect our business (see further discussion that follows in Item 1C "Cybersecurity").
Also, certain states sponsor insurance entities which affect the amount and type of liability coverages purchased in the sponsoring state. Changes to the number of state sponsored entities of this type could result in a large number of insureds changing the amount and type of coverage purchased from private insurance entities such as ProAssurance.
We own two subsidiaries domiciled in the Cayman Islands and subject to the laws of the Cayman Islands and regulations promulgated by the CIMA. Failure to comply with these laws, regulations and requirements could result in consequences ranging from a regulatory examination to a regulatory takeover of our Cayman Islands subsidiaries, which could potentially impact profitability of alternative market solutions offered through these subsidiaries.
Given the current uncertainty surrounding Environmental, Social and Governance and other similar environmental and public policy matters, we cannot predict whether there will be legislation and regulation that will ultimately affect our financial condition, operating performance and ability to compete.
The degree to which the SEC or other regulatory bodies may require climate change disclosures or other ESG-related measures is currently uncertain. As a result, we cannot fully assess the risk associated with the time, expense and business impact of compliance with ESG related matters at this time, and we will closely monitor developments and changes in this area. Aside from federal regulatory requirements, state regulators, investors, policyholders and other stakeholders may continue to focus on ESG matters. In October 2024, the Governor of California signed a bill requiring certain climate-related disclosures for certain companies that do business in California, with initial disclosures to begin in 2026. Compliance with the California law or other similar requirements for disclosures related to climate change and other environmental issues would be burdensome and costly.
The assessments that we are required to pay to state associations may increase or our participation in mandatory risk retention pools could be expanded and our results of operations and financial condition could suffer as a result.
Each state in which we operate has separate insurance guaranty fund laws requiring admitted property and casualty insurance companies doing business within their respective jurisdictions to be members of their guaranty associations. These associations are organized to pay covered claims (as defined and limited by the various guaranty association statutes) under insurance policies issued by insurance companies that have become insolvent. Most guaranty association laws enable the associations to make assessments against member insurers to obtain funds to pay covered claims after a member insurer becomes insolvent. These associations levy assessments (up to prescribed limits) on all member insurers in a particular state on the basis of the proportionate share of the premiums written by member insurers in the covered lines of business in that state. Maximum assessments generally vary between 1% and 2% of annual premiums written by a member in that state. Some states permit member insurers to recover assessments paid through surcharges on policyholders or through full or partial premium tax offsets, while other states permit recovery of assessments through the rate filing process. We had no significant guaranty fund recoupments or assessments in 2024, 2023 or 2022. Our practice is to accrue for insurance insolvencies when notified of assessments. We are not able to reasonably estimate assessments or develop a meaningful range of possible assessments prior to notice because the guaranty funds do not provide sufficient information for development of such estimates or ranges.
Certain states in which we write workers’ compensation insurance have established administrative and/or second injury funds that levy assessments against insurers that write business in their state. The assessments are generally based on an insurer’s proportionate share of premiums or losses in a particular state, and the assessment rate can vary from year to year.
Risk pooling mechanisms have been established in certain states that offer insurance coverage to individuals or entities who are otherwise unable to purchase coverage from private insurers. Authorized property and casualty insurers in these states are generally required to share in the underwriting results of these pooled risks, which are typically adverse. Should our mandatory participation in such pools be increased or if the assessments from such pools increased, our results of operations and financial condition would be negatively affected, although that was not the case in 2024, 2023 or 2022.
Provisions in our charter documents, Delaware law and state insurance law may impede attempts to replace or remove management or may impede a takeover, which could adversely affect the value of our common stock.
Our certificate of incorporation, bylaws and Delaware law contain provisions that may have the effect of inhibiting a non-negotiated merger or other business combination. As of December 31, 2024, we currently have no preferred stock outstanding. In addition, our Corporate Governance Principles provide that the Board, subject to its fiduciary duties, will not issue any series of preferred stock for any defense or anti-takeover purpose, for the purpose of implementing any stockholders rights plan, or with features intended to make any acquisition more difficult or costly without obtaining stockholder approval. However, because the rights and preferences of any series of preferred stock may be set by the Board in its sole discretion, the rights and
preferences of any such preferred stock may be superior to those of our common stock and thus may adversely affect the rights of the holders of common stock.
The voting structure of common stock and other provisions of our certificate of incorporation are intended to encourage a person interested in acquiring us to negotiate with and to obtain the approval of the Board in connection with a transaction. However, certain of these provisions may discourage our future acquisition, including an acquisition in which stockholders might otherwise receive a premium for their shares. As a result, stockholders who might desire to participate in such a transaction may not have the opportunity to do so.
In addition, state insurance laws provide that no person or entity may directly or indirectly acquire control of an insurance company unless that person or entity has received approval from the insurance regulator. An acquisition of control of ProAssurance would be presumed if any person or entity acquires 10% (5% in Alabama) or more of our outstanding common stock, unless the applicable insurance regulator determines otherwise. These provisions apply even if the offer may be considered beneficial by stockholders.
We are subject to numerous NYSE and SEC regulations including insider trading regulations, Regulation FD and regulations requiring timely and accurate reporting of our operating results as well as certain events and transactions. Noncompliance with these regulations could subject us to enforcement actions by the NYSE or the SEC and could affect the value of our shares and our ability to raise additional capital.
The Company carefully adheres to NYSE and SEC requirements as the loss of trading privileges on the NYSE or an SEC enforcement action could have a significant financial impact on the Company. Failure to comply with various SEC reporting and record keeping requirements could result in a decline in the value of our stock or a decline in investor confidence which could directly impact our ability to efficiently raise capital. Failure to adhere to NYSE requirements, including the recent requirement around recovery of erroneously awarded compensation, could result in fines, trading restrictions or delisting. In addition, we may incur significant costs in the course of complying with NYSE and SEC requirements.
Operational
Our performance is dependent on the business, economic, regulatory and legislative conditions of states where we have a significant amount of business.
Our top five states, Pennsylvania, California, Alabama, Florida, and Texas represented 45% of our direct premiums written for the year ended December 31, 2024. Moreover, on a combined basis, Pennsylvania, California and Alabama accounted for 34% of our direct premiums written for the year ended December 31, 2024. Unfavorable business, economic or regulatory conditions in any of these states could have a disproportionately greater effect on us than they would if we were less geographically concentrated.
From time to time, we may identify opportunities for growth through acquisitions. However, approval of acquisitions may not be granted or conditions of approval may adversely alter the expected value and benefits of the acquisition. In addition, expected benefits from acquisitions may not be achieved or may be delayed longer than expected.
Growth through the acquisition of other companies or books of business is opportunistic and sporadic. If we are able to identify a target for acquisition, state insurance regulation concerning change or acquisition of control could delay or prevent us from completing the acquisition. State insurance regulatory codes provide that the acquisition of “control” of a domestic insurer or of any person that directly or indirectly controls a domestic insurer cannot be consummated without the prior approval of the domiciliary insurance regulator. There is no assurance that we will receive such approval from the respective insurance regulator or that such approvals will not be conditioned in a manner that materially and adversely affects the aggregate economic value and business benefits expected to be obtained and cause us to not complete the acquisition.
The Company performs thorough due diligence before agreeing to a merger or acquisition; however, there is no guarantee that the procedures we perform will adequately identify all potential weaknesses or liabilities of the target company or potential risks to the consolidated entity.
There is also no guarantee that businesses acquired in the future will be successfully integrated into our business and therefore we may not be able to achieve expected synergies. Ineffective integration of our businesses and processes may result in substantial costs or delays and adversely affect our ability to compete. The process of integrating an acquired company or business can be complex and costly and may create unforeseen operating difficulties including the ineffective integration of underwriting, risk management, claims handling, finance, information technology and actuarial practices and the design and operation of internal controls over financial reporting. Difficulties integrating an acquired business may also result in the acquired business performing differently than we expected including the loss of customers or in our failure to realize anticipated growth or expense-related efficiencies. We could be adversely affected by the acquisition due to unanticipated performance issues and additional expense, unforeseen or adverse changes in liabilities, including liabilities arising from events prior to the
acquisition or that were unknown to us at the time of the acquisition, transaction-related charges, diversion of management time and resources to integration challenges, loss of key team members, regulatory requirements, exposure to tax liabilities, exposure to pension liabilities, amortization of expenses related to intangibles, and charges for impairment of assets or goodwill.
Furthermore, claims may be asserted by either the policyholders or shareholders of any acquired entity related to payments or other issues associated with the acquisition and merger into the consolidated entity. Such claims may prove costly or difficult to resolve or may have unanticipated consequences.
We are a holding company and are dependent on dividends and other payments from our operating subsidiaries, which may be subject to dividend restrictions.
We are a holding company whose principal source of external revenue is our investment revenues. In addition, cash dividends and other permitted payments from operating subsidiaries represent another source of funds. If our operating subsidiaries are unable to make payments to us, or are able to pay only limited amounts, we may be unable to make payments on our indebtedness, meet other holding company financial obligations, or pay dividends to shareholders. The payment of dividends by these operating subsidiaries is subject to restrictions set forth in the insurance laws and regulations of their respective states of domicile, as discussed in Item I under the heading "Insurance Regulatory Matters."
A natural disaster or pandemic event, or closely related series of events, could cause loss of lives or a substantial loss of property or operational ability at one or more of the Company's facilities.
Our disaster preparedness encompasses our Business Continuity Plan, Disaster Recovery Plan, Operations Plan and Pandemic Response Plan. Our disaster preparedness is focused on maintaining the continuity of our data processing and telephone capabilities in the event of a natural disaster or medical event. Our disaster preparedness relies on team members working remotely in the event of a natural disaster or medical event. Our plans are reviewed during the insurance department examinations of the statutory insurance companies. While we have plans in place to respond to both short- and long-term disaster scenarios, the loss of certain key operating facilities or data processing capabilities could have a significant impact on our operations.
Our business could be affected by the loss of one or more of our senior executives or other qualified personnel.
We are heavily dependent upon our senior management, and the loss of services of our senior executives could adversely affect our business. Our success has been, and will continue to be, dependent on our ability to retain the services of existing key team members and to attract and retain additional qualified personnel in the future. The loss of the services of key team members or senior managers, or the inability to identify, hire and retain other highly qualified personnel in the future, could adversely affect the quality and profitability of our business operations. Our Board regularly reviews succession planning relating to our Chief Executive Officer as well as other senior officers.
If we fail to maintain proper and effective internal controls over financial reporting, our operating results and our ability to operate our business could be harmed.
We continually enhance our operating procedures and internal controls to effectively support our operations and comply with our regulatory and financial reporting requirements. As a result of the inherent limitations in all control systems, no system of controls can provide absolute assurance that all control objectives have been or will be met, and that instances of fraud, if any, within the Company have been detected. These inherent limitations include the realities that judgments in decision-making can be faulty and that breakdowns can occur because of an error or mistake. Additionally, controls can be circumvented by the unauthorized and wrongful individual acts of some persons or by collusion of two or more persons. The design of any system of controls is based in part upon certain assumptions about the likelihood of future events and there can be no assurance that any design will succeed in achieving its stated goals under all potential future conditions. Over time, controls may become inadequate because of changes in conditions or the degree of compliance with policies or procedures may deteriorate. Further, the design of a control system must reflect the fact that resource constraints exist. Accordingly, our control system can provide only reasonable, not absolute, assurance of achieving the desired control objectives.
Technology, Data Security and Privacy
The operations of the Company are dependent upon the security, integrity and availability of our internal technology infrastructure and that of certain third parties including, but not limited to, the use of cloud-based technology. Any significant disruption of these infrastructures could result in unauthorized access to Company data, reduce our ability to conduct business effectively, or cause economic harm to the Company in the form of lost time, lost business opportunity, actual monetary loss or loss of investor confidence.
The Company is dependent upon its technology infrastructure and that of certain third parties to operate and report financial and other Company information accurately and timely. ProAssurance collects, uses, stores or transmits an increasingly
large amount of confidential, proprietary, personal, legally protected, and other information in connection with the operation of our business. Certain third parties or vendors access, process or store data that the Company considers to be sensitive, significant, or legally protected. Therefore, the Company has focused resources on securing and preserving the integrity of its data processing systems and related data (see further discussion that follows in Item 1C "Cybersecurity"). Despite the Company's efforts to ensure the integrity of its systems and those of certain third parties, ProAssurance is increasingly exposed to the risk that its technology infrastructure and that of certain third parties could be subject to cyber-attacks and unauthorized access, such as physical and electronic break-ins or unauthorized tampering. Furthermore, it is impossible to defend against every risk being posed by changing technologies. There is no guarantee that measures taken to date will completely prevent possible disruption, damage or destruction by intentional or unintentional acts or events such as cyber-attacks, viruses, sabotage, human error, system failure or the occurrence of numerous other human or natural events. A breach of IT systems operated by a vendor, customer, or other third-party with whom we conduct business could result in a breach of the Company's data belonging to a third-party for which the Company is responsible, or financial harm in the form of misdirection of payments for valid invoices or other obligations.
Disruption, damage or destruction of any of the Company's systems or data could cause its normal operations to be disrupted, or unauthorized internal or external knowledge or misuse of confidential Company data could occur, all of which could be harmful to the Company from a financial, legal and reputational perspective. Further, delays or difficulties in implementing or integrating new systems or enhancing current systems could cause our normal operations to be disrupted.
In addition, we have migrated certain technology processes and infrastructure to the cloud and, as such, are dependent on cloud-based technology provided by third-parties for certain key aspects of our business and operations. Any disruption of or interference with our use of cloud-based technology could have a material adverse impact on our business and operations.
The development and use of artificial intelligence presents risks and challenges that can impact our business including, but not limited to, posing security risks to our confidential information, proprietary information, and personal data and could damage our reputation or otherwise materially harm our business.
We develop and incorporate artificial intelligence technology in certain of our processes and plan to develop and incorporate additional artificial intelligence technology in future processes. In the fourth quarter of 2024, we introduced tools that will help us address the challenging market conditions by using artificial intelligence along with underwriting and claims data analytics to enhance underwriting profitability, productivity and efficiency. We entered into an agreement with a leading provider of artificial intelligence technology for insurance claims optimization, to enhance medical outcomes for injured workers, improve our case reserve estimation capabilities and lighten the administrative burdens for our claims professionals. We intend to leverage this platform beginning in 2025 to address various aspects of escalating medical costs, including their medical document intelligence platform that helps direct care to the best-performing providers, and their tool to help identify high-severity claims early in the claims’ life cycle. Issues in the development and use of artificial intelligence, including machine learning, generative artificial intelligence tools and large language models may result in reputational harm, liability, security threats or other adverse consequences to our business operations as well as to certain of our insureds. In addition, our vendors may incorporate generative artificial intelligence tools into their offerings without disclosing this use to us, and the providers of these generative artificial intelligence tools may not meet existing or rapidly evolving regulatory or industry standards with respect to privacy and data protection and may inhibit our vendors’ ability to maintain an adequate level of service and experience.
If we, our vendors, or our third-party partners experience an actual or perceived breach of privacy or security incident related to the use of artificial intelligence, we may lose valuable intellectual property and confidential information and our reputation and the public perception of the effectiveness of our security measures could be harmed. Further, bad actors around the world use increasingly sophisticated methods, including the use of artificial intelligence, to engage in illegal activities involving the theft and misuse of personal information, confidential information and intellectual property. If any of these events were to occur, it could have a material, adverse effect on our business and reputation.
| | | | | |
| ITEM 1B. | UNRESOLVED STAFF COMMENTS. |
None.
Risk Management & Strategy
As previously discussed under the section titled "Enterprise Risk Management", through our ERM program we have a risk management framework that recognizes the risks inherent in our operating segments as well as the risks associated with the operations of our holding company. This process includes assessing, identifying and managing material risks related to cybersecurity.
ProAssurance's Information Systems Security department, with assistance from third-party security vendors, continually monitors the Company's systems for indicators of attack or compromise to mitigate the risk of cyberattacks. The Company regularly enhances its cyber and information security in order to identify and neutralize emerging threats and improve its ability to prevent, detect and respond to attempts to gain unauthorized access to the Company's data and systems. ProAssurance regularly adds additional security measures to its computer systems and network infrastructure to mitigate the possibility of cybersecurity breaches, including firewalls and penetration testing. The Company encrypts sensitive information and data and utilizes stringent access controls. Team members are required to complete quarterly security training which encompasses a wide range of cybersecurity topics. This training informs all team members of the processes and procedures to follow in the case they encounter a possible cybersecurity threat. This training is reinforced through periodic simulated phishing tests. Further, all team members are required to read and acknowledge the Company's guidelines for the use of publicly available generative artificial intelligence tools. The Company's guidelines explain how to protect the Company from risks that can arise if legally protected, proprietary or confidential information is shared with these tools.
The Company also evaluates the integrity and security of the technology infrastructure of certain third parties that access, process or store data that the Company considers to be sensitive, significant or legally protected. ProAssurance reviews and assesses its third-party providers' cybersecurity controls, as appropriate, and makes changes to the Company's business processes to manage these risks.
Governance
While our Board is responsible for ensuring that our entire ERM process is in place and functioning, our Audit Committee has the primary oversight responsibility for risks relating to cybersecurity. Our Vice President of Information Security regularly attends and presents to our Audit Committee on material cybersecurity risks and mitigating procedures. Our Vice President of Information Security oversees ProAssurance's information security and data privacy programs and is responsible for establishing and implementing our security strategy alongside our General Counsel, to whom the Vice President of Information Security reports directly. Our Vice President of Information Security has been with ProAssurance since 1998 and has over 26 years of IT and cybersecurity experience.
The Company has a formal process in place for identifying, handling and disclosing of material cybersecurity incidents. The Company's Security Oversight Committee includes our Chief Financial Officer, General Counsel, Vice President of Information Security and representatives from our Internal Audit, Legal, Compliance and Information Systems departments. The purpose of the SOC is to develop and review the Information Security policies, standards and guidelines for the Company that manage Cyber Risk. Furthermore, the Company's Code of Ethics and Conduct explicitly prohibits officers, directors, team members or other insiders who are subject to the Code from transacting in the Company's stock during a time when such individuals have knowledge of any material undisclosed cybersecurity incident or breach.
Effective July 26, 2023, the SEC finalized rules requiring registrants to disclose material cybersecurity incidents. Per the ruling, any cybersecurity incident deemed to be material shall be disclosed within four business days of materiality determination. The determination of materiality related to cybersecurity incidents is subjective, however, the Company has implemented materiality consideration in its formal process.
All possible cybersecurity incidents are reported to our General Counsel for consideration of materiality. Our General Counsel escalates consideration of materiality to our Chief Executive Officer, Chief Financial Officer and other corporate officers as appropriate. The Company does not utilize any third-party service providers for consideration of materiality for cybersecurity incidents. Upon determination that the Company has experienced a material cybersecurity incident, the Company will disclose the incident within four business days as required by regulation. Our Board will also be notified of any material cybersecurity incidents immediately upon determination of materiality.
To date, no risks from cybersecurity threats, including as a result of any previous cybersecurity incidents, have materially affected or are reasonably likely to materially affect the Company. Please refer to Item 1A, Risk Factors under the heading "Technology, Data Security and Privacy" for additional information on our cybersecurity threats.
We own three office properties, all of which are unencumbered:
| | | | | | | | | | | | | | | | | | | | |
| | | Square Footage of Properties |
| Property Location | | Occupied by
ProAssurance | | Leased or Available
for Lease | | Total |
Birmingham, AL(1) | | 120,000 | | | 45,000 | | | 165,000 | |
Franklin, TN (2) | | 25,000 | | | 78,000 | | | 103,000 | |
| Okemos, MI | | 53,000 | | | — | | | 53,000 | |
(1) Corporate Headquarters | | | | | | |
(2) In January 2025, ProAssurance accepted an offer for the sale of the Franklin, TN property to a third-party for approximately $19.5 million. The sale is expected to close during March 2025. |
| | | | | | |
| | | | | |
| ITEM 3. | LEGAL PROCEEDINGS. |
Our insurance subsidiaries are involved in various legal actions, a substantial number of which arise from claims made under insurance policies. While the outcome of all legal actions is not presently determinable, management and its legal counsel are of the opinion that these actions will not have a material adverse effect on our financial position or results of operations. See Note 8 of the Notes to Consolidated Financial Statements included herein.
INFORMATION ABOUT OUR EXECUTIVE OFFICERS
The executive officers of ProAssurance Corporation serve at the pleasure of the Board. We have a knowledgeable and experienced management team with established track records in building and managing successful insurance operations. Following is a brief description of each executive officer of ProAssurance, including their principal occupation, and relevant background with ProAssurance and former employers.
| | | | | | | | |
| Edward L. Rand, Jr. | | Mr. Rand was appointed as our Chief Executive Officer in 2019 and has served as President since 2018. Mr. Rand previously served as Chief Operating Officer, Chief Financial Officer, Executive Vice President and Senior Vice President since joining ProAssurance in 2004. Mr. Rand also has previously served as President of our Medmarc subsidiary from 2016 to 2018. Prior to joining ProAssurance, Mr. Rand was Chief Accounting Officer and Head of Corporate Finance for PartnerRe Ltd. Prior to that time, Mr. Rand served as the Chief Financial Officer of Atlantic American Corporation. (Age 58) |
| | |
| Noreen L. Dishart | | Ms. Dishart was appointed as an Executive Vice President in 2020 and has served as our Chief Human Resources Officer since 2015. Ms. Dishart has previously served as Vice President of Human Resources of our Eastern subsidiary for 9 years. Ms. Dishart has over 39 years of experience in Human Resources including positions with Johnson & Johnson/Merck. (Age 61) |
| | |
| Robert D. Francis | | Mr. Francis was appointed President of Medical Professional Liability and to the Executive Leadership Team in 2023. Mr. Francis began his career in medical professional liability insurance at Mutual Assurance Society of Alabama in 1984 and worked for predecessors of ProAssurance until 2004, serving as Chief Underwriting Officer and Chief Operating Officer of the Southern Division. Prior to rejoining ProAssurance, Mr. Francis was Chief Operating Officer of The Doctor’s Company. (Age 62) |
| | |
| Dana S. Hendricks | | Ms. Hendricks was appointed as an Executive Vice President in 2018 and is also our Chief Financial Officer and Corporate Treasurer. Ms. Hendricks has previously served as Senior Vice President of Business Operations for our PICA subsidiary. Prior to that time, Ms. Hendricks served PICA as Vice President of Finance and Corporate Controller. Prior to joining PICA in 2001, Ms. Hendricks held various finance and data analysis positions with American General Life & Accident Insurance Company. (Age 57) |
| | |
| Jeffrey P. Lisenby | | Mr. Lisenby was appointed as an Executive Vice President in 2014 and is also our General Counsel, Corporate Secretary and head of the corporate Legal Department. Mr. Lisenby has previously served as Senior Vice President. Prior to joining ProAssurance, Mr. Lisenby practiced law privately in Birmingham, Alabama. Mr. Lisenby is a member of the Alabama State Bar and the United States Supreme Court Bar and is a Chartered Property Casualty Underwriter. (Age 56) |
| | |
| | | | | | | | |
| Karen M. Murphy | | Ms. Murphy was appointed President of Life Sciences and to the Executive Leadership team in 2023. Ms. Murphy previously served as General Counsel of Medmarc where she oversaw the legal, regulatory compliance and human resources functions and functioned as Corporate Secretary. Ms. Murphy is licensed to practice law in the State of New York and holds a Corporate Counsel license in the Commonwealth of Virginia. (Age 60) |
| | |
| Kevin M. Shook | | Mr. Shook was appointed as President of our Eastern subsidiary in 2019. Mr. Shook previously served as Executive Vice President of our Eastern subsidiary and has been with Eastern for 21 years. Mr. Shook has over 31 years of insurance industry experience, including 10 years with PricewaterhouseCoopers where he primarily served companies within the insurance industry. (Age 55) |
| | |
| | |
We have adopted a Code of Ethics and Conduct that applies to our directors and executive officers, including but not limited to our principal executive officer and principal financial officer. We also have share ownership guidelines in place to ensure that management maintains a significant portion of their personal investments in the stock of ProAssurance. Both our Code of Ethics and Conduct and our Share Ownership Guidelines are available on the Corporate Information section of our website. Printed copies of these documents may be obtained from our Investor Relations department by email at InvestorRelations@ProAssurance.com, by mail at P.O. Box 590009, Birmingham, Alabama 35259-0009, or by telephone at (205) 776-3028 or (800) 282-6242.
ITEM 4. MINE SAFETY DISCLOSURES.
Not applicable.
PART II
ITEM 5. MARKET FOR REGISTRANT’S COMMON EQUITY, RELATED STOCKHOLDER MATTERS AND ISSUER PURCHASES OF EQUITY SECURITIES.
At February 20, 2025, ProAssurance Corporation had 3,767 stockholders of record and 51,156,821 shares of common stock outstanding. ProAssurance’s common stock currently trades on the NYSE under the symbol “PRA.”
For information regarding dividends paid to shareholders in 2023 see Note 12 of the Notes to Consolidated Financial Statements.
ProAssurance’s insurance subsidiaries are subject to restrictions on the payment of dividends to the parent. Information regarding restrictions on the ability of the insurance subsidiaries to pay dividends is incorporated herein by reference from the paragraphs under the heading “Insurance Regulatory Matters–Regulation of Dividends and Other Payments from Our Operating Subsidiaries” in Item 1 of this Form 10-K.
Securities Authorized for Issuance Under Equity Compensation Plans
The following table provides information regarding ProAssurance’s equity compensation plans as of December 31, 2024.
| | | | | | | | | | | | | | | | | | | | |
| Plan Category | | Number of securities to be
issued upon exercise of
outstanding options, warrants
and rights | | Weighted-average
exercise price of
outstanding options,
warrants and rights | | Number of securities
remaining available
for future issuance
under equity compensation
plans (excluding securities reflected
in column (a)) |
| | | (a) | | (b) | | (c) |
| Equity compensation plans approved by security holders | | 1,577,413 | | $— | * | 1,668,466 |
| Equity compensation plans not approved by security holders | | — | | — | | — |
* No outstanding options as of December 31, 2024. Other outstanding share units have no exercise price.
Issuer Purchases of Equity Securities
| | | | | | | | | | | | | | | | | | | | | | | | | | |
| Period | | Total Number of
Shares Purchased | | Average
Price Paid
per Share | | Total Number of Shares Purchased as Part of Publicly Announced Plans or Programs | | Approximate Dollar Value of Shares that May Yet Be Purchased Under the Plans or Programs* (In thousands) |
| October 1 - October 31, 2024 | | — | | N/A | | — | | $55,902 |
| November 1 - November 30, 2024 | | — | | N/A | | — | | $55,902 |
| December 1 - December 31, 2024 | | — | | N/A | | — | | $55,902 |
| Total | | — | | $— | | — | | |
* Under its current plan begun in November 2010, the Board has authorized $600 million for the repurchase of common shares or the retirement of outstanding debt. This is ProAssurance's only plan for the repurchase of common shares, and the plan has no expiration date.
ITEM 7. MANAGEMENT’S DISCUSSION AND ANALYSIS OF FINANCIAL CONDITION AND RESULTS OF OPERATIONS.
The following discussion generally focuses on the change in financial condition, results of operations and cash flows for the year ended December 31, 2024 as compared to the year ended December 31, 2023 and should be read in conjunction with the Consolidated Financial Statements and Notes to those statements which accompany this report. For a full discussion of the changes in the financial condition, results of operations and cash flows for the year ended December 31, 2023 as compared to the year ended December 31, 2022, please refer to Item 7, "Management's Discussion and Analysis of Financial Condition and Results of Operations" section of ProAssurance's December 31, 2023 report on Form 10-K.
Throughout the discussion we use certain terms and abbreviations, which can be found in the Glossary of Terms and Acronyms at the beginning of this report. In addition, a glossary of insurance terms and phrases is available on the investor section of our website. Throughout the discussion, references to "ProAssurance," "ProAssurance Group," "PRA," "Company," "organization," "we," "us" and "our" refer to ProAssurance Corporation and its consolidated subsidiaries. The discussion contains certain forward-looking information that involves significant risks, assumptions and uncertainties. As discussed under the heading "Caution Regarding Forward-Looking Statements," our actual financial condition and results of operations could differ significantly from these forward-looking statements.
ProAssurance Overview
ProAssurance Corporation is a holding company for property and casualty insurance companies. Our insurance subsidiaries provide medical professional liability insurance, liability insurance for medical technology and life sciences risks and workers' compensation insurance.
We operate in four segments which are based on our internal management reporting structure for which financial results are regularly evaluated by our Chief Executive Officer (our CODM) to determine resource allocation and assess operating performance: Specialty P&C, Workers' Compensation Insurance, Segregated Portfolio Cell Reinsurance and Corporate. Additional information on our four operating and reportable segments is included in Note 16 of the Notes to Consolidated Financial Statements, Part I and in the Segment Results sections herein that follow.
Growth Opportunities and Outlook
Given the cyclical nature of our insurance operations, our financial objectives span multiple years and we target a dynamic long-term ROE of 700 basis points above the 10-year U.S. Treasury rate, which at December 31, 2024 was approximately 11.6%. To achieve our long-term ROE target, we emphasize rate adequacy, selective underwriting, use of our proprietary data and predictive analytics, effective claims management, operational efficiency gained by leveraging our enhanced scope and scale and prudent investment management. Our overall investment strategy is to focus on maximizing current income from our investment portfolio while maintaining appropriate credit risk, liquidity, duration, portfolio diversification and capital efficiency.
Our focus on ROE and consequently, Non-GAAP operating earnings, means that we place profitability over growth and will make decisions to shrink our businesses if we believe it is in the best long-term interest of the Company. We are focused on strategic initiatives in our insurance operations to support the achievement of our long-term objectives. Over the long-term, we are focused on capturing a larger share of the medical professional liability and workers’ compensation insurance markets in specific geographic areas and sub-sectors if we believe we can do so and achieve our profitability targets; this may lead to top-line growth in the future. Over the Company's history, we also have grown through the acquisition of other insurers, service providers and books of business.
We operate in very competitive markets and face strong competition from other insurance companies for all of our insurance products. Our Specialty P&C segment includes our MPL insurance operations, which represents the largest product line in our consolidated gross premiums written (70% in 2024). The healthcare market in the U.S. is continuing to consolidate, which brings competitive challenges and opportunities. This consolidation initially took the form of hospitals acquiring physician practices and later the growth of physician groups owned by outside investors. As these trends continue, most physicians no longer practice medicine as owners of an independent practice. Large single and multi-specialty practices often operate in many states. Healthcare delivery settings are changing with the growth of retail delivery by allied healthcare professionals as well as physicians practicing in distributed clinics, pharmacies, large consumer stores and online. The shifts within the healthcare settings continue to impact the overall market for medical professional liability products due to their differing risk profiles. We are focused on serving those segments of the market where we believe we can achieve our profitability objectives over time.
Over the past several years, we also have responded to rising severity in the medical professional liability market driven by social inflation and eroding tort reforms that have been adversely affecting the loss environment. We believe we have stayed ahead of many in the space in achieving rate levels in MPL that outpace severity trends that continue to be challenging. We also continue to forgo renewal and new business opportunities in this loss environment that we believe do not meet our expectation of rate adequacy. We are encouraged that retention of existing insureds is at 84% with strong retention of the more profitable small to midsize accounts, reinforcing our relevance in the market. New business continues to be impacted by our focus on rate adequacy and may continue to trend lower in the near term.
Along with our pricing actions, we remain focused on disciplined underwriting and managing claims to address these market conditions. Innovation tools also continue to enhance our risk selection, pricing decisions and workflows. Work is ongoing to maximize the use of predictive analytics to leverage our extensive data and to identify specific geographic markets and specialty sub-sectors where there are opportunities to write business that has the potential to meet our profitability objectives. We are also committed to ensuring that our insured and distribution partners find us easy to do business with - helping distinguish us in the marketplace.
Our Specialty P&C segment also includes medical technology liability insurance, which contributed 4% to consolidated gross premiums written in 2024. It is less affected by the trends affecting the healthcare sector and has the potential to increase its market share over time.
Our second largest product line is workers' compensation insurance which represents 23% of our consolidated gross premiums written in 2024, including alternative market premiums which are eliminated in consolidation. The workers’ compensation market is highly competitive and multi-line insurers continue to leverage workers’ compensation in their product offerings, which has resulted in a reduction of new business writings. The rates we charge our policyholders remain pressured by the continuation of loss cost decreases in the states within our operating territories, and most states in which we operate have approved additional loss cost decreases for 2025. Our workers' compensation product offerings are designed to provide flexibility in offering solutions to our customers at a competitive price. In addition, we plan to leverage our investment in claims handling and risk management services beginning in the first half of 2025 to support our strong renewal retention and our ability to effectively manage expenses.
We believe our focus on our organization's Mission, Vision and Core Values enhances our market position and differentiates us from other insurers. We will continue to uphold our values of integrity, leadership, relationships and enthusiasm in all of our activities. We will honor these values in the performance of our Mission and pursuit of our Vision. We believe a commitment to our Mission and Vision in the service of our customers will continue to improve retention and add new insureds.
Key Performance Measures
We are committed to disciplined underwriting, pricing and loss reserving practices as well as strategically managing our investment portfolio. We are also committed to maintaining prudent operating and financial leverage. We recognize the importance that our customers and producers place on the financial strength of our insurance subsidiaries, and we manage our business to protect our financial security.
In evaluating our performance, we consider a number of performance measures, including the following:
•The net loss ratio which is calculated as net losses and loss adjustment expenses incurred divided by net premiums earned and is a component of underwriting profitability.
•The underwriting expense ratio which is calculated as underwriting, policy acquisition and operating expenses incurred divided by net premiums earned and is a component of underwriting profitability.
•The combined ratio which is the sum of the net loss ratio and the underwriting expense ratio and measures underwriting profitability.
•The investment income ratio which is calculated as net investment income divided by net premiums earned and measures the contribution investment earnings provide to our overall profitability.
•The operating ratio which is the combined ratio, less the investment income ratio. This ratio provides the combined effect of underwriting profitability and investment income.
•The effective tax rate which is calculated as total income tax expense (benefit) divided by income (loss) before income taxes.
•Non-GAAP operating income (loss) which is widely used to evaluate performance within the insurance sector. In calculating Non-GAAP operating income (loss), we exclude the effects of items that do not reflect normal operating results. We believe Non-GAAP operating income (loss) presents a useful view of the performance of our core insurance operations; however, it should be considered in conjunction with net income (loss) computed in accordance with GAAP. See a reconciliation to its GAAP counterpart in the Executive Summary of Operations section under the heading “Non-GAAP Financial Measures” that follows.
•ROE which is calculated as net income (loss) divided by the average of beginning and ending shareholders’ equity. This ratio measures our overall after-tax profitability and shows how efficiently capital is being used.
•Non-GAAP operating ROE which is calculated as Non-GAAP operating income (loss) divided by the average of beginning and ending total shareholders’ equity. Non-GAAP operating ROE measures the overall after-tax profitability of our core insurance operations and shows how efficiently capital is being used; however, it should be considered in conjunction with ROE computed in accordance with GAAP. See a reconciliation to its GAAP counterpart in the Executive Summary of Operations section under the heading “Non-GAAP Financial Measures” that follows.
•Book value per share which is calculated as total shareholders’ equity divided by the total number of common shares outstanding at the balance sheet date. This ratio measures the net worth of the Company to shareholders on a per-share basis. Growth in book value per share is an indicator of overall profitability.
•Non-GAAP adjusted book value per share which is a Non-GAAP measure widely used within the insurance sector and is calculated as total shareholders’ equity, excluding AOCI, divided by the total number of common shares outstanding at the balance sheet date. This Non-GAAP calculation measures the net worth of the Company to shareholders on a per share basis excluding AOCI to eliminate the temporary and potentially significant effects of fluctuations in interest rates on our fixed income portfolio; however, it should be considered in conjunction with book value per share computed in accordance with GAAP. See a reconciliation to its GAAP counterpart in the Executive Summary of Operations section under the heading “Non-GAAP Financial Measures” that follows.
In particular, we focus on our combined ratio and investment returns, both of which directly affect our ROE and growth in our book value per share.
Critical Accounting Estimates
Our Consolidated Financial Statements are prepared in conformity with GAAP. Preparation of these financial statements requires us to make estimates and assumptions that affect the amounts we report on those statements. We evaluate these estimates and assumptions on an ongoing basis based on current and historical developments, market conditions, industry trends and other information that we believe to be reasonable under the circumstances. We can make no assurance that actual results will conform to our estimates and assumptions; reported results of operations may be materially affected by changes in these estimates and assumptions.
Management considers the following accounting estimates to be critical because they involve significant judgment by management and those judgments could result in a material effect on our financial statements.
Reserve for Losses and Loss Adjustment Expenses
The largest component of our liabilities is our reserve for losses and loss adjustment expenses ("reserve for losses" or "reserve"), and the largest component of expense for our operations is incurred losses and loss adjustment expenses (also referred to as “losses and loss adjustment expenses,” “incurred losses,” “losses incurred” and “losses”). Incurred losses reported in any period reflect our estimate of losses incurred related to the premiums earned in that period as well as any changes to our previous estimate of the reserve required for prior periods.
As of December 31, 2024, our reserve is comprised almost entirely of long-tail exposures. The estimation of long-tailed losses is inherently complex and is subject to significant judgment on the part of management. Due to the nature of our claims, our loss costs, even for claims with similar characteristics, can vary significantly depending upon many factors, including but not limited to the specific characteristics of the claim and the manner or jurisdiction in which the claim is resolved. Long-tailed insurance is characterized by the extended period of time typically required both to assess the viability of a claim and potential
damages, if any, and to reach a resolution of the claim. The claims resolution process may extend to more than five years. The combination of continually changing conditions and the extended time required for claim resolution results in a loss cost estimation process that requires actuarial skill and the application of significant judgment, and such estimates require periodic modification.
Our reserve is established by management after taking into consideration a variety of factors including premium rates, historical paid and incurred loss development trends and our evaluation of the current loss environment including frequency, severity, expected effects of inflation (monetary, social and medical), general economic and social trends, and the legal and political environment. We also take into consideration the conclusions reached by our internal and consulting actuaries. We update and review the data underlying the estimation of our reserve for losses each reporting period and make adjustments to loss estimation assumptions that we believe best reflect emerging data. Both our internal and consulting actuaries perform an in-depth review of our reserve for losses on at least a semi-annual basis using the loss and exposure data of our insurance subsidiaries.
We partition our reserves by accident year, which is the year in which the claim becomes our liability. For claims-made policies, the insured event generally becomes a liability when the event is first reported to us. For occurrence policies, the insured event becomes a liability when the event takes place. For retroactive coverages, the insured event becomes a liability at inception of the underlying contract. As claims are incurred (reported) and claim payments are made, they are aggregated by accident year for analysis purposes. We also partition our reserves by reserve type: case reserves and IBNR reserves. Case reserves are established by our claims departments based upon the particular circumstances of each reported claim and represent our estimate of the future loss costs (often referred to as expected losses) that will be paid on reported claims. Case reserves are decremented as claim payments are made and are periodically adjusted upward or downward as estimates regarding the amount of future losses are revised; reported loss for an individual claim is the case reserve at any point in time plus the claim payments that have been made to date. IBNR reserves are estimated by accident year by our actuarial department and represent our estimate in the aggregate of future development on losses that have been reported to us and our estimate of losses that have been incurred but not reported to us.
Our reserving process can be broadly grouped into three areas: the establishment of the reserve for the current accident year (the initial reserve), the re-estimation of the reserve for prior accident years (development of prior accident years) and the establishment of the initial reserve for risks assumed in business combinations, applicable only in periods in which acquisitions occur (the acquired reserve). A summary of the activity in our net reserve for losses during 2024 and 2023 is provided under the heading "Losses" in the Liquidity and Capital Resources and Financial Condition section that follows.
Current Accident Year - Initial Reserve
Considerable judgment is required in establishing our initial reserve for any current accident year period, as there is limited data available upon which to base our estimate (see further discussion that follows under the heading "Use of Judgment"). Our process for setting an initial reserve considers the unique characteristics of each product, but in general we rely heavily on the loss assumptions that were used to price business, as our pricing reflects our analysis of loss costs that we expect to incur relative to the insurance product being priced.
Specialty P&C Segment. Loss costs within this segment are impacted by many factors including but not limited to the nature of the claim, including whether or not the claim is an individual or a mass tort claim, the personal situation of the claimant or the claimant's family, the outcome of jury trials including the impacts of social inflation, the legislative and judicial climate where any potential litigation may occur, general economic and social trends and the trend of healthcare costs. Within our Specialty P&C segment, for our professional liability business (86% of our consolidated gross reserve for losses and loss adjustment expenses as of December 31, 2024; predominately comprised of our MPL products), we set an initial reserve using a loss ratio approach based upon our evaluation of the current loss environment including frequency, severity, monetary inflation, social inflation and legal trends. See further discussion in our Segment Results - Specialty Property & Casualty section that follows under the heading "Losses and Loss Adjustment Expenses."
The risks insured in our Medical Technology Liability business (3% of our consolidated gross reserve for losses and loss adjustment expenses as of December 31, 2024) are more varied, and policies are individually priced based on the risk characteristics of the policy and the account. The insured risks range from startup operations to large multinational entities, and the larger entities often have significant deductibles or self-insured retentions. Reserves are established using our most recently developed actuarial estimates of losses expected to be incurred based on factors which include results from prior analysis of similar business, industry indications, observed trends and judgment. Claims in this line of business primarily involve bodily injury to individuals and are affected by factors similar to those of our MPL line of business. For the Medical Technology Liability business, we also establish an initial reserve using a loss ratio approach, including a provision in consideration of historical loss volatility that this line of business has exhibited.
Workers' Compensation Insurance Segment. Many factors affect the ultimate losses incurred for our workers' compensation coverages (6% of our consolidated gross reserve for losses and loss adjustment expenses as of December 31, 2024) including but not limited to the type and severity of the injury, the age, health and occupation of the injured worker, the estimated length of disability, medical treatment and related costs, and the jurisdiction and workers' compensation laws of the state of the injury occurrence.
We use various actuarial methodologies in developing our workers’ compensation reserve, combined with a review of the payroll exposure base. For the current accident year, given the lack of seasoned information, the different actuarial methodologies produce results with significant variability; therefore, more emphasis is placed on supplementing results from the actuarial methodologies with trends in exposure base, medical expense inflation, general inflation, severity and claim counts, among other things, to select an ultimate loss indication.
Segregated Portfolio Cell Reinsurance Segment. The factors that affect the ultimate losses incurred for the workers' compensation and medical professional liability coverages assumed by the SPCs at Inova Re and Eastern Re (2% of our consolidated gross reserve for losses and loss adjustment expenses as of December 31, 2024) are consistent with that of our Workers’ Compensation Insurance and Specialty P&C segments, respectively.
Development of Prior Accident Years
In addition to setting the initial reserve for the current accident year, we reassess the amount of reserve required for prior accident years each period.
The foundation of our reserve re-estimation process is an actuarial analysis that is performed by both our internal and consulting actuaries. This detailed analysis projects ultimate losses based on partitions which include line of business, geography, coverage layer and accident year. The procedure uses the most representative data for each partition, capturing its unique patterns of development and trends. We believe that the use of consulting actuaries provides an independent view of our loss data as well as a broader perspective on industry loss trends.
The analyses performed by our internal actuarial team and the consulting actuaries analyzes each partition of our business in a variety of ways and uses multiple actuarial methodologies in performing these analyses, including:
•Bornhuetter-Ferguson (Paid and Reported) Method
•Paid Development Method
•Reported (Incurred) Development Method
•Average Paid Value Method
•Average Reported Value Method
A brief description of each method follows.
Bornhuetter-Ferguson Method. We use both the Paid and the Reported Bornhuetter-Ferguson Methods. The Paid Method assigns partial weight to initial expected losses for each accident year (initial expected losses being the first established case and IBNR reserves for a specific accident year) and partial weight to paid to date losses. The Reported Method assigns partial weight to the initial expected losses and partial weight to current reported losses. The weights assigned to the initial expected losses decrease as the accident year matures.
Paid Development and Reported (Incurred) Development Methods. These methods use historical, cumulative losses (paid losses for the Paid Development Method, reported losses for the Reported (Incurred) Development Method) by accident year and develop those actual losses to estimated ultimate losses based upon the assumption that each accident year will develop to estimated ultimate cost in a manner that is analogous to prior years, adjusted as deemed appropriate for the expected effects of known changes in the claim payment environment (and case reserving environment for the Reported (Incurred) Development Method); and to the extent necessary, supplemented by analyses of the development of broader industry data.
Average Paid Value and Average Reported Value Methods. In these methods, average claim cost data (paid claim cost for the Average Paid Value Method and reported claim cost for the Reported Value Method) is developed to an ultimate average cost level by report year based on historical data. Claim counts are similarly developed to an ultimate count level. The average claim cost (after rounding and adjustment, if necessary, to accommodate report year data that is not considered to be predictive) is then multiplied by the ultimate claim counts by report year to derive ultimate loss and ALAE.
We use various actuarial methods in the process of setting reserves. Each actuarial method generally returns a different value, and for the more recent accident years the variations among the different methodologies can be significant. Generally, methods such as the Bornhuetter-Ferguson Method are used on more recent accident years where we have less data on which to base our analysis. As time progresses and we have an increased amount of data for a given accident year, we begin to give more confidence to the development and average methods, as these methods typically rely more heavily on our own historical data. These methods emphasize different aspects of loss reserve estimation and provide a variety of perspectives for our decisions.
Certain of the methodologies utilized to estimate the ultimate losses for each partition of our reserves consider the actual amounts paid. Paid data is particularly influential when a large portion of known claims have been closed, as is the case for older accident years. In selecting a point estimate for each partition, management considers the extent to which trends are emerging consistently for all partitions and known industry trends. Thus, actual, rather than estimated severity trends are given more consideration. If actual severity trends are lower than those estimated at the time that reserves were previously established, the recognition of favorable development is indicated. This is particularly true for older accident years where our actuarial methodologies give more weight to actual loss costs (severity).
The various actuarial methods discussed above are applied in a consistent manner from period to period. For each partition of our reserves, we evaluate the results of the various methods, along with the supplementary statistical data regarding such factors as closed with and without indemnity ratios, claim severity trends, the expected duration of such trends, changes in the legal and legislative environment and the current economic environment to develop a point estimate based upon management's judgment and past experience. The series of selected point estimates is then combined to produce an overall point estimate for ultimate losses.
We utilize the selected point estimates of ultimate losses to develop estimates of ultimate losses recoverable from reinsurers, based on the terms and conditions of our reinsurance agreements. An overall estimate of the amount receivable from reinsurers is determined by combining the individual estimates. Our net reserve estimate is the gross reserve point estimate less the estimated reinsurance recovery.
For our Workers’ Compensation Insurance segment and for the workers' compensation exposures in our Segregated Portfolio Cell Reinsurance segment, we utilize the Reported (Incurred) Development Method, Paid Development Method and Bornhuetter-Ferguson Method, to develop our reserve for each accident year. The actuarial review includes the stratification of claims data (lost time claims, medical only claims) using different variations that allow us to identify trends that may not be readily identifiable if the data was evaluated only in the aggregate. Reported and paid loss development factors are key assumptions in the reserve estimation process and are influenced by our historical reported and paid loss development patterns. As accident years mature, the various actuarial methodologies produce more consistent loss estimates.
Acquired Reserve
The acquisition of NORCAL on May 5, 2021 increased our gross reserves by $1.2 billion which was the fair value of NORCAL's gross loss reserve at the time of acquisition. The fair value estimate of NORCAL's gross reserve for losses and loss adjustment expenses was based on three components: an actuarial estimate of the expected future net cash flows, a reduction to those cash flows for the time value of money determined utilizing the U.S. Treasury Yield Curve and a risk margin adjustment to reflect the net present value of profit that an investor would demand in return for the assumption of the development risk associated with the reserve. The fair value of NORCAL's gross reserve, including the risk margin adjustment, exceeded the actuarial estimate of NORCAL’s undiscounted gross loss reserve by approximately $42.2 million as of May 5, 2021. This fair value adjustment was recorded to the reserve for losses and loss adjustment expenses and will be amortized over a period utilizing loss payment patterns as a reduction to prior accident year net losses and loss adjustment expenses. We also recorded other adjustments to NORCAL’s reserve as a result of purchase accounting including negative VOBA on NORCAL’s assumed unearned premium and assumed DDR reserve.
Use of Judgment/Variability of Loss Reserves
The process of estimating reserves involves a high degree of judgment and is subject to a number of variables. These variables can be affected by both views of internal and external events, such as changes in views of monetary and social inflation, legal trends and legislative changes, as well as differentiating views of individuals involved in the reserve estimation process, among others. We continually refine our estimates in a regular, ongoing process as historical loss experience develops and additional claims are reported and settled. Our objective is to consider all significant facts and circumstances known at the time.
Our loss reserves may be impacted by social inflation, which is generally described as the rising costs of insurance claims resulting from factors including, but not limited to, increasing litigation, broader definitions of liability, more plaintiff-friendly legal decisions, jury behavior, third-party litigation financing, and larger compensatory jury awards and non-economic damages. These factors could lead to greater than anticipated claims and claim handling expenses which could exceed our established reserves causing us to increase our loss reserves.
The effects of monetary and medical inflation could cause the cost of claims to rise in the future. Our loss reserves include assumptions about future payments for settlement of claims and claims handling expenses, such as medical treatments and litigation costs. For our workers' compensation reserves, healthcare wage inflation and medical advancements may also increase the cost of claims. To the extent inflation causes these costs to increase above reserves established for these claims, we will be required to increase our loss reserves with a corresponding reduction in our financial results in the period in which the need for additional reserves is identified.
MPL. Over the past several years the most influential factor affecting the analysis of our MPL reserves and the related development recognized has been an observed increase in claim severity for the broader medical professional liability industry as well as higher initial loss expectations on incurred claims. The severity trend is an explicit component of our pricing models and directly impacts the reserving process. Our estimate of this trend and our expectations about changes in this trend impact a variety of factors, from the selection of expected loss ratios to the ultimate point estimates established by management.
Because of the implicit and wide-ranging nature of severity trend assumptions on the loss reserving process, it is not practical to specifically isolate the impact of changing severity trends. However, because severity is an explicit component of our MPL pricing process we can better isolate the impact that changing severity can have on our loss costs and loss ratios in regards to our pricing models for this business component. Our current MPL pricing models assume severity trends in the range of 3% to 6% depending on state, territory and specialty. In some portions of our MPL business, we have observed and reflected higher severity trends in our estimates of losses and loss adjustment expenses.
Due to the long-tailed nature of our claims and the previously discussed historical volatility of loss costs, selection of a severity trend assumption is a subjective process that is inherently likely to prove inaccurate over time. Given the long tail and volatility, we are generally cautious in making changes to the severity assumptions within our pricing models. All open claims and accident years are generally impacted by a change in the severity trend, which compounds the effect of such a change.
Although the future degree and impact of the ultimate severity trend remains uncertain due to the long-tailed nature of our business, we have given consideration to observed loss costs in setting our rates. For our MPL business, this practice has recently resulted in rate increases reflecting the rising loss cost environment, and we anticipate further renewal pricing increases due to increasing loss severity.
Workers' Compensation. In our workers’ compensation business, severity is not an explicit component of our pricing process, as loss costs are established by the states in which we operate. We do, however, have the ability in certain states to apply for increases in our loss cost multipliers to adjust for company specific loss experience that is higher than state loss cost changes. In our reserving process, we consider the loss severity trends in evaluating both our current and expected loss development. Historically, we have been able to minimize the impact of higher severity trends as a result of our early intervention and case management strategies in our claims process, which results in claims being resolved more quickly than the industry norm. However, in the second half of 2023, we observed higher than expected loss trends in our average cost per claim which we primarily attribute to increased medical costs driven by wage inflation and medical advancements. In response to these trends, we increased both our current accident year loss ratio and prior year reserves in 2023. While we continue to observe, and therefore reflect, higher medical loss cost trends, we have seen these trends begin to moderate in 2024, including a reduction in the 2024 average cost per claim.
As previously noted, the number of data points and variables considered and the subjective process followed in establishing our loss reserve makes it impractical to isolate individual variables and demonstrate their impact on our estimate of loss reserves. However, to provide a better understanding of the potential variability in our reserves, we have modeled implied reserve ranges around our single point net reserve estimates for our various lines of business assuming different confidence levels. The ranges have been developed by aggregating the expected volatility of losses across partitions of our business to obtain a consolidated distribution of potential reserve outcomes. The aggregation of this data takes into consideration correlations among our geographic and specialty mix of business. The result of the correlation approach to aggregation is that the ranges are narrower than the sum of the ranges determined for each partition.
We have used this modeled statistical distribution to calculate an 80% and 60% confidence interval for the potential outcome of our consolidated net reserve for losses. The high and low end points of the distributions are as follows:
| | | | | | | | | | | | | | | | | |
| Low End Point | | Carried Net Reserve | | High End Point |
| 80% Confidence Level | $2.085 billion | | $2.849 billion | | $3.726 billion |
| 60% Confidence Level | $2.302 billion | | $2.849 billion | | $3.344 billion |
Any change in our estimate of net ultimate losses for prior years is reflected in net income (loss) in the period in which such changes are made. Due to the size of our consolidated reserve for losses and the large number of claims outstanding at any point in time, even a small percentage adjustment to our total reserve estimate could have a material effect on our results of operations for the period in which the adjustment is made.
Loss Development by Line of Business
Professional Liability
Our professional liability business is primarily compromised of our MPL line of business. We also provide professional liability coverage to attorneys and their firms in select areas of practice. As a result of the higher severity environment, we saw
our closed-with-indemnity-payment ratio (i.e., the number of suits closed with an indemnity or loss payment as compared to the total number of closed suits) for our claims increase from 28% in 2015 to 35% in 2024.
The following table presents additional information about the loss development for our professional liability line of business, excluding loss development for MPL coverages assumed by the SPCs at Inova Re and Eastern Re. Furthermore, loss development for our professional liability line of business for the years ended December 31, 2024, 2023 and 2022 excludes the amortization of purchase accounting fair value adjustments.
| | | | | | | | | | | | | | | | | | | | | | | | | | | | | | | | | | | | | | | | | |
| ($ in thousands) | | | 2024 | | 2023 | | 2022 |
| Accident Years | Estimated Ultimate Losses, Net of Reinsurance, December 31, 2024 | | Reserve Development (favorable) unfavorable | | % of Known Claims Closed | | Reserve Development (favorable) unfavorable | | % of Known Claims Closed | | Reserve Development (favorable) unfavorable | | % of Known Claims Closed |
| 2024 | $ | 583,875 | | | N/A | | 24.5 | % | | N/A | | N/A | | N/A | | N/A |
| 2023 | $ | 643,369 | | | $ | 6,146 | | | 52.7 | % | | N/A | | 24.7 | % | | N/A | | N/A |
| 2022 | $ | 613,710 | | | $ | (1,362) | | | 70.8 | % | | $ | (10,151) | | | 55.0 | % | | N/A | | 26.9 | % |
| 2021 | $ | 680,860 | | | $ | (10,207) | | | 82.1 | % | | $ | (11,690) | | | 71.6 | % | | $ | (5,754) | | | 52.9 | % |
| 2020 | $ | 868,228 | | | $ | (14,686) | | | 89.3 | % | | $ | 44,061 | | | 82.5 | % | | $ | (17,597) | | | 66.7 | % |
| 2019 | $ | 875,608 | | | $ | (3,536) | | | 93.7 | % | | $ | 5,220 | | | 90.4 | % | | $ | 20,285 | | | 83.5 | % |
| 2018 | $ | 852,679 | | | $ | 2,782 | | | 96.3 | % | | $ | 413 | | | 93.6 | % | | $ | 4,491 | | | 89.5 | % |
| 2017 | $ | 718,374 | | | $ | 2,273 | | | 96.5 | % | | $ | (8,265) | | | 95.4 | % | | $ | (10,261) | | | 93.3 | % |
| 2016 | $ | 735,957 | | | $ | (2,555) | | | 91.7 | % | | $ | (2,922) | | | 92.3 | % | | $ | 1,642 | | | 91.0 | % |
| 2015 | $ | 661,638 | | | $ | (7,445) | | | 99.4 | % | | $ | (3,825) | | | 98.9 | % | | $ | 5,190 | | | 98.1 | % |
| Prior to 2015 | $ | 13,266,105 | | | $ | (5,336) | | | | | $ | (3,232) | | | | | $ | (11,997) | | | |
•The loss environment in our MPL line of business continues to be challenging in many jurisdictions, as claim costs are pressured by social inflation and higher than anticipated loss severity trends that started to reemerge in the fourth quarter of 2022. We continue to monitor the impact that these trends have on our open case reserves and prior accident year development. While higher loss severity trends remained challenging in 2024, we recognized net favorable reserve development of $33.9 million during the year ended December 31, 2024 reflecting overall favorable trends in claim closing patterns relative to expectations, principally related to accident years 2019 through 2021.
•Net unfavorable development recognized during 2023 principally related to accident years 2019 and 2020. Net unfavorable reserve development recognized in 2023 was driven by the strengthening of case reserves related to four large claims resulting in unfavorable development of $10.1 million in our MPL line of business during the first quarter of 2023, primarily related to NORCAL's accident years 2016 and 2020, partially offset by $0.5 million of net favorable reserve development recognized during the fourth quarter of 2023, primarily related to accident years 2018 and prior in our legacy book. Further, we recognized unfavorable development in the fourth quarter of 2023 in NORCAL’s 2020 and prior accident year reserves which was entirely offset by favorable development recognized in NORCAL’s 2021 and 2022 accident year reserves since acquisition. These adjustments to NORCAL’s reserves had no impact to the segment’s net losses.
•Development recognized during 2022 principally related to accident years 2017, 2020 and 2021. Net favorable development recognized in 2022 included favorable development related to NORCAL's 2021 accident year. Net favorable prior accident year reserve development recognized in 2022 was partially offset by unfavorable development recognized in our MPL line of business, excluding NORCAL, driven by higher than anticipated loss severity trends, which emerged primarily in the fourth quarter of 2022. In addition, we recognized favorable prior year reserve development of $9.0 million in 2022 related to the 2020 accident year associated with the remaining reduction to our previous COVID-19 IBNR reserve due to the fact that early first notices of potential claims did not turn into claims.
•Not included in the table above, is $5.3 million, $8.3 million and $10.8 million of amortization of the purchase accounting fair value adjustment on NORCAL's assumed net reserve and amortization of the negative VOBA associated with NORCAL's DDR reserve which is recorded as a reduction to prior accident year net losses and loss adjustment expenses in 2024, 2023 and 2022, respectively.
•Not included in the above table is $0.3 million, $1.3 million and $0.7 million of unfavorable development recognized in 2024, 2023 and 2022, respectively, in our Segregated Portfolio Cell Reinsurance segment related to the medical professional liability coverages assumed by the SPCs at Inova Re and Eastern Re, as previously discussed.
Medical Technology Liability
The nature of the risks insured and volatility of the loss experience in the Medical Technology Liability line of business has produced more variable loss development, as presented in the following table:
| | | | | | | | | | | | | | | | | | | | | | | | | | | | | | | | | | | | | | | | | |
| ($ in thousands) | | | 2024 | | 2023 | | 2022 |
| Accident Years | Estimated Ultimate Losses, Net of Reinsurance, December 31, 2024 | | Reserve Development (favorable) unfavorable | | % of Known Claims Closed | | Reserve Development (favorable) unfavorable | | % of Known Claims Closed | | Reserve Development (favorable) unfavorable | | % of Known Claims Closed |
| 2024 | $ | 18,587 | | | N/A | | 49.8 | % | | N/A | | N/A | | N/A | | N/A |
| 2023 | $ | 17,255 | | | $ | (1,609) | | | 55.3 | % | | N/A | | 28.0 | % | | N/A | | N/A |
| 2022 | $ | 14,093 | | | $ | (2,141) | | | 80.2 | % | | $ | (1,448) | | | 59.6 | % | | N/A | | 16.8 | % |
| 2021 | $ | 13,334 | | | $ | 836 | | | 77.2 | % | | $ | (1,647) | | | 73.0 | % | | $ | (2,759) | | | 53.3 | % |
| 2020 | $ | 10,028 | | | $ | (1,098) | | | 84.0 | % | | $ | (1,442) | | | 80.1 | % | | $ | (1,921) | | | 70.6 | % |
| 2019 | $ | 12,528 | | | $ | (953) | | | 62.2 | % | | $ | 1,235 | | | 61.3 | % | | $ | (1,337) | | | 55.3 | % |
| 2018 | $ | 9,239 | | | $ | 186 | | | 89.5 | % | | $ | 499 | | | 89.5 | % | | $ | (252) | | | 86.4 | % |
| 2017 | $ | 6,846 | | | $ | (65) | | | 99.0 | % | | $ | (1,056) | | | 99.0 | % | | $ | 1,950 | | | 97.1 | % |
| 2016 | $ | 8,802 | | | $ | 173 | | | 99.5 | % | | $ | (517) | | | 99.5 | % | | $ | 535 | | | 98.4 | % |
| 2015 | $ | 8,278 | | | $ | 359 | | | 99.4 | % | | $ | 703 | | | 99.4 | % | | $ | (767) | | | 97.6 | % |
| Prior to 2015 | $ | 606,516 | | | $ | (188) | | | | | $ | (326) | | | | | $ | (449) | | | |
•Approximately $3.8 million of the $4.5 million total net favorable development recognized in 2024 related to the 2022 and 2023 accident years. The development for the 2022 and 2023 accident years represents a 10.7% reduction to the ultimates established for those reserves at December 31, 2023.
•Approximately $4.5 million of the $4.0 million total net favorable development recognized in 2023 related to the 2020 through 2022 accident years. The development for the 2020 through 2022 accident years represents a 10.2% reduction to the ultimates established for those reserves at December 31, 2022.
•Approximately $6.3 million of the $5.0 million total net favorable development recognized in 2022 related to the 2018 through 2021 accident years. The development for the 2018 through 2021 accident years represents a 11.7% reduction to the ultimates established for those reserves at December 31, 2021.
•In 2024, 2023 and 2022, the development was largely attributable to favorable results from claims closed during the year. As time has elapsed we have recognized that actual loss experience has on average been better than estimated. We have been cautious in recognizing the improvement, but as claims have matured and claims are closed or have become more certain for the remaining open claims, we have revised reserve estimates. We believe the need for a cautious approach is required as outcomes are uncertain and results can be significantly affected by outcomes for a small number of cases.
Workers' Compensation
Claims in our workers’ compensation line of business have historically closed at a faster rate than in our MPL or Medical Technology Liability lines of business. This faster disposition rate, along with a lower net retention after the application of reinsurance, has resulted in less volatility in loss estimates on a net basis. However, a change in the number of individually-severe claims can create volatility in a given accident year. The following table presents additional information about the loss development for our workers' compensation line of business:
| | | | | | | | | | | | | | | | | | | | | | | | | | | | | | | | | | | | | | |
| ($ in thousands) | | | 2024 | | 2023 | | 2022 |
| Accident Years | Estimated Ultimate Losses, Net of Reinsurance, December 31, 2024 | | Reserve Development (favorable) unfavorable | | % of Known Claims Closed | | Reserve Development (favorable) unfavorable | | % of Known Claims Closed | | Reserve Development (favorable) unfavorable | % of Known Claims Closed |
| 2024 | $ | 150,956 | | | N/A | | 43.0 | % | | N/A | | N/A | | N/A | N/A |
| 2023 | $ | 147,742 | | | $ | (1,576) | | | 79.5 | % | | N/A | | 40.3 | % | | N/A | N/A |
| 2022 | $ | 151,554 | | | $ | (116) | | | 91.3 | % | | $ | 9,016 | | | 81.3 | % | | N/A | 39.8 | % |
| 2021 | $ | 145,869 | | | $ | (1,255) | | | 95.7 | % | | $ | 1,217 | | | 92.8 | % | | $ | 675 | | 82.6 | % |
| 2020 | $ | 135,155 | | | $ | (255) | | | 98.2 | % | | $ | (2,318) | | | 96.7 | % | | $ | (3,348) | | 93.8 | % |
| 2019 | $ | 146,722 | | | $ | (1,183) | | | 98.3 | % | | $ | (2,119) | | | 97.9 | % | | $ | (4,143) | | 96.2 | % |
| 2018 | $ | 156,067 | | | $ | (1,266) | | | 98.5 | % | | $ | (1,819) | | | 98.1 | % | | $ | (410) | | 97.2 | % |
| 2017 | $ | 125,135 | | | $ | (479) | | | 98.8 | % | | $ | (711) | | | 98.7 | % | | $ | (3,209) | | 98.2 | % |
| 2016 | $ | 107,362 | | | $ | (13) | | | 99.1 | % | | $ | (231) | | | 99.0 | % | | $ | (2,179) | | 98.5 | % |
| 2015 | $ | 115,776 | | | $ | (269) | | | 99.3 | % | | $ | (232) | | | 99.2 | % | | $ | (1,285) | | 98.9 | % |
| Prior to 2015 | $ | 892,265 | | | $ | 2,826 | | | | | $ | 1,211 | | | | | $ | (1,107) | | |
•In 2024, we recognized $0.5 million of net favorable development in our Workers' Compensation Insurance segment and we recognized $3.1 million of net favorable development in our Segregated Portfolio Cell Reinsurance segment related to workers' compensation business.
•In 2023, we recognized $9.3 million of net unfavorable development in our Workers' Compensation Insurance segment and $5.3 million of net favorable development in our Segregated Portfolio Cell Reinsurance segment related to workers' compensation business. The net unfavorable prior year reserve development in 2023 reflects higher than expected average claim costs primarily in the 2022 accident year and higher than expected loss experience primarily attributable to a large claim from the 1997 accident year.
•In 2022, we recognized $7.0 million of net favorable development in our Segregated Portfolio Cell Reinsurance segment related to workers' compensation business and $8.0 million of net favorable development in our Workers' Compensation Insurance segment.
Reinsurance
We use insurance and reinsurance (collectively, “reinsurance”) to provide capacity to write larger limits of liability, to provide reimbursement for losses incurred under the higher limit coverages we offer, to provide protection against losses in excess of policy limits and, in the case of risk sharing arrangements, to align our objectives with those of our strategic business partners and to provide custom insurance solutions for large customer groups. The purchase of reinsurance does not relieve us from the ultimate risk on our policies; however, it does provide reimbursement for certain losses we pay.
We make a determination of the amount of insurance risk we choose to retain based upon numerous factors, including our risk tolerance and the capital we have to support it, the price and availability of reinsurance, the volume of business, our level of experience with a particular set of exposures and our analysis of the potential underwriting results. We purchase excess of loss reinsurance to limit the amount of risk we retain and we do so from a number of companies to mitigate concentrations of credit risk. As of December 31, 2024, there is no reinsurer, on an individual basis, for which our recoverables for both paid and unpaid claims (net of amounts due to the reinsurer) and our prepaid balances are more than $55 million, in the aggregate. We utilize reinsurance brokers to assist us in the placement of these reinsurance programs and in the analysis of the credit quality of our reinsurers. The determination of which reinsurers we choose to do business with is based upon an evaluation of their then current financial strength, rating, stability and claims payment practices.
We evaluate each of our ceded reinsurance contracts at inception to confirm that there is sufficient risk transfer to allow the contract to be accounted for as reinsurance under current accounting guidance. At December 31, 2024, all ceded contracts were accounted for as risk transferring contracts.
Our receivable from reinsurers on unpaid losses and loss adjustment expenses represents our estimate of the amount of our reserve for losses that will be recoverable under our reinsurance programs. We base our estimate of funds recoverable upon our expectation of ultimate losses and the portion of those losses that we estimate to be allocable to reinsurers based upon the terms and conditions of our reinsurance agreements. Our assessment of the collectability of the recorded amounts receivable from reinsurers considers the payment history of the reinsurer, publicly available financial and rating agency data, our interpretation of the underlying contracts and policies and responses by reinsurers.
Given the uncertainty inherent in our estimates of losses and related amounts recoverable from reinsurers, these estimates may vary significantly from the ultimate outcome.
Under the terms of certain of our reinsurance agreements, the amount of premium that we cede to our reinsurers is based in part on the losses we recover under the agreements. Therefore, we make an estimate of premiums ceded under these reinsurance agreements subject to certain minimums and maximums. Any adjustments to our estimates of losses recoverable under our reinsurance agreements or the premiums owed under our agreements are reflected in current operations. Due to the size of our reinsurance balances, an adjustment to these estimates could have a material effect on our results of operations for the period in which the adjustment is made.
Our reinsurance receivables are exposed to credit losses but to date have not experienced any significant amount of credit losses. To partially mitigate our exposure to credit losses, reinsurance receivables totaling approximately $145.5 million were collateralized by letters of credit or funds withheld as of December 31, 2024. We measure expected credit losses on our reinsurance receivables on a collective basis when similar risk characteristics exist or on an individual basis if we determine a receivable does not share similar risk characteristics. We measure expected credit losses associated with our reinsurance receivables (related to both paid and unpaid losses) at the consolidated level as our reinsurance receivables share similar risk characteristics including type of financial asset, type of industry and similar historical and expected credit loss patterns. We measure expected credit losses over the average contractual term of our reinsurance receivables utilizing a loss rate method. Historical internal credit loss experience is the basis for our assessment of expected credit losses; however, we may also consider historical credit loss information from external sources. We also consider reasonable and supportable forecasts of future economic conditions in our estimate of expected credit losses. Expected credit losses associated with our reinsurance receivables (related to both paid and unpaid losses) were nominal in amount as of December 31, 2024 and 2023. No reinsurance balances were written off for credit reasons during the years ended December 31, 2024 or 2023. Should our expected credit loss analysis or other facts or circumstances lead us to believe that any reinsurer may not meet its obligations to us, adjustments to the allowance for expected credit losses or to reinsurance receivables would be reflected in current operations. Such an adjustment has the potential to be material to the results of operations in the period in which it is recorded; however, we would not expect such an adjustment to have a material effect on our capital position or our liquidity. For further information on our allowance for expected credit losses related to our receivables from reinsurers see Note 1 of the Notes to Consolidated Financial Statements.
Investment Valuations
We record the majority of our investments at fair value as shown in the table below. At December 31, 2024, the distribution of our investments based on GAAP fair value hierarchies (levels) was as follows:
| | | | | | | | | | | | | | | | | | | | | | | | | | | | | |
| | Distribution by GAAP Fair Value Hierarchy | | | | |
| | Level 1 | | Level 2 | | Level 3 | | Not Categorized | | Total
Investments |
| Investments recorded at: | | | | | | | | | |
| Fair value | 7% | | 83% | | 2% | | 5% | | 97% |
| Other valuations | | | | | | | | | 3% |
| Total Investments | | | | | | | | | 100% |
Fair value is defined as the price that would be received to sell an asset or paid to transfer a liability in an orderly transaction between market participants at the measurement date. All of our fixed maturity and equity investments are carried at fair value. The fair value of our short-term securities approximates the cost of the securities due to their short-term nature.
Because of the number of securities we own and the complexity of developing accurate fair values, we utilize multiple independent pricing services to assist us in establishing the fair value of individual securities. The pricing services provide fair values based on exchange-traded prices, if available. If an exchange-traded price is not available, the pricing services, if possible, provide a fair value that is based on multiple broker/dealer quotes or that has been developed using pricing models. Pricing models vary by asset class and utilize currently available market data for securities comparable to ours to estimate a fair value for our securities. The pricing services scrutinize market data for consistency with other relevant market information before including the data in the pricing models. The pricing services disclose the types of pricing models used and the inputs
used for each asset class. Determining fair values using these pricing models requires the use of judgment to identify appropriate comparable securities and to choose a valuation methodology that is appropriate for the asset class and available data.
The pricing services provide a single value per instrument quoted. We review the values provided for reasonableness each quarter by comparing market yields generated by the supplied value versus market yields observed in the marketplace. We also compare yields indicated by the provided values to appropriate benchmark yields and review for values that are unchanged or that reflect an unanticipated variation as compared to prior period values. We utilize a primary pricing service for each security type and compare provided information for consistency with alternate pricing services, known market data and information from our own trades, considering both values and valuation trends. We also review weekly trades versus the prices supplied by the services. If a supplied value appears unreasonable, we discuss the valuation in question with the pricing service and make adjustments if deemed necessary. Historically our review has not resulted in any material changes to the values supplied by the pricing services. The pricing services do not provide a fair value unless an exchange-traded price or multiple observable inputs are available. As a result, the pricing services may provide a fair value for a security in some periods but not others, depending upon the level of recent market activity for the security or comparable securities.
Level 1 Investments
Fair values for a majority of our equity securities and portions of our short-term and convertible securities are determined using exchange-traded prices. There is little judgment involved when fair value is determined using an exchange-traded price. In accordance with GAAP, we classify securities valued using an exchange-traded price as Level 1 securities.
Level 2 Investments
Most fixed income securities do not trade daily; thus, exchange-traded prices are generally not available for these securities. However, market information (often referred to as observable inputs or market data, including but not limited to, last reported trade, non-binding broker quotes, bids, benchmark yield curves, issuer spreads, two-sided markets, benchmark securities, offers and recent data regarding assumed prepayment speeds, cash flow and loan performance data) is available for most of our fixed income securities. We determine fair value for a large portion of our fixed income securities using available market information. In accordance with GAAP, we classify securities valued based on multiple market observable inputs as Level 2 securities.
Level 3 Investments
When a pricing service does not provide a value for one of our fixed maturity securities, management estimates fair value using either a single non-binding broker quote or pricing models that utilize market based assumptions which have limited observable inputs. The process involves significant judgment in selecting the appropriate data and modeling techniques to use in the valuation process. In accordance with GAAP, we classify securities valued using limited observable inputs as Level 3 securities.
Fair Values Not Categorized
We hold interests in certain investment funds, primarily LPs/LLCs, which measure fund assets at fair value on a recurring basis and provide us with a NAV for our interest. As a practical expedient, we consider the NAV provided to approximate the fair value of our interest. In accordance with GAAP, we do not categorize these investments within the fair value hierarchy.
Nonrecurring Fair Value Measurements
We measure the fair value of certain assets on a nonrecurring basis when events or changes in circumstances indicate that the carrying amount of the asset may not be recoverable. These assets include investments carried principally at cost, investments in tax credit partnerships, fixed assets, goodwill and other intangible assets. These assets would also include any equity method investments that do not provide a NAV. During the third quarter of 2023, we recognized a nonrecurring fair value measurement related to the goodwill in our Workers' Compensation Insurance reporting unit with a carrying value of $44.1 million prior to the fair value measurement. This nonrecurring fair value measurement resulted in the goodwill being written down to its implied fair value of zero resulting in an impairment of goodwill of $44.1 million (see additional information on our goodwill impairment in Note 6 of the Notes to the Consolidated Financial Statements). The fair value measurement used inputs that were non-observable and, as such, was categorized as a Level 3 valuation. We did not have any other assets or liabilities that were measured at fair value on a nonrecurring basis at December 31, 2024 or December 31, 2023.
Investments - Other Valuation Methodologies
Certain of our investments, in accordance with GAAP for the type of investment, are measured using methodologies other than fair value. At December 31, 2024, these investments represented approximately 3% of total investments and are detailed in the following table. Additional information about these investments is provided in Note 2 and Note 3 of the Notes to Consolidated Financial Statements.
| | | | | | | | | | | |
| (In millions) | Carrying Value | | GAAP Measurement Method |
| Other investments: | | | |
| | | |
| Other, principally FHLB capital stock | $ | 5.2 | | | Principally Cost |
| | | |
| Investment in unconsolidated subsidiaries: | | | |
| Investments in tax credit partnerships | 0.2 | | | Equity |
| Equity method investments, primarily LPs/LLCs | 33.0 | | | Equity |
| 33.2 | | | |
| BOLI | 80.2 | | | Cash surrender value |
| Total investments - Other valuation methodologies | $ | 118.6 | | | |
Impairments
We evaluate our available-for-sale investment securities, which at December 31, 2024 and December 31, 2023 consisted entirely of fixed maturity securities, on at least a quarterly basis for the purpose of determining whether declines in fair value below recorded cost basis represent an impairment loss. We consider a credit-related impairment loss to have occurred:
•if there is intent to sell the security;
•if it is more likely than not that the security will be required to be sold before full recovery of its amortized cost basis; or
•if the entire amortized basis of the security is not expected to be recovered.
The assessment of whether the amortized cost basis of a security is expected to be recovered requires management to make assumptions regarding various matters affecting future cash flows. The choice of assumptions is subjective and requires the use of judgment. Actual credit losses experienced in future periods may differ from management’s current estimates of those credit losses. Methodologies used to estimate the present value of expected cash flows are:
The estimate of expected cash flows is determined by projecting a recovery value and a recovery time frame and assessing whether further principal and interest will be received. We consider various factors in projecting recovery values and recovery time frames, including the following:
•third-party research and credit rating reports;
•the current credit standing of the issuer, including credit rating downgrades, whether before or after the balance sheet date;
•the extent to which the decline in fair value is attributable to credit risk specifically associated with the security or its issuer;
•internal assessments and the assessments of external portfolio managers regarding specific circumstances surrounding an investment, which indicate the investment is more or less likely to recover its amortized cost than other investments with a similar structure;
•for asset-backed securities, the origination date of the underlying loans, the remaining average life, the probability that credit performance of the underlying loans will deteriorate in the future and our assessment of the quality of the collateral underlying the loan;
•failure of the issuer of the security to make scheduled interest or principal payments;
•any changes to the rating of the security by a rating agency;
•recoveries or additional declines in fair value subsequent to the balance sheet date;
•adverse legal or regulatory events;
•significant deterioration in the market environment that may affect the value of collateral (e.g., decline in real estate prices);
•significant deterioration in economic conditions; and
•disruption in the business model resulting from changes in technology or new entrants to the industry.
If deemed appropriate and necessary, a discounted cash flow analysis is performed to confirm whether a credit loss exists and, if so, the amount of the credit loss. We use the single best estimate approach for available-for-sale debt securities and consider all reasonably available data points, including industry analyses, credit ratings, expected defaults and the remaining
payment terms of the debt security. For fixed rate available-for-sale debt securities, cash flows are discounted at the security's effective interest rate implicit in the security at the date of acquisition. If the available-for-sale debt security’s contractual interest rate varies based on subsequent changes in an independent factor, such as an index or rate, for example, the prime rate, the SOFR, or the U.S. Treasury bill weekly average, that security’s effective interest rate is calculated based on the factor as it changes over the life of the security. If we intend to sell a debt security or believe we will more likely than not be required to sell a debt security before the amortized cost basis is recovered, any existing allowance will be written off against the security's amortized cost basis, with any remaining difference between the debt security's amortized cost basis and fair value recognized as an impairment loss in earnings.
Exclusive of securities where there is an intent to sell or where it is not more likely than not that the security will be required to be sold before recovery of its amortized cost basis, impairment for debt securities is separated into a credit component and a non-credit component. The credit component of an impairment is the difference between the security’s amortized cost basis and the present value of its expected future cash flows, while the non-credit component is the remaining difference between the security’s fair value and the present value of expected future cash flows. An allowance for expected credit losses will be recorded for the expected credit losses through income and the non-credit component is recognized in OCI. The amount of impairment recognized is limited to the excess of the amortized cost over the fair value of the available-for-sale debt security.
Deferred Taxes
Deferred federal income taxes arise from the recognition of temporary differences between the basis of assets and liabilities determined for financial reporting purposes and the basis determined for income tax purposes. Our temporary differences principally relate to our loss reserves, unearned and advanced premiums, DPAC, NOL and tax credit carryforwards, compensation related items, unrealized investment gains (losses) and basis differences on fixed assets, intangible assets and operating leases. Deferred tax assets and liabilities are measured using the enacted tax rates expected to be in effect when such benefits are realized. We review our deferred tax assets quarterly for impairment. If we determine that it is more likely than not that some or all of a deferred tax asset will not be realized, a valuation allowance is recorded to reduce the carrying value of the asset. In assessing the need for a valuation allowance, management is required to make certain judgments and assumptions about our future operations based on historical experience and information as of the measurement period regarding reversal of existing temporary differences, carryback capacity, future taxable income of the appropriate character (including its capital and operating characteristics) and tax planning strategies.
The largest portion of our deferred tax asset at December 31, 2024 is related to net unrealized investment losses on our fixed maturities due to the significant effect of fluctuations in interest rates beginning in 2022. Future changes in interest rates could cause significant fluctuations in the deferred tax asset. Any loss realized prior to recovery would require sufficient income of the appropriate character (i.e., capital gains), and in the appropriate time frame, to realize the tax benefit. We believe that we have the intent and ability to hold these securities until their recovery. Our projected positive operating income, including the investment income generated from holding our debt securities until maturity, support our ability to implement this tax planning strategy.
A valuation allowance has been established against the deferred tax asset related to the NOL carryforwards for our U.K. operations and against a portion of the deferred tax asset related to our U.S. state NOL carryforwards. Management concluded that it was more likely than not that this deferred tax assets will not be realized. We also established a valuation allowance in a prior year against the deferred tax assets of certain SPCs at our wholly owned Cayman Islands reinsurance subsidiary, Inova Re. Due to the cumulative losses incurred in recent years by these SPCs, management concluded that a valuation allowance was required. As of December 31, 2024, management concluded that the previously recorded valuation allowances were still required against the deferred tax assets related to the NOL carryforwards for our U.K. operations, against the deferred tax assets related to some of our U.S. state NOL carryforwards and the deferred tax assets of certain SPCs at Inova Re. Management’s assessment of the need for these valuation allowances at December 31, 2024 included an analysis of the available sources of income. See further discussion on ProAssurance’s deferred tax assets in Note 5 of the Notes to Consolidated Financial Statements.
U.S. Tax Legislation
Coronavirus Aid, Relief and Economic Security Act
In response to COVID-19, the CARES Act was signed into law on March 27, 2020 and contains several provisions for corporations and eased certain deduction limitations originally imposed by the TCJA. Temporary changes regarding NOL carryback provisions included in the CARES Act had a favorable impact on our liquidity, as we were able to carryback our 2019 and 2020 net operating losses to claim refunds (see discussion that follows in the Operating Activities and Related Cash Flows section under the heading "Taxes"). See further discussion in Note 5 of the Notes to Consolidated Financial Statements.
Unrecognized Tax Benefits
We evaluate tax positions taken on tax returns and recognize positions in our financial statements when it is more likely than not that we will sustain the position upon resolution with a taxing authority. If recognized, the benefit is measured as the largest amount of benefit that has a greater than 50% probability of being realized. We review uncertain tax positions each quarter, considering changes in facts and circumstances, such as changes in tax law, interactions with taxing authorities and developments in case law, and make adjustments as we consider necessary. Adjustments to our unrecognized tax benefits may affect our income tax expense, and settlement of uncertain tax positions may require the use of cash. Other than differences related to timing, no significant adjustments were considered necessary during 2024 or 2023. At December 31, 2024, our liability for unrecognized tax benefits was nominal in amount.
Liquidity and Capital Resources and Financial Condition
Overview
ProAssurance Corporation is a holding company and is a legal entity separate and distinct from its subsidiaries. As a holding company, our principal source of external revenue is our investment revenues. In addition, dividends from our operating subsidiaries represent another source of funds for our obligations, including debt service and shareholder dividends, if declared. We also charge our core domestic operating subsidiaries within our Specialty P&C and Workers' Compensation Insurance segments a management fee based on the extent to which services are provided to the subsidiary and the amount of gross premium written by the subsidiary. At December 31, 2024, we held cash and liquid investments of approximately $101 million outside our insurance subsidiaries that were available for use without regulatory approval or other restriction. As of February 20, 2025, we also have an additional $125 million in permitted borrowings available under our Revolving Credit Agreement as well as the possibility of a $50 million accordion feature, if successfully subscribed, as discussed in this section under the heading "Debt."
During 2024, our operating subsidiaries paid dividends to us of $66 million. Our insurance subsidiaries, in the aggregate, are permitted to pay dividends of approximately $145 million over the course of 2025 without prior approval of state insurance regulators. However, the payment of any dividend requires prior notice to the insurance regulator in the state of domicile, and the regulator may reduce or prevent the dividend if, in its judgment, payment of the dividend would have an adverse effect on the surplus of the insurance subsidiary. We make the decision to pay dividends from an insurance subsidiary based on the capital needs of that subsidiary and may pay less than the permitted dividend or may also request permission to pay an additional amount (an extraordinary dividend).
Cash Flows
Cash flows between periods compare as follows:
| | | | | | | | | | | | | | | | | |
| Year Ended December 31 |
| (In thousands) | 2024 | | 2023 | | Change |
| Net cash provided (used) by: | | | | | |
| Operating activities | $ | (10,715) | | | $ | (49,885) | | | $ | 39,170 | |
| Investing activities | 10,672 | | | 141,139 | | | (130,467) | |
| Financing activities | (10,974) | | | (55,315) | | | 44,341 | |
| Increase (decrease) in cash and cash equivalents | $ | (11,017) | | | $ | 35,939 | | | $ | (46,956) | |
The principal components of our operating cash flows are the excess of premiums collected and net investment income over losses paid and operating costs, including income taxes. Timing delays exist between the collection of premiums and the payment of losses associated with the premiums. Premiums are generally collected within the twelve-month period after the policy is written, while our claim payments are generally paid over a more extended period of time. Likewise, timing delays exist between the payment of claims and the collection of any associated reinsurance recoveries.
The increase in operating cash flows of $39.2 million in 2024 as compared to 2023 was primarily due to:
•A decrease in paid losses of $37.2 million driven by our Specialty P&C segment reflecting a lower number of claims resolved with large indemnity payments as compared to the prior year period. Claim costs in our MPL line of business continue to be pressured by social inflation and higher than anticipated loss severity trends.
•A decrease in cash paid for operating expenses of $28.4 million driven by a decrease in compensation-related costs, primarily as a result of a decrease in paid bonuses, premium taxes and commissions.
•An increase in cash received from investment income of $10.7 million driven by an increase in distributed earnings and redemptions from our portfolio of investments in LPs/LLCs and higher average book yields as we took advantage of the current interest rate environment as our portfolio matures.
The increase in operating cash flows was partially offset by:
•A decrease in net premium receipts of $18.7 million primarily driven by the proactive actions we have taken in certain lines of business to improve profitability.
•The effect of a tax refund of approximately $11.7 million which we received in February 2023 (see additional discussion within this section under the heading "Taxes" that follows).
•The prior year impact of proceeds of $6.9 million received in 2023 associated with the sale of our remaining ownership interest in the underwriting and operations entity associated with Syndicate 1729 to unrelated third parties.
The remaining variance in operating cash flows in 2024 as compared to 2023 was composed of individually insignificant components.
We manage our investing cash flows to ensure that we will have sufficient liquidity to meet our obligations, taking into consideration the timing of cash flows from our investments, including interest payments, dividends and principal payments, as well as the expected cash flows to be generated by our operations as discussed in this section under the heading "Investing Activities and Related Cash Flows."
Our financing cash flows are primarily comprised of share repurchases, borrowings and repayment of debt, as well as capital contributions received from or return of capital to external SPC participants. See further discussion of share repurchases and debt in this section under the heading "Financing Activities and Related Cash Flows."
Operating Activities and Related Cash Flows
Losses
The following table, known as the Analysis of Reserve Development, presents information over the preceding ten years regarding the payment of our losses as well as changes to (the development of) our estimates of losses during that time period. As noted in the table, we have completed various acquisitions over the ten year period which have affected original and re-estimated gross and net reserve balances as well as loss payments.
The table includes losses on both a direct and an assumed basis and is net of anticipated reinsurance recoverables. The gross liability for losses before reinsurance, as shown on the balance sheet, and the reconciliation of that gross liability to amounts net of reinsurance are reflected below the table. We do not discount our reserve for losses to present value. Information presented in the table is cumulative and, accordingly, each amount includes the effects of all changes in amounts for prior years. The table presents the development of our balance sheet reserve for losses; it does not present accident year or policy year development data. Conditions and trends that have affected the development of liabilities in the past may not necessarily occur in the future. Accordingly, it is not appropriate to extrapolate future redundancies or deficiencies based on this table.
The following may be helpful in understanding the Analysis of Reserve Development:
•The line entitled “Reserve for losses, undiscounted and net of reinsurance recoverables” reflects our reserve for losses and loss adjustment expense, less the receivables from reinsurers, each as reported in our Consolidated Balance Sheets at the end of each year (the Balance Sheet Reserves).
•The section entitled “Cumulative net paid, as of” reflects the cumulative amounts paid as of the end of each succeeding year with respect to the previously recorded Balance Sheet Reserves.
•The section entitled “Re-estimated net liability as of” reflects the re-estimated amount of the liability previously recorded as Balance Sheet Reserves that includes the cumulative amounts paid and an estimate of the remaining net liability based upon claims experience as of the end of each succeeding year (the Net Re-estimated Liability).
•The line entitled “Net cumulative redundancy (deficiency)” reflects the difference between the previously recorded Balance Sheet Reserve for each applicable year and the Net Re-estimated Liability relating thereto as of the end of the most recent fiscal year.
| | | | | | | | | | | | | | | | | | | | | | | | | | | | | | | | | | | | | | | | | | | | | | | | | | | | | | | | | | | | | | | | | |
| Analysis of Reserve Development |
|
| December 31 |
| (In thousands) | 2014 | | 2015 | | 2016 | | 2017 | | 2018 | | 2019 | | 2020 | | 2021 | | 2022 | | 2023 | | 2024 |
| Reserve for losses, undiscounted and net of reinsurance recoverables | $ | 1,812,299 | | | $ | 1,730,308 | | | $ | 1,681,423 | | | $ | 1,659,971 | | | $ | 1,709,129 | | | $ | 1,878,140 | | | $ | 1,945,099 | | | $ | 3,059,328 | | | $ | 2,973,196 | | | $ | 2,888,655 | | | $ | 2,775,805 | |
| Cumulative net paid, as of: | | | | | | | | | | | | | | | | | | | | | |
| One Year Later | 380,508 | | | 370,973 | | | 354,526 | | | 387,389 | | | 428,940 | | | 466,904 | | | 454,902 | | | 756,601 | | | 773,912 | | | 727,893 | | | |
| Two Years Later | 640,655 | | | 616,016 | | | 621,783 | | | 668,340 | | | 734,638 | | | 790,989 | | | 813,768 | | | 1,371,326 | | | 1,342,670 | | | | | |
| Three Years Later | 798,636 | | | 799,689 | | | 800,331 | | | 857,177 | | | 952,309 | | | 1,046,573 | | | 1,101,050 | | | 1,790,959 | | | | | | | |
| Four Years Later | 910,998 | | | 898,844 | | | 930,769 | | | 990,023 | | | 1,133,462 | | | 1,249,196 | | | 1,288,873 | | | | | | | | | |
| Five Years Later | 964,897 | | | 974,104 | | | 1,004,951 | | | 1,085,267 | | | 1,265,971 | | | 1,373,263 | | | | | | | | | | | |
| Six Years Later | 1,006,215 | | | 1,018,148 | | | 1,061,488 | | | 1,162,371 | | | 1,337,095 | | | | | | | | | | | | | |
| Seven Years Later | 1,030,782 | | | 1,051,495 | | | 1,110,311 | | | 1,198,522 | | | | | | | | | | | | | | | |
| Eight Years Later | 1,045,980 | | | 1,078,647 | | | 1,130,936 | | | | | | | | | | | | | | | | | |
| Nine Years Later | 1,066,063 | | | 1,092,023 | | | | | | | | | | | | | | | | | | | |
| Ten Years Later | 1,074,763 | | | | | | | | | | | | | | | | | | | | | |
| Re-estimated net liability as of: | | | | | | | | | | | | | | | | | | | | | |
| End of Year | 1,812,299 | | | 1,730,308 | | | 1,681,423 | | | 1,659,971 | | | 1,709,129 | | | 1,878,140 | | | 1,945,099 | | | 3,059,328 | | | 2,973,196 | | | 2,888,655 | | | |
| One Year Later | 1,651,117 | | | 1,587,029 | | | 1,547,876 | | | 1,565,867 | | | 1,696,893 | | | 1,827,153 | | | 1,902,813 | | | 3,015,241 | | | 2,975,793 | | | 2,841,623 | | | |
| Two Years Later | 1,511,542 | | | 1,460,660 | | | 1,444,619 | | | 1,487,905 | | | 1,656,615 | | | 1,805,433 | | | 1,885,456 | | | 3,025,786 | | | 2,928,757 | | | | | |
| Three Years Later | 1,388,682 | | | 1,356,075 | | | 1,337,571 | | | 1,446,571 | | | 1,647,283 | | | 1,792,202 | | | 1,890,578 | | | 2,982,007 | | | | | | | |
| Four Years Later | 1,288,564 | | | 1,257,650 | | | 1,306,274 | | | 1,432,477 | | | 1,632,836 | | | 1,768,451 | | | 1,872,584 | | | | | | | | | |
| Five Years Later | 1,221,463 | | | 1,231,713 | | | 1,299,032 | | | 1,415,077 | | | 1,605,374 | | | 1,746,868 | | | | | | | | | | | |
| Six Years Later | 1,204,642 | | | 1,230,562 | | | 1,287,731 | | | 1,394,624 | | | 1,593,134 | | | | | | | | | | | | | |
| Seven Years Later | 1,199,654 | | | 1,217,713 | | | 1,277,884 | | | 1,384,216 | | | | | | | | | | | | | | | |
| Eight Years Later | 1,183,973 | | | 1,216,727 | | | 1,274,519 | | | | | | | | | | | | | | | | | |
| Nine Years Later | 1,186,762 | | | 1,212,329 | | | | | | | | | | | | | | | | | | | |
| Ten Years Later | 1,187,289 | | | | | | | | | | | | | | | | | | | | | |
| | | | | | | | | | | | | | | | | | | | | |
| Net cumulative redundancy (deficiency) | $ | 625,010 | | | $ | 517,979 | | | $ | 406,904 | | | $ | 275,755 | | | $ | 115,995 | | | $ | 131,272 | | | $ | 72,515 | | | $ | 77,321 | | | $ | 44,439 | | | $ | 47,032 | | | |
| Original gross liability - end of year | $ | 2,052,768 | | | $ | 1,990,266 | | | $ | 1,961,436 | | | $ | 1,971,303 | | | $ | 2,037,274 | | | $ | 2,243,133 | | | $ | 2,295,279 | | | $ | 3,469,417 | | | $ | 3,373,260 | | | $ | 3,303,558 | | | |
| Reinsurance recoverables | (240,469) | | | (259,958) | | | (280,013) | | | (311,332) | | | (328,145) | | | (364,993) | | | (350,180) | | | (410,089) | | | (400,064) | | | (414,903) | | | |
| Original net liability - end of year | $ | 1,812,299 | | | $ | 1,730,308 | | | $ | 1,681,423 | | | $ | 1,659,971 | | | $ | 1,709,129 | | | $ | 1,878,140 | | | $ | 1,945,099 | | | $ | 3,059,328 | | | $ | 2,973,196 | | | $ | 2,888,655 | | | |
| Gross re-estimated liability - latest | $ | 1,376,945 | | | $ | 1,443,378 | | | $ | 1,517,600 | | | $ | 1,628,123 | | | $ | 1,887,784 | | | $ | 2,082,564 | | | $ | 2,209,546 | | | $ | 3,425,815 | | | $ | 3,365,601 | | | $ | 3,239,514 | | | |
| Re-estimated reinsurance recoverables | (189,656) | | | (231,049) | | | (243,081) | | | (243,907) | | | (294,650) | | | (335,696) | | | (336,962) | | | (443,808) | | | (436,844) | | | (397,891) | | | |
| Net re-estimated liability - latest | $ | 1,187,289 | | | $ | 1,212,329 | | | $ | 1,274,519 | | | $ | 1,384,216 | | | $ | 1,593,134 | | | $ | 1,746,868 | | | $ | 1,872,584 | | | $ | 2,982,007 | | | $ | 2,928,757 | | | $ | 2,841,623 | | | |
| Gross cumulative redundancy (deficiency) | $ | 675,823 | | | $ | 546,888 | | | $ | 443,836 | | | $ | 343,180 | | | $ | 149,490 | | | $ | 160,569 | | | $ | 85,733 | | | $ | 43,602 | | | $ | 7,659 | | | $ | 64,044 | | | |
See table notes on following page.
Table Notes
•We have elected to present reserve history for acquired entities on a prospective basis in the table above; therefore, certain items will not agree to the following table which details activity in our net reserve for losses.
•Given the Lloyd's Syndicates operations are in run-off and the reserve is relatively small on a standalone basis as compared to our consolidated reserve, we have elected to exclude its reserve history for all periods presented in the table above, which is consistent with prior year; therefore, certain items will not agree to the following table which details activity in our net reserve for losses.
•Reserves for 2014 include gross and net reserves acquired in 2014 business combinations of $153.2 million and $139.5 million, respectively.
•Reserves for 2021 include gross and net reserves acquired in 2021 business combinations of $1.2 billion and $1.1 billion, respectively.
In each year reflected in the table, we have estimated our reserve for losses utilizing the management and actuarial processes discussed under the heading "Reserve for Losses and Loss Adjustment Expenses" in the Critical Accounting Estimates section. Factors that have contributed to the variation in loss development are primarily related to the extended period of time required to resolve professional liability claims and include the following:
•The MPL legal environment deteriorated in the late 1990’s and severity began to increase at a greater pace than anticipated in our rates and reserve estimates. We addressed the adverse severity trends through increased rates, stricter underwriting and modifications to claims handling procedures, and reflected this adverse severity trend when we established our initial reserves for subsequent years.
•These adverse severity trends later moderated, with that moderation becoming more pronounced beginning in 2009. We were cautious in giving full recognition to indications that the pace of severity increase had slowed, however we gave measured recognition of the improved trend in our reserve estimates. The favorable development was most pronounced for years 2004 to 2008, as the initial reserves for these accident years were established prior to substantial indication that severity trends were moderating. We gave stronger recognition to the lower severity trend as time elapsed and a greater percentage of claims were closed.
•A general decline in claims frequency has also been a contributor to favorable loss development. A significant portion of our policies through 2003 were issued on an occurrence basis, and a smaller portion of our ongoing business results from the issuance of extended reporting endorsements which have occurrence-like exposure. As claims frequency declined, the number of reported claims related to these coverages was less than originally expected.
•Beginning in 2017, we identified potential higher severity trends in the broader MPL industry. These trends were also reflected in increases in estimates of ultimate losses for open MPL claims for earlier accident years, which resulted in a lower amount of favorable development recognized in 2018 and 2017 as compared to prior years.
•During 2019 the loss experience in our Specialty book in our Specialty P&C segment deteriorated further, particularly in regard to the reserves we established for a large national healthcare account that experienced losses far exceeding the assumptions we made when underwriting the account, beginning in 2016. As a result, we strengthened our Specialty reserves through the recognition of net unfavorable development on prior accident years and a higher current accident year net loss ratio in our Specialty P&C segment in 2019.
•The loss environment in our MPL line of business in our Specialty P&C segment continues to be challenging in many jurisdictions, as claim costs are pressured by social inflation and higher than anticipated loss severity trends which started to emerge in the fourth quarter of 2022. We continue to monitor the impact that these trends have on our open case reserves and prior accident year development. Further, beginning in the second half of 2023, we observed higher than expected loss trends in our average cost per claim in our Workers' Compensation Insurance segment which we primarily attribute to increased medical costs driven by wage inflation and medical advancements. In response to these trends, we increased both our current accident year loss ratio and prior year reserves in our Workers' Compensation Insurance segment in 2023.
Activity in our net reserve for losses during 2024, 2023 and 2022 is summarized below:
| | | | | | | | | | | | | | | | | |
| | Year Ended December 31 |
| (In thousands) | 2024 | | 2023 | | 2022 |
| Balance, beginning of year | $ | 3,401,281 | | | $ | 3,471,147 | | | $ | 3,579,940 | |
| Less reinsurance recoverables on unpaid losses and loss adjustment expenses | 445,573 | | | 431,889 | | | 451,741 | |
| Net balance, beginning of year | 2,955,708 | | | 3,039,258 | | | 3,128,199 | |
| | | | | |
| Net losses: | | | | | |
Current year(1) | 779,650 | | | 794,848 | | | 813,515 | |
(Favorable) unfavorable development of reserves established in prior years, net(1) | (40,215) | | | 5,646 | | | (36,753) | |
| Total | 739,435 | | | 800,494 | | | 776,762 | |
| Paid related to: | | | | | |
| Current year | (113,268) | | | (101,996) | | | (108,139) | |
| Prior years | (733,248) | | | (782,048) | | | (757,564) | |
| Total paid | (846,516) | | | (884,044) | | | (865,703) | |
| Net balance, end of year | 2,848,627 | | | 2,955,708 | | | 3,039,258 | |
| Plus reinsurance recoverables on unpaid losses and loss adjustment expenses | 409,069 | | | 445,573 | | | 431,889 | |
| Balance, end of year | $ | 3,257,696 | | | $ | 3,401,281 | | | $ | 3,471,147 | |
(1) Current year net losses for the year ended December 31, 2022 and net prior year reserve development recognized for years ended December 31, 2024, 2023 and 2022 includes certain purchase accounting adjustments associated with our acquisition of NORCAL. See Note 7 of the Notes to Consolidated Financial Statements for additional information.
At December 31, 2024 our gross reserve for losses included case reserves of approximately $2.1 billion and IBNR reserves of approximately $1.2 billion. Our consolidated gross reserve for losses on a GAAP basis exceeds the combined gross reserves of our insurance subsidiaries on a statutory basis by approximately $215 million, which is principally due to the portion of the GAAP reserve for losses that is reflected for statutory accounting purposes as unearned premiums. These unearned premiums are applicable to extended reporting endorsements (“tail” coverage) issued without a premium charge upon death, disability or retirement of an insured who meets certain qualifications.
Reinsurance
Within our Specialty P&C segment, we use insurance and reinsurance (collectively, “reinsurance”) to provide capacity to write larger limits of liability, to provide reimbursement for losses incurred under the higher limit coverages we offer and to provide protection against losses in excess of policy limits. Within our Workers' Compensation Insurance segment, we use reinsurance to reduce our net liability on individual risks, to mitigate the effect of significant loss occurrences (including catastrophic events), to stabilize underwriting results and to increase underwriting capacity by decreasing leverage. In both our Specialty P&C and Workers' Compensation Insurance segments, we use reinsurance in risk sharing arrangements to align our objectives with those of our strategic business partners and to provide custom insurance solutions for large customer groups. The purchase of reinsurance does not relieve us from the ultimate risk on our policies; however, it does provide reimbursement for certain losses we pay. We pay our reinsurers a premium in exchange for reinsurance of the risk. In certain of our excess of loss arrangements, the premium due to the reinsurer is determined by the loss experience of the business reinsured, subject to certain minimum and maximum amounts. Until all loss amounts are known, we estimate the premium due to the reinsurer. Changes to the estimate of premium owed under reinsurance agreements related to prior periods are recorded in the period in which the change in estimate occurs and can have a significant effect on net premiums earned.
We offer alternative market solutions whereby we cede certain premiums from our Workers' Compensation Insurance and Specialty P&C segments to either the SPCs at Inova Re, one of our Cayman Islands reinsurance subsidiaries which is reported in our Segregated Portfolio Cell Reinsurance segment, or captive insurers unaffiliated with ProAssurance for two programs. The majority of these policies are reinsured to the SPCs at Inova Re, net of a ceding commission. See further discussion on our SPC operations in the Segment Results - Segregated Portfolio Cell Reinsurance section that follows. The alternative market workers' compensation policies are ceded from our Workers' Compensation Insurance segment to the SPCs under 100% quota share reinsurance agreements. The alternative market medical professional liability policies are ceded from our Specialty P&C segment to the SPCs under either excess of loss or quota share reinsurance agreements, depending on the structure of the
individual program. The portion of the risk that is not ceded to an SPC is retained in our Specialty P&C segment and may also be reinsured under our standard medical professional liability reinsurance program, depending on the policy limits provided. The remaining premium written in our alternative market business is 100% ceded to unaffiliated captive insurers.
Excess of Loss Reinsurance Agreements
We generally reinsure risks under treaties (our excess of loss reinsurance agreements) pursuant to which the reinsurers agree to assume all or a portion of all risks that we insure above our individual risk retention levels, up to the maximum individual limits offered. These agreements are negotiated and renewed annually. Our Medical Professional Liability and Medical Technology Liability treaties renew annually on October 1 and our workers' compensation treaty renews annually on May 1. Our MPL and Medical Technology Liability treaties renewed October 1, 2024. Our MPL treaty renewal incorporated podiatric and chiropractic policies and MPL coverages in excess of $2 million changed from 9% to 0% co-participation. The next $24 million of risk changed from 9.5% to 7.5% co-participation. Our Medical Technology Liability treaty renewed at a higher rate than the previous treaty. All other material terms were consistent with the expiring treaties. Our traditional workers' compensation treaty renewed May 1, 2024 at a higher contract rate than the previous treaty and included the elimination of the AAD as well as an increase in the per occurrence retention to $0.75 million from $0.5 million. Overall, the impact of our traditional workers' compensation treaty renewal is expected to increase our ceded premium ratio while losses related to the increase in the per occurrence retention are expected to be more than offset by the elimination of the AAD. The significant coverages provided by our current excess of loss reinsurance agreements are depicted in the following table.
Current Excess of Loss Reinsurance Agreements
| | | | | | | | | | | | | | | | | |
| Medical Professional Liability | | Medical Technology &
Life Sciences Products | | Workers'
Compensation - Traditional |
(1) Effective October 1, 2020, one prepaid limit reinstatement of $21M and a second limit reinstatement of up to $21M for the second layer, subject to reinstatement premium, which attaches after the first reinstatement has been completely exhausted. All limit reinstatements thereafter require no additional premium. Effective October 1, 2021, limits can be reinstated a maximum of four times.
(2) Prior to October 1, 2020, retention was $1M.
(3) Historically, retention has ranged from 0% to 32.5%.
(4) Historically, retention has ranged from $1M to $2M.
(5) Subject to a limit of $20M per individual claimant. If an individual loss were to exceed this level the Company would retain this excess exposure. Historically, the limit per individual claimant has ranged from $15M to $20M.
(6) Historically, retention has ranged from $0.5M to $0.75M.
Large MPL risks that are above the limits of our basic reinsurance treaties may be reinsured on a facultative basis, whereby the reinsurer agrees to insure a particular risk up to a designated limit. We also have in place a number of risk sharing arrangements that apply to the first $1 million of losses for certain large healthcare systems and other insurance entities.
Other Reinsurance Arrangements
For the workers' compensation business ceded to Inova Re; each SPC has in place its own reinsurance arrangements, which are illustrated in the following table.
Segregated Portfolio Cell Reinsurance
| | | | | | | | |
| Per Occurrence Coverage | | Aggregate Coverage |
(1) The attachment point is based on a percentage of written premium within individual cells, ranges from 85% to 94%, and varies by cell.
Each SPC has participants and the profit or loss of each cell accrues fully to these cell participants. As previously discussed, we participate in certain SPCs to a varying degree. Each SPC maintains a loss fund initially equal to the difference between premium assumed by the cell and the ceding commission. The external participants of each cell provide collateral to us, typically in the form of a letter of credit that is initially equal to the difference between the loss fund of the SPC (amount of funds available to pay losses after deduction of ceding commission) and the aggregate attachment point of the reinsurance. Over time, an SPC's retained profits are considered in the determination of the collateral amount required to be provided by the cell's external participants.
Taxes
We are subject to the tax laws and regulations of the U.S., Cayman Islands and U.K. We file a consolidated U.S. federal income tax return that includes the parent company and its U.S. subsidiaries, except for ProAssurance American Mutual, A Risk Retention Group. Our filing obligations include a requirement to make quarterly payments of estimated taxes to the IRS using the corporate tax rate effective for the tax year. We did not make any quarterly estimated tax payments during the year ended December 31, 2024; however, estimated taxable income after consideration of NOL carryforwards and previously
deferred tax credits from our tax credit partnership investments as of December 31, 2024, indicates that an extension payment will be necessary in early 2025.
As a result of the CARES Act that was signed into law on March 27, 2020 we were permitted to carryback NOLs generated in tax years 2019 and 2020 for up to five years. We generated an NOL of approximately $33.3 million from the 2020 tax year that was carried back to the 2015 tax year that resulted in a tax refund of approximately $11.7 million which was received in February 2023. In addition, the CARES Act included the initial version of the ERC which was extended and expanded in December 2020 and March 2021. See further discussion of the ERC in Note 1 of the Notes to Consolidated Financial Statements. As an eligible employer under the provisions of the CARES Act, NORCAL filed a claim for a payroll tax refund of approximately $3.8 million during the second quarter of 2023, based on eligible wages paid during 2020.
As a result of the NORCAL acquisition, we have U.S. federal NOL carryforwards, which were approximately $18.9 million as of December 31, 2024. These NOL carryforwards are subject to limitation by Internal Revenue Code Section 382 and will begin to expire in 2035.
Investing Activities and Related Cash Flows
Our investments at December 31, 2024 and December 31, 2023 are comprised as follows:
| | | | | | | | | | | | | | | | | |
| | December 31, 2024 | | December 31, 2023 |
| ($ in thousands) | Carrying
Value | % of Total Investment | | Carrying
Value | % of Total Investment |
| Fixed maturities, available-for-sale: | | | | | |
| U.S. Treasury obligations | $ | 243,903 | | 5 | % | | $ | 243,525 | | 5 | % |
| U.S. Government-sponsored enterprise obligations | 14,894 | | 1 | % | | 18,724 | | 1 | % |
| State and municipal bonds | 446,601 | | 10 | % | | 454,381 | | 10 | % |
| Corporate debt | 1,727,775 | | 40 | % | | 1,750,574 | | 40 | % |
| Residential mortgage-backed securities | 478,799 | | 11 | % | | 430,137 | | 10 | % |
| Commercial mortgage-backed securities | 208,513 | | 5 | % | | 197,861 | | 5 | % |
| Other asset-backed securities | 461,722 | | 10 | % | | 398,395 | | 9 | % |
| Total fixed maturities, available-for-sale | 3,582,207 | | 82 | % | | 3,493,597 | | 80 | % |
| Fixed maturities, trading | 53,157 | | 1 | % | | 48,324 | | 1 | % |
| Total fixed maturities | 3,635,364 | | 83 | % | | 3,541,921 | | 81 | % |
| | | | | |
Equity investments(1) | 130,158 | | 3 | % | | 151,295 | | 4 | % |
| Short-term investments | 254,922 | | 5 | % | | 235,785 | | 5 | % |
| BOLI | 80,179 | | 2 | % | | 78,205 | | 2 | % |
| Investment in unconsolidated subsidiaries | 259,538 | | 6 | % | | 276,756 | | 6 | % |
| Other investments | 7,266 | | 1 | % | | 65,819 | | 2 | % |
| Total investments | $ | 4,367,427 | | 100 | % | | $ | 4,349,781 | | 100 | % |
(1)Includes $101.2 million and $114.9 million of investment grade bond funds as of December 31, 2024 and 2023, respectively, which are not subject to significant equity price risk. |
At December 31, 2024, 99% of our investments in available-for-sale fixed maturity securities were rated and the average rating was A+. The distribution of our investments in available-for-sale fixed maturity securities by rating were as follows:
| | | | | | | | | | | | | | | | | |
| December 31, 2024 | | December 31, 2023 |
| ($ in thousands) | Carrying
Value | % of Total Investment | | Carrying
Value | % of Total Investment |
| Rating* | | | | | |
| AAA | $ | 571,139 | | 16 | % | | $ | 489,121 | | 14 | % |
| AA+ | 710,841 | | 20 | % | | 689,491 | | 20 | % |
| AA | 208,986 | | 6 | % | | 206,471 | | 6 | % |
| AA- | 174,349 | | 5 | % | | 180,827 | | 5 | % |
| A+ | 248,353 | | 7 | % | | 286,723 | | 8 | % |
| A | 413,259 | | 11 | % | | 410,935 | | 12 | % |
| A- | 381,746 | | 11 | % | | 374,612 | | 11 | % |
| BBB+ | 197,142 | | 5 | % | | 194,140 | | 5 | % |
| BBB | 297,266 | | 8 | % | | 286,378 | | 8 | % |
| BBB- | 138,693 | | 4 | % | | 138,399 | | 4 | % |
| Below investment grade | 239,577 | | 6 | % | | 233,405 | | 6 | % |
| Not rated | 856 | | 1 | % | | 3,095 | | 1 | % |
| Total | $ | 3,582,207 | | 100 | % | | $ | 3,493,597 | | 100 | % |
| *Average of three NRSRO sources, presented as an S&P equivalent. Source: S&P, Copyright ©2025, S&P Global Market Intelligence |
A detailed listing of our investment holdings as of December 31, 2024 is located under the Financial Information heading on the Investor Relations page of our website which can be reached directly at https://investor.proassurance.com/financial-information/quarterly-investment-supplements/default.aspx or through links from the Investor Relations section of our website, https://investor.proassurance.com/corporate-profile/default.aspx.
We manage our investments to ensure that we will have sufficient liquidity to meet our obligations, taking into consideration the timing of cash flows from our investments, including interest payments, dividends and principal payments, as well as the expected cash flows to be generated or used by our operations. In addition to the interest and dividends we will receive from our investments, we anticipate that between $100 million and $140 million of our portfolio will mature (or be paid down) each quarter over the next twelve months and become available, if needed, to meet our cash flow requirements. Our reinvestment rate of cash flows compared to recent years is more intermittent due to anticipated higher severity and paid loss trends in our MPL line of business and our Workers' Compensation Insurance segment. From time to time our cash balances will fluctuate depending on the actual timing of paid losses. The primary outflow of cash at our insurance subsidiaries is related to paid losses and operating costs, including income taxes. The payment of individual claims cannot be predicted with certainty; therefore, we rely upon the history of paid claims in estimating the timing of future claims payments with consideration given to current and anticipated industry trends and macroeconomic conditions. To the extent that we may have an unanticipated shortfall in cash, we may either liquidate securities or borrow funds under existing borrowing arrangements through our Revolving Credit Agreement and the FHLB system. As of February 20, 2025, $175 million could be made available for use through our Revolving Credit Agreement, as discussed in this section under the heading "Debt." Given the duration of our investments, we do not foresee a shortfall that would require us to meet operating cash needs through additional borrowings. Additional information regarding our Revolving Credit Agreement is detailed in Note 10 of the Notes to Consolidated Financial Statements.
At December 31, 2024, our FAL was comprised of cash and cash equivalents and investment securities, primarily available-for-sale fixed maturities, deposited with Lloyd's which had a fair value of $11.7 million. During 2024, we received a return of approximately $9.1 million of cash from our FAL balances due to lower capital requirements for the 2023 underwriting year and lower economic capital assessments. Additional information regarding our FAL is detailed in Note 3 of the Notes to Consolidated Financial Statements.
Our investment portfolio continues to be primarily composed of high quality fixed income securities with approximately 93% of our fixed maturities being investment grade securities as determined by national rating agencies. The weighted average effective duration of our fixed maturity securities at December 31, 2024 was 3.22 years; the weighted average effective duration of our fixed maturity securities combined with our short-term securities was 3.01 years.
The carrying value and unfunded commitments for certain of our investments were as follows:
| | | | | | | | | | | | | | | | | |
| Carrying Value | | December 31, 2024 |
| ($ in thousands, except expected funding period) | December 31, 2024 | December 31, 2023 | | Unfunded Commitment | Expected funding period in years |
Qualified affordable housing project tax credit partnerships (1) | $ | 247 | | $ | 666 | | | $ | 67 | | 2 |
| | | | | |
| All other investments, primarily investment fund LPs/LLCs | 259,291 | | 276,090 | | | 148,657 | | 4 |
| Total | $ | 259,538 | | $ | 276,756 | | | $ | 148,724 | | |
(1) The carrying value reflects our total commitments (both funded and unfunded) to the partnerships, less any amortization, since our initial investment. We fund these investments based on funding schedules maintained by the partnerships. |
|
Investment fund LPs/LLCs are by nature less liquid and may involve more risk than other investments. We manage our risk through diversification of asset class and geographic location. At December 31, 2024, we had investments in 35 separate investment funds with a total carrying value of $259.3 million which represented approximately 6% of our total investments. Our investment fund LPs/LLCs generate earnings from trading portfolios, secured debt, debt securities, multi-strategy funds and private equity investments, and the performance of these LPs/LLCs is affected by the volatility of equity and credit markets. For our investments in LPs/LLCs, we record our allocable portion of the partnership operating income or loss as the results of the LPs/LLCs become available, typically following the end of a reporting period. As of December 31, 2024, our total funding commitments legally outstanding related to our investments in LPs/LLCs were approximately $148.7 million; however, we anticipate capital of approximately $82 million to be drawn based on our current estimates.
Financing Activities and Related Cash Flows
Treasury Shares
Treasury share activity for 2024, 2023 and 2022 was as follows:
| | | | | | | | | | | | | | | | | |
| (Share amounts in thousands) | 2024 | | 2023 | | 2022 |
| Treasury shares at the beginning of the period | 12,607 | | | 9,464 | | | 9,325 | |
| | | | | |
| Shares reacquired, at cost of $50.5 million and $3.3 million for 2023 and 2022, respectively | — | | | 3,143 | | | 139 | |
| | | | | |
| Treasury shares at the end of the period | 12,607 | | | 12,607 | | | 9,464 | |
We did not repurchase any common shares subsequent to December 31, 2024, and as of February 20, 2025, our remaining Board authorization was approximately $55.9 million.
Debt
Our outstanding debt consisted of the following:
| | | | | | | | | | | |
| ($ in thousands) | December 31,
2024 | | December 31,
2023 |
| | | |
| Contribution Certificates | $ | 181,163 | | | $ | 179,387 | |
| Revolving Credit Agreement | 125,000 | | | 125,000 | |
| Term Loan | 120,313 | | | 125,000 | |
| Total principal | 426,476 | | | 429,387 | |
| Less unamortized debt issuance costs | 1,603 | | | 2,254 | |
| Debt less unamortized debt issuance costs | $ | 424,873 | | | $ | 427,133 | |
|
Additional information regarding our debt is provided in Note 10 of the Notes to Consolidated Financial Statements.
To manage our exposure to interest rate risk due to variability in the base rate on borrowings under the Revolving Credit Agreement and Term Loan, we entered into two forward-starting interest rate swap agreements ("Interest Rate Swaps"). Additional information regarding our Interest Rate Swaps is provided in Note 11 of the Notes to Consolidated Financial Statements.
Two of our insurance subsidiaries are members of an FHLB. Through membership, those subsidiaries have access to secured cash advances which can be used for liquidity purposes or other operational needs. In order for us to use FHLB
proceeds, regulatory approvals may be required depending on the nature of the transaction. To date, those subsidiaries have not materially utilized their membership for borrowing purposes.
Contingent Consideration
During 2024, the contingent consideration associated with the 2021 NORCAL acquisition was settled, and the corresponding liability was reduced to zero as of June 30, 2024. The $6.5 million decrease during the year ended December 31, 2024 was recognized as a component of net investment gains (losses). During the year ended December 31, 2023, we recorded an $8.5 million decrease to the contingent consideration liability comprised of $5.0 million related to the remeasurement of the liability to fair value (component of net investment gains (losses)) and $3.5 million related to the impact of unfavorable development recognized in 2023 on NORCAL's reserves related to accident years 2020 and prior (component of operating expenses). See further discussion that follows under the heading "Results of Operations."
Contingent consideration is measured at fair value on the date of acquisition and remeasured at fair value each subsequent reporting period. Fair value of a liability represents the price that would be paid to transfer the liability in an orderly transaction between market participants at the measurement date considering characteristics specific to the liability. As of December 31, 2023, the contingent consideration liability was $6.5 million carried at fair value utilizing a stochastic model (see Note 2 of the Notes to Consolidated Financial Statements). As of December 31, 2023, the remaining uncertainty around the analysis to be performed by the independent actuary was a significant component in the determination of the fair value of the liability. See further discussion around the contingent consideration in Note 1, Note 2 and Note 8 of the Notes to Consolidated Financial Statements.
Given the contingent consideration associated with the NORCAL acquisition was dependent upon the after-tax development of NORCAL's ultimate net losses between December 31, 2020 and December 31, 2023, we bifurcated changes in the contingent consideration for periods prior to 2024 between fair value changes and, if applicable, changes in estimates of NORCAL's ultimate net losses for accident years 2020 and prior. See further discussion regarding our estimates of ultimate net losses under the heading "Reserve for Losses and Loss Adjustment Expenses" in the Critical Accounting Estimates section. Changes in the contingent consideration related to fair value are recognized in earnings as a component of net investment gains (losses) and changes in the contingent consideration related to changes in estimates of NORCAL's ultimate net losses for accident years 2020 and prior are recognized in earnings as a component of operating expenses.
Results of Operations - Year Ended December 31, 2024 Compared to Year Ended December 31, 2023
Selected consolidated financial data for each period is summarized in the table below.
| | | | | | | | | | | | | | | | | |
| Year Ended December 31 |
| ($ in thousands, except per share data) | 2024 | | 2023 | | Change |
| Revenues: | | | | | |
| Net premiums written | $ | 953,675 | | | $ | 985,994 | | | $ | (32,319) | |
| Net premiums earned | $ | 968,250 | | | $ | 977,397 | | | $ | (9,147) | |
| | | | | |
| | | | | |
| Net investment result | 166,741 | | | 135,210 | | | 31,531 | |
| Net investment gains (losses) | 1,903 | | | 13,828 | | | (11,925) | |
| Other income (expense) | 13,510 | | | 10,777 | | | 2,733 | |
| Total revenues | 1,150,404 | | | 1,137,212 | | | 13,192 | |
| | | | | |
| Expenses: | | | | | |
| | | | | |
| | | | | |
| Net losses and loss adjustment expenses | 739,435 | | | 800,494 | | | (61,059) | |
| Underwriting, policy acquisition and operating expenses | 319,339 | | | 300,744 | | | 18,595 | |
| SPC U.S. federal income tax expense (benefit) | 1,766 | | | 1,629 | | | 137 | |
| SPC dividend expense (income) | 4,444 | | | 6,234 | | | (1,790) | |
| Interest expense | 22,342 | | | 23,150 | | | (808) | |
| Goodwill impairment | — | | | 44,110 | | | (44,110) | |
| Total expenses | 1,087,326 | | | 1,176,361 | | | (89,035) | |
| | | | | |
| Income (loss) before income taxes | 63,078 | | | (39,149) | | | 102,227 | |
| Income tax expense (benefit) | 10,334 | | | (545) | | | 10,879 | |
| Net income (loss) | $ | 52,744 | | | $ | (38,604) | | | $ | 91,348 | |
| Non-GAAP operating income (loss) | $ | 48,592 | | | $ | (9,014) | | | $ | 57,606 | |
| Earnings (loss) per share: | | | | | |
| Basic | $ | 1.03 | | | $ | (0.73) | | | $ | 1.76 | |
| Diluted | $ | 1.03 | | | $ | (0.73) | | | $ | 1.76 | |
| Non-GAAP operating income (loss) per share: | | | | | |
| Basic | $ | 0.95 | | | $ | (0.17) | | | $ | 1.12 | |
| Diluted | $ | 0.95 | | | $ | (0.17) | | | $ | 1.12 | |
| Net loss ratio | 76.4 | % | | 81.9 | % | | (5.5 pts) |
| Underwriting expense ratio | 33.0 | % | | 30.8 | % | | 2.2 pts |
| Combined ratio | 109.4 | % | | 112.7 | % | | (3.3 pts) |
| Operating ratio | 94.5 | % | | 99.6 | % | | (5.1 pts) |
| Effective tax rate | 16.4 | % | | 1.4 | % | | 15.0 pts |
| Return on equity* | 4.6 | % | | (3.5 | %) | | 8.1 pts |
| Non-GAAP operating return on equity* | 4.2 | % | | (0.8 | %) | | 5.0 pts |
| *See further discussion on this calculation in the Executive Summary of Operations section under the heading "Non-GAAP Operating ROE." |
In all tables that follow, the abbreviation "nm" indicates that the information or the percentage change is not meaningful. |
Executive Summary of Operations
The following sections provide an overview of our consolidated and segment results of operations for the year ended December 31, 2024 as compared to the year ended December 31, 2023. See the Segment Results sections that follow for additional information regarding each segment's results. For a full discussion of the changes in the financial condition, results of operations and cash flows for the year ended December 31, 2023 as compared to the year ended December 31, 2022, please refer to Item 7, "Management's Discussion and Analysis of Financial Condition and Results of Operations" section of ProAssurance's December 31, 2023 report on Form 10-K.
Revenues
The following table shows our consolidated and segment net premiums earned:
| | | | | | | | | | | | | | | | | | | | | | | |
| Year Ended December 31 |
| ($ in thousands) | 2024 | | 2023 | | Change |
| Net premiums earned | | | | | | | |
| Specialty P&C | $ | 747,942 | | | $ | 755,817 | | | $ | (7,875) | | | (1.0 | %) |
| Workers' Compensation Insurance | 167,610 | | | 160,034 | | | 7,576 | | | 4.7 | % |
| Segregated Portfolio Cell Reinsurance | 52,698 | | | 61,546 | | | (8,848) | | | (14.4 | %) |
| Consolidated total | $ | 968,250 | | | $ | 977,397 | | | $ | (9,147) | | | (0.9 | %) |
For the year ended December 31, 2024, consolidated net premiums decreased $9.1 million as compared to 2023.
•For our Specialty P&C segment, net premiums earned decreased during 2024 as compared to 2023 driven by our ceased participation in Syndicate 1729 for the 2024 underwriting year and, to a lesser extent, the pro rata effect of a decrease in the volume of premium written during the preceding twelve months, primarily due to proactive actions taken in certain lines to improve profitability.
•For our Workers' Compensation Insurance segment, net premiums earned increased in 2024 due to higher renewal premium, including the renewal of certain policies as traditional business that were previously written in one of the alternative market programs in our Segregated Portfolio Cell Reinsurance segment, and an increase in audit premium billed to policyholders, partially offset by the continuation of competitive market conditions.
•Net premiums earned in our Segregated Portfolio Cell Reinsurance segment decreased during 2024 primarily due to the non-renewal of two programs; however, as the underlying policies expired in one of these programs, a majority of those policies renewed as traditional business in our Workers' Compensation Insurance segment. The other program, in which we do not participate in the underwriting results, assumed both workers' compensation insurance and medical professional liability insurance.
The following table shows our consolidated net investment result:
| | | | | | | | | | | | | | | | | | | | | | | |
| Year Ended December 31 |
| ($ in thousands) | 2024 | | 2023 | | Change |
| Net investment income | $ | 144,538 | | | $ | 128,419 | | | $ | 16,119 | | | 12.6 | % |
| Equity in earnings (loss) of unconsolidated subsidiaries* | 22,203 | | | 6,791 | | | 15,412 | | | 226.9 | % |
| Net investment result | $ | 166,741 | | | $ | 135,210 | | | $ | 31,531 | | | 23.3 | % |
| *Equity in earnings (loss) of unconsolidated subsidiaries includes our share of the operating results of interests we hold in certain LPs/LLCs as well as the operating results associated with our tax credit partnership investments, which are designed to generate returns in the form of tax credits and tax-deductible project operating losses. See further discussion around our tax credit partnership investments in the Segment Results - Corporate section under the heading "Net Investment Income" that follows. |
| | | | | | | |
The increase in our consolidated net investment income for the year ended December 31, 2024 as compared to 2023 reflected higher average book yields as we took advantage of the current interest rate environment as well as an increase in average investment balances. Our equity in earnings of unconsolidated subsidiaries increased in 2024 as compared to 2023 driven by the performance of certain LPs/LLCs. These results are typically reported on a one-quarter lag, and the increase reflected higher market valuations during the fourth quarter of 2023 and first half of 2024.
The following table shows our total consolidated net investment gains (losses):
| | | | | | | | | | | | | | | | | | | | | | | |
| Year Ended December 31 |
| ($ in thousands) | 2024 | | 2023 | | Change |
| Net impairment losses recognized in earnings | $ | (3,196) | | | $ | (3,111) | | | $ | (85) | | | 2.7 | % |
Contingent Consideration remeasurement gain(1) | 6,500 | | | 5,000 | | | 1,500 | | | 30.0 | % |
| Other net investment gains (losses) | (1,401) | | | 11,939 | | | (13,340) | | | (111.7 | %) |
| Net investment gains (losses) | $ | 1,903 | | | $ | 13,828 | | | $ | (11,925) | | | (86.2 | %) |
(1) Represents the change in the fair value of contingent consideration issued in connection with the NORCAL acquisition. See previous discussion under the heading "Contingent Consideration" in the Financing Activities and Related Cash Flows section. We do not consider these adjustments in assessing the financial performance of any of our segments and therefore, we have excluded them from the Segment Results sections that follow. See Note 16 of the Notes to Consolidated Financial Statements for a reconciliation of our segment results to our consolidated results. |
For the year ended December 31, 2024, we recognized $3.3 million of credit-related impairment losses in earnings, primarily related to four corporate bonds in the real estate sector. For the year ended December 31, 2023, we recognized credit-related impairment losses in earnings of $3.1 million related to a mortgage-backed security and two corporate bonds in the financial sector. Additional information regarding investment impairment losses is provided in Note 3 of the Notes to Consolidated Financial Statements.
We recognized $1.4 million of other net investment losses for the year ended December 31, 2024 driven by net realized losses from the sale of certain available-for-sale fixed maturities and, to a lesser extent, unrealized holding losses resulting from changes in the fair value of our equity investments. We recognized $11.9 million of other net investment gains for the year ended December 31, 2023 driven by unrealized holding gains resulting from changes in the fair value of our convertible securities and equity investments and, to a lesser extent, death benefit proceeds from BOLI contracts.
Consolidated other income (expense) for the year ended December 31, 2024 as compared to 2023 was comprised as follows:
| | | | | | | | | | | | | | | | | | | | | | | |
| Year Ended December 31 |
| ($ in thousands) | 2024 | | 2023 | | Change |
Foreign currency exchange rate gains (losses)(1) | $ | 6,731 | | | $ | (2,993) | | | $ | 9,724 | | | 324.9 | % |
| Other | 6,779 | | | 13,770 | | | (6,991) | | | (50.8 | %) |
| Other income (expense) | $ | 13,510 | | | $ | 10,777 | | | $ | 2,733 | | | 25.4 | % |
(1) Includes a gain of $0.3 million for the year ended December 31, 2024 related to a foreign currency forward contract, which is designed to mitigate our exposure related to fluctuations in exchange rates associated with foreign currency denominated available-for-sale fixed maturities and loss reserves. Additional information regarding our foreign currency forward contract is provided in Note 11 of the Notes to the Consolidated Financial Statements. |
Excluding foreign currency exchange movements, other income decreased for the year ended December 31, 2024 as compared to 2023 driven by proceeds of $6.9 million received in 2023 associated with the sale of our remaining ownership interest in the underwriting and operations entity associated with Syndicate 1729 to unrelated third parties.
Foreign currency exchange rate movements are primarily related to foreign currency denominated loss reserves associated with premium assumed from an international medical professional liability insured in our Specialty P&C segment. Our participation in this program has grown in recent years which has led to greater volatility in our results of operations even with nominal movements in exchange rates given the size of the reserve. We mitigate foreign exchange exposure by generally matching the currency and duration of associated investments to the corresponding loss reserves as well as utilizing foreign currency forward contracts. When we invest in foreign currency denominated available-for-sale fixed maturities, in accordance with GAAP, the change in market value due to changes in foreign currency exchange rates is reflected as part of OCI. Conversely, the impact of changes in foreign currency exchange rates on loss reserves is reflected through net income (loss) as a component of other income (expense). The effect of exchange rate movements on foreign currency denominated loss reserves are reported in our Corporate segment to be consistent with the reporting of the foreign currency denominated invested assets and associated investment income.
Expenses
The following table shows our consolidated and segment net loss ratios and net prior accident year reserve development.
| | | | | | | | | | | | | | | | | |
| Year Ended December 31 |
| ($ in millions) | 2024 | | 2023 | | Change |
| Current accident year net loss ratio | | | | | |
| Consolidated ratio | 80.5 | % | | 81.3 | % | | (0.8 | pts) |
| Specialty P&C | 82.3 | % | | 82.6 | % | | (0.3 | pts) |
| Workers' Compensation Insurance | 77.0 | % | | 81.3 | % | | (4.3 | pts) |
| Segregated Portfolio Cell Reinsurance | 66.8 | % | | 65.5 | % | | 1.3 | pts |
| Calendar year net loss ratio | | | | | |
| Consolidated ratio | 76.4 | % | | 81.9 | % | | (5.5 | pts) |
| Specialty P&C | 77.3 | % | | 82.7 | % | | (5.4 | pts) |
| Workers' Compensation Insurance | 76.7 | % | | 87.1 | % | | (10.4 | pts) |
| Segregated Portfolio Cell Reinsurance | 61.6 | % | | 59.1 | % | | 2.5 | pts |
| Favorable (unfavorable) reserve development, prior accident years | | | | | |
| Consolidated | $ | 40.2 | | $ | (5.6) | | $ | 45.8 |
| Specialty P&C | $ | 36.9 | | $ | (0.3) | | $ | 37.2 |
| Workers' Compensation Insurance | $ | 0.5 | | $ | (9.3) | | $ | 9.8 |
| Segregated Portfolio Cell Reinsurance | $ | 2.8 | | $ | 4.0 | | $ | (1.2) |
Each line of business' contribution to the change in our consolidated current accident year net loss ratio for the year ended December 31, 2024 as compared to 2023 is as follows:
| | | | | |
| (In percentage points) | Increase (Decrease) 2024 versus 2023 |
| Estimated ratio increase (decrease) attributable to: | |
Medical Professional Liability (1) | (0.5 pts) |
| Medical Technology Liability | 0.1 pts |
| |
Workers' Compensation Insurance (2) | (0.7 pts) |
| Segregated Portfolio Cell Reinsurance | 0.1 pts |
| Other | 0.2 pts |
| |
| |
| |
| |
| Decrease in the consolidated current accident year net loss ratio | (0.8 pts) |
|
(1) The improvement in the MPL line of business current accident year net loss ratio, which represents the largest product line within our Specialty P&C segment, was driven by our continued underwriting and pricing actions which have resulted in our decrease to certain expected loss ratios during the first quarter of 2024.
(2) The improvement in the Workers' Compensation Insurance segment's current accident year net loss ratio reflects the impact of underwriting actions taken in 2023 due to higher than expected average claim costs that we began to observe and react to in 2023. While we continue to observe, and therefore reflect, higher medical loss cost trends, we have seen these trends begin to moderate in 2024, including a reduction in the 2024 average cost per claim.
Our consolidated calendar year net loss ratio can be lower than or higher than our consolidated current accident year net loss ratio due to the recognition of either favorable or unfavorable prior accident year reserve development, respectively. For all periods presented, total net prior accident year reserve development included the favorable impacts of purchase accounting amortization, as shown in the following table.
| | | | | | | | | | | | | | | | | | | | | | | |
| Year Ended December 31 |
| ($ in thousands) | 2024 | | 2023 | | Change |
| Net favorable (unfavorable) reserve development | $ | 34,891 | | $ | (13,978) | | $ | 48,869 | | | 349.6 | % |
| NORCAL Acquisition - Purchase Accounting Amortization | 5,324 | | 8,332 | | (3,008) | | | (36.1 | %) |
| Total net favorable (unfavorable) reserve development | $ | 40,215 | | $ | (5,646) | | $ | 45,861 | | | 812.3 | % |
|
Net favorable reserve development recognized in 2024 is primarily attributable to favorable trends in claim closing patterns in our MPL line of business in our Specialty P&C segment. See the Segment Results sections that follow for additional information regarding each segment's current accident year net loss ratio and net prior accident year reserve development.
Our consolidated and segment underwriting expense ratios were as follows:
| | | | | | | | | | | | | | | | | |
| Year Ended December 31 |
| 2024 | | 2023 | | Change |
| Underwriting Expense Ratio | | | | | |
Consolidated (1) | 33.0 | % | | 30.8 | % | | 2.2 | pts |
| Specialty P&C | 27.2 | % | | 25.8 | % | | 1.4 | pts |
| Workers' Compensation Insurance | 37.0 | % | | 34.4 | % | | 2.6 | pts |
| Segregated Portfolio Cell Reinsurance | 34.3 | % | | 33.2 | % | | 1.1 | pts |
Corporate (2) | 4.1 | % | | 3.5 | % | | 0.6 | pts |
(1) Consolidated underwriting expenses for 2024 include $0.3 million of actuarial consulting fees paid in connection with the final determination of contingent consideration associated with the acquisition of NORCAL. These transaction-related costs are not included in a segment as we do not consider these costs in assessing the financial performance of any of our operating or reportable segments. We did not incur any transaction-related costs during 2023. See Note 16 of the Notes to Consolidated Financial Statements for a reconciliation of our segment results to our consolidated results. |
(2) There are no net premiums earned associated with the Corporate segment. Ratios shown are the contribution of the Corporate segment to the consolidated ratio (Corporate operating expenses divided by consolidated net premiums earned). |
The change in our consolidated underwriting expense ratio for the year ended December 31, 2024 as compared to 2023 was primarily attributable to the following:
| | | | | | | | |
| (In percentage points) | Increase (Decrease) 2024 versus 2023 |
| Estimated ratio increase (decrease) attributable to: | |
| Change in Net Premiums Earned and DPAC amortization | 0.2 pts |
| |
| |
| |
| Prior Year One-Time Items | 0.7 pts |
| |
| All other, net | 1.3 pts |
| Increase in the underwriting expense ratio | 2.2 pts |
|
|
|
|
•Excluding the impact of the items specifically identified in the table above, our consolidated underwriting expense ratio increased by 1.3 percentage points in 2024 as compared to 2023 driven by higher amounts accrued for performance-related incentive plans across the organization due to the improvement in the related performance metrics, partially offset by a decrease in professional fees.
•As shown in the previous table, our consolidated underwriting expense ratio for 2024 reflected the impact of the change in DPAC amortization which was relatively in line with the corresponding change in net premiums earned as compared to 2023.
•As shown in the previous table, our consolidated underwriting expense ratio for 2024 reflected the prior year impact of certain one-time items that are unique or non-recurring in nature recorded in 2023 that resulted in a benefit to operating expenses in our Specialty P&C segment. We recognized a claim for a payroll tax refund of $3.8 million related to the employee retention credit and a reduction to operating expenses of $3.5 million related to the reduction to the contingent consideration liability associated with the NORCAL acquisition. See additional discussion on the ERC in Note 1 of the Notes to Consolidated Financial Statements and previous discussion on contingent consideration in the Financing Activities and Related Cash Flows section under the heading "Contingent Consideration."
Taxes
Our consolidated effective tax rates for the years ended December 31, 2024 and 2023 were as follows:
| | | | | | | | | | | | | | | | | | | | |
| ($ in thousands) | Year Ended December 31 |
| 2024 | | 2023 | | Change |
| Income (loss) before income taxes | $ | 63,078 | | | $ | (39,149) | | | $ | 102,227 | | 261.1% |
| Income tax expense (benefit) | 10,334 | | | (545) | | | 10,879 | | 1,996.1% |
| Net income (loss) | $ | 52,744 | | | $ | (38,604) | | | $ | 91,348 | | 236.6% |
| Effective tax rate | 16.4% | | 1.4% | | 15.0 pts | |
The comparability of our effective tax rates is impacted by the consolidated pre-tax income recognized during 2024 as compared to the consolidated pre-tax loss recognized during 2023. See further discussion on our effective tax rate in the Segment Results - Corporate section that follows under the heading "Taxes."
Operating Ratio
Our operating ratio is our combined ratio, less our investment income ratio. This ratio provides the combined effect of underwriting profitability and investment income. Our operating ratio for the years ended December 31, 2024 and 2023 was as follows:
| | | | | | | | | | | | | | | | | |
| Year Ended December 31 |
| 2024 | | 2023 | | Change |
| Combined ratio | 109.4 | % | | 112.7 | % | | (3.3 | pts) |
| Less: investment income ratio | 14.9 | % | | 13.1 | % | | 1.8 | pts |
| Operating ratio | 94.5 | % | | 99.6 | % | | (5.1 | pts) |
| | | | | |
| | | | | |
|
| | | | | |
| | | | | |
|
The primary drivers of the change in our operating ratio were as follows:
| | | | | | | |
| (In percentage points) | | | Increase (Decrease) 2024 versus 2023 |
| Estimated ratio increase (decrease) attributable to: | | | |
Change in Prior Accident Year Reserve Development(1) | | | (4.7 pts) |
| Investment Income | | | (1.8 pts) |
| Prior Year One-Time Items | | | 0.7 pts |
| | | |
| All other, net | | | 0.7 pts |
| Decrease in the operating ratio | | | (5.1 pts) |
(1) Includes the impact of purchase accounting amortization on prior accident year reserve development related to the NORCAL acquisition. |
|
Excluding the impact of the items specifically identified in the table above, our operating ratio in 2024 increased by approximately 0.7 percentage points as compared to 2023 driven by an increase in the consolidated underwriting expense ratio, partially offset by an improvement in the current accident year net loss ratio in our Workers' Compensation Insurance and Specialty P&C segments. See previous discussion in this section under the heading "Expenses" and further discussion in our Segment Results sections that follow.
Non-GAAP Financial Measures
Non-GAAP Operating Income (Loss)
Non-GAAP operating income (loss) is a financial measure that is widely used to evaluate performance within the insurance sector. In calculating Non-GAAP operating income (loss), we have excluded the effects of the items listed in the following table that do not reflect normal results. We believe Non-GAAP operating income (loss) presents a useful view of the
performance of our ongoing core insurance operations; however, it should be considered in conjunction with net income (loss) computed in accordance with GAAP.
The following table is a reconciliation of net income (loss) to Non-GAAP operating income (loss):
| | | | | | | | | | | |
| Year Ended December 31 |
| (In thousands, except per share data) | 2024 | | 2023 |
| Net income (loss) | $ | 52,744 | | | $ | (38,604) | |
| Items excluded in the calculation of Non-GAAP operating income (loss): | | | |
| | | |
Net investment (gains) losses(1) | (1,903) | | | (13,828) | |
Net investment gains (losses) attributable to SPCs in which no profit/loss is retained(2) | 1,773 | | | 2,925 | |
Transaction-related costs(3) | 320 | | | — | |
| Goodwill impairment | — | | | 44,110 | |
Foreign currency exchange rate (gains) losses(4) | (6,731) | | | 2,993 | |
Non-operating income(5) | — | | | (6,878) | |
| Guaranty fund assessments (recoupments) | (873) | | | 57 | |
Non-core operations(6) | 3,331 | | | (1,683) | |
| | | |
| | | |
| Pre-tax effect of exclusions | (4,083) | | | 27,696 | |
Tax effect, at 21%(7) | (69) | | | 1,894 | |
| After-tax effect of exclusions | (4,152) | | | 29,590 | |
| | | |
| | | |
| | | |
| | | |
| Non-GAAP operating income (loss) | $ | 48,592 | | | $ | (9,014) | |
| Per diluted common share: | | | |
| Net income (loss) | $ | 1.03 | | | $ | (0.73) | |
| Effect of exclusions | (0.08) | | | 0.56 | |
| Non-GAAP operating income (loss) per diluted common share | $ | 0.95 | | | $ | (0.17) | |
(1) Net investment gains (losses) recognized in earnings are primarily driven by changes in the value of investments that are marked to fair value each period, the nature and timing of which are unrelated to our normal operating results. Net investment gains (losses) for the year ended December 31, 2024 include the $6.5 million decrease to the contingent consideration liability during the second quarter of 2024. Net investment gains (losses) during the year ended December 31, 2023 include a gain of $5.0 million related to the remeasurement of the contingent consideration liability to fair value. See further discussion around the contingent consideration in Note 2 and Note 8 of the Notes to Consolidated Financial Statements and previous discussion under the heading "Contingent Consideration" in the Financing Activities and Related Cash Flows section.
(2) Net investment gains (losses) on investments related to SPCs are recognized in our Segregated Portfolio Cell Reinsurance segment. SPC results, including any net investment gain or loss, that are attributable to external cell participants are reflected in the SPC dividend expense (income). To be consistent with our exclusion of net investment gains (losses) recognized in earnings, we are excluding the portion of net investment gains (losses) that is included in the SPC dividend expense (income) which is attributable to the external cell participants.
(3) Transaction-related costs are attributable to actuarial consulting fees paid during the second quarter of 2024 in relation to the final determination of contingent consideration associated with the NORCAL acquisition. See previous discussion under the heading "Contingent Consideration" in the Financing Activities and Related Cash Flows section. We are excluding these costs as they do not reflect normal operating results and are unique and non-recurring in nature.
(4) Foreign currency exchange rate movements relate to foreign currency denominated loss reserves predominately associated with premium assumed from an international medical professional liability insured in our Specialty P&C segment. Our participation in this program has grown in recent years which has led to greater volatility in our results of operations even with nominal movements in exchange rates given the size of the reserve. We mitigate foreign exchange rate exposure on our Consolidated Balance Sheet by generally matching the currency and duration of associated investments to the corresponding loss reserves as well as utilizing foreign currency forward contracts. When we invest in foreign currency denominated available-for-sale fixed maturities, in accordance with GAAP, the change in market value due to changes in foreign currency exchange rates is reflected as a part of OCI. Conversely, the impact of changes in foreign currency exchange rates on loss reserves is reflected through net income (loss) as a component of other income (expense). Therefore, we believe foreign currency exchange rate gains (losses) in our Consolidated Statements of Income and Comprehensive Income in isolation are not indicative of our operating performance. To be consistent with our exclusion of foreign currency exchange rate gains (losses) recognized in earnings, we are excluding the changes in the value of the associated foreign currency forward contract. Additional information regarding our foreign currency forward contract is provided in Note 11 of the Notes to the Consolidated Financial Statements.
(5) Non-operating income includes proceeds associated with the sale of our remaining ownership interest in the underwriting and operations entity associated with Syndicate 1729 to unrelated third parties recognized in other income in our Corporate segment. We are excluding these costs as they do not reflect normal operating results and are unique and non-recurring in nature.
(6) Non-core operations includes the net results from our Lloyd's Syndicates operations from our previous participation in Syndicate 1729 and Syndicate 6131 at Lloyd's of London, which is currently in run off. Net investment gains (losses) recognized in earnings associated with these investments are included in the adjustment for consolidated net investment gains (losses) as described in footnote 1. We are excluding these results from our Lloyd's Syndicates operations as they are irrelevant to our ongoing operations and do not qualify for Discontinued Operations under GAAP.
(7) Our statutory tax rate was applied to these items in calculating net income (loss), excluding the 2023 goodwill impairment loss which is not tax deductible. Changes in the contingent consideration liability are non-taxable and therefore had no associated income tax impact. The taxes associated with the net investment gains (losses) related to SPCs in our Segregated Portfolio Cell Reinsurance segment are paid by the individual SPCs and are not included in our consolidated tax provision or net income (loss); therefore, both the net investment gains (losses) from our Segregated Portfolio Cell Reinsurance segment and the adjustment to exclude the portion of net investment gains (losses) included in the SPC dividend expense (income) in the table above are not tax effected. There are no taxes associated with our Lloyd’s Syndicates operations in our consolidated tax provision due to the availability of net operating losses and the full valuation allowance recorded against the deferred tax assets. Accordingly, both the net investment gains (losses) and the adjustment to exclude the underwriting results and net investment income associated with our previous participation included in Lloyd's Syndicates operations in the table above are not tax effected.
Non-GAAP Operating ROE
Non-GAAP operating ROE is a financial measure that is calculated as Non-GAAP operating income (loss) divided by the average of beginning and ending total shareholders’ equity. As previously discussed, in calculating Non-GAAP operating income (loss), we have excluded the effects of certain items that do not reflect normal results. Non-GAAP operating ROE measures the overall after-tax profitability of our core insurance operations and shows how efficiently capital is being used; however, it should be considered in conjunction with ROE computed in accordance with GAAP. The following table is a reconciliation of ROE to Non-GAAP operating ROE for the years ended December 31, 2024 and 2023:
| | | | | | | | | | | | | | |
| Year Ended December 31 |
| 2024 | | 2023 | Change |
| ROE | 4.6 | % | | (3.5 | %) | 8.1 | pts |
| Effect of items excluded in the calculation of Non-GAAP operating ROE | (0.4 | %) | | 2.7 | % | (3.1 | pts) |
| | | | |
| Non-GAAP operating ROE | 4.2 | % | | (0.8 | %) | 5.0 | pts |
|
Non-GAAP operating ROE in 2024 increased by 5.0 percentage points as compared to 2023 driven by an improvement in prior accident year reserve development in our Specialty P&C and Workers' Compensation Insurance segments, an increase in our net investment result and an improvement in the current accident year net loss ratio in our Workers' Compensation Insurance segment. See previous discussions in this section under the heading "Executive Summary of Operations" and further discussion in our Segment Results sections that follow.
Non-GAAP Adjusted Book Value per Share
Book value per share is calculated as total GAAP shareholders’ equity divided by the total number of common shares outstanding at the balance sheet date. This ratio measures the net worth of the Company to shareholders on a per share basis.
Non-GAAP adjusted book value per share is a Non-GAAP measure widely used within the insurance sector and is calculated as total shareholders’ equity, excluding AOCI, divided by the total number of common shares outstanding at the balance sheet date. This Non-GAAP calculation measures the net worth of the Company to shareholders on a per share basis excluding AOCI to eliminate the temporary and potentially significant effects of fluctuations in interest rates on our fixed income portfolio; however, it should be considered in conjunction with book value per share computed in accordance with GAAP. Higher interest rates have led to significant unrealized holding losses on our available-for-sale fixed maturity investments resulting in volatility in AOCI in 2023 and 2024. See Note 12 of the Notes to Consolidated Financial Statements for additional information.
The following table is a reconciliation of our book value per share to Non-GAAP adjusted book value per share at December 31, 2024 and December 31, 2023:
| | | | | |
| Book Value Per Share |
| Book Value Per Share at December 31, 2023 | $ | 21.82 | |
Less: AOCI Per Share(1) | (4.01) | |
| Non-GAAP Adjusted Book Value Per Share at December 31, 2023 | 25.83 |
| Increase (decrease) to Non-GAAP Adjusted Book Value Per Share during the year ended December 31, 2024 attributable to: | |
| |
| |
| Net income (loss) | 1.03 | |
| |
| Non-GAAP Adjusted Book Value Per Share at December 31, 2024 | 26.86 | |
Add: AOCI Per Share(1) | (3.37) | |
| Book Value Per Share at December 31, 2024 | $ | 23.49 | |
(1) Primarily the impact of accumulated unrealized investment gains (losses) on our available-for-sale fixed maturity investments. See Note 12 of the Notes to Consolidated Financial Statements for additional information. |
|
|
|
Book value increased $1.67 per share from December 31, 2023 to December 31, 2024 were due to net income of $1.03 per share and the change in AOCI of $0.64 per share largely due to unrealized holding gains on our fixed income investment portfolio which flow directly to AOCI due to a decrease in interest rates since the end of 2023.
Segment Results - Specialty Property & Casualty
Our Specialty P&C segment focuses on Medical Professional Liability insurance and Medical Technology Liability insurance as discussed in Note 16 of the Notes to Consolidated Financial Statements. The Specialty P&C segment also includes the underwriting results from our participation in Syndicate 1729 and Syndicate 6131 at Lloyd's of London, which is currently in run off. We normally report results from our Lloyd's Syndicates operations on a one quarter delay; however, we have accelerated the reporting of certain events into the fourth quarter of 2024. See further discussion in this section under the heading "Losses and Loss Adjustment Expenses."
Segment results reflected pre-tax underwriting profit or loss from these insurance lines and included the amortization of certain purchase accounting adjustments. Segment results included the following:
| | | | | | | | | | | | | | | | | | | | | | | |
| Year Ended December 31 |
| ($ in thousands) | 2024 | | 2023 | | Change |
| Net premiums written | $ | 737,502 | | $ | 762,580 | | $ | (25,078) | | (3.3 | %) |
| Net premiums earned | $ | 747,942 | | $ | 755,817 | | $ | (7,875) | | (1.0 | %) |
| Other income (expense) | 4,373 | | 4,695 | | (322) | | (6.9 | %) |
| Net losses and loss adjustment expenses | (578,486) | | (624,809) | | 46,323 | | (7.4 | %) |
| Underwriting, policy acquisition and operating expenses | (203,207) | | (195,303) | | (7,904) | | 4.0 | % |
| Segment results | $ | (29,378) | | $ | (59,600) | | $ | 30,222 | | 50.7 | % |
| | | | | | | |
| Net loss ratio | 77.3 | % | | 82.7 | % | | (5.4 | pts) | | |
| Underwriting expense ratio | 27.2 | % | | 25.8 | % | | 1.4 | pts | | |
| | | | | | | |
| Excluding Lloyd's Syndicates Operations: | | | | | | | |
| Net loss ratio* | 76.9 | % | | 83.2 | % | | (6.3 | pts) | | |
| Underwriting expense ratio* | 27.1 | % | | 25.6 | % | | 1.5 | pts | | |
*Our Specialty P&C net loss and underwriting expense ratios as reported in 2024 include an underwriting loss of $4.7 million as compared to underwriting income of $0.6 million in 2023 associated with our Lloyd's Syndicates operations, which is currently in run-off. Given these underwriting results are irrelevant to our ongoing operations and do not qualify for Discontinued Operations under GAAP, we have excluded their impact from our calculation of the net loss and underwriting expense ratios in the table above. |
Premiums Written
Changes in our premium volume within our Specialty P&C segment are generally driven by three primary factors: (1) the amount of new business written, (2) our retention of existing business and (3) the premium charged for business that is
renewed, which is affected by rates charged and by the amount and type of coverage an insured chooses to purchase. In addition, premium volume may periodically be affected by shifts in the timing of renewals between periods.
The medical professional liability market, which accounts for a majority of the revenues in this segment, remains challenging as physicians continue joining hospitals or larger group practices and, therefore, are no longer purchasing individual or group policies in the standard market. In addition, some competitors have chosen to compete primarily on price. Those carriers have accumulated an excess of capital since approximately 2004 driven largely by drops in claims frequency. They now use that capital to generate higher investment returns supporting operating income over underwriting income. Both factors may impact our ability to write new business and retain existing business. Furthermore, the insurance and reinsurance markets have historically been cyclical, characterized by extended periods of intense price competition and other periods of reduced capacity. The medical professional liability market has historically been particularly affected by these cycles. Underwriting cycles are driven, among other reasons, by excess capacity available to compete for the business. Changes in the frequency and severity of losses may also affect the cycles of the insurance and reinsurance markets significantly.
Gross, ceded and net premiums written were as follows:
| | | | | | | | | | | | | | | | | | | | | | | |
| Year Ended December 31 |
| ($ in thousands) | 2024 | | 2023 | | Change |
| Gross premiums written | $ | 807,463 | | | $ | 835,430 | | | $ | (27,967) | | | (3.3 | %) |
| Less: Ceded premiums written | 69,961 | | | 72,850 | | | (2,889) | | | (4.0 | %) |
| Net premiums written | $ | 737,502 | | | $ | 762,580 | | | $ | (25,078) | | | (3.3 | %) |
Gross Premiums Written
During the first quarter of 2024, we moved the podiatric, chiropractic and dental coverages from the Small Business Unit into HCPL, renaming the unit Medical Professional Liability. By combining these resources, we have a single unit dedicated to all of our healthcare insurance specialty areas and meeting customer needs more efficiently and effectively in order to better serve this market. As a result, we reorganized our presentation of gross premiums written by component and related metrics below to better align with the current internal management reporting structure within the segment. All prior period information has been recast to conform to the current period presentation.
Gross premiums written by component were as follows:
| | | | | | | | | | | | | | | | | | | | | | | |
| Year Ended December 31 |
| ($ in thousands) | 2024 | | 2023 | | Change |
Medical Professional Liability (1)(2) | $ | 737,209 | | | $ | 746,777 | | | $ | (9,568) | | | (1.3 | %) |
Medical Technology Liability (3) | 44,936 | | | 44,581 | | | 355 | | | 0.8 | % |
Lloyd's Syndicates (4) | 5,969 | | | 19,572 | | | (13,603) | | | (69.5 | %) |
Other (5) | 19,349 | | | 24,500 | | | (5,151) | | | (21.0 | %) |
| Total Gross Premiums Written | $ | 807,463 | | | $ | 835,430 | | | $ | (27,967) | | | (3.3 | %) |
(1) Medical Professional Liability premium was our greatest source of premium revenues in 2024 and 2023. The decrease in MPL premium for 2024 as compared to 2023 was driven by retention losses, partially offset by an increase in renewal pricing, new business written and, to a lesser extent, net timing differences of $2.0 million primarily related to the prior year renewal of a few large custom physician policies. Retention losses during 2024 generally reflect our pursuit of rate adequacy in a competitive market where other carriers may not have the same profitability objectives, recognize the rate need, or are attempting to gain market share despite near term underwriting losses which can be supported by investment returns from excess capital. Renewal pricing increases during 2024 reflect our response to the rising loss cost environment and new business written reflects the competitive market conditions. See a description of our MPL line of business and additional discussion on competitive market conditions in Part I Item 1. Business under the heading "Specialty Property and Casualty Segment" and "Competition," respectively.
(2) We offer alternative risk and self-insurance products on a customized basis. Our custom alternative risk solutions include a turnkey captive solution whereby we cede either all or a portion of the alternative market premium, net of reinsurance, to two SPCs of our wholly owned Cayman Islands reinsurance subsidiary, Inova Re, which is reported in our Segregated Portfolio Cell Reinsurance segment (see further discussion in the Ceded Premiums Written section that follows). Our MPL line of business for 2024 and 2023 included $4.2 million and $6.7 million, respectively, of alternative market gross premium written, which reflected our non-renewal of one program
effective January 1, 2024, in which we do not participate in the underwriting results. Written premium related to this program totaled $3.4 million for 2023.
(3) Our Medical Technology Liability business is marketed throughout the U.S.; coverage is offered on a primary or excess basis, within specified limits, to manufacturers and distributors of medical technology and life sciences products including entities conducting human clinical trials. In addition to the previously listed factors that affect our premium volume, our Medical Technology Liability premium is also impacted by the sales volume of insureds. Our Medical Technology Liability premium remained relatively unchanged in 2024 as compared to 2023. Renewal pricing increases in 2024 are primarily due to changes in the sales volume and changes in exposure of certain insureds. Retention losses in 2024 are primarily attributable to insureds no longer needing coverage or going out of business, the broker losing the account, non-payment as well as merger activity within the industry.
(4) Our Lloyd's Syndicates business includes the results from our previous participation in Syndicate 1729 at Lloyd's of London, which is currently in run off. Effective September 2023, we elected to discontinue our participation in the results of Syndicate 1729 beginning with the 2024 underwriting year. For the 2023 underwriting year our participation in the results of Syndicate 1729 was approximately 5%. Our Lloyd’s Syndicates premium during 2024 reflected the impact of our ceased participation.
(5) This component of gross premiums written includes all other product lines within our Specialty P&C segment, primarily professional liability coverage to attorneys and their firms in select areas of practice.
New business written, retention and the change in renewal pricing for our Specialty P&C segment and by major component, excluding Lloyd's Syndicates, are shown in the table below:
| | | | | | | | | | | | | | | | | | | | | | | | | | | | | |
| Year Ended December 31 |
| 2024 | | 2023 |
| ($ in millions) | MPL | Medical Technology Liability | Other | Specialty P&C Segment | | MPL | Medical Technology Liability | Other | Specialty P&C Segment |
| New business | $ | 26.8 | | $ | 4.1 | | $ | 0.5 | | $ | 31.4 | | | $ | 56.4 | | $ | 7.7 | | $ | 0.7 | | $ | 64.8 | |
Retention (1) | 84 | % | 91 | % | 74 | % | 84 | % | | 85 | % | 82 | % | 84 | % | 85 | % |
Change in renewal pricing (2) | 10 | % | 1 | % | 4 | % | 9 | % | | 7 | % | 1 | % | 4 | % | 6 | % |
(1) Calculated as annualized renewed premium divided by all annualized premium subject to renewal. Retention is affected by a number of factors. We may lose insureds to competitors or to alternative insurance mechanisms such as risk retention groups, captive arrangements or self-insurance entities (often when physicians join hospitals or large group practices) or due to pricing or other issues. We may choose not to renew an insured as a result of our underwriting evaluation. Insureds may also terminate coverage because they have left the practice of medicine for various reasons, principally for retirement, death or disability, but also for personal reasons. See further explanation of changes in retention above under the heading "Gross Premiums Written". |
(2) We are committed to a rate structure that will allow us to fulfill our obligations to our insureds while generating competitive long-term returns for our shareholders. Our pricing continues to be based on expected losses as indicated by our historical loss data and available industry loss data. In recent years, this practice has resulted in rate increases and we anticipate further rate increases due to indications of increasing projected loss severity. Additionally, the pricing of our business includes the effects of filed rates, surcharges and discounts. Renewal pricing reflects changes in our exposure base, deductibles, self-insurance retention limits and other policy terms and conditions. See further explanation of changes in renewal pricing above under the heading "Gross Premiums Written". |
Ceded Premiums Written
Ceded premiums represent the amounts owed to our reinsurers for their assumption of a portion of our losses. See previous discussion in our Liquidity and Capital Resources and Financial Condition section under the heading "Reinsurance" for information regarding our Medical Professional Liability and Medical Technology Liability excess of loss reinsurance arrangements.
We pay our reinsurers a ceding premium in exchange for their accepting the risk, and in certain of our excess of loss arrangements, the ultimate amount of which is determined by the loss experience of the business ceded, subject to certain minimum and maximum amounts. Given the length of time that it takes to resolve our claims, many years may elapse before all losses recoverable under a reinsurance arrangement are known. As a part of the process of estimating our loss reserve we also make estimates regarding the amounts recoverable under our reinsurance arrangements. As a result, we may have an adjustment to our estimate of expected losses and associated recoveries for prior year ceded losses under certain loss sensitive reinsurance agreements. Any changes to estimates of premiums ceded related to prior accident years are fully earned in the period the changes in estimates occur.
Ceded premiums written were as follows:
| | | | | | | | | | | | | | | | | | | | | | | |
| Year Ended December 31 |
| ($ in thousands) | 2024 | | 2023 | | Change |
Excess of loss reinsurance arrangements (1) | $ | 43,110 | | | $ | 40,191 | | | $ | 2,919 | | | 7.3 | % |
| | | | | | | |
Premium ceded to SPCs (2) | 2,649 | | | 5,640 | | | (2,991) | | | (53.0 | %) |
| | | | | | | |
Other ceded premiums written (3) | 22,797 | | | 29,445 | | | (6,648) | | | (22.6 | %) |
Adjustment to premiums owed under reinsurance agreements, prior accident years, net (4) | 1,405 | | | (2,426) | | | 3,831 | | | 157.9 | % |
| Total ceded premiums written | $ | 69,961 | | | $ | 72,850 | | | $ | (2,889) | | | (4.0 | %) |
(1)We generally reinsure risks under our excess of loss reinsurance arrangements pursuant to which the reinsurers agree to assume all or a portion of all risks that we insure above our individual risk retention levels. Premium due to reinsurers is based on a rate factor applied to gross premiums written subject to cession under the arrangement.
(2)As previously discussed, as a part of our alternative market solutions, all or a portion of certain medical professional liability premium written is ceded to SPCs in our Segregated Portfolio Cell Reinsurance segment under either excess of loss or quota share reinsurance agreements, depending on the structure of the individual program. See the Segment Results - Segregated Portfolio Cell Reinsurance section for further discussion on the cession to the SPCs from our Specialty P&C segment.
(3)Our other ceded premiums written is primarily comprised of various shared risk arrangements and cyber liability coverages.
(4)Given the length of time that it takes to resolve our claims, many years may elapse before all losses recoverable under a reinsurance arrangement are known. As a part of the process of estimating our loss reserve we also make estimates regarding the amounts recoverable under our reinsurance arrangements. As previously discussed, the premiums ultimately ceded under certain of our swing rated excess of loss reinsurance arrangements are subject to the losses ceded under the arrangements. As part of the review of our reserves for 2024, we recorded a net increase in our estimate of ceded premiums owed to reinsurers due to an increase in our estimate of expected losses and associated recoveries for certain prior year ceded losses, whereas we decreased our estimate of ceded premiums owed to reinsurers in 2023. Changes to estimates of premiums ceded related to prior accident years are fully earned in the period the changes in estimates occur.
Ceded Premiums Ratio
As shown in the table below, our ceded premiums ratio was affected in both 2024 and 2023 by revisions to our estimate of premiums owed to reinsurers related to coverages provided in prior accident years. The ceded premiums ratio was as follows:
| | | | | | | | | | | | | | | | | |
| Year Ended December 31 |
| | 2024 | | 2023 | | Change |
| Ceded premiums ratio | 8.7 | % | | 8.7 | % | | — | pts |
| Less the effect of adjustments in premiums owed under reinsurance agreements, prior accident years (as previously discussed) | 0.2 | % | | (0.3 | %) | | 0.5 | pts |
| Ratio, current accident year | 8.5 | % | | 9.0 | % | | (0.5 | pts) |
The above table reflects ceded premiums written, excluding the effect of prior year ceded premium adjustments, as previously discussed, as a percent of gross premiums written. The decrease in our current accident year ceded premiums ratio for 2024 as compared to 2023 was primarily driven by our ceased participation in Syndicate 1729 for the 2024 underwriting year and, to a lesser extent, a decrease in premium ceded to SPCs.
Net Premiums Earned
Net premiums earned consist of gross premiums earned less the portion of earned premiums that we cede to our reinsurers for their assumption of a portion of our losses. Because premiums are generally earned pro rata over the entire policy period, fluctuations in premiums earned tend to lag those of premiums written. The majority of our policies carry a term of one year; however, some of our Medical Technology Liability policies have a multi-year term. Tail coverage premiums are generally 100% earned in the period written because the policies insure only incidents that occurred in prior periods and are not cancellable. Retroactive coverage premiums are 100% earned at the inception of the contract, as all of the associated underlying loss events occurred in the past. Additionally, any ceded premium changes due to changes to estimates of premiums owed under reinsurance agreements for prior accident years are fully earned in the period of change.
Net premiums earned were as follows:
| | | | | | | | | | | | | | | | | | | | | | | |
| Year Ended December 31 |
| ($ in thousands) | 2024 | | 2023 | | Change |
| Gross premiums earned | $ | 818,751 | | | $ | 826,907 | | | $ | (8,156) | | | (1.0 | %) |
| Less: Ceded premiums earned | 70,809 | | | 71,090 | | | (281) | | | (0.4 | %) |
| Net premiums earned | $ | 747,942 | | | $ | 755,817 | | | $ | (7,875) | | | (1.0 | %) |
Gross premiums earned decreased in 2024 as compared to 2023 driven by our ceased participation in Syndicate 1729 for the 2024 underwriting year and, to a lesser extent, the pro rata effect of a decrease in the volume of written premium during the preceding twelve months, primarily due to proactive actions taken in certain lines to improve profitability.
Ceded premiums earned during 2024 and 2023 included prior accident year ceded premium adjustments under swing rated reinsurance agreements (see previous discussion in footnote 4 under the heading "Ceded Premiums Written"). After removing the effect of the prior accident year ceded premium adjustment from both years, ceded premiums earned decreased by $4.1 million in 2024 as compared to 2023, driven by the pro rata effect of a decrease in premium ceded to SPCs during the preceding twelve months.
Losses and Loss Adjustment Expenses
The determination of calendar year losses involves the actuarial evaluation of incurred losses for the current accident year and the actuarial re-evaluation of incurred losses for prior accident years.
Accident year refers to the accounting period in which the insured event becomes a liability of the insurer. For claims-made policies, which represent the majority of the premiums written in our Specialty P&C segment, the insured event generally becomes a liability when the event is first reported to us and the policy that is in effect at that time covers the claim. For occurrence policies, the insured event becomes a liability when the event takes place even though the claim may be reported to us at a later date. For retroactive coverages, the insured event becomes a liability at inception of the underlying contract. We believe that measuring losses on an accident year basis is the best measure of the underlying profitability of the premiums earned in that period, since it associates policy premiums earned with the estimate of the losses incurred related to those policy premiums.
The following tables summarize calendar year net loss ratios for our Specialty P&C segment by separating losses between the current accident year and all prior accident years, including each line of business' contribution to the change in the segment's current accident year net loss ratio.
| | | | | | | | | | | | | | | | | |
| Net Loss Ratios (1) |
| Year Ended December 31 |
| 2024 | | 2023 | | Change |
| Calendar year net loss ratio | 77.3 | % | | 82.7 | % | | (5.4 | pts) |
| Less impact of prior accident years on the net loss ratio | (5.0 | %) | | 0.1 | % | | (5.1 | pts) |
| Current accident year net loss ratio | 82.3 | % | | 82.6 | % | | (0.3 | pts) |
| | | | | |
| | | | | |
| | | | | |
| | | | | |
| | | | | |
| | | | | |
| | | | | |
| (In percentage points) | | | Increase (Decrease) 2024 versus 2023 |
| Estimated ratio increase (decrease) attributable to: | | | | |
Medical Professional Liability (2) | | | (0.6 pts) |
| Medical Technology Liability | | | 0.1 pts |
| | | |
| Other | | | 0.2 pts |
| Decrease in current accident year net loss ratio | | | (0.3 pts) |
| | | | | |
| | | | | |
| | | | | |
| | | | | |
(1)Net losses, as specified, divided by net premiums earned.
(2)For the year ended December 31, 2024, our MPL line of business current accident year net loss ratio, which represents the largest product line within our Specialty P&C segment, improved 0.6 percentage points as compared
to 2023 (as shown in the table above). The change in our MPL current accident year net loss ratio was primarily attributable to the following:
| | | | | | | | |
| (In percentage points) | Increase (Decrease) 2024 versus 2023 |
| Estimated ratio increase (decrease) attributable to: | |
| |
| |
Ceded Premium Adjustment, Prior Accident Years (1) | 0.5 pts |
| Change in ULAE | 0.6 pts |
| |
| |
| |
| All other, net | (1.7 pts) |
| Decrease in MPL current accident year net loss ratio | (0.6 pts) |
(1) See previous discussion in footnote 4 under the heading "Ceded Premiums Written" for additional information. |
•Excluding the impact of the items specifically identified in the table above, our MPL line of business current accident year net loss ratio for 2024 as compared to 2023 improved 1.7 percentage points driven by our continued underwriting and pricing actions which have resulted in our decrease to certain expected loss ratios during the first quarter of 2024 and, to a lesser extent, a decrease in our reserves related to DDR coverage endorsements due to a decrease in business eligible for tail coverage. In both 2024 and 2023, we decreased our reserves related to DDR coverage endorsements; however, the adjustment was greater in 2024 as compared to 2023. The improvement in our current accident year net loss ratio was partially offset by higher than anticipated loss severity trends in select jurisdictions which have resulted in an increase to certain expected loss ratios during the fourth quarter of 2024 as well as changes in the mix of business.
•ULAE are costs that cannot be attributed to processing a specific claim and are allocated to net losses and loss adjustment expenses from underwriting and operating expenses. In 2024, ULAE increased due to higher compensation-related costs in our claims department.
We re-evaluate our previously established reserve each quarter based upon the most recently completed actuarial analysis supplemented by any new analysis, information or trends that have emerged since the date of that study. We also take into account currently available industry trend information.
We recognized net favorable (unfavorable) prior accident year reserve development as follows:
| | | | | | | | | | | | | | | | | | | | | | | |
| Year Ended December 31 |
| ($ in thousands) | 2024 | | 2023 | | Change |
| | | | | | | |
| | | | | | | |
| Total net favorable (unfavorable) reserve development | $ | 36,932 | | $ | (328) | | $ | 37,260 | | | 11,359.8 | % |
|
|
The following table shows net favorable (unfavorable) development by component for the years ended December 31, 2024 and 2023:
•MPL: The loss environment in our MPL line of business continues to be challenging in many jurisdictions, as claim costs are pressured by social inflation and higher than anticipated loss severity trends that started to reemerge in the fourth quarter of 2022. We continue to monitor the impact that these trends have on our open case reserves and prior accident year development. While higher loss severity trends remained challenging in 2024, we recognized net favorable reserve development for the year ended December 31, 2024 reflecting overall favorable trends in claim closing patterns relative to expectations, principally related to accident years 2019 through 2021.
In the first quarter of 2023, we strengthened case reserves related to four large claims, resulting in $10.1 million of unfavorable development, primarily related to NORCAL's accident years 2016 and 2020, partially offset by $0.5 million of net favorable reserve development recognized during the fourth quarter of 2023, primarily related to accident years 2018 and prior in our legacy book. The contingent consideration associated with the NORCAL acquisition was dependent upon the after-tax development of NORCAL’s 2020 and prior accident year reserves from December 31, 2020 to December 31, 2023. In the fourth quarter of 2023, we recognized unfavorable development in NORCAL’s 2020 and prior accident year reserves which was entirely offset by favorable development recognized in NORCAL’s 2021 and 2022 accident year reserves since acquisition. While these adjustments to NORCAL’s reserves had no impact to the segment’s net losses or net loss ratio, they contributed to the decrease in the fair value of the contingent consideration liability of $3.5 million in 2023 which was recorded as an offset to operating expenses in the segment. See further discussion on the contingent consideration in the Financing Activities and Related Cash Flows section under the heading "Contingent Consideration."
•Medical Technology Liability: During both 2024 and 2023, we recognized net favorable reserve development due to lower than anticipated loss emergence. Net favorable development recognized in 2024 principally related to accident years 2022 and 2023 whereas development recognized in 2023 principally related to accident years 2020 through 2022.
•Lloyd's Syndicates Operations (Participation Discontinued): We normally report results from our Lloyd's Syndicates operations on a one quarter delay; however, during the fourth quarter of 2024, Syndicate 6131 increased its IBNR reserve associated with the 2021 underwriting year for exposures related to aviation coverages in connection with Russia's invasion of Ukraine. While this event would normally be reported in our first quarter of 2025 results, given the availability and significance of this event, we have accelerated the reporting of our allocated share of these losses of $5.3 million into the fourth quarter of 2024, consistent with our policy of recognizing significant losses in the period in which they become known to us. The remaining net unfavorable reserve development during 2024 and 2023 was driven by higher than expected losses and development on certain large claims, primarily aviation and catastrophe related losses.
•Purchase Accounting Amortization: Net prior year reserve development for both periods presented included amortization of the purchase accounting fair value adjustment on NORCAL's assumed net reserve and amortization of the negative VOBA associated with NORCAL's DDR reserve which is recorded as a reduction to net losses and loss adjustment expenses.
A detailed discussion of factors influencing our recognition of loss development is included in our Critical Accounting Estimates section under the heading "Reserve for Losses and Loss Adjustment Expenses." Assumptions used in establishing our reserve are regularly reviewed and updated by management as new data becomes available. Any adjustments necessary are reflected in the then current operations. Due to the size of our reserve, even a small percentage adjustment to the assumptions can have a material effect on our results of operations for the period in which the change is made.
Underwriting, Policy Acquisition and Operating Expenses
Our Specialty P&C segment underwriting, policy acquisition and operating expenses were comprised as follows:
| | | | | | | | | | | | | | | | | | | | | | | |
| Year Ended December 31 |
| ($ in thousands) | 2024 | | 2023 | | Change |
| DPAC amortization | $ | 102,125 | | | $ | 101,691 | | | $ | 434 | | | 0.4 | % |
| Management fees | 3,845 | | | 3,894 | | | (49) | | | (1.3 | %) |
| Other underwriting and operating expenses | 97,237 | | | 89,718 | | | 7,519 | | | 8.4 | % |
| Total | $ | 203,207 | | | $ | 195,303 | | | $ | 7,904 | | | 4.0 | % |
DPAC amortization increased in 2024 as compared to 2023 primarily driven by an increase in capitalized compensation-related costs and, to a lesser extent, a decrease in ceding commission income, which is an offset to expense, partially offset by a decrease in brokerage expenses.
Management fees are charged pursuant to a management agreement by the Corporate segment to the core domestic operating subsidiaries within our Specialty P&C segment for services provided based on the extent to which services are provided to the subsidiary and the amount of premium written by the subsidiary. While the terms of the management agreement were generally consistent between 2024 and 2023, fluctuations in the amount of premium written by each subsidiary can result in corresponding variations in the management fee charged to each subsidiary during a particular period.
Other underwriting and operating expenses increased in 2024 as compared to 2023 primarily attributable to the following:
•Prior year impact of certain one-time items that are unique or non-recurring in nature recorded during 2023 that resulted in a benefit to operating expenses. We recognized a claim for a payroll tax refund of $3.8 million related to the employee retention credit and a reduction to operating expenses of $3.5 million related to the reduction to the contingent consideration liability. See additional discussion on the ERC in Note 1 of the Notes to Consolidated Financial Statements and previous discussion on contingent consideration in the Financing Activities and Related Cash Flows section under the heading "Contingent Consideration."
•An increase in compensation-related expenses, partially offset by lower professional fees, a decrease in Syndicate 1729's operating expenses due to our ceased participation for the 2024 underwriting year and lower facilities expenses. The increase in compensation-related costs in 2024 as compared to 2023 was primarily due to higher amounts accrued for performance-related incentive plans due to the improvement of the related performance metrics. The decrease in professional fees in 2024 was driven by a reduction in fees associated with a data analytics services agreement, a decrease in consulting fees and lower external audit fees. The remaining variance in other underwriting and operating expenses for 2024 as compared to 2023 was comprised of individually insignificant components.
Underwriting Expense Ratio (the Expense Ratio)
Our expense ratio for the Specialty P&C segment was as follows:
| | | | | | | | | | | | | | | | | |
| | Year Ended December 31 |
| | 2024 | | 2023 | | Change |
| Underwriting expense ratio | 27.2 | % | | 25.8 | % | | 1.4 | pts |
The change in our expense ratio in 2024 as compared to 2023 was primarily attributable to the following:
| | | | | | | | | |
| (In percentage points) | Increase (Decrease) 2024 versus 2023 | |
| Estimated ratio increase (decrease) attributable to: | | |
| Change in Net Premiums Earned and DPAC amortization | 0.2 pts | |
| | |
| | |
| | |
| Prior Year One-Time Items | 1.0 pts | |
| | |
| Lloyd's Syndicates Operations | (0.1 pts) | |
| All other, net | 0.3 pts | |
| Increase in the underwriting expense ratio | 1.4 pts | |
| |
| |
| |
| |
Excluding the impact of the items specifically identified in the table above, our expense ratio was relatively unchanged in 2024 as compared to 2023 as the increase in compensation-related expenses was partially offset by lower professional fees and facilities expenses.
Segment Results - Workers' Compensation Insurance
Our Workers' Compensation Insurance segment includes workers' compensation products provided to employers generally with 1,000 or fewer employees, as discussed in Note 16 of the Notes to Consolidated Financial Statements. Segment results included the following:
| | | | | | | | | | | | | | | | | | | | | | | |
| Year Ended December 31 |
| ($ in thousands) | 2024 | | 2023 | | Change |
| Net premiums written | $ | 166,223 | | | $ | 162,285 | | | $ | 3,938 | | | 2.4 | % |
| | | | | | | |
| Net premiums earned | $ | 167,610 | | | $ | 160,034 | | | $ | 7,576 | | | 4.7 | % |
| Other income | 1,887 | | | 1,854 | | | 33 | | | 1.8 | % |
| Net losses and loss adjustment expenses | (128,483) | | | (139,322) | | | 10,839 | | | (7.8 | %) |
| Underwriting, policy acquisition and operating expenses | (61,999) | | | (55,061) | | | (6,938) | | | 12.6 | % |
| Segment results | $ | (20,985) | | | $ | (32,495) | | | $ | 11,510 | | | 35.4 | % |
| | | | | | | |
| Net loss ratio | 76.7% | | 87.1% | | (10.4 pts) | |
| Underwriting expense ratio | 37.0% | | 34.4% | | 2.6 pts | |
Premiums Written
Our workers’ compensation premium volume is driven by five primary factors: (1) the amount of new business written, (2) retention of our existing book of business, (3) premium rates charged on our renewal book of business, (4) changes in payroll exposure and (5) audit premium.
Gross, ceded and net premiums written were as follows:
| | | | | | | | | | | | | | | | | | | | | | | |
| Year Ended December 31 |
| ($ in thousands) | 2024 | | 2023 | | Change |
| Gross premiums written | $ | 243,404 | | | $ | 246,857 | | | $ | (3,453) | | | (1.4 | %) |
| Less: Ceded premiums written | 77,181 | | | 84,572 | | | (7,391) | | | (8.7 | %) |
| Net premiums written | $ | 166,223 | | | $ | 162,285 | | | $ | 3,938 | | | 2.4 | % |
Gross Premiums Written
Gross premiums written by product were as follows:
| | | | | | | | | | | | | | | | | | | | | | | | | | | | | | | |
| | | Year Ended December 31 |
| ($ in thousands) | | | | | | | 2024 | | 2023 | | Change |
| Traditional business: | | | | | | | | | | | | | | | |
| Guaranteed cost | | | | | | | | | $ | 141,231 | | | $ | 137,088 | | | $ | 4,143 | | | 3.0 | % |
| Policyholder dividend | | | | | | | | | 21,641 | | | 22,829 | | | (1,188) | | | (5.2 | %) |
| Deductible | | | | | | | | | 5,548 | | | 5,061 | | | 487 | | | 9.6 | % |
| Retrospective | | | | | | | | | 4,853 | | | 2,749 | | | 2,104 | | | 76.5 | % |
| Other | | | | | | | | | 5,950 | | | 6,376 | | | (426) | | | (6.7 | %) |
| Change in EBUB estimate | | | | | | | | | 2,900 | | | 2,900 | | | — | | | — | % |
Total traditional business(1) | | | | | | | | | 182,123 | | | 177,003 | | | 5,120 | | | 2.9 | % |
Alternative market business(2) | | | | | | | | | 61,281 | | | 69,854 | | | (8,573) | | | (12.3 | %) |
| Total | | | | | | | | | $ | 243,404 | | | $ | 246,857 | | | $ | (3,453) | | | (1.4 | %) |
(1) Gross premiums written increased during 2024 as compared to 2023 driven by higher renewal business and audit premium. Renewal business reflected an improvement in renewal pricing and an increase in payroll exposure. Additionally, renewal business included the renewal of certain policies as traditional business that were previously written in one of the alternative market programs in our Segregated Portfolio Cell Reinsurance segment, totaling $3.0 million for 2024. Gross premiums written in our traditional business also reflected the continuation of competitive workers' compensation market conditions, which contributed to a reduction in our renewal retention rate and the impact of compounded state loss cost reductions in our core operating territories.
(2) A majority of alternative market premiums are ceded to SPCs in our Segregated Portfolio Cell Reinsurance segment. See further discussion on alternative market gross premiums written in our Segment Results - Segregated Portfolio Cell Reinsurance section under the heading "Gross Premiums Written" that follows. We retained twenty-one of the twenty-four (five in the fourth quarter) workers' compensation alternative market programs that were up for renewal during the year ended December 31, 2024. Effective January 1, 2024, two programs were non-renewed and placed into run-off; however, as the underlying policies expired in one program, a majority of those policies renewed as traditional business in our Workers' Compensation Insurance segment, as previously discussed. The other program, in which we do not participate in the underwriting results, assumed both workers' compensation insurance and medical professional liability insurance and we elected to non-renew this program. Additionally, we retroactively non-renewed a program during fourth quarter of 2024 (originally renewed in the second quarter) due to the non-renewal of a large policy written in the program.
New business, audit premium, renewal retention and renewal price changes for our traditional business and the alternative market business are shown in the table below:
| | | | | | | | | | | | | | | | | | | | | | | |
| Year Ended December 31 |
| 2024 | | 2023 |
| ($ in millions) | Traditional Business | Alternative Market Business | Segment
Results | | Traditional Business | Alternative Market Business | Segment
Results |
| New business | $ | 17.5 | | $ | 3.5 | | $ | 21.0 | | | $ | 22.0 | | $ | 4.2 | | $ | 26.2 | |
| Audit premium (excluding EBUB) | $ | 12.1 | | $ | 3.7 | | $ | 15.8 | | | $ | 9.1 | | $ | 3.6 | | $ | 12.7 | |
Retention(1) | 87 | % | 84 | % | 86 | % | | 88 | % | 93 | % | 89 | % |
Change in renewal pricing (2) | (2 | %) | (1 | %) | (1 | %) | | (5 | %) | (5 | %) | (5 | %) |
(1) We calculate our workers' compensation retention as renewed premium divided by premium available to renew. Beginning in the fourth quarter of 2024, we have revised our calculation of retention to remove the impacts of audit premium. Previously, premium available to renew in the calculation included premium adjustments related to audits of expired policies which impacted retention. Prior periods have been recast to conform to the current period calculation. Our retention rate can be impacted by various factors, including price or other competitive issues, insureds being acquired, or a decision not to renew based on our underwriting evaluation. |
(2) The pricing of our business includes an assessment of the underlying policy exposure and market conditions. We continue to base our pricing on expected losses, as indicated by our historical loss data. |
Ceded Premiums Written
Ceded premiums written were as follows:
| | | | | | | | | | | | | | | | | | | | | | | |
| Year Ended December 31 |
| ($ in thousands) | 2024 | | 2023 | | Change |
Premiums ceded to SPCs(1) | $ | 55,255 | | | $ | 64,619 | | | $ | (9,364) | | | (14.5 | %) |
Premiums ceded to external reinsurers(2) | 15,900 | | | 14,718 | | | 1,182 | | | 8.0 | % |
Other(3) | 6,026 | | | 5,235 | | | 791 | | | 15.1 | % |
| Total ceded premiums written | $ | 77,181 | | | $ | 84,572 | | | $ | (7,391) | | | (8.7 | %) |
(1) Represents alternative market business that is ceded under 100% quota share reinsurance agreements to the SPCs in our Segregated Portfolio Cell Reinsurance segment. See further discussion on alternative market gross premiums written in our Segment Results - Segregated Portfolio Cell Reinsurance section under the heading "Gross Premiums Written" that follows. |
(2) Premiums ceded under our traditional reinsurance treaty are based on premiums earned during the treaty period. The increase for the year ended December 31, 2024 as compared to 2023 reflected the increase in premiums earned and a higher average reinsurance rate, partially offset by lower reinstatement premium recognized of $0.7 million in 2024 as compared to $1.6 million in 2023 related to reserve increases on prior year reinsured claims. |
(3) This component of ceded premiums written primarily represents premiums ceded to unaffiliated captive insurers represents alternative market business for two programs that are ceded under 100% quota share reinsurance agreements. |
|
|
Ceded Premiums Ratio
Ceded premiums ratio was as follows:
| | | | | | | | | | | | | | | | | |
| Year Ended December 31 |
| 2024 | | 2023 | | Change |
| Ceded premiums ratio, as reported | 32.3 | % | | 34.6 | % | | (2.3 | pts) |
| Less the effect of: | | | | | |
| Premiums ceded to SPCs (100%) | 20.9 | % | | 23.6 | % | | (2.7 | pts) |
| | | | | |
| Other | 2.4 | % | | 2.2 | % | | 0.2 | pts |
| Ceded premiums ratio (related to external reinsurance), less the effects of above | 9.0 | % | | 8.8 | % | | 0.2 | pts |
The above table reflects traditional ceded premiums earned as a percent of traditional gross premiums earned. As discussed above, premiums ceded under our traditional reinsurance treaty are based on premiums earned during the treaty period. The increase in the ceded premiums ratio in 2024 as compared to 2023 primarily reflects a higher average reinsurance rate, partially offset by lower reinstatement premium (see previous discussion on reinstatement premium in footnote 2 under the heading "Ceded Premiums Written").
Net Premiums Earned
Net premiums earned consist of gross premiums earned less the portion of earned premiums that we cede to SPCs in our Segregated Portfolio Cell Reinsurance segment, external reinsurers (including changes related to the return premium and revenue share estimates) and the unaffiliated captive insurers. Because premiums are generally earned pro rata over the entire policy period, fluctuations in premiums earned tend to lag those of premiums written. Our workers’ compensation policies are twelve month term policies, and premiums are earned on a pro rata basis over the policy period. Net premiums earned also include premium adjustments related to the audit of our insureds' payrolls, changes in our estimates related to EBUB and premium adjustments related to retrospectively-rated policies. Payroll audits are conducted subsequent to the end of the policy period and any related premium adjustments are recorded as fully earned in the current period. We evaluate our estimates related to EBUB and retrospectively-rated premium adjustments on a quarterly basis with any adjustments being included in written and earned premium in the current period.
Net premiums earned were as follows:
| | | | | | | | | | | | | | | | | | | | | | | |
| Year Ended December 31 |
| ($ in thousands) | 2024 | | 2023 | | Change |
| Gross premiums earned | $ | 247,745 | | | $ | 244,873 | | | $ | 2,872 | | | 1.2 | % |
| Less: Ceded premiums earned | 80,135 | | | 84,839 | | | (4,704) | | | (5.5 | %) |
| Net premiums earned | $ | 167,610 | | | $ | 160,034 | | | $ | 7,576 | | | 4.7 | % |
Net premiums earned increased during the year ended December 31, 2024 as compared to 2023 primarily driven by higher renewal premium, including the renewal of certain policies as traditional business that were previously written in one of the alternative market programs in our Segregated Portfolio Cell Reinsurance segment, higher audit premium and, to a lesser extent, lower reinstatement premium, partially offset by the continuation of competitive market conditions. See previous discussion on reinstatement premium in footnote 2 under the heading "Ceded Premiums Written.
Losses and Loss Adjustment Expenses
We estimate our current accident year loss and loss adjustment expenses by developing actual reported losses using historical loss development factors, adjusted to reflect current and expected trends based on various internal analyses and supplemental information. The following table summarizes calendar year net loss ratios by separating losses between the current accident year and all prior accident years. Calendar year and current accident year net loss ratios by component were as follows:
| | | | | | | | | | | | | | | | | |
| Year Ended December 31 |
| 2024 | | 2023 | | Change |
| Calendar year net loss ratio | 76.7 | % | | 87.1 | % | | (10.4 | pts) |
| Less impact of prior accident years on the net loss ratio | (0.3 | %) | | 5.8 | % | | (6.1 | pts) |
| Current accident year net loss ratio | 77.0 | % | | 81.3 | % | | (4.3 | pts) |
| | | | | |
| | | | | |
| | | | | |
| | | | | |
| | | | | |
|
The 2024 current accident year net loss ratio improved 4.3 points as compared to 2023. During the second half of 2023, we increased our current accident year net loss ratio to reflect higher than expected loss trends observed in our average cost per claim. While we continue to observe, and therefore reflect, higher medical loss cost trends, we have seen these trends begin to moderate during 2024, including a reduction in the 2024 average cost per claim.
Calendar year reported losses in excess of our per occurrence reinsurance retention decreased $8.3 million in 2024 as compared to 2023, reflecting a reduction in severity-related claim activity. We recognized losses within the AAD totaling $2.0 million for the year ended December 31, 2024 as compared to $5.8 million in 2023, reflecting the elimination of the AAD from our reinsurance treaty renewal effective May 1, 2024. Our exposure to losses within the AAD were recognized at the maximum liability for each reinsurance contract year, based on historical reinsured loss trends. During the 2024 fourth quarter, we reduced the AAD liability by $0.5 million based on an evaluation of open claims for contract years in which actual losses are within the maximum liability. Actual losses within the AAD continue to be less than the maximum liability after the $0.5 million reduction, but the ultimate liability could increase or decrease based on changes in future estimates of claims within the AAD.
We recognized net favorable prior accident year reserve development of $0.5 million for the year ended December 31, 2024 as compared to $9.3 million of net unfavorable prior accident year reserve development for 2023. In 2024, net favorable reserve development was driven by favorable prior accident year reserve development of $1.6 million, including the reduction of the AAD liability, as discussed above, partially offset by an adjustment to aggregate losses assumed from the Segregated Portfolio Cell Reinsurance segment of $1.1 million. The net favorable development recognized in 2024 reflected overall favorable trends in claim closing patterns in accident years 2017 through 2019 and 2023. Net unfavorable development recognized in 2023 reflected higher than expected average claim costs primarily in the 2022 accident year and a large claim from the 1997 accident year.
Underwriting, Policy Acquisition and Operating Expenses
Underwriting, policy acquisition and operating expenses include the amortization of commissions, premium taxes and underwriting salaries, which are capitalized and deferred over the related workers’ compensation policy period, net of ceding commissions earned. The capitalization of underwriting salaries can vary as they are subject to the success rate of our contract acquisition efforts. These expenses also include a management fee charged by our Corporate segment, which represents intercompany charges pursuant to a management agreement. The management fee is based on the extent to which services are provided to the subsidiary and the amount of premium written by the subsidiary.
Our Workers' Compensation Insurance segment underwriting, policy acquisition and operating expenses were comprised as follows:
| | | | | | | | | | | | | | | | | | | | | | | |
| Year Ended December 31 |
| ($ in thousands) | 2024 | | 2023 | | Change |
| DPAC amortization | $ | 29,072 | | | $ | 29,486 | | | $ | (414) | | | (1.4 | %) |
| Management fees | 1,820 | | | 1,846 | | | (26) | | | (1.4 | %) |
| Other underwriting and operating expenses | 42,055 | | | 38,014 | | | 4,041 | | | 10.6 | % |
| | | | | | | |
| SPC ceding commission offset | (10,948) | | | (14,285) | | | 3,337 | | | (23.4 | %) |
| Total | $ | 61,999 | | | $ | 55,061 | | | $ | 6,938 | | | 12.6 | % |
DPAC amortization decreased for the year ended December 31, 2024 as compared to 2023 reflecting the recovery of guaranty fund assessments totaling $1.0 million during 2024. After removing the effect of the guaranty fund recoupments, DPAC amortization increased by $0.6 million during 2024 reflecting an increase in gross premiums earned.
Other underwriting and operating expenses increased for the year ended December 31, 2024 as compared to 2023, primarily reflecting an increase in compensation-related and information technology costs. The increase in compensation-related costs primarily reflected higher amounts accrued for performance-related incentive plans due to an improvement in the related performance metrics and an increase in salaries due to annual merit adjustments. Information technology costs increased during 2024 reflecting our investment in initiatives that will enhance underwriting and claim operating efficiencies.
As previously discussed, alternative market premiums written by our Workers' Compensation Insurance segment are 100% ceded, less a ceding commission, to either the SPCs in our Segregated Portfolio Cell Reinsurance segment or unaffiliated captive insurers. The ceding commission charged to the SPCs consists of an amount for fronting fees, cell rental fees, commissions, premium taxes, claims administration fees and risk management fees. The fronting fees, commissions, premium taxes and risk management fees are recorded as an offset to underwriting, policy acquisition and operating expenses. Cell rental fees are recorded as a component of other income and claims administration fees are recorded as ceded ULAE. SPC ceding commissions earned decreased for the year ended December 31, 2024 as compared to 2023, primarily reflecting an adjustment to ceding commissions charged to the SPCs in prior periods related to certain fees as well as the non-renewal of the two alternative market programs effective January 1, 2024 and the related decrease in ceded premium.
Underwriting Expense Ratio (the Expense Ratio)
The underwriting expense ratio included the impact of the following:
| | | | | | | | | | | | | | | | | |
| Year Ended December 31 |
| 2024 | | 2023 | | Change |
| Underwriting expense ratio, as reported | 37.0 | % | | 34.4 | % | | 2.6 | pts |
| Less estimated ratio increase (decrease) attributable to: | | | | | |
| Impact of ceding commissions received from SPCs | 5.5 | % | | 4.3 | % | | 1.2 | pts |
| | | | | |
| Impact of audit premium | (2.1 | %) | | (2.0 | %) | | (0.1 | pts) |
| | | | | |
| | | | | |
| Impact of reinstatement premium | — | % | | 0.3 | % | | (0.3 | pts) |
| Underwriting expense ratio, less listed effects | 33.6 | % | | 31.8 | % | | 1.8 | pts |
Excluding the items noted in the table above, the expense ratio increased for the year ended December 31, 2024 primarily reflecting the increase in other underwriting and operating expenses and lower ceding commission income, which is an offset to expense, as previously discussed.
Segment Results - Segregated Portfolio Cell Reinsurance
The Segregated Portfolio Cell Reinsurance segment includes the results (underwriting profit or loss, plus investment results, net of U.S. federal income taxes) of SPCs at Inova Re and Eastern Re, our Cayman Islands SPC operations, as discussed in Note 17 of the Notes to Consolidated Financial Statements. SPCs are segregated pools of assets and liabilities that provide an insurance facility for a defined set of risks. Assets of each SPC are solely for the benefit of that individual cell and each SPC is solely responsible for the liabilities of that individual cell. Assets of one SPC are statutorily protected from the creditors of the others. As of December 31, 2024, there were twenty-six (six inactive) SPCs. Effective January 1, 2024, two SPCs were non-renewed and placed into run-off. As the underlying policies expired that were previously written in one of the programs, a majority of those policies renewed as traditional business in our Workers' Compensation Insurance segment. The other program, in which we do not participate in the underwriting results, assumed both workers' compensation insurance and medical professional liability insurance. For the year ended December 31, 2023, these SPCs had workers' compensation and medical professional liability premiums written totaling $6.4 million and $3.4 million, respectively. Additionally, we retroactively non-renewed a program during the fourth quarter of 2024 (originally renewed in the second quarter) due to the non-renewal of a large policy written in the program. The expiring premium on the policies that non-renewed totaled $1.8 million.
Segment results reflect our share of the underwriting and investment results of the SPCs in which we participate, and included the following:
| | | | | | | | | | | | | | | | | | | |
| | | Year Ended December 31 |
| ($ in thousands) | | | | | 2024 | 2023 | Change |
| Net premiums written | | | | | | $ | 49,950 | | $ | 61,129 | | $ | (11,179) | | (18.3 | %) |
| | | | | | | | | |
| Net premiums earned | | | | | | $ | 52,698 | | $ | 61,546 | | $ | (8,848) | | (14.4 | %) |
| Net investment income | | | | | | 3,608 | | 2,289 | | 1,319 | | 57.6 | % |
| Net investment gains (losses) | | | | | | 2,369 | | 3,680 | | (1,311) | | (35.6 | %) |
| Other income (expenses) | | | | | | 19 | | 5 | | 14 | | 280.0 | % |
| Net losses and loss adjustment expenses | | | | | | (32,466) | | (36,363) | | 3,897 | | (10.7 | %) |
| Underwriting, policy acquisition and operating expenses | | | | | | (18,063) | | (20,457) | | 2,394 | | (11.7 | %) |
SPC U.S. federal income tax (expense) benefit (1) | | | | | | (1,766) | | (1,629) | | (137) | | 8.4 | % |
| SPC net results | | | | | | 6,399 | | 9,071 | | (2,672) | | (29.5 | %) |
SPC dividend (expense) income (2) | | | | | | (4,444) | | (6,234) | | 1,790 | | (28.7 | %) |
Segment results (3) | | | | | | $ | 1,955 | | $ | 2,837 | | $ | (882) | | (31.1 | %) |
| | | | | | | | | |
| Net loss ratio | | | | | | 61.6% | 59.1% | 2.5 pts | |
| Underwriting expense ratio | | | | | | 34.3% | 33.2% | 1.1 pts | |
(1) Represents the provision for U.S. federal income taxes for SPCs at Inova Re, which have elected to be taxed as a U.S. corporation under Section 953(d) of the Internal Revenue Code. U.S. federal income taxes are included in the total SPC net results and are paid by the individual SPCs. |
(2) Represents the net (profit) loss attributable to external cell participants. |
(3) Represents our share of the net profit (loss) and OCI of the SPCs in which we participate. |
Premiums Written
Premiums in our Segregated Portfolio Cell Reinsurance segment are assumed from either our Workers' Compensation Insurance or Specialty P&C segments. Premium volume is driven by five primary factors: (1) the amount of new business written, (2) retention of the existing book of business, (3) premium rates charged on the renewal book of business and, for workers' compensation business, (4) changes in payroll exposure and (5) audit premium.
Gross, ceded and net premiums written were as follows:
| | | | | | | | | | | | | | | | | | | | | | | |
| Year Ended December 31 |
| ($ in thousands) | 2024 | | 2023 | | Change |
| Gross premiums written | $ | 57,904 | | | $ | 70,259 | | | $ | (12,355) | | | (17.6 | %) |
| Less: Ceded premiums written | 7,954 | | | 9,130 | | | (1,176) | | | (12.9 | %) |
| Net premiums written | $ | 49,950 | | | $ | 61,129 | | | $ | (11,179) | | | (18.3 | %) |
|
Gross Premiums Written
Gross premiums written reflected reinsurance premiums assumed by component as follows:
| | | | | | | | | | | | | | | | | | | | | | | |
| Year Ended December 31 |
| ($ in thousands) | 2024 | | 2023 | | Change |
| Workers' compensation | $ | 55,255 | | | $ | 64,619 | | | $ | (9,364) | | | (14.5 | %) |
| Medical professional liability | 2,649 | | | 5,640 | | | (2,991) | | | (53.0 | %) |
| | | | | | | |
| Gross Premiums Written | $ | 57,904 | | | $ | 70,259 | | | $ | (12,355) | | | (17.6 | %) |
Gross premiums written for the years ended December 31, 2024 and 2023 were primarily comprised of workers' compensation coverages assumed from our Workers' Compensation Insurance segment. Workers' compensation and medical professional liability gross premiums written decreased during the year ended December 31, 2024 as compared to 2023 due to the non-renewal of three programs, as previously discussed.
We retained nineteen of the twenty-two workers' compensation programs and two of the three medical professional liability programs up for renewal for the year ended December 31, 2024.
New business, audit premium, retention and renewal price changes for the assumed workers' compensation premium is shown in the table below:
| | | | | | | | | | | | | | |
| | Year Ended December 31 |
| ($ in millions) | | 2024 | | 2023 |
| New business | | $ | 3.5 | | | $ | 4.2 | |
| Audit premium | | $ | 3.7 | | | $ | 3.6 | |
Retention(1) | | 84 | % | | 93 | % |
Change in renewal pricing(2) | | (1 | %) | | (5 | %) |
(1) We calculate our workers' compensation retention as renewed premium divided by premium available to renew. Beginning in the fourth quarter of 2024, we have revised our calculation of retention to remove the impacts of audit premium. Previously, premium available to renew in the calculation included premium adjustments related to audits of expired policies which impacted retention. Prior periods have been recast to conform to the current period calculation. Our retention rate can be impacted by various factors, including price or other competitive issues, insureds being acquired, or a decision not to renew based on our underwriting evaluation. |
(2) The pricing of our business includes an assessment of the underlying policy exposure and market conditions. We continue to base our pricing on expected losses, as indicated by our historical loss data. |
Ceded Premiums Written
Ceded premiums written were as follows:
| | | | | | | | | | | | | | | | | | | | | | | |
| Year Ended December 31 |
| ($ in thousands) | 2024 | | 2023 | | Change |
| Ceded premiums written | $ | 7,954 | | | $ | 9,130 | | | $ | (1,176) | | | (12.9 | %) |
For the workers' compensation business, each SPC has in place its own external reinsurance coverage. The medical professional liability business is assumed net of reinsurance from our Specialty P&C segment; therefore, there are no ceded premiums related to the medical professional liability business reflected in the table above. Premiums ceded under our SPC reinsurance treaty are based on premiums written during the treaty period. The change in ceded premiums written in 2024 as compared to 2023 primarily reflected the decrease in workers' compensation gross premiums written and the impact of rate changes under the external reinsurance treaty. External reinsurance rates vary based on the alternative market program.
Ceded Premiums Ratio
Ceded premiums ratio was as follows:
| | | | | | | | | | | | | | | | | |
| Year Ended December 31 |
| 2024 | | 2023 | | Change |
| Ceded premiums ratio | 14.4 | % | | 14.1 | % | | 0.3 | pts |
The above table reflects ceded premiums as a percent of gross premiums written for the workers' compensation business only; medical professional liability business is assumed net of reinsurance, as discussed above. The ceded premiums ratio reflects the weighted average reinsurance rates of all SPC programs.
Net Premiums Earned
Net premiums earned consist of gross premiums earned less the portion of earned premiums that the SPCs cede to external reinsurers. Because premiums are generally earned pro rata over the entire policy period, fluctuations in premiums earned tend to lag those of premiums written. Policies ceded to the SPCs are twelve month term policies and premiums are earned on a pro rata basis over the policy period. Net premiums earned also include premium adjustments related to the audit of workers' compensation insureds' payrolls. Payroll audits are conducted subsequent to the end of the policy period and any related adjustments are recorded as fully earned in the current period.
Gross, ceded and net premiums earned were as follows:
| | | | | | | | | | | | | | | | | | | | | | | |
| Year Ended December 31 |
| ($ in thousands) | 2024 | | 2023 | | Change |
| Gross premiums earned | $ | 60,959 | | | $ | 70,706 | | | $ | (9,747) | | | (13.8 | %) |
| Less: Ceded premiums earned | 8,261 | | | 9,160 | | | (899) | | | (9.8 | %) |
| Net premiums earned | $ | 52,698 | | | $ | 61,546 | | | $ | (8,848) | | | (14.4 | %) |
|
The decrease in net premiums earned during the year ended December 31, 2024 as compared to 2023 primarily reflected the non-renewal of two SPCs effective January 1, 2024.
Losses and Loss Adjustment Expenses
The following table summarizes the calendar year net loss ratios by separating losses between the current accident year and all prior accident years. The current accident year net loss ratio reflects the aggregate loss ratio for all programs. Loss reserves and associated reinsurance are estimated for each program on a quarterly basis. Each SPC has in place its own reinsurance agreement, and the attachment point of aggregate reinsurance coverage varies by program. Due to the size of some of the programs, quarterly loss results, including changes in estimated aggregate reinsurance, can create volatility in the current accident year net loss ratio from period to period.
Calendar year and current accident year net loss ratios for the years ended December 31, 2024 and 2023 were as follows:
| | | | | | | | | | | | | | | | | | | | | | | |
| Year Ended December 31 |
| 2024 | | 2023 | | Change |
| | | | | | | | | | | |
| Calendar year net loss ratio | 61.6 | % | | 59.1 | % | | | | | | 2.5 | pts | | |
| Less impact of prior accident years on the net loss ratio | (5.2 | %) | | (6.4 | %) | | | | | | 1.2 | pts | | |
| Current accident year net loss ratio | 66.8 | % | | 65.5 | % | | | | | | 1.3 | pts | | |
| | | | | | | | | | | |
| | | | | | | | | | | |
| | | | | | | | | | | |
| | | | | | | | | | | |
| | | | | | | | | | | |
| | |
The current accident year net loss ratio increased in 2024 as compared to 2023, primarily reflecting an increase in claim severity.
Calendar year workers' compensation incurred losses (excluding IBNR) ceded to our external reinsurers increased $8.9 million for the year ended December 31, 2024 as compared to 2023. Current accident year ceded incurred losses (excluding IBNR) increased $9.5 million for the year ended December 31, 2024 as compared to 2023. The 2024 ceded loss activity reflects an increase in average claim severity and reported large loss frequency.
We recognized net favorable prior year reserve development of $2.8 million and $4.0 million for the years ended December 31, 2024 and 2023, respectively. The development in 2024 includes net favorable development in the workers' compensation business of $3.1 million and net unfavorable development of $0.3 million in the medical professional liability business. The net favorable development related to the workers' compensation business in 2024 reflected overall favorable trends in claim closing patterns primarily in accident years 2018 through 2023. The net unfavorable development in the medical professional liability business in 2024 primarily reflected higher than expected claim frequency in the program that assumed both workers' compensation and medical professional liability insurance, which was non-renewed effective January 1, 2024. We do not participate in the underwriting results of this program.
The development in 2023 includes net favorable development in the workers' compensation business of $5.3 million, partially offset by net unfavorable development of $1.3 million in the medical professional liability business. The net favorable development in the workers' compensation business in 2023 reflected overall favorable trends in claim closing patterns
primarily in accident years 2016 through 2021. The net unfavorable development in the medical professional liability business in 2023 reflected higher than expected claim frequency in one program. We do not participate in the underwriting results of this program.
Underwriting, Policy Acquisition and Operating Expenses
Our Segregated Portfolio Cell Reinsurance segment underwriting, policy acquisition and operating expenses were comprised as follows:
| | | | | | | | | | | | | | | | | | | | | | | |
| Year Ended December 31 |
| ($ in thousands) | 2024 | | 2023 | | Change |
| DPAC amortization | $ | 16,354 | | | $ | 18,371 | | | $ | (2,017) | | | (11.0 | %) |
| | | | | | | |
| Other underwriting and operating expenses | 1,709 | | | 2,086 | | | (377) | | | (18.1 | %) |
| Total | $ | 18,063 | | | $ | 20,457 | | | $ | (2,394) | | | (11.7 | %) |
DPAC amortization primarily represents ceding commissions, which vary by program and are paid to our Workers' Compensation Insurance and Specialty P&C segments for premiums assumed. Ceding commissions include an amount for fronting fees, commissions, premium taxes and risk management fees, which are reported as an offset to underwriting, policy acquisition and operating expenses within our Workers' Compensation Insurance and Specialty P&C segments. In addition, ceding commissions paid to our Workers' Compensation Insurance segment include cell rental fees which are recorded as other income and claims administration fees which are recorded as ceded ULAE within our Workers' Compensation Insurance segment. The decrease in DPAC amortization in 2024 as compared to 2023 primarily reflected a decrease in earned premium, as discussed above under the heading "Net Premiums Earned."
Other underwriting and operating expenses primarily include bank fees, professional fees, changes in the allowance for expected credit losses and policyholder dividend expense. Other underwriting and operating expenses decreased in 2024 driven by the change in the allowance for expected credit losses.
Underwriting Expense Ratio (the Expense Ratio)
The underwriting expense ratio included the impact of the following:
| | | | | | | | | | | | | | | | | |
| Year Ended December 31 |
| 2024 | | 2023 | | Change |
| Underwriting expense ratio, as reported | 34.3 | % | | 33.2 | % | | 1.1 | pts |
| Less: impact of audit premium on expense ratio | (2.6 | %) | | (2.1 | %) | | (0.5 | pts) |
| Underwriting expense ratio, excluding the effect of audit premium | 36.9 | % | | 35.3 | % | | 1.6 | pts |
|
Excluding the effect of audit premium, the underwriting expense ratio increased for the year ended December 31, 2024 as compared to 2023 primarily reflecting the non-renewal of the program that assumed both workers' compensation insurance and medical professional liability insurance, which was subject to a lower ceding commission.
Segment Results - Corporate
Our Corporate segment includes our investment operations excluding those reported in our Segregated Portfolio Cell Reinsurance segment as discussed in Note 16 of the Notes to Consolidated Financial Statements. In addition, this segment includes corporate expenses, interest expense, U.S. and U.K. income taxes and non-premium revenues generated outside of our insurance entities.
Segment results for the years ended December 31, 2024 and 2023 exclude the change in fair value of contingent consideration and, for the year ended December 31, 2024, transaction-related costs, including the associated income tax benefit, as we do not consider these items in assessing the financial performance of the segment. Transaction-related costs are attributable to actuarial consulting fees paid during the second quarter of 2024 in relation to the final determination of contingent consideration associated with the NORCAL acquisition. We did not incur any transaction-related costs in 2023. Segment results for our Corporate segment were net earnings of $94.7 million and $89.8 million for the years ended December 31, 2024 and 2023, respectively, and included the following:
| | | | | | | | | | | | | | | | | | | | | | | |
| Year Ended December 31 |
| ($ in thousands) | 2024 | | 2023 | | Change |
| Net investment income | $ | 140,930 | | | $ | 126,130 | | | $ | 14,800 | | | 11.7 | % |
| Equity in earnings (loss) of unconsolidated subsidiaries | $ | 22,203 | | | $ | 6,791 | | | $ | 15,412 | | | 226.9 | % |
| Net investment gains (losses) | $ | (7,206) | | | $ | 5,148 | | | $ | (12,354) | | | (240.0 | %) |
| Other income (expense) | $ | 11,489 | | | $ | 8,307 | | | $ | 3,182 | | | 38.3 | % |
| Operating expense | $ | 40,008 | | | $ | 34,007 | | | $ | 6,001 | | | 17.6 | % |
| Interest expense | $ | 22,342 | | | $ | 23,150 | | | $ | (808) | | | (3.5 | %) |
| Income tax expense (benefit) | $ | 10,401 | | | $ | (545) | | | $ | 10,946 | | | 2,008.4 | % |
Net Investment Income
Net investment income is primarily derived from the income earned by our fixed maturity securities and also includes dividend income from equity securities, income from our short-term and cash equivalent investments, earnings from other investments and changes in the cash surrender value of BOLI contracts, net of investment fees and expenses.
Net investment income (loss) by investment category was as follows:
| | | | | | | | | | | | | | | | | | | | | | | |
| Year Ended December 31 |
| ($ in thousands) | 2024 | | 2023 | | Change |
| Fixed maturities | $ | 131,333 | | | $ | 112,270 | | | $ | 19,063 | | | 17.0 | % |
| Equities | 4,758 | | | 4,610 | | | 148 | | | 3.2 | % |
| Short-term investments, including Other | 10,723 | | | 14,262 | | | (3,539) | | | (24.8 | %) |
| BOLI | 2,316 | | | 2,489 | | | (173) | | | (7.0 | %) |
| Investment fees and expenses | (8,200) | | | (7,501) | | | (699) | | | 9.3 | % |
| Net investment income | $ | 140,930 | | | $ | 126,130 | | | $ | 14,800 | | | 11.7 | % |
Fixed Maturities
Income from our fixed maturities increased in 2024 as compared to 2023 driven by higher average book yields as we took advantage of the current interest rate environment as our portfolio matures. Additionally, average investment balances were approximately 1.8% higher for 2024 as compared to 2023.
Average yields for our fixed maturity portfolio were as follows:
| | | | | | | | | | | |
| Year Ended December 31 |
| | 2024 | | 2023 |
| Average income yield | 3.5% | | 3.1% |
| Average tax equivalent income yield | 3.5% | | 3.1% |
Short-term Investments and Other Investments
Short-term investments, which have a maturity at purchase of one year or less are carried at fair value, which approximates their cost basis, and are primarily composed of investments in U.S. treasury obligations, commercial paper, money market funds and a certificate of deposit. Income from our short-term and other investments decreased during 2024 as compared to 2023 primarily due to lower average investment balances and lower yields given the decrease in interest rates.
Investment Fees and Expenses
Investment fees and expenses increased in 2024 as compared to 2023 primarily due to the mix of investment managers as well as an increase in service costs.
Equity in Earnings (Loss) of Unconsolidated Subsidiaries
Equity in earnings (loss) of unconsolidated subsidiaries was comprised as follows:
| | | | | | | | | | | | | | | | | | | | | | | |
| Year Ended December 31 |
| ($ in thousands) | 2024 | | 2023 | | Change |
| All other investments, primarily investment fund LPs/LLCs | $ | 21,532 | | | $ | 9,196 | | | $ | 12,336 | | | 134.1 | % |
| Tax credit partnerships | 671 | | | (2,405) | | | 3,076 | | | 127.9 | % |
| Equity in earnings (loss) of unconsolidated subsidiaries | $ | 22,203 | | | $ | 6,791 | | | $ | 15,412 | | | 226.9 | % |
We hold interests in certain LPs/LLCs that generate earnings from trading portfolios, secured debt, debt securities, multi-strategy funds and private equity investments. The performance of the LPs/LLCs is affected by the volatility of equity and credit markets. For our investments in LPs/LLCs, we record our allocable portion of the partnership operating income or loss as the results of the LPs/LLCs become available, typically following the end of a reporting period. Our investment results from our portfolio of investments in LPs/LLCs increased for 2024 as compared to 2023 primarily due to the performance of certain LPs/LLCs which reflected higher market valuations during the first half of 2024 and the fourth quarter of 2023.
Our tax credit partnership investments are designed to generate returns in the form of tax credits and tax-deductible project operating losses and are comprised of qualified affordable housing project tax credit partnerships and a historic tax credit partnership. We account for our tax credit partnership investments under the equity method and record our allocable portion of the operating losses of the underlying properties based on estimates provided by the partnerships. These tax credit partnership investments are reaching the end of their lifecycle, therefore partnership operating losses and tax benefits associated with these investments have been and are expected to continue to be nominal in amount. However, we may receive distributions from time to time due to the sale of properties, as was the case in 2024. The results from our tax credit partnership investments for the year ended December 31, 2024 also reflected the benefit of a decrease in our estimate of our allocable portion of operating losses of $0.7 million as compared to an increase in this estimate of $1.3 million during 2023. See additional information on our tax credit partnership investments in Note 3 of the Notes to Consolidated Financial Statements.
Net Investment Gains (Losses)
The following table provides detailed information regarding our net investment gains (losses).
| | | | | | | | | | | |
| Year Ended December 31 |
| (In thousands) | 2024 | | 2023 |
| Total impairment losses | | | |
| | | |
| Corporate debt | $ | (2,710) | | | $ | (2,984) | |
| | | |
| | | |
| Asset-backed securities | (588) | | | (127) | |
| | | |
| Portion of impairment losses recognized in other comprehensive income before taxes: | | | |
| | | |
| Corporate debt | 102 | | | — | |
| Net impairment losses recognized in earnings | (3,196) | | | (3,111) | |
| Gross realized gains, available-for-sale fixed maturities | 1,522 | | | 875 | |
| Gross realized (losses), available-for-sale fixed maturities | (4,035) | | | (1,800) | |
| Net realized gains (losses), trading fixed securities | 34 | | | (88) | |
| Net realized gains (losses), equity investments | (704) | | | (7) | |
| Net realized gains (losses), other investments | (826) | | | (2,417) | |
| Change in unrealized holding gains (losses), trading fixed securities | 445 | | | 68 | |
| Change in unrealized holding gains (losses), equity investments | (1,495) | | | 2,495 | |
| Change in unrealized holding gains (losses), convertible securities, carried at fair value as a part of other investments | 866 | | | 5,774 | |
| Other | 183 | | | 3,359 | |
| Net investment gains (losses) | $ | (7,206) | | | $ | 5,148 | |
For the year ended December 31, 2024, we recognized $3.2 million of credit-related impairment losses in earnings primarily related to four corporate bonds in the real estate sector and a nominal amount of non-credit impairment losses in OCI related to a corporate bond in the consumer sector. For the year ended December 31, 2023, we recognized credit-related impairment losses in earnings of $3.1 million related to a mortgage-backed security and two corporate bonds in the financial sector.
We recognized $7.2 million of net investment losses for the year ended December 31, 2024 driven by net realized losses from the sale of certain available-for-sale fixed maturities and, to a lesser extent, unrealized holding losses resulting from changes in the fair value of our equity investments. We recognized $5.1 million of net investment gains for the year ended December 31, 2023 driven by unrealized holding gains resulting from changes in the fair value of our convertible securities and equity investments and, to a lesser extent, death benefit proceeds from BOLI contracts.
Other Income (Expense)
Corporate other income (expense) for the years ended December 31, 2024 as compared to 2023 was comprised of the following:
| | | | | | | | | | | | | | | | | | | | | | | |
| Year Ended December 31 |
| ($ in thousands) | 2024 | | 2023 | | Change |
Foreign currency exchange rate gains (losses)(1) | $ | 6,731 | | | $ | (2,993) | | | $ | 9,724 | | | 324.9 | % |
| Other | 4,758 | | | 11,300 | | | (6,542) | | | (57.9 | %) |
| Total other income (expense) | $ | 11,489 | | | $ | 8,307 | | | $ | 3,182 | | | 38.3 | % |
(1) See further information on foreign currency exchange rate movements in the Executive Summary of Operations section under the heading "Revenues." |
Excluding foreign currency exchange rate movements, other income decreased for the year ended December 31, 2024 as compared to 2023 driven by proceeds of $6.9 million received in 2023 associated with the sale of our remaining ownership interest in the underwriting and operations entity associated with Syndicate 1729 to unrelated third parties.
Operating Expenses
Corporate segment operating expenses were comprised as follows:
| | | | | | | | | | | | | | | | | | | | | | | | | | |
| | Year Ended December 31 |
| ($ in thousands) | | 2024 | | 2023 | | Change |
| Operating expenses | | $ | 45,673 | | | $ | 39,747 | | | $ | 5,926 | | | 14.9 | % |
| Management fee offset | | (5,665) | | | (5,740) | | | 75 | | | (1.3 | %) |
| Total | | $ | 40,008 | | | $ | 34,007 | | | $ | 6,001 | | | 17.6 | % |
Operating expenses increased during the year ended December 31, 2024 as compared to 2023 driven by an increase in compensation-related costs, certain software and equipment costs and, to a lesser extent, share-based compensation expenses, partially offset by a decrease in professional fees. The increase in compensation-related costs during 2024 primarily reflected higher amounts accrued for performance-related incentive plans due to the improvement in the related performance metrics. The increase in share-based compensation expenses in 2024 reflected an increase in awards outstanding as compared to 2023. The decrease in professional fees during 2024 primarily reflected a decrease in consulting and temporary personnel fees.
Core domestic operating subsidiaries within our Specialty P&C segment and our Workers' Compensation Insurance segment are charged a management fee by the Corporate segment for services provided to these subsidiaries. The management fee is based on the extent to which services are provided to the subsidiary and the amount of premium written by the subsidiary. Under the arrangement, the expenses associated with such services are reported as expenses of the Corporate segment, and the management fees charged are reported as an offset to Corporate operating expenses. While the terms of the arrangement were generally consistent between 2024 and 2023, fluctuations in the amount of premium written by each subsidiary can result in corresponding variations in the management fee charged to each subsidiary during a particular period.
Interest Expense
Interest expense for the years ended December 31, 2024 and 2023 was comprised as follows:
| | | | | | | | | | | | | | | | | | | | | | | |
| Year Ended December 31 |
| ($ in thousands) | 2024 | | 2023 | | Change |
| Senior Notes due 2023 | $ | — | | | $ | 11,742 | | | $ | (11,742) | | | nm |
Contribution Certificates (including accretion)(1) | 7,517 | | | 7,567 | | | (50) | | | (0.7 | %) |
| Revolving Credit Agreement (including fees and amortization) | 10,244 | | | 2,494 | | | 7,750 | | | 310.7 | % |
| Term Loan (including fees and amortization) | 9,508 | | | 1,392 | | | 8,116 | | | 583.0 | % |
| (Gain)/loss on cash flow hedges reclassified from AOCI | (4,927) | | | (45) | | | (4,882) | | | 10,848.9 | % |
| | | | | | | |
| | | | | | | |
| Interest expense | $ | 22,342 | | | $ | 23,150 | | | $ | (808) | | | (3.5 | %) |
(1) Includes accretion of approximately $1.8 million and $1.9 million for the years ended December 31, 2024 and 2023, respectively, which is recorded as an increase to interest expense as a result of the difference between the recorded acquisition date fair value and the principal balance of the Contribution Certificates associated with our acquisition of NORCAL. |
|
|
Interest expense decreased during 2024 as compared to 2023 driven by the change in the fair value of our Interest Rate Swaps, largely offset by the higher effective interest rate on our Revolving Credit Agreement and Term Loan as compared to the effective interest rate of our Senior Notes that matured in November 2023. The Interest Rate Swaps are designated as highly effective cash flow hedges to manage our exposure to interest rate risk due to variability in the base rates on the borrowings under both the Revolving Credit Agreement and Term Loan. The change in the fair value of our Interest Rate Swaps in 2023 reflected our short-term exposure to variability in the base rates on these borrowings from November 15, 2023 until the Interest Rate Swaps were effective on December 29, 2023. See further discussion on our outstanding debt in Note 10 of the Notes to Consolidated Financial Statements and additional information regarding our Interest Rate Swaps is provided in Note 11 of the Notes to Consolidated Financial Statements.
Taxes
Tax expense allocated to our Corporate segment includes U.S. and U.K. tax expense including U.S. tax expense incurred from our corporate membership in Lloyd's of London, if any. The SPCs at Inova Re, one of our Cayman Islands reinsurance subsidiaries, have each made a 953(d) election under the U.S. Internal Revenue Code and are subject to U.S. federal income tax; therefore, tax expense allocated to our Corporate segment also includes tax expense incurred from any SPC at Inova Re in which we have a participation interest of 80% or greater as those SPCs are required to be included in our consolidated tax
return. Consolidated tax expense (benefit) reflects the tax expense (benefit) of both segments and the tax impact of items excluded from segment reporting, as shown in the table below:
| | | | | | | | | | | | | | | |
| | | Year Ended December 31 |
| (In thousands) | | | | | 2024 | | 2023 |
| Corporate segment income tax expense (benefit) | | | | | $ | 10,401 | | | $ | (545) | |
| | | | | | | |
| Income tax expense (benefit) - transaction-related costs* | | | | | (67) | | | — | |
| Consolidated income tax expense (benefit) | | | | | $ | 10,334 | | | $ | (545) | |
| *Represents the income tax benefit associated with actuarial consulting fees paid during the second quarter of 2024 in relation to the final determination of contingent consideration associated with the NORCAL acquisition. These costs are not included in a segment as we do not consider these costs in assessing the financial performance of any of our operating or reportable segments. See Note 16 of the Notes to Consolidated Financial Statements for a reconciliation of our segment results to our consolidated results. |
Listed below are the primary factors affecting our consolidated effective tax rate for the years ended December 31, 2024 and 2023. The comparability of each factor's impact on our effective tax rate is affected by the consolidated pre-tax income recognized during the year ended December 31, 2024 as compared to the consolidated pre-tax loss recognized in 2023. Factors that have the same directional impact on income tax expense in each period have an opposite impact on our effective tax rate due to the effective tax rate being calculated based upon a pre-tax income during the year ended December 31, 2024 as compared to the pre-tax loss during 2023. These factors include the following:
| | | | | | | | | | | | | | | | | |
| Year Ended December 31 |
| | 2024 | | 2023 |
| ($ in thousands) | Income tax (benefit) expense | Rate Impact | | Income tax (benefit) expense | Rate Impact |
| Computed "expected" tax expense (benefit) at statutory rate | $ | 13,247 | | 21.0 | % | | $ | (8,221) | | 21.0 | % |
Tax-exempt income(1) | (1,062) | | (1.7 | %) | | (1,192) | | 3.0 | % |
| Tax credits | (32) | | (0.1 | %) | | (631) | | 1.6 | % |
| Non-U.S. operating results | 396 | | 0.6 | % | | (625) | | 1.7 | % |
| Tax deficiency (excess tax benefit) on share-based compensation | 708 | | 1.1 | % | | 191 | | (0.5 | %) |
| | | | | |
Non-taxable contingent consideration(2) | (1,415) | | (2.2 | %) | | (1,785) | | 4.6 | % |
Goodwill impairment(3) | — | | — | % | | 9,263 | | (23.7 | %) |
| Provision-to-return and other differences | (42) | | (0.1 | %) | | 327 | | (0.8 | %) |
Change in uncertain tax positions(4) | (3,004) | | (4.8 | %) | | 1,546 | | (3.9 | %) |
| | | | | |
| Change in limitation of future deductibility of certain executive compensation | (198) | | (0.3 | %) | | 932 | | (2.4 | %) |
| GILTI and subpart F income | 292 | | 0.5 | % | | 396 | | (1.0 | %) |
| State income taxes | 911 | | 1.4 | % | | 65 | | (0.2 | %) |
| Non-taxable gain from life insurance proceeds | (42) | | (0.1 | %) | | (682) | | 1.7 | % |
| Other | 575 | | 1.1 | % | | (129) | | 0.3 | % |
| Total income tax expense (benefit) | $ | 10,334 | | 16.4 | % | | $ | (545) | | 1.4 | % |
(1) Includes tax-exempt interest, dividends received deduction and change in cash surrender value of BOLI.
(2) Represents the tax impact of a decrease in the contingent consideration liability issued in connection with the NORCAL acquisition of $6.5 million and the reversal of a nominal amount of associated contingent investment banker fees accrued during purchase accounting for the year ended December 31, 2024 as compared to a decrease in the contingent consideration liability of $8.5 million for the year ended December 31, 2023, all of which is non-taxable. See further discussion on the contingent consideration in Note 2 and Note 8 of the Notes to Consolidated Financial Statements.
(3) Represents the tax impact of the impairment of non-deductible goodwill in relation to the Workers' Compensation Insurance reporting unit during the third quarter of 2023. See further discussion on the impairment charge in Note 6 of the Notes to Consolidated Financial Statements.
(4) Represents the benefit for tax positions whose statute of limitations has expired.
ITEM 7A. QUANTITATIVE AND QUALITATIVE DISCLOSURES ABOUT MARKET RISK.
We believe that we are principally exposed to three types of market risk: interest rate risk, credit risk and foreign currency risk.
Interest Rate Risk
Investments
Our fixed maturities portfolio is exposed to interest rate risk. Fluctuations in interest rates have a direct impact on the market valuation of these securities. As interest rates rise, market values of fixed income portfolios fall and vice versa. Certain of the securities are held in an unrealized loss position; we do not intend to sell and believe we will not be required to sell any debt security held in an unrealized loss position before its anticipated recovery. If recovery is not anticipated, we will record an impairment loss through earnings either by establishing a credit allowance or by directly reducing the security's amortized cost basis if there is an intent to sell.
The following tables summarize estimated changes in the fair value of our available-for-sale fixed maturity securities for specific hypothetical changes in interest rates by asset class at December 31, 2024 and December 31, 2023. There are principally two factors that determine interest rates on a given security: changes in the level of yield curves and credit spreads. As different asset classes can be affected in different ways by movements in those two factors, we have separated our portfolio by asset class in the following tables.
| | | | | | | | | | | | | | | | | | | | | | | | | | | | | |
| Interest Rate Shift in Basis Points |
| December 31, 2024 |
| ($ in millions) | (200) | | (100) | | Current | | 100 | | 200 |
| Fair Value: | | | | | | | | | |
| Fixed maturities, available-for-sale: | | | | | | | | | |
| U.S. Treasury obligations | $ | 260 | | | $ | 252 | | | $ | 244 | | | $ | 236 | | | $ | 229 | |
| U.S. Government-sponsored enterprise obligations | 16 | | | 15 | | | 15 | | | 14 | | | 14 | |
| State and municipal bonds | 486 | | | 466 | | | 446 | | | 427 | | | 409 | |
| Corporate debt | 1,832 | | | 1,779 | | | 1,728 | | | 1,679 | | | 1,632 | |
| Asset-backed securities | 1,221 | | | 1,185 | | | 1,149 | | | 1,113 | | | 1,077 | |
| Total fixed maturities, available-for-sale | $ | 3,815 | | | $ | 3,697 | | | $ | 3,582 | | | $ | 3,469 | | | $ | 3,361 | |
| | | | | | | | | |
| Duration: | | | | | | | | | |
| Fixed maturities, available-for-sale: | | | | | | | | | |
| U.S. Treasury obligations | 2.49 | | 2.43 | | 2.38 | | 2.33 | | 2.28 |
| U.S. Government-sponsored enterprise obligations | 3.33 | | 3.40 | | 3.51 | | 3.56 | | 3.55 |
| State and municipal bonds | 4.04 | | 4.13 | | 4.25 | | 4.41 | | 4.50 |
| Corporate debt | 3.18 | | 3.20 | | 3.18 | | 3.13 | | 3.08 |
| Asset-backed securities | 2.81 | | 2.96 | | 3.05 | | 3.15 | | 3.19 |
| Total fixed maturities, available-for-sale | 3.13 | | 3.19 | | 3.22 | | 3.24 | | 3.23 |
| | | | | | | | | | | | | | | | | | | | | | | | | | | | | |
| Interest Rate Shift in Basis Points |
| December 31, 2023 |
| ($ in millions) | (200) | | (100) | | Current | | 100 | | 200 |
| Fair Value: | | | | | | | | | |
| Fixed maturities, available-for-sale: | | | | | | | | | |
| U.S. Treasury obligations | $ | 258 | | | $ | 251 | | | $ | 244 | | | $ | 237 | | | $ | 230 | |
| U.S. Government-sponsored enterprise obligations | 20 | | | 19 | | | 19 | | | 18 | | | 18 | |
| State and municipal bonds | 492 | | | 473 | | | 454 | | | 436 | | | 418 | |
| Corporate debt | 1,865 | | | 1,807 | | | 1,751 | | | 1,697 | | | 1,645 | |
| Asset-backed securities | 1,090 | | | 1,058 | | | 1,026 | | | 995 | | | 963 | |
| Total fixed maturities, available-for-sale | $ | 3,725 | | | $ | 3,608 | | | $ | 3,494 | | | $ | 3,383 | | | $ | 3,274 | |
| | | | | | | | | |
| Duration: | | | | | | | | | |
| Fixed maturities, available-for-sale: | | | | | | | | | |
| U.S. Treasury obligations | 2.95 | | 2.88 | | 2.82 | | 2.76 | | 2.70 |
| U.S. Government-sponsored enterprise obligations | 3.46 | | 3.46 | | 3.41 | | 3.35 | | 3.27 |
| State and municipal bonds | 3.90 | | 3.97 | | 4.07 | | 4.19 | | 4.30 |
| Corporate debt | 3.26 | | 3.25 | | 3.23 | | 3.18 | | 3.12 |
| Asset-backed securities | 2.82 | | 2.94 | | 3.03 | | 3.10 | | 3.14 |
| Total fixed maturities, available-for-sale | 3.19 | | 3.23 | | 3.25 | | 3.26 | | 3.25 |
Computations of prospective effects of hypothetical interest rate changes are based on numerous assumptions, including the maintenance of the existing level and composition of fixed income security assets, and should not be relied on as indicative of future results.
Certain shortcomings are inherent in the method of analysis presented in the computation of the fair value of fixed rate instruments. Actual values may differ from the projections presented should market conditions vary from assumptions used in the calculation of the fair value of individual securities, including non-parallel shifts in the term structure of interest rates and changing individual issuer credit spreads.
At December 31, 2024, our fixed maturities portfolio includes fixed maturities classified as trading securities which do not have a significant amount of exposure to market interest rates or credit spreads.
Our cash and short-term investments at December 31, 2024 were carried at fair value which approximates their cost basis due to their short-term nature. Our cash and short-term investments lack significant interest rate sensitivity due to their short duration.
Debt
We are exposed to interest rate risk due to variability in the base rate on borrowings under our Revolving Credit Agreement and Term Loan. Borrowings under our Revolving Credit Agreement and Term Loan accrue interest at a selected SOFR base rate, adjusted by a margin. To manage our exposure to interest rate risk on any borrowings under these agreements, we entered into two Interest Rate Swaps which effectively fix the base rate on borrowings under the Revolving Credit Agreement and Term Loan to 3.187% and 3.207%, respectively. As of December 31, 2024, the Revolving Credit Agreement and Term Loan have $125 million and $120 million in outstanding borrowings, respectively. Additional information regarding our debt is provided in Note 10 and further information regarding the Interest Rate Swaps in Note 11 of the Notes to Consolidated Financial Statements.
Defined Benefit Pension Plan
We are exposed to certain economic risks related to the costs of our defined benefit pension plan, including changes in discount rates for high quality corporate bonds and changes in the expected return on plan assets.
Credit Risk
We have exposure to credit risk primarily as a holder of fixed income securities. We control this exposure by emphasizing investment grade credit quality in the fixed income securities we purchase.
As of December 31, 2024, 93% of our fixed maturity securities were rated investment grade as determined by NRSROs, such as Fitch, Moody’s and Standard & Poor’s. We believe that this concentration in investment grade securities reduces our exposure to credit risk on our fixed income investments to an acceptable level. However, investment grade securities, in spite of their rating, can rapidly deteriorate and result in significant losses. Ratings published by the NRSROs are one of the tools used to evaluate the creditworthiness of our securities. The ratings reflect the subjective opinion of the rating agencies as to the creditworthiness of the securities; therefore, we may be subject to additional credit exposure should the ratings prove to be unreliable.
We also have exposure to credit risk related to our premiums receivable and receivables from reinsurers; however, to-date we have not experienced any significant amount of credit losses. At December 31, 2024, our premiums receivable was approximately $229 million, net of an allowance for expected credit losses of approximately $8 million. See Note 1 of the Notes to Consolidated Financial Statements for further information on our allowance for expected credit losses related to our premiums receivable. Our receivables from reinsurers (with regard to both paid and unpaid losses) approximated $427 million at December 31, 2024 and $467 million at December 31, 2023. We monitor the credit risk associated with our reinsurers using publicly available financial and rating agency data. We have not historically experienced material credit losses due to the financial condition of a reinsurer, and as of December 31, 2024 our expected credit losses associated with our receivables from reinsurers were nominal in amount.
Foreign Currency Risk
Foreign currency exchange rate movements are primarily related to foreign currency denominated available-for-sale fixed maturities and loss reserves associated with premium assumed from an international medical professional liability insurer in our Specialty P&C segment. Our participation in this program has grown in recent years which has led to greater volatility in our results of operations even with nominal movements in exchange rates given the size of the reserve. We mitigate foreign currency exchange exposure and manage market risks that arise in the normal course of business by generally matching the currency and duration of associated investments to the corresponding loss reserves as well as utilizing foreign currency forward contracts. Foreign currency forward contracts are typically short-term in nature with a maturity at inception of less than three months. At December 31, 2024, we had one foreign currency forward contract with a notional amount of €5.0 million ($5.5 million based on December 31, 2024 exchange rates) and a fair value of approximately $0.3 million. The counterparty to the foreign currency forward contract is a major financial institution which had an investment grade rating of BBB as of December 31, 2024. Additional information regarding our foreign currency forward contracts is provided in Note 11 of the Notes to Consolidated Financial Statements.
ITEM 8. FINANCIAL STATEMENTS AND SUPPLEMENTARY DATA.
| | | | | |
| Index to Consolidated Financial Statements | |
| |
| |
| |
| |
| |
| |
| |
| |
| |
| |
| |
| |
ITEM 9. CHANGES IN AND DISAGREEMENTS WITH ACCOUNTANTS ON ACCOUNTING AND FINANCIAL DISCLOSURE.
Not Applicable.
ITEM 9A. CONTROLS AND PROCEDURES.
Disclosure Controls
Under the supervision and with the participation of management, including the principal executive and principal financial officers, the Company has evaluated the effectiveness of the design and operation of our disclosure controls and procedures as of the end of the fiscal year ended December 31, 2024. Based on that evaluation, the principal executive and principal financial officers have concluded that these controls and procedures are effective.
Disclosure controls and procedures are defined in Exchange Act Rule 13a-15(e) and include the Company’s controls and other procedures that are designed to ensure that information, required to be disclosed by the Company in the reports that it files or submits under the Exchange Act, is accumulated and communicated to management, including the principal executive and principal financial officers, as appropriate, to allow timely decisions regarding required disclosure.
Management’s Report on Internal Control over Financial Reporting
Our management is responsible for establishing and maintaining adequate internal control over financial reporting, as such term is defined in Exchange Act Rules 13a-15(f) and 15d-15(f). Under the supervision and with the participation of our management, including our principal executive and principal financial officers, we conducted an evaluation of the effectiveness of our internal control over financial reporting as of December 31, 2024 based on the framework in Internal Control–Integrated Framework issued by the COSO (2013 Framework). Based on that evaluation, our management concluded that our internal control over financial reporting was effective as of December 31, 2024 and that there was no change in the Company's internal controls during the fiscal year then ended that has materially affected, or is reasonably likely to materially affect, the Company's internal control over financial reporting.
Ernst & Young LLP, an independent registered public accounting firm, has audited the effectiveness of our internal controls over financial reporting as of December 31, 2024 as stated in their report which is included elsewhere herein.
ITEM 9B. OTHER INFORMATION
During the three months ended December 31, 2024, no director or officer of the Company adopted or terminated a Rule 10b5-1 trading arrangement or non-Rule 10b5-1 trading arrangement, as each term is defined in Item 408(a) of Regulation S-K.
Report of Independent Registered Public Accounting Firm
To the Shareholders and the Board of Directors of ProAssurance Corporation
Opinion on Internal Control Over Financial Reporting
We have audited ProAssurance Corporation and subsidiaries’ internal control over financial reporting as of December 31, 2024, based on criteria established in Internal Control—Integrated Framework issued by the Committee of Sponsoring Organizations of the Treadway Commission (2013 Framework) (the COSO criteria). In our opinion, ProAssurance Corporation and subsidiaries (the Company) maintained, in all material respects, effective internal control over financial reporting as of December 31, 2024, based on the COSO criteria.
We also have audited, in accordance with the standards of the Public Company Accounting Oversight Board (United States) (PCAOB), the consolidated balance sheets as of December 31, 2024 and 2023, the related consolidated statements of changes in capital, income and comprehensive income, and cash flows for each of the three years in the period ended December 31, 2024, and the related notes and financial statement schedules listed in the Index at Item 15(c) (collectively referred to as the “financial statements”) of the Company and our report dated February 24, 2025, expressed an unqualified opinion thereon.
Basis for Opinion
The Company’s management is responsible for maintaining effective internal control over financial reporting and for its assessment of the effectiveness of internal control over financial reporting included in the accompanying Management’s Report on Internal Control over Financial Reporting. Our responsibility is to express an opinion on the Company’s internal control over financial reporting based on our audit. We are a public accounting firm registered with the PCAOB and are required to be independent with respect to the Company in accordance with the U.S. federal securities laws and the applicable rules and regulations of the Securities and Exchange Commission and the PCAOB.
We conducted our audit in accordance with the standards of the PCAOB. Those standards require that we plan and perform the audit to obtain reasonable assurance about whether effective internal control over financial reporting was maintained in all material respects.
Our audit included obtaining an understanding of internal control over financial reporting, assessing the risk that a material weakness exists, testing and evaluating the design and operating effectiveness of internal control based on the assessed risk, and performing such other procedures as we considered necessary in the circumstances. We believe that our audit provides a reasonable basis for our opinion.
Definition and Limitations of Internal Control Over Financial Reporting
A company’s internal control over financial reporting is a process designed to provide reasonable assurance regarding the reliability of financial reporting and the preparation of financial statements for external purposes in accordance with generally accepted accounting principles. A company’s internal control over financial reporting includes those policies and procedures that (1) pertain to the maintenance of records that, in reasonable detail, accurately and fairly reflect the transactions and dispositions of the assets of the company; (2) provide reasonable assurance that transactions are recorded as necessary to permit preparation of financial statements in accordance with generally accepted accounting principles, and that receipts and expenditures of the company are being made only in accordance with authorizations of management and directors of the company; and (3) provide reasonable assurance regarding prevention or timely detection of unauthorized acquisition, use, or disposition of the company’s assets that could have a material effect on the financial statements.
Because of its inherent limitations, internal control over financial reporting may not prevent or detect misstatements. Also, projections of any evaluation of effectiveness to future periods are subject to the risk that controls may become inadequate because of changes in conditions, or that the degree of compliance with the policies or procedures may deteriorate. not prevent or detect misstatements. Also, projections of any evaluation of effectiveness to future periods are subject to the risk that controls may become inadequate because of changes in conditions, or that the degree of compliance with the policies or procedures may deteriorate.
/s/ Ernst & Young LLP
Birmingham, Alabama
February 24, 2025
PART III
ITEM 10. DIRECTORS, EXECUTIVE OFFICERS AND CORPORATE GOVERNANCE OF THE REGISTRANT.
The information required by this Item regarding executive officers is included in Part I of the Form 10-K in accordance with Instruction 3 of the Instructions to Paragraph (b) of Item 401 of Regulation S-K.
The information required by this Item regarding directors is incorporated by reference pursuant to General Instruction G (3) of Form 10-K from ProAssurance’s definitive proxy statement for the 2025 Annual Meeting of its Stockholders to be filed with the Securities and Exchange Commission pursuant to Regulation 14A on or about April 11, 2025.
All employees and officers of ProAssurance are responsible for conducting themselves in compliance with our Code of Ethics and Conduct, which includes the Company's Securities Trading policy. In addition, all members of the Board, in connection with their duties as Directors, are responsible for conducting themselves in compliance with applicable provisions of the Code of Ethics and Conduct. The Code of Ethics and Conduct is available in the Corporate Governance section of our website, http://investor.ProAssurance.com/govdocs and included as Exhibit 14.1 of this report.
ITEM 11. EXECUTIVE COMPENSATION.
The information required by this Item is incorporated by reference pursuant to General Instruction G (3) of Form 10-K from ProAssurance’s definitive proxy statement for the 2025 Annual Meeting of its Stockholders to be filed with the Securities and Exchange Commission pursuant to Regulation 14A on or about April 11, 2025.
ITEM 12. SECURITY OWNERSHIP OF CERTAIN BENEFICIAL OWNERS AND MANAGEMENT AND RELATED STOCKHOLDER MATTERS.
The information required by this Item is incorporated by reference pursuant to General Instruction G (3) of Form 10-K from ProAssurance’s definitive proxy statement for the 2025 Annual Meeting of its Stockholders to be filed with the Securities and Exchange Commission pursuant to Regulation 14A on or about April 11, 2025.
ITEM 13. CERTAIN RELATIONSHIPS AND RELATED TRANSACTIONS, AND DIRECTOR INDEPENDENCE.
The information required by this Item is incorporated by reference pursuant to General Instruction G (3) of Form 10-K from ProAssurance’s definitive proxy statement for the 2025 Annual Meeting of its Stockholders to be filed with the Securities and Exchange Commission pursuant to Regulation 14A on or about April 11, 2025.
ITEM 14. PRINCIPAL ACCOUNTANT FEES AND SERVICES.
The information required by this Item is incorporated by reference pursuant to General Instruction G (3) of Form 10-K from ProAssurance’s definitive proxy statement for the 2025 Annual Meeting of its Stockholders to be filed with the Securities and Exchange Commission pursuant to Regulation 14A on or about April 11, 2025.
PART IV
ITEM 15. EXHIBITS AND FINANCIAL STATEMENT SCHEDULES.
(a)Financial Statements. The following consolidated financial statements of ProAssurance Corporation and subsidiaries are included herein in accordance with Item 8 of Part II of this report. (b)The exhibits required to be filed by Item 15(b) are listed herein in the Exhibit Index. (c)Financial Statement Schedules. The following consolidated financial statement schedules of ProAssurance Corporation and subsidiaries are included herein in accordance with Rule 14a-3(b): All other schedules to the consolidated financial statements required by Article 7 of Regulation S-X are not required under the related instructions or are inapplicable and therefore have been omitted.
SIGNATURES
Pursuant to the requirements of Section 13 of 15(d) of the Securities Exchange Act of 1934, the Registrant has duly caused this report to be signed on its behalf by the undersigned, thereunto duly authorized, on this the 24th day of February 2025.
| | | | | |
| PROASSURANCE CORPORATION |
| |
| By: | /S/ EDWARD L. RAND, JR. |
| Edward L. Rand, Jr. |
Pursuant to the requirements of the Securities Exchange Act of 1934, this report has been signed below by the following persons on behalf of the Registrant and in the capacities and on the dates indicated.
| | | | | | | | | | | | | | | | | |
| Name | | Title | | Date |
| | | | | |
| /S/ EDWARD L. RAND, JR. | | President and Chief Executive Officer | | February 24, 2025 |
| Edward L. Rand, Jr. | | (Principal Executive Officer) | | |
| | | | | |
| /S/ DANA S. HENDRICKS | | Chief Financial Officer | | February 24, 2025 |
| Dana S. Hendricks | | (Principal Financial and Accounting Officer) | | |
| | | | | |
| /S/ KEDRICK D. ADKINS, JR. | | Director | | February 24, 2025 |
| Kedrick D. Adkins, Jr. | | | | |
| | | | | |
| /S/ BRUCE D. ANGIOLILLO, J.D. | | Director | | February 24, 2025 |
| Bruce D. Angiolillo, J.D. | | | | |
| | | | | |
| /S/ RICHARD J. BIELEN, CPA | | Director | | February 24, 2025 |
| Richard J. Bielen, CPA | | | | |
| | | | | |
| /S/ FABIOLA COBARRUBIAS, M.D. | | Director | | February 24, 2025 |
| Fabiola Cobarrubias, M.D. | | | | |
| | | | | |
| /S/ SAMUEL A. DI PIAZZA, JR. | | Director | | February 24, 2025 |
| Samuel A. Di Piazza, Jr. | | | | |
| | | | | |
| /S/ MAYE HEAD FREI | | Director | | February 24, 2025 |
| Maye Head Frei | | | | |
| | | | | |
| /S/ STACI M. PIERCE, J.D. | | Director | | February 24, 2025 |
| Staci M. Pierce, J.D. | | | | |
| | | | | |
| /S/ SCOTT C. SYPHAX | | Director | | February 24, 2025 |
| Scott C. Syphax | | | | |
| | | | | |
| /S/ KATISHA T. VANCE, M.D. | | Director | | February 24, 2025 |
| Katisha T. Vance, M.D. | | | | |
Report of Independent Registered Public Accounting Firm
To the Shareholders and the Board of Directors of ProAssurance Corporation
Opinion on the Financial Statements
We have audited the accompanying consolidated balance sheets of ProAssurance Corporation and subsidiaries (the Company) as of December 31, 2024 and 2023, the related consolidated statements of changes in capital, income and comprehensive income, and cash flows for each of the three years in the period ended December 31, 2024, and the related notes and the financial statement schedules listed in the Index at Item 15(c) (collectively referred to as the “consolidated financial statements”). In our opinion, the consolidated financial statements present fairly, in all material respects, the financial position of the Company at December 31, 2024 and 2023, and the results of its operations and its cash flows for each of the three years in the period ended December 31, 2024, in conformity with U.S. generally accepted accounting principles.
We also have audited, in accordance with the standards of the Public Company Accounting Oversight Board (United States) (PCAOB), the Company's internal control over financial reporting as of December 31, 2024, based on criteria established in Internal Control-Integrated Framework issued by the Committee of Sponsoring Organizations of the Treadway Commission (2013 Framework) and our report dated February 24, 2025 expressed an unqualified opinion thereon.
Basis for Opinion
These financial statements are the responsibility of the Company's management. Our responsibility is to express an opinion on the Company’s financial statements based on our audits. We are a public accounting firm registered with the PCAOB and are required to be independent with respect to the Company in accordance with the U.S. federal securities laws and the applicable rules and regulations of the Securities and Exchange Commission and the PCAOB.
We conducted our audits in accordance with the standards of the PCAOB. Those standards require that we plan and perform the audit to obtain reasonable assurance about whether the financial statements are free of material misstatement, whether due to error or fraud. Our audits included performing procedures to assess the risks of material misstatement of the financial statements, whether due to error or fraud, and performing procedures that respond to those risks. Such procedures included examining, on a test basis, evidence regarding the amounts and disclosures in the financial statements. Our audits also included evaluating the accounting principles used and significant estimates made by management, as well as evaluating the overall presentation of the financial statements. We believe that our audits provide a reasonable basis for our opinion.
Critical Audit Matters
The critical audit matters communicated below are matters arising from the current period audit of the financial statements that were communicated or required to be communicated to the audit committee and that: (1) relate to accounts or disclosures that are material to the financial statements and (2) involved our especially challenging, subjective, or complex judgments. The communication of critical audit matters does not alter in any way our opinion on the consolidated financial statements, taken as a whole, and we are not, by communicating the critical audit matters below, providing separate opinions on the critical audit matters or on the accounts or disclosures to which they relate.
| | | | | |
| Valuation of reserve for losses and loss adjustment expenses |
| Description of the Matter | At December 31, 2024, the Company’s gross reserve for losses and loss adjustment expenses was $3.3 billion. As explained in Notes 1 and 7 to the financial statements, the reserve for losses and loss adjustment expenses represents the estimated ultimate costs of all reported and unreported losses and loss adjustment expenses incurred and unpaid as of the reporting date. The reserve for losses and loss adjustment expenses is determined based on individual claims and payments thereon as well as actuarially determined estimates of ultimate losses. The Company updates the data underlying the estimation of the reserve for losses each reporting period and adjusts loss estimation assumptions that best reflect emerging data. Both internal and consulting actuaries perform an in-depth review of the reserve for losses on at least a semi-annual basis using the Company’s loss and exposure data. The actuarial process is highly judgmental, both as to the selection of the various actuarial methodologies, and the significant assumptions within those methodologies, which are based on historical paid and incurred development trends, and in the interpretation of the output of the various methods used. |
| Auditing management’s reserve for losses and loss adjustment expenses required the involvement of our actuarial specialists and was complex and highly judgmental due to sensitivity of the significant assumptions supporting the valuation of the reserve for losses and loss adjustment expenses. |
| | | | | |
| How We Addressed the Matter in Our Audit | We obtained an understanding, evaluated the design and tested controls that address the risks of material misstatement related to the valuation of the reserve for losses and loss adjustment expenses. This included testing management’s controls over the review and approval processes that management has in place for the methods and significant assumptions used in estimating the reserve. |
| To test the reserve for losses and loss adjustment expenses, we performed audit procedures that included, among others, evaluating, with the assistance of our actuarial specialists, the Company’s selection of methods against those used in prior periods and used in the industry for similar types of insurance. We evaluated significant assumptions, based on historical paid and incurred loss development trends, relative to the Company’s historical experience and to the extent required compared to industry experience. We involved our actuarial specialists to independently calculate a range of reasonable losses and loss adjustment expense reserve estimates and compared this range to the Company’s recorded reserve for losses and loss adjustment expenses. We also performed a review of the development of prior years’ reserve estimates. |
| | | | | |
| Deferred tax assets valuation allowance |
| Description of the Matter | As described in Note 5 to the consolidated financial statements, the Company had total deferred tax assets of $212.4 million. As described in Note 1 to the consolidated financial statements, these deferred tax assets represent the tax benefit of future deductible temporary differences, net operating loss carryforwards, and tax credit carryforwards. Deferred tax assets are reduced by a valuation allowance if, based on the weight of all available evidence, it is more likely than not that some portion, or all, of the deferred tax assets will not be realized. In evaluating the need for a valuation allowance, the Company considers many factors, including the future reversal of existing temporary differences and the identification and use of available tax planning strategies. If those sources are insufficient to support the recoverability of the deferred tax assets, the Company then considers its projections of future taxable income, which involves significant management judgment. |
| Auditing management's assessment of the realizability of its deferred tax assets was complex because management's projection of future taxable income includes forward-looking assumptions which are inherently judgmental as they may be affected by future market or other economic conditions. |
| | | | | |
| How We Addressed the Matter in Our Audit | We obtained an understanding, evaluated the design, and tested the operating effectiveness of the controls related to the realizability of deferred tax assets, which included, among others, controls related to the review and approval of future projected taxable income and the assumptions used in the Company’s model. |
| Among other audit procedures performed, we evaluated the assumptions used by the Company to develop projections of future taxable income and tested the completeness and accuracy of the underlying data used in its projections. For example, we compared the projections of future taxable income with the actual results of prior periods, as well as management’s consideration of current industry and economic trends. We also assessed the historical accuracy of management’s projections and compared the projections of future taxable income with other forecasted financial information prepared by the Company. Further, we utilized tax professionals to assist us in our audit procedures. |
/s/ Ernst & Young, LLP
We have served as the Company's auditor since 1977.
Birmingham, Alabama
February 24, 2025
ProAssurance Corporation and Subsidiaries
Consolidated Balance Sheets
(In thousands, except share data)
| | | | | | | | | | | |
| December 31,
2024 | | December 31,
2023 |
| Assets | | | |
| Investments | | | |
| Fixed maturities, available-for-sale, at fair value (amortized cost, $3,803,835 and $3,758,720, respectively; allowance for expected credit losses, $3,399 and $555, respectively) | $ | 3,582,207 | | | $ | 3,493,597 | |
| Fixed maturities, trading, at fair value (cost, $52,493 and $48,449, respectively) | 53,157 | | | 48,324 | |
| Equity investments, at fair value (cost, $145,411 and $164,262, respectively) | 130,158 | | | 151,295 | |
| Short-term investments | 254,922 | | | 235,785 | |
| Business owned life insurance | 80,179 | | | 78,205 | |
| Investment in unconsolidated subsidiaries | 259,538 | | | 276,756 | |
| Other investments (at fair value, $2,077 and $62,604, respectively, otherwise at cost or amortized cost) | 7,266 | | | 65,819 | |
| Total Investments | 4,367,427 | | | 4,349,781 | |
| Cash and cash equivalents | 54,881 | | | 65,898 | |
| | | |
| Premiums receivable, net (allowance for expected credit losses, $8,141 and $7,809, respectively) | 228,900 | | | 235,569 | |
| Receivable from reinsurers on paid losses and loss adjustment expenses | 18,226 | | | 21,122 | |
| Receivable from reinsurers on unpaid losses and loss adjustment expenses | 409,069 | | | 445,573 | |
| Prepaid reinsurance premiums | 30,623 | | | 31,149 | |
| Deferred policy acquisition costs | 59,026 | | | 60,336 | |
| Deferred tax asset, net | 163,928 | | | 186,164 | |
| Real estate, net | 29,581 | | | 29,757 | |
| Operating lease ROU assets | 16,514 | | | 16,275 | |
| Intangible assets, net | 54,208 | | | 60,308 | |
| Goodwill | 5,500 | | | 5,500 | |
| Other assets | 136,390 | | | 124,493 | |
| Total Assets | $ | 5,574,273 | | | $ | 5,631,925 | |
| Liabilities and Shareholders' Equity | | | |
| Liabilities | | | |
| Policy liabilities and accruals | | | |
| Reserve for losses and loss adjustment expenses | $ | 3,257,696 | | | $ | 3,401,281 | |
| Unearned premiums | 418,756 | | | 433,715 | |
| Reinsurance premiums payable | 27,289 | | | 24,019 | |
| Total Policy Liabilities and Accruals | 3,703,741 | | | 3,859,015 | |
| | | |
| Operating lease liabilities | 17,390 | | | 17,179 | |
| Other liabilities | 226,520 | | | 216,618 | |
| Debt less unamortized debt issuance costs | 424,873 | | | 427,133 | |
| Total Liabilities | 4,372,524 | | | 4,519,945 | |
| Shareholders' Equity | | | |
| Common shares (par value $0.01 per share, 100,000,000 shares authorized, 63,763,789 and 63,576,932 shares issued, respectively) | 638 | | | 636 | |
| Additional paid-in capital | 408,471 | | | 403,554 | |
| Accumulated other comprehensive income (loss) (net of deferred tax expense (benefit) of ($46,681) and ($55,738), respectively) | (172,391) | | | (204,489) | |
| Retained earnings | 1,434,725 | | | 1,381,981 | |
| Treasury shares, at cost (12,606,968 shares as of each respective period end) | (469,694) | | | (469,702) | |
| Total Shareholders' Equity | 1,201,749 | | | 1,111,980 | |
| Total Liabilities and Shareholders' Equity | $ | 5,574,273 | | | $ | 5,631,925 | |
See accompanying notes.
ProAssurance Corporation and Subsidiaries
Consolidated Statements of Changes in Capital
(In thousands)
| | | | | | | | | | | | | | | | | | | | | | | | | | | | | | | | | | | |
| Common Stock | | Additional Paid-in Capital | | Accumulated Other Comprehensive Income (Loss) | | Retained Earnings | | Treasury Stock | | Total |
| Balance at January 1, 2022 | $ | 633 | | | $ | 392,941 | | | $ | 16,284 | | | $ | 1,434,491 | | | $ | (415,962) | | | $ | 1,428,387 | |
| | | | | | | | | | | |
| Common shares reacquired | — | | | — | | | — | | | — | | | (3,252) | | | (3,252) | |
| Common shares issued for compensation | — | | | 1,078 | | | — | | | — | | | — | | | 1,078 | |
| Share-based compensation | — | | | 4,828 | | | — | | | — | | | — | | | 4,828 | |
| Net effect of restricted and performance shares issued | 1 | | | (928) | | | — | | | — | | | — | | | (927) | |
| Dividends to shareholders | — | | | — | | | — | | | (10,803) | | | — | | | (10,803) | |
| Other comprehensive income (loss) | — | | | — | | | (314,891) | | | — | | | — | | | (314,891) | |
| Net income (loss) | — | | | — | | | — | | | (402) | | | — | | | (402) | |
| Balance at December 31, 2022 | 634 | | | 397,919 | | | (298,607) | | | 1,423,286 | | | (419,214) | | | 1,104,018 | |
| | | | | | | | | | | |
| Common shares reacquired | — | | | — | | | — | | | — | | | (50,488) | | | (50,488) | |
| Common shares issued for compensation | — | | | 1,064 | | | — | | | — | | | — | | | 1,064 | |
| Share-based compensation | — | | | 5,247 | | | — | | | — | | | — | | | 5,247 | |
| Net effect of restricted and performance shares issued | 2 | | | (676) | | | — | | | — | | | — | | | (674) | |
| Dividends to shareholders | — | | | — | | | — | | | (2,701) | | | — | | | (2,701) | |
| Other comprehensive income (loss) | — | | | — | | | 94,118 | | | — | | | — | | | 94,118 | |
| Net income (loss) | — | | | — | | | — | | | (38,604) | | | — | | | (38,604) | |
| Balance at December 31, 2023 | 636 | | | 403,554 | | | (204,489) | | | 1,381,981 | | | (469,702) | | | 1,111,980 | |
| | | | | | | | | | | |
| Common shares reacquired | — | | | — | | | — | | | — | | | 8 | | | 8 | |
| | | | | | | | | | | |
| Share-based compensation | — | | | 6,203 | | | — | | | — | | | — | | | 6,203 | |
| Net effect of restricted and performance shares issued | 2 | | | (1,286) | | | — | | | — | | | — | | | (1,284) | |
| | | | | | | | | | | |
| Other comprehensive income (loss) | — | | | — | | | 32,098 | | | — | | | — | | | 32,098 | |
| Net income (loss) | — | | | — | | | — | | | 52,744 | | | — | | | 52,744 | |
| Balance at December 31, 2024 | $ | 638 | | | $ | 408,471 | | | $ | (172,391) | | | $ | 1,434,725 | | | $ | (469,694) | | | $ | 1,201,749 | |
See accompanying notes.
ProAssurance Corporation and Subsidiaries
Consolidated Statements of Income and Comprehensive Income
(In thousands, except per share data)
| | | | | | | | | | | | | | | | | |
| Year Ended December 31 |
| | 2024 | | 2023 | | 2022 |
| Revenues | | | | | |
| Net premiums earned | $ | 968,250 | | | $ | 977,397 | | | $ | 1,029,581 | |
| Net investment income | 144,538 | | | 128,419 | | | 95,972 | |
| Equity in earnings (loss) of unconsolidated subsidiaries | 22,203 | | | 6,791 | | | 4,888 | |
| Net investment gains (losses): | | | | | |
| Impairment losses | (3,298) | | | (3,111) | | | (1,772) | |
| Portion of impairment losses recognized in other comprehensive income (loss) before taxes | 102 | | | — | | | 14 | |
| Net impairment losses recognized in earnings | (3,196) | | | (3,111) | | | (1,758) | |
| Other net investment gains (losses) | 5,099 | | | 16,939 | | | (31,399) | |
| Total net investment gains (losses) | 1,903 | | | 13,828 | | | (33,157) | |
| Other income (expense) | 13,510 | | | 10,777 | | | 9,404 | |
| Total revenues | 1,150,404 | | | 1,137,212 | | | 1,106,688 | |
| Expenses | | | | | |
| | | | | |
| | | | | |
| Net losses and loss adjustment expenses | 739,435 | | | 800,494 | | | 776,762 | |
| Underwriting, policy acquisition and operating expenses: | | | | | |
| Operating expense | 183,909 | | | 165,931 | | | 174,163 | |
| DPAC amortization | 135,430 | | | 134,813 | | | 133,175 | |
| SPC U.S. federal income tax expense (benefit) | 1,766 | | | 1,629 | | | 1,759 | |
| SPC dividend expense (income) | 4,444 | | | 6,234 | | | 6,673 | |
| Interest expense | 22,342 | | | 23,150 | | | 20,372 | |
| Goodwill impairment | — | | | 44,110 | | | — | |
| Total expenses | 1,087,326 | | | 1,176,361 | | | 1,112,904 | |
| | | | | |
| Income (loss) before income taxes | 63,078 | | | (39,149) | | | (6,216) | |
| Provision for income taxes: | | | | | |
| Current expense (benefit) | (2,487) | | | 1,223 | | | 807 | |
| Deferred expense (benefit) | 12,821 | | | (1,768) | | | (6,621) | |
| Total income tax expense (benefit) | 10,334 | | | (545) | | | (5,814) | |
| Net income (loss) | 52,744 | | | (38,604) | | | (402) | |
| Other comprehensive income (loss), after tax, net of reclassification adjustments | 32,098 | | | 94,118 | | | (314,891) | |
| Comprehensive income (loss) | $ | 84,842 | | | $ | 55,514 | | | $ | (315,293) | |
| Earnings (loss) per share: | | | | | |
| Basic | $ | 1.03 | | | $ | (0.73) | | | $ | (0.01) | |
| Diluted | $ | 1.03 | | | $ | (0.73) | | | $ | (0.01) | |
| Weighted average number of common shares outstanding: | | | | | |
| Basic | 51,097 | | | 52,642 | | | 54,008 | |
| Diluted | 51,266 | | | 52,788 | | | 54,140 | |
| Cash dividends declared per common share | $ | — | | | $ | 0.05 | | | $ | 0.20 | |
See accompanying notes.
ProAssurance Corporation and Subsidiaries
Consolidated Statements of Cash Flows
(In thousands)
| | | | | | | | | | | | | | | | | |
| Year Ended December 31 |
| | 2024 | | 2023 | | 2022 |
| Operating Activities | | | | | |
| Net income (loss) | $ | 52,744 | | | $ | (38,604) | | | $ | (402) | |
| Adjustments to reconcile net income (loss) to net cash provided (used) by operating activities: | | | | | |
| Goodwill impairment | — | | | 44,110 | | | — | |
| | | | | |
| Depreciation and amortization, net of accretion | 17,751 | | | 26,015 | | | 38,063 | |
| (Increase) decrease in cash surrender value of BOLI | (2,316) | | | 3,541 | | | 21 | |
| Net investment (gains) losses | (1,903) | | | (13,828) | | | 33,157 | |
| Share-based compensation | 6,203 | | | 5,247 | | | 4,829 | |
| Deferred income tax expense (benefit) | 12,821 | | | (1,768) | | | (6,621) | |
| Policy acquisition costs, net of amortization (net deferral) | 1,310 | | | (2,188) | | | 792 | |
| Equity in (earnings) loss of unconsolidated subsidiaries | (22,203) | | | (6,791) | | | (4,888) | |
| Distributed earnings from unconsolidated subsidiaries | 21,156 | | | 15,375 | | | 30,278 | |
| Other, net | (320) | | | 947 | | | (571) | |
| Change in: | | | | | |
| Premiums receivable | 6,669 | | | 10,525 | | | (4,999) | |
| Reinsurance related assets and liabilities | 43,196 | | | (26,017) | | | 20,476 | |
| Other assets | (9,424) | | | (5,014) | | | 12,076 | |
| Reserve for losses and loss adjustment expenses | (143,585) | | | (69,866) | | | (108,793) | |
| Unearned premiums | (14,959) | | | 10,765 | | | (11,011) | |
| Other liabilities | 22,145 | | | (2,334) | | | (32,248) | |
| Net cash provided (used) by operating activities | (10,715) | | | (49,885) | | | (29,841) | |
| Investing Activities | | | | | |
| Purchases of: | | | | | |
| Fixed maturities, available-for-sale | (770,332) | | | (419,234) | | | (607,790) | |
| Equity investments | (2,104) | | | (1,586) | | | (34,907) | |
| Other investments | (9,585) | | | (40,795) | | | (38,873) | |
| | | | | |
| Investment in unconsolidated subsidiaries | (25,845) | | | (36,739) | | | (39,488) | |
| Proceeds from sales or maturities of: | | | | | |
| Fixed maturities, available-for-sale | 707,840 | | | 493,648 | | | 542,855 | |
| Equity investments | 23,518 | | | 3,751 | | | 78,550 | |
| Other investments | 68,767 | | | 77,130 | | | 34,794 | |
| Net sales or (purchases) of fixed maturities, trading | (4,353) | | | (4,911) | | | (499) | |
| Return of invested capital from unconsolidated subsidiaries | 44,110 | | | 56,609 | | | 44,464 | |
| Net sales or maturities (purchases) of short-term investments | (14,170) | | | 13,198 | | | (27,789) | |
| Unsettled security transactions, net change | 1,842 | | | 2,199 | | | (6,302) | |
| Purchases of capital assets | (9,016) | | | (4,790) | | | (4,353) | |
| | | | | |
| | | | | |
| | | | | |
| Other | — | | | 2,659 | | | (2,659) | |
| Net cash provided (used) by investing activities | 10,672 | | | 141,139 | | | (61,997) | |
| Continued on the following page. | | | | | |
| | | | | | | | | | | | | | | | | |
| Year Ended December 31 |
| | 2024 | | 2023 | | 2022 |
| Continued from the previous page. | | | | | |
| Financing Activities | | | | | |
| Borrowings (repayments) under Revolving Credit Agreement | (4,687) | | | 250,000 | | | — | |
| Repayments of Senior Notes | — | | | (250,000) | | | — | |
| | | | | |
| Repurchase of common stock | 8 | | | (50,488) | | | (3,252) | |
| Dividends to shareholders | — | | | (5,379) | | | (10,768) | |
| Capital contribution received from (return of capital to) external segregated portfolio cell participants | (5,010) | | | 3,503 | | | (8,928) | |
| | | | | |
| | | | | |
| Other | (1,285) | | | (2,951) | | | 1,143 | |
| Net cash provided (used) by financing activities | (10,974) | | | (55,315) | | | (21,805) | |
| Increase (decrease) in cash and cash equivalents | (11,017) | | | 35,939 | | | (113,643) | |
| Cash and cash equivalents at beginning of period | 65,898 | | | 29,959 | | | 143,602 | |
| Cash and cash equivalents at end of period | $ | 54,881 | | | $ | 65,898 | | | $ | 29,959 | |
| | | | | |
| Supplemental Disclosure of Cash Flow Information | | | | | |
| Cash paid (refunded) during the year for income taxes, net | $ | 1,371 | | | $ | (11,195) | | | $ | 2,340 | |
| Cash paid during the year for interest | $ | 23,429 | | | $ | 22,314 | | | $ | 19,679 | |
| | | | | |
| Significant Non-Cash Transactions | | | | | |
| | | | | |
| Operating lease liabilities arising from obtaining ROU assets | $ | 2,176 | | | $ | — | | | $ | 3,133 | |
| Dividends declared and not yet paid | $ | — | | | $ | — | | | $ | 2,698 | |
| | | | | |
| | | | | |
| Increase (decrease) in fair value of contingent consideration issued in NORCAL acquisition | $ | (6,500) | | | $ | (8,500) | | | $ | (9,000) | |
See accompanying notes.
ProAssurance Corporation and Subsidiaries
Notes to Consolidated Financial Statements
December 31, 2024
1. Accounting Policies
Organization and Nature of Business
ProAssurance Corporation (ProAssurance, ProAssurance Group, PRA or the Company), a Delaware corporation, is an insurance holding company primarily for wholly owned specialty property and casualty and workers' compensation insurance entities including an entity that provides capital to Syndicate 1729 at Lloyd's to support the Company's previous participation in underwriting years that remain open. Risks insured are primarily liability risks located within the U.S.
ProAssurance operates in four reportable segments as follows: Specialty P&C, Workers' Compensation Insurance, Segregated Portfolio Cell Reinsurance and Corporate. For more information on the Company's segment reporting, including the nature of products and services provided and financial information by segment, refer to Note 16.
Principles of Consolidation
The accompanying Consolidated Financial Statements include the accounts of ProAssurance Corporation, its wholly owned subsidiaries and VIEs in which ProAssurance is the primary beneficiary. See Note 14 for more information on ProAssurance's VIE interests. Investments in entities where ProAssurance holds a greater than minor interest but does not hold a controlling interest are accounted for using the equity method. All significant intercompany accounts and transactions are eliminated in consolidation. ProAssurance subsidiaries located in the U.K. are normally reported on a quarter lag due to timing issues regarding the availability of information, except when information is available that is material to the current period. Furthermore, investment results associated with ProAssurance's FAL investments and certain U.S. paid administrative expenses are reported concurrently as that information is available on an earlier time frame.
Basis of Presentation
The preparation of financial statements in conformity with GAAP requires management to make estimates and assumptions that affect the reported amounts of assets and liabilities, revenues and expenses, and disclosures related to these amounts at the date of the financial statements.
Accounting Policies
The significant accounting policies followed by ProAssurance in making estimates that materially affect financial reporting are summarized in these Notes to Consolidated Financial Statements. The Company evaluates these estimates and assumptions on an ongoing basis based on current and historical developments, market conditions, industry trends and other information that the Company believes to be reasonable under the circumstances. The Company can make no assurance that actual results will conform to its estimates and assumptions; reported results of operations may be materially affected by changes in these estimates and assumptions.
Recognition of Revenues
Insurance premiums are recognized as revenues pro rata over the terms of the policies, which are principally one year in duration.
Losses and Loss Adjustment Expenses
ProAssurance establishes its reserve for losses and LAE ("reserve for losses" or "reserve") based on estimates of the future amounts necessary to pay claims and expenses associated with the investigation and settlement of claims. The reserve for losses is determined on the basis of individual claims and payments thereon as well as actuarially determined estimates of future losses based on past loss experience, available industry data and projections as to future claims frequency, severity, inflationary trends, judicial trends, legislative changes and settlement patterns.
Management establishes the reserve for losses after taking into consideration a variety of factors including premium rates, historical paid and incurred loss development trends, and management's evaluation of the current loss environment including frequency, severity, expected effect of inflation, general economic and social trends, and the legal and political environment. Management also takes into consideration the conclusions reached by internal and consulting actuaries. Management updates and reviews the data underlying the estimation of the reserve for losses each reporting period and makes adjustments to loss estimation assumptions that best reflect emerging data. Both internal and consulting actuaries perform an in-depth review of the
ProAssurance Corporation and Subsidiaries
Notes to Consolidated Financial Statements
December 31, 2024
reserve for losses on at least a semi-annual basis using the loss and exposure data of ProAssurance's subsidiaries. Consulting actuaries provide reports to management regarding the adequacy of reserves.
Estimating casualty insurance reserves, and particularly long-tailed insurance reserves, is a complex process. Long-tailed insurance is characterized by the extended period of time typically required both to assess the viability of a claim and potential damages, if any, and to reach a resolution of the claim. For a high proportion of the risks insured or reinsured by ProAssurance, the period of time required to resolve a claim is often five years or more, and claims may be subject to litigation. Estimating losses for these long-tailed claims requires ProAssurance to make and revise judgments and assessments regarding multiple uncertainties over an extended period of time. As a result, reserve estimates may vary significantly from the eventual outcome. Reserve estimates and the assumptions on which these estimates are predicated are regularly reviewed and updated as new information becomes available. Any adjustments necessary are reflected in current operations. Due to the size of ProAssurance’s reserve for losses, even a small percentage adjustment to these estimates could have a material effect on earnings in the period in which the adjustment is made. See Note 7 for additional information on ProAssurance's reserve for losses and LAE.
The effect of adjustments made to reinsured losses is mitigated by the corresponding adjustment that is made to reinsurance recoveries. Thus, in any given year, ProAssurance may make significant adjustments to gross losses that have little effect on its net losses.
Reinsurance Receivables
ProAssurance enters into reinsurance agreements whereby other insurance entities agree to assume a portion of the risk associated with certain policies issued by ProAssurance. In return, ProAssurance agrees to pay a premium to the reinsurer. ProAssurance uses reinsurance to provide capacity to write larger limits of liability, to provide reimbursement for losses incurred under the higher limit coverages the Company offers, to provide protection against losses in excess of policy limits, and, in the case of risk sharing arrangements, to align the Company's objectives with those of its strategic business partners and to provide custom insurance solutions for large customer groups.
Receivable from reinsurers on paid losses and LAE is the estimated amount of losses already paid that will be recoverable from reinsurers. Receivable from reinsurers on unpaid losses and LAE is the estimated amount of future loss payments that will be recoverable from reinsurers. Reinsurance recoveries are the portion of losses incurred during the period that are estimated to be allocable to reinsurers. Premiums ceded are the estimated premiums that will be due to reinsurers with respect to premiums earned and losses incurred during the period.
These estimates are based upon management’s estimates of ultimate losses and the portion of those losses that are allocable to reinsurers under the terms of the related reinsurance agreements. Given the uncertainty inherent in management's estimate of the ultimate amounts of losses, these estimates may vary significantly from the ultimate outcome. Management regularly reviews these estimates and any adjustments necessary are reflected in the period in which the estimate is changed. Due to the size of the receivable from reinsurers, an adjustment to these estimates could have a material effect on ProAssurance's results of operations for the period in which the adjustment is made.
Reinsurance contracts do not relieve ProAssurance from its obligations to policyholders. ProAssurance continually monitors its reinsurers to minimize its exposure to significant credit losses from reinsurer insolvencies (see additional discussion below under the heading "Credit Losses"). Any amount determined to be uncollectible is written off in the period in which the uncollectible amount is identified. See Note 4 for further information.
Credit Losses
ProAssurance's premiums receivable and reinsurance receivables are exposed to credit losses, but to-date have not experienced any significant amount of credit losses. ProAssurance measures expected credit losses on its premiums receivables and reinsurance receivables on a collective (pool) basis when similar risk characteristics exist, and the Company will reassess its pools each reporting period to ensure all receivables within the pool continue to share similar risk characteristics. If the Company determines that a receivable does not share risk characteristics with its other receivables within a pool, it will evaluate that receivable for expected credit losses on an individual basis. ProAssurance measures expected credit losses associated with its premium receivables at the segment level as each segment’s premium receivables share similar risk characteristics including term, type of financial asset and similar historical and expected credit loss patterns. ProAssurance measures expected credit losses associated with its reinsurance receivables (related to both paid and unpaid losses) at the consolidated level as its reinsurance receivables share similar risk characteristics including type of financial asset, type of industry and similar historical and expected credit loss patterns.
ProAssurance Corporation and Subsidiaries
Notes to Consolidated Financial Statements
December 31, 2024
ProAssurance measures expected credit losses over the contractual term of each pool utilizing a loss rate method. Historical internal credit loss experience for each pool is the basis for the Company’s assessment of expected credit losses; however, the Company may also consider historical credit loss information from external sources. In addition to historical credit loss data, the Company also considers reasonable and supportable forecasts of future economic conditions in its estimate of expected credit losses by utilizing industry and macroeconomic factors that it believes most relevant to the collectability of each pool.
ProAssurance's available-for-sale fixed maturity investments are also exposed to credit losses. See Note 3 for information on ProAssurance's allowance for expected credit losses on its available-for-sale fixed maturities.
ProAssurance's premiums receivable on its Consolidated Balance Sheet as of December 31, 2024 and 2023 is reported net of the related allowance for expected credit losses of $8.1 million and $7.8 million, respectively. The following tables present a roll forward of the allowance for expected credit losses related to the Company's premiums receivable for the years ended December 31, 2024 and 2023.
| | | | | | | | | | | | | | | |
| (In thousands) | | | | | Premiums Receivable, Net | | Allowance for Expected Credit Losses |
| Balance, December 31, 2023 | | | | | $ | 235,569 | | | $ | 7,809 | |
| | | | | | | |
| | | | | | | |
| | | | | | | |
| Provision for expected credit losses | | | | | | | 960 | |
| Write offs charged against the allowance | | | | | | | (698) | |
| Recoveries of amounts previously written off | | | | | | | 70 | |
| Balance, December 31, 2024 | | | | | $ | 228,900 | | | $ | 8,141 | |
| | | | | | | | | | | | | | | |
| (In thousands) | | | | | Premiums
Receivable, Net | | Allowance for Expected Credit Losses |
| Balance, December 31, 2022 | | | | | $ | 246,094 | | | $ | 7,658 | |
| | | | | | | |
| Provision for expected credit losses | | | | | | | 1,114 | |
| | | | | | | |
| Write offs charged against the allowance | | | | | | | (1,040) | |
| Recoveries of amounts previously written off | | | | | | | 77 | |
| Balance, December 31, 2023 | | | | | $ | 235,569 | | | $ | 7,809 | |
|
|
ProAssurance's expected credit losses associated with its reinsurance receivables (related to both paid and unpaid losses) were nominal in amount as of December 31, 2024 and 2023. ProAssurance has other financial assets and off-balance-sheet commitments that are exposed to credit losses; however, expected credit losses associated with these assets and commitments were nominal in amount as of December 31, 2024 and 2023.
Retroactive Insurance Contracts
In certain instances, ProAssurance’s insurance contracts cover losses both on a prospective basis and retroactive basis, and accordingly, ProAssurance bifurcates the prospective and retroactive provisions of these contracts and accounts for each component separately, where practicable.
Under the retroactive provisions of a contract, all premiums received and losses assumed are recognized immediately in earnings at the inception of the contract as all of the underlying loss events occurred in the past. If the estimated losses assumed differ from the premium received related to the retroactive provision of a contract, the resulting difference is deferred and recognized over the estimated claim payment period with the periodic amortization reflected in earnings as a component of net losses and LAE. Deferred gains are included as a component of the reserve for losses and LAE, and deferred losses are included as a component of other assets on the Consolidated Balance Sheets. Subsequent changes to the estimated timing or amount of future loss payments in relation to the losses assumed under retroactive provisions also produce changes in deferred balances. Changes in such estimates are applied retrospectively, and the resulting changes in deferred balances, together with periodic amortization, are included in earnings in the period of change.
Investments
Recurring Fair Value Measurements
Fair values of investment securities are primarily provided by independent pricing services. The pricing services provide an exchange-traded price, if available, or provide an estimated price determined using multiple observable inputs, including
ProAssurance Corporation and Subsidiaries
Notes to Consolidated Financial Statements
December 31, 2024
exchange-traded prices for similar assets. Management reviews valuations of securities obtained from the pricing services for accuracy based upon the specifics of the security, including class, maturity, credit rating, durations, collateral and comparable markets for similar securities. Multiple observable inputs are not available for certain of the Company's investments, including corporate debt not actively traded, certain asset-backed securities and investments in LPs/LLCs. Management values the corporate debt not actively traded and the other asset-backed securities either using dealer quotes for similar securities or discounted cash flow models using yields currently available for similar securities. Management values certain investment funds, primarily LPs/LLCs, based on the NAV of the interest held, as provided by the fund.
Nonrecurring Fair Value Measurements
Management measures the fair value of certain assets on a nonrecurring basis when events or changes in circumstances indicate that the carrying amount of the assets may not be recoverable. These assets include investments carried principally at cost, investments in tax credit partnerships, fixed assets, goodwill and other intangible assets. These assets would also include any equity method investments that do not provide a NAV.
Fixed Maturities
Fixed maturities are considered as either available-for-sale or trading securities.
Available-for-sale securities are carried at fair value, determined as described above and in Note 2. Exclusive of impairment losses, discussed in a separate section that follows, unrealized holding gains and losses on available-for-sale securities are included, net of related tax effects, as a component of OCI in the Consolidated Statement of Income and Comprehensive Income during the period of change and as a component of AOCI in shareholders' equity on the Consolidated Balance Sheet.
Investment income includes amortization of premium and accretion of discount related to available-for-sale debt securities acquired at other than par value. Debt securities and mandatorily redeemable preferred stock with maturities beyond one year when purchased are classified as fixed maturities.
Trading securities are carried at fair value, determined as described above, with the unrealized holding gains and losses included as a component of net investment gains (losses) in the Consolidated Statement of Income and Comprehensive Income during the period of change.
Equity Investments
Equity investments are carried at fair value, as described above, with the holding gains and losses included as a component of net investment gains (losses) in the Consolidated Statement of Income and Comprehensive Income during the period of change. Equity investments are primarily comprised of bond funds, stocks and investment funds.
Short-term Investments
Short-term investments, which have a maturity at purchase of one year or less, are primarily comprised of investments in U.S. Treasury obligations, commercial paper, money market funds and a certificate of deposit. All balances are carried at fair value which approximates the cost of the securities due to their short-term nature.
Other Investments
Investments in convertible bond securities are carried at fair value as permitted by the accounting guidance for hybrid financial instruments, with changes in fair value recognized in earnings as a component of net investment gains (losses) during the period of change. Interest on convertible bond securities is recorded on an accrual basis based on contractual interest rates and is included in net investment income.
Investment in Unconsolidated Subsidiaries
Equity investments, primarily investments in LPs/LLCs, where ProAssurance is deemed to have influence because it holds a greater than a minor interest are accounted for using the equity method. Under the equity method, the recorded basis of the investment is adjusted each period for the investor’s pro rata share of the investee’s income or loss. Investments in unconsolidated subsidiaries include tax credit partnerships accounted for using the equity method, whereby ProAssurance’s proportionate share of income or loss is included in equity in earnings (loss) of unconsolidated subsidiaries. Tax credits received from the partnerships are recognized in the period received in the Consolidated Statements of Income and
ProAssurance Corporation and Subsidiaries
Notes to Consolidated Financial Statements
December 31, 2024
Comprehensive Income as either a reduction to current tax expense or as a component of deferred tax expense if they cannot be utilized in the period received.
Business Owned Life Insurance
ProAssurance owns life insurance contracts on certain management employees. The life insurance contracts are carried at their current cash surrender value. Changes in the cash surrender value are included in earnings in the current period as investment income. Death benefit proceeds from the contracts are recorded when the proceeds become payable under the policy terms.
Realized Gains and Losses
Realized investment gains and losses are recognized on the first-in, first-out basis for GAAP purposes and on the specific identification basis for tax purposes.
Impairments
ProAssurance evaluates its available-for-sale investment securities, which at December 31, 2024 and 2023 consisted entirely of fixed maturity securities, on at least a quarterly basis for the purpose of determining whether declines in fair value below recorded cost basis represent a credit loss. The Company considers a credit loss to have occurred:
•if there is intent to sell the security;
•if it is more likely than not that the security will be required to be sold before full recovery of its amortized cost basis; or
•if the entire amortized basis of the security is not expected to be recovered.
The assessment of whether the amortized cost basis of a security is expected to be recovered requires the Company to make assumptions regarding various matters affecting future cash flows. The choice of assumptions is subjective and requires the use of judgment. Actual credit losses experienced in future periods may differ from the Company’s current estimates of those credit losses. Methodologies used to estimate the present value of expected cash flows are:
The estimate of expected cash flows is determined by projecting a recovery value and a recovery time frame and assessing whether further principal and interest will be received. ProAssurance considers various factors in projecting recovery values and recovery time frames, including the following:
•third-party research and credit rating reports;
•the current credit standing of the issuer, including credit rating downgrades, whether before or after the balance sheet date;
•the extent to which the decline in fair value is attributable to credit risk specifically associated with the security or its issuer;
•internal assessments and the assessments of external portfolio managers regarding specific circumstances surrounding an investment, which indicate the investment is more or less likely to recover its amortized cost than other investments with a similar structure;
•for asset-backed securities, the origination date of the underlying loans, the remaining average life, the probability that credit performance of the underlying loans will deteriorate in the future and ProAssurance's assessment of the quality of the collateral underlying the loan;
•failure of the issuer of the security to make scheduled interest or principal payments;
•any changes to the rating of the security by a rating agency;
•recoveries or additional declines in fair value subsequent to the balance sheet date;
•adverse legal or regulatory events;
•significant deterioration in the market environment that may affect the value of collateral (e.g., decline in real estate prices);
•significant deterioration in economic conditions; and
•disruption in the business model resulting from changes in technology or new entrants to the industry.
If deemed appropriate and necessary, a discounted cash flow analysis is performed to confirm whether a credit loss exists and, if so, the amount of the credit loss. ProAssurance uses the single best estimate approach for available-for-sale debt securities and considers all reasonably available data points, including industry analyses, credit ratings, expected defaults and the remaining payment terms of the debt security. For fixed rate available-for-sale debt securities, cash flows are discounted at the security's effective interest rate implicit in the security at the date of acquisition. If the available-for-sale debt security’s contractual interest rate varies based on subsequent changes in an independent factor, such as an index or rate, for example, the
ProAssurance Corporation and Subsidiaries
Notes to Consolidated Financial Statements
December 31, 2024
prime rate, the SOFR, or the U.S. Treasury bill weekly average, that security’s effective interest rate is calculated based on the factor as it changes over the life of the security.
If ProAssurance intends to sell a debt security or believes it will more likely than not be required to sell a debt security before the amortized cost basis is recovered, any existing allowance will be written off against the security's amortized cost basis, with any remaining difference between the debt security's amortized cost basis and fair value recognized as an impairment loss in earnings.
Exclusive of securities where there is an intent to sell or where it is not more likely than not that the security will be required to be sold before recovery of its amortized cost basis, impairment for debt securities is separated into a credit component and a non-credit component. The credit component of an impairment is the difference between the security’s amortized cost basis and the present value of its expected future cash flows, while the non-credit component is the remaining difference between the security’s fair value and the present value of expected future cash flows. An allowance for expected credit losses will be recorded for the expected credit losses through income and the non-credit component is recognized in OCI. The amount of impairment recognized is limited to the excess of the amortized cost over the fair value of the available-for-sale debt security.
Derivatives
ProAssurance records derivative instruments at fair value on the Consolidated Balance Sheet. ProAssurance accounts for the changes in fair value of derivatives depending on whether the derivative is designated as a hedging instrument and if so, the type of hedging relationship. ProAssurance does not use derivative instruments for trading purposes.
For derivative financial instruments designed as cash flow hedges, ProAssurance formally documents all relationships between the hedging instruments and the hedged items as well as its risk-management objective and strategy for undertaking various hedged transactions. ProAssurance also formally assesses, both at the hedge's inception and on an ongoing basis, whether the derivatives that are used in hedging transactions are highly effective in offsetting changes in cash flows of hedged items. When it is determined that a derivative is not highly effective as a hedge or that it has ceased to be a highly effective hedge, hedge accounting is discontinued prospectively.
As of December 31, 2024, ProAssurance uses Interest Rate Swaps that are designated and qualify as highly effective cash flow hedges to manage its exposure to variability in cash flows of forecasted interest payments attributable to variability in the selected base rates on borrowings under the Revolving Credit Agreement. Changes in the fair value of derivatives that are designated and qualify as highly effective cash flow hedges are recorded in AOCI, net of tax, and are reclassified into earnings when the hedged cash flows impact earnings. When the change in the fair value of a qualifying cash flow hedge is included in earnings, it is included in the same line item on the Consolidated Statement of Income and Comprehensive Income as the cash flows from the hedged item. The Company has elected not to offset fair value amounts recognized for the Interest Rate Swaps and fair value of the amounts recognized to reclaim cash collateral or the obligation to return cash collateral executed with counterparties under a master netting arrangement. The cash flows of Interest Rate Swaps are classified as operating cash flows.
For derivative instruments not designated as hedging instruments, ProAssurance recognizes the change in fair value of the derivative in earnings during the period of change. As of December 31, 2024, ProAssurance uses foreign currency forward contracts that are designated as an economic hedge (non-hedging instrument) to reduce the market risk related to fluctuations in exchange rates associated with foreign currency denominated available-for-sale fixed maturities and loss reserves. The cash flows of foreign currency forward contracts are classified as operating cash flows and the change in fair value is recognized in the Consolidated Statements of Income and Comprehensive Income as a component of other income (see additional discussion below under the heading "Foreign Currency").
Cash and Cash Equivalents
For purposes of the Consolidated Balance Sheets and Consolidated Statements of Cash Flows, ProAssurance considers all demand deposits and overnight investments to be cash equivalents.
Foreign Currency
The functional currency of all ProAssurance foreign subsidiaries is the U.S. dollar. In recording foreign currency transactions, revenue and expense items are converted to U.S. dollars at the exchange rate prevailing at the transaction date. Monetary assets and liabilities originating in currencies other than the U.S. dollar are remeasured to U.S. dollars at the rates of exchange in effect as of the balance sheet date. The resulting foreign currency gains or losses are recognized in the Consolidated Statements of Income and Comprehensive Income as a component of other income. Monetary assets and liabilities include investments, cash and cash equivalents, accrued expenses and other liabilities. In addition, monetary assets
ProAssurance Corporation and Subsidiaries
Notes to Consolidated Financial Statements
December 31, 2024
and liabilities include certain premiums receivable and reserve for losses and LAE as a result of reinsurance transactions conducted with foreign cedents denominated in their local functional currencies.
Pension
The Company sponsors NORCAL's frozen qualified defined benefit pension plan which covers substantially all NORCAL employees (except those that were previous employees of Medicus Insurance Company and FD Insurance Company, employees of PPM RRG as well as new hires after December 31, 2013). Accounting for pension benefits requires the use of assumptions for the valuation of the PBO and the expected performance of the plan assets.
The Company uses December 31 as the measurement date for calculating its obligation related to this defined benefit pension plan and for estimating net periodic benefit cost (income) for the subsequent year. The PBO for pension benefits represents the present value of all future benefits earned as of the measurement date for vested and non-vested employees. At each measurement date, the Company reviews the various assumptions impacting the amounts recorded for the pension plan including the discount rates, which impacts the recorded value of the PBO and interest costs, and the expected return on plan assets.
To estimate the discount rate at the measurement date, the Company uses a bond yield curve model, developed based on pricing and yield information for high quality corporate bonds. The assumption for the expected return on plan assets is based on the anticipated returns that will be earned by the portfolio over the long term. The expected return is influenced, but not determined, by historical portfolio performance.
Accounting standards provide for the delayed recognition of differences between actual results and expected or estimated results. This delayed recognition of the differences is amortized into earnings over time. The differences between actual results and expected or estimated results are recognized in full in AOCI. Amounts recognized in AOCI are reclassified to earnings in a systematic manner over the average future service period of participants.
Deferred Policy Acquisition Costs; Ceding Commission Income
Costs that vary with and are directly related to the successful production of new and renewal premiums (primarily premium taxes, commissions and underwriting salaries) are deferred to the extent they are recoverable against unearned premiums and are amortized as related premiums are earned. Unearned ceding commission income is reported as an offset to DPAC, and ceding commission earned is reported as an offset to DPAC amortization.
ProAssurance evaluates the recoverability of DPAC typically at the segment level each reporting period, or in a manner that is consistent with the way the Company manages its business. Any amounts estimated to be unrecoverable are charged to expense in the current period. As part of the evaluation of the recoverability of DPAC, ProAssurance also evaluates unearned premium for premium deficiencies. A premium deficiency is recognized if the sum of anticipated losses and loss adjustment expenses, unamortized DPAC and maintenance costs, net of anticipated investment income, exceeds the related unearned premium. If a premium deficiency is identified, the associated DPAC is written off, and a PDR is recorded for the excess deficiency as a component of net losses and loss adjustment expenses in the Consolidated Statements of Income and Comprehensive Income and as a component of the reserve for losses on the Consolidated Balance Sheets.
Income Taxes/Deferred Taxes
ProAssurance files a consolidated federal income tax return. Tax-related interest and penalties are recognized as components of tax expense.
ProAssurance evaluates tax positions taken on tax returns and recognizes positions in the financial statements when it is more likely than not that the position will be sustained upon resolution with a taxing authority. If recognized, the benefit is measured as the largest amount of benefit that has a greater than fifty percent probability of being realized. Uncertain tax positions are reviewed each period by considering changes in facts and circumstances, such as changes in tax law, interactions with taxing authorities and developments in case law, and adjustments would be made if considered necessary. Adjustments to unrecognized tax benefits may affect income tax expense, and the settlement of uncertain tax positions may require the use of cash. Other than differences related to timing, no significant adjustments were considered necessary during the years ended December 31, 2024 or 2023.
Deferred federal income taxes arise from the recognition of temporary differences between the basis of assets and liabilities determined for financial reporting purposes and the basis determined for income tax purposes. ProAssurance’s temporary differences principally relate to loss reserves, unearned and advanced premiums, DPAC, NOL and tax credit carryforwards, compensation related items, unrealized investment gains (losses) and basis differentials in fixed assets,
ProAssurance Corporation and Subsidiaries
Notes to Consolidated Financial Statements
December 31, 2024
intangible assets and operating leases. Deferred tax assets and liabilities are measured using the enacted tax rates expected to be in effect when such benefits are realized. ProAssurance reviews its deferred tax assets quarterly for impairment. If management determines that it is more likely than not that some or all of a deferred tax asset will not be realized, a valuation allowance is recorded to reduce the carrying value of the asset. In assessing the need for a valuation allowance, management is required to make certain judgments and assumptions about the future operations of ProAssurance based on historical experience and information as of the measurement period regarding reversal of existing temporary differences, carryback capacity, future taxable income of the appropriate character (including its capital and operating characteristics) and tax planning strategies.
Goodwill/Intangibles
Intangible Assets
Intangible assets with definite lives are amortized over the estimated useful life of the asset. Amortizable intangible assets primarily consist of policyholder relationships, renewal rights and trade names. Intangible assets with an indefinite life, primarily state licenses, are not amortized. Indefinite lived intangible assets are evaluated for impairment on an annual basis or upon the occurrence of certain triggering events or substantive changes in circumstances that indicate the intangible asset may be impaired. Amortizable intangible assets and other long-lived assets are tested for impairment at the asset group level upon the occurrence of certain triggering events or substantive changes in circumstances that indicate the carrying amount of the asset group may not be recoverable. An impairment loss is recognized when estimated undiscounted future cash flows expected to result from the use of the asset group are less than the carrying amounts of the related asset group. Impairment losses are measured as the amount by which the carrying amount of the asset groups exceed their fair values. The Company's asset groups generally correspond to the same level at which goodwill is tested for impairment (see additional discussion in the following section). The following table provides additional information regarding ProAssurance's intangible assets.
| | | | | | | | | | | | | | | | | | | | | | | | | | | | | | | | | | | | | | | | | |
| Gross Carrying Value | | Accumulated Amortization | | Amortization Expense |
| December 31 | | December 31 | | Year Ended December 31 |
| (In millions) | 2024 | | 2023 | | 2024 | | 2023 | | 2024 | | 2023 | | 2022 |
| Intangible Assets | | | | | | | | | | | | | |
| Non-amortizable | $ | 38.2 | | | $ | 38.2 | | | | | | | | | | | |
| Amortizable | 100.3 | | | 100.3 | | | $ | 84.3 | | | $ | 78.2 | | | $ | 6.1 | | | $ | 6.5 | | | $ | 6.5 | |
| Total Intangible Assets | $ | 138.5 | | | $ | 138.5 | | | | | | | | | | | |
|
Aggregate amortization expense for intangible assets is estimated to be $5.7 million for the year ended December 31, 2025, $3.7 million for the year ended December 31, 2026, $3.4 million for the year ended December 31, 2027, $2.9 million for the year ended December 31, 2028 and nominal in amount for the year ended December 31, 2029.
Goodwill
Goodwill is tested for impairment annually or more frequently if circumstances indicate an impairment may have occurred. The date of the Company's annual goodwill impairment testing is October 1. Impairment of goodwill is tested at the reporting unit level which are: Specialty P&C, Workers' Compensation Insurance, Segregated Portfolio Cell Reinsurance, Lloyd's Syndicates and Corporate. Of the Company's five reporting units, only the Segregated Portfolio Cell Reinsurance reporting unit has goodwill at December 31, 2024. See Note 6 for additional information about the Company's goodwill.
During the third quarter of 2023, ProAssurance recorded a goodwill impairment charge of $44.1 million, and the facts and circumstances that led to this impairment and how the fair value of each reporting unit was estimated, including the significant assumptions used and other details, are outlined in the following section.
Interim Impairment Assessment
The Company performed a quantitative goodwill impairment assessment on the Workers' Compensation Insurance reporting unit as of September 30, 2023, due to market conditions impacting that reporting unit's actual and projected results along with a broader decline in ProAssurance's stock price that occurred for a sustained period of time during the third quarter of 2023.
The quantitative goodwill impairment test involves comparing the fair value of a reporting unit with its carrying value including goodwill. If the fair value of a reporting unit exceeds its carrying value, the reporting unit's goodwill is considered not to be impaired. However, if the carrying value of a reporting unit exceeds its fair value, an impairment loss is recorded in an
ProAssurance Corporation and Subsidiaries
Notes to Consolidated Financial Statements
December 31, 2024
amount equal to that excess. Any impairment charge recognized is limited to the amount of the respective reporting unit's allocated goodwill.
Determining the fair value of a reporting unit under the quantitative goodwill impairment test requires judgment and often involves the use of significant estimates and assumptions, including an assessment of external factors such as macroeconomic, industry and market conditions, as well as entity-specific factors, such as actual and planned financial performance. These estimates and assumptions could have a significant impact on whether or not an impairment charge is recognized and the magnitude of any such charge. To assist management in the process of determining any potential goodwill impairment, the Company may review and consider appraisals from accredited independent valuation firms. Estimates of fair value are primarily determined using discounted cash flows and market comparisons. These approaches involve significant estimates and assumptions, including projected future cash flows (including timing), discount rates reflecting the risks inherent in those future cash flows, perpetual growth rates, and selection of appropriate market comparable metrics and transactions.
Management estimated the fair value of the Workers' Compensation Insurance reporting unit using both an income approach and a market approach using marketplace data that was current at the time of each respective analysis based on the valuation methodologies and process for developing assumptions. The estimate of fair value derived from the income approach was based on the present value of expected future cash flows, including terminal value, utilizing a market-based weighted average cost of capital determined separately for each reporting unit. The estimate of fair value derived from the market approach was based on price to book multiple data. To corroborate the reporting unit's valuation, management performed a reconciliation of the estimate of the aggregate fair value of all reporting units to ProAssurance's market capitalization as of each testing date, including consideration of a control premium. The determination of fair value involved the use of significant estimates and assumptions, including revenue growth rates, combined ratios, capital requirements, tax rates, terminal growth rates, discount rates, comparable public companies and synergistic benefits available to market participants. In addition, management made certain judgments and assumptions in allocating shared assets and liabilities to individual reporting units to determine the carrying amount of each reporting unit.
The analysis indicated impairment of the goodwill associated with the Workers' Compensation Insurance reporting unit and accordingly ProAssurance recorded a $44.1 million charge to fully impair the goodwill in the third quarter of 2023.
Management also estimated the fair value of the Segregated Portfolio Cell Reinsurance reporting unit using the same approaches, which indicated that the fair value of the reporting unit significantly exceeded the carrying amount.
Management also performed impairment tests of indefinite lived intangible assets and certain of the Company's definite lived intangible assets for which a triggering event was deemed to have occurred. Based upon these impairment tests, no impairment of its definite or indefinite lived intangible assets was identified at September 30, 2023.
Annual Impairment Assessment
The Company performed its annual goodwill impairment assessment as of October 1, 2024 and October 1, 2023.
When testing goodwill for impairment on the annual test date, management has the option to first assess qualitative factors to determine whether the existence of events or circumstances leads to a determination that it is more likely than not that the estimated fair value of a reporting unit is less than its carrying amount. If management elects to perform a qualitative assessment and determine that an impairment is more likely than not, the Company is then required to perform a quantitative impairment test; otherwise, no further analysis is required. Management also may elect not to perform the qualitative assessment and, instead, proceed directly to the quantitative impairment test.
For the most recent goodwill impairment test performed on October 1, 2024, the Company elected to perform a qualitative impairment test for the Segregated Portfolio Cell Reinsurance reporting unit. Based on previous quantitative assessments, the Segregated Portfolio Cell Reinsurance reporting unit has historically had an excess of fair value over book value and based on current operations is expected to continue to do so; therefore, the Company's annual impairment test for this reporting unit was performed qualitatively.
Performance of the qualitative goodwill impairment assessment requires judgment in identifying and considering the significance of relevant key factors, events and circumstances that affect the fair values of the Company's reporting units. This requires consideration and assessment of external factors such as macroeconomic, industry, and market conditions, as well as entity-specific factors, such as the Company's actual and planned financial performance. ProAssurance also gives consideration to the difference between the reporting unit's fair value and carrying value as of the most recent date that a fair value measurement was performed. If the results of the qualitative assessment conclude that it is not more likely than not that the fair value of a reporting unit exceeds its carrying value, additional quantitative impairment testing is performed.
ProAssurance Corporation and Subsidiaries
Notes to Consolidated Financial Statements
December 31, 2024
In applying the qualitative approach, management considered macroeconomic factors, industry and market conditions, cost factors that could have a negative impact on the reporting unit, actual financial performance of the reporting unit versus expectations and management's future business expectations. As a result of the annual qualitative assessments in 2024 and 2023, management concluded that it was not more likely than not that the fair value of the Segregated Portfolio Cell Reinsurance reporting unit was less than its carrying value as of the testing date; therefore, no further impairment testing was required. Management also performed an impairment test of its indefinite lived intangible assets which indicated no impairment as of October 1, 2024 or 2023.
No goodwill impairment was recorded during the year ended December 31, 2024 or 2022.
Business Combinations
The Company accounts for business combinations in accordance with GAAP which requires management to make certain estimates and assumptions including determining the fair value of any non-cash components of the acquisition consideration and the acquisition date fair values of the acquired tangible and identifiable intangible assets and assumed liabilities.
Contingent Consideration
Contingent consideration in a business combination that is classified as a liability is carried as a component of other liabilities on ProAssurance's Consolidated Balance Sheet. Contingent consideration is measured at fair value on the date of acquisition and remeasured at fair value each subsequent reporting period. Fair value of a liability represents the price that would be paid to transfer the liability in an orderly transaction between market participants at the measurement date considering characteristics specific to the liability.
The purchase consideration in the Company's 2021 acquisition of NORCAL included contingent consideration. NORCAL policyholders who elected to receive NORCAL stock and tender it to ProAssurance were eligible for a share of contingent consideration in an amount of up to approximately $84 million. As defined in the purchase agreement, the contingent consideration was dependent upon the after-tax development of NORCAL's ultimate net losses for accident years ended on or before December 31, 2020 determined as of December 31, 2023 by a mutually agreed upon independent actuarial consultant. This independent actuarial consultant had until June 30, 2024 to complete their estimate. In June 2024, the independent actuarial consulting firm completed its estimate, and based on that estimate no additional consideration was due. The Committee appointed by NORCAL prior to the close of the acquisition reviewed the work of the independent actuarial consultant and accepted the conclusion that no additional consideration was due.
Given the contingent consideration associated with the NORCAL acquisition was dependent upon the after-tax development of NORCAL's ultimate net losses between December 31, 2020 and December 31, 2023, the Company bifurcated changes in the contingent consideration each period between fair value changes and, if applicable, changes in estimates of NORCAL's ultimate net losses for accident years 2020 and prior. Changes in contingent consideration related to fair value are recognized in earnings as a component of net investment gains (losses) and changes in contingent consideration related to changes in estimates of NORCAL's ultimate net losses for accident years 2020 and prior are recognized in earnings as component of operating expenses.
VOBA
VOBA is based on actuarially determined projections and reflects the estimated fair value of in-force contracts acquired in a business combination. VOBA is recorded as an asset when the in-force contracts acquired are expected to generate underwriting income and is recorded as a liability when the in-force contracts acquired are expected to generate an underwriting loss. VOBA liabilities (negative VOBA) are recorded as a component of the reserve for losses and loss adjustment expenses on the Consolidated Balance Sheets. To the extent negative VOBA relates to unearned premium, it is amortized over a period in proportion to the earn-out of the premium as a reduction to current accident year net losses and loss adjustment expenses. To the extent negative VOBA relates to the DDR reserve, it is amortized over a period in proportion to the approximate consumption of losses as a reduction to prior accident year net losses and loss adjustment expenses.
Leases
ProAssurance is involved in a number of leases, primarily for office facilities. The Company determines if an arrangement is a lease at the inception date of the contract and classifies all leases as either financing or operating. Operating leases are included in operating lease ROU assets and operating lease liabilities on the Consolidated Balance Sheets. The ROU asset represents the right to use the underlying asset for the lease term. As of December 31, 2024, ProAssurance has no leases that are classified as financing leases.
ProAssurance Corporation and Subsidiaries
Notes to Consolidated Financial Statements
December 31, 2024
Operating ROU assets and operating lease liabilities are initially recognized as of the lease commencement date based on the present value of the remaining lease payments, discounted over the term of the lease using a discount rate determined based on information available as of the commencement date. As the majority of ProAssurance's lessors do not provide an implicit discount rate, the Company uses its collateralized incremental borrowing rate in determining the present value of remaining lease payments. Due to the adoption of ASU 2016-02, the Company used its collateralized incremental borrowing rate as of January 1, 2019 for operating leases that commenced prior to that date. Subsequent to the initial recognition, the operating ROU asset and operating lease liability are amortized and accreted, respectively, over the lease term in a manner that results in a straight-line operating lease expense. Operating lease expense is included as a component of operating expense on the Consolidated Statements of Income and Comprehensive Income for the years ended December 31, 2024, 2023 and 2022. Leases with an initial term of twelve months or less are considered short-term and are not recorded on the Consolidated Balance Sheet; lease expense for these leases is also recognized on a straight-line basis over the lease term. Additionally, for leases entered into or reassessed after the adoption of ASU 2016-02 on January 1, 2019, ProAssurance accounts for lease and non-lease components of a contract as a single lease component.
Operating lease ROU assets are evaluated for impairment at the asset group level whenever events or changes in circumstances indicate that the carrying amount of the asset group may not be recoverable. The carrying amount of an asset group, which includes the operating lease ROU asset and the related operating lease liability, is not recoverable if the carrying amount exceeds the sum of the undiscounted cash flows expected to result from the use of the asset group over the life of the primary asset in the asset group. That assessment is based on the carrying amount of the asset group, including the operating lease ROU asset and the related operating lease liability, at the date it is tested for recoverability and an impairment loss is measured and recognized as the amount by which the carrying amount of the asset group exceeds its fair value. Any impairment loss is allocated to each asset in the asset group, including the operating ROU asset.
When a lease of an office facility is to be abandoned and will not be subleased, the Company first evaluates whether or not the operating lease ROU asset’s inclusion in an existing asset group continues to be appropriate and if the commitment to abandon the lease constitutes a change in circumstances requiring the operating lease ROU asset, or the larger asset group, to be tested for impairment. If an impairment test is required, it is performed in the same manner as discussed above. Any remaining carrying value of the operating lease ROU asset is amortized from the date the Company commits to a plan to abandon the lease to the expected date that the Company will cease to use the leased property. Leases to be abandoned in which the Company has the intent or practical ability to sublease continue to be accounted for under a held and use model, with no change to the amortization period of the operating lease ROU asset, and are evaluated for impairment as a separate asset group at the date the sublease is executed.
Real Estate
Real Estate balances are reported at cost or, for properties acquired in business combinations, estimated fair value on the date of acquisition, less accumulated depreciation. Real estate principally consists of properties in use as corporate offices. Depreciation is computed over the estimated useful lives of the related property using the straight-line method. Excess office capacity is leased or made available for lease; rental income is included in other income, and real estate expenses are included in operating expense.
Real estate accumulated depreciation was approximately $30.1 million and $29.2 million at December 31, 2024 and 2023, respectively. Real estate depreciation expense was $0.9 million for each of the years ended December 31, 2024, 2023 and 2022.
Earned But Unbilled Premiums
Workers’ compensation premiums are determined based upon the payroll of the insured, the applicable premium rates and an experience-based modification factor, where applicable. An audit of the policyholders’ records is conducted after policy expiration to make a final determination of applicable premiums. Audit premium due from or due to a policyholder as a result of an audit is reflected in net premiums written and earned when billed. ProAssurance tracks, by policy, the amount of additional premium billed in final audit invoices as a percentage of payroll exposure and uses this information to estimate the probable additional amount of EBUB as of the balance sheet date. Changes to the EBUB estimate are included in net premiums written and earned in the period recognized. As of December 31, 2024 and 2023, ProAssurance carried EBUB of $9.1 million and $6.2 million, respectively, as a part of premiums receivable. ProAssurance will continue to monitor and adjust the estimate, if necessary, based on changes in insured payrolls and economic conditions, as experience develops or new information becomes known; however, the length and magnitude of such changes depends on future developments, which are highly uncertain and cannot be predicted.
ProAssurance Corporation and Subsidiaries
Notes to Consolidated Financial Statements
December 31, 2024
Other Liabilities
Other liabilities at December 31, 2024 and 2023 consisted of the following:
| | | | | | | | | | | | | | |
| (In thousands) | | 2024 | | 2023 |
| SPC dividends payable | | $ | 64,985 | | | $ | 63,949 | |
| Deferred compensation liabilities | | 33,793 | | | 32,043 | |
| Contingent consideration | | — | | | 6,500 | |
| All other | | 127,742 | | | 114,126 | |
| Total other liabilities | | $ | 226,520 | | | $ | 216,618 | |
SPC dividends payable represents the undistributed equity contractually payable to the external cell participants of SPCs operated by ProAssurance's Cayman Islands subsidiaries, Inova Re and Eastern Re.
Deferred compensation liabilities represent the amount of elective deferrals and employer contributions adjusted for periodic changes in the fair value of the participant balances based on the performance of the funds selected by the participants.
Contingent consideration represents a portion of the purchase consideration for the NORCAL acquisition and depends on the after-tax development of NORCAL's ultimate net losses over a three year period beginning on December 31, 2020 (see previous discussion above under the heading "Contingent Consideration").
Treasury Shares
Treasury shares are reported at cost, less any applicable excise tax, and are reflected on the Consolidated Balance Sheets as an unallocated reduction of total equity.
Share-Based Payments
Compensation cost for share-based payments is measured based on the grant-date fair value of the award and recognized over the requisite service period. Excess tax benefits (tax deductions realized in excess of the compensation costs recognized for the exercise of the awards, multiplied by the incremental tax rate) are reported as operating cash inflows.
Subsequent Events
ProAssurance evaluates events that occurred subsequent to December 31, 2024 through the date this Form 10-K was filed for recognition or disclosure in its Consolidated Financial Statements.
Accounting Changes Adopted
Improvements to Reportable Segment Disclosures (ASU 2023-07)
Effective for fiscal years beginning after December 15, 2023 and interim periods within fiscal years beginning after December 15, 2024, and requiring retrospective application to all prior periods presented in the financial statements, the FASB amended disclosure requirements for segment reporting by modifying and adding disclosure requirements, primarily related to significant segment expenses which are regularly provided to the Company’s CODM. ProAssurance adopted the guidance beginning January 1, 2024, and adoption had no material effect on ProAssurance's results of operations, financial position or cash flows.
Accounting Changes Not Yet Adopted
Disclosure Improvements (ASU 2023-06)
In October 2023, the FASB amended guidance to clarify or improve disclosure and presentation requirements of a variety of topics, which will allow users to more easily compare entities subject to the SEC's existing disclosures with those entities that were not previously subject to the requirements and align the requirements in the Codification with the SEC's regulations. The effective date for each amendment will be the date on which the SEC’s removal of that related disclosure from Regulation S-X becomes effective, with early adoption prohibited. ProAssurance is currently evaluating the effect the updated guidance will have on the Company's financial statement disclosures.
Improvements to Income Tax Disclosures (ASU 2023-09)
ProAssurance Corporation and Subsidiaries
Notes to Consolidated Financial Statements
December 31, 2024
Effective for fiscal years beginning after December 15, 2024, the FASB amended disclosure requirements to provide greater transparency on income tax disclosures, including the disaggregation of existing disclosures related to the tax rate reconciliation and income taxes paid. ProAssurance is currently evaluating the effect the updated guidance will have on the Company's financial statement disclosures.
Disaggregation of Income Statement Expenses (ASU 2024-03)
Effective for fiscal years beginning after December 15, 2026 and interim reporting periods beginning after December 15, 2027, the FASB issued guidance to improve disclosures about the Company’s expenses by requiring more detailed information about certain expenses (employee compensation, depreciation and intangible asset amortization) included within the Consolidated Statement of Income and Comprehensive Income captions. ProAssurance is currently evaluating the effect the updated guidance will have on the Company's financial statement disclosures.
Employee Retention Credit
In response to COVID-19, the CARES Act was signed into law on March 27, 2020 and contains several provisions for corporations, including the initial version of the ERC. In December 2020 and March 2021, the ERC was extended and expanded from 50% of qualified wages to 70%. The 2020 rules limited qualified wages to $10,000 per employee and applied to employers with 100 or fewer full-time employees in 2019. The rules were expanded in 2021 to raise the qualified wage limit to $10,000 per employee, per quarter. As an eligible employer, NORCAL filed a claim during the second quarter of 2023 for a payroll tax refund of approximately $3.8 million. The Company recorded the expected payroll tax refund as a component of operating expenses on the Consolidated Statement of Income and Comprehensive Income for the year ended December 31, 2023 and as a component of other assets on the Consolidated Balance Sheet as of December 31, 2023.
ProAssurance Corporation and Subsidiaries
Notes to Consolidated Financial Statements
December 31, 2024
2. Fair Value Measurement
Fair value is defined as the price that would be received to sell an asset or paid to transfer a liability in an orderly transaction between market participants at the measurement date. A three level hierarchy has been established for valuing assets and liabilities based on how transparent (observable) the inputs are that are used to determine fair value, with the inputs considered most observable categorized as Level 1 and those that are the least observable categorized as Level 3. Hierarchy levels are defined as follows:
| | | | | | | | |
| | Level 1: | quoted (unadjusted) market prices in active markets for identical assets and liabilities. For ProAssurance, Level 1 inputs are generally quotes for securities actively traded in exchange or over-the-counter markets. |
| | | | | | | | |
| | Level 2: | market data obtained from sources independent of the reporting entity (observable inputs). For ProAssurance, Level 2 inputs generally include quoted prices in markets that are not active, quoted prices for similar assets or liabilities, and results from pricing models that use observable inputs such as interest rates and yield curves that are generally available at commonly quoted intervals. |
| | | | | | | | |
| | Level 3: | the reporting entity’s own assumptions about market participant assumptions based on the best information available in the circumstances (non-observable inputs). For ProAssurance, Level 3 inputs are used in situations where little or no Level 1 or 2 inputs are available or are inappropriate given the particular circumstances. Level 3 inputs include results from pricing models for which some or all of the inputs are not observable, discounted cash flow methodologies, single non-binding broker quotes and adjustments to externally quoted prices that are based on management judgment or estimation. |
Fair values of assets measured at fair value on a recurring basis as of December 31, 2024 and December 31, 2023 are shown in the following tables. Where applicable, the tables also indicate the fair value hierarchy of the valuation techniques utilized to determine those fair values. For some assets, the inputs used to measure fair value may fall into different levels of the fair value hierarchy. When this is the case, the asset is categorized based on the level of the most significant input to the fair value measurement. Assessments of the significance of a particular input to the fair value measurement require judgment and consideration of factors specific to the assets being valued.
ProAssurance Corporation and Subsidiaries
Notes to Consolidated Financial Statements
December 31, 2024
| | | | | | | | | | | | | | | | | | | | | | | |
| December 31, 2024 |
| Fair Value Measurements Using | | Total |
| (In thousands) | Level 1 | | Level 2 | | Level 3 | | Fair Value |
| Assets: | | | | | | | |
| Fixed maturities, available-for-sale | | | | | | | |
| U.S. Treasury obligations | $ | — | | | $ | 243,903 | | | $ | — | | | $ | 243,903 | |
| U.S. Government-sponsored enterprise obligations | — | | | 14,894 | | | — | | | 14,894 | |
| State and municipal bonds | — | | | 446,601 | | | — | | | 446,601 | |
| Corporate debt, multiple observable inputs | — | | | 1,646,713 | | | — | | | 1,646,713 | |
| | | | | | | |
| Corporate debt, limited observable inputs | — | | | — | | | 81,062 | | | 81,062 | |
| | | | | | | |
| Residential mortgage-backed securities | — | | | 478,799 | | | — | | | 478,799 | |
| Agency commercial mortgage-backed securities | — | | | 6,727 | | | — | | | 6,727 | |
| Other commercial mortgage-backed securities | — | | | 201,786 | | | — | | | 201,786 | |
| Other asset-backed securities | — | | | 457,948 | | | 3,774 | | | 461,722 | |
| Fixed maturities, trading | — | | | 53,157 | | | — | | | 53,157 | |
| Equity investments | | | | | | | |
| Financial | 9,006 | | | 2,310 | | | 273 | | | 11,589 | |
| Utilities/Energy | 724 | | | — | | | — | | | 724 | |
| | | | | | | |
| Industrial | — | | | — | | | 5,233 | | | 5,233 | |
| Bond funds | 101,243 | | | — | | | — | | | 101,243 | |
| All other | 11,369 | | | — | | | — | | | 11,369 | |
| Short-term investments | 185,492 | | | 69,430 | | | — | | | 254,922 | |
| Other investments | — | | | 1,577 | | | 500 | | | 2,077 | |
| Other assets | — | | | 6,094 | | | — | | | 6,094 | |
| Total assets categorized within the fair value hierarchy | $ | 307,834 | | | $ | 3,629,939 | | | $ | 90,842 | | | 4,028,615 | |
| Assets carried at NAV, which approximates fair value and which are not categorized within the fair value hierarchy, reported as a part of: | | | | | | | |
| | | | | | | |
| Investment in unconsolidated subsidiaries | | | | | | | 226,269 | |
| Total assets at fair value | | | | | | | $ | 4,254,884 | |
| | | | | | | |
| Liabilities: | | | | | | | |
| Other liabilities | $ | 6,680 | | | $ | — | | | $ | — | | | $ | 6,680 | |
| Total liabilities categorized within the fair value hierarchy | $ | 6,680 | | | $ | — | | | $ | — | | | $ | 6,680 | |
ProAssurance Corporation and Subsidiaries
Notes to Consolidated Financial Statements
December 31, 2024
| | | | | | | | | | | | | | | | | | | | | | | |
| December 31, 2023 |
| Fair Value Measurements Using | | Total |
| (In thousands) | Level 1 | | Level 2 | | Level 3 | | Fair Value |
| Assets: | | | | | | | |
| Fixed maturities, available-for-sale | | | | | | | |
| U.S. Treasury obligations | $ | — | | | $ | 243,525 | | | $ | — | | | $ | 243,525 | |
| U.S. Government-sponsored enterprise obligations | — | | | 18,724 | | | — | | | 18,724 | |
| State and municipal bonds | — | | | 454,381 | | | — | | | 454,381 | |
| Corporate debt, multiple observable inputs | — | | | 1,668,197 | | | — | | | 1,668,197 | |
| | | | | | | |
| Corporate debt, limited observable inputs | — | | | — | | | 82,377 | | | 82,377 | |
| | | | | | | |
| Residential mortgage-backed securities | — | | | 429,883 | | | 254 | | | 430,137 | |
| Agency commercial mortgage-backed securities | — | | | 8,387 | | | — | | | 8,387 | |
| Other commercial mortgage-backed securities | — | | | 188,464 | | | 1,010 | | | 189,474 | |
| Other asset-backed securities | — | | | 395,245 | | | 3,150 | | | 398,395 | |
| Fixed maturities, trading | — | | | 48,324 | | | — | | | 48,324 | |
| Equity investments | | | | | | | |
| Financial | 9,464 | | | 2,287 | | | 291 | | | 12,042 | |
| Utilities/Energy | 1,256 | | | — | | | — | | | 1,256 | |
| | | | | | | |
| Industrial | — | | | — | | | 4,946 | | | 4,946 | |
| Bond funds | 114,901 | | | — | | | — | | | 114,901 | |
| All other | 18,150 | | | — | | | — | | | 18,150 | |
| Short-term investments | 163,499 | | | 72,286 | | | — | | | 235,785 | |
| Other investments | — | | | 57,478 | | | 5,126 | | | 62,604 | |
| Other assets | — | | | 3,876 | | | — | | | 3,876 | |
| Total assets categorized within the fair value hierarchy | $ | 307,270 | | | $ | 3,591,057 | | | $ | 97,154 | | | 3,995,481 | |
| Assets carried at NAV, which approximates fair value and which are not categorized within the fair value hierarchy, reported as a part of: | | | | | | | |
| | | | | | | |
| Investment in unconsolidated subsidiaries | | | | | | | 245,455 | |
| Total assets at fair value | | | | | | | $ | 4,240,936 | |
| | | | | | | |
| Liabilities: | | | | | | | |
| Other liabilities | $ | 4,030 | | | $ | — | | | $ | 6,500 | | | $ | 10,530 | |
| Total liabilities categorized within the fair value hierarchy | $ | 4,030 | | | $ | — | | | $ | 6,500 | | | $ | 10,530 | |
The fair values for securities included in the Level 2 category, with the few exceptions described below, were developed by one of several third-party, nationally recognized pricing services, including services that price only certain types of securities. Each service uses complex methodologies to determine values for securities and subject the values they develop to quality control reviews. Management selected a primary source for each type of security in the portfolio and reviewed the values provided for reasonableness by comparing data to alternate pricing services and to available market and trade data. Values that appeared inconsistent were further reviewed for appropriateness. Any value that did not appear reasonable was discussed with the service that provided the value and adjusted, if necessary. There were no material changes to the values supplied by the pricing services during the years ended December 31, 2024 and 2023.
Level 2 Valuations
Below is a summary description of the valuation methodologies primarily used by the pricing services for securities in the Level 2 category, by security type:
U.S. Treasury obligations were valued based on quoted prices for identical assets, or, in markets that are not active, quotes for similar assets, taking into consideration adjustments for variations in contractual cash flows and yields to maturity.
ProAssurance Corporation and Subsidiaries
Notes to Consolidated Financial Statements
December 31, 2024
U.S. Government-sponsored enterprise obligations were valued using pricing models that consider current and historical market data, normal trading conventions, credit ratings and the particular structure and characteristics of the security being valued, such as yield to maturity, redemption options, and contractual cash flows. Adjustments to model inputs or model results were included in the valuation process when necessary to reflect recent regulatory, government or corporate actions or significant economic, industry or geographic events affecting the security’s fair value.
State and municipal bonds were valued using a series of matrices that considered credit ratings, the structure of the security, the sector in which the security falls, yields and contractual cash flows. Valuations were further adjusted, when necessary, to reflect the expected effect on fair value of recent significant economic or geographic events or ratings changes.
Corporate debt, multiple observable inputs consisted primarily of corporate bonds. The methodology used to value Level 2 corporate bonds was the same as the methodology previously described for U.S. Government-sponsored enterprise obligations. Bank loans were valued based on an average of broker quotes for the loans in question, if available. If quotes were not available, the loans were valued based on quoted prices for comparable loans or, if the loan was newly issued, by comparison to similar seasoned issues. Broker quotes were compared to actual trade prices to permit assessment of the reliability of the quotes; unreliable quotes were not considered in quoted averages.
Residential and commercial mortgage-backed securities were valued using a pricing matrix which considers the issuer type, coupon rate and longest cash flows outstanding. The matrix used was based on the most recently available market information. Agency and non-agency collateralized mortgage obligations were both valued using models that consider the structure of the security, current and historical information regarding prepayment speeds, ratings and ratings updates, current and historical interest rates and interest rate spread data.
Other asset-backed securities were valued using models that consider the structure of the security, monthly payment information, current and historical information regarding prepayment speeds, ratings and ratings updates, current and historical interest rates and interest rate spread data. Spreads and prepayment speeds consider collateral type.
Fixed maturities, trading are held by the Lloyd's Syndicates corporate member subsidiary and include U.S. Treasury obligations, corporate debt with multiple observable inputs and other asset-backed securities. These securities were valued using the respective valuation methodologies discussed above for each security type.
Equity investments were securities not traded on an exchange on the valuation date. The securities were valued using the most recently available quotes for the securities.
Short-term investments were securities maturing within one year, carried at fair value which approximated the cost of the securities due to their short-term nature.
Other investments consisted primarily of convertible bonds valued using a pricing model that incorporated selected dealer quotes as well as current market data regarding equity prices and risk free rates. If dealer quotes were unavailable for the security being valued, quotes for securities with similar terms and credit status were used in the pricing model. Dealer quotes selected for use were those considered most accurate based on parameters such as underwriter status and historical reliability.
Other assets consisted of interest rate swap and foreign currency forward contract derivative instruments, which are discussed in Note 11, valued using a model which considers the forward yield curves and volatilities from other instruments with similar maturities, strike prices and durations.
Level 3 Valuations
Below is a summary description of the valuation methodologies used as well as quantitative information regarding securities in the Level 3 category, by security type:
Level 3 Valuation Methodologies
Corporate debt, limited observable inputs consisted of corporate bonds valued using dealer quotes for similar securities or discounted cash flow models using yields currently available for similar securities. Similar securities are defined as securities of comparable credit quality that have like terms and payment features. Assessments of credit quality were based on NRSRO ratings, if available, or were determined by management if not available. At December 31, 2024, 100% of the securities were rated and the average rating was BBB+. At December 31, 2023, 98% of the securities were rated and the average rating was BBB+.
Residential mortgage-backed, other commercial mortgage-backed and other asset-backed securities consisted of securitizations of receivables valued using dealer quotes for similar securities or discounted cash flow models using yields currently available for similar securities. Similar securities are defined as securities of comparable credit quality that have like
ProAssurance Corporation and Subsidiaries
Notes to Consolidated Financial Statements
December 31, 2024
terms and payment features. Assessments of credit quality were based on NRSRO ratings, if available, or were subjectively determined by management if not available. At December 31, 2024, 81% of the securities were rated and the average rating was A-. At December 31, 2023, 79% of the securities were rated and the average rating was AA.
Equity investments consisted of preferred stock for which limited observable inputs were available at December 31, 2024 and December 31, 2023. The equity securities were primarily priced using broker/dealer quotes and internal models with some inputs that are unobservable.
Other investments consisted of convertible securities for which limited observable inputs were available at December 31, 2024 and December 31, 2023. The securities were valued internally based on expected cash flows, including the expected final recovery, discounted at a yield that considered the lack of liquidity and the financial status of the issuer.
Other liabilities consisted of contingent consideration associated with the NORCAL acquisition and was recorded at fair value at December 31, 2023. The ultimate payout under the contingent consideration was dependent upon the after-tax development of NORCAL's ultimate net losses over a three-year period beginning December 31, 2020 determined as of December 31, 2023 by a mutually agreed upon independent actuarial consultant. In June 2024, the independent actuarial consulting firm completed its estimate, and based on that estimate no additional consideration was due. The Committee appointed by NORCAL prior to the close of the acquisition reviewed the work of the independent actuarial consultant and accepted the conclusion that no additional consideration was due; therefore, the liability was reduced to zero as of June 30, 2024. As of December 31, 2023, the remaining uncertainty was a significant component in the determination of the fair value of the liability. See further discussion around the contingent consideration in Note 8.
Quantitative Information Regarding Level 3 Valuations
Below is quantitative information regarding securities in the Level 3 category, by security type:
| | | | | | | | | | | | | | | | | | | | | | | | | | | | | | | | |
| | Fair Value at | | | | | | |
| ($ in thousands) | | December 31, 2024 | | December 31, 2023 | | Valuation Technique | | Unobservable Input | | Range
(Weighted Average) |
| Assets: | | | | | | | | | | |
| | | | | | | | | | |
| | | | | | | | | | |
| Corporate debt, limited observable inputs | | $81,062 | | $82,377 | | Market Comparable
Securities | | Comparability Adjustment | | 0% - 5% (2.5%) |
| | | | | | Discounted Cash Flows | | Comparability Adjustment | | 0% - 5% (2.5%) |
| Residential mortgage-backed, other commercial mortgage-backed and other asset-backed securities | | $3,774 | | $4,414 | | Market Comparable
Securities | | Comparability Adjustment | | 0% - 5% (2.5%) |
| | | | | | Discounted Cash Flows | | Comparability Adjustment | | 0% - 5% (2.5%) |
| | | | | | | | | | |
| | | | | | | | | | |
| | | | | | | | | | |
| | | | | | | | | | |
| Equity investments | | $5,506 | | $5,237 | | Discounted Cash Flows | | Comparability Adjustment | | 0% - 10% (5%) |
| Other investments | | $500 | | $5,126 | | Discounted Cash Flows | | Comparability Adjustment | | 0% - 10% (5%) |
| Liabilities: | | | | | | | | | | |
| Other liabilities | | $— | | $6,500 | | Stochastic Model/Discounted Cash Flows | | Weighted Average Cost of Capital | | 0% - 10% (8%) |
| | | | | | | | | | |
| | | | | | | | | | |
The significant unobservable inputs used in the fair value measurement of the above listed securities were the valuations of comparable securities with similar issuers, credit quality and maturity. Changes in the availability of comparable securities could result in changes in the fair value measurements.
ProAssurance Corporation and Subsidiaries
Notes to Consolidated Financial Statements
December 31, 2024
Fair Value Measurements - Level 3 Assets & Liabilities
The following tables present summary information regarding changes in the fair value of assets and liabilities measured using Level 3 inputs. | | | | | | | | | | | | | | | | | | | | | | | | | | | | | | | | | | | | | | | | | | | | | | | | | | | |
| | | | | | December 31, 2024 | | | | | | |
| | | | | Level 3 Fair Value Measurements | | | | | | |
| | | | | | Assets | | Liabilities | | | | | | |
| (In thousands) | | | | | Corporate Debt | | Asset-backed Securities | | Equity Investments | | Other Investments | | Total Assets | | Other Liabilities | | Total Liabilities | | | | | | |
| Balance, December 31, 2023 | | | | | $ | 82,377 | | | $ | 4,414 | | | $ | 5,237 | | | $ | 5,126 | | | $ | 97,154 | | | $ | (6,500) | | | $ | (6,500) | | | | | | | |
| Total gains (losses) realized and unrealized: | | | | | | | | | | | | | | | | | | | | | | | |
| Included in earnings, as a part of: | | | | | | | | | | | | | | | | | | | | | | | |
| Net investment income (loss) | | | | | — | | | 2 | | | — | | | — | | | 2 | | | — | | | — | | | | | | | |
| | | | | | | | | | | | | | | | | | | | | | | |
| Net investment gains (losses) | | | | | — | | | — | | | (51) | | | 98 | | | 47 | | | 6,500 | | | 6,500 | | | | | | | |
| | | | | | | | | | | | | | | | | | | | | | | |
| Included in other comprehensive income (loss) | | | | | (85) | | | (53) | | | — | | | — | | | (138) | | | — | | | — | | | | | | | |
| Purchases | | | | | 18,508 | | | 6,248 | | | 320 | | | — | | | 25,076 | | | — | | | — | | | | | | | |
| Sales | | | | | (2,814) | | | (286) | | | — | | | (252) | | | (3,352) | | | — | | | — | | | | | | | |
| Transfers in | | | | | 3,587 | | | — | | | — | | | — | | | 3,587 | | | — | | | — | | | | | | | |
| Transfers out | | | | | (20,511) | | | (6,551) | | | — | | | (4,472) | | | (31,534) | | | — | | | — | | | | | | | |
| Balance, December 31, 2024 | | | | | $ | 81,062 | | | $ | 3,774 | | | $ | 5,506 | | | $ | 500 | | | $ | 90,842 | | | $ | — | | | $ | — | | | | | | | |
| Change in unrealized gains (losses) included in earnings for the above period for Level 3 assets and liabilities held at period-end | | | | | $ | — | | | $ | — | | | $ | (51) | | | $ | 88 | | | $ | 37 | | | $ | — | | | $ | — | | | | | | | |
| | | | | | | | | | | | | | | | | | | | | | | |
| | | | | | | | | | | | | | | | | | | | | | | | | | | | | | | | | | | | | | | | | | | | | |
| | | | | | December 31, 2023 |
| | | | | | Level 3 Fair Value Measurements |
| | | | | Assets | | Liabilities |
| (In thousands) | | | | | Corporate Debt | | Asset-backed Securities | | Equity Investments | | Other Investments | | Total Assets | | Other Liabilities | | Total Liabilities |
| Balance, December 31, 2022 | | | | | $ | 63,973 | | | $ | 2,954 | | | $ | 2,803 | | | $ | 1,783 | | | $ | 71,513 | | | $ | (15,000) | | | $ | (15,000) | |
| Total gains (losses) realized and unrealized: | | | | | | | | | | | | | | | | | |
| Included in earnings, as a part of: | | | | | | | | | | | | | | | | | |
| Net investment income (loss) | | | | | (23) | | | — | | | — | | | — | | | (23) | | | — | | | — | |
| | | | | | | | | | | | | | | | | |
| Net investment gains (losses) | | | | | 212 | | | — | | | (737) | | | 113 | | | (412) | | | 5,000 | | | 5,000 | |
| Operating expense | | | | | — | | | — | | | — | | | — | | | — | | | 3,500 | | | 3,500 | |
| Included in other comprehensive income (loss) | | | | | 165 | | | (357) | | | — | | | — | | | (192) | | | — | | | — | |
| Purchases | | | | | 34,311 | | | 3,253 | | | 3,171 | | | 4,294 | | | 45,029 | | | — | | | — | |
| Sales | | | | | (9,534) | | | (398) | | | — | | | — | | | (9,932) | | | — | | | — | |
| Transfers in | | | | | 14,666 | | | 3,988 | | | — | | | 2,108 | | | 20,762 | | | — | | | — | |
| Transfers out | | | | | (21,393) | | | (5,026) | | | — | | | (3,172) | | | (29,591) | | | — | | | — | |
| Balance, December 31, 2023 | | | | | $ | 82,377 | | | $ | 4,414 | | | $ | 5,237 | | | $ | 5,126 | | | $ | 97,154 | | | $ | (6,500) | | | $ | (6,500) | |
| Change in unrealized gains (losses) included in earnings for the above period for Level 3 assets and liabilities held at period-end | | | | | $ | — | | | $ | — | | | $ | (737) | | | $ | 113 | | | $ | (624) | | | $ | — | | | $ | — | |
ProAssurance Corporation and Subsidiaries
Notes to Consolidated Financial Statements
December 31, 2024
Transfers
Transfers shown in the preceding Level 3 tables were as of the end of the period in which the transfer occurred. All transfers were to or from Level 2.
All transfers in and out of Level 3 during 2024 and 2023 related to securities held for which the level of market activity for identical or nearly identical securities varies from period to period. The securities were valued using multiple observable inputs when those inputs were available; otherwise the securities were valued using limited observable inputs.
Fair Values Not Categorized
At December 31, 2024 and 2023, certain LPs/LLCs and investment funds measure fund assets at fair value on a recurring basis and provide a NAV for ProAssurance's interest. The carrying value of these interests is based on the NAV provided and was considered to approximate the fair value of the interests. For investment in unconsolidated subsidiaries, ProAssurance recognizes any changes in the NAV of its interests in equity in earnings (loss) of unconsolidated subsidiaries during the period of change. In accordance with GAAP, the fair value of these investments was not classified within the fair value hierarchy. The amount of ProAssurance's unfunded contractual commitments related to these investments as of December 31, 2024 and fair values of these investments as of December 31, 2024 and 2023 were as follows:
| | | | | | | | | | | | | | | | | |
| | Unfunded
Contractual Commitments | | Fair Value |
| (In thousands) | December 31, 2024 | | December 31, 2024 | | December 31, 2023 |
| | | | | |
| | | | | |
| Investment in unconsolidated subsidiaries: | | | | | |
Private debt funds (1) | $4,386 | | $ | 14,190 | | | $ | 19,886 | |
| | | | | |
Long/short equity funds (2) | None | | 4,246 | | | 4,497 | |
Non-public equity funds (3) | $31,935 | | 111,441 | | | 111,251 | |
| | | | | |
Credit funds (4) | $33,632 | | 45,134 | | | 55,740 | |
| | | | | |
Strategy focused funds (5) | $68,072 | | 51,258 | | | 54,081 | |
| | | | | |
| | | | | |
| | | | | |
| | | | | |
| Total investments carried at NAV | | | $ | 226,269 | | | $ | 245,455 | |
|
Below is additional information regarding each of the investments listed in the table above as of December 31, 2024.
(1)This investment is comprised of interests in two unrelated LP funds that are structured to provide interest distributions primarily through diversified portfolios of private debt instruments. One LP allows redemption by special consent, while the other does not permit redemption. Income and capital are to be periodically distributed at the discretion of the LPs over an anticipated time frame that spans from three to eight years.
(2)This investment is comprised of one LP fund which holds long and short publicly traded securities that will passively generate income. Redemptions are permitted with 30 days written notice if outside of a lock-up period.
(3)This investment is comprised of interests in multiple unrelated LP funds, each structured to provide capital appreciation through diversified investments in private equity, which can include investments in buyout, venture capital, debt including senior, second lien and mezzanine, distressed debt, collateralized loan obligations and other private equity-oriented LPs. Two of the LPs allow redemption by terms set forth in the LP agreements; the others do not permit redemption. Income and capital are to be periodically distributed at the discretion of the LP over time frames that are anticipated to span up to ten years.
(4)This investment is comprised of multiple unrelated LP funds. Three funds seek to obtain superior risk-adjusted absolute returns through a diversified portfolio of debt securities, including bonds, loans and other asset-backed instruments. The remaining funds focus on private middle market company mezzanine and senior secured loans, opportunities across the credit spectrum, mortgage backed-loans, as well as various types of loan-backed investments. One fund allows redemptions at any quarter-end with prior notice requirements of 180 days, while two other funds allow for redemptions with consent of the General Partner. The remaining funds do not allow redemptions. For the funds that do not allow redemptions, income and capital are to be periodically distributed at the discretion of the LP over time frames throughout the remaining life of the funds.
(5)This investment is comprised of multiple unrelated LPs/LLCs funds. One fund is an LLC focused on investing in North American consumer products companies, comprised of equity and equity-related securities, as well as debt instruments. A second fund is focused on aircraft investments, along with components and assets related to aircrafts. A third fund is an LLC focused on acquiring ownership stakes in insurance agencies. For all three
ProAssurance Corporation and Subsidiaries
Notes to Consolidated Financial Statements
December 31, 2024
funds, redemptions are not permitted. The remaining funds are real estate focused LPs, three of which allow for redemption with prior notice.
ProAssurance may not sell, transfer or assign its interest in any of the above LPs/LLCs without special consent from the LPs/LLCs.
Nonrecurring Fair Value Measurement
During the third quarter of 2023, ProAssurance recognized a nonrecurring fair value measurement related to the goodwill in its Workers' Compensation Insurance reporting unit with a carrying value of $44.1 million prior to the fair value measurement. This nonrecurring fair value measurement resulted in the goodwill being written down to its implied fair value of zero resulting in an impairment of goodwill of $44.1 million. The inputs used in the fair value measurement were non-observable and, as such, were categorized as a Level 3 valuation. ProAssurance did not have any other assets or liabilities that were measured at fair value on a nonrecurring basis at December 31, 2024 or 2023.
Financial Instruments - Methodologies Other Than Fair Value
The following table provides the estimated fair value of the Company's financial instruments that, in accordance with GAAP for the type of investment, are measured using a methodology other than fair value. Fair values provided primarily fall within the Level 3 fair value category.
| | | | | | | | | | | | | | | | | | | | | | | |
| | December 31, 2024 | | December 31, 2023 |
| (In thousands) | Carrying
Value | | Fair
Value | | Carrying
Value | | Fair
Value |
| Financial assets: | | | | | | | |
| BOLI | $ | 80,179 | | | $ | 80,179 | | | $ | 78,205 | | | $ | 78,205 | |
| Other investments | $ | 5,189 | | | $ | 5,189 | | | $ | 3,215 | | | $ | 3,215 | |
| Other assets | $ | 34,793 | | | $ | 34,793 | | | $ | 33,231 | | | $ | 33,221 | |
| Financial liabilities: | | | | | | | |
| | | | | | | |
| Revolving Credit Agreement* | $ | 125,000 | | | $ | 125,000 | | | $ | 125,000 | | | $ | 125,000 | |
| Term Loan* | $ | 120,313 | | | $ | 120,313 | | | $ | 125,000 | | | $ | 125,000 | |
| Contribution Certificates | $ | 181,163 | | | $ | 152,564 | | | $ | 179,387 | | | $ | 149,782 | |
| Other liabilities | $ | 33,793 | | | $ | 33,793 | | | $ | 32,043 | | | $ | 32,043 | |
| * Carrying value excludes unamortized debt issuance costs. |
The fair value of the BOLI was equal to the cash surrender value associated with the policies on the valuation date.
Other investments listed in the table above include FHLB common stock carried at cost and an annuity investment carried at amortized cost. Two of ProAssurance's insurance subsidiaries are members of an FHLB. The estimated fair value of the FHLB common stock was based on the amount the subsidiaries would receive if their memberships were canceled, as the memberships cannot be sold. The fair value of the annuity represents the present value of the expected future cash flows discounted using a rate available in active markets for similarly structured instruments.
Other assets and other liabilities primarily consisted of related investment assets and liabilities associated with funded deferred compensation agreements. The fair value of the funded deferred compensation assets was based upon quoted market prices, which is categorized as a Level 1 valuation, and had a fair value of $34.1 million and $32.3 million at December 31, 2024 and 2023, respectively. Other assets also included an unsecured note receivable. The fair value of the note receivable was based on the present value of expected cash flows from the note receivable, discounted at market rates on the valuation date for receivables with similar credit standings and similar payment structures. Other liabilities primarily consisted of liabilities associated with funded deferred compensation agreements. The reported balance is determined based on the amount of elective deferrals and employer contributions adjusted for periodic changes in the fair value of the participant balances based on the performance of the funds selected by the participants and had a fair value of $33.8 million and $32.0 million at December 31, 2024 and December 31, 2023, respectively.
The fair value of the debt was estimated based on the present value of expected future cash outflows, discounted at rates available on the valuation date for similar debt issued by entities with a similar credit standing to ProAssurance.
ProAssurance Corporation and Subsidiaries
Notes to Consolidated Financial Statements
December 31, 2024
3. Investments
Available-for-sale fixed maturities at December 31, 2024 and December 31, 2023 included the following:
| | | | | | | | | | | | | | | | | | | | | | | | | | | | | |
| December 31, 2024 |
| (In thousands) | Amortized
Cost | | Allowance for Expected Credit Losses | | Gross Unrealized Gains | | Gross Unrealized Losses | | Estimated Fair Value |
| Fixed maturities, available-for-sale | | | | | | | | | |
| U.S. Treasury obligations | $ | 256,939 | | | $ | — | | | $ | 107 | | | $ | 13,143 | | | $ | 243,903 | |
| U.S. Government-sponsored enterprise obligations | 15,586 | | | — | | | — | | | 692 | | | 14,894 | |
| State and municipal bonds | 470,974 | | | — | | | 1,135 | | | 25,508 | | | 446,601 | |
| Corporate debt | 1,833,207 | | | 2,608 | | | 4,241 | | | 107,065 | | | 1,727,775 | |
| Residential mortgage-backed securities | 536,194 | | | 197 | | | 1,628 | | | 58,826 | | | 478,799 | |
| Agency commercial mortgage-backed securities | 7,600 | | | — | | | — | | | 873 | | | 6,727 | |
| Other commercial mortgage-backed securities | 214,019 | | | 406 | | | 439 | | | 12,266 | | | 201,786 | |
| Other asset-backed securities | 469,316 | | | 188 | | | 1,725 | | | 9,131 | | | 461,722 | |
| $ | 3,803,835 | | | $ | 3,399 | | | $ | 9,275 | | | $ | 227,504 | | | $ | 3,582,207 | |
| | | | | | | | | | | | | | | | | | | | | | | | | | | | | |
| | December 31, 2023 |
| (In thousands) | Amortized
Cost | | Allowance for Expected Credit Losses | | Gross Unrealized Gains | | Gross Unrealized Losses | | Estimated Fair Value |
| Fixed maturities, available-for-sale | | | | | | | | | |
| U.S. Treasury obligations | $ | 259,834 | | | $ | — | | | $ | 165 | | | $ | 16,474 | | | $ | 243,525 | |
| U.S. Government-sponsored enterprise obligations | 19,752 | | | — | | | 2 | | | 1,030 | | | 18,724 | |
| State and municipal bonds | 482,367 | | | — | | | 1,885 | | | 29,871 | | | 454,381 | |
| Corporate debt | 1,883,308 | | | — | | | 4,025 | | | 136,759 | | | 1,750,574 | |
| Residential mortgage-backed securities | 481,267 | | | 211 | | | 2,876 | | | 53,795 | | | 430,137 | |
| Agency commercial mortgage-backed securities | 9,369 | | | — | | | 5 | | | 987 | | | 8,387 | |
| Other commercial mortgage-backed securities | 210,469 | | | 151 | | | 60 | | | 20,904 | | | 189,474 | |
| Other asset-backed securities | 412,354 | | | 193 | | | 1,104 | | | 14,870 | | | 398,395 | |
| $ | 3,758,720 | | | $ | 555 | | | $ | 10,122 | | | $ | 274,690 | | | $ | 3,493,597 | |
ProAssurance Corporation and Subsidiaries
Notes to Consolidated Financial Statements
December 31, 2024
The recorded cost basis and estimated fair value of available-for-sale fixed maturities at December 31, 2024, by contractual maturity, are shown below. Actual maturities may differ from contractual maturities because borrowers may have the right to call or prepay obligations with or without call or prepayment penalties.
| | | | | | | | | | | | | | | | | | | | | | | | | | | | | | | | | | | |
| (In thousands) | Amortized
Cost | | Due in one
year or less | | Due after
one year
through
five years | | Due after
five years
through
ten years | | Due after
ten years | | Total Fair
Value |
| Fixed maturities, available-for-sale | | | | | | | | | | | |
| U.S. Treasury obligations | $ | 256,939 | | | $ | 62,307 | | | $ | 152,785 | | | $ | 26,312 | | | $ | 2,499 | | | $ | 243,903 | |
| U.S. Government-sponsored enterprise obligations | 15,586 | | | 5,514 | | | 6,932 | | | 499 | | | 1,949 | | | 14,894 | |
| State and municipal bonds | 470,974 | | | 44,589 | | | 143,632 | | | 150,338 | | | 108,042 | | | 446,601 | |
| Corporate debt | 1,833,207 | | | 179,365 | | | 897,261 | | | 537,948 | | | 113,201 | | | 1,727,775 | |
| Residential mortgage-backed securities | 536,194 | | | | | | | | | | | 478,799 | |
| Agency commercial mortgage-backed securities | 7,600 | | | | | | | | | | | 6,727 | |
| Other commercial mortgage-backed securities | 214,019 | | | | | | | | | | | 201,786 | |
| Other asset-backed securities | 469,316 | | | | | | | | | | | 461,722 | |
| $ | 3,803,835 | | | | | | | | | | | $ | 3,582,207 | |
Excluding obligations of the U.S. Government, U.S. Government-sponsored enterprises and a U.S. Government obligations money market fund, no investment in any entity or its affiliates exceeded 10% of shareholders’ equity at December 31, 2024.
Cash and securities with a carrying value of $52.2 million at December 31, 2024 were on deposit with various state insurance departments to meet regulatory requirements. ProAssurance also held securities with a carrying value of $68.2 million at December 31, 2024 that are pledged as collateral security for advances under the Company's borrowing relationships with FHLBs.
As a member of Lloyd's, ProAssurance is required to maintain capital at Lloyd's, referred to as FAL, to support the Company's previous participation in underwriting years that remain open at Syndicate 1729. At December 31, 2024, the fair value of ProAssurance's FAL investments was $11.7 million and were comprised of cash and cash equivalents and investment securities, primarily available-for-sale fixed maturities on deposit with Lloyd's, in order to satisfy these FAL requirements. During 2024, ProAssurance received a return of approximately $9.1 million of cash from its FAL balances due to lower capital requirements for the 2023 underwriting year and lower economic capital assessments.
ProAssurance Corporation and Subsidiaries
Notes to Consolidated Financial Statements
December 31, 2024
Investments Held in a Loss Position
The following tables provide summarized information with respect to investments held in an unrealized loss position at December 31, 2024 and December 31, 2023, including the length of time the investment had been held in a continuous unrealized loss position.
| | | | | | | | | | | | | | | | | | | | | | | | | | | | | | | | | | | |
| December 31, 2024 |
| | Total | | Less than 12 months | | 12 months or longer |
| | Fair | | Unrealized | | Fair | | Unrealized | | Fair | | Unrealized |
| (In thousands) | Value | | Loss | | Value | | Loss | | Value | | Loss |
| Fixed maturities, available-for-sale | | | | | | | | | | | |
| U.S. Treasury obligations | $ | 213,505 | | | $ | 13,143 | | | $ | 33,822 | | | $ | 1,561 | | | $ | 179,683 | | | $ | 11,582 | |
| U.S. Government-sponsored enterprise obligations | 14,894 | | | 692 | | | 2,603 | | | 69 | | | 12,291 | | | 623 | |
| State and municipal bonds | 378,425 | | | 25,508 | | | 82,312 | | | 2,261 | | | 296,113 | | | 23,247 | |
| Corporate debt | 1,350,139 | | | 107,065 | | | 222,614 | | | 9,593 | | | 1,127,525 | | | 97,472 | |
| Residential mortgage-backed securities | 378,461 | | | 58,826 | | | 118,908 | | | 3,810 | | | 259,553 | | | 55,016 | |
| Agency commercial mortgage-backed securities | 6,727 | | | 873 | | | 426 | | | 8 | | | 6,301 | | | 865 | |
| Other commercial mortgage-backed securities | 151,386 | | | 12,266 | | | 17,337 | | | 188 | | | 134,049 | | | 12,078 | |
| Other asset-backed securities | 202,517 | | | 9,131 | | | 65,870 | | | 560 | | | 136,647 | | | 8,571 | |
| $ | 2,696,054 | | | $ | 227,504 | | | $ | 543,892 | | | $ | 18,050 | | | $ | 2,152,162 | | | $ | 209,454 | |
| | | | | | | | | | | |
| | | | | | | | | | | |
| | | | | | | | | | | | | | | | | | | | | | | | | | | | | | | | | | | |
| December 31, 2023 |
| | Total | | Less than 12 months | | 12 months or longer |
| | Fair | | Unrealized | | Fair | | Unrealized | | Fair | | Unrealized |
| (In thousands) | Value | | Loss | | Value | | Loss | | Value | | Loss |
| Fixed maturities, available-for-sale | | | | | | | | | | | |
| U.S. Treasury obligations | $ | 213,634 | | | $ | 16,474 | | | $ | 32,925 | | | $ | 1,364 | | | $ | 180,709 | | | $ | 15,110 | |
| U.S. Government-sponsored enterprise obligations | 18,428 | | | 1,030 | | | 4,128 | | | 242 | | | 14,300 | | | 788 | |
| State and municipal bonds | 378,313 | | | 29,871 | | | 48,960 | | | 2,287 | | | 329,353 | | | 27,584 | |
| Corporate debt | 1,524,940 | | | 136,759 | | | 84,221 | | | 5,054 | | | 1,440,719 | | | 131,705 | |
| Residential mortgage-backed securities | 313,082 | | | 53,795 | | | 74,463 | | | 10,271 | | | 238,619 | | | 43,524 | |
| Agency commercial mortgage-backed securities | 7,955 | | | 987 | | | 212 | | | 1 | | | 7,743 | | | 986 | |
| Other commercial mortgage-backed securities | 184,416 | | | 20,904 | | | 18,092 | | | 1,140 | | | 166,324 | | | 19,764 | |
| Other asset-backed securities | 293,447 | | | 14,870 | | | 30,115 | | | 867 | | | 263,332 | | | 14,003 | |
| $ | 2,934,215 | | | $ | 274,690 | | | $ | 293,116 | | | $ | 21,226 | | | $ | 2,641,099 | | | $ | 253,464 | |
| | | | | | | | | | | |
| | | | | | | | | | | |
As of December 31, 2024, excluding U.S. Government or U.S. Government-sponsored enterprise obligations, there were 2,350 debt securities (58.7% of all available-for-sale fixed maturity securities held) in an unrealized loss position representing 1,235 issuers. The greatest and second greatest unrealized loss positions among those securities were approximately $5.2 million and $3.4 million, respectively. The securities were evaluated for impairment as of December 31, 2024.
As of December 31, 2023, excluding U.S. Government or U.S. Government-sponsored enterprise obligations, there were 2,531 debt securities (65.6% of all available-for-sale fixed maturity securities held) in an unrealized loss position representing 1,319 issuers. The greatest and second greatest unrealized loss positions among those securities were approximately $5.0 million and $3.2 million, respectively. The securities were evaluated for impairment as of December 31, 2023.
ProAssurance Corporation and Subsidiaries
Notes to Consolidated Financial Statements
December 31, 2024
Each quarter, ProAssurance performs a detailed analysis for the purpose of assessing whether any of the securities it holds in an unrealized loss position has suffered an impairment due to credit or non-credit factors. A detailed discussion of the factors considered in the assessment is included in Note 1.
Fixed maturity securities held in an unrealized loss position at December 31, 2024, excluding asset-backed securities, have paid all scheduled contractual payments and are expected to continue. Expected future cash flows of asset-backed securities, excluding those issued by GNMA, FNMA and FHLMC, held in an unrealized loss position were estimated as part of the December 31, 2024 impairment evaluation using the most recently available six-month historical performance data for the collateral (loans) underlying the security or, if historical data was not available, sector based assumptions, and equaled or exceeded the current amortized cost basis of the security.
The following tables present a roll forward of the allowance for expected credit losses on available-for-sale fixed maturities for the years ended December 31, 2024 and 2023.
| | | | | | | | | | | | | | | | | | | | |
| | | Year Ended December 31, 2024 |
| (In thousands) | | | Corporate Debt | Residential mortgage-backed securities | | Other commercial mortgage-backed securities | Other asset-backed securities | Total |
| Balance, at December 31, 2023 | | | $ | — | | $ | 211 | | | $ | 151 | | $ | 193 | | $ | 555 | |
| Additional credit losses related to securities for which: | | | | | | | | |
| No allowance for credit losses has been previously recognized | | | 2,138 | | — | | | 406 | | — | | 2,544 | |
| | | | | | | | |
| An allowance for credit losses was recorded in a previous period | | | 470 | | — | | | — | | — | | 470 | |
| Reductions related to: | | | | | | | | |
| Securities sold during the period | | | — | | (14) | | | (151) | | (5) | | (170) | |
| | | | | | | | |
| | | | | | | | |
| | | | | | | | |
| Balance, at December 31, 2024 | | | $ | 2,608 | | $ | 197 | | | $ | 406 | | $ | 188 | | $ | 3,399 | |
| | | | | | | | | | | | | | | | | | |
| | | | Year Ended December 31, 2023 |
| (In thousands) | | | | Residential mortgage-backed securities | | Other commercial mortgage-backed securities | Other asset-backed securities | Total |
| Balance, at December 31, 2022 | | | | $ | 229 | | | $ | — | | $ | 198 | | $ | 427 | |
| Additional credit losses related to securities for which: | | | | | | | | |
| No allowance for credit losses has been previously recognized | | | | — | | | 151 | | — | | 151 | |
| | | | | | | | |
| | | | | | | | |
| Reductions related to: | | | | | | | | |
| Securities sold during the period | | | | (18) | | | — | | (5) | | (23) | |
| | | | | | | | |
| | | | | | | | |
| | | | | | | | |
| Balance, at December 31, 2023 | | | | $ | 211 | | | $ | 151 | | $ | 193 | | $ | 555 | |
Other information regarding sales and purchases of fixed maturity available-for-sale securities is as follows:
| | | | | | | | | | | |
| Year Ended December 31 |
| (In millions) | 2024 | 2023 | 2022 |
| Proceeds from sales (exclusive of maturities and paydowns) | $ | 149.3 | | $ | 51.4 | | $ | 131.0 | |
| Purchases | $ | 770.3 | | $ | 419.2 | | $ | 607.8 | |
Equity Investments
ProAssurance's equity investments are carried at fair value with changes in fair value recognized in income as a component of net investment gains (losses) during the period of change. Equity investments on the Consolidated Balance Sheets as of December 31, 2024 and 2023 primarily included bond funds and, to a lesser degree, stocks and investment funds.
ProAssurance Corporation and Subsidiaries
Notes to Consolidated Financial Statements
December 31, 2024
Short-term Investments
ProAssurance's short-term investments, which have a maturity at purchase of one year or less, are primarily comprised of investments in U.S. treasury obligations, commercial paper, money market funds and a certificate of deposit. Short-term investments are carried at fair value which approximates the cost of the securities due to their short-term nature.
BOLI
ProAssurance holds BOLI policies that are carried at the current cash surrender value of the policies (original cost $38 million). All insured individuals were members of the Company's management at the time the policies were acquired. The primary purpose of the program is to offset future employee benefit expenses through earnings on the cash value of the policies. ProAssurance is the owner and beneficiary of these policies.
Net Investment Income
Net investment income (loss) by investment category was as follows:
| | | | | | | | | | | | | | | | | |
| Year Ended December 31 |
| (In thousands) | 2024 | | 2023 | | 2022 |
| Fixed maturities | $ | 133,577 | | | $ | 113,721 | | | $ | 93,736 | |
| Equities | 4,758 | | | 4,610 | | | 3,706 | |
| Short-term investments, including Other | 12,463 | | | 15,476 | | | 5,681 | |
| BOLI | 2,316 | | | 2,489 | | | 1,141 | |
| Investment fees and expenses | (8,576) | | | (7,877) | | | (8,292) | |
| Net investment income | $ | 144,538 | | | $ | 128,419 | | | $ | 95,972 | |
Investment in Unconsolidated Subsidiaries
ProAssurance's investment in unconsolidated subsidiaries were as follows:
| | | | | | | | | | | | | | | | | | | | |
| | December 31, 2024 | | Carrying Value |
| (In thousands) | Percentage
Ownership | | December 31,
2024 | | December 31,
2023 |
| | | | | | |
| Qualified affordable housing project tax credit partnerships | See below | | $ | 247 | | | $ | 666 | |
| | | | | |
| All other investments, primarily investment fund LPs/LLCs | See below | | 259,291 | | | 276,090 | |
| | | $ | 259,538 | | | $ | 276,756 | |
Qualified affordable housing project tax credit partnership interests held by ProAssurance generate investment returns by providing tax benefits to fund investors in the form of tax credits and project operating losses. The carrying value of these investments reflects ProAssurance's total commitments (both funded and unfunded) to the partnerships, less any amortization. At December 31, 2024 and December 31, 2023, ProAssurance did not have an ownership percentage greater than 20% in any tax credit partnership interests. Since ProAssurance has the ability to exert influence over the partnerships but does not control them, all are accounted for using the equity method. See further discussion of the entities in which ProAssurance holds passive interests in Note 14.
ProAssurance holds interests in investment fund LPs/LLCs and other equity method investments and LPs/LLCs which are not considered to be investment funds. ProAssurance's ownership percentage relative to five and four of the LPs/LLCs is greater than 25% at December 31, 2024 and 2023, respectively, which is likely to be reduced as the funds mature and other investors participate in the funds; these investments had a carrying value of $18.0 million and $23.0 million at December 31, 2024 and 2023, respectively. ProAssurance's ownership percentage relative to the remaining investments and LPs/LLCs is less than 25%; these interests had a carrying value of $241.3 million and $253.1 million at December 31, 2024 and 2023, respectively. ProAssurance does not have the ability to exert control over any of these funds.
ProAssurance Corporation and Subsidiaries
Notes to Consolidated Financial Statements
December 31, 2024
Equity in Earnings (Loss) of Unconsolidated Subsidiaries
Equity in earnings (loss) of unconsolidated subsidiaries included losses from tax credit partnerships. Investment results recorded reflect ProAssurance's allocable portion of partnership operating results. Tax credits reduce income tax expense in the period they are utilized. The results recorded and tax credits recognized related to ProAssurance's tax credit partnership investments were as follows:
| | | | | | | | | | | | | | | | | | | | | |
| | | Year Ended December 31 |
| (In thousands) | | | | | 2024 | | 2023 | | 2022 |
| Qualified affordable housing project tax credit partnerships | | | | | | | | | |
| Losses (gains) recorded | | | | | $ | 193 | | | $ | 2,405 | | | $ | 8,278 | |
| Tax credits recognized | | | | | $ | 32 | | | $ | 631 | | | $ | 4,805 | |
| | | | | | | | | |
| Historic tax credit partnership* | | | | | | | | | |
| Losses (gains) recorded | | | | | $ | (864) | | | $ | — | | | $ | (1,212) | |
| | | | | | | | | |
| *ProAssurance holds a historic tax credit partnership which was fully amortized in 2020. This partnership generated investment returns by providing benefits to partnership investors in the form of tax credits, tax deductible project operating losses and distributions resulting from positive cash flows. ProAssurance received distributions associated with this investment during the fourth quarter of 2024 and second quarter of 2022 as a result of positive cash flows from completed projects, which were recognized as an operating gain. |
ProAssurance accounts for its tax credit partnership investments under the equity method of accounting and records its allocable portion of the operating losses of the underlying properties based on estimates provided by the partnerships. For the Company's qualified affordable housing project tax credit partnerships, it adjusts its estimates of their allocable portion of operating losses periodically as actual operating results of the underlying properties become available. The primary benefits of tax credits and tax-deductible operating losses from the historic tax credit partnerships are earned in a short period with potential for additional cash flows extending over several years. For the years ended December 31, 2024, 2023 and 2022 the Company generated a nominal amount, $0.6 million and $4.8 million, respectively, of tax credits from its tax credit partnership investments, which were deferred and are expected to be utilized in future periods. For the year ended December 31, 2024, ProAssurance utilized approximately $5.9 million of tax credits carried forward from 2019 and, as of December 31, 2024, the Company had approximately $46.9 million of available tax credit carryforwards generated from its investments in tax credit partnerships which they expect to utilize in future periods (see further discussion in Note 5).
Equity Method Investees
As previously discussed, ProAssurance holds certain investments that are measured using the equity method of accounting, primarily investments in LPs/LLCs, which are carried as a part of investment in unconsolidated subsidiaries on the Consolidated Balance Sheets. As of December 31, 2024, ProAssurance determined one equity method investee, WNG Aircraft Opportunities Fund II LP, to be significant. WNG Aircraft Opportunities Fund II LP invests in mid-life to older narrow body aircraft.
The following tables present aggregated gross summarized financial information for the fund as of December 31, 2024, including the portion not attributable to ProAssurance, derived from the fund's financial statements which are prepared in accordance with GAAP. As the majority of ProAssurance's equity method investments report their results to the Company on a one quarter lag, the majority of the summarized financial information below is for the twelve months ended September 30, 2024 and 2023.
| | | | | | | | | | | |
| Balance Sheet Information |
| (In thousands) | September 30, 2024 | | September 30, 2023 |
| Total assets | $ | 316,699 | | | $ | 228,725 | |
| Total liabilities | $ | 14,830 | | | $ | 80 | |
| Total partners' capital | $ | 301,869 | | | $ | 228,645 | |
ProAssurance Corporation and Subsidiaries
Notes to Consolidated Financial Statements
December 31, 2024
| | | | | | | | | | | | | | | | | |
| Income Statement Information |
| (In thousands) | Year Ended September 30 |
| 2024 | | 2023 | | 2022 |
| Net investment income (loss) | $ | 74,769 | | | $ | (4,846) | | | $ | (5,814) | |
| Net investment gains (losses) | — | | | (475) | | | 3,025 | |
| Net change in unrealized appreciation (depreciation) | 27,152 | | | 20,976 | | | 8,171 | |
| | | | | |
| Net gain (loss) | $ | 101,921 | | | $ | 15,655 | | | $ | 5,382 | |
| | | | | |
Net gain (loss) attributable to ProAssurance(1) | $ | 6,348 | | | $ | (4,517) | | | $ | 377 | |
|
(1) Represents ProAssurance's share of the fund's aggregate income or loss, which is included as a component of equity in earnings (loss) of unconsolidated subsidiaries in its Consolidated Statements of Income and Comprehensive Income for the years ended December 31, 2024, 2023 and 2022.
Net Investment Gains (Losses)
Realized investment gains and losses are recognized on the first-in, first-out basis. The following table provides detailed information regarding net investment gains (losses):
| | | | | | | | | | | | | | | | | |
| Year Ended December 31 |
| (In thousands) | 2024 | | 2023 | | 2022 |
| Total impairment losses: | | | | | |
| | | | | |
| | | | | |
| Corporate debt | $ | (2,710) | | | $ | (2,984) | | | $ | (1,331) | |
| | | | | |
| | | | | |
| Asset-backed securities | (588) | | | (127) | | | (441) | |
| Portion of impairment losses recognized in other comprehensive income before taxes: | | | | | |
| Corporate debt | 102 | | | — | | | — | |
| Asset-backed securities | — | | | — | | | 14 | |
| Net impairment losses recognized in earnings | (3,196) | | | (3,111) | | | (1,758) | |
| Gross realized gains, available-for-sale fixed maturities | 1,527 | | | 876 | | | 1,740 | |
| Gross realized (losses), available-for-sale fixed maturities | (4,116) | | | (1,860) | | | (3,387) | |
| | | | | |
| Net realized gains (losses), trading fixed maturities | 34 | | | (88) | | | (155) | |
| Net realized gains (losses), equity investments | 2,559 | | | 496 | | | (5,252) | |
| Net realized gains (losses), other investments | (826) | | | (2,417) | | | (222) | |
| Change in unrealized holding gains (losses), trading fixed maturities | 445 | | | 68 | | | (613) | |
| Change in unrealized holding gains (losses), equity investments | (2,313) | | | 5,733 | | | (22,166) | |
| Change in unrealized holding gains (losses), convertible securities, carried at fair value | 866 | | | 5,774 | | | (10,557) | |
| | | | | |
Other(1) | 6,923 | | | 8,357 | | | 9,213 | |
| Net investment gains (losses) | $ | 1,903 | | | $ | 13,828 | | | $ | (33,157) | |
(1) Includes gains of $6.5 million, $5.0 million and $9.0 million related to the decrease in the contingent consideration liability during 2024, 2023 and 2022, respectively. See further discussion on the contingent consideration in Note 2 and Note 8. |
For the years ended December 31, 2024, 2023 and 2022, ProAssurance recognized credit-related impairment losses in earnings of $3.2 million, $3.1 million and $1.8 million, respectively, and, for the years ended December 31, 2024 and 2022, a nominal amount of non-credit impairment losses in OCI. The credit-related impairment losses recognized in 2024 primarily related to four corporate bonds in the real estate sector. The credit-related impairment losses recognized in 2023 related to a mortgage-backed security and two corporate bonds in the financial sector. The credit-related impairment losses recognized in 2022 related to a corporate bond in the consumer sector as well as certain mortgage-backed and other asset backed securities.
ProAssurance Corporation and Subsidiaries
Notes to Consolidated Financial Statements
December 31, 2024
The following table presents a roll forward of cumulative credit losses recorded in earnings related to impaired debt securities for which a portion of the impairment was recorded in OCI.
| | | | | | | | | | | | | | | | | |
| Year Ended December 31 |
| (In thousands) | 2024 | | 2023 | | 2022 |
| Balance beginning of period | $ | 57 | | | $ | 57 | | | $ | — | |
| Additional credit losses recognized during the period, related to securities for which: | | | | | |
| No impairment has been previously recognized | 740 | | | — | | | 610 | |
| Impairment has been previously recognized | 470 | | | — | | | — | |
| Reductions due to: | | | | | |
| | | | | |
| | | | | |
| Securities for which there is an intent to sell or will more likely than not be sold before recovery of amortized cost | — | | | — | | | (553) | |
| Balance December 31 | $ | 1,267 | | | $ | 57 | | | $ | 57 | |
4. Reinsurance
ProAssurance purchases reinsurance from third-party reinsurers and insurance enterprises in order to reduce its net exposure to losses, to provide capacity to write larger limits of liability, to provide reimbursement for losses incurred under the higher limit coverages the Company offers and as a mechanism for providing custom insurance solutions. ProAssurance also uses reinsurance arrangements as a mechanism for sharing risk with insureds or their affiliates.
The effects of reinsurance for the years ended December 31, 2024, 2023 and 2022 were as follows:
| | | | | | | | | | | | | | | | | | | | |
| | Year Ended December 31 |
| (In thousands) | | 2024 | | 2023 | | 2022 |
| Direct | | $ | 992,835 | | | $ | 1,020,538 | | | $ | 1,048,690 | |
| Assumed | | 58,032 | | | 61,741 | | | 55,304 | |
| Ceded | | (97,192) | | | (96,285) | | | (89,857) | |
| Net premiums written | | $ | 953,675 | | | $ | 985,994 | | | $ | 1,014,137 | |
| | | | | | |
| Direct | | $ | 1,009,010 | | | $ | 1,008,915 | | | $ | 1,058,263 | |
| Assumed | | 57,489 | | | 62,861 | | | 56,175 | |
| Ceded | | (98,249) | | | (94,379) | | | (84,857) | |
| Net premiums earned | | $ | 968,250 | | | $ | 977,397 | | | $ | 1,029,581 | |
| | | | | | |
| Losses and loss adjustment expenses | | $ | 795,273 | | | $ | 918,695 | | | $ | 839,717 | |
| Reinsurance recoveries | | (55,838) | | | (118,201) | | | (62,955) | |
| Net losses and loss adjustment expenses | | $ | 739,435 | | | $ | 800,494 | | | $ | 776,762 | |
The receivable from reinsurers on unpaid losses and LAE represents management’s estimated amount of future loss payments that will be recoverable under ProAssurance reinsurance agreements. Certain of the Company's reinsurance agreements base the amount of premium that is due to the reinsurer in part on losses reimbursed or to be reimbursed under the agreement, and terms may also include minimum and maximum amounts of ceded premium. Ceded premium amounts are estimated based on management’s expectation of ultimate losses and the portion of those losses that are allocable to reinsurers according to the terms of the agreements, including any minimums or maximums. Given the uncertainty of the ultimate amounts of losses, management’s estimates of losses and related amounts recoverable may vary significantly from the eventual outcome. Due to changes in management’s estimates of amounts due to reinsurers related to prior accident year loss recoveries, ProAssurance increased premiums ceded in its Specialty P&C segment by $1.4 million during the year ended December 31, 2024 and decreased premiums ceded in its Specialty P&C segment by $2.4 million and $2.8 million during the years ended December 31, 2023 and 2022, respectively.
ProAssurance Corporation and Subsidiaries
Notes to Consolidated Financial Statements
December 31, 2024
Reinsurance contracts do not relieve ProAssurance from its obligations to policyholders, and ProAssurance remains liable to its policyholders whether or not reinsurers honor their contractual obligations. ProAssurance continually monitors its reinsurers to minimize its exposure to significant losses from reinsurer insolvencies.
At December 31, 2024, the net total amounts due from reinsurers was $430.6 million (receivables related to paid and unpaid losses and LAE and prepaid reinsurance premiums, less reinsurance premiums payable). No single reinsurer had an individual balance which exceeded $55 million.
At December 31, 2024 reinsurance recoverables totaling approximately $145.5 million were collateralized by letters of credit or funds withheld. Expected credit losses associated with the Company's reinsurance receivables (related to both paid and unpaid losses) were nominal in amount as of December 31, 2024, 2023 and 2022. During the years ended December 31, 2024, 2023 or 2022, no reinsurance balances were written off for credit reasons. For further information on the Company's allowance for expected credit losses related to its receivables from reinsurers see Note 1.
5. Income Taxes
Deferred income taxes reflect the net tax effects of temporary differences between the amount of assets and liabilities for financial reporting purposes and the amounts used for income tax purposes. Significant components of ProAssurance’s deferred tax assets and liabilities were as follows:
| | | | | | | | | | | |
| December 31 |
| (In thousands) | 2024 | | 2023 |
| Deferred tax assets | | | |
| Unpaid loss discount | $ | 45,733 | | | $ | 49,189 | |
| Unearned premium adjustment | 21,319 | | | 22,031 | |
| Compensation related | 15,209 | | | 11,505 | |
| Unrealized losses on investments, net | 47,679 | | | 56,229 | |
| Basis differentials-investments | 3,578 | | | 2,018 | |
| Intangibles | 5,340 | | | 7,158 | |
| Operating lease liabilities | 3,592 | | | 3,539 | |
| | | |
| Tax credit carryforward | 47,187 | | | 53,154 | |
| Net operating loss carryforward | 22,792 | | | 30,488 | |
| | | |
| Other | — | | | 1,547 | |
| Total gross deferred tax assets | 212,429 | | | 236,858 | |
| Valuation allowance | (20,754) | | | (20,078) | |
| Total deferred tax assets, net of valuation allowance | 191,675 | | | 216,780 | |
| Deferred tax liabilities | | | |
| Deferred policy acquisition costs | (13,064) | | | (13,051) | |
| Unpaid loss discount-transition | (1,259) | | | (3,265) | |
| | | |
| Fixed assets | (1,804) | | | (2,720) | |
| Operating lease ROU assets | (3,409) | | | (3,350) | |
| | | |
| Basis differentials-foreign operations | (1,690) | | | (1,386) | |
| Intangibles | (5,693) | | | (6,844) | |
| Other | (828) | | | — | |
| Total deferred tax liabilities | (27,747) | | | (30,616) | |
| Net deferred tax assets (liabilities) | $ | 163,928 | | | $ | 186,164 | |
As of December 31, 2024, ProAssurance had U.S. Federal, U.S. state and U.K. income tax NOL carryforwards of approximately $42.4 million, $173.1 million and $25.4 million, respectively. The U.K. NOL carryforwards do not expire while the U.S. Federal and state NOL carryforwards will begin to expire in 2035 and 2031, respectively.
ProAssurance Corporation and Subsidiaries
Notes to Consolidated Financial Statements
December 31, 2024
As a result of the NORCAL acquisition, the Company has U.S. federal NOL carryforwards which as of December 31, 2024 were approximately $18.9 million. These NOL carryforwards are subject to limitation by Internal Revenue Code Section 382 and will begin to expire in 2035.
ProAssurance had $46.9 million of available tax credit carryforwards generated from the Company's investments in tax credit partnerships all of which may be carried forward until they begin to expire on December 31, 2039. For the year ended December 31, 2024, ProAssurance utilized approximately $5.9 million of tax credits carried forward from 2019.
The Company's total valuation allowance increased by $0.7 million and $1.7 million for the years ended December 31, 2024 and 2023, respectively.
In 2024 and 2023, management evaluated the realizability of the deferred tax assets related to the NOL carryforwards of the Company's Lloyd's corporate member subsidiary and concluded that it was more likely than not that the deferred tax assets will not be realized; therefore, a valuation allowance was recorded against the full value of the deferred tax assets related to the U.S. Federal and U.K. NOL carryforwards in 2024 and 2023 of $11.3 million and $12.5 million, respectively. The decrease in the valuation allowance related to the U.S. Federal and U.K. NOL carryforwards in 2024 as compared to 2023 was partially due to current year activity.
In 2024 and 2023, management evaluated the realizability of the deferred tax asset related to the U.S. state NOL carryforwards and concluded that it was more likely than not that a portion of the deferred tax asset will not be realized; therefore, a valuation allowance was recorded against a portion of the deferred tax asset related to the U.S. state NOL carryforwards in 2024 and 2023 of $8.1 million and $6.8 million, respectively. The increase in the valuation allowance related to the U.S. state NOL carryforwards in 2024 as compared to 2023 was primarily due to current year activity.
Deferred tax assets and liabilities include SPCs the Company participates in at Inova Re, net of a valuation allowance $1.4 million and $0.7 million at December 31, 2024 and 2023, respectively. Due to the cumulative losses in recent years , management concluded that a valuation allowance was required against the DTAs of certain SPCs as of December 31, 2024 and 2023.
ProAssurance files income tax returns in various states, the U.S. federal jurisdiction and the U.K. ProAssurance had a liability for U.S. federal and U.K. income taxes carried as part of other liabilities of $1.0 million and $4.0 million at December 31, 2024 and 2023, respectively.
The statute of limitations is now closed for all tax years prior to 2021.
A reconciliation of the beginning and ending amounts of unrecognized tax benefits for 2024, 2023 and 2022, were as follows:
| | | | | | | | | | | | | | | | | | | | |
| (In thousands) | | 2024 | | 2023 | | 2022 |
| Balance at January 1 | | $ | 4,791 | | | $ | 3,623 | | | $ | 3,020 | |
| | | | | | |
| | | | | | |
| Decreases for tax positions taken during the current year | | (487) | | | — | | | (99) | |
| Increases for tax positions taken during prior years | | 23 | | | 1,391 | | | 1,839 | |
| | | | | | |
| | | | | | |
| Decreases relating to a lapse of the applicable statute of limitations | | (4,148) | | | (223) | | | (1,137) | |
| Balance at December 31 | | $ | 179 | | | $ | 4,791 | | | $ | 3,623 | |
At December 31, 2024 and 2023, approximately $0.1 million and $0.9 million of ProAssurance's uncertain tax positions, if recognized, would affect the effective tax rate, respectively. As with any uncertain tax position, there is a possibility that the ultimate benefit realized could differ from the estimate management has established. Management believes that it is reasonably possible that a portion of unrecognized tax benefits at December 31, 2024 may change during the next twelve months. However, an estimate of the change cannot be made at this time.
ProAssurance recognizes interest and/or penalties related to income tax matters, if any, as a component of income tax expense. Interest and penalties recognized in the Consolidated Statements of Income and Comprehensive Income were nominal for each of the years ended December 31, 2024, 2023 and 2022. The accrued liability for interest was nominal at December 31, 2024 and approximately $0.5 million at December 31, 2023.
ProAssurance Corporation and Subsidiaries
Notes to Consolidated Financial Statements
December 31, 2024
Income tax expense (benefit) for each of the years ended December 31, 2024, 2023 and 2022 consisted of the following:
| | | | | | | | | | | | | | | | | | | | |
| (In thousands) | | 2024 | | 2023 | | 2022 |
| Provision for income taxes: | | | | | | |
| Current expense (benefit) | | | | | | |
| Federal and foreign | | $ | (2,993) | | | $ | 716 | | | $ | 793 | |
| State | | 506 | | | 507 | | | 14 | |
| Total current expense (benefit) | | (2,487) | | | 1,223 | | | 807 | |
| Deferred expense (benefit) | | | | | | |
| Federal and foreign | | 12,581 | | | (1,410) | | | (6,826) | |
| State | | 240 | | | (358) | | | 205 | |
| Total deferred expense (benefit) | | 12,821 | | | (1,768) | | | (6,621) | |
| Total income tax expense (benefit) | | $ | 10,334 | | | $ | (545) | | | $ | (5,814) | |
A reconciliation of “expected” federal income tax expense (benefit) to actual income tax expense (benefit) for each of the years ended December 31, 2024, 2023 and 2022 were as follows:
| | | | | | | | | | | | | | | | | | | | |
| (In thousands) | | 2024 | | 2023 | | 2022 |
| Computed “expected” tax expense (benefit) | | $ | 13,247 | | | $ | (8,221) | | | $ | (1,305) | |
Tax-exempt income (1) | | (1,062) | | | (1,192) | | | (1,072) | |
| Tax credits | | (32) | | | (631) | | | (4,805) | |
| Non-U.S. operating results | | 396 | | | (625) | | | (411) | |
| Tax deficiency (excess tax benefit) on share-based compensation | | 708 | | | 191 | | | 309 | |
| | | | | | |
| | | | | | |
| Change in limitation of future deductibility of certain executive compensation | | (198) | | | 932 | | | 708 | |
| | | | | | |
Non-taxable contingent consideration(2) | | (1,415) | | | (1,785) | | | (1,890) | |
Goodwill impairment(3) | | — | | | 9,263 | | | — | |
| GILTI and subpart F income | | 292 | | | 396 | | | 556 | |
| Provision-to-return and other differences | | (42) | | | 327 | | | 1,112 | |
Change in uncertain tax positions(4) | | (3,004) | | | 1,546 | | | 780 | |
| State income taxes | | 911 | | | 65 | | | 105 | |
| | | | | | |
| | | | | | |
| Non-taxable gain from life insurance proceeds | | (42) | | | (682) | | | (142) | |
| Other | | 575 | | | (129) | | | 241 | |
| Total income tax expense (benefit) | | $ | 10,334 | | | $ | (545) | | | $ | (5,814) | |
(1) Includes tax-exempt interest, dividends received deduction and change in cash surrender value of BOLI.
(2) Represents the tax impact of a decrease in the contingent consideration liability issued in connection with the NORCAL acquisition of $6.5 million and the reversal of a nominal amount of associated contingent investment banker fees accrued during purchase accounting year ended December 31, 2024 as compared to a decrease in the contingent consideration liability of $8.5 million and $9.0 million for the years ended December 31, 2023 and 2022, respectively, all of which are non-taxable. See further discussion on the contingent consideration in Note 2 and Note 8.
(3) Represents the tax impact of the impairment of non-deductible goodwill in relation to the Workers' Compensation Insurance reporting unit during the third quarter of 2023 (see further discussion on the impairment charge in Note 6).
(4) Represents the benefit for tax positions whose statute of limitations has expired.
Coronavirus Aid, Relief and Economic Security Act
In response to COVID-19, the CARES Act was signed into law on March 27, 2020 and contains several provisions for corporations and eased certain deduction limitations originally imposed by the TCJA. The CARES Act, among other things,
ProAssurance Corporation and Subsidiaries
Notes to Consolidated Financial Statements
December 31, 2024
includes temporary changes regarding the prior and future utilization of NOLs, temporary changes to the prior and future limitations on interest deductions, temporary suspension of certain payment requirements for the employer portion of Social Security taxes and the creation of certain refundable employee retention credits. As a result of the CARES Act, ProAssurance was permitted to carryback NOLs generated in tax years 2019 and 2020 for up to five years. ProAssurance generated an NOL of approximately $33.3 million from the 2020 tax year that was carried back to the 2015 tax year which resulted in a tax refund of approximately $11.7 million received in February 2023.
6. Goodwill
Goodwill is recognized in conjunction with business acquisitions as the excess of the purchase consideration for the business acquisition over the fair value of identifiable assets acquired and liabilities assumed. The fair value of identifiable assets acquired and liabilities assumed, and thus goodwill, is subject to redetermination within a measurement period of up to one year following completion of a business acquisition. See Note 1 for further information on how the Company tests goodwill for impairment.
Goodwill is tested for impairment annually or more frequently if circumstances indicate an impairment may have occurred. The date of the Company's annual goodwill impairment test is October 1. Impairment of goodwill is tested at the reporting unit level. The reporting units are: Specialty P&C, Workers' Compensation Insurance, Segregated Portfolio Cell Reinsurance, Lloyd's Syndicates and Corporate. Of the five reporting units, only the Segregated Portfolio Cell Reinsurance reporting unit has goodwill at December 31, 2024.
Interim Impairment Assessment
As discussed in Note 1, during the third quarter of 2023 ProAssurance recorded a $44.1 million charge to fully impair the goodwill in the Workers' Compensation Insurance reporting unit.
Annual Impairment Assessments
The Company performed its annual goodwill impairment assessment on October 1, 2024 and October 1, 2023. For both annual assessments, management concluded that it was not more likely than not that the fair value of the Segregated Portfolio Cell Reinsurance reporting unit was less than its carrying value as of the testing date; therefore, no further impairment testing was required.
There were no changes in the carrying amount of goodwill or accumulated impairment losses for the year ended December 31, 2024. The table below presents the changes in the carrying amount of goodwill and accumulated impairment losses by reporting unit for the year ended December 31, 2023:
| | | | | | | | | | | | | | | | | | | | | | | |
| Reporting Unit | | |
| (In thousands) | Specialty P&C | | Workers' Compensation Insurance | | Segregated Portfolio Cell Reinsurance | | Total |
| At December 31, 2023: | | | | | | | |
| Goodwill, gross | $ | 161,115 | | | $ | 44,110 | | | $ | 5,500 | | | $ | 210,725 | |
| Accumulated impairment losses* | (161,115) | | | (44,110) | | | — | | | (205,225) | |
| Goodwill, net | $ | — | | | $ | — | | | $ | 5,500 | | | $ | 5,500 | |
| | | | | | | |
| | | | | | | |
| | | | | | | |
| Goodwill, net as of January 1, 2023 | $ | — | | | $ | 44,110 | | | $ | 5,500 | | | $ | 49,610 | |
| Impairment losses | — | | | (44,110) | | | — | | | (44,110) | |
| Goodwill, net as of December 31, 2023 | $ | — | | | $ | — | | | $ | 5,500 | | | $ | 5,500 | |
| *Accumulated impairment losses include the $44.1 million impairment loss recognized in relation to the Workers' Compensation Insurance reporting unit during the third quarter of 2023 and the $161.1 million impairment loss recognized during the third quarter of 2020 in relation to the Specialty P&C reporting unit. |
7. Reserve for Losses and Loss Adjustment Expenses
The reserve for losses is established based on estimates of individual claims and actuarially determined estimates of future losses based on ProAssurance’s past loss experience, available industry data and projections as to future claims frequency, severity, inflationary trends and settlement patterns. Estimating the reserve, particularly the reserve appropriate for liability exposures, is a complex process. For a high proportion of the risks insured or reinsured by ProAssurance, claims may be resolved over an extended period of time, often five years or more, and may be subject to litigation. Estimating losses requires
ProAssurance Corporation and Subsidiaries
Notes to Consolidated Financial Statements
December 31, 2024
ProAssurance to make and revise judgments and assessments regarding multiple uncertainties over an extended period of time. As a result, the reserve estimate may vary considerably from the eventual outcome. The assumptions used in establishing ProAssurance’s reserve are regularly reviewed and updated by management as new data becomes available. Changes to estimates of previously established reserves are included in earnings in the period in which the estimate is changed.
ProAssurance believes that the methods it uses to establish reserves are reasonable and appropriate. Each year, ProAssurance uses internal actuaries to review the reserve for losses of each insurance subsidiary. ProAssurance also engages consulting actuaries to review ProAssurance claims data and provide observations regarding cost trends, rate adequacy and ultimate loss costs. The statutory filings of each insurance company with the insurance regulators must be accompanied by a consulting actuary's certification as to their respective reserves. ProAssurance considers the views of the actuaries as well as other factors, such as premium rates, historical paid and incurred loss development trends and an evaluation of the current loss environment including frequency, severity, expected effect of inflation (monetary, social and medical), general economic and social trends, and the legal and political environment in establishing the amount of its reserve for losses. ProAssurance's booked reserves as of December 31, 2024 include consideration of these factors, but the duration and degree to which these issues persist, along with potential legislative, regulatory or judicial actions, could result in significant changes to the Company's reserve estimates in future periods.
ProAssurance partitions its reserve by accident year, which is the year in which the claim becomes its liability. For claims-made policies, the insured event generally becomes a liability when the event is first reported to the Company and the policy that is in effect at that time covers the claim. For occurrence policies, the insured event becomes a liability when the event takes place even though the claim may be reported to the Company at a later date. For retroactive coverages, the insured event becomes a liability at inception of the underlying contract. As claims are incurred (reported) and claim payments are made, they are aggregated by accident year for analysis purposes. ProAssurance also partitions its reserve by reserve type: case reserves and IBNR reserves. Case reserves are established by the claims department based upon the particular circumstances of each reported claim and represent ProAssurance’s estimate of the future loss costs (often referred to as expected losses) that will be paid on reported claims. Case reserves are decremented as claim payments are made and are periodically adjusted upward or downward as estimates regarding the amount of future losses are revised; a reported loss for an individual claim equates to the case reserve at any point in time plus the claim payments that have been made to date. IBNR reserves represent an estimate, in the aggregate, of future development on losses that have been reported to ProAssurance plus an estimate of losses that have been incurred but not reported.
Acquired Reserve
The 2021 acquisition of NORCAL increased ProAssurance's net reserves by $1.1 billion which represented the fair value of NORCAL's reserve, net of the fair value of related reinsurance recoverables, at the time of acquisition including a fair value adjustment on the reserve as well as negative VOBA recorded on NORCAL's unearned premium and DDR reserve. The reserve fair value adjustment will be amortized utilizing loss payment patterns and the negative VOBAs will be amortized over a period in proportion to the earn-out of the premium or in-line with the approximate consumption of losses. Such amortization is recorded as a reduction to net losses and loss adjustment expenses.
Development of Prior Accident Years
In addition to setting the initial reserve for the current accident year, each period ProAssurance reassesses the amount of reserve required for prior accident years.
The foundation of ProAssurance’s reserve re-estimation process is an actuarial analysis that is performed by both the internal and consulting actuaries. This detailed analysis projects ultimate losses based on partitions which include line of business, geography, coverage layer and accident year. The procedure uses the most representative data for each partition, capturing its unique patterns of development and trends. ProAssurance believes that the use of consulting actuaries provides an independent view of the loss data as well as a broader perspective on industry loss trends.
Reserving Methodologies
The analyses performed by ProAssurance's internal actuarial team and its consulting actuaries analyzes each partition of the business in a variety of ways and uses multiple actuarial methodologies in performing these analyses, including: Bornhuetter-Ferguson (Paid and Reported) Method, Paid Development Method, Reported (Incurred) Development Method, Average Paid Value Method and Average Reported Value Method.
ProAssurance uses various actuarial methods in the process of setting each reserve. Each actuarial method generally returns a different value, and for the more recent accident years, the variations among the different methodologies can be significant. Generally, methods such as the Bornhuetter-Ferguson Method are used on more recent accident years where there is less data available on which to base the analysis. As time progresses and an increased amount of data is available for a given
ProAssurance Corporation and Subsidiaries
Notes to Consolidated Financial Statements
December 31, 2024
accident year, management gives more confidence to the development and average methods, as these methods typically rely more heavily on ProAssurance's own historical data. These methods emphasize different aspects of loss reserve estimation and provide a variety of perspectives for ProAssurance's decisions.
Certain of the methodologies utilized to estimate the ultimate losses for each partition of the reserve consider the actual amounts paid. Paid data is particularly influential when a large portion of known claims have been closed, as is the case for older accident years. In selecting a point estimate for each partition, management considers the extent to which trends are emerging consistently for all partitions and known industry trends. Thus, actual, rather than estimated severity trends are given more consideration. If actual severity trends are lower than those estimated at the time that reserves were previously established, the recognition of favorable development is indicated. This is particularly true for older accident years where actuarial methodologies give more weight to actual loss costs (severity).
The various actuarial methods discussed above are applied in a consistent manner from period to period. For each partition of the reserve, ProAssurance evaluates the results of the various methods, along with the supplementary statistical data regarding such factors as closed with and without indemnity ratios, claim severity trends, the expected duration of such trends, changes in the legal and legislative environment and the current economic environment to develop a point estimate based upon management's judgement and past experience. The series of selected point estimates is the combined to produce an overall point estimate for ultimate losses.
Selected point estimates of ultimate losses are utilized to develop estimates of ultimate losses recoverable from reinsurers, based on the terms and conditions of ProAssurance’s reinsurance agreements. An overall estimate of the amount receivable from reinsurers is determined by combining the individual estimates. ProAssurance’s net reserve estimate is the gross reserve point estimate less the estimated reinsurance recovery.
For the Workers’ Compensation line of business in both the Workers' Compensation Insurance and Segregated Portfolio Cell Reinsurance segments, ProAssurance utilizes the Reported (Incurred) Development Method, Paid Loss Development Method and Bornhuetter-Ferguson Method, to develop the reserve for each accident year. The actuarial review includes the stratification of claims data (lost time claims and medical only claims) using different variations that allow for identification of trends that may not be readily identifiable if the data was evaluated only in the aggregate. Reported and paid loss development factors are key assumptions in the reserve estimation process and are based on ProAssurance’s historical reported and paid loss development patterns. As accident years mature, the various actuarial methodologies produce more consistent loss estimates.
Activity in the reserve for losses and loss adjustment expenses is summarized as follows:
| | | | | | | | | | | | | | | | | |
| (In thousands) | 2024 | | 2023 | | 2022 |
| Balance, beginning of year | $ | 3,401,281 | | | $ | 3,471,147 | | | $ | 3,579,940 | |
| Less reinsurance recoverables on unpaid losses and loss adjustment expenses | 445,573 | | | 431,889 | | | 451,741 | |
| Net balance, beginning of year | 2,955,708 | | | 3,039,258 | | | 3,128,199 | |
| | | | | |
| Net losses: | | | | | |
Current year(1) | 779,650 | | | 794,848 | | | 813,515 | |
(Favorable) unfavorable development of reserves established in prior years, net(2) | (40,215) | | | 5,646 | | | (36,753) | |
| Total | 739,435 | | | 800,494 | | | 776,762 | |
| Paid related to: | | | | | |
| Current year | (113,268) | | | (101,996) | | | (108,139) | |
| Prior years | (733,248) | | | (782,048) | | | (757,564) | |
| Total paid | (846,516) | | | (884,044) | | | (865,703) | |
| Net balance, end of year | 2,848,627 | | | 2,955,708 | | | 3,039,258 | |
| Plus reinsurance recoverables on unpaid losses and loss adjustment expenses | 409,069 | | | 445,573 | | | 431,889 | |
| Balance, end of year | $ | 3,257,696 | | | $ | 3,401,281 | | | $ | 3,471,147 | |
(1) Current year net losses for the year ended December 31, 2022 included $4.9 million of purchase accounting amortization of the negative VOBA associated with NORCAL's assumed unearned premium, which was amortized over a period in proportion to the earn-out of the associated premium as a reduction to current accident year net losses. As of June 30, 2022, the negative VOBA was fully amortized.
ProAssurance Corporation and Subsidiaries
Notes to Consolidated Financial Statements
December 31, 2024
(2) Net prior accident year reserve development recognized for the years ended December 31, 2024, 2023 and 2022 included $5.3 million, $8.3 million and $10.8 million, respectively, of amortization of the purchase accounting fair value adjustment on NORCAL's assumed net reserve and amortization of the negative VOBA associated with NORCAL's DDR reserve which is recorded as a reduction to prior accident year net losses and loss adjustment expenses.
As discussed in Note 1, estimating liability reserves is complex and requires the use of many assumptions. As time passes and ultimate losses for prior years are either known or become subject to a more precise estimation, ProAssurance increases or decreases the reserve estimates established in prior periods.
The consolidated net favorable prior year reserve development recognized for the year ended December 31, 2024 primarily reflected:
•The loss environment in the MPL line of business within the Specialty P&C segment continues to be challenging in many jurisdictions, as claim costs are pressured by social inflation and higher than anticipated loss severity trends that started to reemerge in the fourth quarter of 2022. The Company continues to monitor the impact that these trends have on its open case reserves and prior accident year development. While higher loss severity trends remained challenging in 2024, the Company recognized net favorable prior year reserve development of $33.9 million in the Company's MPL line of business, principally related to accident years 2019 through 2021. Further, net favorable reserve development reflected $4.5 million of favorable development related to the Company's Medical Technology Liability line of business, partially offset by unfavorable reserve development of $6.8 million attributable to the Company's discontinued participation in Lloyd’s Syndicates operations, primarily aviation related losses.
•Consolidated net favorable loss development recognized during the year ended December 31, 2024 also included net favorable development of $2.8 million in the Segregated Portfolio Cell Reinsurance segment related to workers' compensation business of $3.1 million, principally related to accident years 2018 through 2023, partially offset by unfavorable development of $0.3 million related to medical professional liability business driven by higher than expected claim frequency in one program in which the Company does not participate in the underwriting results.
•Consolidated net favorable loss development recognized during the year ended December 31, 2024 also included net favorable development of $0.5 million in the Workers' Compensation Insurance segment reflecting overall favorable trends in claim closing patterns in accident years 2017 through 2019 and 2023.
The consolidated net unfavorable prior year reserve development recognized for the year ended December 31, 2023 primarily reflected:
•Higher than expected loss trends observed in the average cost per claim in the Workers' Compensation Insurance segment primarily attributable to the 2022 accident year. The consolidated net unfavorable loss development also reflected unfavorable development recognized during the first quarter of 2023 primarily attributable to one large claim from the 1997 accident year.
•During the first quarter of 2023, the Company strengthened case reserves related to four large MPL claims resulting in net unfavorable prior year reserve development of $10.1 million recognized during 2023. The net unfavorable prior year reserve development also reflected higher than expected loss development on certain large claims, primarily catastrophe related losses, associated with Lloyd’s Syndicates operations, partially offset by favorable prior year reserve development due to lower than anticipated loss emergence, predominately in the Medical Technology Liability line of business.
•Consolidated net unfavorable loss development recognized for the year ended December 31, 2023 was partially offset by favorable reserve development recognized in the Segregated Portfolio Cell Reinsurance segment driven by overall favorable trends in claim closing patterns primarily in accident years 2016 through 2021.
The consolidated net favorable prior year reserve development recognized for the year ended December 31, 2022 primarily reflected:
•Favorable prior year reserve development due to lower than anticipated loss emergence in the Specialty P&C segment related to the 2017, 2020 and 2021 accident years, primarily attributable to NORCAL's 2021 accident year, and, to a lesser extent, the Medical Technology Liability and MPL lines of business. The net favorable development recognized also included a $9.0 million reduction in the Company's previous IBNR reserve for COVID-19. Further, the net favorable development recognized was partially offset by higher than anticipated loss severity trends in select jurisdictions in the MPL line of business, which emerged primarily in the fourth quarter of 2022 and unfavorable development associated with Lloyd’s Syndicates operations.
•The net favorable development also reflected overall favorable trends in claim closing patterns in the Workers' Compensation Insurance and Segregated Portfolio Cell Reinsurance segments. The net favorable loss development
ProAssurance Corporation and Subsidiaries
Notes to Consolidated Financial Statements
December 31, 2024
recognized in the Workers' Compensation Insurance segment is primarily related to the 2017 through 2020 accident years. The net favorable loss development recognized in the Segregated Portfolio Cell Reinsurance segment is primarily related to the 2016 through 2021 accident years.
Claims Development
ProAssurance establishes its reserve and manages claims activity by coverage, product or line of business and various categories of reserves have similar characteristics. Therefore, ProAssurance has aggregated these reserve categories into several reserve groups in the following disclosures and tables that provide a more meaningful view of the amount, timing and uncertainty of cash flows arising from the liability. At the same time, these reserve groups present a disaggregated view of the major elements of the overall loss reserve liability. The reserve groups include MPL claims-made reserve, MPL occurrence reserve, Medical Technology Liability claims-made reserve, Workers’ Compensation Insurance reserve and Segregated Portfolio Cell Reinsurance - workers' compensation reserve. All other loss reserve categories are deemed to be less homogeneous or relatively small on a standalone basis and are included in other short-duration lines in the claims development reconciliation.
The composition of the reserve groups is based on similar characteristics with respect to the risks being insured and the reporting and payout pattern of the underlying claims. In most instances the groups follow the coverage categorizations used in statutory financial reporting for U.S.-domiciled property-casualty insurance companies.
MPL claims are disaggregated into those claims covered by claims-made policies and those claims covered by occurrence policies. Claims-made coverage has a short reporting pattern, with virtually all claims known shortly after the end of the policy period. Occurrence coverage claims can have an extended reporting pattern, with the time from the loss event until the filing of the claim often measured in years, at which point the claims resolution process begins. Although the resolution process and time frame is similar once a claim is reported, combining claims from claims-made and occurrence coverage types would result in distortion due to the difference in reporting lag. Medical Technology Liability reserves are grouped separately due to the nature of the risk, including the potential for mass torts and multiple claims arising out of the same product or service. The small amount of Medical Technology Liability occurrence reserves are included in other short-duration lines.
Workers' compensation reserves in the Workers' Compensation Insurance and the Segregated Portfolio Cell Reinsurance segments are each grouped separately due to the difference in the type of coverage provided and the differences in the claims resolution process as compared to other liability insurance. The small amount of MPL reserves in the Segregated Portfolio Cell Reinsurance segment are included in other short-duration lines.
ProAssurance has elected to present reserve history for acquired entities in all periods shown in the tables below, including periods prior to acquisition. With the exception of the Workers' Compensation Insurance and Segregated Portfolio Cell Reinsurance - workers' compensation lines of business, virtually all other acquired entities are captured within the MPL line of business.
All information prior to 2024 disclosed in the Incurred Claims and Allocated Claim Adjustment Expenses, Net of Reinsurance, Cumulative Paid Claims and Allocated Claim Adjustment Expenses, Net of Reinsurance and Average Annual Percentage Payout of Incurred Claims by Age, Net of Reinsurance tables that follow is presented as supplementary information. The “Cumulative Number of Reported Claims” in the tables that follow includes the combined number of claims for an accident year and excludes projected unreported IBNR claims. A claim is considered reported when ProAssurance becomes aware of and accepts it for coverage under the terms of the Company's insurance contracts.
ProAssurance Corporation and Subsidiaries
Notes to Consolidated Financial Statements
December 31, 2024
Medical Professional Liability Reserve
MPL loss costs are impacted by many factors, including but not limited to the nature of the claim, including whether or not the claim is an individual or a mass tort claim, the personal situation of the claimant or the claimant's family, the outcome of jury trials including the impacts of social inflation, the legislative and judicial climate where any potential litigation may occur, general economic and social conditions and, for claims involving bodily injury, the trend of healthcare costs. ProAssurance sets an initial reserve based upon the evaluation of the current loss environment including frequency, severity, the expected effect of inflation, general economic and social trends, and the legal and political environment. The initial loss ratio for MPL business has ranged from 83% to 104% in the past five years.
ProAssurance has elected to present reserve history for NORCAL in all periods shown in the Medical Professional Liability tables below, including periods prior to acquisition.
Medical Professional Liability Claims-Made | | | | | | | | | | | | | | | | | | | | | | | | | | | | | | | | | | | | | | | | | |
|
| | | | |
| Incurred Claims and Allocated Claim Adjustment Expenses, Net of Reinsurance | | December 31, 2024 |
| ($ in thousands) | Year Ended December 31 | | IBNR* | Cumulative Number of Reported Claims |
| 2015 | 2016 | 2017 | 2018 | 2019 | 2020 | 2021 | 2022 | 2023 | 2024 | |
| Accident Year | Unaudited | | |
| 2015 | $ | 503,412 | | $ | 486,760 | | $ | 492,824 | | $ | 491,180 | | $ | 500,336 | | $ | 500,550 | | $ | 503,600 | | $ | 503,628 | | $ | 504,585 | | $ | 498,249 | | | $ | 1,001 | | 7,421 | |
| 2016 | — | | $ | 484,153 | | $ | 488,349 | | $ | 507,586 | | $ | 555,416 | | $ | 554,395 | | $ | 560,840 | | $ | 557,097 | | $ | 556,531 | | 550,544 | | | $ | 5,116 | | 7,927 | |
| 2017 | — | | — | | $ | 508,072 | | $ | 506,207 | | $ | 577,401 | | $ | 569,737 | | $ | 573,570 | | $ | 557,620 | | $ | 554,336 | | 558,362 | | | $ | 5,469 | | 8,081 | |
| 2018 | — | | — | | — | | $ | 544,617 | | $ | 643,864 | | $ | 630,169 | | $ | 636,023 | | $ | 642,948 | | $ | 644,705 | | 648,246 | | | $ | (21,346) | | 8,517 | |
| 2019 | — | | — | | — | | — | | $ | 670,958 | | $ | 664,934 | | $ | 642,370 | | $ | 646,676 | | $ | 656,790 | | 653,012 | | | $ | 1,645 | | 8,476 | |
| 2020 | — | | — | | — | | — | | — | | $ | 593,994 | | $ | 574,274 | | $ | 557,651 | | $ | 601,642 | | 600,104 | | | $ | (8,655) | | 6,758 | |
| 2021 | — | | — | | — | | — | | — | | — | | $ | 527,718 | | $ | 524,468 | | $ | 508,391 | | 500,764 | | | $ | (12,560) | | 5,400 | |
| 2022 | — | | — | | — | | — | | — | | — | | — | | $ | 464,069 | | $ | 475,752 | | 476,551 | | | $ | 17,785 | | 4,907 | |
| 2023 | — | | — | | — | | — | | — | | — | | — | | — | | $ | 465,702 | | 477,274 | | | $ | 50,765 | | 4,487 | |
| 2024 | — | | — | | — | | — | | — | | — | | — | | — | | — | | 460,088 | | | $ | 249,409 | | 3,719 | |
| Total | | | | | | | | | | $ | 5,423,194 | | | | |
| * Includes expected development on reported claims |
| | | | | | | | | | | | | | | | | | | | | | | | | | | | | | | | |
| Cumulative Paid Claims and Allocated Claim Adjustment Expenses, Net of Reinsurance |
| (In thousands) | Year Ended December 31 |
| 2015 | 2016 | 2017 | 2018 | 2019 | 2020 | 2021 | 2022 | 2023 | 2024 |
| Accident Year | Unaudited | |
| 2015 | $ | 26,664 | | $ | 125,234 | | $ | 256,791 | | $ | 351,703 | | $ | 410,506 | | $ | 446,069 | | $ | 463,224 | | $ | 476,664 | | $ | 482,757 | | $ | 486,605 | |
| 2016 | — | | $ | 27,442 | | $ | 137,338 | | $ | 276,548 | | $ | 378,828 | | $ | 440,163 | | $ | 472,441 | | $ | 499,431 | | $ | 524,901 | | 525,150 | |
| 2017 | — | | — | | $ | 32,342 | | $ | 147,515 | | $ | 288,695 | | $ | 351,548 | | $ | 419,180 | | $ | 467,423 | | $ | 496,970 | | 520,794 | |
| 2018 | — | | — | | — | | $ | 34,238 | | $ | 159,657 | | $ | 279,204 | | $ | 367,522 | | $ | 450,952 | | $ | 520,383 | | 561,247 | |
| 2019 | — | | — | | — | | — | | $ | 37,755 | | $ | 144,225 | | $ | 259,889 | | $ | 364,411 | | $ | 463,007 | | 528,008 | |
| 2020 | — | | — | | — | | — | | — | | $ | 32,270 | | $ | 117,153 | | $ | 234,804 | | $ | 341,481 | | 429,227 | |
| 2021 | — | | — | | — | | — | | — | | — | | $ | 23,494 | | $ | 110,483 | | $ | 205,414 | | 286,729 | |
| 2022 | — | | — | | — | | — | | — | | — | | — | | $ | 24,792 | | $ | 103,111 | | 210,069 | |
| 2023 | — | | — | | — | | — | | — | | — | | — | | — | | $ | 26,206 | | 97,852 | |
| 2024 | — | | — | | — | | — | | — | | — | | — | | — | | — | | 27,029 | |
| Total | | | | | | | | | | 3,672,710 | |
| | | | | | | | | | |
| All outstanding liabilities before 2015, net of reinsurance | | | 19,970 | |
| Liabilities for losses and loss adjustment expenses, net of reinsurance | | | $ | 1,770,454 | |
ProAssurance Corporation and Subsidiaries
Notes to Consolidated Financial Statements
December 31, 2024
Medical Professional Liability Occurrence
| | | | | | | | | | | | | | | | | | | | | | | | | | | | | | | | | | | | | | | | | |
|
| | | | |
| Incurred Claims and Allocated Claim Adjustment Expenses, Net of Reinsurance | | December 31, 2024 |
| ($ in thousands) | Year Ended December 31 | | IBNR* | Cumulative Number of Reported Claims |
| 2015 | 2016 | 2017 | 2018 | 2019 | 2020 | 2021 | 2022 | 2023 | 2024 | |
| Accident Year | Unaudited | | |
| 2015 | $ | 52,531 | | $ | 54,890 | | $ | 56,621 | | $ | 57,606 | | $ | 52,455 | | $ | 51,276 | | $ | 56,468 | | $ | 61,198 | | $ | 57,560 | | $ | 56,817 | | | $ | 573 | | 626 | |
| 2016 | — | | $ | 56,089 | | $ | 49,795 | | $ | 53,358 | | $ | 56,345 | | $ | 66,886 | | $ | 64,122 | | $ | 68,674 | | $ | 68,079 | | 70,844 | | | $ | 1,302 | | 787 | |
| 2017 | — | | — | | $ | 45,463 | | $ | 42,338 | | $ | 40,983 | | $ | 44,449 | | $ | 46,865 | | $ | 50,652 | | $ | 50,747 | | 49,727 | | | $ | 2,551 | | 775 | |
| 2018 | — | | — | | — | | $ | 59,351 | | $ | 61,880 | | $ | 63,576 | | $ | 73,599 | | $ | 74,419 | | $ | 76,975 | | 75,255 | | | $ | 5,977 | | 752 | |
| 2019 | — | | — | | — | | — | | $ | 63,548 | | $ | 58,555 | | $ | 70,926 | | $ | 86,543 | | $ | 87,535 | | 83,533 | | | $ | 885 | | 881 | |
| 2020 | — | | — | | — | | — | | — | | $ | 165,955 | | $ | 178,804 | | $ | 181,643 | | $ | 183,767 | | 168,435 | | | $ | 37,585 | | 1,974 | |
| 2021 | — | | — | | — | | — | | — | | — | | $ | 82,590 | | $ | 81,254 | | $ | 86,436 | | 87,403 | | | $ | 7,907 | | 695 | |
| 2022 | — | | — | | — | | — | | — | | — | | — | | $ | 82,436 | | $ | 66,926 | | 64,944 | | | $ | 21,656 | | 482 | |
| 2023 | — | | — | | — | | — | | — | | — | | — | | — | | $ | 56,795 | | 58,064 | | | $ | 36,607 | | 288 | |
| 2024 | — | | — | | — | | — | | — | | — | | — | | — | | — | | 62,272 | | | $ | 59,501 | | 96 | |
| Total | | | | | | | | | | $ | 777,294 | | | | |
| * Includes expected development on reported claims |
| | | | | | | | | | | | | | | | | | | | | | | | | | | | | | | | |
| Cumulative Paid Claims and Allocated Claim Adjustment Expenses, Net of Reinsurance |
| (In thousands) | Year Ended December 31 |
| 2015 | 2016 | 2017 | 2018 | 2019 | 2020 | 2021 | 2022 | 2023 | 2024 |
| Accident Year | Unaudited | |
| 2015 | $ | (180) | | $ | 2,617 | | $ | 9,953 | | $ | 20,627 | | $ | 28,482 | | $ | 36,413 | | $ | 41,800 | | $ | 52,017 | | $ | 54,100 | | $ | 54,823 | |
| 2016 | — | | $ | 44 | | $ | 2,750 | | $ | 15,433 | | $ | 28,362 | | $ | 40,766 | | $ | 48,691 | | $ | 54,324 | | $ | 58,386 | | 60,862 | |
| 2017 | — | | — | | $ | (6,631) | | $ | (3,385) | | $ | 3,592 | | $ | 11,051 | | $ | 19,696 | | $ | 30,489 | | $ | 38,687 | | 42,585 | |
| 2018 | — | | — | | — | | $ | 444 | | $ | 6,193 | | $ | 15,229 | | $ | 26,932 | | $ | 37,828 | | $ | 49,549 | | 56,309 | |
| 2019 | — | | — | | — | | — | | $ | 628 | | $ | 4,575 | | $ | 10,399 | | $ | 26,359 | | $ | 44,758 | | 57,332 | |
| 2020 | — | | — | | — | | — | | — | | $ | 397 | | $ | 6,194 | | $ | 21,100 | | $ | 42,129 | | 54,935 | |
| 2021 | — | | — | | — | | — | | — | | — | | $ | 762 | | $ | 4,335 | | $ | 16,268 | | 30,686 | |
| 2022 | — | | — | | — | | — | | — | | — | | — | | $ | 675 | | $ | 3,329 | | 13,579 | |
| 2023 | — | | — | | — | | — | | — | | — | | — | | — | | $ | 463 | | 4,962 | |
| 2024 | — | | — | | — | | — | | — | | — | | — | | — | | — | | 469 | |
| Total | | | | | | | | | | 376,542 | |
| | | | | | | | | | |
| All outstanding liabilities before 2015, net of reinsurance | | | 7,430 | |
| Liabilities for losses and loss adjustment expenses, net of reinsurance | | | $ | 408,182 | |
| | | | | | | | | | | | | | | | | | | | | | | | | | | | | | | | |
| Average Annual Percentage Payout of Incurred Claims by Age, Net of Reinsurance |
| Years | 1 | 2 | 3 | 4 | 5 | 6 | 7 | 8 | 9 | 10 |
| Unaudited |
| Medical Professional Liability Claims-Made | 5.4% | 17.7% | 21.8% | 16.1% | 12.9% | 8.5% | 5.0% | 3.9% | 0.6% | 0.8% |
| Medical Professional Liability Occurrence | (0.9%) | 5.2% | 12.8% | 16.5% | 15.5% | 15.5% | 10.7% | 10.5% | 3.6% | 1.3% |
| | | | | | | | | | |
| | | | | | | | | | |
| | | | | | | | | | |
ProAssurance Corporation and Subsidiaries
Notes to Consolidated Financial Statements
December 31, 2024
Medical Technology Liability Reserve
The risks insured in the Medical Technology Liability line of business are more varied, and policies are individually priced based on the risk characteristics of the policy and the account. These policies often have substantial deductibles or self-insured retentions, and the insured risks range from startup operations to large multinational entities. Premiums are established using the most recently developed actuarial estimates of losses expected to be incurred based on factors which include: results from prior analysis of similar business, industry indications, observed trends and judgment. Claims in this line of business primarily involve bodily injury to individuals and are affected by factors similar to those of the MPL line of business. For the Medical Technology Liability line of business, ProAssurance also establishes an initial reserve using a loss ratio approach, including a provision in consideration of historical loss volatility that this line of business has exhibited.
Medical Technology Liability Claims-Made
| | | | | | | | | | | | | | | | | | | | | | | | | | | | | | | | | | | | | | | | | |
|
| | | | |
| Incurred Claims and Allocated Claim Adjustment Expenses, Net of Reinsurance | | December 31, 2024 |
| ($ in thousands) | Year Ended December 31 | | IBNR* | Cumulative Number of Reported Claims |
| 2015 | 2016 | 2017 | 2018 | 2019 | 2020 | 2021 | 2022 | 2023 | 2024 | |
| Accident Year | Unaudited | | |
| 2015 | $ | 9,376 | | $ | 8,757 | | $ | 7,193 | | $ | 5,929 | | $ | 5,081 | | $ | 4,664 | | $ | 4,192 | | $ | 3,499 | | $ | 4,348 | | $ | 4,568 | | | $ | 104 | | 157 | |
| 2016 | — | | $ | 9,200 | | $ | 8,467 | | $ | 7,413 | | $ | 6,422 | | $ | 6,241 | | $ | 4,491 | | $ | 5,145 | | $ | 4,721 | | 4,901 | | | $ | 157 | | 182 | |
| 2017 | — | | — | | $ | 11,049 | | $ | 10,143 | | $ | 8,306 | | $ | 4,919 | | $ | 3,381 | | $ | 5,351 | | $ | 4,349 | | 4,299 | | | $ | 227 | | 98 | |
| 2018 | — | | — | | — | | $ | 10,141 | | $ | 8,108 | | $ | 7,506 | | $ | 4,961 | | $ | 4,646 | | $ | 5,233 | | 5,483 | | | $ | 1,129 | | 216 | |
| 2019 | — | | — | | — | | — | | $ | 10,072 | | $ | 8,324 | | $ | 9,588 | | $ | 7,658 | | $ | 8,907 | | 7,332 | | | $ | 160 | | 336 | |
| 2020 | — | | — | | — | | — | | — | | $ | 11,082 | | $ | 10,671 | | $ | 9,150 | | $ | 7,949 | | 6,468 | | | $ | 2,718 | | 179 | |
| 2021 | — | | — | | — | | — | | — | | — | | $ | 13,914 | | $ | 11,909 | | $ | 9,927 | | 10,512 | | | $ | 4,192 | | 174 | |
| 2022 | — | | — | | — | | — | | — | | — | | — | | $ | 15,014 | | $ | 14,718 | | 12,160 | | | $ | 9,083 | | 181 | |
| 2023 | — | | — | | — | | — | | — | | — | | — | | — | | $ | 16,268 | | 15,543 | | | $ | 14,578 | | 249 | |
| 2024 | — | | — | | — | | — | | — | | — | | — | | — | | — | | 16,860 | | | $ | 16,420 | | 253 | |
| Total | | | | | | | | | | $ | 88,126 | | | | |
| * Includes expected development on reported claims |
| | | | | | | | | | | | | | | | | | | | | | | | | | | | | | | | |
| Cumulative Paid Claims and Allocated Claim Adjustment Expenses, Net of Reinsurance |
| (In thousands) | Year Ended December 31 |
| 2015 | 2016 | 2017 | 2018 | 2019 | 2020 | 2021 | 2022 | 2023 | 2024 |
| Accident Year | Unaudited | |
| 2015 | $ | 25 | | $ | 440 | | $ | 1,625 | | $ | 2,097 | | $ | 2,567 | | $ | 2,911 | | $ | 2,987 | | $ | 2,989 | | $ | 2,989 | | $ | 2,989 | |
| 2016 | — | | $ | 53 | | $ | 1,690 | | $ | 2,365 | | $ | 2,959 | | $ | 4,295 | | $ | 4,342 | | $ | 4,383 | | $ | 4,415 | | 4,593 | |
| 2017 | — | | — | | $ | 56 | | $ | 1,681 | | $ | 2,017 | | $ | 2,360 | | $ | 2,867 | | $ | 4,073 | | $ | 4,072 | | 4,072 | |
| 2018 | — | | — | | — | | $ | 6 | | $ | 191 | | $ | 1,850 | | $ | 2,651 | | $ | 3,065 | | $ | 4,185 | | 4,188 | |
| 2019 | — | | — | | — | | — | | $ | 584 | | $ | 2,552 | | $ | 3,902 | | $ | 5,321 | | $ | 5,700 | | 6,384 | |
| 2020 | — | | — | | — | | — | | — | | $ | 40 | | $ | 526 | | $ | 1,034 | | $ | 2,412 | | 3,584 | |
| 2021 | — | | — | | — | | — | | — | | — | | $ | 4 | | $ | 384 | | $ | 3,374 | | 3,816 | |
| 2022 | — | | — | | — | | — | | — | | — | | — | | $ | 24 | | $ | 500 | | 2,128 | |
| 2023 | — | | — | | — | | — | | — | | — | | — | | — | | $ | — | | 129 | |
| 2024 | — | | — | | — | | — | | — | | — | | — | | — | | — | | 35 | |
| Total | | | | | | | | | | 31,918 | |
| | | | | | | | | | |
| All outstanding liabilities before 2015, net of reinsurance | | | 103 | |
| Liabilities for losses and loss adjustment expenses, net of reinsurance | | | $ | 56,311 | |
| | | | | | | | | | | | | | | | | | | | | | | | | | | | | | | | |
| Average Annual Percentage Payout of Incurred Claims by Age, Net of Reinsurance |
| Years | 1 | 2 | 3 | 4 | 5 | 6 | 7 | 8 | 9 | 10 |
| Unaudited |
| Medical Technology Liability | 1.2 | % | 14.0 | % | 18.2 | % | 12.8 | % | 13.4 | % | 13.3 | % | 0.6 | % | 0.2 | % | 1.8 | % | — | % |
| | | | | | | | | | |
| | | | | | | | | | |
| | | | | | | | | | |
| | | | | | | | | | |
| | | | | | | | | | |
| | | | | | | | | | |
| | | | | | | | | | |
| | | | | | | | | | |
| | | | | | | | | | |
| | | | | | | | | | |
| | | | | | | | | | |
| | | | | | | | | | |
| | | | | | | | | | |
ProAssurance Corporation and Subsidiaries
Notes to Consolidated Financial Statements
December 31, 2024
Workers' Compensation Insurance Reserve
Many factors affect the ultimate losses incurred for the workers' compensation coverages in the Workers' Compensation Insurance segment including, but not limited to, the type and severity of the injury, the age and occupation of the injured worker, the estimated length of disability, medical treatment and related costs, and the jurisdiction and workers' compensation laws of the injury occurrence. ProAssurance uses various actuarial methodologies in developing the workers’ compensation reserve combined with a review of the exposure base generally based upon payroll of the insured. For the current accident year, given the lack of seasoned information, the different actuarial methodologies produce results with considerable variability; therefore, more emphasis is placed on supplementing results from the actuarial methodologies with trends in exposure base, medical expense inflation, general inflation, severity, and claim counts, among other things, to select an expected loss ratio.
Workers' Compensation Insurance
| | | | | | | | | | | | | | | | | | | | | | | | | | | | | | | | | | | | | | | | | |
|
| | | | |
| Incurred Claims and Allocated Claim Adjustment Expenses, Net of Reinsurance | | December 31, 2024 |
| ($ in thousands) | Year Ended December 31 | | IBNR* | Cumulative Number of Reported Claims |
| 2015 | 2016 | 2017 | 2018 | 2019 | 2020 | 2021 | 2022 | 2023 | 2024 | |
| Accident Year | Unaudited | | |
| 2015 | $ | 100,101 | | $ | 100,454 | | $ | 98,454 | | $ | 97,654 | | $ | 96,354 | | $ | 93,054 | | $ | 91,840 | | $ | 90,547 | | $ | 90,362 | | $ | 90,190 | | | $ | — | | 16,551 | |
| 2016 | — | | $ | 101,348 | | $ | 97,348 | | $ | 92,148 | | $ | 84,799 | | $ | 82,799 | | $ | 80,751 | | $ | 78,808 | | $ | 78,892 | | 78,889 | | | $ | — | | 15,979 | |
| 2017 | — | | — | | $ | 99,874 | | $ | 99,874 | | $ | 99,874 | | $ | 97,874 | | $ | 95,674 | | $ | 92,715 | | $ | 92,000 | | 91,411 | | | $ | 75 | | 16,085 | |
| 2018 | — | | — | | — | | $ | 118,095 | | $ | 118,095 | | $ | 120,095 | | $ | 120,095 | | $ | 120,056 | | $ | 119,086 | | 118,249 | | | $ | 136 | | 18,017 | |
| 2019 | — | | — | | — | | — | | $ | 115,852 | | $ | 115,852 | | $ | 115,352 | | $ | 112,534 | | $ | 111,296 | | 110,159 | | | $ | 147 | | 17,531 | |
| 2020 | — | | — | | — | | — | | — | | $ | 102,475 | | $ | 102,475 | | $ | 101,621 | | $ | 100,486 | | 100,608 | | | $ | 143 | | 14,529 | |
| 2021 | — | | — | | — | | — | | — | | — | | $ | 105,722 | | $ | 108,722 | | $ | 112,606 | | 112,642 | | | $ | 398 | | 15,497 | |
| 2022 | — | | — | | — | | — | | — | | — | | — | | $ | 104,675 | | $ | 112,858 | | 113,386 | | | $ | 751 | | 15,154 | |
| 2023 | — | | — | | — | | — | | — | | — | | — | | — | | $ | 114,013 | | 112,931 | | | $ | 7,000 | | 15,087 | |
| 2024 | — | | — | | — | | — | | — | | — | | — | | — | | — | | 116,609 | | | $ | 39,400 | | 15,260 | |
| Total | | | | | | | | | | $ | 1,045,074 | | | | |
| * Includes expected development on reported claims |
| | | | | | | | | | | | | | | | | | | | | | | | | | | | | | | | |
| Cumulative Paid Claims and Allocated Claim Adjustment Expenses, Net of Reinsurance |
| (In thousands) | Year Ended December 31 |
| 2015 | 2016 | 2017 | 2018 | 2019 | 2020 | 2021 | 2022 | 2023 | 2024 |
| Accident Year | Unaudited | |
| 2015 | $ | 32,078 | | $ | 65,070 | | $ | 78,947 | | $ | 83,483 | | $ | 86,528 | | $ | 87,884 | | $ | 88,476 | | $ | 89,089 | | $ | 89,212 | | $ | 89,314 | |
| 2016 | — | | $ | 28,377 | | $ | 58,192 | | $ | 69,237 | | $ | 74,886 | | $ | 76,954 | | $ | 77,546 | | $ | 77,265 | | $ | 77,575 | | 77,757 | |
| 2017 | — | | — | | $ | 31,586 | | $ | 70,333 | | $ | 82,289 | | $ | 87,129 | | $ | 88,504 | | $ | 88,953 | | $ | 89,421 | | 89,931 | |
| 2018 | — | | — | | — | | $ | 41,619 | | $ | 86,063 | | $ | 104,216 | | $ | 110,928 | | $ | 114,525 | | $ | 115,792 | | 116,256 | |
| 2019 | — | | — | | — | | — | | $ | 40,994 | | $ | 84,108 | | $ | 100,373 | | $ | 105,724 | | $ | 107,525 | | 107,945 | |
| 2020 | — | | — | | — | | — | | — | | $ | 32,447 | | $ | 74,532 | | $ | 90,174 | | $ | 95,213 | | 97,114 | |
| 2021 | — | | — | | — | | — | | — | | — | | $ | 39,634 | | $ | 81,499 | | $ | 98,292 | | 103,578 | |
| 2022 | — | | — | | — | | — | | — | | — | | — | | $ | 38,734 | | $ | 85,584 | | 101,291 | |
| 2023 | — | | — | | — | | — | | — | | — | | — | | — | | $ | 38,921 | | 85,066 | |
| 2024 | — | | — | | — | | — | | — | | — | | — | | — | | — | | 39,056 | |
| Total | | | | | | | | | | 907,308 | |
| | | | | | | | | | |
| All outstanding liabilities before 2015, net of reinsurance | | | 4,004 | |
| Liabilities for losses and loss adjustment expenses, net of reinsurance | | | $ | 141,770 | |
| | | | | | | | | | | | | | | | | | | | | | | | | | | | | | | | |
| Average Annual Percentage Payout of Incurred Claims by Age, Net of Reinsurance |
| Years | 1 | 2 | 3 | 4 | 5 | 6 | 7 | 8 | 9 | 10 |
| Unaudited |
| Workers' Compensation Insurance | 34.8 | % | 39.4 | % | 14.6 | % | 5.4 | % | 2.3 | % | 0.8 | % | 0.3 | % | 0.5 | % | 0.2 | % | 0.1 | % |
| | | | | | | | | | |
| | | | | | | | | | |
| | | | | | | | | | |
ProAssurance Corporation and Subsidiaries
Notes to Consolidated Financial Statements
December 31, 2024
Segregated Portfolio Cell Reinsurance - Workers' Compensation Reserve
The Company estimates and reserves for the workers' compensation business assumed by the Segregated Portfolio Cell Reinsurance segment in the same manner as for its workers' compensation business in the Workers' Compensation Insurance segment, as previously discussed.
Segregated Portfolio Cell Reinsurance - Workers' Compensation
| | | | | | | | | | | | | | | | | | | | | | | | | | | | | | | | | | | | | | | | | |
|
| | | | |
| Incurred Claims and Allocated Claim Adjustment Expenses, Net of Reinsurance | | December 31, 2024 |
| ($ in thousands) | Year Ended December 31 | | IBNR* | Cumulative Number of Reported Claims |
| 2015 | 2016 | 2017 | 2018 | 2019 | 2020 | 2021 | 2022 | 2023 | 2024 | |
| Accident Year | Unaudited | | |
| 2015 | $ | 36,423 | | $ | 32,519 | | $ | 28,746 | | $ | 27,548 | | $ | 26,720 | | $ | 26,121 | | $ | 25,566 | | $ | 25,575 | | $ | 25,528 | | $ | 25,432 | | | $ | — | | 4,949 | |
| 2016 | — | | $ | 37,601 | | $ | 34,055 | | $ | 30,998 | | $ | 29,424 | | $ | 28,437 | | $ | 28,411 | | $ | 28,175 | | $ | 27,873 | | 27,740 | | | $ | — | | 5,327 | |
| 2017 | — | | — | | $ | 42,725 | | $ | 38,594 | | $ | 34,246 | | $ | 32,879 | | $ | 32,763 | | $ | 32,514 | | $ | 32,544 | | 32,552 | | | $ | 122 | | 5,707 | |
| 2018 | — | | — | | — | | $ | 43,654 | | $ | 41,283 | | $ | 40,017 | | $ | 38,569 | | $ | 38,197 | | $ | 37,376 | | 36,951 | | | $ | 215 | | 6,342 | |
| 2019 | — | | — | | — | | — | | $ | 48,505 | | $ | 42,345 | | $ | 38,815 | | $ | 37,490 | | $ | 36,608 | | 36,562 | | | $ | 334 | | 6,157 | |
| 2020 | — | | — | | — | | — | | — | | $ | 40,094 | | $ | 38,602 | | $ | 36,107 | | $ | 34,924 | | 34,547 | | | $ | 362 | | 5,795 | |
| 2021 | — | | — | | — | | — | | — | | — | | $ | 39,510 | | $ | 37,185 | | $ | 34,518 | | 33,227 | | | $ | 631 | | 5,182 | |
| 2022 | — | | — | | — | | — | | — | | — | | — | | $ | 37,978 | | $ | 38,811 | | 38,417 | | | $ | 1,752 | | 4,714 | |
| 2023 | — | | — | | — | | — | | — | | — | | — | | — | | $ | 35,305 | | 35,062 | | | $ | 3,784 | | 4,063 | |
| 2024 | — | | — | | — | | — | | — | | — | | — | | — | | — | | 34,348 | | | $ | 11,749 | | 3,769 | |
| Total | | | | | | | | | | $ | 334,838 | | | | |
| * Includes expected development on reported claims |
| | | | | | | | | | | | | | | | | | | | | | | | | | | | | | | | |
| Cumulative Paid Claims and Allocated Claim Adjustment Expenses, Net of Reinsurance |
| (In thousands) | Year Ended December 31 |
| 2015 | 2016 | 2017 | 2018 | 2019 | 2020 | 2021 | 2022 | 2023 | 2024 |
| Accident Year | Unaudited | |
| 2015 | $ | 11,257 | | $ | 21,706 | | $ | 23,977 | | $ | 24,781 | | $ | 25,033 | | $ | 25,125 | | $ | 25,144 | | $ | 25,266 | | $ | 25,300 | | $ | 25,316 | |
| 2016 | — | | $ | 10,980 | | $ | 23,003 | | $ | 26,285 | | $ | 27,162 | | $ | 27,211 | | $ | 27,585 | | $ | 27,583 | | $ | 27,640 | | 27,646 | |
| 2017 | — | | — | | $ | 12,404 | | $ | 24,791 | | $ | 28,853 | | $ | 31,140 | | $ | 31,631 | | $ | 31,875 | | $ | 31,904 | | 31,985 | |
| 2018 | — | | — | | — | | $ | 12,517 | | $ | 27,501 | | $ | 33,236 | | $ | 35,575 | | $ | 36,010 | | $ | 36,117 | | 36,229 | |
| 2019 | — | | — | | — | | — | | $ | 15,100 | | $ | 29,604 | | $ | 33,314 | | $ | 34,829 | | $ | 35,323 | | 35,426 | |
| 2020 | — | | — | | — | | — | | — | | $ | 11,238 | | $ | 26,626 | | $ | 30,680 | | $ | 32,961 | | 33,623 | |
| 2021 | — | | — | | — | | — | | — | | — | | $ | 12,465 | | $ | 26,495 | | $ | 30,441 | | 31,671 | |
| 2022 | — | | — | | — | | — | | — | | — | | — | | $ | 13,420 | | $ | 28,749 | | 33,265 | |
| 2023 | — | | — | | — | | — | | — | | — | | — | | — | | $ | 11,304 | | 24,947 | |
| 2024 | — | | — | | — | | — | | — | | — | | — | | — | | — | | 13,553 | |
| Total | | | | | | | | | | 293,661 | |
| | | | | | | | | | |
| All outstanding liabilities before 2015, net of reinsurance | | | 392 | |
| Liabilities for losses and loss adjustment expenses, net of reinsurance | | | $ | 41,569 | |
| | | | | | | | | | | | | | | | | | | | | | | | | | | | | | | | |
| Average Annual Percentage Payout of Incurred Claims by Age, Net of Reinsurance |
| Years | 1 | 2 | 3 | 4 | 5 | 6 | 7 | 8 | 9 | 10 |
| Unaudited |
| Segregated Portfolio Cell Reinsurance - workers' compensation | 37.4 | % | 40.9 | % | 11.8 | % | 4.9 | % | 1.1 | % | 0.6 | % | 0.1 | % | 0.3 | % | 0.1 | % | 0.1 | % |
| | | | | | | | | | |
| | | | | | | | | | |
| | | | | | | | | | |
ProAssurance Corporation and Subsidiaries
Notes to Consolidated Financial Statements
December 31, 2024
Below is a reconciliation of the claims development information to the Consolidated Balance Sheet:
| | | | | | |
| |
| (In thousands) | December 31, 2024 | |
| Net outstanding liabilities | | |
| Medical Professional Liability claims-made | $ | 1,770,454 | | |
| Medical Professional Liability occurrence | 408,182 | | |
| Medical Technology Liability claims-made | 56,311 | | |
| Workers' Compensation Insurance | 141,770 | | |
| Segregated Portfolio Cell Reinsurance - workers' compensation | 41,569 | | |
| | |
| | |
| | |
| Other short-duration lines | 187,880 | | |
| Liabilities for losses and loss adjustment expenses, net of reinsurance | 2,606,166 | | |
| | |
| Reinsurance recoverable on unpaid losses | | |
| Medical Professional Liability claims-made | 212,272 | | |
| Medical Professional Liability occurrence | 52,524 | | |
| Medical Technology Liability claims-made | 38,197 | | |
| Workers' Compensation Insurance | 39,118 | | |
| Segregated Portfolio Cell Reinsurance - Workers' Compensation | 25,789 | | |
| | |
| | |
| | |
| Other short-duration lines | 41,169 | | |
| Total reinsurance recoverable on unpaid losses and loss adjustment expenses | 409,069 | | |
| | |
| Reserve for the future utilization of the DDR benefit | 101,151 | | |
| Unallocated loss adjustment expenses | 120,965 | | |
| Annual Aggregate Deductible | 8,965 | | |
Loss portfolio transfer (1) | 1,592 | | |
Purchase accounting adjustments (2) | 9,783 | | |
| Other | 5 | | |
| 242,461 | | |
| Gross liability for losses and loss adjustment expenses | $ | 3,257,696 | | |
(1) Represents the reserve for retroactive coverages, net of any applicable deferred gains, related to the loss portfolio transfer entered into during 2019. | |
(2) Represents the remaining unamortized fair value adjustment on the net reserve for losses and loss adjustment expenses, the negative net VOBA recorded on the assumed unearned premium and negative VOBA recorded on the DDR reserve associated with the Company's acquisition of NORCAL. |
| |
8. Commitments and Contingencies
ProAssurance is involved in various legal actions related to insurance policies and claims handling including, but not limited to, claims asserted by policyholders. These types of legal actions arise in the Company's ordinary course of business and, in accordance with GAAP for insurance entities, are considered as a part of the Company's loss reserving process, which is described in detail under the heading "Losses and Loss Adjustment Expenses" in the Accounting Policies section in Note 1. ProAssurance also has other direct actions against the Company unrelated to its claims activity which are evaluated and accounted for as a part of other liabilities. For these corporate legal actions, the Company evaluates each case separately and establishes what it believes is an appropriate reserve based on GAAP guidance related to contingent liabilities. As of December 31, 2024, there were no material reserves established for corporate legal actions.
ProAssurance has entered into financial instrument transactions that may present off-balance sheet credit risk or market risk. These transactions include a short-term loan commitment and commitments to provide funding to non-public investment entities. Under the short-term loan commitment, ProAssurance has agreed to advance funds on a 30 day basis to a counterparty provided there is no violation of any condition established in the contract. As of December 31, 2024, ProAssurance had total funding commitments related to non-public investment entities as well as the short-term loan commitment of approximately $172.1 million which included the amount at risk if the full short-term loan is extended and the counterparties default.
ProAssurance Corporation and Subsidiaries
Notes to Consolidated Financial Statements
December 31, 2024
However, the credit risk associated with the short-term loan commitment is minimal as the counterparties to the contract are highly rated commercial institutions and to-date have been performing in accordance with their contractual obligations. As such, ProAssurance’s expected credit losses associated with this short-term loan commitment were nominal in amount as of December 31, 2024.
The purchase consideration in the 2021 NORCAL acquisition included contingent consideration. NORCAL policyholders who elected to receive NORCAL stock and tender it to ProAssurance were eligible for a share of contingent consideration in an amount of up to approximately $84 million. As defined in the purchase agreement, the contingent consideration was dependent upon the after-tax development of NORCAL's ultimate net losses for accident years ended on or before December 31, 2020 determined as of December 31, 2023 by a mutually agreed upon independent actuarial consultant. In June 2024, the independent actuarial consulting firm completed its estimate, and based on that estimate no additional consideration was due. The Committee appointed by NORCAL prior to the close of the acquisition reviewed the work of the independent actuarial consultant and accepted the conclusion that no additional consideration was due; therefore, the liability was reduced to zero as of June 30, 2024. As of December 31, 2023, the contingent consideration liability was $6.5 million carried at fair value utilizing a stochastic model. As of December 31, 2023, the remaining uncertainty around the analysis to be performed by the independent actuary was a significant component in the determination of the fair value of the liability. See further discussion around the contingent consideration in Note 2.
9. Leases
ProAssurance is involved in a number of operating leases that are primarily for office facilities. Office facility leases have remaining lease terms ranging from one year to seven years; some of which include options to extend the leases for up to ten years, and some of which include an option to terminate the lease within one year. ProAssurance subleases certain office facilities to third parties and classifies these leases as operating leases.
The following table provides a summary of the components of net lease expense as well as the reporting location in the Consolidated Statements of Income and Comprehensive Income for the years ended December 31, 2024, 2023 and 2022.
| | | | | | | | | | | | | | |
| (In thousands) | Location in the Consolidated Statements of Income and Comprehensive Income | Year Ended December 31 |
| 2024 | 2023 | 2022 |
Operating lease expense (1) | Operating expense | $ | 3,636 | | $ | 4,546 | | $ | 5,395 | |
Sublease income (2) | Other income | (288) | | (396) | | (469) | |
| Net lease expense | | $ | 3,348 | | $ | 4,150 | | $ | 4,926 | |
| |
| |
(1) Includes short-term lease costs and variable lease costs, if applicable. For the years ended December 31, 2024 and 2022, no short-term lease costs were recognized and variable lease costs were nominal in amount. We recognized a nominal amount of short-term lease costs and variable lease costs for the year ended December 31, 2023.
(2) Sublease income excludes rental income from owned properties of $2.8 million for each of the years ended December 31, 2024 and 2023 and $2.6 million during the year ended December 31, 2022 which is included in other income. See “Item 2. Properties” for a listing of currently owned properties.
The following table provides supplemental lease information for operating leases on the Consolidated Balance Sheet as of December 31, 2024 and December 31, 2023.
| | | | | | | | | |
| Year Ended December 31 | |
| ($ in thousands) | 2024 | 2023 | |
| Operating lease ROU assets | $ | 16,514 | | $ | 16,275 | | |
| Operating lease liabilities | $ | 17,390 | | $ | 17,179 | | |
| Weighted-average remaining lease term | 6.25 years | 7.17 years | |
| Weighted-average discount rate | 3.57 | % | 3.42 | % | |
ProAssurance Corporation and Subsidiaries
Notes to Consolidated Financial Statements
December 31, 2024
The following table provides supplemental lease information for the Consolidated Statements of Cash Flows for the years ended December 31, 2024, 2023 and 2022.
| | | | | | | | | | | | | | |
| Year Ended December 31 | | |
| (In thousands) | 2024 | 2023 | 2022 | | | |
| Cash paid for amounts included in the measurement of lease liabilities: | | | | | | |
| Operating cash flows from operating leases | $ | 3,564 | | $ | 4,573 | | $ | 5,574 | | | | |
| | | | | | |
| | | | | | |
The following table is a schedule of remaining future minimum lease payments for operating leases that had an initial or remaining non-cancellable lease term in excess of one year as of December 31, 2024. Operating lease payments exclude $1.2 million of total future minimum lease payments for a lease signed but not yet commenced as of December 31, 2024. This lease will commence in the second quarter of 2025 with a lease term of approximately five years.
| | | | | |
| (In thousands) | |
| 2025 | $ | 3,307 | |
| 2026 | 3,241 | |
| 2027 | 3,274 | |
| 2028 | 2,910 | |
| 2029 | 2,474 | |
| Thereafter | 4,209 | |
| Total future minimum lease payments | 19,415 | |
| Less: Imputed interest | 2,025 | |
| Total operating lease liabilities | $ | 17,390 | |
10. Debt
ProAssurance’s outstanding debt consisted of the following:
| | | | | | | | | | | |
| ($ in thousands) | December 31,
2024 | | December 31,
2023 |
| | | |
| Contribution Certificates due 2031, interest at 3.0% (effective interest rate at 3.88%) paid annually in April | $ | 181,163 | | | $ | 179,387 | |
| Revolving Credit Agreement, outstanding borrowings are not permitted to exceed $300 million aggregately, including a $50 million accordion feature; Revolving Credit Agreement expires in 2028. The effective interest rate was 6.30% as of December 31, 2024. | 125,000 | | | 125,000 | |
| Term Loan, principal repayments in quarterly installments began June 30, 2024; Term Loan expires in 2028. The effective interest rate was 6.43% as of December 31, 2024. | 120,313 | | | 125,000 | |
| Total principal | 426,476 | | | 429,387 | |
| Less unamortized debt issuance costs | 1,603 | | | 2,254 | |
| Debt less unamortized debt issuance costs | $ | 424,873 | | | $ | 427,133 | |
Contribution Certificates
On May 5, 2021, NORCAL Insurance Company, successor to NORCAL Mutual Insurance Company, issued Contribution Certificates, which are due in 2031, to certain NORCAL policyholders in the conversion. The Contribution Certificates have a principal amount of $191 million and were recorded at their fair value of $175 million at the date of the NORCAL acquisition. The difference of $16 million between the recorded acquisition date fair value and the principal balance of the Contribution Certificates will be accreted utilizing the effective interest method over the term of the certificates of ten years as an increase to interest expense. In addition, interest payments are subject to deferral if ProAssurance does not receive permission from the California Department of Insurance prior to payment. ProAssurance received permission from the California Department of Insurance to pay the annual interest payment, which was paid in April 2024. There are no financial covenants associated with the Contribution Certificates.
Revolving Credit Agreement and Term Loan
The Revolving Credit Agreement, which expires April 2028, includes a $125 million delayed draw term loan ("Term Loan"). The Term Loan is available to be drawn during a five year period after closing, subject to customary borrowing
ProAssurance Corporation and Subsidiaries
Notes to Consolidated Financial Statements
December 31, 2024
conditions. The Revolving Credit Agreement may be used for general corporate purposes, including, but not limited to, short-term working capital, share repurchases as authorized by the Board and support for other activities. ProAssurance's Revolving Credit Agreement permits borrowings up to $250 million and has available a $50 million accordion feature which, if successfully subscribed, would expand the permitted borrowings to a maximum of $300 million. The Revolving Credit Agreement permits ProAssurance to borrow, repay and reborrow from the lenders during the term of the Revolving Credit Agreement.
All borrowings are required to be repaid prior to the expiration date of the Revolving Credit Agreement. ProAssurance is required to pay a commitment fee, ranging from 0.20% to 0.45% based on ProAssurance’s debt to capitalization ratio, on the average unused portion of the Revolving Credit Agreement during the term of the agreement. Borrowings under the agreements may be secured or unsecured and accrue interest at a selected base rate, adjusted by a margin, which can vary from 0% to 2.375%, based on ProAssurance’s debt to capitalization ratio and whether the borrowing is secured or unsecured. The base rate selected may either be the current one-, three- or six-month SOFR, with the SOFR term selected fixing the interest period for which the rate is effective. If no selection is made, the base rate defaults to the highest of (1) Zero, (2) the Prime rate, (3) the Federal Funds rate plus 0.5% or (4) the one-month SOFR Adjusted Screen Rate plus 1.0%, determined daily. Rates are reset each successive interest period until the borrowing is repaid.
The Revolving Credit Agreement contains customary representations, covenants and events constituting default, and remedies for default. Additionally, the agreement carries the following financial covenants:
(1)ProAssurance is not permitted to have a leverage ratio of consolidated funded indebtedness (principally, obligations for borrowed money, obligations evidenced by instruments such as notes or acceptances, standby and commercial letters of credit, and contingent obligations) to consolidated total capitalization (principally, total non-trade liabilities on a consolidated basis plus consolidated shareholders’ equity, exclusive of AOCI) greater than 0.35 to 1.0, determined at the end of each fiscal quarter.
(2)ProAssurance is required to maintain a minimum net worth, excluding AOCI, of at least $912 million.
(3)ProAssurance is required to maintain minimum liquidity, which will include cash, securities, and capacity on its revolving line, of at least $25 million.
ProAssurance is currently in compliance with all covenants of the Revolving Credit Agreement.
11. Derivatives
ProAssurance is exposed to certain risks relating to its ongoing business and investment activities. ProAssurance utilizes derivative instruments as part of its risk management strategy to reduce the market risk related to fluctuations in future interest rates associated with a portion of its variable-rate debt. ProAssurance also uses derivative instruments to mitigate foreign exchange exposure related to fluctuations in exchange rates associated with foreign currency denominated available-for-sale fixed maturities and loss reserves. See Note 1 for the Company's accounting policy regarding derivative instruments.
To manage the Company's exposure to variability in cash flows of forecasted interest payments attributable to variability in the selected base rates on borrowings under both the Revolving Credit Agreement and Term Loan, ProAssurance entered into two forward-starting interest rate swap agreements ("Interest Rate Swaps") on May 2, 2023, each with an effective date of December 29, 2023 and a maturity date of March 31, 2028. As ProAssurance's Interest Rate Swaps are designated and qualify as highly effective cash flow hedges, changes in the fair value of the Interest Rate Swaps are recorded in AOCI, net of tax, and are reclassified into earnings when the hedged cash flows impact earnings. The Interest Rate Swap hedging the variability in cash flows associated with interest payments on the Revolving Credit Agreement will have a constant $125 million notional amount throughout the term of the swap, while the Interest Rate Swap hedging the variability in cash flows associated with interest payments on the Term Loan will have an amortizing $125 million notional amount, which is designed to match the outstanding principal on the Term Loan throughout the term of the swap. Borrowings under the Revolving Credit Agreement and Term Loan will accrue interest at a selected base rate, adjusted by a margin. The Interest Rate Swaps effectively fix the base rate on borrowings under the Revolving Credit Agreement and Term Loan to 3.187% and 3.207%, respectively. The margin component of the interest rate, which can vary from 0% to 2.375%, will remain variable and is based on ProAssurance’s debt to capitalization ratio. As of December 31, 2024, the margin component of the interest rate on the outstanding borrowings under the Revolving Credit Agreement and Term Loan was 1.98% and 2.10%, respectively, based on ProAssurance's debt to capitalization ratio as of September 30, 2024 resulting in a total interest rate of 5.17% and 5.31%, respectively, including the effect of the Interest Rate Swaps on the base rate. Additional information regarding the Company's Revolving Credit Agreement and Term Loan is provided in Note 10.
ProAssurance Corporation and Subsidiaries
Notes to Consolidated Financial Statements
December 31, 2024
ProAssurance received cash collateral from the counterparty to secure the net present value of future cash flows associated with the Interest Rate Swaps which is reflected as a component of other liabilities on the Consolidated Balance Sheet. Those cash collateral balances were $6.7 million and $4.0 million at December 31, 2024 and 2023, respectively.
ProAssurance utilizes foreign currency forward contracts with the objective of offsetting fluctuations in exchange rates related to foreign currency denominated available-for-sale fixed maturities and loss reserves associated with the Company's strategic partnership with an international medical professional liability insurer. On October 11, 2024, ProAssurance entered into a short-term forward contract with a maturity at inception of less than three months to mitigate these foreign exchange exposures. ProAssurance has designated this foreign currency forward as an economic hedge (non-hedging instrument) of foreign currency exchange rate risk and any change in fair value of this derivative is recognized in earnings during the period of change.
The following table provides a summary of the volume and fair value position of the Company's derivative instruments as well as the reporting location in the Consolidated Balance Sheet as of December 31, 2024 and 2023.
| | | | | | | | | | | | | | | | | | | | | | | | | | | | | | |
| ($ in thousands) | December 31, 2024 | | December 31, 2023 | | |
| Derivative Instruments | Location in the Consolidated Balance Sheets | Number of Instruments | Aggregate Notional Amount(1) | Estimated Fair Value(2) | | Number of Instruments | Aggregate Notional Amount(1) | Estimated Fair Value(2) | | | | |
| Cash Flow Hedge- Interest Rate Swaps | Other Assets | 2 | $245,313 | $5,801 | | 2 | $250,000 | $3,876 | | | | |
| Foreign Currency Forward | Other Assets | 1 | $5,470 | $293 | | — | $— | $— | | | | |
| | | | | | | | | | | | |
(1) Volume is represented by the derivative instruments' notional amount.
(2) Additional information regarding the fair value of the Company's Interest Rate Swaps and foreign currency forward is provided in Note 2.
For the years ended December 31, 2024 and 2023, ProAssurance reclassified a gain on the Interest Rate Swaps from AOCI, net of tax, into earnings as shown in the table below:
| | | | | | | | | | | | | | |
| | Qualifying Cash Flow Hedges - Gains (Losses) Reclassified from AOCI, net of tax, to Earnings |
| (In thousands) | Year Ended December 31 |
| Derivatives Designated as Hedging Instruments | Location in the Consolidated Statements of Income and Comprehensive Income | 2024 | 2023 | 2022 |
| Cash Flow Hedge- Interest Rate Swaps | Interest Expense | $ | 3,892 | | $ | 36 | | $ | — | |
| | | | |
At December 31, 2024, management estimates that it will reclassify approximately $2.2 million of pre-tax net gains on the Interest Rate Swaps from AOCI to earnings over the next twelve months, which will be recorded to interest expense. See additional information on gains or losses related to the Interest Rate Swaps reported as a component of AOCI in Note 12.
The following table presents the pre-tax impact of the change in the fair value of the foreign currency forward and the reporting location in the Consolidated Statements of Income and Comprehensive Income for the year ended December 31, 2024.
| | | | | | | | | | | | | | |
| | |
| (In thousands) | Year Ended December 31 |
| Derivatives not Designated as Hedging Instruments | Location in the Consolidated Statements of Income and Comprehensive Income | 2024 | 2023 | 2022 |
| Foreign Currency Forward | Other Income (Expense) | $ | 293 | | $ | — | | $ | — | |
As a result of the utilization of derivative instruments, ProAssurance is exposed to risk that the counterparties will fail to meet their contractual obligations. To mitigate this counterparty credit risk, ProAssurance only enters into derivative contracts with carefully selected major financial institutions based upon their credit ratings and monitors their creditworthiness. As of December 31, 2024, the counterparty involved with the Interest Rate Swaps had an investment grade rating of A and the counterparty involved with the foreign currency forward had an investment grade rating of BBB. Each counterparty has performed in accordance with their contractual obligations.
ProAssurance Corporation and Subsidiaries
Notes to Consolidated Financial Statements
December 31, 2024
12. Shareholders’ Equity
At December 31, 2024 and 2023, ProAssurance had 100 million shares of authorized common stock and 50 million shares of authorized preferred stock. The Board has the authority to determine provisions for the issuance of preferred shares, including the number of shares to be issued, the designations, powers, preferences and rights, and the qualifications, limitations or restrictions of such shares.
The following is a summary of changes in common shares issued and outstanding during the years ended December 31, 2024, 2023 and 2022:
| | | | | | | | | | | | | | | | | |
| (In thousands) | 2024 | | 2023 | | 2022 |
| Issued and outstanding shares - January 1 | 50,970 | | | 53,964 | | | 53,984 | |
| Repurchase of shares, at cost of $50.5 million and $3.3 million for 2023 and 2022, respectively | — | | | (3,143) | | | (139) | |
| Shares issued due to vesting of share-based compensation awards | 158 | | | 61 | | | 66 | |
Other shares issued for compensation* | 29 | | | 88 | | | 53 | |
| Issued and outstanding shares - December 31 | 51,157 | | | 50,970 | | | 53,964 | |
| * Shares issued were valued at fair value (the market price of a ProAssurance common share on the date of issue). |
As of December 31, 2024, approximately 1.6 million of authorized common shares were reserved for the issuance of currently outstanding restricted share and performance share unit awards under the incentive compensation plans described in Note 13.
ProAssurance declared cash dividends during 2024, 2023 and 2022 as follows:
| | | | | | | | | | | | | | | | | | | | |
| | Cash Dividends Declared, per Share |
| | 2024 | | 2023 | | 2022 |
| First Quarter | | $ | — | | | $ | 0.05 | | | $ | 0.05 | |
| Second Quarter | | $ | — | | | $ | — | | | $ | 0.05 | |
| Third Quarter | | $ | — | | | $ | — | | | $ | 0.05 | |
| Fourth Quarter | | $ | — | | | $ | — | | | $ | 0.05 | |
| | | | | | |
Quarterly dividends were paid in the month following the quarter in which they were declared. Dividends declared totaled $2.7 million and $10.8 million during 2023 and 2022, respectively.
ProAssurance's ability to pay dividends to its shareholders is limited by its holding company structure, to the extent of the net assets held by its insurance subsidiaries, as discussed in Note 18. Otherwise, there are no other regulatory restrictions on ProAssurance's retained earnings or net income that materially impact its ability to pay dividends. Based on shareholders' equity at December 31, 2024, total equity of $462.4 million was free of debt covenant restrictions regarding the payment of dividends. However, any decision to pay cash dividends is subject to the Board’s final determination after a comprehensive review of financial performance, future expectations and other factors deemed relevant by the Board. In light of the price range in which the Company's stock has traded beginning in the second quarter of 2023, the Board decided to suspend payment of a quarterly cash dividend. Instead, the Company used available capital to repurchase shares pursuant to the existing share repurchase authorization.
As of December 31, 2024, Board authorizations for the repurchase of common shares or the retirement of outstanding debt of $55.9 million remained available for use. The timing and quantity of share repurchases depends upon market conditions and changes in ProAssurance's capital requirements and is subject to limitations that may be imposed on such repurchases by applicable securities laws and regulations as well as the rules of the NYSE.
Other Comprehensive Income (Loss) and Accumulated Other Comprehensive Income (Loss)
The following tables provide a detailed breakout of the components of AOCI and the amounts reclassified from AOCI to net income (loss). The tax effects of all amounts in the tables below, except for an immaterial amount of unrealized gains and losses on available-for-sale securities held at the Company's U.K. subsidiary, were computed using the enacted U.S. federal corporate tax rate of 21%. OCI included a deferred tax expense of $9.1 million and $25.1 million for the years ended December 31, 2024 and 2023, respectively, and a deferred tax benefit of $85.2 million for the year ended December 31, 2022.
ProAssurance Corporation and Subsidiaries
Notes to Consolidated Financial Statements
December 31, 2024
The changes in the balance of each component of AOCI for the years ended December 31, 2024, 2023 and 2022 were as follows:
| | | | | | | | | | | | | | | | | | | | | | | | | | | | | |
| (In thousands) | Unrealized Investment Gains (Losses) | | Cash Flow Hedging Gains (Losses)(1) | | Non-credit Impairments | | Unrecognized Change in Defined Benefit Plan Liabilities | | Accumulated Other Comprehensive Income (Loss) |
| Balance, December 31, 2023 | $ | (206,327) | | | $ | 3,026 | | | $ | (11) | | | $ | (1,177) | | | $ | (204,489) | |
| OCI, before reclassifications, net of tax | 25,690 | | | 5,442 | | | (455) | | | 355 | | | 31,032 | |
| Amounts reclassified from AOCI, net of tax | 4,584 | | | (3,892) | | | 374 | | | — | | | 1,066 | |
| Net OCI, current period | 30,274 | | | 1,550 | | | (81) | | | 355 | | | 32,098 | |
| Balance, December 31, 2024 | $ | (176,053) | | | $ | 4,576 | | | $ | (92) | | | $ | (822) | | | $ | (172,391) | |
| | | | | | | | | | | | | | | | | | | | | | | | | | | | | |
| (In thousands) | Unrealized Investment Gains (Losses) | | Cash Flow Hedging Gains (Losses)(1) | | Non-credit Impairments | | Unrecognized Change in Defined Benefit Plan Liabilities | | Accumulated Other Comprehensive Income (Loss) |
| Balance, December 31, 2022 | $ | (297,142) | | | $ | — | | | $ | (11) | | | $ | (1,454) | | | $ | (298,607) | |
| OCI, before reclassifications, net of tax | 87,624 | | | 3,062 | | | — | | | 277 | | | 90,963 | |
| Amounts reclassified from AOCI, net of tax | 3,191 | | | (36) | | | — | | | — | | | 3,155 | |
| Net OCI, current period | 90,815 | | | 3,026 | | | — | | | 277 | | | 94,118 | |
| Balance, December 31, 2023 | $ | (206,327) | | | $ | 3,026 | | | $ | (11) | | | $ | (1,177) | | | $ | (204,489) | |
| | | | | | | | | | | | | | | | | | | | | | | |
| (In thousands) | Unrealized Investment Gains (Losses) | | Non-credit Impairments | | Unrecognized Change in Defined Benefit Plan Liabilities(2) | | Accumulated Other Comprehensive Income (Loss) |
| Balance, December 31, 2021 | $ | 14,929 | | | $ | — | | | $ | 1,355 | | | $ | 16,284 | |
| | | | | | | |
| OCI, before reclassifications, net of tax | (314,822) | | | (342) | | | (2,746) | | | (317,910) | |
| Amounts reclassified from AOCI, net of tax | 2,751 | | | 331 | | | (63) | | | 3,019 | |
| Net OCI, current period | (312,071) | | | (11) | | | (2,809) | | | (314,891) | |
| Balance, December 31, 2022 | $ | (297,142) | | | $ | (11) | | | $ | (1,454) | | | $ | (298,607) | |
(1) ProAssurance entered into two forward-starting interest rate swap agreements ("Interest Rate Swaps") on May 2, 2023, each of which are designated and qualify as a cash flow hedge. See Note 11 for additional information on the Interest Rate Swaps. |
(2) The Company sponsors NORCAL's frozen defined benefit plan and recorded a nominal net actuarial gain, net of tax, included in AOCI as of December 31, 2022. |
|
|
13. Share-Based Payments
Share-based compensation costs are classified as a component of operating expense.
During 2024, 2023 and 2022, ProAssurance provided share-based compensation to employees utilizing two types of awards: restricted share units and performance share units. Since May 2024, the restricted share and performance share awards were made under the ProAssurance Corporation 2024 Equity Incentive Plan. Prior to May 2024, the restricted share and performance share awards were made under the ProAssurance Corporation Amended and Restated 2014 Equity Incentive Plan. The Compensation Committee of the Board is responsible for the administration of both plans. The Compensation Committee of the Board is also charged with determining and administering Director compensation and issued compensation to Directors in the form of the Company's common shares, which were nominal in amount for 2024, 2023 and 2022; all Directors elected to defer the receipt of the shares until the end of their service on the Board. Shares issued to Directors in 2024 and 2023 are payable from the shares reserved for issuance under the ProAssurance Corporation 2024 Equity Incentive Plan.
ProAssurance Corporation and Subsidiaries
Notes to Consolidated Financial Statements
December 31, 2024
The following table provides a summary of compensation expense and the total related tax benefit recognized during each period as well as estimated compensation cost that will be charged to expense in future periods.
| | | | | | | | | | | | | | | | | | | | | | | | | | | | | | | | |
| | | Share-Based
Compensation Expense | | Unrecognized Compensation Cost |
| | | Year Ended December 31 | | December 31, 2024 |
| ($ in millions, except remaining recognition period) | | 2024 | | 2023 | | 2022 | | Amount | | Weighted Average Remaining
Recognition Period |
| | | | | | | | | | |
| | | | | | | | | | |
| | | | | | | | | | |
| | | | | | | | | | |
| Total share-based compensation expense | | $ | 6.2 | | | $ | 5.2 | | | $ | 4.8 | | | $ | 8.6 | | | 1.9 |
| Tax benefit recognized | | $ | 1.3 | | | $ | 1.1 | | | $ | 1.0 | | | | | |
All awards are equity classified awards and are charged to expense as an increase to additional paid-in capital over the requisite service period (generally the vesting period) associated with the award. As of December 31, 2024, the majority of share-based compensation expense related to restricted share units. Restricted share units generally vest one-third each year over a three-year period following the grant date based on a continuous service requirement. Performance share units vest in their entirety generally at the end of a three-year period following the grant date based on a continuous service requirement and achievement of specific performance objectives. Certain restricted share units granted in 2019 vested at the end of a five-year period and all restricted share units granted in 2024 and 2023 will vest one-third each year over a three-year period. Partial vesting is permitted for retirees. For restricted share units, a single share of ProAssurance common stock is issued per vested unit. For performance share units, the number of shares of ProAssurance common stock issued per vested unit varies based on performance goals achieved. Upon vesting, units sufficient to satisfy required tax withholdings are paid in cash rather than in shares of ProAssurance common stock.
Restricted Share Units
Activity for restricted share units during 2024, 2023 and 2022 is summarized below. Grant date fair values are based on the market value of a share of ProAssurance common stock on the date of grant less the estimated net present value of expected dividends during the vesting period.
| | | | | | | | | | | | | | | | | | | | | | | | | | | | | | | | | | | | | | |
| | | 2024 | | 2023 | | 2022 |
| | | Units | | Weighted
Average
Grant Date
Fair Value | | Units | | Weighted
Average
Grant Date
Fair Value | | Units | | Weighted
Average
Grant Date
Fair Value |
| Beginning non-vested balance | | 582,363 | | | $ | 23.11 | | | 465,203 | | | $ | 26.21 | | | 387,182 | | | $ | 30.78 | |
| Granted | | 429,227 | | | $ | 14.57 | | | 224,185 | | | $ | 19.31 | | | 195,941 | | | $ | 24.19 | |
| Forfeited | | (14,164) | | | $ | 20.73 | | | (7,967) | | | $ | 24.14 | | | (12,238) | | | $ | 25.13 | |
| Vested and released | | (261,203) | | | $ | 24.52 | | | (99,058) | | | $ | 28.97 | | | (105,682) | | | $ | 39.36 | |
| Ending non-vested balance | | 736,223 | | | $ | 17.68 | | | 582,363 | | | $ | 23.11 | | | 465,203 | | | $ | 26.21 | |
The aggregate grant date fair value of restricted share units vested and released in 2024, 2023 and 2022 totaled $6.4 million, $2.9 million and $4.2 million, respectively. The aggregate intrinsic value of restricted share units vested and released in 2024, 2023 and 2022 (including units paid in cash to cover tax withholdings) totaled $3.2 million, $2.0 million and $2.6 million, respectively.
Performance Share Units
Performance share units vest only if minimum performance objectives are met, and the number of units earned varies from 50% to 200% of a base award depending upon the degree to which stated performance objectives are achieved. Performance share unit activity for 2024, 2023 and 2022 is summarized below. The table reflects the base number of units; actual awards that vest depend upon the extent to which performance objectives are achieved. Grant date fair values are based on the market value of a share of ProAssurance common stock on the date of grant less the estimated net present value of expected dividends during the vesting period.
ProAssurance Corporation and Subsidiaries
Notes to Consolidated Financial Statements
December 31, 2024
| | | | | | | | | | | | | | | | | | | | | | | | | | | | | | | | | | | | | | |
| | | 2024 | | 2023 | | 2022 |
| | | Base Units | | Weighted
Average
Grant Date
Fair Value | | Base Units | | Weighted
Average
Grant Date
Fair Value | | Base Units | | Weighted
Average
Grant Date
Fair Value |
| Beginning non-vested balance | | 315,091 | | | $ | 22.09 | | | 222,155 | | | $ | 25.01 | | | 137,781 | | | $ | 28.43 | |
| Granted | | 192,554 | | | $ | 14.57 | | | 133,723 | | | $ | 19.31 | | | 109,542 | | | $ | 24.19 | |
| Forfeited | | (13,672) | | | $ | 23.52 | | | (2,076) | | | $ | 23.07 | | | — | | | $ | — | |
| Expired* | | (73,150) | | | $ | 24.04 | | | (38,609) | | | $ | 29.18 | | | (25,168) | | | $ | 40.18 | |
| Vested and released | | (228) | | | $ | 19.31 | | | (102) | | | $ | 24.19 | | | — | | | $ | — | |
| Ending non-vested balance | | 420,595 | | | $ | 18.27 | | | 315,091 | | | $ | 22.09 | | | 222,155 | | | $ | 25.01 | |
*Represents performance share units that did not vest as minimum performance objectives were not achieved.
The aggregate grant date and fair value of performance share units (base level) and the aggregate intrinsic value of performance share units (including units paid in cash to cover tax withholdings) vested and released in 2024 and 2023 were nominal in amount. The weighted average level at which the vested units were issued was 52% and 53% during 2024 and 2023, respectively, based on performance levels achieved. There were no performance share units vested and released in 2022 as minimum performance objectives were not achieved.
14. Variable Interest Entities
ProAssurance holds passive interests in a number of entities that are considered to be VIEs under GAAP guidance. ProAssurance's VIE interests principally consist of interests in LPs/LLCs formed for the purpose of achieving diversified equity and debt returns. ProAssurance's VIE interests, carried as a part of investment in unconsolidated subsidiaries, totaled $234.4 million at December 31, 2024 and $250.4 million at December 31, 2023. ProAssurance does not have power over the activities that most significantly impact the economic performance of these VIEs and thus is not the primary beneficiary. Investments in entities where ProAssurance holds a greater than minor interest but does not hold a controlling interest are accounted for using the equity method. Therefore, ProAssurance has not consolidated these VIEs. ProAssurance’s involvement with each of these VIEs is limited to its direct ownership interest in the VIE. Except for the funding commitments disclosed in Note 8, ProAssurance has no arrangements with any of these VIEs to provide other financial support to or on behalf of the VIE. At December 31, 2024, ProAssurance’s maximum loss exposure relative to these investments was limited to the carrying value of ProAssurance’s investment in the VIE.
ProAssurance is the primary beneficiary of PPM RRG. While there is no direct ownership of PPM RRG by ProAssurance, it manages the business operations of PPM RRG through its management services agreement and has effective control of PPM RRG's Board of Directors through an irrevocable voting proxy. The management services agreement allows ProAssurance to provide management and oversight services to PPM RRG, which includes the ability to make business decisions impacting the operations of PPM RRG. PPM RRG has a $5 million surplus note to NORCAL which is its only source of capital. At December 31, 2024 and December 31, 2023, approximately $139 million and $142 million of ProAssurance's assets, respectively, and approximately $139 million and $142 million of its liabilities, respectively, included on the Consolidated Balance Sheet were related to PPM RRG.
ProAssurance Corporation and Subsidiaries
Notes to Consolidated Financial Statements
December 31, 2024
15. Earnings (Loss) Per Share
Diluted weighted average shares is calculated as basic weighted average shares plus the effect, calculated using the treasury stock method, of assuming that restricted share units and performance share units have vested. The following table provides a reconciliation between the Company's basic weighted average number of common shares outstanding to its diluted weighted average number of common shares outstanding:
| | | | | | | | | | | | | | | | | |
| (In thousands, except per share data) | Year Ended December 31 |
| 2024 | | 2023 | | 2022 |
| Weighted average number of common shares outstanding, basic | 51,097 | | | 52,642 | | | 54,008 | |
| Dilutive effect of securities: | | | | | |
| Restricted Share Units | 127 | | | 120 | | | 115 | |
| Performance Share Units | 42 | | | 26 | | | 17 | |
| | | | | |
| | | | | |
| Weighted average number of common shares outstanding, diluted | 51,266 | | | 52,788 | | | 54,140 | |
| Effect of dilutive shares on earnings (loss) per share | $ | — | | | $ | — | | | $ | — | |
The diluted weighted average number of common shares outstanding for the years ended December 31, 2024, 2023 and 2022 excludes approximately 158,000, 118,000 and 2,000, respectively, of common share equivalents issuable under the Company's stock compensation plans, as their effect would have been antidilutive.
Dilutive common share equivalents are reflected in the earnings (loss) per share calculation while antidilutive common share equivalents are not reflected in the earnings (loss) per share calculation. For the years ended December 31, 2023 and 2022, all incremental common share equivalents were not included in the computation of diluted earnings (loss) per share because to do so would have been antidilutive for each period.
16. Segment Information
ProAssurance's segments are based on the Company's internal management reporting structure for which financial results are regularly evaluated by the Company's CODM, its Chief Executive Officer, to determine resource allocation and assess operating performance. The Company continually assesses its internal management reporting structure and information evaluated by its CODM to determine whether any changes have occurred that would impact its segment reporting structure.
The Company operates in four segments that are organized around the nature of the products and services provided: Specialty P&C, Workers' Compensation Insurance, Segregated Portfolio Cell Reinsurance and Corporate. A description of each of ProAssurance's four operating and reportable segments follows.
•Specialty P&C focuses on Medical Professional Liability insurance and Medical Technology Liability insurance. Medical Professional Liability insurance is primarily comprised of medical professional liability products offered to healthcare providers and institutions. Medical Technology Liability insurance is offered to medical technology and life sciences companies that manufacture or distribute products including entities conducting human clinical trials. In addition, the Company also offers custom alternative risk solutions including assumed reinsurance, loss portfolio transfers and captive cell programs for medical professional liability insureds. For the alternative market captive cell programs, the Specialty P&C segment cedes either all or a portion of the premium to certain SPCs in the Company's Segregated Portfolio Cell Reinsurance segment. The Specialty P&C segment also includes the underwriting results from ProAssurance's previous participation in Lloyd's of London Syndicate 1729 and Syndicate 6131, which is currently in run-off. Effective September 2023, ProAssurance elected to discontinue its participation in the results of Syndicate 1729 beginning with the 2024 underwriting year which, due to the quarter lag, was not reflected in its results until the second quarter of 2024. For the 2023 underwriting year ProAssurance's participation in the results of Syndicate 1729 was approximately 5%. The Company ceased participation in Syndicate 6131 beginning with the 2022 underwriting year which, due to the quarter lag, was not reflected in its results until the second quarter of 2022.
•Workers' Compensation Insurance includes workers' compensation insurance products which are provided primarily to employers with 1,000 or fewer employees. The segment's products include guaranteed cost policies, policyholder dividend policies, retrospectively-rated policies, deductible policies and alternative market solutions. Alternative market program premiums include program design, fronting, claims administration, risk management, SPC rental, asset management and SPC management services. Alternative market program premiums are 100% ceded to either
ProAssurance Corporation and Subsidiaries
Notes to Consolidated Financial Statements
December 31, 2024
SPCs in the Company's Segregated Portfolio Cell Reinsurance segment or captive insurers unaffiliated with ProAssurance for two programs.
•Segregated Portfolio Cell Reinsurance includes the results (underwriting profit or loss, plus investment results, net of U.S. federal income taxes) of SPCs at Inova Re and Eastern Re, the Company's Cayman Islands SPC operations. Each SPC is owned, fully or in part, by an individual company, agency, group or association, and the results of the SPCs are attributable to the participants of that cell. ProAssurance participates to a varying degree in the results of selected SPCs. SPC results attributable to external cell participants are reported as an SPC dividend expense (income) in the Segregated Portfolio Cell Reinsurance segment and in ProAssurance's Consolidated Statements of Income and Comprehensive Income. In addition, the Segregated Portfolio Cell Reinsurance segment includes the investment results of the SPCs as the investments are solely for the benefit of the cell participants, and investment results attributable to external cell participants are reflected in SPC dividend expense (income). The SPCs assume workers' compensation insurance, medical professional liability insurance or a combination of the two from the Company's Workers' Compensation Insurance and Specialty P&C segments.
•Corporate includes ProAssurance's investment operations excluding those reported in the Company's Segregated Portfolio Cell Reinsurance segment. In addition, this segment includes corporate expenses, interest expense, U.S. and U.K. income taxes and non-premium revenues generated outside of the Company's insurance entities.
The accounting policies of the segments are described in Note 1. The CODM evaluates the performance of the Specialty P&C and Workers' Compensation Insurance segments based on before tax underwriting profit or loss. The CODM also evaluates the Specialty P&C and Workers' Compensation Insurance segment's net loss and underwriting expense ratios in assessing each segment's financial performance. The net loss ratio is calculated as the segment's net losses and loss adjustment expenses incurred divided by net premiums earned. The underwriting expense ratio is calculated as the segment's underwriting, policy acquisition and operating expenses incurred divided by net premiums earned. The CODM evaluates the performance of the Segregated Portfolio Cell Reinsurance segment based on operating profit or loss, which includes investment results of investment assets solely allocated to SPC operations, net of U.S. federal income taxes. Performance of the Corporate segment is evaluated by the CODM based on its contribution to consolidated after-tax results. The CODM also evaluates the contribution of the Corporate segment to the consolidated underwriting expense ratio (Corporate operating expenses divided by consolidated net premiums earned) in assessing the segment's financial performance. ProAssurance accounts for inter-segment transactions as if the transactions were to third parties at current market prices. Assets are not allocated to segments because investments, other than the investments discussed above that are solely allocated to the Segregated Portfolio Cell Reinsurance segment, and other assets are not managed at the segment level.
The tabular information that follows shows the financial results of the Company's reportable segments reconciled to results reflected in the Consolidated Statements of Income and Comprehensive Income. The CODM does not consider goodwill or intangible asset impairments, changes in the fair value of contingent consideration or transaction-related costs for completed business combinations, including any related tax impacts, in assessing the financial performance of its operating and reportable segments, and thus are included in the reconciliation of segment results to consolidated results.
ProAssurance Corporation and Subsidiaries
Notes to Consolidated Financial Statements
December 31, 2024
Financial results by segment were as follows:
| | | | | | | | | | | | | | | | | | | | | | | | | | | | | | | | | | | | |
| Year Ended December 31, 2024 |
| (In thousands) | Specialty P&C | | Workers' Compensation Insurance | | Segregated Portfolio Cell Reinsurance | | | Corporate | | Inter-segment Eliminations | | Consolidated |
| Net premiums earned | $ | 747,942 | | | $ | 167,610 | | | $ | 52,698 | | | | $ | — | | | $ | — | | | $ | 968,250 | |
| Net investment income | — | | | — | | | 3,608 | | | | 140,930 | | | — | | | 144,538 | |
| Equity in earnings (loss) of unconsolidated subsidiaries | — | | | — | | | — | | | | 22,203 | | | — | | | 22,203 | |
| Net investment gains (losses) | — | | | — | | | 2,369 | | | | (7,206) | | | — | | | (4,837) | |
Other income (expense)(1) | 4,373 | | | 1,887 | | | 19 | | | | 11,489 | | | (4,258) | | | 13,510 | |
Net losses and loss adjustment expenses(2) | (578,486) | | | (128,483) | | | (32,466) | | | | — | | | — | | | (739,435) | |
Operating expenses(1)(2)(3) | (101,082) | | | (43,875) | | | (1,709) | | | | (40,008) | | | 3,085 | | | (183,589) | |
Deferred policy acquisition costs amortization(2) | (102,125) | | | (18,124) | | | (16,354) | | | | — | | | 1,173 | | | (135,430) | |
| | | | | | | | | | | | |
SPC U.S. federal income tax benefit (expense)(4) | — | | | — | | | (1,766) | | | | — | | | — | | | (1,766) | |
| SPC dividend (expense) income | — | | | — | | | (4,444) | | | | — | | | — | | | (4,444) | |
| Interest expense | — | | | — | | | — | | | | (22,342) | | | — | | | (22,342) | |
| Income tax benefit (expense) | — | | | — | | | — | | | | (10,401) | | | — | | | (10,401) | |
| Segment results | $ | (29,378) | | | $ | (20,985) | | | $ | 1,955 | | | | $ | 94,665 | | | $ | — | | | 46,257 | |
| Reconciliation of segments to consolidated results: | | | | | | | | | |
| | | | | | | | | | | | |
Contingent consideration(5) | | | | | | | | | | | | 6,740 | |
| | | | | | | | | | | | |
| | | | | | | | | | | | |
Transaction-related costs, net(6) | | | | | | | | | | | | (253) | |
| Net income (loss) | | | | | | | | | | | | $ | 52,744 | |
| Significant non-cash items: | | | | | | | | | | | | |
| | | | | | | | | | | | |
| | | | | | | | | | | | |
| Depreciation and amortization, net of accretion | $ | 8,919 | | | $ | 5,020 | | | $ | (2,129) | | | | $ | 5,941 | | | $ | — | | | $ | 17,751 | |
| | | | | | | | | | | | | | | | | | | | | | | | | | | | | | | | | | | | |
| Year Ended December 31, 2023 |
| (In thousands) | Specialty P&C | | Workers' Compensation Insurance | | Segregated Portfolio Cell Reinsurance | | | Corporate | | Inter-segment Eliminations | | Consolidated |
| Net premiums earned | $ | 755,817 | | | $ | 160,034 | | | $ | 61,546 | | | | $ | — | | | $ | — | | | $ | 977,397 | |
| Net investment income | — | | | — | | | 2,289 | | | | 126,130 | | | — | | | 128,419 | |
| Equity in earnings (loss) of unconsolidated subsidiaries | — | | | — | | | — | | | | 6,791 | | | — | | | 6,791 | |
| Net investment gains (losses) | — | | | — | | | 3,680 | | | | 5,148 | | | — | | | 8,828 | |
Other income (expense)(1) | 4,695 | | | 1,854 | | | 5 | | | | 8,307 | | | (4,084) | | | 10,777 | |
| | | | | | | | | | | | |
Net losses and loss adjustment expenses(2) | (624,809) | | | (139,322) | | | (36,363) | | | | — | | | — | | | (800,494) | |
Operating expenses(1)(2)(3) | (93,612) | | | (39,860) | | | (2,086) | | | | (34,007) | | | 3,634 | | | (165,931) | |
Deferred policy acquisition costs amortization(2) | (101,691) | | | (15,201) | | | (18,371) | | | | — | | | 450 | | | (134,813) | |
| | | | | | | | | | | | |
SPC U.S. federal income tax benefit (expense)(4) | — | | | — | | | (1,629) | | | | — | | | — | | | (1,629) | |
| SPC dividend (expense) income | — | | | — | | | (6,234) | | | | — | | | — | | | (6,234) | |
| Interest expense | — | | | — | | | — | | | | (23,150) | | | — | | | (23,150) | |
| Income tax benefit (expense) | — | | | — | | | — | | | | 545 | | | — | | | 545 | |
| Segment results | $ | (59,600) | | | $ | (32,495) | | | $ | 2,837 | | | | $ | 89,764 | | | $ | — | | | 506 | |
| Reconciliation of segments to consolidated results: | | | | | | | | | |
Contingent consideration(5) | | | | | | | | | | | | 5,000 | |
| Goodwill impairment | | | | | | | | | | | | (44,110) | |
| | | | | | | | | | | | |
| | | | | | | | | | | | |
| | | | | | | | | | | | |
| Net income (loss) | | | | | | | | | | | | $ | (38,604) | |
| Significant non-cash items: | | | | | | | | | | | | |
| | | | | | | | | | | | |
| Goodwill impairment | | | | | | | | | | | | $ | 44,110 | |
| Depreciation and amortization, net of accretion | $ | 10,581 | | | $ | 3,424 | | | $ | (436) | | | | $ | 12,446 | | | $ | — | | | $ | 26,015 | |
ProAssurance Corporation and Subsidiaries
Notes to Consolidated Financial Statements
December 31, 2024
| | | | | | | | | | | | | | | | | | | | | | | | | | | | | | | | | | | | |
| Year Ended December 31, 2022 |
| (In thousands) | Specialty P&C | | Workers' Compensation Insurance | | Segregated Portfolio Cell Reinsurance | | | Corporate | | Inter-segment Eliminations | | Consolidated |
| Net premiums earned | $ | 793,400 | | | $ | 166,371 | | | $ | 69,810 | | | | $ | — | | | $ | — | | | $ | 1,029,581 | |
| Net investment income | — | | | — | | | 1,029 | | | | 94,943 | | | — | | | 95,972 | |
| Equity in earnings (loss) of unconsolidated subsidiaries | — | | | — | | | — | | | | 4,888 | | | — | | | 4,888 | |
| Net investment gains (losses) | — | | | — | | | (3,067) | | | | (39,090) | | | — | | | (42,157) | |
Other income (expense)(1) | 5,122 | | | 2,201 | | | 2 | | | | 6,198 | | | (4,119) | | | 9,404 | |
| | | | | | | | | | | | |
Net losses and loss adjustment expenses(2) | (626,045) | | | (111,407) | | | (39,310) | | | | — | | | — | | | (776,762) | |
Operating expenses(1)(2)(3) | (102,052) | | | (39,901) | | | (248) | | | | (34,733) | | | 4,633 | | | (172,301) | |
Deferred policy acquisition costs amortization(2) | (97,757) | | | (14,836) | | | (20,068) | | | | — | | | (514) | | | (133,175) | |
| | | | | | | | | | | | |
SPC U.S. federal income tax benefit (expense)(4) | — | | | — | | | (1,759) | | | | — | | | — | | | (1,759) | |
| SPC dividend (expense) income | — | | | — | | | (6,673) | | | | — | | | — | | | (6,673) | |
| Interest expense | — | | | — | | | — | | | | (20,372) | | | — | | | (20,372) | |
| Income tax benefit (expense) | — | | | — | | | — | | | | 5,423 | | | — | | | 5,423 | |
| Segment results | $ | (27,332) | | | $ | 2,428 | | | $ | (284) | | | | $ | 17,257 | | | $ | — | | | (7,931) | |
| Reconciliation of segments to consolidated results: | | | | | | | | | |
Contingent consideration(5) | | | | | | | | | | | | 9,000 | |
| | | | | | | | | | | | |
| | | | | | | | | | | | |
Transaction-related costs, net(6) | | | | | | | | | | | | (1,471) | |
| Net income (loss) | | | | | | | | | | | | $ | (402) | |
| Significant non-cash items: | | | | | | | | | | | | |
| | | | | | | | | | | | |
| Depreciation and amortization, net of accretion | $ | 10,473 | | | $ | 3,491 | | | $ | 1,186 | | | | $ | 22,913 | | | $ | — | | | $ | 38,063 | |
(1) Includes certain fees for services provided by the Workers' Compensation Insurance segment to the SPCs at Inova Re and Eastern Re which are recorded as expenses within the Segregated Portfolio Cell Reinsurance segment and as other income within the Workers' Compensation Insurance segment. These fees are primarily SPC rental fees and are eliminated between segments in consolidation. |
(2) The significant expense categories and amounts align with the segment-level information that is regularly provided to the CODM. |
(3) Primarily includes compensation-related costs, professional fees, software and equipment costs and management fees in the Specialty P&C, Workers' Compensation Insurance and Corporate segments. Operating expenses in the Segregated Portfolio Cell Reinsurance segment primarily include bank fees, professional fees, changes in the allowance for expected credit losses and policyholder dividend expense. The remaining operating expenses were comprised of individually insignificant components. |
(4) Represents the provision for U.S. federal income taxes for SPCs at Inova Re, which have elected to be taxed as a U.S. corporation under Section 953(d) of the Internal Revenue Code. U.S. federal income taxes are included in the total SPC net results and are paid by the individual SPCs. |
(5) Represents the change in the fair value of contingent consideration issued in connection with the NORCAL acquisition and, for the year ended December 31, 2024, the reversal of a nominal amount of associated contingent investment banker fees accrued during purchase accounting, all of which are included as a component of consolidated net investment gains (losses) on the Consolidated Statements of Income and Comprehensive Income. See further discussion on the contingent consideration in Note 2. |
(6) For the years ended December 31, 2024 and 2022, pre-tax transaction-related costs of approximately $0.3 million and $1.9 million, respectively, were included as a component of consolidated operating expense and a nominal amount and $0.4 million of the associated income tax benefit for the years ended December 31, 2024 and 2022, respectively, was included as a component of consolidated income tax benefit (expense) on the Consolidated Statements of Income and Comprehensive Income. For 2024, these costs represent actuarial consulting fees, after tax, paid in connection with the final determination of contingent consideration associated with the acquisition of NORCAL. For 2022, these costs represent the transaction-related costs, after-tax, associated with the acquisition of NORCAL. |
|
|
|
ProAssurance Corporation and Subsidiaries
Notes to Consolidated Financial Statements
December 31, 2024
The following table provides detailed information regarding ProAssurance's gross premiums earned by product as well as a reconciliation to net premiums earned. All gross premiums earned are from external customers except as noted. ProAssurance's insured risks are primarily within the U.S.
| | | | | | | | | | | | | | | | | | | | |
| | Year Ended December 31 |
| (In thousands) | | 2024 | | 2023 | | 2022 |
| Specialty P&C Segment | | | | | | |
| Gross premiums earned: | | | | | | |
| MPL | | $ | 738,422 | | | $ | 738,496 | | | $ | 764,244 | |
| Medical Technology Liability | | 44,432 | | | 43,387 | | | 41,323 | |
| Lloyd's Syndicates | | 13,875 | | | 19,310 | | | 27,486 | |
| Other | | 22,022 | | | 25,714 | | | 28,933 | |
| Ceded premiums earned | | (70,809) | | | (71,090) | | | (68,586) | |
| Segment net premiums earned | | 747,942 | | | 755,817 | | | 793,400 | |
| | | | | | |
| Workers' Compensation Insurance Segment | | | | | | |
| Gross premiums earned: | | | | | | |
| Traditional business | | 183,520 | | | 174,743 | | | 179,558 | |
| Alternative market business | | 64,225 | | | 70,130 | | | 72,894 | |
| Ceded premiums earned | | (80,135) | | | (84,839) | | | (86,081) | |
| Segment net premiums earned | | 167,610 | | | 160,034 | | | 166,371 | |
| | | | | | |
| Segregated Portfolio Cell Reinsurance Segment | | | | | | |
| Gross premiums earned: | | | | | | |
Workers' compensation (1) | | 58,419 | | | 65,001 | | | 68,548 | |
MPL (2) | | 2,540 | | | 5,705 | | | 10,799 | |
| | | | | | |
| Ceded premiums earned | | (8,261) | | | (9,160) | | | (9,537) | |
| Segment net premiums earned | | 52,698 | | | 61,546 | | | 69,810 | |
| Consolidated net premiums earned | | $ | 968,250 | | | $ | 977,397 | | | $ | 1,029,581 | |
(1) Premium for all periods is assumed from the Workers' Compensation Insurance segment.
(2) Premium for all periods is assumed from the Specialty P&C segment.
17. Benefit Plans
ProAssurance maintains the ProAssurance Savings Plan that provides a vehicle for eligible employees to build retirement income. For the first quarter of 2023 and the year ended December 31, 2022, ProAssurance provided employer contributions to the plan of up to 5% of eligible contributions for qualified employees. Effective April 2023, ProAssurance increased the maximum employer contribution to the plan to 6% from 5% of eligible contributions for qualified employees. ProAssurance incurred expenses related to these savings plans of $5.9 million, $5.7 million and $4.3 million during the years ended December 31, 2024, 2023 and 2022, respectively.
ProAssurance also maintains the ProAssurance Plan that allows eligible management employees to defer a portion of their current salary. ProAssurance incurred nominal expense related to the ProAssurance Plan in each of the years ended December 31, 2024, 2023 and 2022. ProAssurance's deferred compensation liabilities totaled $33.8 million and $32.0 million at December 31, 2024 and 2023, respectively. The liabilities included amounts due under the ProAssurance Plan and amounts due under individual agreements with current or former employees.
Pension
ProAssurance sponsors NORCAL's frozen defined benefit plan, which covers substantially all NORCAL employees (except those that were previous employees of Medicus Insurance Company and FD Insurance Company, employees of PPM RRG as well as new hires after December 31, 2013). Benefits are based on years of service and the employee’s average of the highest five years of annual compensation. Annual contributions to the defined benefit pension plan are above the minimum
ProAssurance Corporation and Subsidiaries
Notes to Consolidated Financial Statements
December 31, 2024
funding standards outlined in the Employee Retirement Income Security Act of 1974, as amended. ProAssurance makes contributions to the defined benefit pension plan with the goal of ensuring that it is adequately funded to meet its future obligations. ProAssurance did not make any contributions to NORCAL's defined benefit pension plan during the year ended December 31, 2024 and does not anticipate making any contributions in 2025. The defined benefit pension plan no longer has future service accruals or compensation increases because this plan was frozen effective December 31, 2015.
The PBO for pension benefits represents the present value of benefits earned as of December 31 for vested and non-vested employees. The following table provides a reconciliation of the changes in the PBO and fair value of plan assets for the years ended December 31, 2024 and 2023:
| | | | | | | | | | | | | | | |
| Year Ended
December 31 | | |
| (In thousands) | 2024 | | 2023 | | | | |
| Change in benefit obligation: | | | | | | | |
| PBO at beginning of period | $ | 74,710 | | | $ | 74,230 | | | | | |
| | | | | | | |
| | | | | | | |
| Interest cost | 3,526 | | | 3,666 | | | | | |
Actuarial (gain) loss (1) | (4,437) | | | 1,824 | | | | | |
| Benefits paid | (4,251) | | | (5,010) | | | | | |
| | | | | | | |
| PBO at December 31 | $ | 69,548 | | | $ | 74,710 | | | | | |
| | | | | | | |
| Change in fair value of plan assets: | | | | | | | |
| Fair value of plan assets beginning of period | $ | 76,136 | | | $ | 75,427 | | | | | |
| | | | | | | |
| Actual return on plan assets | (418) | | | 5,719 | | | | | |
| | | | | | | |
| Benefits paid | (4,251) | | | (5,010) | | | | | |
| | | | | | | |
| Fair value of plan assets at December 31 | $ | 71,467 | | | $ | 76,136 | | | | | |
| Funded (underfunded) status of the plan | $ | 1,919 | | | $ | 1,426 | | | | | |
Amount recognized in Consolidated Balance Sheets at December 31 (2) | $ | 1,919 | | | $ | 1,426 | | | | | |
| Net actuarial (gain) loss recognized in AOCI and not yet reflected in net periodic benefit cost (income) | $ | 1,046 | | | $ | 1,495 | | | | | |
(1) The actuarial gain experienced in 2024 was largely driven by the increase in the discount rate from the prior year that was used to determine the projected benefit obligation at December 31, 2024. | | |
(2) The funded balance is included as a component of other assets on the Consolidated Balance Sheets for the years ended December 31, 2024 and 2023. | | |
The components of the net periodic benefit cost (income) for the years ended December 31, 2024, 2023 and 2022 were as follows:
| | | | | | | | | | | | | | | | | |
| (In thousands) | Year Ended December 31 |
| 2024 | | 2023 | | 2022 |
| Components of net periodic benefit cost (income): | | | | | |
| | | | | |
| Interest cost | $ | 3,526 | | | $ | 3,666 | | | $ | 2,885 | |
| Expected return on plan assets | (3,569) | | | (3,545) | | | (4,013) | |
| | | | | |
| (Gain) loss on settlement | — | | | — | | | 163 | |
| Total net periodic benefit cost (income)* | (43) | | | 121 | | | (965) | |
|
| | | | | |
| Other changes recognized in OCI: | | | | | |
| Net actuarial (gain) loss | (449) | | | (350) | | | 3,476 | |
| Reclassification of gain (loss) on settlement | — | | | — | | | (163) | |
| (Gain) loss recognized in OCI | (449) | | | (350) | | | 3,313 | |
| Total recognized in net periodic benefit cost (income) and OCI | $ | (492) | | | $ | (229) | | | $ | 2,348 | |
| *Net periodic benefit cost (income) is included as a component of operating expense on the Consolidated Statements of Income and Comprehensive Income for the years ended December 31, 2024, 2023 and 2022. |
ProAssurance Corporation and Subsidiaries
Notes to Consolidated Financial Statements
December 31, 2024
The components of the change in amounts not yet recognized as components of the net periodic benefit cost (income) were as follows:
| | | | | | | | | | | | | | | |
| Year Ended
December 31 | | |
| (In thousands) | 2024 | | 2023 | | | | |
| Items not yet recognized as a component of net periodic benefit cost (income) at beginning of period | $ | 1,495 | | | $ | 1,845 | | | | | |
| Net actuarial (gain) loss | (449) | | | (350) | | | | | |
| | | | | | | |
| | | | | | | |
| Items not yet recognized as a component of net periodic benefit cost (income) at December 31 | $ | 1,046 | | | $ | 1,495 | | | | | |
| Amounts recognized in AOCI | $ | 1,046 | | | $ | 1,495 | | | | | |
The weighted average discount rate used to determine the projected benefit obligation of the defined benefit pension plan for the years ended December 31, 2024 and 2023 were as follows:
| | | | | | | | | | | | | |
| December 31, 2024 | | December 31, 2023 | | |
| Weighted average discount rate | 5.51 | % | | 4.91 | % | | |
The weighted average discount rate and the weighted average expected return on plan assets used to determine net periodic benefit cost (income) for the years ended December 31, 2024 and 2023 were as follows:
| | | | | | | | | | | |
| December 31, 2024 | | December 31, 2023 |
| Weighted average discount rate | 4.91 | % | | 5.13 | % |
| Weighted average expected return on plan assets | 5.25 | % | | 5.25 | % |
The long-term rate of return is based on the anticipated returns that will be earned by the portfolio over the long term. The weighted average expected return on plan assets is influenced, but not determined, by historical portfolio performance.
ProAssurance has engaged a certified investment adviser to manage the defined benefit pension plan’s assets. The investment strategy is to build an efficient, well diversified portfolio based on a long-term strategic outlook of the investment markets. The investment markets outlook utilizes both historically based and forward-looking return forecasts to establish future return expectations for various asset classes. These return expectations are used to develop a core asset allocation based on the specific needs of the pension plan. The core asset allocation utilizes investment portfolios of various asset classes and multiple investment managers to help maximize the defined benefit pension plan’s return, while providing multiple layers of diversification to help minimize risk. The defined benefit pension plan’s target allocations, by asset category as of December 31, 2024 and 2023, were as follows:
| | | | | | | | | | | | | | | |
| December 31, 2024 | | December 31, 2023 | | |
| | | | | | | |
| Fixed maturities | 90 | % | | 90 | % | | | | |
| Equity investments | 10 | % | | 10 | % | | | | |
| | | | | | | |
| 100 | % | | 100 | % | | | | |
The pension plan's assets consist of investments in pooled separate accounts that invest in mutual funds, equity investments or debt securities. The fair values of the assets in the defined benefit pension plan, by asset category as of December 31, 2024 and 2023, were as follows:
| | | | | | | | | | | | | | | | | | | | | | | | | |
| | | December 31, 2024 |
| (In thousands) | | | Level 1 | | Level 2 | | Level 3 | | Total* |
| Pooled separate account investments: | | | | | | | | | |
Large cap equity investments(1) | | | $ | 5,219 | | | $ | — | | | $ | — | | | $ | 5,219 | |
| | | | | | | | | |
| | | | | | | | | |
International equity investments(2) | | | — | | | 2,111 | | | — | | | 2,111 | |
Corporate and government debt(3) | | | — | | | 64,137 | | | — | | | 64,137 | |
| | | | | | | | | |
| Total | | | $ | 5,219 | | | $ | 66,248 | | | $ | — | | | $ | 71,467 | |
| | | | | | | | | |
| | | | | |
| | | | | | | | | |
| | | | | | | | | |
| | | | | | | | | |
| | | | | | | | | |
| | | | | | | | | |
| | | | | | | | | |
| | | | | | | | | |
| | | | | | | | | |
| | |
ProAssurance Corporation and Subsidiaries
Notes to Consolidated Financial Statements
December 31, 2024
| | | | | | | | | | | | | | | | | | | | | | | | | |
| | | December 31, 2023 |
| (In thousands) | | | Level 1 | | Level 2 | | Level 3 | | Total* |
| Pooled separate account investments: | | | | | | | | | |
Large cap equity investments(1) | | | $ | 5,325 | | | $ | — | | | $ | — | | | $ | 5,325 | |
| | | | | | | | | |
| | | | | | | | | |
International equity investments(2) | | | — | | | 2,280 | | | — | | | 2,280 | |
Corporate and government debt(3) | | | 68,531 | | | — | | | — | | | 68,531 | |
| | | | | | | | | |
| Total | | | $ | 73,856 | | | $ | 2,280 | | | $ | — | | | $ | 76,136 | |
| *For some assets, the inputs used to measure fair value may fall into different levels of the fair value hierarchy. When this is the case, the asset is categorized based on the level of the most significant input to the fair value measurement. Assessments of the significance of a particular input to the fair value measurement require judgement and consideration of factors specific to the assets being valued. |
| | | | | | | | | |
| | | | | |
| | | | | | | | | |
| | | | | | | | | |
| | | | | | | | | |
| | | | | | | | | |
| | | | | | | | | |
| | | | | | | | | |
| | | | | | | | | |
| | | | | | | | | |
| | |
Management has determined that the NAV of the pooled separate accounts represents fair value because the NAV is published and available to current investors and is the basis for current transactions. Consequently, the pooled separate accounts are classified in the fair value hierarchy discussed in Note 2 based upon the ending NAV. The fair values of the underlying investments used to determine the NAV of the pooled separate accounts are primarily publicly quoted prices or quoted prices for similar assets in active or non-active markets, however other inputs may also be used as described below. Below is a description of the inputs and valuation methodologies used to determine the fair value of the Company's defined benefit pension plan assets:
(1) The portfolios invest primarily in publicly traded equity securities of large U.S. companies that are priced using the closing price of the applicable U.S. nationally recognized stock exchange.
(2) The portfolios invest primarily in publicly traded equity securities of non-U.S. companies that are priced using the closing price of the applicable foreign stock exchange, which may require certain liquidity adjustments for non-active markets.
(3) The portfolios invest in various fixed income securities, primarily of U.S. origin. These include, but are not limited to, corporate bonds and U.S. Treasury obligations. The majority of underlying securities were priced using quoted prices for similar assets or pricing models that consider current and historical market data, normal trading conventions, credit ratings and the particular structure and characteristics of the security being valued.
Based on current data and assumptions as of December 31, 2024, the following benefit payments are expected to be paid in future periods:
| | | | | | | |
| (In thousands) | | |
| | | |
| | | |
| 2025 | $ | 5,880 | | | |
| 2026 | 4,790 | | | |
| 2027 | 4,890 | | | |
| 2028 | 5,580 | | | |
| 2029 | 5,770 | | | |
| Thereafter | 26,400 | | | |
| Total | $ | 53,310 | | | |
18. Statutory Accounting and Dividend Restrictions
ProAssurance’s domestic U.S. insurance subsidiaries are required to file statutory financial statements with state insurance regulatory authorities, prepared based upon SAP prescribed or permitted by regulatory authorities. ProAssurance did not use any prescribed or permitted SAP that differed from the NAIC's SAP at December 31, 2024, 2023 or 2022. The most significant differences between net income (loss) prepared in accordance with GAAP and statutory net income (loss) are generally due to: (a) policy acquisition and certain software and equipment costs which are deferred under GAAP but expensed for statutory purposes, (b) certain deferred income taxes which are recognized under GAAP but are not recognized for statutory purposes, (c) net unrealized gains or losses which are included in shareholders' equity related to available-for-sale fixed maturity securities carried at fair value under GAAP but are principally carried at amortized cost for statutory purposes and (d) accounting for goodwill and intangible assets.
ProAssurance Corporation and Subsidiaries
Notes to Consolidated Financial Statements
December 31, 2024
The NAIC specifies risk-based capital requirements for property and casualty insurance providers. At December 31, 2024, the Company estimates that actual statutory capital and surplus for each of ProAssurance’s insurance subsidiaries will exceed the minimum regulatory requirements. Statutory net income (loss) and capital and surplus of ProAssurance’s insurance subsidiaries are estimates and could differ from actual results upon completion and filing of statutory financial statements with state insurance regulatory authorities subsequent to filing this report on Form 10-K. Net income (loss) and capital and surplus of ProAssurance’s insurance subsidiaries on a statutory basis are shown in the following table.
| | | | | | | | | | | | | | | | | | | | | | | | | | |
| (In millions) |
| Statutory Net Income (Loss) | | Statutory Capital and Surplus |
| 2024 | | 2023 | | 2022 | | 2024 | | 2023 |
| $107 | | $31 | | $69 | | $1,519 | | $1,465 |
At December 31, 2024, $1.3 billion of ProAssurance's consolidated net assets were held at its domestic insurance subsidiaries, of which approximately $145 million are permitted to be paid as dividends over the course of 2025 without prior approval of state insurance regulators. However, the payment of any dividend requires prior notice to the insurance regulator in the state of domicile and the regulator may prevent the dividend if, in its judgment, payment of the dividend would have an adverse effect on the capital and surplus of the insurance subsidiary. In addition, ProAssurance makes the decision to pay dividends from an insurance subsidiary based on the capital needs of that subsidiary and may pay less than the permitted dividend or may also request permission to pay an additional amount (an extraordinary dividend).
ProAssurance Corporation and Subsidiaries
Schedule I – Summary of Investments – Other than Investments in Related Parties
(In thousands)
| | | | | | | | | | | | | | | | | | | | |
| | December 31, 2024 |
| Type of Investment | | Recorded
Cost
Basis | | Fair
Value | | Amount Which is
Presented
in the
Balance Sheet |
| Fixed maturities | | | | | | |
| Bonds: | | | | | | |
| U.S. Government or government agencies and authorities | | $ | 285,378 | | | $ | 271,853 | | | $ | 271,853 | |
| States, municipalities and political subdivisions | | 470,974 | | | 446,601 | | | 446,601 | |
| Foreign governments | | 23,593 | | | 22,507 | | | 22,507 | |
| Public utilities | | 93,516 | | | 219,201 | | | 219,201 | |
| All other corporate bonds | | 1,755,738 | | | 1,526,168 | | | 1,526,168 | |
| | | | | | |
| Asset-backed securities | | 1,227,129 | | | 1,149,034 | | | 1,149,034 | |
| Total Fixed Maturities | | 3,856,328 | | | 3,635,364 | | | 3,635,364 | |
| | | | | | |
| | | | | | |
| | | | | | |
| | | | | | |
| Equity Securities | | | | | | |
| Common Stocks: | | | | | | |
| Public utilities | | 604 | | | 546 | | | 546 | |
| Banks, trusts and insurance companies | | 15,182 | | | 11,589 | | | 11,589 | |
| Industrial, miscellaneous and all other | | 129,625 | | | 118,023 | | | 118,023 | |
| Total Equity Securities, trading | | 145,411 | | | 130,158 | | | 130,158 | |
| | | | | | |
| Other long-term investments | | 281,796 | | | 346,983 | | | 346,983 | |
| Short-term investments | | 254,903 | | | 254,922 | | | 254,922 | |
| Total Investments | | $ | 4,538,438 | | | $ | 4,367,427 | | | $ | 4,367,427 | |
ProAssurance Corporation and Subsidiaries
Schedule II – Condensed Financial Information of Registrant
Condensed Balance Sheet
(In thousands)
| | | | | | | | | | | |
| December 31,
2024 | | December 31,
2023 |
| Assets | | | |
| Investment in subsidiaries, at equity | $ | 1,325,710 | | | $ | 1,287,347 | |
| Fixed maturities available for sale, at fair value | 19,998 | | | 20,044 | |
| | | |
| Short-term investments | 59,356 | | | 16,495 | |
| Investment in unconsolidated subsidiaries | 945 | | | 945 | |
| Cash and cash equivalents | 6,928 | | | 17,731 | |
| | | |
| Due from subsidiaries | 25,943 | | | 11,190 | |
| Other assets | 12,528 | | | 17,732 | |
| Total Assets | $ | 1,451,408 | | | $ | 1,371,484 | |
| Liabilities and Shareholders’ Equity | | | |
| Liabilities: | | | |
| | | |
| | | |
| Other liabilities | $ | 5,949 | | | $ | 11,758 | |
| Debt less debt issuance costs | 243,710 | | | 247,746 | |
| Total Liabilities | 249,659 | | | 259,504 | |
| Shareholders’ Equity: | | | |
| Common stock | 638 | | | 636 | |
| Other shareholders’ equity, including unrealized gains (losses) on securities of subsidiaries | 1,201,111 | | | 1,111,344 | |
| Total Shareholders’ Equity | 1,201,749 | | | 1,111,980 | |
| Total Liabilities and Shareholders’ Equity | $ | 1,451,408 | | | $ | 1,371,484 | |
ProAssurance Corporation and Subsidiaries
Schedule II – Condensed Financial Information of Registrant
Condensed Statements of Income
(In thousands)
| | | | | | | | | | | | | | | | | |
| | Year Ended December 31 |
| 2024 | | 2023 | | 2022 |
| Revenues | | | | | |
| Net investment income (loss) | $ | 33 | | | $ | 762 | | | $ | (663) | |
| Equity in earnings (loss) of unconsolidated subsidiaries | — | | | 30 | | | — | |
| Net investment gains (losses) | (285) | | | (22) | | | — | |
| Other income (loss) | 6,891 | | | 3,955 | | | 1,970 | |
| Total revenues | 6,639 | | | 4,725 | | | 1,307 | |
| Expenses | | | | | |
| Interest expense | 14,825 | | | 15,583 | | | 14,445 | |
| Other expenses | 36,245 | | | 30,357 | | | 32,513 | |
| Total expenses | 51,070 | | | 45,940 | | | 46,958 | |
| Income (loss) before income tax expense (benefit) and equity in net income (loss) of consolidated subsidiaries | (44,431) | | | (41,215) | | | (45,651) | |
| Income tax expense (benefit) | (11,092) | | | (6,001) | | | (7,994) | |
| Income (loss) before equity in net income (loss) of consolidated subsidiaries | (33,339) | | | (35,214) | | | (37,657) | |
| Equity in net income (loss) of consolidated subsidiaries | 86,083 | | | (3,390) | | | 37,255 | |
| Net income (loss) | 52,744 | | | (38,604) | | | (402) | |
| Other comprehensive income (loss) | 32,098 | | | 94,118 | | | (314,891) | |
| Comprehensive income (loss) | $ | 84,842 | | | $ | 55,514 | | | $ | (315,293) | |
ProAssurance Corporation and Subsidiaries
Schedule II – Condensed Financial Information of Registrant
Condensed Statements of Cash Flow
(In thousands)
| | | | | | | | | | | | | | | | | |
| | Year Ended December 31 |
| 2024 | | 2023 | | 2022 |
| Net cash provided (used) by operating activities | $ | 10,333 | | | $ | (23,313) | | | $ | (25,862) | |
| Investing activities | | | | | |
| | | | | |
| | | | | |
| | | | | |
| Proceeds from sales or maturities of: | | | | | |
| Fixed maturities, available for sale | 19,837 | | | 9,289 | | | 5,800 | |
| | | | | |
| Net decrease (increase) in short-term investments | (42,861) | | | 22,624 | | | 4,151 | |
| Return of invested capital from subsidiaries | 17 | | | 28,060 | | | 8,756 | |
| Contribution of capital to subsidiaries | — | | | (93) | | | (58) | |
| | | | | |
| | | | | |
| | | | | |
| Funds (advanced) repaid for Lloyd's FAL deposit | 9,116 | | | 4,106 | | | 11,131 | |
| | | | | |
| | | | | |
| Other | — | | | 140 | | | 14 | |
| Net cash provided (used) by investing activities | (13,891) | | | 64,126 | | | 29,794 | |
| Financing activities | | | | | |
| Borrowings (repayments) under Revolving Credit Agreement | (4,687) | | | 250,000 | | | — | |
| Borrowing (repayments) of Senior Notes | — | | | (250,000) | | | — | |
| Repurchase of common stock | 8 | | | (20,188) | | | (3,252) | |
| Subsidiary payments for common shares and share-based compensation awarded to subsidiary employees | (1,282) | | | (657) | | | (928) | |
| | | | | |
| Dividends to shareholders | — | | | (5,403) | | | (10,768) | |
| Other | (1,284) | | | (2,956) | | | (977) | |
| Net cash provided (used) by financing activities | (7,245) | | | (29,204) | | | (15,925) | |
| Increase (decrease) in cash and cash equivalents | (10,803) | | | 11,609 | | | (11,993) | |
| Cash and cash equivalents at beginning of period | 17,731 | | | 6,122 | | | 18,115 | |
| Cash and cash equivalents at end of period | $ | 6,928 | | | $ | 17,731 | | | $ | 6,122 | |
| | | | | |
| Supplemental disclosure of cash flow information: | | | | | |
| Cash paid (refunded) during the year for income taxes, net | $ | (3,866) | | | $ | (14,983) | | | $ | (6,081) | |
| Cash paid during the year for interest | $ | 16,996 | | | $ | 16,522 | | | $ | 14,071 | |
| | | | | |
| Significant non-cash transactions: | | | | | |
| Dividends declared and not yet paid | $ | — | | | $ | — | | | $ | 2,698 | |
| Securities transferred at fair value as dividends from subsidiaries | $ | 20,908 | | | $ | 3,022 | | | $ | 32,512 | |
| Operating ROU assets obtained in exchange for operating lease liabilities | $ | — | | | $ | — | | | $ | 3,133 | |
Basis of Presentation
The registrant-only financial statements should be read in conjunction with ProAssurance Corporation’s Consolidated Financial Statements and Notes thereto.
At December 31, 2024 and 2023, PRA investment in subsidiaries is stated at the initial consolidation value plus equity in the undistributed earnings of subsidiaries since the date of acquisition.
ProAssurance Corporation has a management agreement with its domestic operating subsidiaries whereby ProAssurance Corporation charges the operating subsidiaries a management fee for various management services provided to the subsidiary. Under the arrangement, the expenses associated with such services remain as expenses of ProAssurance Corporation and the management fee charged is reported as an offset to ProAssurance Corporation expenses.
ProAssurance Corporation and Subsidiaries
Schedule III – Supplementary Insurance Information
(In thousands)
| | | | | | | | | | | |
| 2024 | 2023 | 2022 |
| Net premiums earned | | | |
| Specialty P&C | $ | 747,942 | | $ | 755,817 | | $ | 793,400 | |
| Workers' Compensation Insurance | 167,610 | | 160,034 | | 166,371 | |
| Segregated Portfolio Cell Reinsurance | 52,698 | | 61,546 | | 69,810 | |
| Consolidated | $ | 968,250 | | $ | 977,397 | | $ | 1,029,581 | |
Net investment income (1) | | | |
| Segregated Portfolio Cell Reinsurance | $ | 3,608 | | $ | 2,289 | | $ | 1,029 | |
| Corporate | 140,930 | | 126,130 | | 94,943 | |
| Consolidated | $ | 144,538 | | $ | 128,419 | | $ | 95,972 | |
| Losses and loss adjustment expenses incurred related to current year, net of reinsurance | | | |
| Specialty P&C | $ | 615,418 | | $ | 624,481 | | $ | 648,531 | |
| Workers' Compensation Insurance | 129,024 | | 130,046 | | 119,407 | |
| Segregated Portfolio Cell Reinsurance | 35,208 | | 40,321 | | 45,577 | |
| Consolidated | $ | 779,650 | | $ | 794,848 | | $ | 813,515 | |
| Losses and loss adjustment expenses incurred related to prior year, net of reinsurance | | | |
| Specialty P&C | $ | (36,932) | | $ | 328 | | $ | (22,486) | |
| Workers' Compensation Insurance | (541) | | 9,276 | | (8,000) | |
| Segregated Portfolio Cell Reinsurance | (2,742) | | (3,958) | | (6,267) | |
| Consolidated | $ | (40,215) | | $ | 5,646 | | $ | (36,753) | |
| Paid losses and loss adjustment expenses, net of reinsurance | | | |
| Specialty P&C | $ | 684,737 | | $ | 721,152 | | $ | 704,635 | |
| Workers' Compensation Insurance | 124,626 | | 125,952 | | 123,098 | |
| Segregated Portfolio Cell Reinsurance | 37,153 | | 36,940 | | 38,007 | |
| Inter-segment eliminations | — | | — | | (37) | |
| Consolidated | $ | 846,516 | | $ | 884,044 | | $ | 865,703 | |
| Amortization of DPAC | | | |
| Specialty P&C | $ | 102,125 | | $ | 101,691 | | $ | 97,757 | |
| Workers' Compensation Insurance | 18,124 | | 15,201 | | 14,836 | |
| Segregated Portfolio Cell Reinsurance | 16,354 | | 18,371 | | 20,068 | |
| Inter-segment eliminations | (1,173) | | (450) | | 514 | |
| Consolidated | $ | 135,430 | | $ | 134,813 | | $ | 133,175 | |
|
| | | |
| Other underwriting, policy acquisition and operating expenses | | | |
| Specialty P&C | $ | 101,082 | | $ | 93,612 | | $ | 102,052 | |
| Workers' Compensation Insurance | 43,875 | | 39,860 | | 39,901 | |
| Segregated Portfolio Cell Reinsurance | 1,709 | | 2,086 | | 248 | |
| Corporate | 40,008 | | 34,007 | | 34,733 | |
Non-segmented items (2) | 320 | | — | | 1,862 | |
| Inter-segment eliminations | (3,085) | | (3,634) | | (4,633) | |
| Consolidated | $ | 183,909 | | $ | 165,931 | | $ | 174,163 | |
| Continued on the following page. |
ProAssurance Corporation and Subsidiaries
Schedule III – Supplementary Insurance Information
(In thousands)
| | | | | | | | | | | |
| 2024 | 2023 | 2022 |
| Continued from previous page. | | | |
| Net premiums written | | | |
| Specialty P&C | $ | 737,502 | | $ | 762,580 | | $ | 784,020 | |
| Workers' Compensation Insurance | 166,223 | | 162,285 | | 160,760 | |
| Segregated Portfolio Cell Reinsurance | 49,950 | | 61,129 | | 69,357 | |
| Consolidated | $ | 953,675 | | $ | 985,994 | | $ | 1,014,137 | |
Deferred policy acquisition costs (1) | $ | 59,026 | | $ | 60,336 | | $ | 58,148 | |
Reserve for losses and loss adjustment expenses (1) | $ | 3,257,696 | | $ | 3,401,281 | | $ | 3,471,147 | |
Unearned premiums (1) | $ | 418,756 | | $ | 433,715 | | $ | 422,950 | |
(1) Assets are not allocated to segments because investments, other than the investments that are solely allocated to the Segregated Portfolio Cell Reinsurance segment, and other assets are not managed at the segment level. See Note 16 of the Notes to Consolidated Financial Statements for additional information.
(2) Represents pre-tax actuarial consulting fees paid in connection with the final determination of contingent consideration associated with the acquisition of NORCAL in 2024 and pre-tax transaction-related costs associated with the acquisition of NORCAL in 2022. These costs are not included in a segment as ProAssurance does not consider these costs in assessing the financial performance of any of its operating or reportable segments. See Note 16 of the Notes to Consolidated Financial Statements for a reconciliation of the Company's segment results to its consolidated results.
ProAssurance Corporation and Subsidiaries
Schedule IV - Reinsurance
($ in thousands)
| | | | | | | | | | | |
| 2024 | 2023 | 2022 |
| Property and Liability * | | | |
| Premiums earned | $ | 1,009,010 | | $ | 1,008,915 | | $ | 1,058,263 | |
| Premiums ceded | (98,249) | | (94,379) | | (84,857) | |
| Premiums assumed | 57,489 | | 62,861 | | 56,175 | |
| Net premiums earned | $ | 968,250 | | $ | 977,397 | | $ | 1,029,581 | |
| Percentage of amount assumed to net | 5.94% | 6.43% | 5.46% |
| * All of ProAssurance’s premiums are related to property and liability coverages. |
EXHIBIT INDEX
| | | | | | | | |
| Exhibit Number | | Description |
| | |
| | Agreement and Plan of Acquisition by and among ProAssurance Corporation, PRA Professional Liability Group, Inc. and NORCAL Mutual Insurance Company dated as of February 20, 2020 filed as an Exhibit to ProAssurance's Quarterly Report on Form 10-Q for the quarter ended March 31, 2020 (File No. 001-16533) and incorporated herein by reference pursuant to SEC Rule 12b-32. |
| | |
| | Certificate of Incorporation of ProAssurance, filed as an Exhibit to ProAssurance’s Registration Statement on Form S-4 (File No. 333-49378) and incorporated herein by reference pursuant to SEC Rule 12b-32. |
| | |
| | Certificate of Amendment to Certificate of Incorporation of ProAssurance, filed as an Exhibit to ProAssurance’s Annual Report on Form 10-K for the year ended December 31, 2001 (File No. 001-16533) and incorporated herein by reference pursuant to SEC Rule 12b-32. |
| | |
| | Fourth Restatement of the Bylaws of ProAssurance, effective December 2, 2015, filed as an Exhibit to ProAssurance’s Annual Report on Form 10-K for the year ended December 31, 2015 (File No. 001-16533) and incorporated herein by reference pursuant to SEC Rule 12b-32. |
| | |
| | ProAssurance Corporation 2024 Equity Incentive Plan, filed as an Exhibit to ProAssurance’s Definitive Proxy Statement (File No. 001-16533) filed on May 22, 2024 and incorporated herein by reference pursuant to SEC Rule 12b-32.* |
| | |
| | Form of Release and Severance Compensation Agreement dated as of January 1, 2008 between ProAssurance and each of the following named executive officers*: |
| | Jeffrey P. Lisenby |
| | Edward L. Rand Jr. |
| | Filed as an Exhibit to ProAssurance’s Annual Report on Form 10-K for the year ended December 31, 2007 (File No. 001-16533) and incorporated herein by this reference pursuant to SEC Rule 12b-32. |
| | |
| | Employment Agreement between ProAssurance and Edward L. Rand, Jr. dated as of July 1, 2019, filed as an Exhibit to ProAssurance's Quarterly Report on Form 10-Q for the quarter ended September 30, 2019 (File No. 001-16533) and incorporated herein by reference pursuant to SEC Rule 12b-32, which supersedes the Release and Severance Compensation Agreement referenced in Exhibit 10.1.* |
| | |
| | Form of Release and Severance Compensation Agreement dated as of May 13, 2019 between ProAssurance and Dana S. Hendricks, filed as an Exhibit to ProAssurance's Annual Report on Form 10-K for the year ended December 31, 2019 (File No. 001-16533) and incorporated herein by reference pursuant to SEC Rule 12b-32.* |
| | |
| | Form of Release and Severance Compensation Agreement dated as of May 13, 2019 between ProAssurance and Kevin M. Shook, filed as an Exhibit to ProAssurance's Annual Report on Form 10-K for the year ended December 31, 2019 (File No. 001-16533) and incorporated herein by reference pursuant to SEC Rule 12b-32.* |
| | |
| | Form of Release and Severance Compensation Agreement dated as of December 7, 2022 between ProAssurance and Darryl K. Thomas, filed as an Exhibit to ProAssurance’s Annual Report on Form 10-K for the year ended December 31, 2022 (File No. 001-16533) and incorporated herein by this reference pursuant to SEC Rule 12b-32.* |
| | |
| | Form of Indemnification Agreement between ProAssurance and each of the following named executive officers and directors of ProAssurance*: |
| | M. James Gorrie
Ziad R. Haydar
Jeffrey P. Lisenby
Edward L. Rand, Jr.
Frank A. Spinosa
Ross E. Taubman
Thomas A. S. Wilson, Jr. |
| | Filed as an Exhibit to ProAssurance’s Annual Report on Form 10-K for the year ended December 31, 2010 (File No. 001-16533) and incorporated herein by reference pursuant to SEC Rule 12b-32. |
| | |
| | ProAssurance Group Employee Benefit Plan which includes the Executive Supplemental Life Insurance Program (Article VIII), filed as an Exhibit to ProAssurance's Annual Report on Form 10-K for the year ended December 31, 2004 (File No. 001-16533) and incorporated herein by reference pursuant to SEC Rule 12b-32.* |
| | |
| | |
| | | | | | | | |
| | Amendment and Restatement of the Executive Non-Qualified Excess Plan and Trust effective January 1, 2008, filed as an Exhibit to ProAssurance’s Annual Report on Form 10-K for the year ended December 31, 2007 (File No. 001-16533) and incorporated herein by this reference pursuant to SEC Rule 12b-32.* |
| | |
| | Director Deferred Compensation Plan as amended and restated December 7, 2011, filed as an Exhibit to ProAssurance's Annual Report on Form 10-K for the year ended December 31, 2011 (File No. 001-16533) and incorporated herein by reference pursuant to SEC Rule 12b-32.* |
| | |
| | Amendment No. 1 to the Amended and Restated Director Deferred Compensation Plan dated May 22, 2013, filed as an Exhibit to ProAssurance's Quarterly Report on Form 10-Q for the quarter ended June 30, 2013 (File No. 001-16533) and incorporated herein by reference pursuant to SEC Rule 12b-32.* |
| | |
| | Amendment No. 2 to the Amended and Restated Director Deferred Compensation Plan effective June 22, 2017, filed as an Exhibit to ProAssurance's Annual Report on Form 10-K for the year ended December 31, 2019 (File No. 001-16533) and incorporated herein by reference pursuant to SEC Rule 12b-32.* |
| | |
| | Amendment No. 3 to the Amended and Restated Director Deferred Compensation Plan effective March 6, 2019, filed as an Exhibit to ProAssurance's Annual Report on Form 10-K for the year ended December 31, 2019 (File No. 001-16533) and incorporated herein by reference pursuant to SEC Rule 12b-32.* |
| | |
| | Revolving Credit Agreement, dated April 15, 2011, between ProAssurance and U.S. Bank National Association, Wells Fargo Bank, National Association, Branch Banking and Trust Company, First Tennessee Bank, N.A., and JP Morgan Chase Bank N.A., filed as an Exhibit to ProAssurance’s Quarterly Report on Form 10-Q for the quarter ended June 30, 2011 (File No. 001-16533) and incorporated herein by reference pursuant to SEC Rule 12b-32. |
| | |
| | Amendment No. 1 to Revolving Credit Agreement between ProAssurance and U.S. Bank National Association, Wells Fargo Bank, National Association, Branch Banking and Trust Company, First Tennessee Bank, N.A., and JP Morgan Chase Bank N.A., filed as an Exhibit to ProAssurance's Quarterly Report on Form 10-Q for the quarter ended September 30, 2012 (File No. 001-16533) and incorporated herein by reference pursuant to SEC Rule 12b-32. |
| | |
| | Amendment No. 2 to Revolving Credit Agreement between ProAssurance and U.S. Bank National Association, Wells Fargo Bank, National Association, Branch Banking and Trust Company, First Tennessee Bank, N.A., and JP Morgan Chase Bank N.A., filed as an Exhibit to ProAssurance's Current Report on Form 8-K for the event occurring November 8, 2013 (File No. 001-16533) and incorporated herein by reference pursuant to SEC Rule 12b-32. |
| | |
| | Form of the Augmenting Lender Supplement to Revolving Credit Agreement between ProAssurance and U.S. Bank National Association, Wells Fargo Bank, National Association, Branch Banking and Trust Company, First Tennessee Bank, N.A., and JP Morgan Chase Bank N.A., filed as an Exhibit to ProAssurance's Current Report on Form 8-K for the event occurring April 1, 2014 (File No. 001-16533) and incorporated herein by reference pursuant to SEC Rule 12b-32. |
| | |
| | Amendment No. 4 to Revolving Credit Agreement between ProAssurance and U.S. Bank National Association., Wells Fargo Bank, National Association, Branch Banking and Trust Company, First Tennessee Bank, N.A., KeyBank N.A., Cadence Bank, N.A., and Regions Bank, N.A., dated June 19, 2015, filed as an Exhibit to ProAssurance’s Quarterly Report on Form 10-Q for the quarter ended June 30, 2015 (File No. 001-16533) and incorporated herein by reference pursuant to SEC Rule 12b-32. |
| | |
| | Amendment No. 5 to Revolving Credit Agreement between ProAssurance and U.S. Bank National Association, Wells Fargo Bank, National Association, Branch Banking and Trust Company, First Tennessee Bank, N.A., KeyBank N.A., Cadence Bank N.A. and Regions Bank, filed as an Exhibit to ProAssurance's Annual Report on Form 10-K for the year ended December 31, 2017 (File No. 001-16533) and incorporated herein by reference pursuant to SEC Rule 12b-32. |
| | |
| | Amended and Restated Revolving Credit Agreement between ProAssurance and U.S. Bank N.A., Wells Fargo Bank, National Association, Branch Banking and Trust Company, First Tennessee Bank, N.A., KeyBank N.A., Cadence Bank, N.A. and Regions Bank, filed as an Exhibit to ProAssurance's Annual Report on Form 10-K for the year ended December 31, 2019 (File No. 001-16533) and incorporated herein by reference pursuant to SEC Rule 12b-32. |
| | |
| | Amendment No. 1 to Amended and Restated Revolving Credit Agreement, dated as of April 19, 2021, between ProAssurance and U.S. Bank N.A., Wells Fargo Bank N.A., KeyBank N.A., Regions Bank, Trust Bank, Cadence Bank N.A., and First Horizon Bank, filed as an Exhibit to ProAssurance's Quarterly Report on Form 10-Q for the quarter ended March 31, 2021 (File No. 001-16533) and incorporated herein by reference pursuant to SEC Rule 12b-32. |
| | |
| | | | | | | | |
| | Amendment No. 2 to Amended and Restated Revolving Credit Agreement, dated as of April 28, 2023, between ProAssurance and U.S. Bank N.A., KeyBank N.A., Regions Bank, Truist Bank, Cadence Bank, First Horizon Bank, Pinnacle Bank and Synovus, filed as an Exhibit to ProAssurance's Quarterly Report on Form 10-Q for the quarter ended March 31, 2022 (File No. 001-16533) and incorporated herein by reference pursuant to SEC Rule 12b-32. |
| | |
| | Pledge and Security Agreement between ProAssurance and U.S. Bank National Association, filed as an Exhibit to ProAssurance’s Quarterly Report on Form 10-Q for the quarter ended June 30, 2011 (File No. 001-16533) and incorporated herein by reference pursuant to SEC Rule 12b-32. |
| | |
| | |
| | |
| | |
| | |
| | |
| | |
| | |
| | |
| | |
| | |
| | |
| | |
| | Interest Rate Swap Agreement associated with ProAssurance's amendment No. 2 to amended and restated Revolving Credit Agreement, dated as of May 2, 2023, between ProAssurance and U.S. Bank N.A., filed as an Exhibit to ProAssurance's Quarterly Report on Form 10-Q for the quarter ended March 31, 2022 (File No. 001-16533) and incorporated herein by reference pursuant to SEC Rule 12b-32. |
| | |
| | Interest Rate Swap Agreement associated with ProAssurance's delayed draw Term Loan, dated as of May 2, 2023, between ProAssurance and U.S. Bank N.A., filed as an Exhibit to ProAssurance's Quarterly Report on Form 10-Q for the quarter ended March 31, 2022 (File No. 001-16533) and incorporated herein by reference pursuant to SEC Rule 12b-32. |
| | |
| | Form of Release and Severance Compensation Agreement dated as of April 22, 2024 between ProAssurance and Robert D. Francis, filed as an Exhibit to ProAssurance's Quarterly Report on Form 10-Q for the quarter ended June 30, 2024 (File No. 001-16533) and incorporated herein by reference pursuant to SEC Rule 12b-32.* |
| | |
| | Code of Ethics and Conduct dated as of January 1, 2021 filed as an Exhibit to ProAssurance's Annual Report on Form 10-K for the year ended December 31, 2024 (File No. 00-1-6533) and incorporated herein by reference pursuant to SEC Rule 12b-32. |
| | |
| | Securities Trading Policy (included in the Code of Ethics and Conduct) |
| | |
| | Subsidiaries of ProAssurance Corporation |
| | |
| | Consent of Ernst & Young LLP |
| | |
| | Certification of Principal Executive Officer of ProAssurance as required under SEC Rule 13a-14(a) |
| | |
| | Certification of Principal Financial Officer of ProAssurance as required under SEC Rule 13a-14(a) |
| | |
| | Certification of Principal Executive Officer of ProAssurance as required under SEC Rule 13a-14(b) and Section 1350 of Chapter 63 of Title 18 of the United States Code, as amended (18 U.S.C. 1350) |
| | |
| | Certification of Principal Financial Officer of ProAssurance as required under SEC Rule 13a-14(b) and 18 U.S.C. 1350 |
| | |
| | ProAssurance Corporation Policy Relating to Recovery of Erroneously Awarded Compensation |
| | |
| | XBRL Instance Document |
| | |
| | XBRL Taxonomy Extension Schema Document |
| | |
| | XBRL Taxonomy Extension Calculation Linkbase Document |
| | |
| | XBRL Taxonomy Extension Definition Linkbase Document |
| | |
| | XBRL Taxonomy Extension Labels Linkbase Document |
| | |
| | XBRL Taxonomy Extension Presentation Linkbase Document |
| * Denotes a management contract or compensatory plan, contract or arrangement required to be filed as an Exhibit to this report. |