FIRST FEDERAL OF NORTHERN MICHIGAN BANCORP, INC. 8-K
Exhibit 99.1
First Federal of Northern Michigan Bancorp, Inc . 2015 Annual Meeting Martin A. Thomson – Chairman Michael W. Mahler – CEO

The Pledge of Allegiance I pledge allegiance to the Flag of the United States of America, and to the Republic for which it stands, one nation under God, indivisible, with liberty and justice for all.
FFNM Bancorp, Inc. May 13, 2015 Shareholder Meeting Martin Thomson - Chairman Board Member and Senior Officer Introductions
FFNM Bancorp, Inc. May 13, 2015 Shareholder Meeting Michael W. Mahler - CEO 2014 Overview Asset Quality Review Performance Drivers Financial Results Looking Ahead

Private Securities Litigation Reform Act Safe Harbor Statement This Presentation contains forward - looking statements within the meaning of the Private Securities Litigation Reform Act of 195 5, which can be identified by the use of words such as “estimate,” “project,” “believe,” “intend,” “anticipate,” “plan,” “seek,” “expect,” “will,” “may, ” a nd words of similar meaning. These forward - looking statements include, but are not limited to: • statements of our goals, intentions and expectations; • statements regarding our business plans, prospects, growth and operating strategies; • statements regarding the asset quality of our loan and investment portfolios; and • estimates of our risks and future costs and benefits. These forward - looking statements are based on our current beliefs and expectations and are inherently subject to significant bu siness, economic and competitive uncertainties and contingencies, many of which are beyond our control. In addition, these forward - looking statements are subject to assumptions with respect to future business strategies and decisions that are subject to change. We are under no duty to and do not take any o bli gation to update any forward - looking statements after the date of this Annual Meeting. The following factors, among others, could cause actual results to differ materially from the anticipated results or other ex pe ctations expressed in the forward - looking statements: • general economic conditions, either nationally or in our market areas, that are worse than expected; • competition among depository and other financial institutions; • inflation and changes in the interest rate environment that reduce our margins or reduce the fair value of financial instrume nts; • adverse changes in the securities markets; • changes in laws or government regulations or policies affecting financial institutions, including changes in regulatory fees and capital requirements; • our ability to enter new markets successfully and capitalize on growth opportunities; • our ability to successfully integrate acquired entities; • changes in consumer spending, borrowing and savings habits; • changes in accounting policies and practices, as may be adopted by the regulatory agencies, the Financial Accounting Standard s Board, the Securities and Exchange Commission and the Public Company Accounting Oversight Board; • changes in our organization, compensation and benefit plans; • changes in our financial condition or results or operations that reduce capital available to pay dividends; • regulatory changes or actions; and • changes in the financial condition or future prospects of issuers of securities that we own. Because of these and a wide variety of other uncertainties, our actual future results may be materially different from the re sul ts indicated by these forward - looking statements.
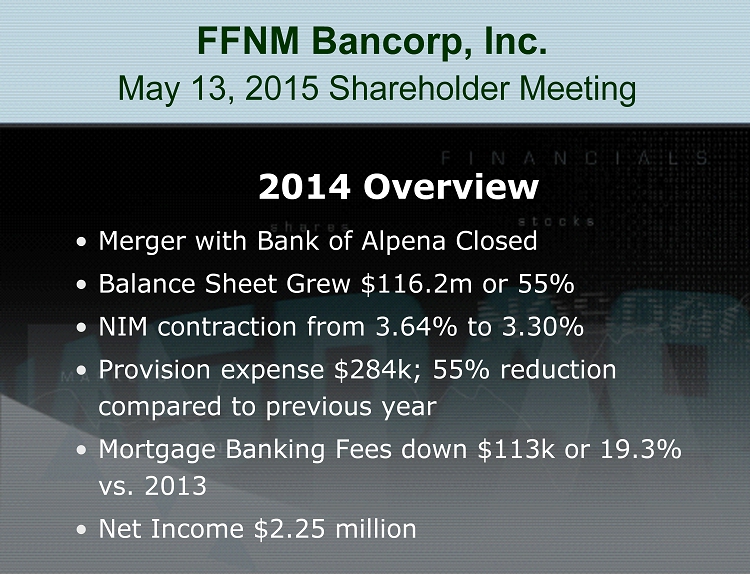
FFNM Bancorp, Inc. May 13, 2015 Shareholder Meeting 2014 Overview • Merger with Bank of Alpena Closed • Balance Sheet Grew $116.2m or 55% • NIM contraction from 3.64% to 3.30% • Provision expense $284k; 55% reduction compared to previous year • Mortgage Banking Fees down $113k or 19.3% vs. 2013 • Net Income $2.25 million
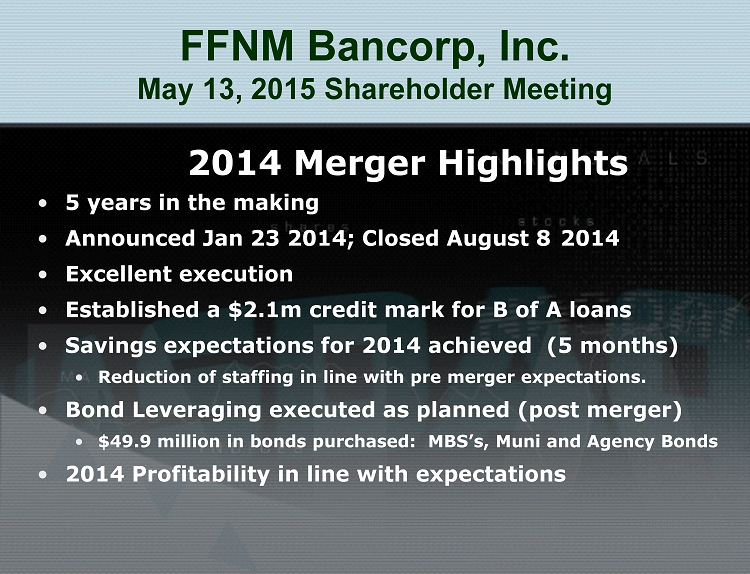
FFNM Bancorp, Inc. May 13, 2015 Shareholder Meeting 2014 Merger Highlights • 5 years in the making • Announced Jan 23 2014; Closed August 8 2014 • Excellent execution • Established a $2.1m credit mark for B of A loans • Savings expectations for 2014 achieved (5 months) • Reduction of staffing in line with pre merger expectations. • Bond Leveraging executed as planned (post merger) • $49.9 million in bonds purchased: MBS’s, Muni and Agency Bonds • 2014 Profitability in line with expectations
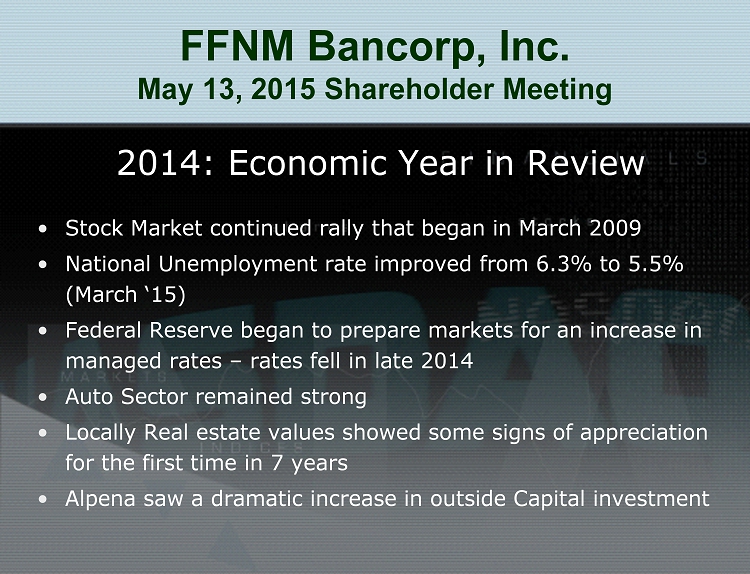
FFNM Bancorp, Inc. May 13, 2015 Shareholder Meeting 2014: Economic Year in Review • Stock Market continued rally that began in March 2009 • National Unemployment rate improved from 6.3% to 5.5% (March ‘15) • Federal Reserve began to prepare markets for an increase in managed rates – rates fell in late 2014 • Auto Sector remained strong • Locally Real estate values showed some signs of appreciation for the first time in 7 years • Alpena saw a dramatic increase in outside Capital investment
FFNM Bancorp, Inc. May 13, 2015 Shareholder Meeting Asset Quality Review
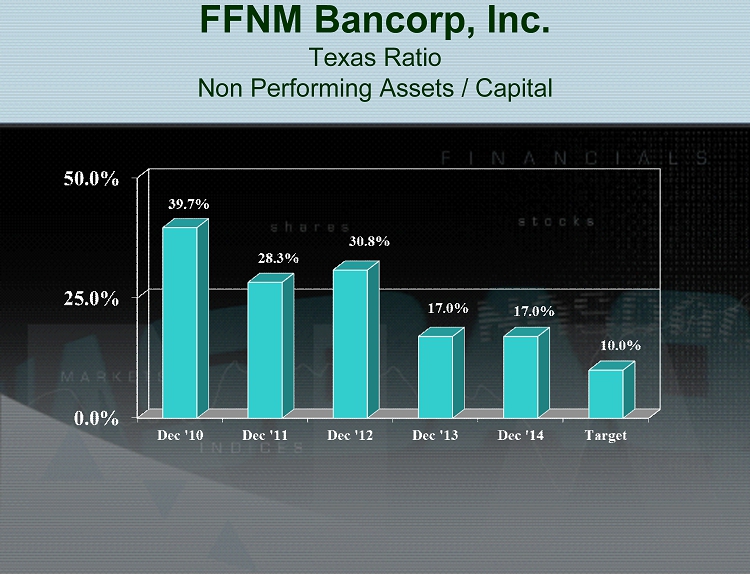
FFNM Bancorp, Inc. Texas Ratio Non Performing Assets / Capital
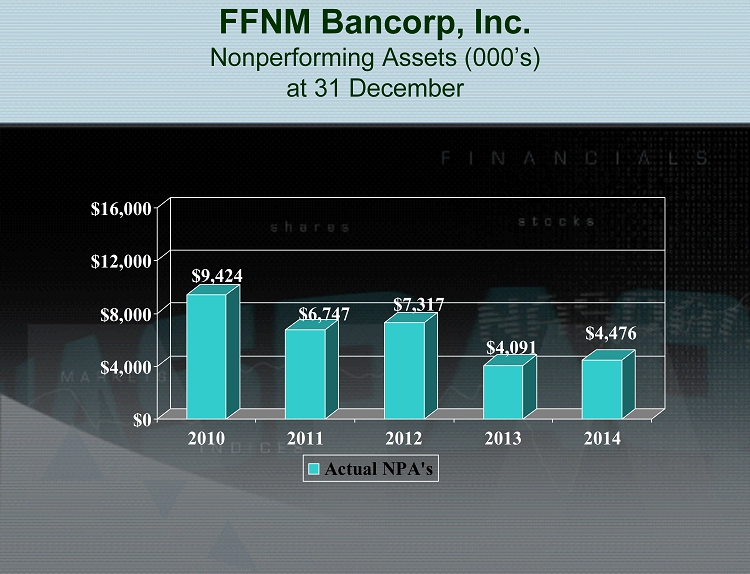
FFNM Bancorp, Inc. Nonperforming Assets (000’s) at 31 December $9,424 $6,747 $7,317 $4,091 $4,476 $0 $4,000 $8,000 $12,000 $16,000 2010 2011 2012 2013 2014 Actual NPA's
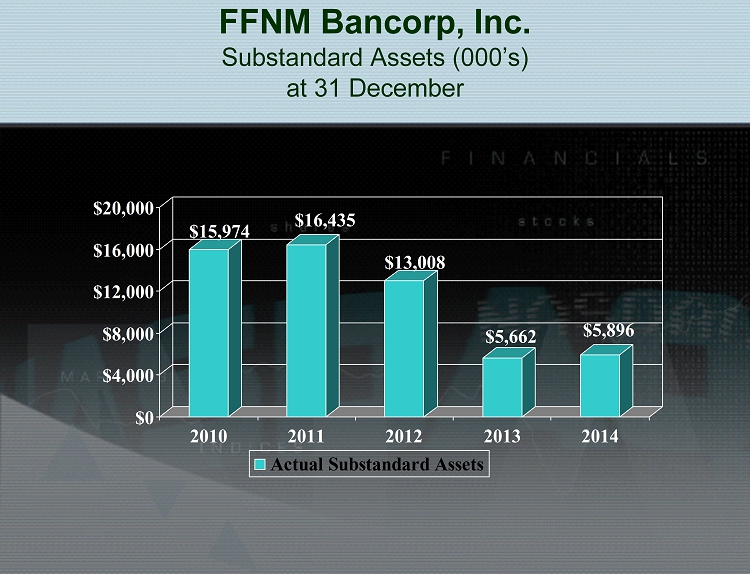
FFNM Bancorp, Inc. Substandard Assets (000’s) at 31 December $15,974 $16,435 $13,008 $5,662 $5,896 $0 $4,000 $8,000 $12,000 $16,000 $20,000 2010 2011 2012 2013 2014 Actual Substandard Assets
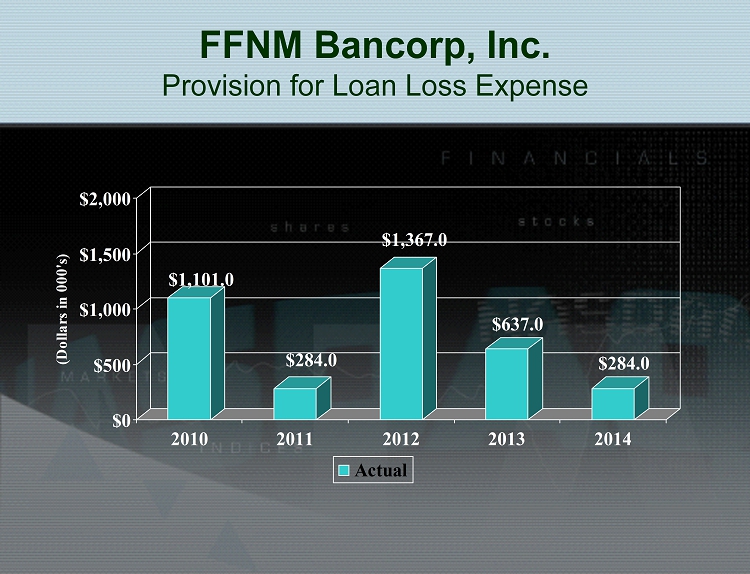
FFNM Bancorp, Inc. Provision for Loan Loss Expense $1,101.0 $284.0 $1,367.0 $637.0 $284.0 $0 $500 $1,000 $1,500 $2,000 (Dollars in 000's) 2010 2011 2012 2013 2014 Actual
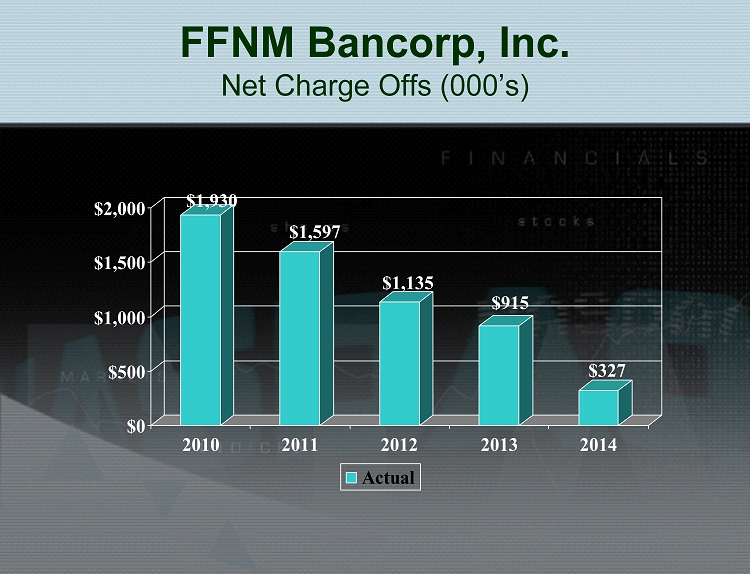
FFNM Bancorp, Inc. Net Charge Offs (000’s) $1,930 $1,597 $1,135 $915 $327 $0 $500 $1,000 $1,500 $2,000 2010 2011 2012 2013 2014 Actual
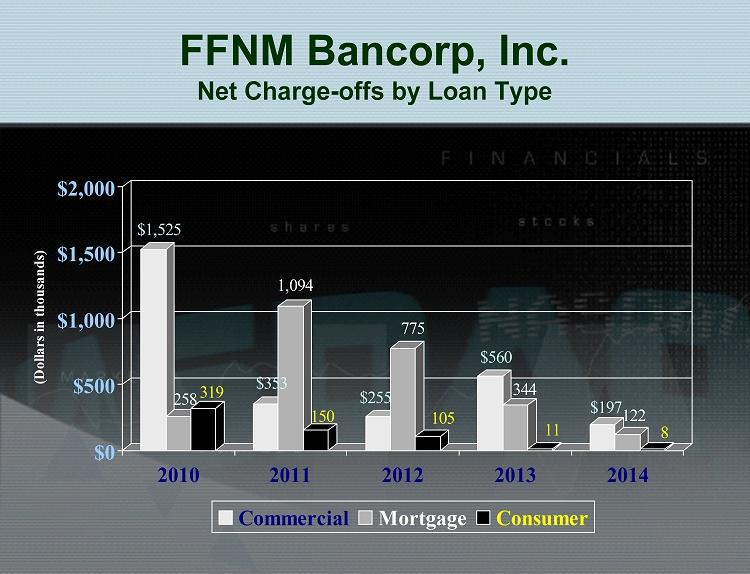
FFNM Bancorp, Inc. Net Charge - offs by Loan Type $1,525 258 319 $353 1,094 150 $255 775 105 $560 344 11 $197 122 8 $0 $500 $1,000 $1,500 $2,000 (Dollars in thousands) 2010 2011 2012 2013 2014 Commercial Mortgage Consumer
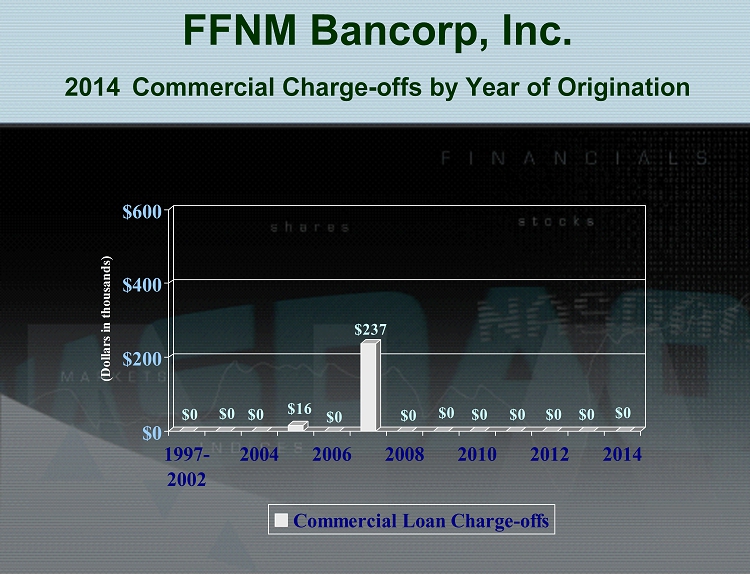
FFNM Bancorp, Inc. 2014 Commercial Charge - offs by Year of Origination $0 $0 $0 $16 $0 $237 $0 $0 $0 $0 $0 $0 $0 $0 $200 $400 $600 (Dollars in thousands) 1997- 2002 2004 2006 2008 2010 2012 2014 Commercial Loan Charge-offs
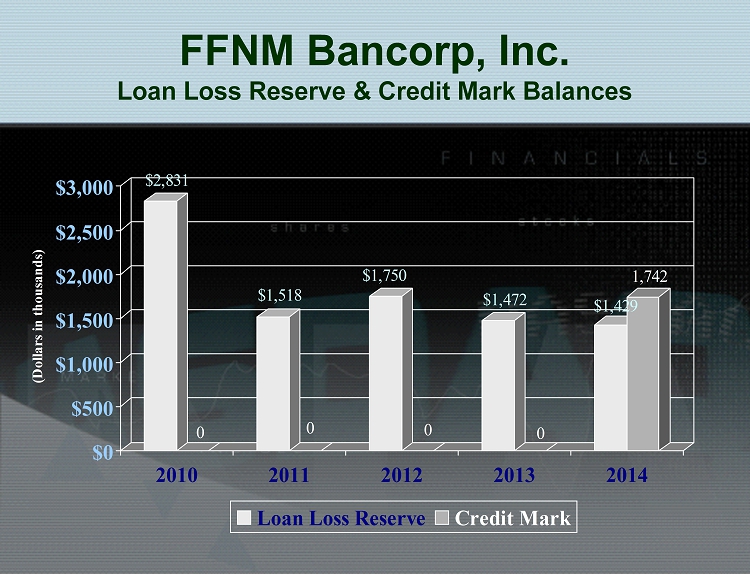
FFNM Bancorp, Inc. Loan Loss Reserve & Credit Mark Balances $2,831 0 $1,518 0 $1,750 0 $1,472 0 $1,429 1,742 $0 $500 $1,000 $1,500 $2,000 $2,500 $3,000 (Dollars in thousands) 2010 2011 2012 2013 2014 Loan Loss Reserve Credit Mark
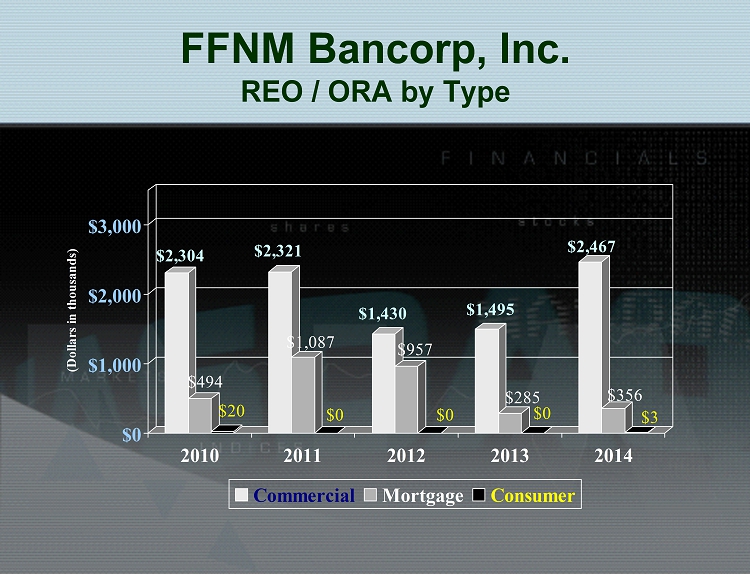
FFNM Bancorp, Inc. REO / ORA by Type $2,304 $494 $20 $2,321 $1,087 $0 $1,430 $957 $0 $1,495 $285 $0 $2,467 $356 $3 $0 $1,000 $2,000 $3,000 (Dollars in thousands) 2010 2011 2012 2013 2014 Commercial Mortgage Consumer
FFNM Bancorp, Inc. May 14, 2014 Shareholder Meeting Performance Drivers
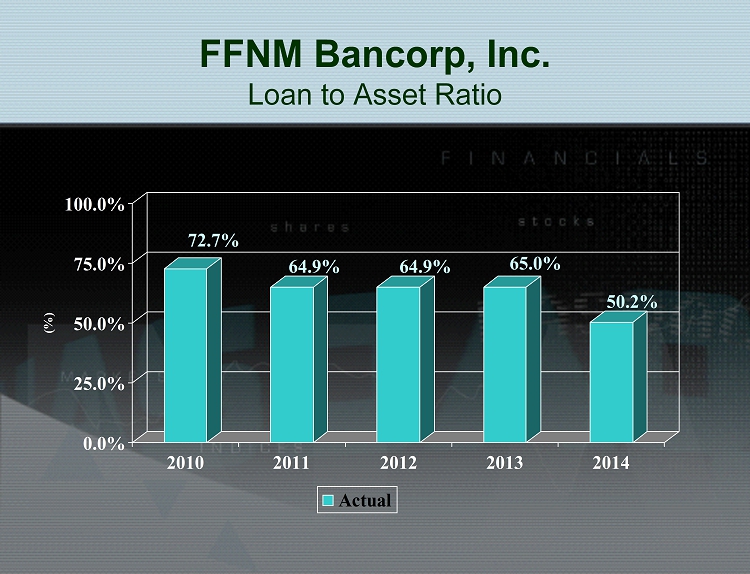
FFNM Bancorp, Inc. Loan to Asset Ratio 72.7% 64.9% 64.9% 65.0% 50.2% 0.0% 25.0% 50.0% 75.0% 100.0% (%) 2010 2011 2012 2013 2014 Actual
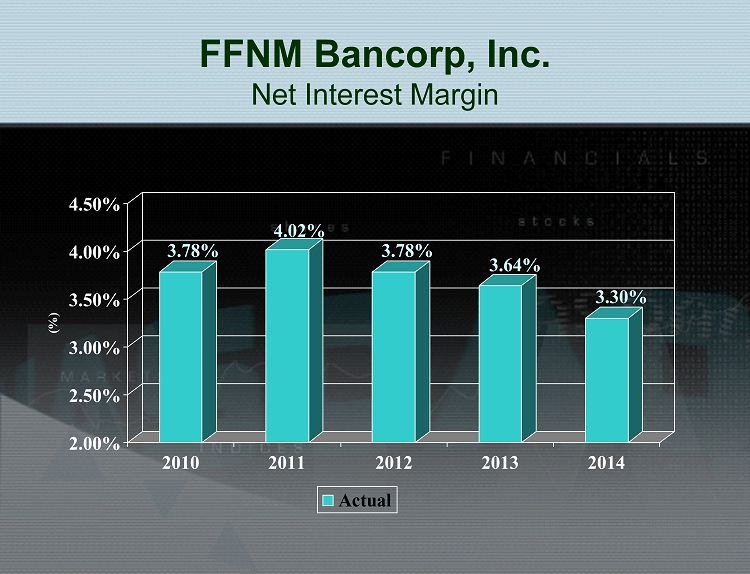
FFNM Bancorp, Inc. Net Interest Margin 3.78% 4.02% 3.78% 3.64% 3.30% 2.00% 2.50% 3.00% 3.50% 4.00% 4.50% (%) 2010 2011 2012 2013 2014 Actual
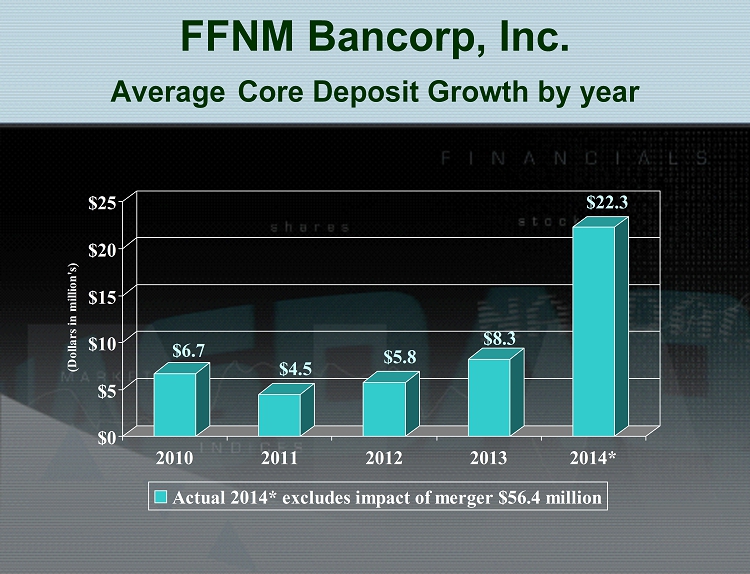
FFNM Bancorp, Inc. Average Core Deposit Growth by year $6.7 $4.5 $5.8 $8.3 $22.3 $0 $5 $10 $15 $20 $25 (Dollars in million's) 2010 2011 2012 2013 2014* Actual 2014* excludes impact of merger $56.4 million
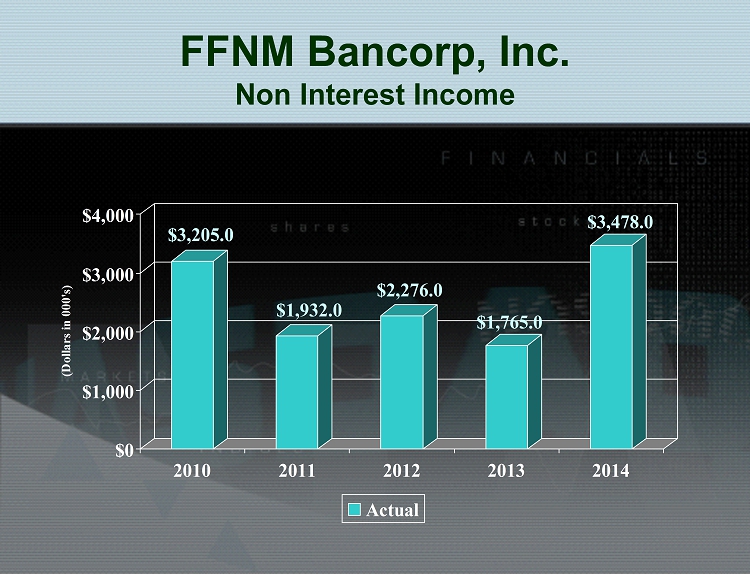
FFNM Bancorp, Inc. Non Interest Income $3,205.0 $1,932.0 $2,276.0 $1,765.0 $3,478.0 $0 $1,000 $2,000 $3,000 $4,000 (Dollars in 000's) 2010 2011 2012 2013 2014 Actual
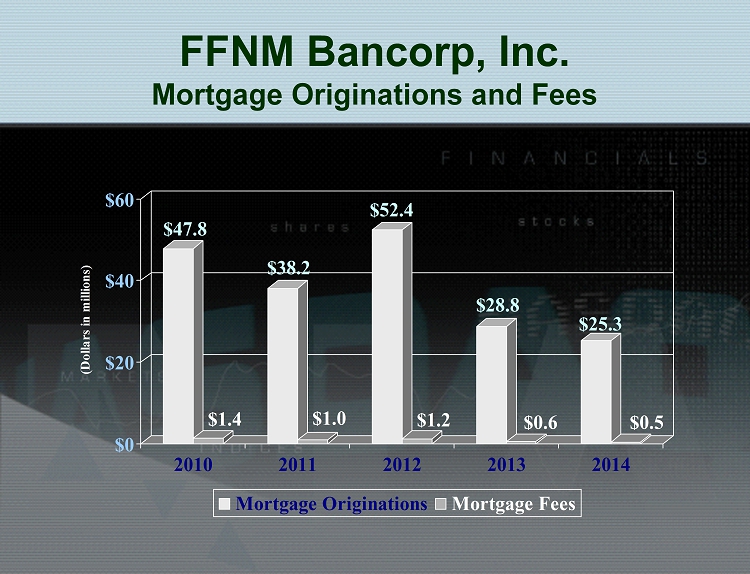
FFNM Bancorp, Inc. Mortgage Originations and Fees $47.8 $1.4 $38.2 $1.0 $52.4 $1.2 $28.8 $0.6 $25.3 $0.5 $0 $20 $40 $60 (Dollars in millions) 2010 2011 2012 2013 2014 Mortgage Originations Mortgage Fees
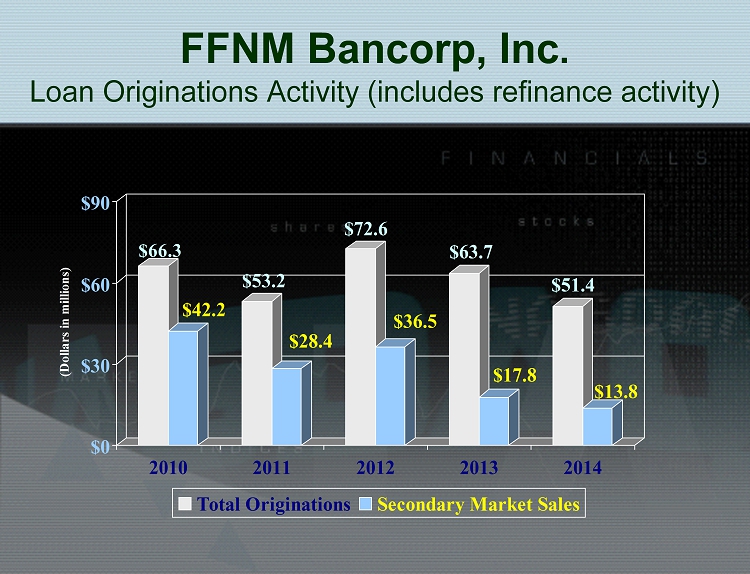
FFNM Bancorp, Inc . Loan Originations Activity (includes refinance activity) $66.3 $42.2 $53.2 $28.4 $72.6 $36.5 $63.7 $17.8 $51.4 $13.8 $0 $30 $60 $90 (Dollars in millions) 2010 2011 2012 2013 2014 Total Originations Secondary Market Sales

FFNM Bancorp, Inc. Loan Originations by Type $47.8 14.8 3.7 $38.2 12.9 2.1 $52.4 18.2 2.0 $28.8 33.2 1.6 $25.3 23.9 2.3 $0 $10 $20 $30 $40 $50 $60 $70 (Dollars in millions) 2010 2011 2012 2013 2014 Mortgage Commercial Consumer
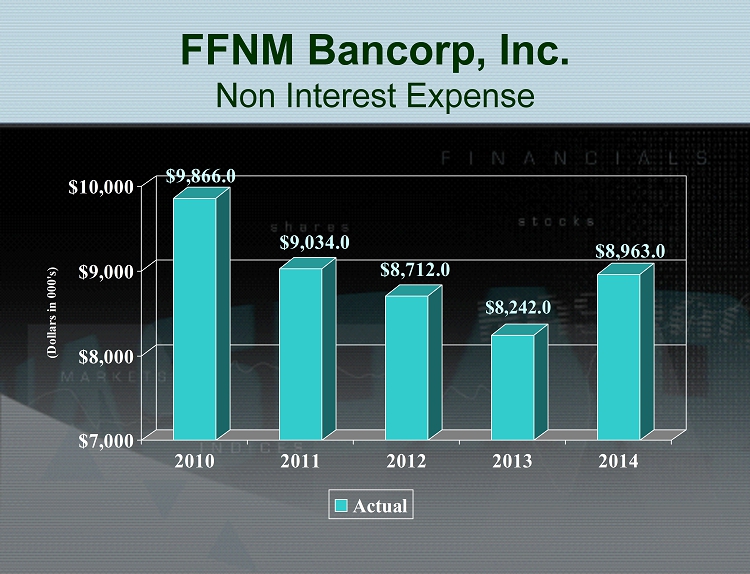
FFNM Bancorp, Inc. Non Interest Expense $9,866.0 $9,034.0 $8,712.0 $8,242.0 $8,963.0 $7,000 $8,000 $9,000 $10,000 (Dollars in 000's) 2010 2011 2012 2013 2014 Actual
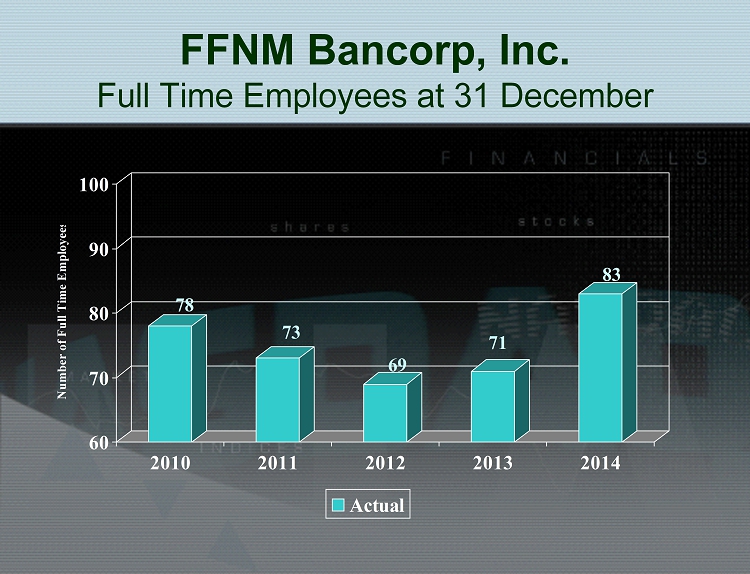
FFNM Bancorp, Inc. Full Time Employees at 31 December 78 73 69 71 83 60 70 80 90 100 Number of Full Time Employees 2010 2011 2012 2013 2014 Actual
FFNM Bancorp, Inc. 2014 Financial Results
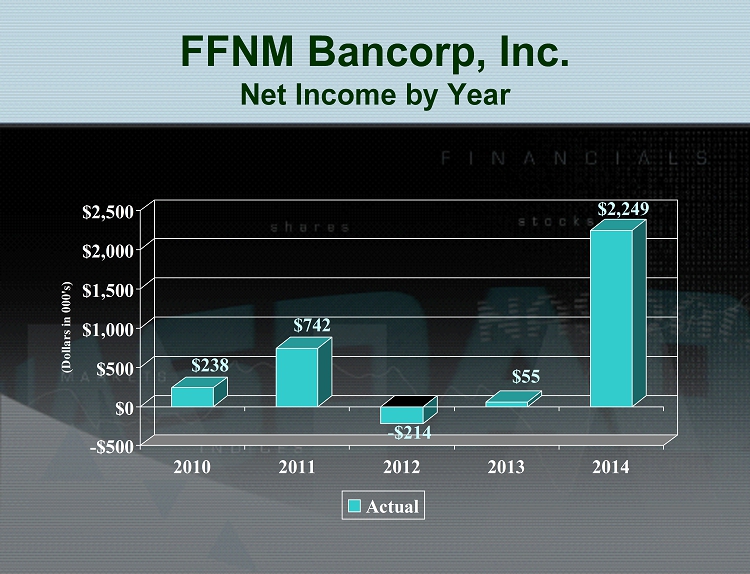
FFNM Bancorp, Inc. Net Income by Year $238 $742 -$214 $55 $2,249 -$500 $0 $500 $1,000 $1,500 $2,000 $2,500 (Dollars in 000's) 2010 2011 2012 2013 2014 Actual
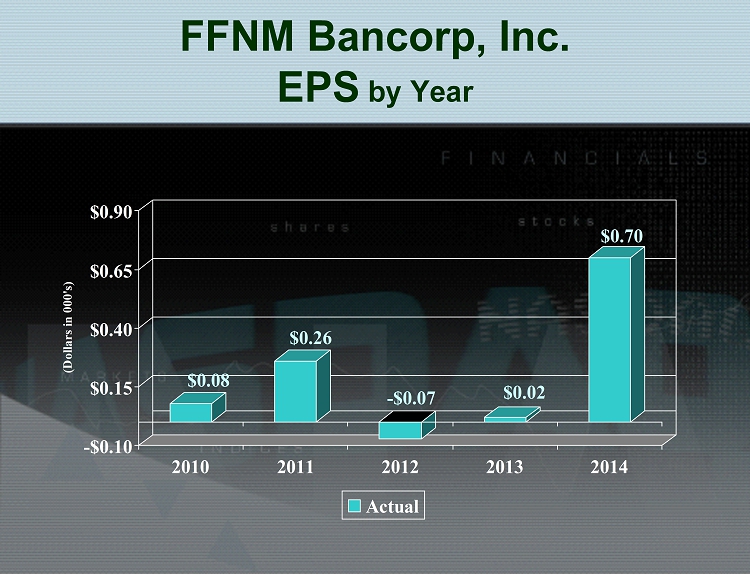
FFNM Bancorp, Inc. EPS by Year $0.08 $0.26 -$0.07 $0.02 $0.70 -$0.10 $0.15 $0.40 $0.65 $0.90 (Dollars in 000's) 2010 2011 2012 2013 2014 Actual
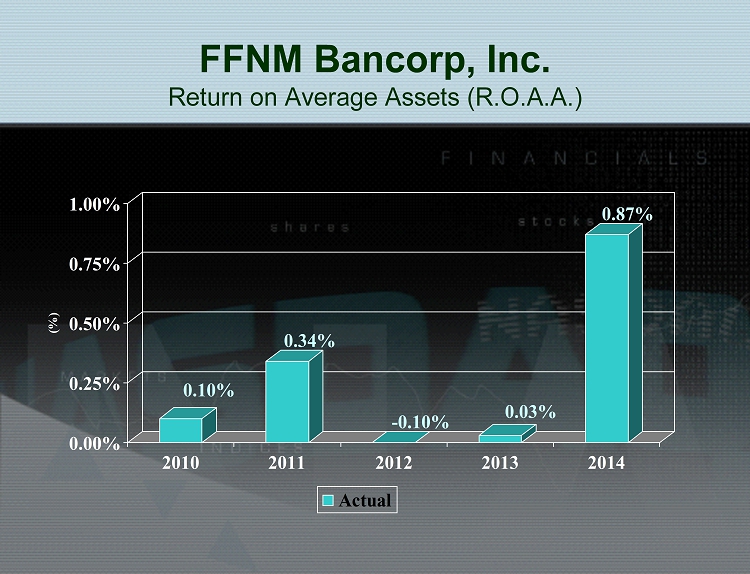
FFNM Bancorp, Inc. Return on Average Assets (R.O.A.A.) 0.10% 0.34% -0.10% 0.03% 0.87% 0.00% 0.25% 0.50% 0.75% 1.00% (%) 2010 2011 2012 2013 2014 Actual
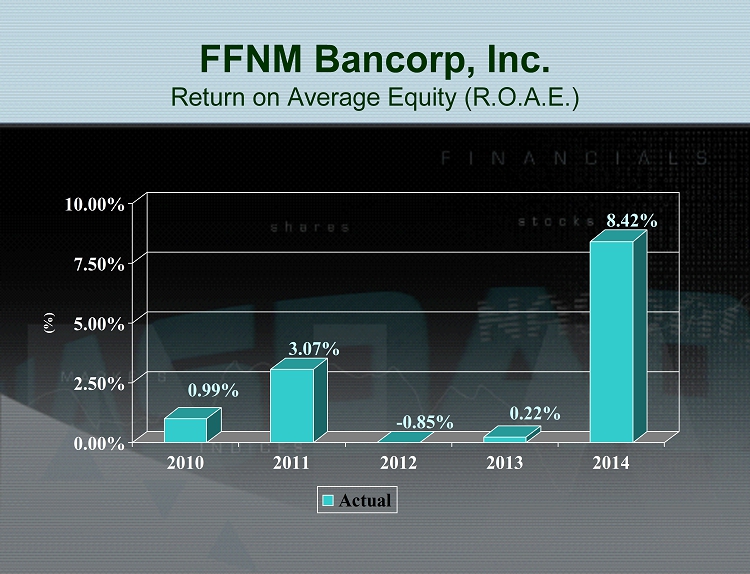
FFNM Bancorp, Inc. Return on Average Equity (R.O.A.E.) 0.99% 3.07% -0.85% 0.22% 8.42% 0.00% 2.50% 5.00% 7.50% 10.00% (%) 2010 2011 2012 2013 2014 Actual
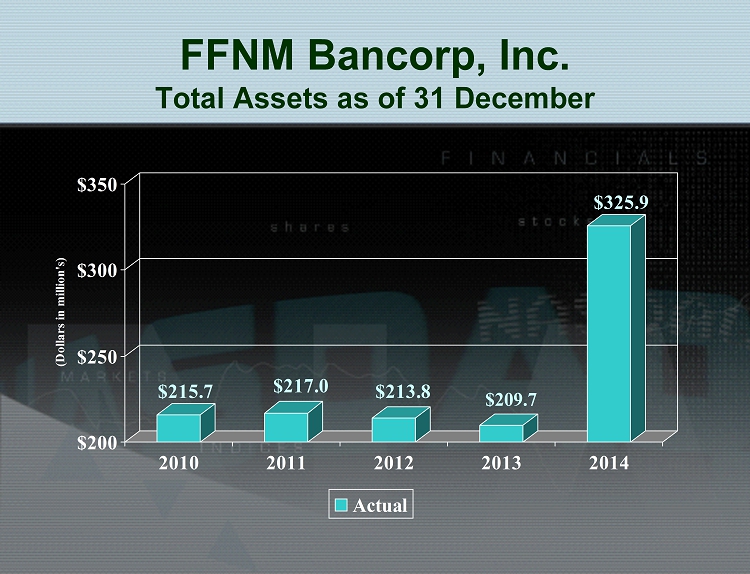
FFNM Bancorp, Inc. Total Assets as of 31 December $215.7 $217.0 $213.8 $209.7 $325.9 $200 $250 $300 $350 (Dollars in million's) 2010 2011 2012 2013 2014 Actual
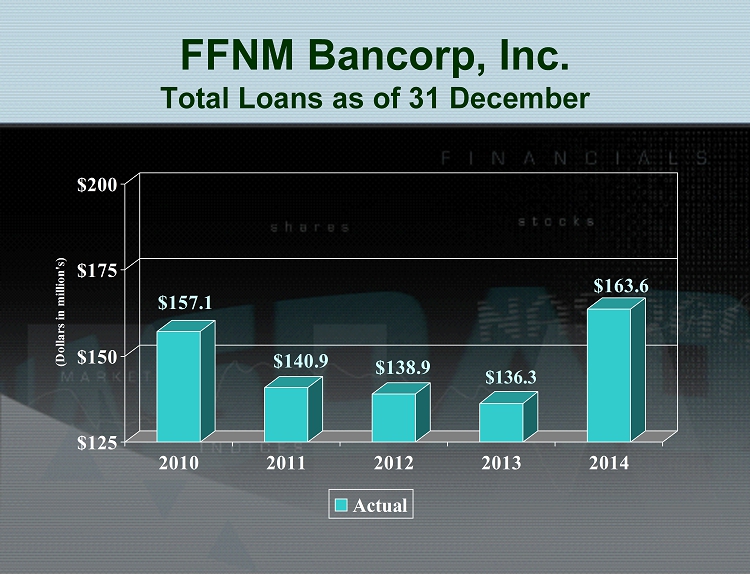
FFNM Bancorp, Inc. Total Loans as of 31 December $157.1 $140.9 $138.9 $136.3 $163.6 $125 $150 $175 $200 (Dollars in million's) 2010 2011 2012 2013 2014 Actual
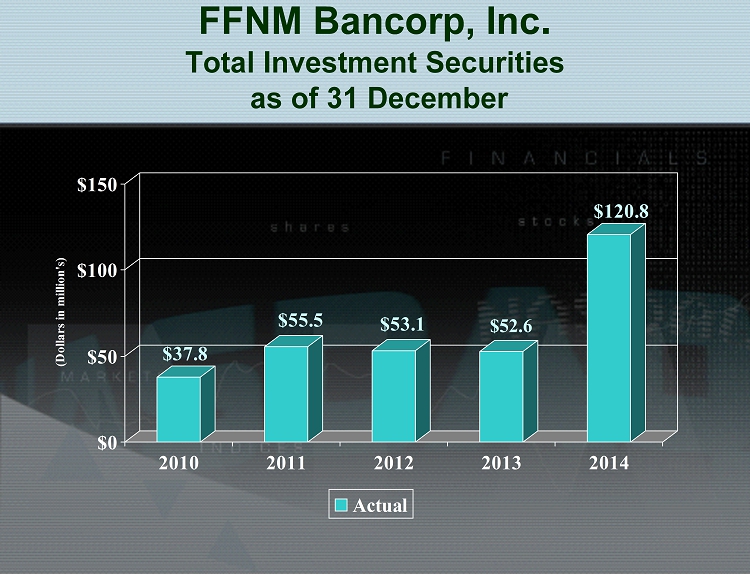
FFNM Bancorp, Inc . Total Investment Securities as of 31 December $37.8 $55.5 $53.1 $52.6 $120.8 $0 $50 $100 $150 (Dollars in million's) 2010 2011 2012 2013 2014 Actual
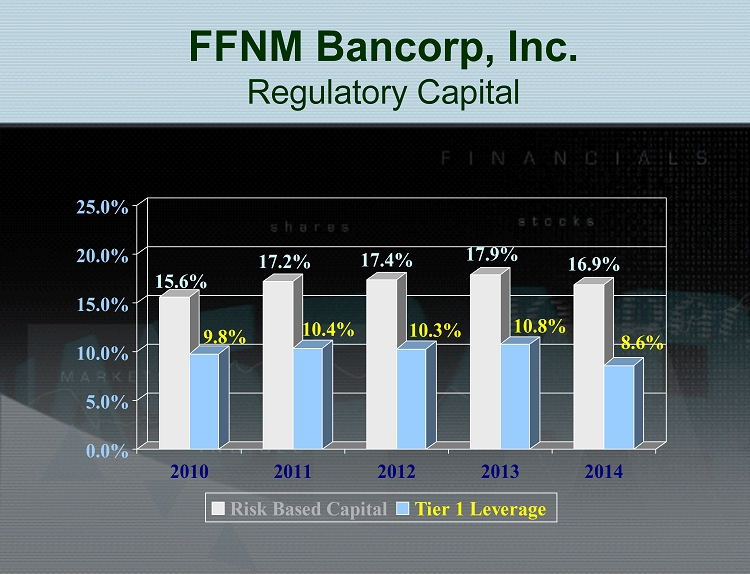
FFNM Bancorp, Inc. Regulatory Capital 15.6% 9.8% 17.2% 10.4% 17.4% 10.3% 17.9% 10.8% 16.9% 8.6% 0.0% 5.0% 10.0% 15.0% 20.0% 25.0% 2010 2011 2012 2013 2014 Risk Based Capital Tier 1 Leverage
FFNM Bancorp, Inc. Looking Ahead
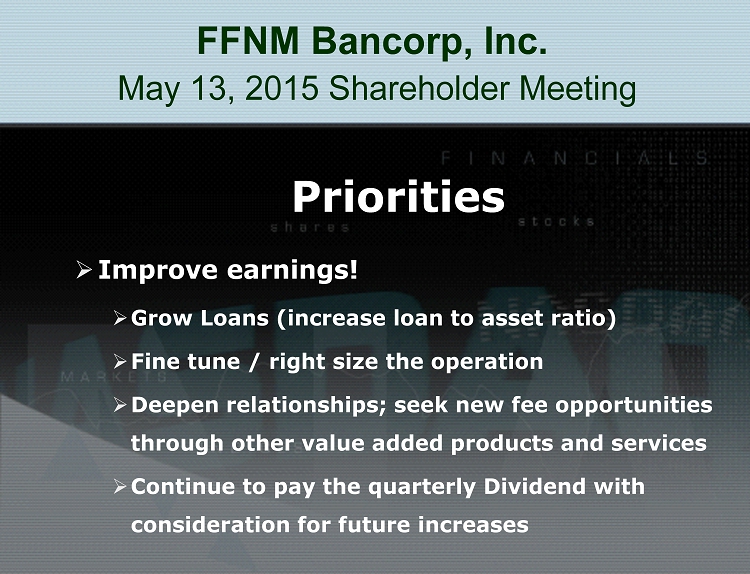
FFNM Bancorp, Inc. May 13, 2015 Shareholder Meeting Priorities » Improve earnings! » Grow Loans (increase loan to asset ratio) » Fine tune / right size the operation » Deepen relationships; seek new fee opportunities through other value added products and services » Continue to pay the quarterly Dividend with consideration for future increases
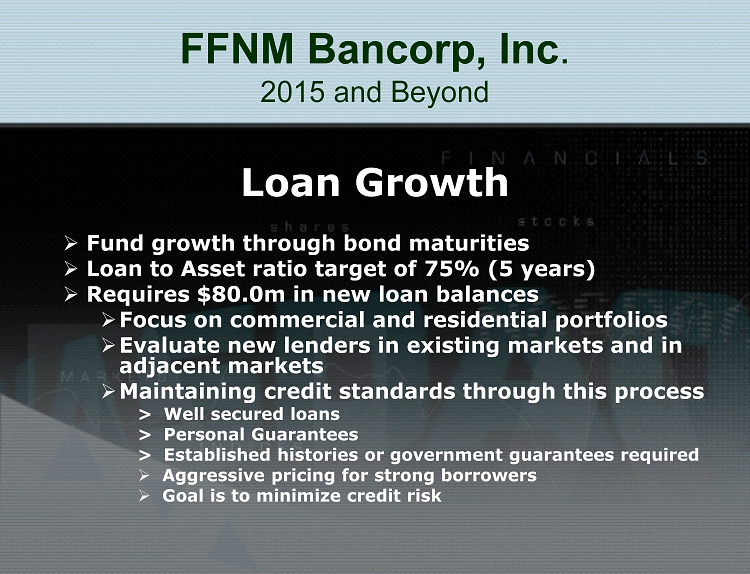
FFNM Bancorp, Inc . 2015 and Beyond Loan Growth » Fund growth through bond maturities » Loan to Asset ratio target of 75% (5 years) » Requires $80.0m in new loan balances » Focus on commercial and residential portfolios » Evaluate new lenders in existing markets and in adjacent markets » Maintaining credit standards through this process > Well secured loans > Personal Guarantees > Established histories or government guarantees required » Aggressive pricing for strong borrowers » Goal is to minimize credit risk
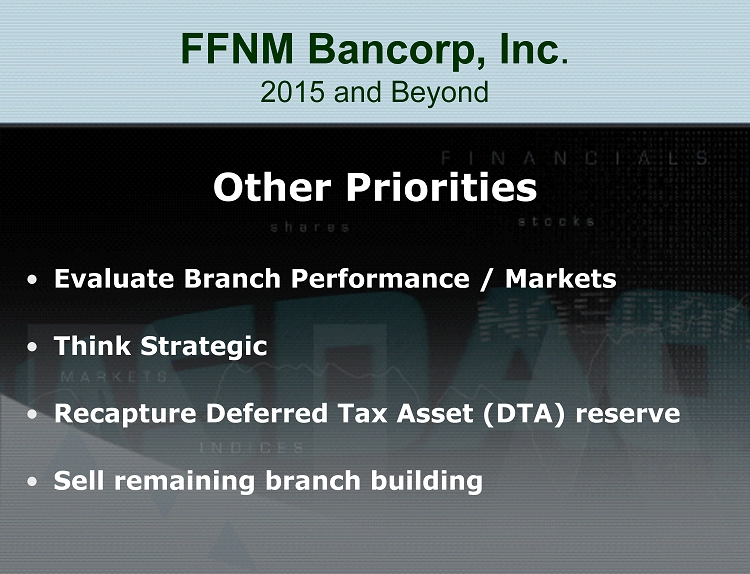
FFNM Bancorp, Inc . 2015 and Beyond Other Priorities • Evaluate Branch Performance / Markets • Think Strategic • Recapture Deferred Tax Asset (DTA) reserve • Sell remaining branch building
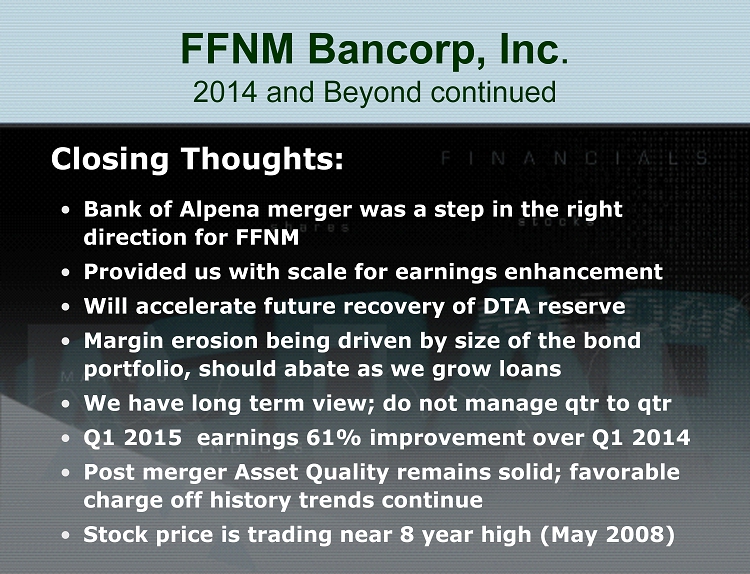
FFNM Bancorp, Inc . 2014 and Beyond continued Closing Thoughts: • Bank of Alpena merger was a step in the right direction for FFNM • Provided us with scale for earnings enhancement • Will accelerate future recovery of DTA reserve • Margin erosion being driven by size of the bond portfolio, should abate as we grow loans • We have long term view; do not manage qtr to qtr • Q1 2015 earnings 61% improvement over Q1 2014 • Post merger Asset Quality remains solid; favorable charge off history trends continue • Stock price is trading near 8 year high (May 2008)
FFNM Bancorp, Inc . 2015 Shareholder Meeting Thank You Questions / Comments?