Exhibit 99.1

First Federal of Northern Michigan Bancorp, Inc . 2014 Annual Meeting Martin A. Thomson – Chairman Michael W. Mahler – President and CEO

The Pledge of Allegiance I pledge allegiance to the Flag of the United States of America, and to the Republic for which it stands, one nation under God, indivisible, with liberty and justice for all.

FFNM Bancorp, Inc. May 14, 2014 Shareholder Meeting Michael W. Mahler - President and CEO 2013 Overview Asset Quality Update 2013 Financial Results 2014 Looking Ahead

FFNM Bancorp, Inc. May 14, 2014 Shareholder Meeting 2013 Overview • Asset Quality Improvement - Significant improvement year over year. Best AQ profile since 2006. • NPA’s fell from $7.3m to $4.1m - a 44% reduction. • Operating Expenses reduced year over year $470k or 5.4% • Dividend was restored! 2 cents Q4 2013 • FFNM Stock price improved from $4.60 to $5.40 (17.3%) • Early 2014 announced merger with Bank of Alpena

FFNM Bancorp, Inc. May 14, 2014 Shareholder Meeting 2013 Overview • Balance Sheet Declined $4.2m or 2.0% • NIM contraction from 3.78% to 3.64% • Provision expense $637k; 53.5% reduction compared to previous year • Mortgage Banking Fees down $658k or 53% vs. 2012 • Merger related expenses about $100k during year

FFNM Bancorp, Inc. May 14, 2014 Shareholder Meeting 2013: Economic Year in Review • Stock Market continued rally that began in March 2009 • Federal Reserves began to implement “the Taper” which pushed up intermediate and longer term interest rates • Auto Sector recovery continued • Michigan’s Bond rating upgraded to AA from AA - (Fitch); real estate values stabilized in NE Lower Michigan (6 th yr w/o appreciation) • Locally Alpena saw more tourism and exposure • Saw local capital investment in 2013 with more to come in 2014.

FFNM Bancorp, Inc. May 14, 2014 Shareholder Meeting 2013 Asset Quality Recap – goals are within reach

FFNM Bancorp, Inc. Texas Ratio by Quarter Non Performing Assets / Capital 64.3% 39.7% 28.3% 30.8% 17.0% 10.0% 0.0% 20.0% 40.0% 60.0% 80.0% 100.0% Dec '09 Dec '10 Dec '11 Dec '12 Dec '13 Target

FFNM Bancorp, Inc. Nonperforming Assets (000’s) at 31 December $15,366 $9,424 $6,747 $7,317 $4,091 $0 $4,000 $8,000 $12,000 $16,000 2009 2010 2011 2012 2013 Actual NPA's

FFNM Bancorp, Inc. Substandard Assets (000’s) at 31 December $18,141 $15,974 $16,435 $13,008 $5,662 $0 $4,000 $8,000 $12,000 $16,000 $20,000 2009 2010 2011 2012 2013 Actual Substandard Assets

FFNM Bancorp, Inc. Provision for Loan Loss Expense $6,196.0 $1,101.0 $284.0 $1,367.0 $637.0 $0 $1,000 $2,000 $3,000 $4,000 $5,000 $6,000 $7,000 (Dollars in 000's) 2009 2010 2011 2012 2013 Actual

FFNM Bancorp, Inc. Net Charge Offs (000’s) $8,183 $1,930 $1,597 $1,135 $915 $0 $3,000 $6,000 $9,000 2009 2010 2011 2012 2013 Actual

FFNM Bancorp, Inc. Net Charge - offs by Loan Type $7,631 362 254 $1,525 258 319 $353 1,094 150 $255 775 105 $560 344 11 $0 $1,000 $2,000 $3,000 $4,000 $5,000 $6,000 $7,000 $8,000 (Dollars in thousands) 2009 2010 2011 2012 2013 Commercial Mortgage Consumer

FFNM Bancorp, Inc. Residential Delinquency greater than 60 days at Dec 31 $1,819 $1,719 $2,056 $2,434 $1,501 $1,969 $796 $1,198 $393 $353 $0 $600 $1,200 $1,800 $2,400 $3,000 (Dollars in Thousands) 2009 2010 2011 2012 2013 60-89 days 90 Days and Over

FFNM Bancorp, Inc. 2013 Commercial Charge - offs by Year of Origination $0 $0 $85 $0 $589 $0 $0 $0 $0 $0 $0 $100 $200 $300 $400 $500 $600 (Dollars in thousands) 1997- 2002 2004 2006 2008 2010 2012 Residential

FFNM Bancorp, Inc. Commercial Loan Balances by Grade at Dec 31 $56.3 3.5 10.1 $49.6 1.1 10.5 $51.3 2.7 8.7 $56.3 4.9 3.1 $0 $10 $20 $30 $40 $50 $60 (Dollars in millions) 2010 2011 2012 2013 Grade 3 & 4 Grade 5 Grade 6

FFNM Bancorp, Inc. REO / ORA by Type $882 $686 $70 $2,985 $584 $11 $2,304 $494 $20 $2,321 $1,087 $0 $1,430 $957 $0 $1,495 $285 $0 $0 $1,000 $2,000 $3,000 (Dollars in thousands) 2008 2009 2010 2011 2012 2013 Commercial Mortgage Consumer

FFNM Bancorp, Inc. May 14, 2014 Shareholder Meeting Core Profitability

FFNM Bancorp, Inc. Net Interest Margin 3.26% 3.78% 4.02% 3.78% 3.64% 2.00% 2.50% 3.00% 3.50% 4.00% 4.50% (%) 2009 2010 2011 2012 2013 Actual

FFNM Bancorp, Inc. Average Core Deposit Growth by year $3.4 $6.7 $4.5 $5.8 $8.3 $0 $5 $10 (Dollars in million's) 2009 2010 201 2012 2013 Actual

FFNM Bancorp, Inc. Non Interest Income $2,575.0 $3,205.0 $1,932.0 $2,276.0 $1,765.0 $0 $1,000 $2,000 $3,000 $4,000 (Dollars in 000's) 2009 2010 2011 2012 2013 Actual

FFNM Bancorp, Inc. Non Interest Expense $8,874.0 $9,866.0 $9,034.0 $8,712.0 $8,242.0 $7,600 $7,900 $8,200 $8,500 $8,800 $9,100 $9,400 $9,700 $10,000 (Dollars in 000's) 2008 2010 2011 2012 2013 Actual

FFNM Bancorp, Inc. Full Time Employees at Dec 31 99 86 87 79 77 76 75 73 69 69 67 60 70 80 90 100 Number of Full Time Employees 2004 2006 2008 2010 2012 Q1 2014 Actual

FFNM Bancorp, Inc. Discussion of 2013 Financial Results

FFNM Bancorp, Inc. Net Income by Year -$6,763 $238 $742 -$214 $55 -$7,000 -$6,000 -$5,000 -$4,000 -$3,000 -$2,000 -$1,000 $0 $1,000 (Dollars in 000's) 2009 2010 2011 2012 2013 Actual

FFNM Bancorp, Inc. Total Assets as of 31 December $233.5 $215.7 $217.0 $213.8 $209.7 $200 $225 $250 (Dollars in million's) 2009 2010 2011 2012 2013 Actual

FFNM Bancorp, Inc. Total Loans as of 31 December $171.2 $157.1 $140.9 $138.9 $136.3 $125 $150 $175 (Dollars in million's) 2009 2010 2011 2012 2013 Actual

FFNM Bancorp, Inc . Loan Originations Activity (includes refinance activity) $80.1 $49.5 $66.3 $42.2 $53.2 $28.4 $72.6 $36.5 $63.7 $17.8 $0 $30 $60 $90 (Dollars in millions) 2009 2010 2011 2012 2013 Total Originations Secondary Market Sales

FFNM Bancorp, Inc. Loan Originations by Type $58.9 17.3 3.9 $47.8 14.8 3.7 $38.2 12.9 2.1 $52.4 18.2 2.0 $28.8 33.2 1.6 $0 $10 $20 $30 $40 $50 $60 $70 (Dollars in millions) 2009 2010 2011 2012 2013 Mortgage Commercial Consumer

FFNM Bancorp, Inc. Asset Balances by Type at 31 December $81.6 72.2 21.3 37.6 $71.7 69.8 18.7 37.8 $66.6 61.2 14.9 55.5 $66.5 62.8 11.7 53.1 $63.8 64.4 9.9 52.6 $0 $30 $60 $90 (Dollars in millions) 2009 2010 2011 2012 2013 Mortgage Commercial Consumer Investments

FFNM Bancorp, Inc. Regulatory Capital 15.8% 10.2% 13.6% 8.8% 15.6% 9.8% 17.2% 10.4% 17.4% 10.3% 17.9% 10.8% 0.0% 4.0% 8.0% 12.0% 16.0% 20.0% 2008 2009 2010 2011 2012 2013 Risk Based Capital Tier 1 Leverage

FFNM Bancorp, Inc. Looking Ahead: Dawning of a New Era

FFNM Bancorp, Inc. May 14, 2014 Shareholder Meeting Priorities » Improve earnings! » Requires Loan Growth » Cannot cut our way to prosperity » Maintain our margins; seek further core deposit growth » Deepen relationships; seek new fee opportunities » Deferred Tax Asset valuation reserve recovery

FFNM Bancorp, Inc . 2014 and Beyond How? • Organic Growth is a challenge in our markets • Refinance activity all but dried up at this juncture Bank of Alpena Merger Focus • Long courtship, each well known to the other • Extensive due diligence of one another • Similar cultures, in Market • Will add approximately $75 million to our balance sheet • They have excellent level of core deposits • Reduced expenses on a merged basis • Enhanced revenue opportunities • Earnings focus driven

FFNM Bancorp, Inc . 2014 and Beyond Merger Highlights: • Well into the Merger Process • All Merger Applications have been filed • Hope to obtain regulatory approval in June • Special Shareholder meeting needed to seek approval (end of July target date) • Transitional and operational planning underway since early February • Target Closing Date: August 8 th 2014 • Planned conversion and rollout: August 11 th 2014

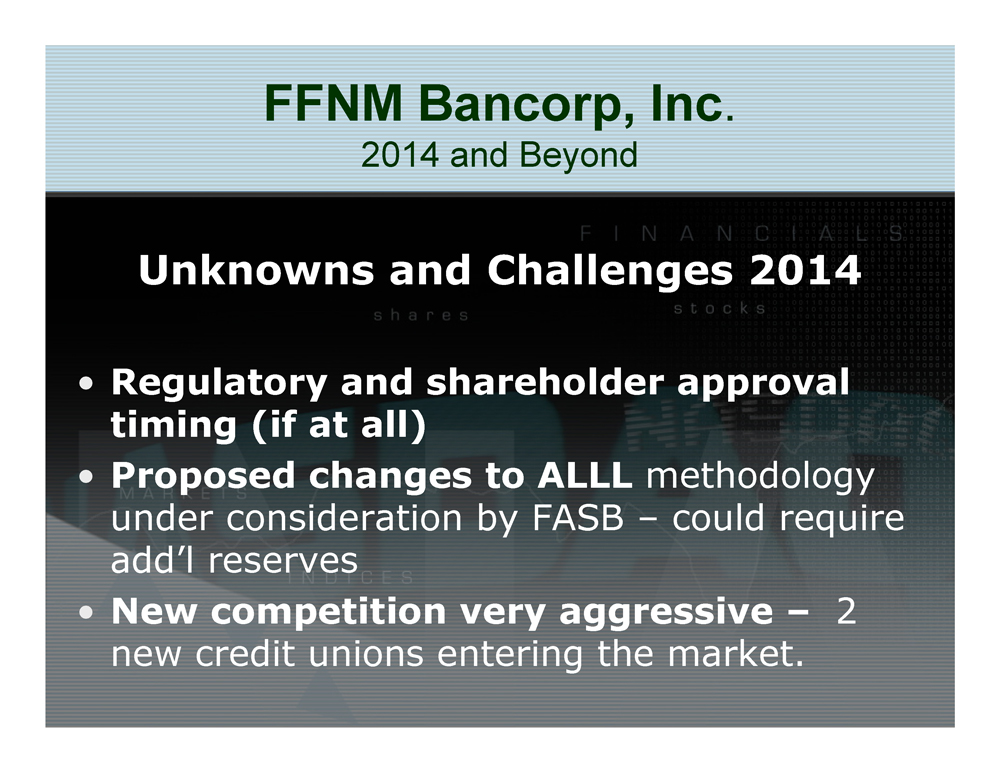
FFNM Bancorp, Inc . 2014 and Beyond Unknowns and Challenges 2014 • Regulatory and shareholder approval timing (if at all) • Proposed changes to ALLL methodology under consideration by FASB – could require add’l reserves • New competition very aggressive – 2 new credit unions entering the market.

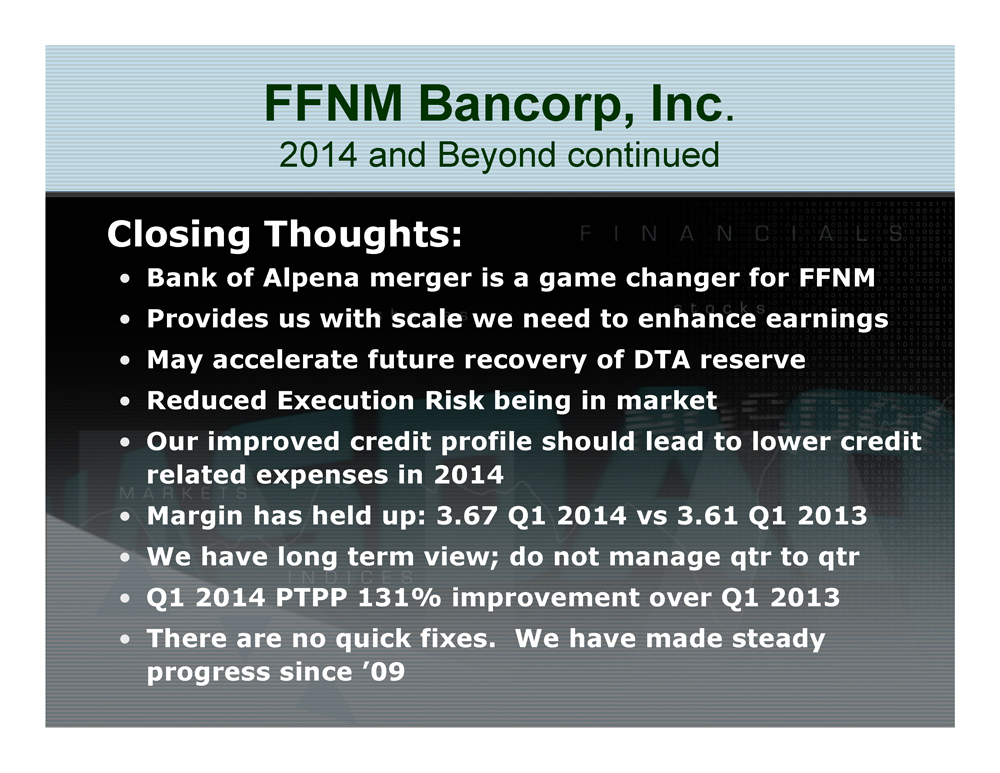
FFNM Bancorp, Inc . 2014 and Beyond continued Closing Thoughts: • Bank of Alpena merger is a game changer for FFNM • Provides us with scale we need to enhance earnings • May accelerate future recovery of DTA reserve • Reduced Execution Risk being in market • Our improved credit profile should lead to lower credit related expenses in 2014 • Margin has held up: 3.67 Q1 2014 vs 3.61 Q1 2013 • We have long term view; do not manage qtr to qtr • Q1 2014 PTPP 131% improvement over Q1 2013 • There are no quick fixes. We have made steady progress since ’09

FFNM Bancorp, Inc . 2014 Shareholder Meeting Thank You Questions / Comments?


