
2019 First Quarter Earnings Conference Call Wednesday, April 17, 2019 1

Forward Looking Statements & Additional Disclosures This presentation may contain statements regarding future events or the future financial performance of the Company that constitute forward‐looking statements within the meaning of Section 27A of the Securities Act of 1933, as amended, and Section 21E of the Securities Exchange Act of 1934, as amended. These forward‐looking statements relate to, among other things, expectations regarding the business environment in which we operate, projections of future performance, perceived opportunities in the market, and statements regarding our business strategies, objectives and vision. Forward‐ looking statements include, but are not limited to, statements preceded by, followed by or that include the words “will,” “believes,” “expects,” “anticipates,” “intends,” “plans,” “estimates” or similar expressions. With respect to any such forward‐looking statements, the Company claims the protection provided for in the Private Securities Litigation Reform Act of 1995. These statements involve risks and uncertainties. The Company’s actual results, performance or achievements may differ significantly from the results, performance or achievements expressed or implied in any forward‐looking statements. The risks and uncertainties include, but are not limited to: possible deterioration in economic conditions in our areas of operation; interest rate risk associated with volatile interest rates and related asset‐liability matching risk; liquidity risks; risk of significant non‐earning assets, and net credit losses that could occur, particularly in times of weak economic conditions or times of rising interest rates; and regulatory risks associated with current and future regulations. For additional information concerning these and other risk factors, see the Company’s most recent Annual Report on Form 10‐K. The Company does not undertake, and specifically disclaims any obligation, to update any forward‐looking statements to reflect the occurrence of events or circumstances after the date of such statements except as required by law. 2
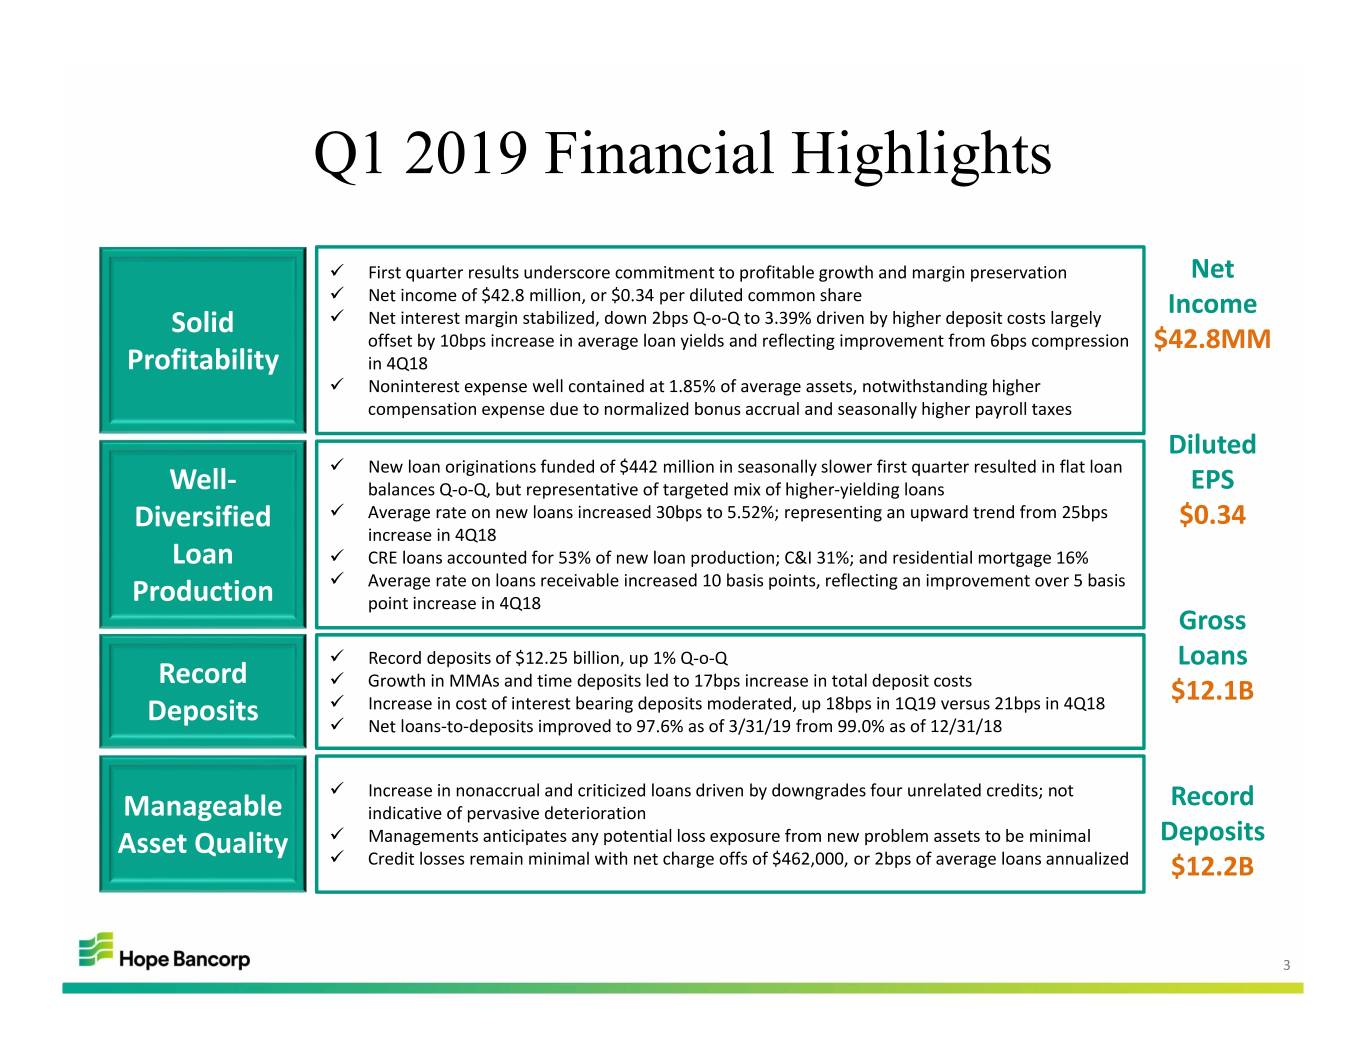
Q1 2019 Financial Highlights First quarter results underscore commitment to profitable growth and margin preservation Net Net income of $42.8 million, or $0.34 per diluted common share Income Solid Net interest margin stabilized, down 2bps Q‐o‐Q to 3.39% driven by higher deposit costs largely offset by 10bps increase in average loan yields and reflecting improvement from 6bps compression $42.8MM Profitability in 4Q18 Noninterest expense well contained at 1.85% of average assets, notwithstanding higher compensation expense due to normalized bonus accrual and seasonally higher payroll taxes Diluted New loan originations funded of $442 million in seasonally slower first quarter resulted in flat loan Well‐ balances Q‐o‐Q, but representative of targeted mix of higher‐yielding loans EPS Diversified Average rate on new loans increased 30bps to 5.52%; representing an upward trend from 25bps $0.34 increase in 4Q18 Loan CRE loans accounted for 53% of new loan production; C&I 31%; and residential mortgage 16% Average rate on loans receivable increased 10 basis points, reflecting an improvement over 5 basis Production point increase in 4Q18 Gross Record deposits of $12.25 billion, up 1% Q‐o‐Q Loans Record Growth in MMAs and time deposits led to 17bps increase in total deposit costs Increase in cost of interest bearing deposits moderated, up 18bps in 1Q19 versus 21bps in 4Q18 $12.1B Deposits Net loans‐to‐deposits improved to 97.6% as of 3/31/19 from 99.0% as of 12/31/18 Increase in nonaccrual and criticized loans driven by downgrades four unrelated credits; not Record Manageable indicative of pervasive deterioration Asset Quality Managements anticipates any potential loss exposure from new problem assets to be minimal Deposits Credit losses remain minimal with net charge offs of $462,000, or 2bps of average loans annualized $12.2B 3
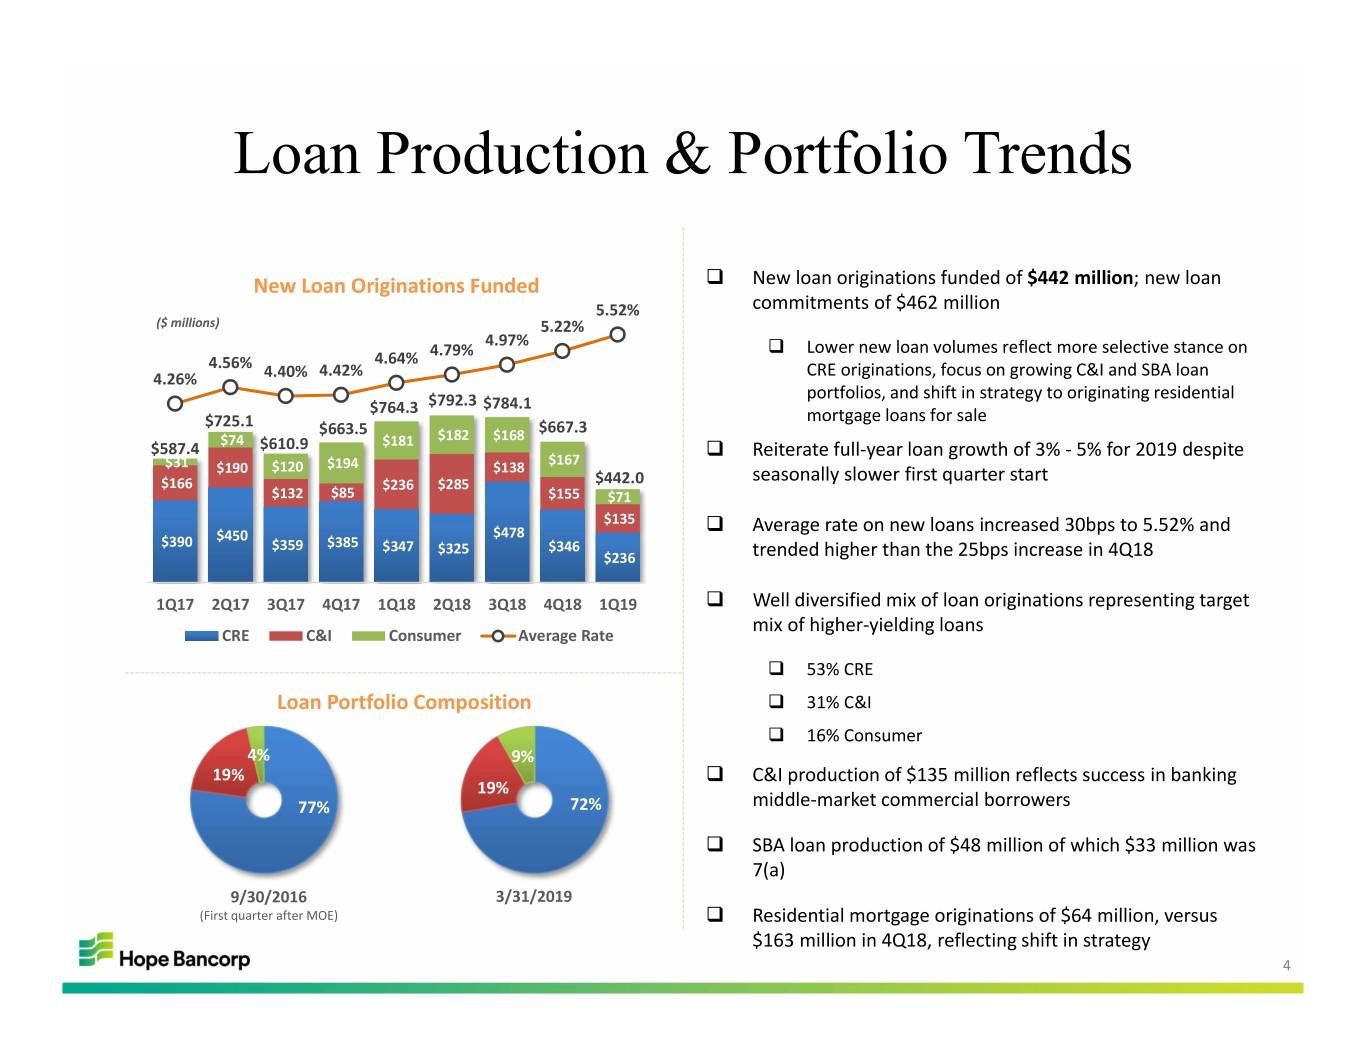
Loan Production & Portfolio Trends New Loan Originations Funded New loan originations funded of $442 million; new loan 5.52% commitments of $462 million ($ millions) 5.22% 4.97% Lower new loan volumes reflect more selective stance on 4.64% 4.79% 4.56% 4.42% 4.26% 4.40% CRE originations, focus on growing C&I and SBA loan portfolios, and shift in strategy to originating residential $792.3 $784.1 $764.3 mortgage loans for sale $725.1 $663.5 $667.3 $74 $182 $168 $587.4 $610.9 $181 Reiterate full‐year loan growth of 3% ‐ 5% for 2019 despite $31 $194 $167 $190 $120 $138 seasonally slower first quarter start $166 $236 $285 $442.0 $132 $85 $155 $71 $135 Average rate on new loans increased 30bps to 5.52% and $450 $478 $390 $359 $385 $347 $325 $346 $236 trended higher than the 25bps increase in 4Q18 1Q17 2Q17 3Q17 4Q17 1Q18 2Q18 3Q18 4Q18 1Q19 Well diversified mix of loan originations representing target mix of higher‐yielding loans CRE C&I Consumer Average Rate 53% CRE Loan Portfolio Composition 31% C&I 16% Consumer 4% 9% 19% C&I production of $135 million reflects success in banking 19% 77% 72% middle‐market commercial borrowers SBA loan production of $48 million of which $33 million was 7(a) 9/30/2016 3/31/2019 (First quarter after MOE) Residential mortgage originations of $64 million, versus $163 million in 4Q18, reflecting shift in strategy 4
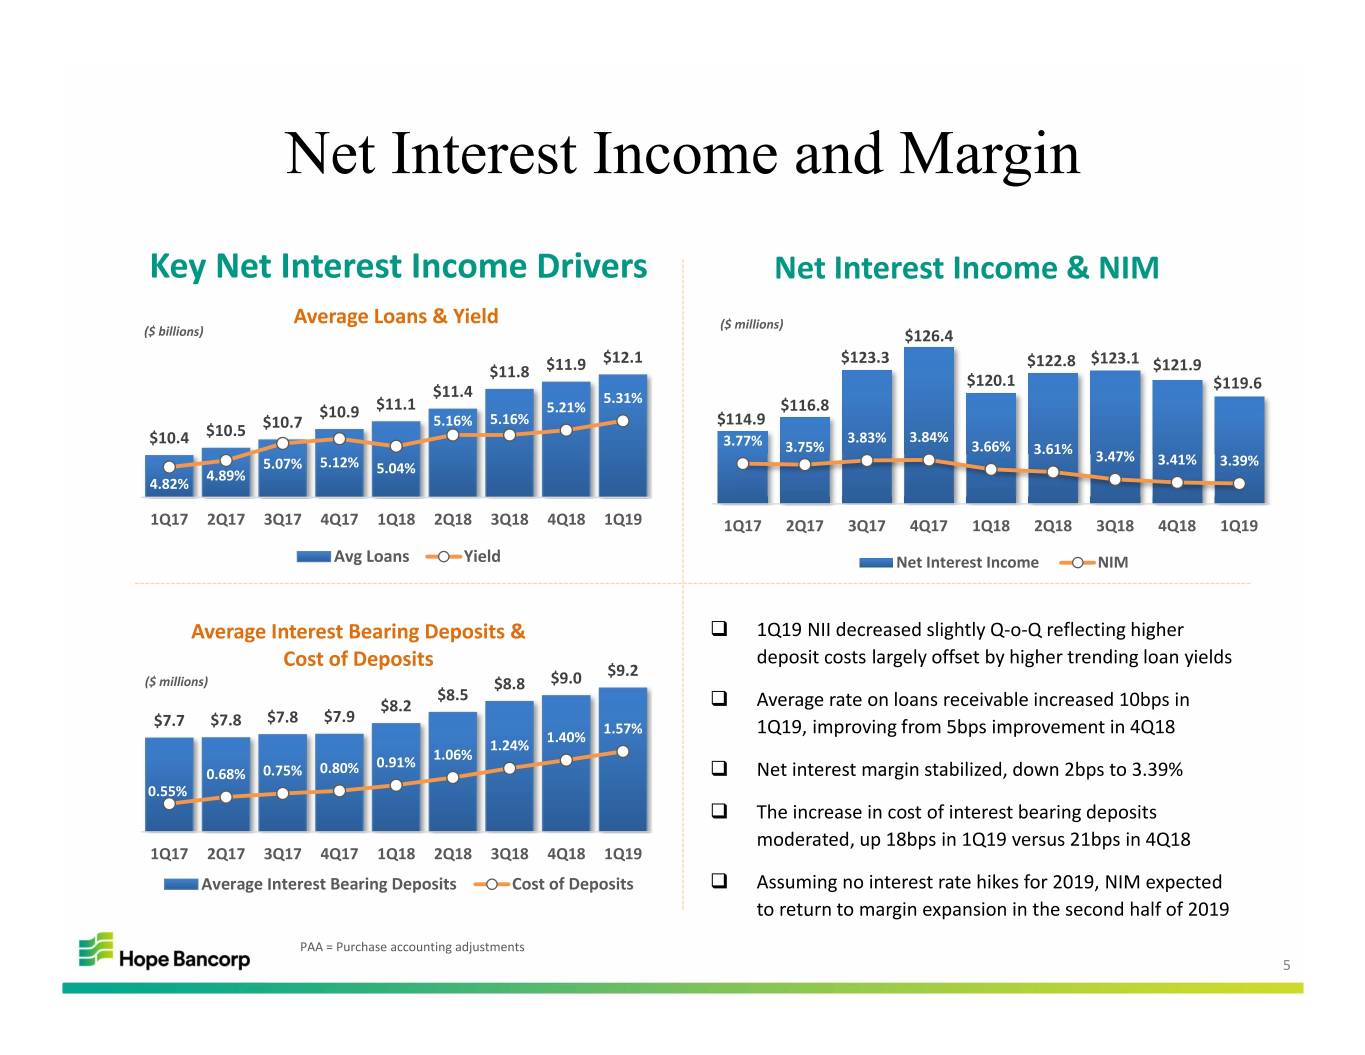
Net Interest Income and Margin Key Net Interest Income Drivers Net Interest Income & NIM Average Loans & Yield ($ millions) ($ billions) $126.4 $12.1 $123.3 $122.8 $123.1 $11.8 $11.9 $121.9 $120.1 $119.6 $11.4 5.31% $10.9 $11.1 5.21% $116.8 5.16% 5.16% $114.9 $10.5 $10.7 $10.4 3.77% 3.83% 3.84% 3.75% 3.66% 3.61% 5.07% 5.12% 3.47% 3.41% 3.39% 4.89% 5.04% 4.82% 1Q17 2Q17 3Q17 4Q17 1Q18 2Q18 3Q18 4Q18 1Q19 1Q17 2Q17 3Q17 4Q17 1Q18 2Q18 3Q18 4Q18 1Q19 Avg Loans Yield Net Interest Income NIM Average Interest Bearing Deposits & 1Q19 NII decreased slightly Q‐o‐Q reflecting higher Cost of Deposits deposit costs largely offset by higher trending loan yields $9.2 ($ millions) $8.8 $9.0 $8.5 $8.2 Average rate on loans receivable increased 10bps in $7.8 $7.9 $7.7 $7.8 1.57% 1.40% 1Q19, improving from 5bps improvement in 4Q18 1.24% 0.91% 1.06% 0.68% 0.75% 0.80% Net interest margin stabilized, down 2bps to 3.39% 0.55% The increase in cost of interest bearing deposits moderated, up 18bps in 1Q19 versus 21bps in 4Q18 1Q17 2Q17 3Q17 4Q17 1Q18 2Q18 3Q18 4Q18 1Q19 Average Interest Bearing Deposits Cost of Deposits Assuming no interest rate hikes for 2019, NIM expected to return to margin expansion in the second half of 2019 PAA = Purchase accounting adjustments 5
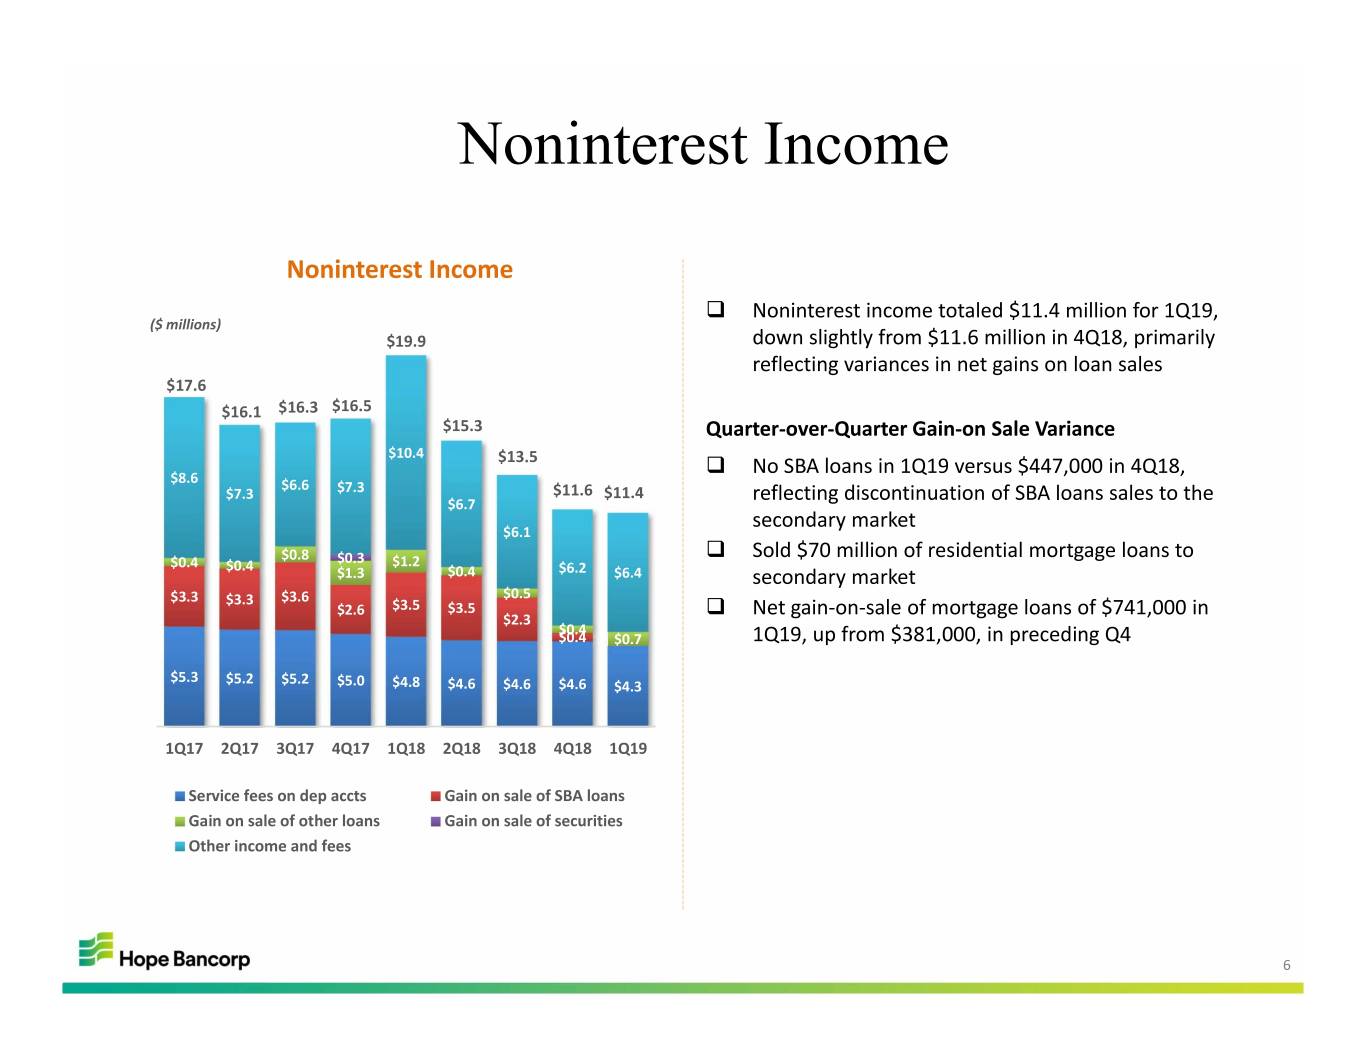
Noninterest Income Noninterest Income Noninterest income totaled $11.4 million for 1Q19, ($ millions) $19.9 down slightly from $11.6 million in 4Q18, primarily reflecting variances in net gains on loan sales $17.6 $16.1 $16.3 $16.5 $15.3 Quarter‐over‐Quarter Gain‐on Sale Variance $10.4 $13.5 No SBA loans in 1Q19 versus $447,000 in 4Q18, $8.6 $6.6 $7.3 $7.3 $11.6 $11.4 $6.7 reflecting discontinuation of SBA loans sales to the secondary market $6.1 $0.8 $0.3 Sold $70 million of residential mortgage loans to $0.4 $0.4 $1.2 $1.3 $0.4 $6.2 $6.4 secondary market $3.3 $3.3 $3.6 $0.5 $2.6 $3.5 $3.5 Net gain‐on‐sale of mortgage loans of $741,000 in $2.3 $0.4 $0.4 $0.7 1Q19, up from $381,000, in preceding Q4 $5.3 $5.2 $5.2 $5.0 $4.8 $4.6 $4.6 $4.6 $4.3 1Q17 2Q17 3Q17 4Q17 1Q18 2Q18 3Q18 4Q18 1Q19 Service fees on dep accts Gain on sale of SBA loans Gain on sale of other loans Gain on sale of securities Other income and fees 6
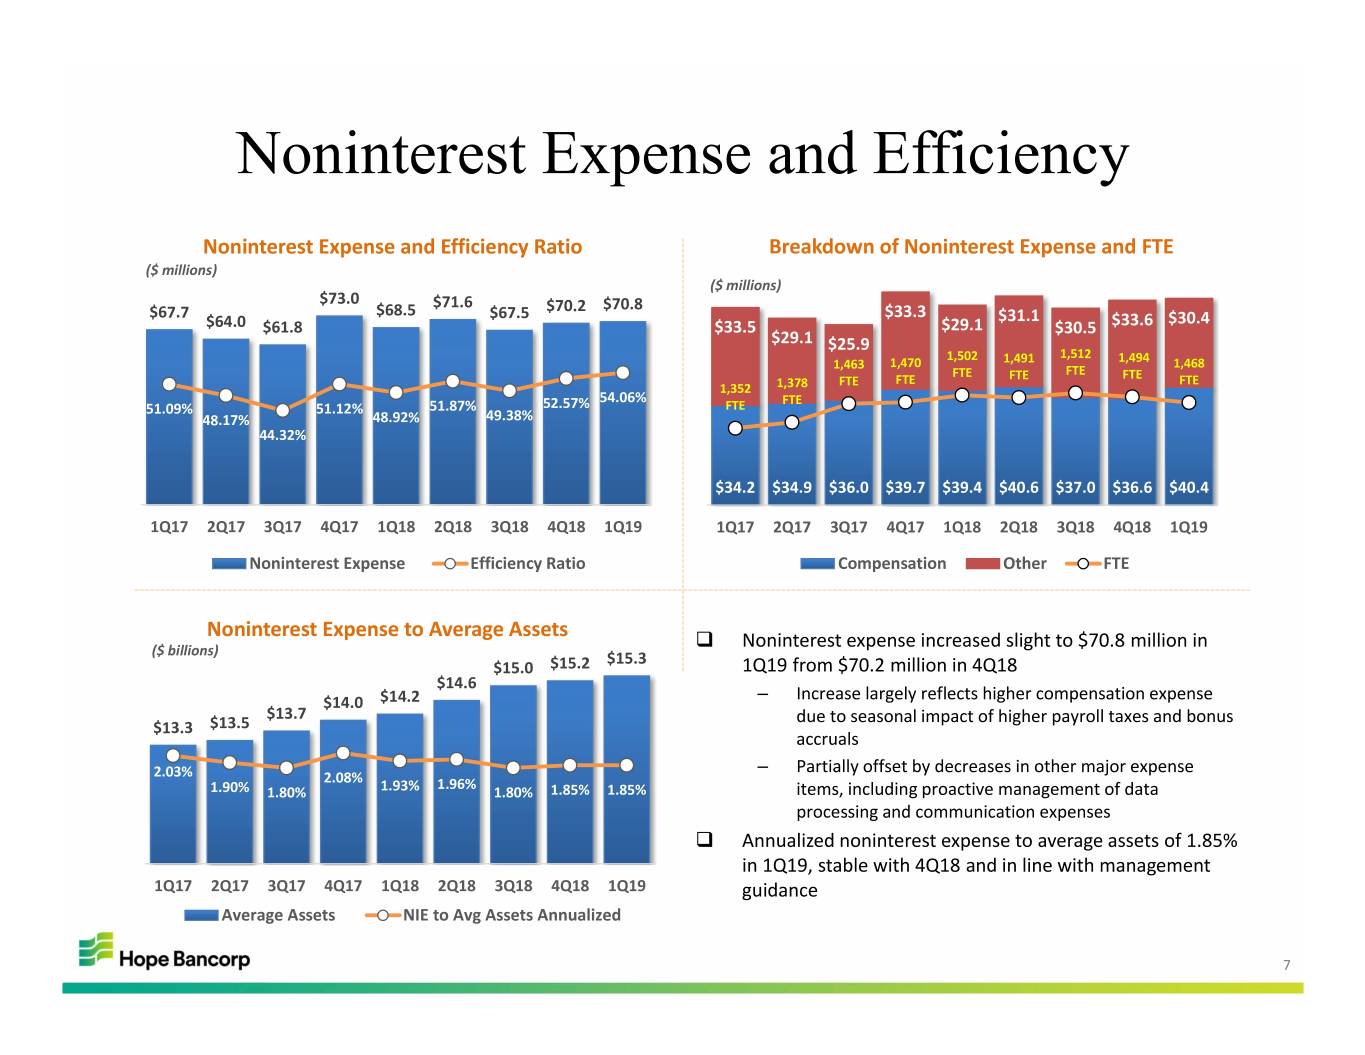
Noninterest Expense and Efficiency Noninterest Expense and Efficiency Ratio Breakdown of Noninterest Expense and FTE ($ millions) ($ millions) $73.0 $71.6 $70.2 $70.8 $67.7 $68.5 $67.5 $33.3 $31.1 $30.4 $64.0 $61.8 $33.5 $29.1 $30.5 $33.6 $29.1 $25.9 1,502 1,512 1,463 1,470 1,491 1,494 1,468 FTE FTE FTE FTE FTE FTE FTE 1,352 1,378 54.06% FTE 51.09% 51.12% 51.87% 52.57% FTE 48.17% 48.92% 49.38% 44.32% $34.2 $34.9 $36.0 $39.7 $39.4 $40.6 $37.0 $36.6 $40.4 1Q17 2Q17 3Q17 4Q17 1Q18 2Q18 3Q18 4Q18 1Q19 1Q17 2Q17 3Q17 4Q17 1Q18 2Q18 3Q18 4Q18 1Q19 Noninterest Expense Efficiency Ratio Compensation Other FTE Noninterest Expense to Average Assets Noninterest expense increased slight to $70.8 million in ($ billions) $15.3 $15.0 $15.2 1Q19 from $70.2 million in 4Q18 $14.6 – $14.0 $14.2 Increase largely reflects higher compensation expense $13.7 due to seasonal impact of higher payroll taxes and bonus $13.3 $13.5 accruals 2.03% – Partially offset by decreases in other major expense 2.08% 1.96% 1.90% 1.80% 1.93% 1.80% 1.85% 1.85% items, including proactive management of data processing and communication expenses Annualized noninterest expense to average assets of 1.85% in 1Q19, stable with 4Q18 and in line with management 1Q17 2Q17 3Q17 4Q17 1Q18 2Q18 3Q18 4Q18 1Q19 guidance Average Assets NIE to Avg Assets Annualized 7
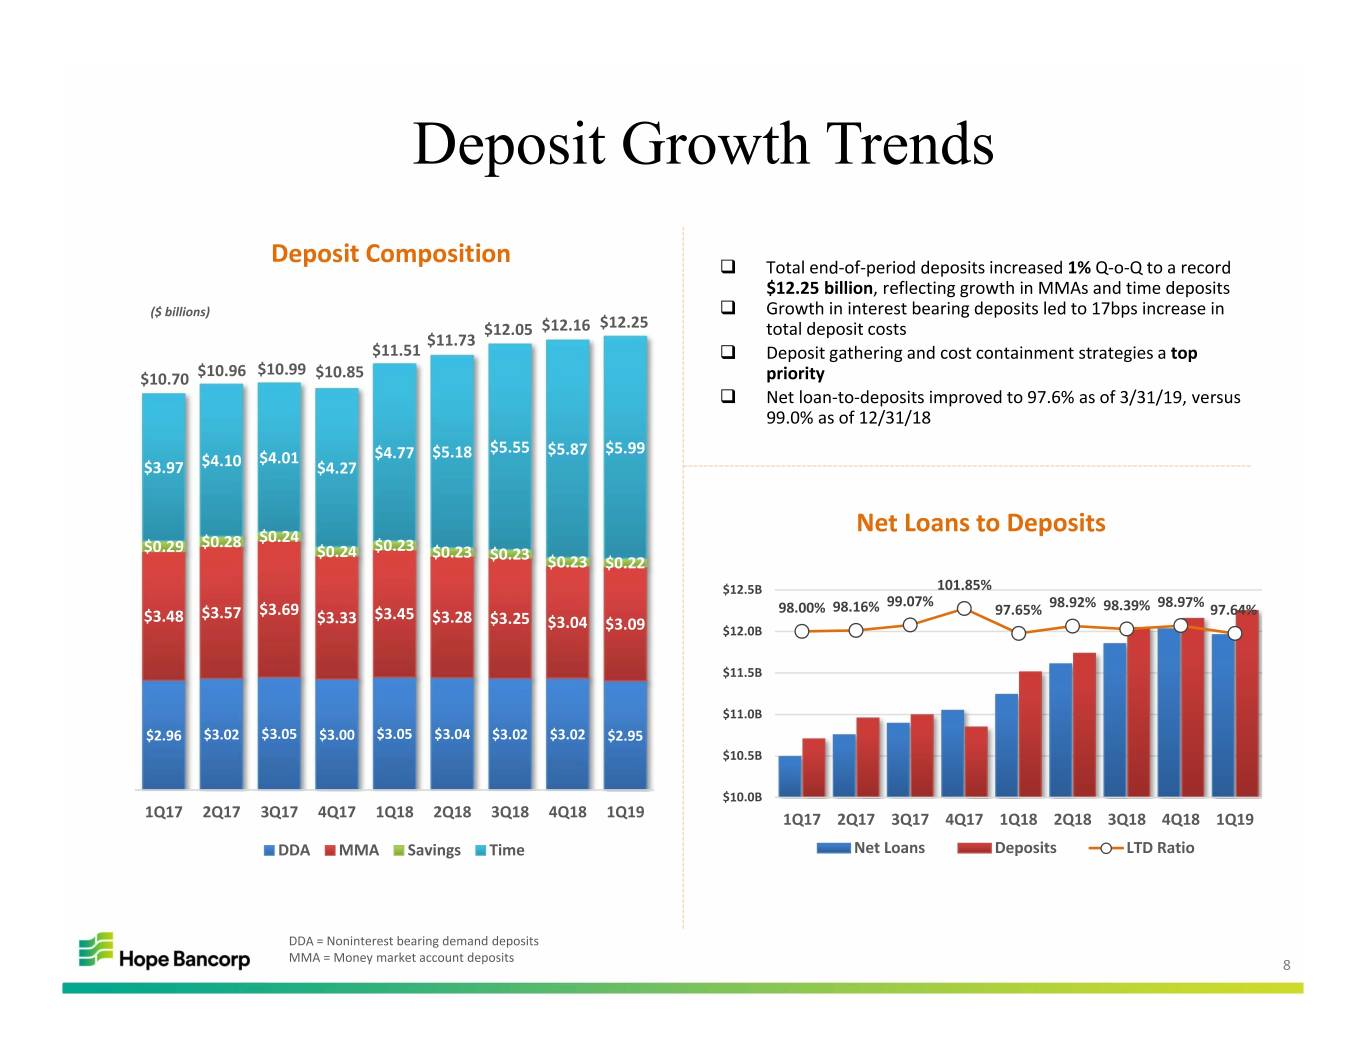
Deposit Growth Trends Deposit Composition Total end‐of‐period deposits increased 1% Q‐o‐Q to a record $12.25 billion, reflecting growth in MMAs and time deposits ($ billions) Growth in interest bearing deposits led to 17bps increase in $12.05 $12.16 $12.25 total deposit costs $11.73 $11.51 Deposit gathering and cost containment strategies a top $10.99 $10.70 $10.96 $10.85 priority Net loan‐to‐deposits improved to 97.6% as of 3/31/19, versus 99.0% as of 12/31/18 $5.55 $5.87 $5.99 $4.01 $4.77 $5.18 $3.97 $4.10 $4.27 $0.24 Net Loans to Deposits $0.28 $0.23 $0.29 $0.24 $0.23 $0.23 $0.23 $0.22 $12.5B 101.85% 99.07% 98.97% $3.69 98.00% 98.16% 97.65% 98.92% 98.39% 97.64% $3.48 $3.57 $3.33 $3.45 $3.28 $3.25 $3.04 $3.09 $12.0B $11.5B $11.0B $2.96 $3.02 $3.05 $3.00 $3.05 $3.04 $3.02 $3.02 $2.95 $10.5B $10.0B 1Q17 2Q17 3Q17 4Q17 1Q18 2Q18 3Q18 4Q18 1Q19 1Q17 2Q17 3Q17 4Q17 1Q18 2Q18 3Q18 4Q18 1Q19 DDA MMA Savings Time Net Loans Deposits LTD Ratio DDA = Noninterest bearing demand deposits MMA = Money market account deposits 8
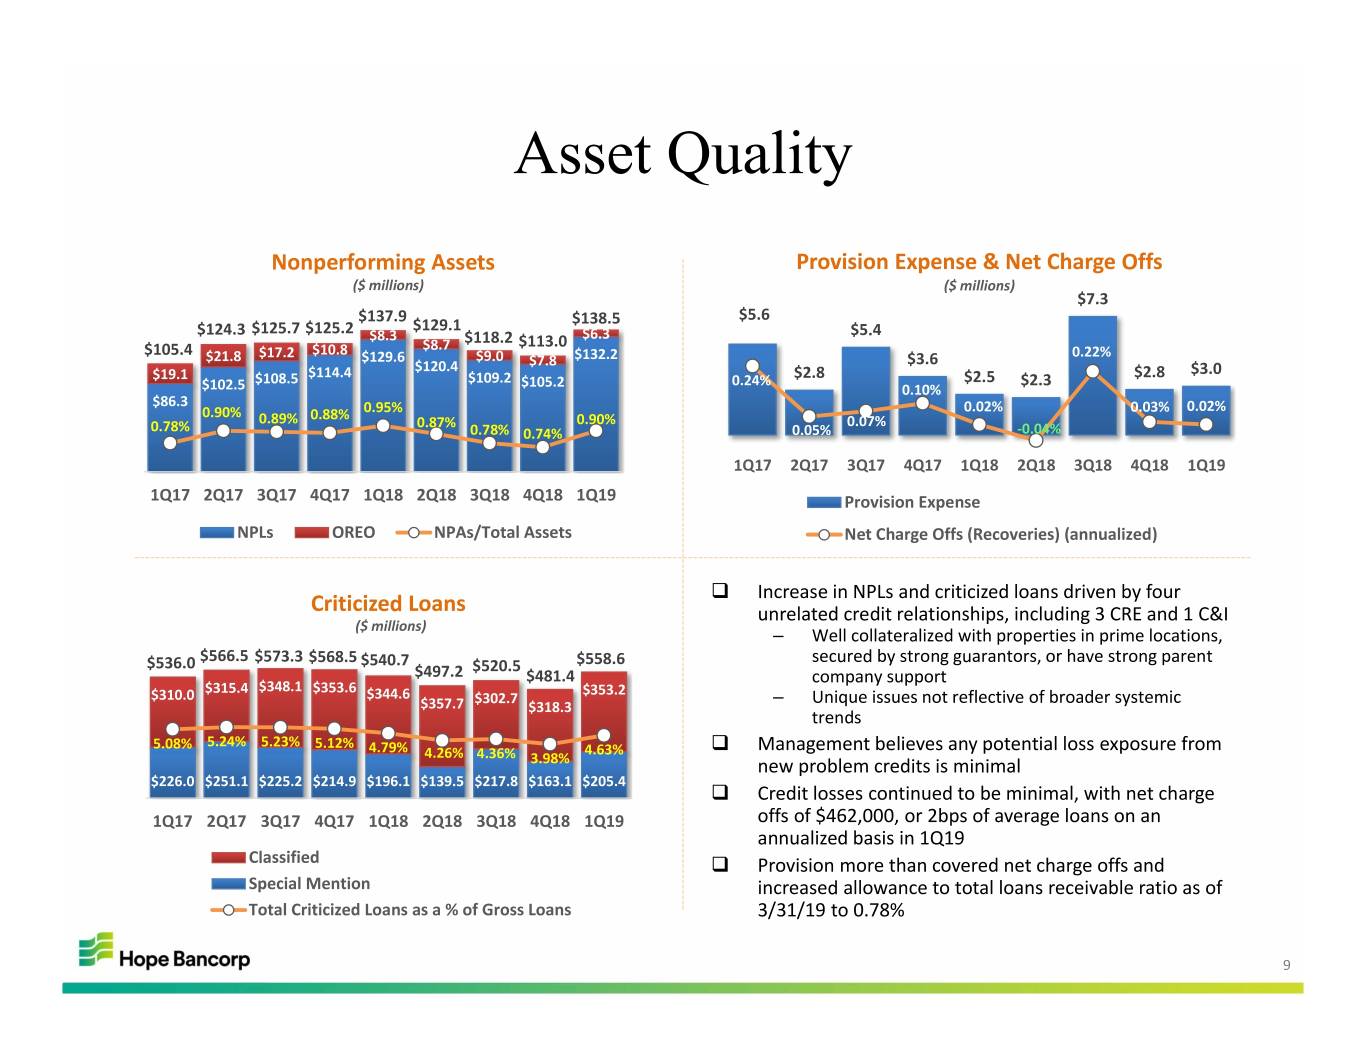
Asset Quality Nonperforming Assets Provision Expense & Net Charge Offs ($ millions) ($ millions) $7.3 $137.9 $138.5 $5.6 $124.3 $125.7 $125.2 $129.1 $5.4 $8.3 $118.2 $113.0 $6.3 $105.4 $17.2 $10.8 $8.7 0.22% $21.8 $129.6 $9.0 $7.8 $132.2 $3.6 $114.4 $120.4 $2.8 $2.8 $3.0 $19.1 $108.5 $109.2 $105.2 0.24% $2.5 $2.3 $102.5 0.10% $86.3 0.02% 0.02% 0.90% 0.88% 0.95% 0.03% 0.89% 0.87% 0.90% 0.07% 0.78% 0.78% 0.74% 0.05% ‐0.04% 1Q17 2Q17 3Q17 4Q17 1Q18 2Q18 3Q18 4Q18 1Q19 1Q17 2Q17 3Q17 4Q17 1Q18 2Q18 3Q18 4Q18 1Q19 Provision Expense NPLs OREO NPAs/Total Assets Net Charge Offs (Recoveries) (annualized) Increase in NPLs and criticized loans driven by four Criticized Loans unrelated credit relationships, including 3 CRE and 1 C&I ($ millions) – Well collateralized with properties in prime locations, $566.5 $573.3 $568.5 secured by strong guarantors, or have strong parent $536.0 $540.7 $520.5 $558.6 $497.2 $481.4 company support $315.4 $348.1 $353.6 $353.2 $310.0 $344.6 $302.7 – Unique issues not reflective of broader systemic $357.7 $318.3 trends 5.08% 5.24% 5.23% 5.12% 4.79% 4.26% 4.36% 4.63% Management believes any potential loss exposure from 3.98% new problem credits is minimal $226.0 $251.1 $225.2 $214.9 $196.1 $139.5 $217.8 $163.1 $205.4 Credit losses continued to be minimal, with net charge 1Q17 2Q17 3Q17 4Q17 1Q18 2Q18 3Q18 4Q18 1Q19 offs of $462,000, or 2bps of average loans on an annualized basis in 1Q19 Classified Provision more than covered net charge offs and Special Mention increased allowance to total loans receivable ratio as of Total Criticized Loans as a % of Gross Loans 3/31/19 to 0.78% 9
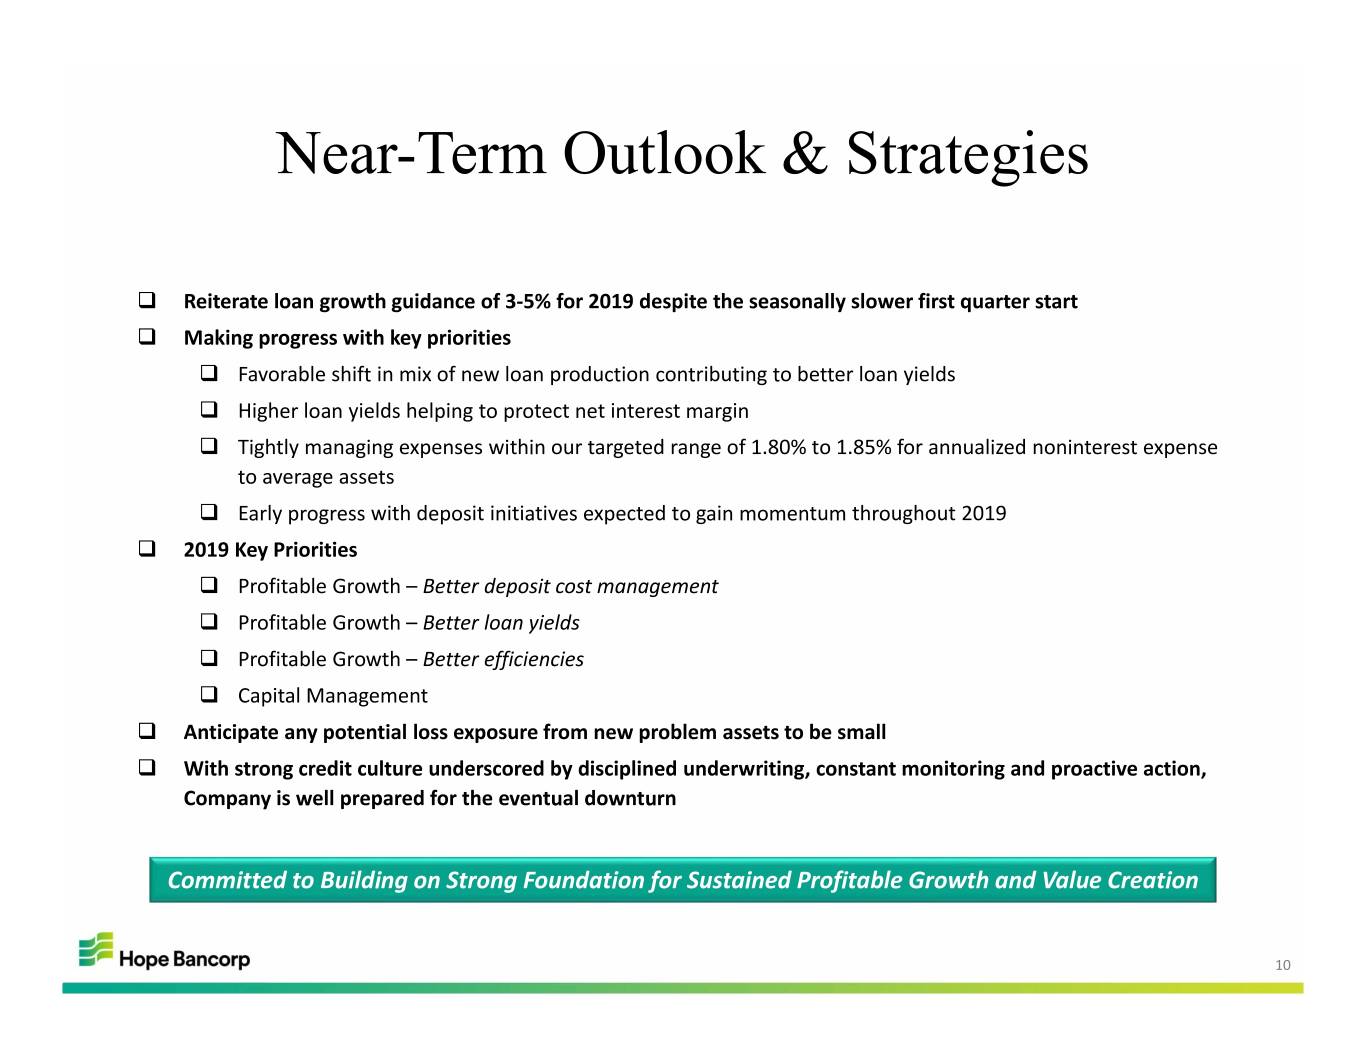
Near-Term Outlook & Strategies Reiterate loan growth guidance of 3‐5% for 2019 despite the seasonally slower first quarter start Making progress with key priorities Favorable shift in mix of new loan production contributing to better loan yields Higher loan yields helping to protect net interest margin Tightly managing expenses within our targeted range of 1.80% to 1.85% for annualized noninterest expense to average assets Early progress with deposit initiatives expected to gain momentum throughout 2019 2019 Key Priorities Profitable Growth – Better deposit cost management Profitable Growth – Better loan yields Profitable Growth – Better efficiencies Capital Management Anticipate any potential loss exposure from new problem assets to be small With strong credit culture underscored by disciplined underwriting, constant monitoring and proactive action, Company is well prepared for the eventual downturn Committed to Building on Strong Foundation for Sustained Profitable Growth and Value Creation 10

2019 First Quarter Earnings Conference Call Q&A 11
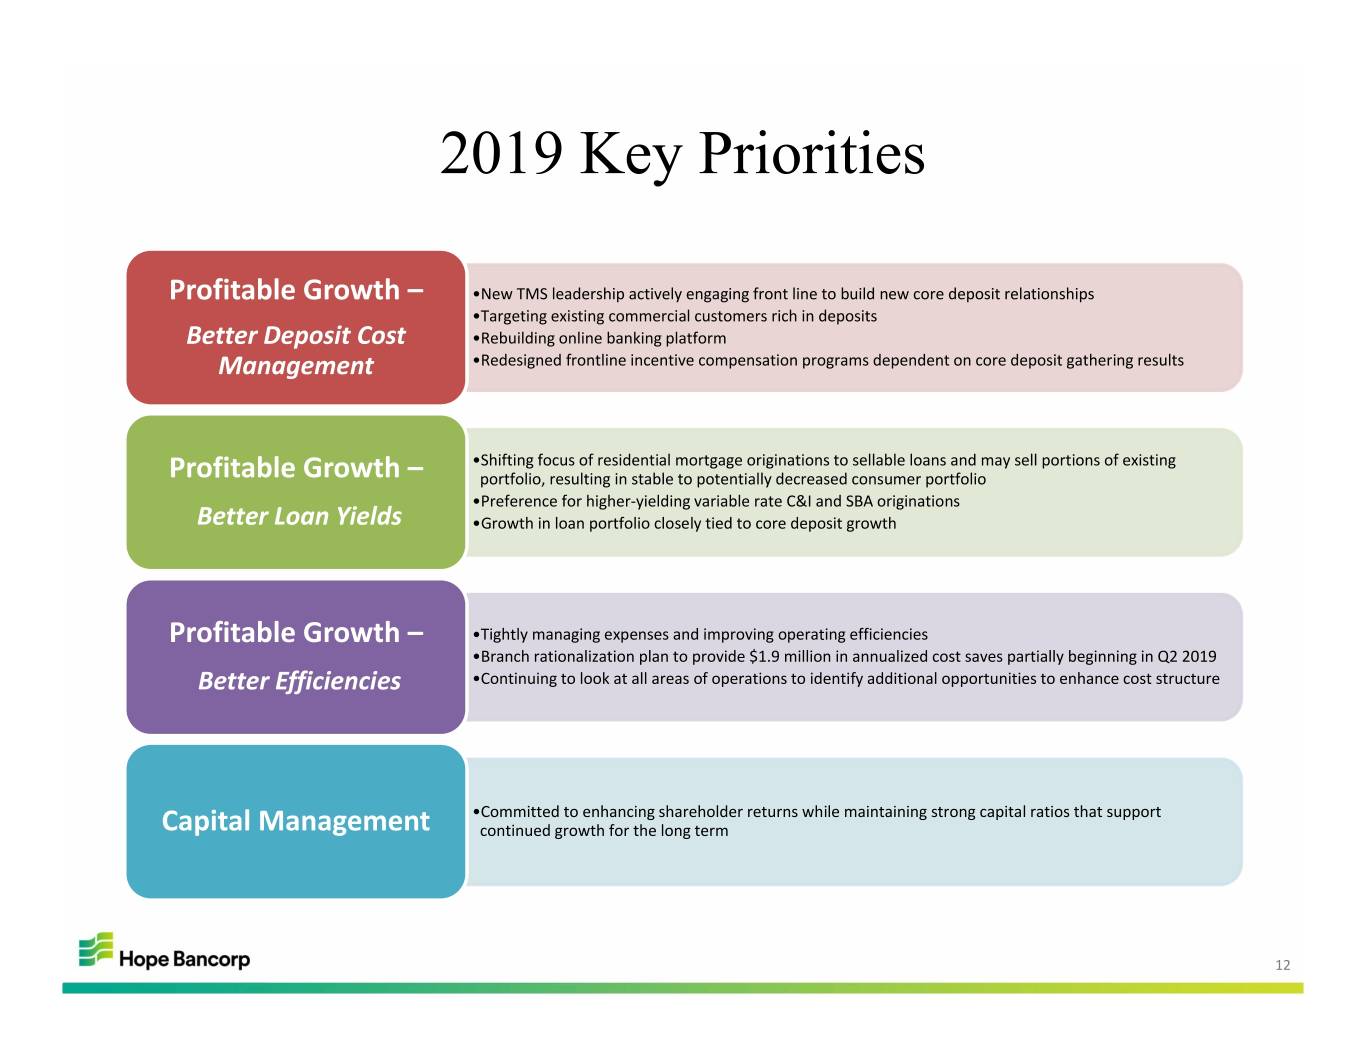
2019 Key Priorities Profitable Growth – •New TMS leadership actively engaging front line to build new core deposit relationships •Targeting existing commercial customers rich in deposits Better Deposit Cost •Rebuilding online banking platform Management •Redesigned frontline incentive compensation programs dependent on core deposit gathering results •Shifting focus of residential mortgage originations to sellable loans and may sell portions of existing Profitable Growth – portfolio, resulting in stable to potentially decreased consumer portfolio •Preference for higher‐yielding variable rate C&I and SBA originations Better Loan Yields •Growth in loan portfolio closely tied to core deposit growth Profitable Growth – •Tightly managing expenses and improving operating efficiencies •Branch rationalization plan to provide $1.9 million in annualized cost saves partially beginning in Q2 2019 Better Efficiencies •Continuing to look at all areas of operations to identify additional opportunities to enhance cost structure •Committed to enhancing shareholder returns while maintaining strong capital ratios that support Capital Management continued growth for the long term 12
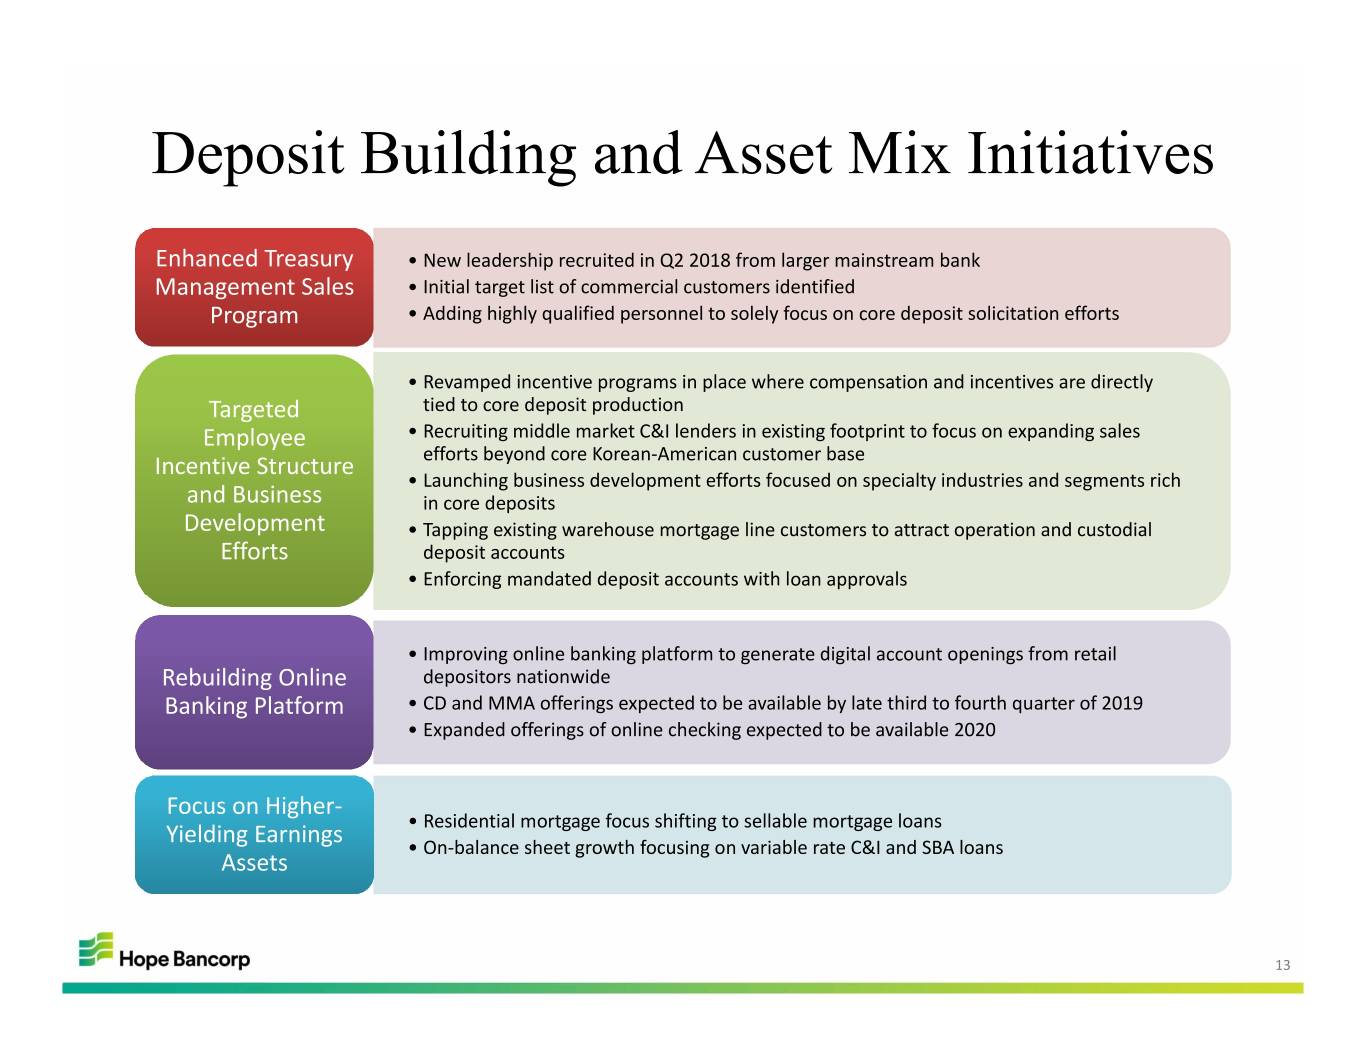
Deposit Building and Asset Mix Initiatives Enhanced Treasury • New leadership recruited in Q2 2018 from larger mainstream bank Management Sales • Initial target list of commercial customers identified Program • Adding highly qualified personnel to solely focus on core deposit solicitation efforts • Revamped incentive programs in place where compensation and incentives are directly Targeted tied to core deposit production Employee • Recruiting middle market C&I lenders in existing footprint to focus on expanding sales Incentive Structure efforts beyond core Korean‐American customer base • Launching business development efforts focused on specialty industries and segments rich and Business in core deposits Development • Tapping existing warehouse mortgage line customers to attract operation and custodial Efforts deposit accounts • Enforcing mandated deposit accounts with loan approvals • Improving online banking platform to generate digital account openings from retail Rebuilding Online depositors nationwide Banking Platform • CD and MMA offerings expected to be available by late third to fourth quarter of 2019 • Expanded offerings of online checking expected to be available 2020 Focus on Higher‐ • Residential mortgage focus shifting to sellable mortgage loans Yielding Earnings • On‐balance sheet growth focusing on variable rate C&I and SBA loans Assets 13


