
2019 Second Quarter Earnings Conference Call Wednesday, July 17, 2019 1

Forward Looking Statements & Additional Disclosures This presentation may contain statements regarding future events or the future financial performance of the Company that constitute forward‐looking statements within the meaning of Section 27A of the Securities Act of 1933, as amended, and Section 21E of the Securities Exchange Act of 1934, as amended. These forward‐looking statements relate to, among other things, expectations regarding the business environment in which we operate, projections of future performance, perceived opportunities in the market, and statements regarding our business strategies, objectives and vision. Forward‐ looking statements include, but are not limited to, statements preceded by, followed by or that include the words “will,” “believes,” “expects,” “anticipates,” “intends,” “plans,” “estimates” or similar expressions. With respect to any such forward‐looking statements, the Company claims the protection provided for in the Private Securities Litigation Reform Act of 1995. These statements involve risks and uncertainties. The Company’s actual results, performance or achievements may differ significantly from the results, performance or achievements expressed or implied in any forward‐looking statements. The risks and uncertainties include, but are not limited to: possible deterioration in economic conditions in our areas of operation; interest rate risk associated with volatile interest rates and related asset‐liability matching risk; liquidity risks; risk of significant non‐earning assets, and net credit losses that could occur, particularly in times of weak economic conditions or times of rising interest rates; and regulatory risks associated with current and future regulations. For additional information concerning these and other risk factors, see the Company’s most recent Annual Report on Form 10‐K. The Company does not undertake, and specifically disclaims any obligation, to update any forward‐looking statements to reflect the occurrence of events or circumstances after the date of such statements except as required by law. 2
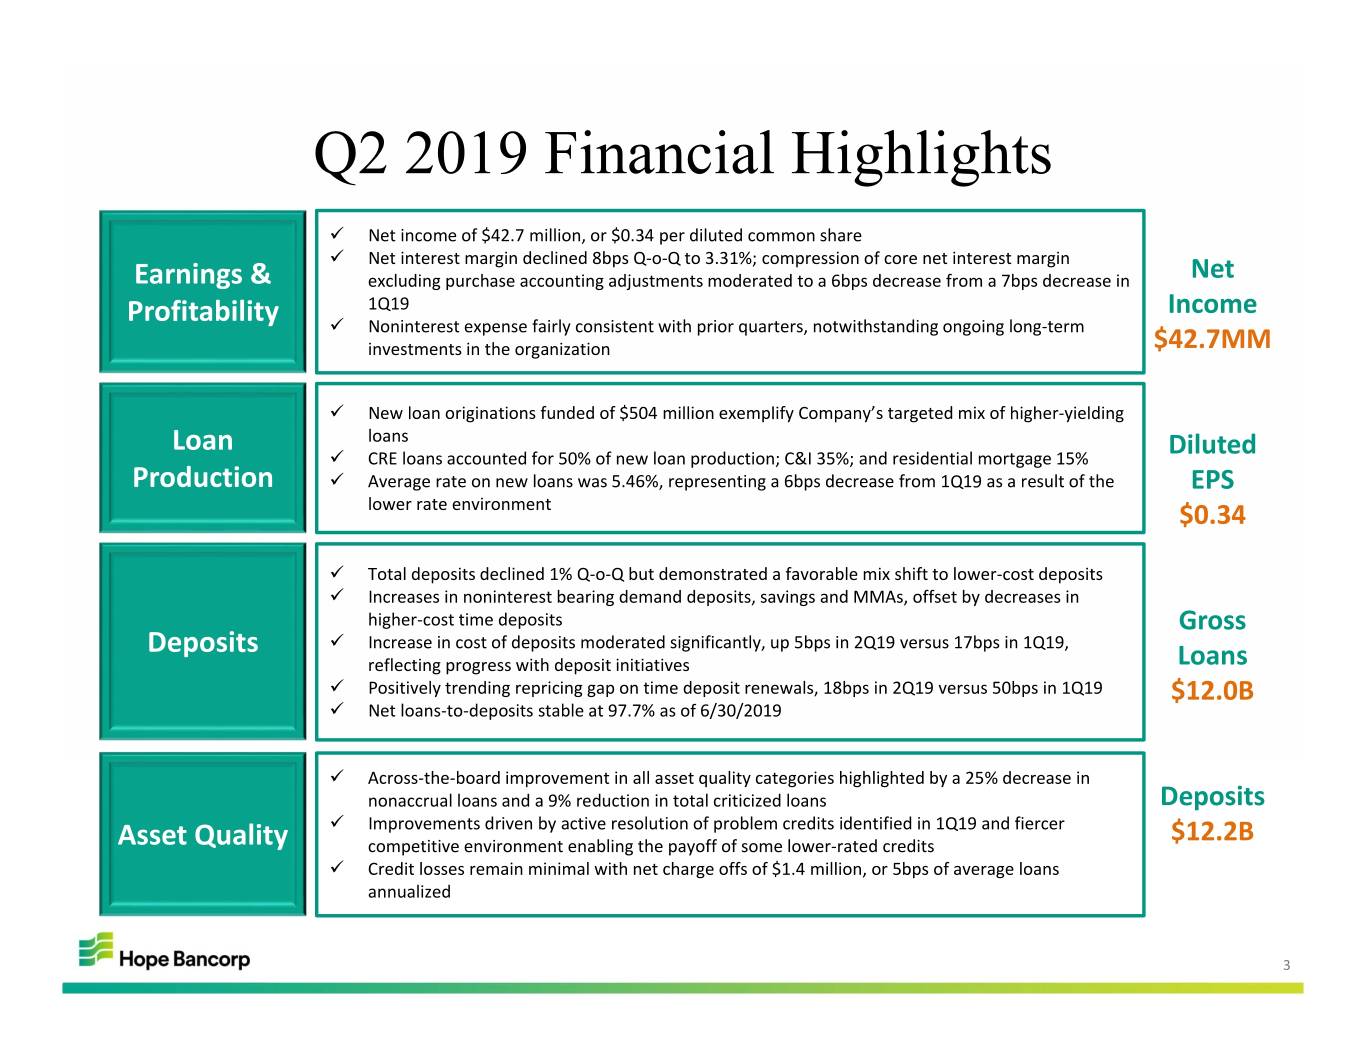
Q2 2019 Financial Highlights Net income of $42.7 million, or $0.34 per diluted common share Net interest margin declined 8bps Q‐o‐Q to 3.31%; compression of core net interest margin Earnings & excluding purchase accounting adjustments moderated to a 6bps decrease from a 7bps decrease in Net 1Q19 Income Profitability Noninterest expense fairly consistent with prior quarters, notwithstanding ongoing long‐term investments in the organization $42.7MM New loan originations funded of $504 million exemplify Company’s targeted mix of higher‐yielding Loan loans CRE loans accounted for 50% of new loan production; C&I 35%; and residential mortgage 15% Diluted Production Average rate on new loans was 5.46%, representing a 6bps decrease from 1Q19 as a result of the EPS lower rate environment $0.34 Total deposits declined 1% Q‐o‐Q but demonstrated a favorable mix shift to lower‐cost deposits Increases in noninterest bearing demand deposits, savings and MMAs, offset by decreases in higher‐cost time deposits Gross Deposits Increase in cost of deposits moderated significantly, up 5bps in 2Q19 versus 17bps in 1Q19, reflecting progress with deposit initiatives Loans Positively trending repricing gap on time deposit renewals, 18bps in 2Q19 versus 50bps in 1Q19 $12.0B Net loans‐to‐deposits stable at 97.7% as of 6/30/2019 Across‐the‐board improvement in all asset quality categories highlighted by a 25% decrease in nonaccrual loans and a 9% reduction in total criticized loans Deposits Improvements driven by active resolution of problem credits identified in 1Q19 and fiercer Asset Quality competitive environment enabling the payoff of some lower‐rated credits $12.2B Credit losses remain minimal with net charge offs of $1.4 million, or 5bps of average loans annualized 3
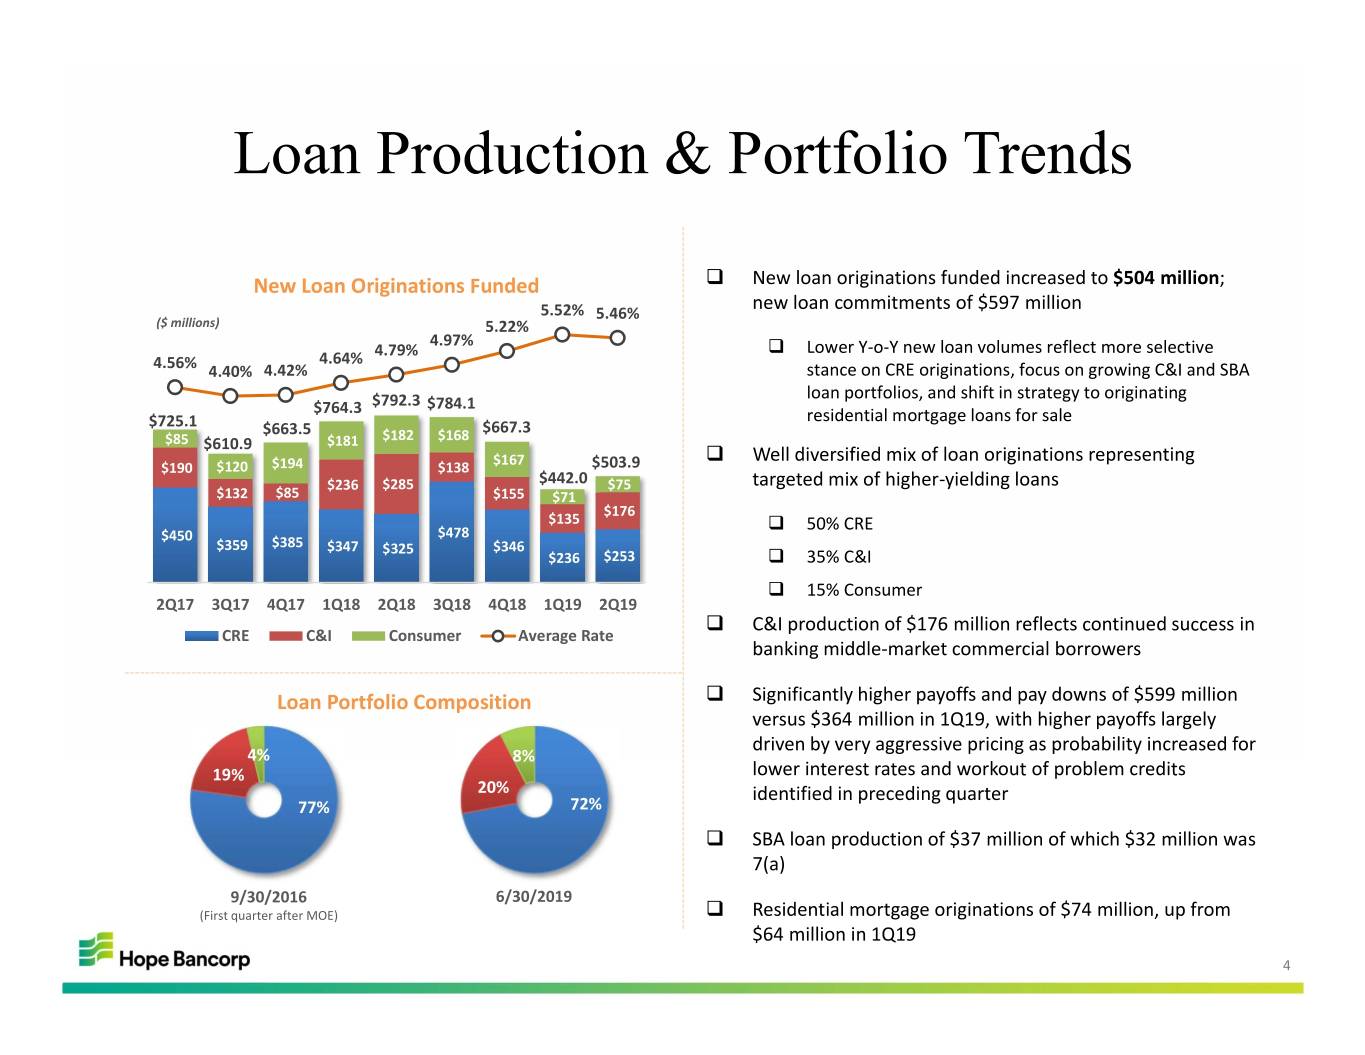
Loan Production & Portfolio Trends New Loan Originations Funded New loan originations funded increased to $504 million; new loan commitments of $597 million 5.52% 5.46% ($ millions) 5.22% 4.97% 4.79% Lower Y‐o‐Y new loan volumes reflect more selective 4.56% 4.64% 4.40% 4.42% stance on CRE originations, focus on growing C&I and SBA loan portfolios, and shift in strategy to originating $764.3 $792.3 $784.1 $725.1 residential mortgage loans for sale $663.5 $182 $667.3 $85 $610.9 $181 $168 $167 Well diversified mix of loan originations representing $190 $120 $194 $138 $503.9 $236 $285 $442.0 $75 targeted mix of higher‐yielding loans $132 $85 $155 $71 $176 $135 50% CRE $450 $478 $359 $385 $347 $325 $346 $236 $253 35% C&I 15% Consumer 2Q17 3Q17 4Q17 1Q18 2Q18 3Q18 4Q18 1Q19 2Q19 C&I production of $176 million reflects continued success in CRE C&I Consumer Average Rate banking middle‐market commercial borrowers Loan Portfolio Composition Significantly higher payoffs and pay downs of $599 million versus $364 million in 1Q19, with higher payoffs largely driven by very aggressive pricing as probability increased for 4% 8% 19% lower interest rates and workout of problem credits 20% identified in preceding quarter 77% 72% SBA loan production of $37 million of which $32 million was 7(a) 9/30/2016 6/30/2019 (First quarter after MOE) Residential mortgage originations of $74 million, up from $64 million in 1Q19 4

Net Interest Income and Margin Key Net Interest Income Drivers Net Interest Income & NIM Average Loans & Yield ($ millions) ($ billions) $126.4 $11.9 $12.1 $12.0 $123.3 $123.1 $11.8 $122.8 $121.9 $11.4 5.31% 5.32% $120.1 $119.6 $10.9 $11.1 $10.7 5.16% 5.21% $10.5 $116.8 3.84% $117.2 3.83% 3.66% 3.61% 5.07% 5.12% 5.16% 3.47% 3.41% 3.39% 5.04% 3.31% 4.89% 3.75% 2Q17 3Q17 4Q17 1Q18 2Q18 3Q18 4Q18 1Q19 2Q19 2Q17 3Q17 4Q17 1Q18 2Q18 3Q18 4Q18 1Q19 2Q19 Avg Loans Yield Net Interest Income NIM Average Interest Bearing Deposits & 2Q19 NII decreased slightly Q‐o‐Q reflecting slight decrease in Cost of Deposits average loans coupled with lower NIM $9.2 $9.1 ($ millions) $8.8 $9.0 $8.5 Net interest margin declined 8bps to 3.31% $8.2 $7.8 $7.9 $7.8 1.57% 1.62% 1.40% – Compression of core net interest margin excluding 1.24% 0.91% 1.06% purchase accounting adjustments moderated to a 0.75% 0.80% 0.68% 6bps decrease from a 7bps decrease in 1Q19 The increase in cost of deposits continued to moderate, up 5 2Q17 3Q17 4Q17 1Q18 2Q18 3Q18 4Q18 1Q19 2Q19 bps in 2Q19, versus 17bps in 1Q19 Average Interest Bearing Deposits Cost of Deposits Repricing gap on time deposit renewals continued to improve at 18bps in 2Q19, compared with 50bps in 1Q19 PAA = Purchase accounting adjustments 5
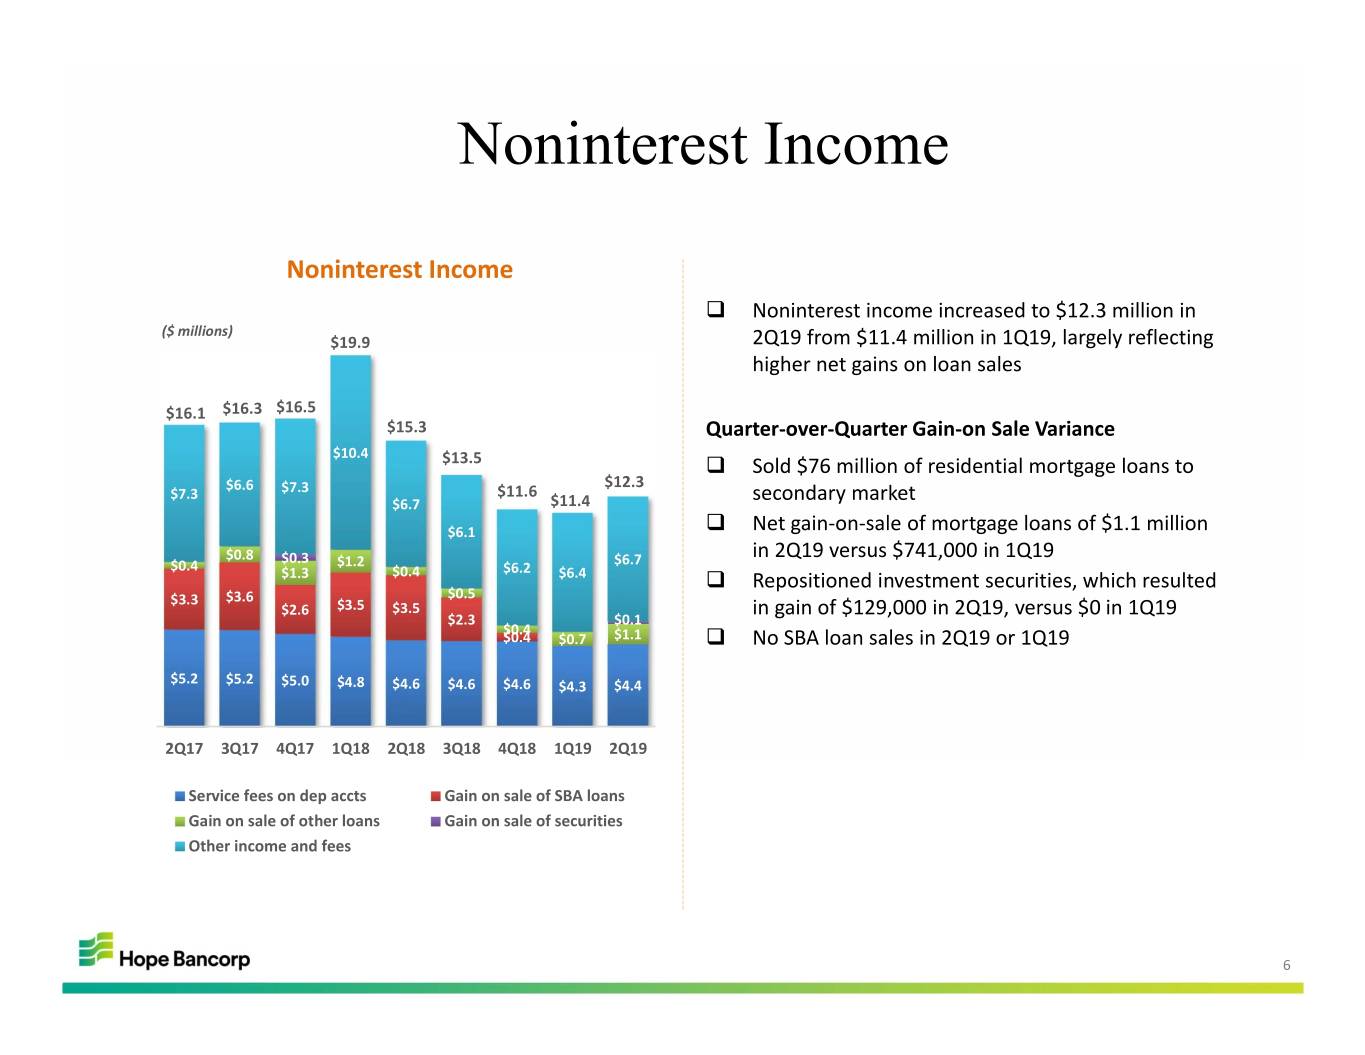
Noninterest Income Noninterest Income Noninterest income increased to $12.3 million in ($ millions) $19.9 2Q19 from $11.4 million in 1Q19, largely reflecting higher net gains on loan sales $16.1 $16.3 $16.5 $15.3 Quarter‐over‐Quarter Gain‐on Sale Variance $10.4 $13.5 Sold $76 million of residential mortgage loans to $6.6 $12.3 $7.3 $7.3 $11.6 $6.7 $11.4 secondary market $6.1 Net gain‐on‐sale of mortgage loans of $1.1 million $0.8 $0.3 $6.7 in 2Q19 versus $741,000 in 1Q19 $0.4 $1.2 $6.2 $1.3 $0.4 $6.4 Repositioned investment securities, which resulted $3.3 $3.6 $0.5 $2.6 $3.5 $3.5 in gain of $129,000 in 2Q19, versus $0 in 1Q19 $2.3 $0.1 $0.4 $0.4 $0.7 $1.1 No SBA loan sales in 2Q19 or 1Q19 $5.2 $5.2 $5.0 $4.8 $4.6 $4.6 $4.6 $4.3 $4.4 2Q17 3Q17 4Q17 1Q18 2Q18 3Q18 4Q18 1Q19 2Q19 Service fees on dep accts Gain on sale of SBA loans Gain on sale of other loans Gain on sale of securities Other income and fees 6
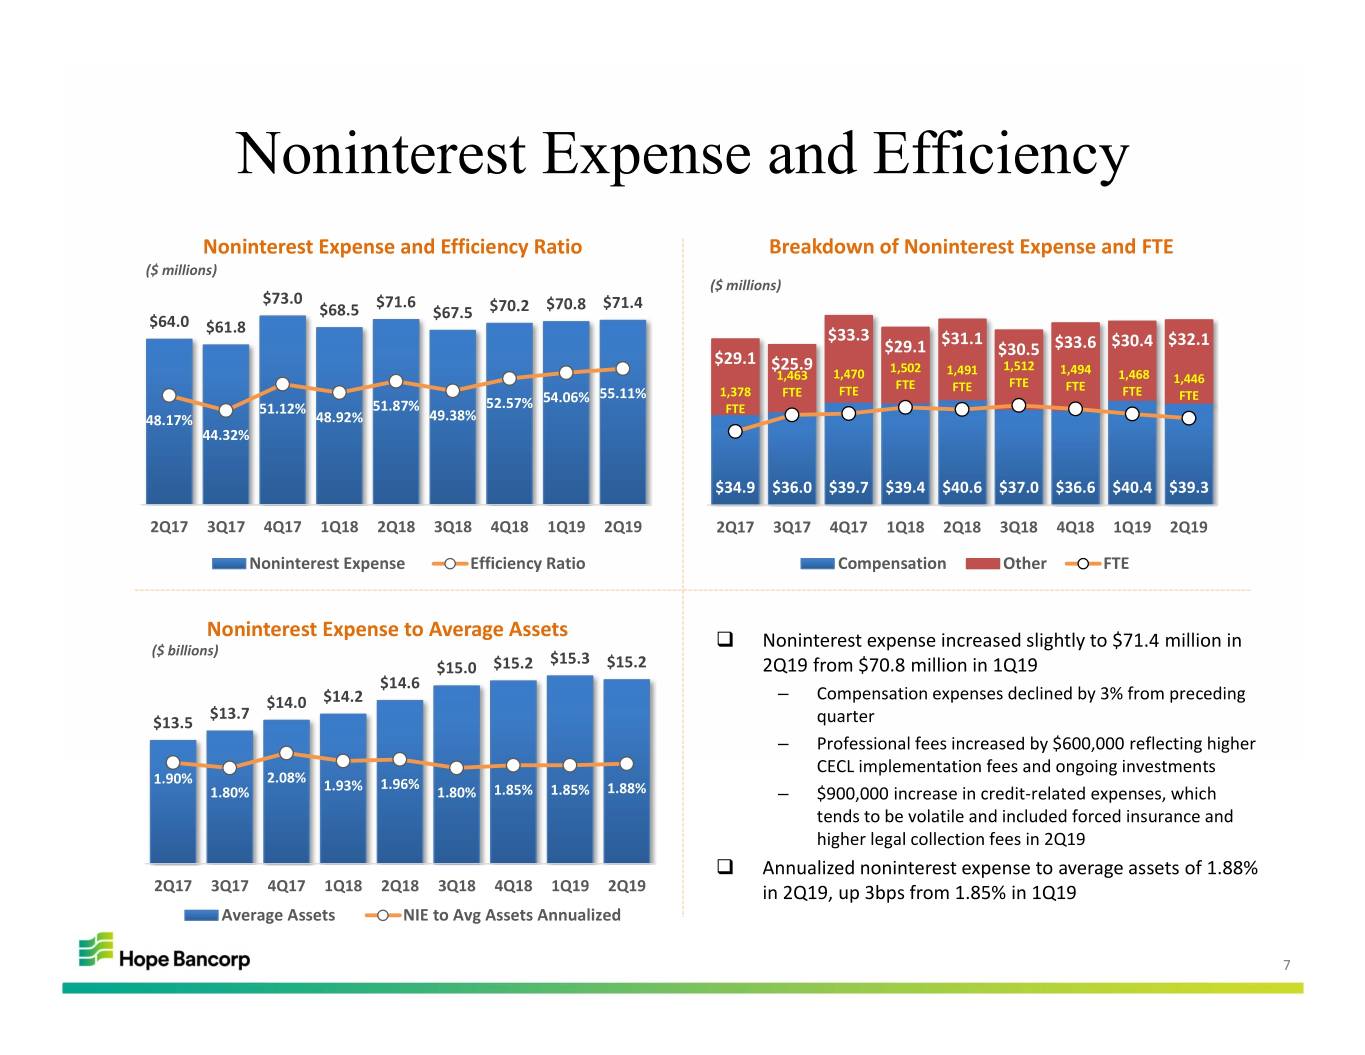
Noninterest Expense and Efficiency Noninterest Expense and Efficiency Ratio Breakdown of Noninterest Expense and FTE ($ millions) ($ millions) $73.0 $71.6 $70.8 $71.4 $68.5 $67.5 $70.2 $64.0 $61.8 $33.3 $29.1 $31.1 $33.6 $30.4 $32.1 $29.1 $30.5 $25.9 1,502 1,491 1,512 1,494 1,463 1,470 1,468 1,446 FTE FTE FTE FTE 54.06% 55.11% 1,378 FTE FTE FTE FTE 51.12% 51.87% 52.57% FTE 48.17% 48.92% 49.38% 44.32% $34.9 $36.0 $39.7 $39.4 $40.6 $37.0 $36.6 $40.4 $39.3 2Q17 3Q17 4Q17 1Q18 2Q18 3Q18 4Q18 1Q19 2Q19 2Q17 3Q17 4Q17 1Q18 2Q18 3Q18 4Q18 1Q19 2Q19 Noninterest Expense Efficiency Ratio Compensation Other FTE Noninterest Expense to Average Assets Noninterest expense increased slightly to $71.4 million in ($ billions) $15.3 $15.0 $15.2 $15.2 2Q19 from $70.8 million in 1Q19 $14.6 – $14.0 $14.2 Compensation expenses declined by 3% from preceding $13.7 $13.5 quarter – Professional fees increased by $600,000 reflecting higher CECL implementation fees and ongoing investments 1.90% 2.08% 1.96% 1.80% 1.93% 1.80% 1.85% 1.85% 1.88% – $900,000 increase in credit‐related expenses, which tends to be volatile and included forced insurance and higher legal collection fees in 2Q19 Annualized noninterest expense to average assets of 1.88% 2Q17 3Q17 4Q17 1Q18 2Q18 3Q18 4Q18 1Q19 2Q19 in 2Q19, up 3bps from 1.85% in 1Q19 Average Assets NIE to Avg Assets Annualized 7

Deposit Trends Deposit Composition Total end‐of‐period deposits decreased 1% Q‐o‐Q ($ billions) Favorable shift in deposit mix with increases in lower‐cost $11.51 $11.73 $12.05 $12.16 $12.25 $12.17 deposits and decreases in time deposits $10.96 $10.99 $10.85 – 2% increase in noninterest bearing deposits Q‐o‐Q $4.10 $4.01 $4.27 $4.77 $5.18 $5.55 $5.87 $5.99 $5.68 – 5% increase in MMA balances Q‐o‐Q $0.24 $0.28 $0.24 $0.23 $0.23 $0.23 $0.23 $0.22 $0.24 Net loan‐to‐deposits stable at 97.7% at 6/30/19, versus $3.57 $3.69 $3.33 $3.45 $3.28 $3.25 $3.04 $3.09 $3.24 97.6% as of 3/31/19 $3.02 $3.05 $3.00 $3.05 $3.04 $3.02 $3.02 $2.95 $3.01 Repricing gap on time deposit renewals continued to improve at 18bps in 2Q19, compared with 50bps in 1Q19 2Q17 3Q17 4Q17 1Q18 2Q18 3Q18 4Q18 1Q19 2Q19 Deposit gathering and cost containment strategies remain a DDA MMA Savings Time top priority Net Loans to Deposits CD Renewal Repricing Gap $12.5B 0.25% 101.85% 98.97% 97.64%97.68% 98.16% 99.07% 98.92% 98.39% 0.22% 0.22% $12.0B 97.65% 0.19% $11.5B 0.13% 0.10% 0.10% $11.0B $10.5B 0.33% 0.51% 0.65% 0.85% 0.69% 0.50% 0.18% $10.0B 4Q17 1Q18 2Q18 3Q18 4Q18 1Q19 2Q19 2Q17 3Q17 4Q17 1Q18 2Q18 3Q18 4Q18 1Q19 2Q19 CD Renewal Repricing Gap QTD Change in Avg CD Rate Net Loans Deposits LTD Ratio DDA = Noninterest bearing demand deposits MMA = Money market account deposits 8

Asset Quality Nonperforming Assets Provision Expense & Net Charge Offs ($ millions) ($ millions) $7.3 $137.9 $138.5 $125.7 $125.2 $129.1 $5.4 $124.3 $8.3 $118.2 $6.3 $17.2 $10.8 $8.7 $113.0 $111.66 $21.8 $129.6 $9.0 $7.8 $132.2 $5.6 $2.8 $3.6 0.22% $114.4 $120.4 $2.8 $3.0 $102.5 $108.5 $109.2 $105.2 $106.0 $2.5 $2.3 $1.2 0.95% 0.03% 0.02% 0.90% 0.89% 0.87% 0.90% 0.10% 0.02% 0.88% 0.07% ‐0.04% 0.05% 0.78% 0.74% 0.73% 0.05% 2Q17 3Q17 4Q17 1Q18 2Q18 3Q18 4Q18 1Q19 2Q19 2Q17 3Q17 4Q17 1Q18 2Q18 3Q18 4Q18 1Q19 2Q19 Provision Expense NPLs OREO NPAs/Total Assets Net Charge Offs (Recoveries) (annualized) Criticized Loans Across‐the‐board improvements in all asset quality ($ millions) categories – $566.5 $573.3 $568.5 25% decline in nonaccrual loans led to 20% decrease $540.7 $520.5 $558.6 $497.2 $481.4 $510.3 in total nonperforming loans $315.4 $348.1 $353.6 $353.2 $344.6 $302.7 – Total criticized loans down 9% Q‐o‐Q $357.7 $318.3 $323.8 Improvements driven by payoffs of lower‐rated credits 5.24% 5.23% 5.12% 4.79% 4.63% 4.26% 4.36% 3.98% 4.26% and workout efforts of problem loans identified in 1Q19 $251.1 $225.2 $214.9 $196.1 $139.5 $217.8 $163.1 $205.4 $186.5 Any potential loss exposure from problem credits identified in 1Q19 remain minimal 2Q17 3Q17 4Q17 1Q18 2Q18 3Q18 4Q18 1Q19 2Q19 Credit losses continued to be minimal, with net charge Classified offs of $1.4 million, or 5bps of average loans on an Special Mention annualized basis in 2Q19 Total Criticized Loans as a % of Gross Loans Underlying health of broader portfolio remains solid 9
Near-Term Outlook & Strategies Continuation of positive trends from first half of 2019 Favorable shift in mix of new loan production favoring higher‐yielding loans Gaining more traction with deposit gathering initiatives, leading to improved deposit mix and better deposit cost management Stable asset quality, supported by disciplined underwriting, constant monitoring and proactive action Improved expense management Full‐year loan growth guidance revised to 2‐3% for 2019, reflecting stronger headwinds with projection for lower interest rates and an even fiercer competitive landscape NIM guidance updated to reflect rapidly evolving rate environment and high probability for lower rates 25bps decline in interest rates expected to impact NIM by 5‐8bps 2019 Key Priorities remain in focus relative to the rapidly changing rate environment Profitable Growth – Better deposit cost management Profitable Growth – Better loan yields Profitable Growth – Better efficiencies Capital Management Committed to Building on Strong Foundation and Enhancing Long‐Term Shareholder Value 10

2019 Second Quarter Earnings Conference Call Q&A 11


