
2019 Fourth Quarter Earnings Conference Call Thursday, January 23, 2020 1

Forward Looking Statements & Additional Disclosures This presentation may contain statements regarding future events or the future financial performance of the Company that constitute forward‐looking statements within the meaning of Section 27A of the Securities Act of 1933, as amended, and Section 21E of the Securities Exchange Act of 1934, as amended. These forward‐looking statements relate to, among other things, expectations regarding the business environment in which we operate, projections of future performance, perceived opportunities in the market, and statements regarding our business strategies, objectives and vision. Forward‐ looking statements include, but are not limited to, statements preceded by, followed by or that include the words “will,” “believes,” “expects,” “anticipates,” “intends,” “plans,” “estimates” or similar expressions. With respect to any such forward‐looking statements, the Company claims the protection provided for in the Private Securities Litigation Reform Act of 1995. These statements involve risks and uncertainties. The Company’s actual results, performance or achievements may differ significantly from the results, performance or achievements expressed or implied in any forward‐looking statements. The risks and uncertainties include, but are not limited to: possible deterioration in economic conditions in our areas of operation; interest rate risk associated with volatile interest rates and related asset‐liability matching risk; liquidity risks; risk of significant non‐earning assets, and net credit losses that could occur, particularly in times of weak economic conditions or times of rising interest rates; the failure of or changes to assumptions and estimates underlying the Company’s allowances for loan losses, including the timing and effects of the implementation of the current expected credit losses model; and regulatory risks associated with current and future regulations. For additional information concerning these and other risk factors, see the Company’s most recent Annual Report on Form 10‐K. The Company does not undertake, and specifically disclaims any obligation, to update any forward‐looking statements to reflect the occurrence of events or circumstances after the date of such statements except as required by law. 2
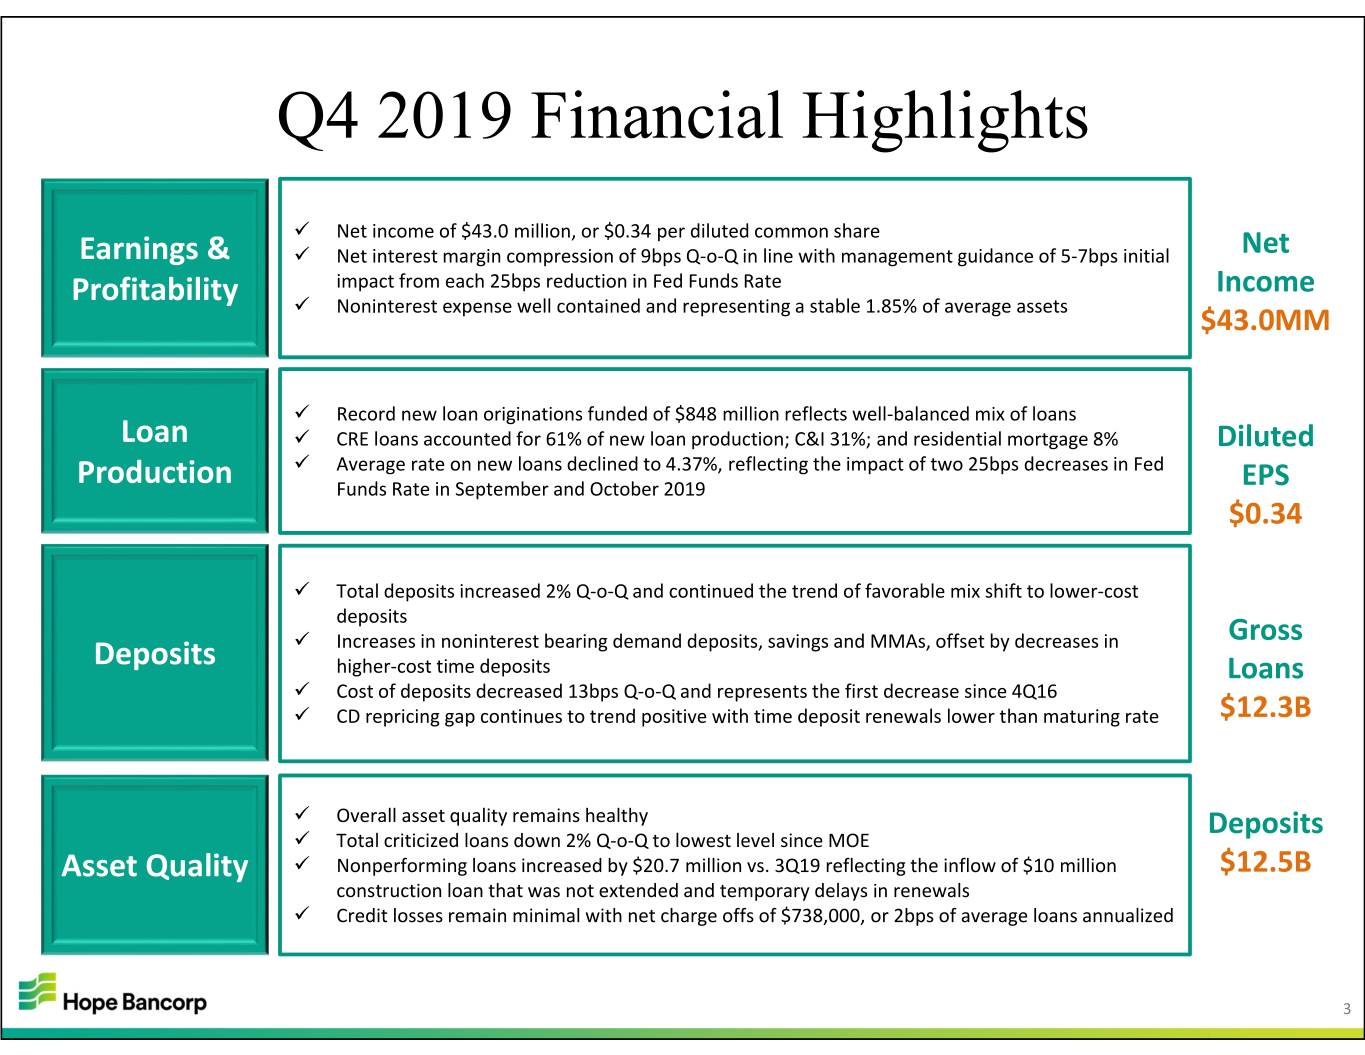
Q4 2019 Financial Highlights Net income of $43.0 million, or $0.34 per diluted common share Earnings & Net interest margin compression of 9bps Q‐o‐Q in line with management guidance of 5‐7bps initial Net Profitability impact from each 25bps reduction in Fed Funds Rate Income Noninterest expense well contained and representing a stable 1.85% of average assets $43.0MM Record new loan originations funded of $848 million reflects well‐balanced mix of loans Loan CRE loans accounted for 61% of new loan production; C&I 31%; and residential mortgage 8% Diluted Average rate on new loans declined to 4.37%, reflecting the impact of two 25bps decreases in Fed Production Funds Rate in September and October 2019 EPS $0.34 Total deposits increased 2% Q‐o‐Q and continued the trend of favorable mix shift to lower‐cost deposits Increases in noninterest bearing demand deposits, savings and MMAs, offset by decreases in Gross Deposits higher‐cost time deposits Loans Cost of deposits decreased 13bps Q‐o‐Q and represents the first decrease since 4Q16 CD repricing gap continues to trend positive with time deposit renewals lower than maturing rate $12.3B Overall asset quality remains healthy Deposits Total criticized loans down 2% Q‐o‐Q to lowest level since MOE Asset Quality Nonperforming loans increased by $20.7 million vs. 3Q19 reflecting the inflow of $10 million $12.5B construction loan that was not extended and temporary delays in renewals Credit losses remain minimal with net charge offs of $738,000, or 2bps of average loans annualized 3
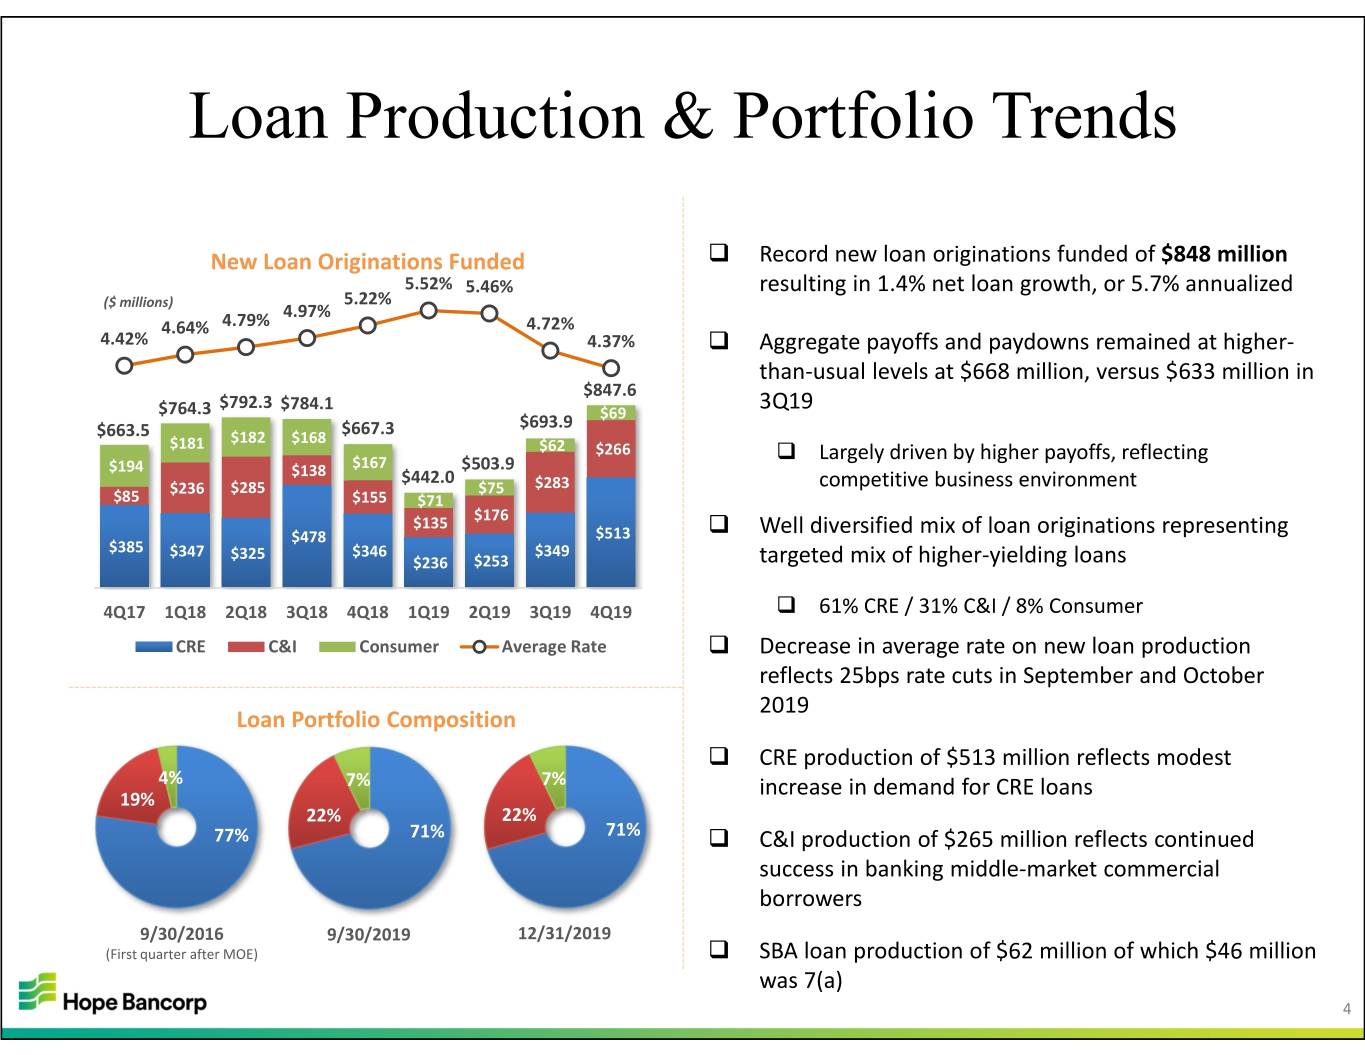
Loan Production & Portfolio Trends New Loan Originations Funded Record new loan originations funded of $848 million 5.52% 5.46% resulting in 1.4% net loan growth, or 5.7% annualized 5.22% ($ millions) 4.97% 4.64% 4.79% 4.72% 4.42% 4.37% Aggregate payoffs and paydowns remained at higher‐ than‐usual levels at $668 million, versus $633 million in $847.6 $764.3 $792.3 $784.1 3Q19 $693.9 $69 $663.5 $182 $168 $667.3 $181 $62 $266 Largely driven by higher payoffs, reflecting $194 $167 $503.9 $138 $442.0 $236 $285 $75 $283 competitive business environment $85 $155 $71 $135 $176 $478 $513 Well diversified mix of loan originations representing $385 $347 $325 $346 $349 $236 $253 targeted mix of higher‐yielding loans 4Q17 1Q18 2Q18 3Q18 4Q18 1Q19 2Q19 3Q19 4Q19 61% CRE / 31% C&I / 8% Consumer CRE C&I Consumer Average Rate Decrease in average rate on new loan production reflects 25bps rate cuts in September and October 2019 Loan Portfolio Composition CRE production of $513 million reflects modest 4% 7% 7% 19% increase in demand for CRE loans 22% 22% 77% 71% 71% C&I production of $265 million reflects continued success in banking middle‐market commercial borrowers 9/30/2016 9/30/2019 12/31/2019 (First quarter after MOE) SBA loan production of $62 million of which $46 million was 7(a) 4
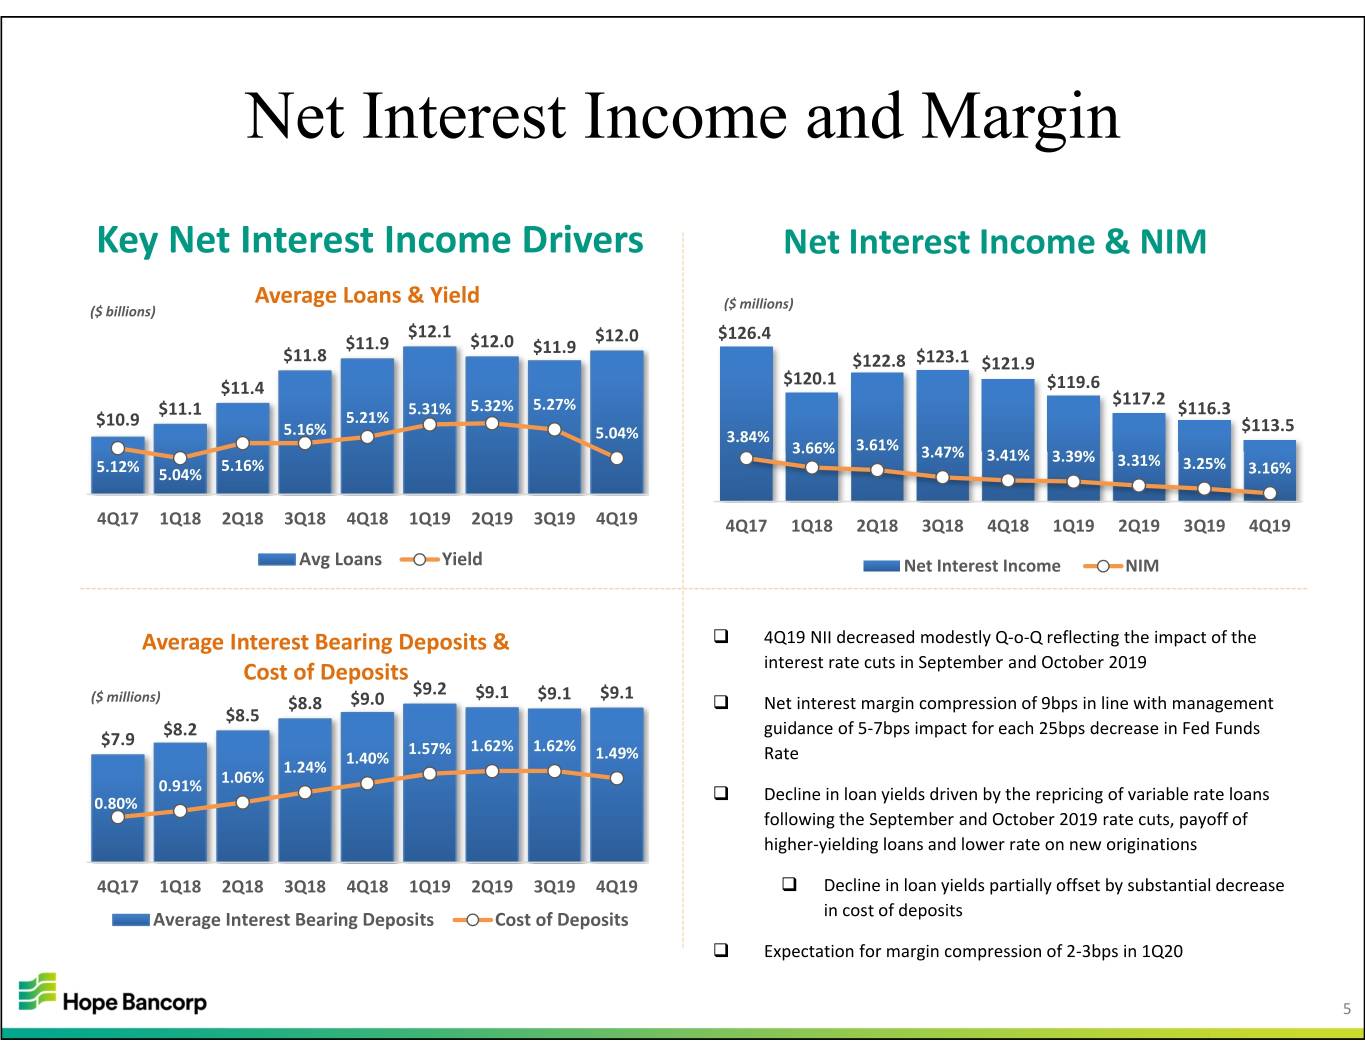
Net Interest Income and Margin Key Net Interest Income Drivers Net Interest Income & NIM Average Loans & Yield ($ millions) ($ billions) $12.1 $12.0 $126.4 $11.9 $12.0 $11.9 $11.8 $122.8 $123.1 $121.9 $11.4 $120.1 $119.6 $117.2 $11.1 5.31% 5.32% 5.27% $116.3 $10.9 5.21% 5.16% 5.04% $113.5 3.84% 3.61% 3.66% 3.47% 3.41% 3.39% 5.16% 3.31% 3.25% 5.12% 5.04% 3.16% 4Q17 1Q18 2Q18 3Q18 4Q18 1Q19 2Q19 3Q19 4Q19 4Q17 1Q18 2Q18 3Q18 4Q18 1Q19 2Q19 3Q19 4Q19 Avg Loans Yield Net Interest Income NIM Average Interest Bearing Deposits & 4Q19 NII decreased modestly Q‐o‐Q reflecting the impact of the Cost of Deposits interest rate cuts in September and October 2019 $9.2 $9.1 $9.1 $9.1 ($ millions) $8.8 $9.0 Net interest margin compression of 9bps in line with management $8.5 $8.2 guidance of 5‐7bps impact for each 25bps decrease in Fed Funds $7.9 1.57% 1.62% 1.62% 1.40% 1.49% Rate 1.24% 1.06% 0.91% 0.80% Decline in loan yields driven by the repricing of variable rate loans following the September and October 2019 rate cuts, payoff of higher‐yielding loans and lower rate on new originations 4Q17 1Q18 2Q18 3Q18 4Q18 1Q19 2Q19 3Q19 4Q19 Decline in loan yields partially offset by substantial decrease Average Interest Bearing Deposits Cost of Deposits in cost of deposits Expectation for margin compression of 2‐3bps in 1Q20 5
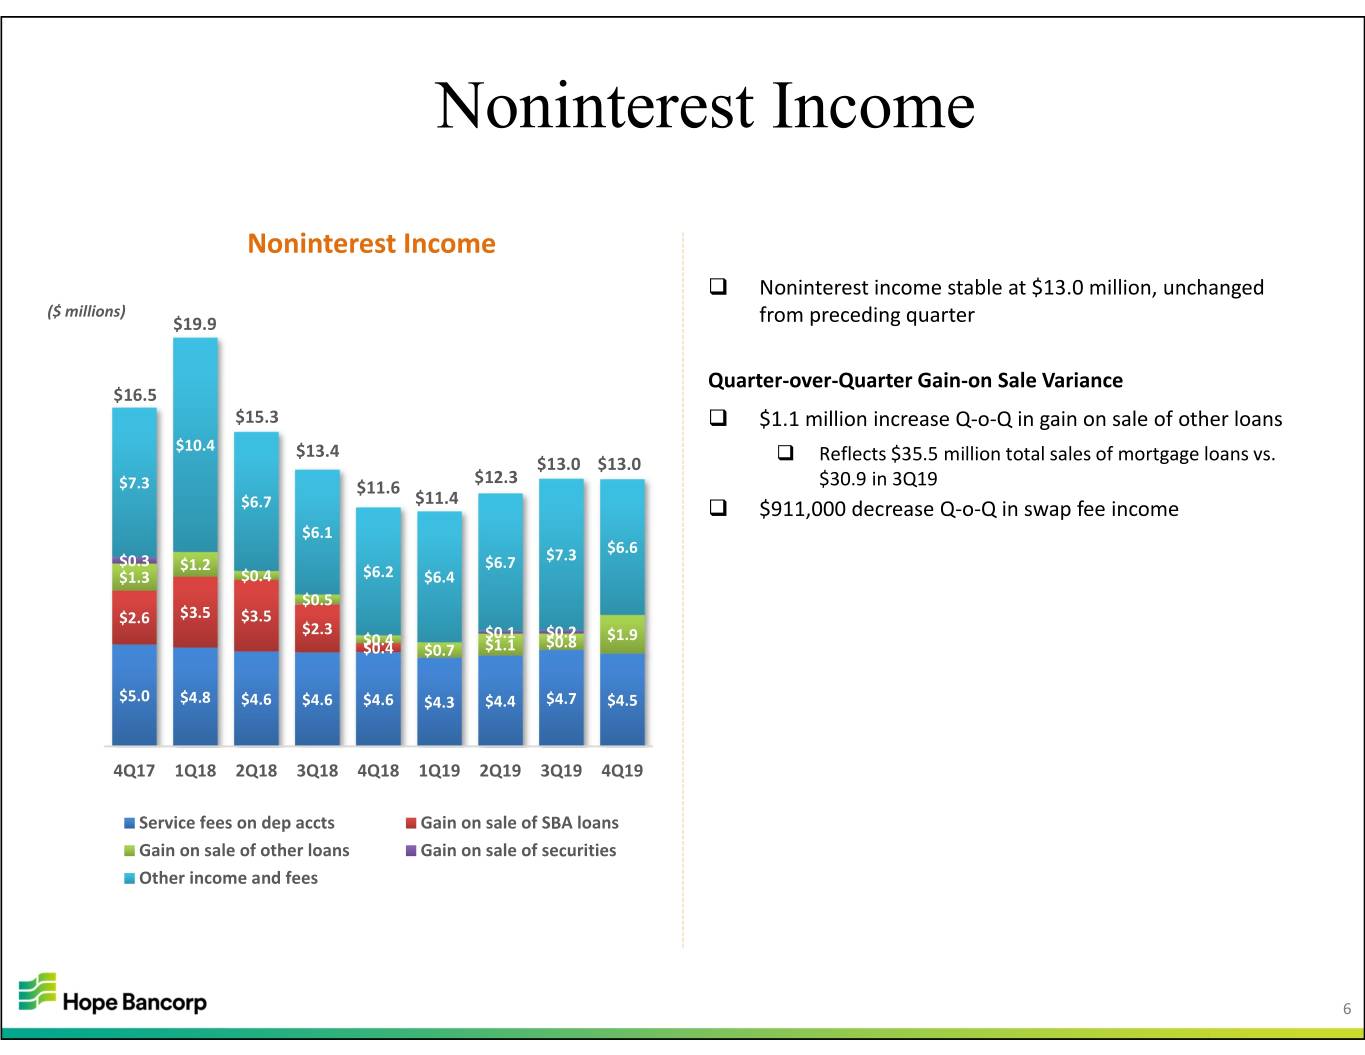
Noninterest Income Noninterest Income Noninterest income stable at $13.0 million, unchanged ($ millions) $19.9 from preceding quarter Quarter‐over‐Quarter Gain‐on Sale Variance $16.5 $15.3 $1.1 million increase Q‐o‐Q in gain on sale of other loans $10.4 $13.4 $13.0 $13.0 Reflects $35.5 million total sales of mortgage loans vs. $12.3 $7.3 $11.6 $30.9 in 3Q19 $6.7 $11.4 $911,000 decrease Q‐o‐Q in swap fee income $6.1 $7.3 $6.6 $0.3 $1.2 $6.7 $1.3 $0.4 $6.2 $6.4 $0.5 $2.6 $3.5 $3.5 $2.3 $0.4 $0.1 $0.2 $1.9 $0.4 $0.7 $1.1 $0.8 $5.0 $4.8 $4.6 $4.6 $4.6 $4.3 $4.4 $4.7 $4.5 4Q17 1Q18 2Q18 3Q18 4Q18 1Q19 2Q19 3Q19 4Q19 Service fees on dep accts Gain on sale of SBA loans Gain on sale of other loans Gain on sale of securities Other income and fees 6
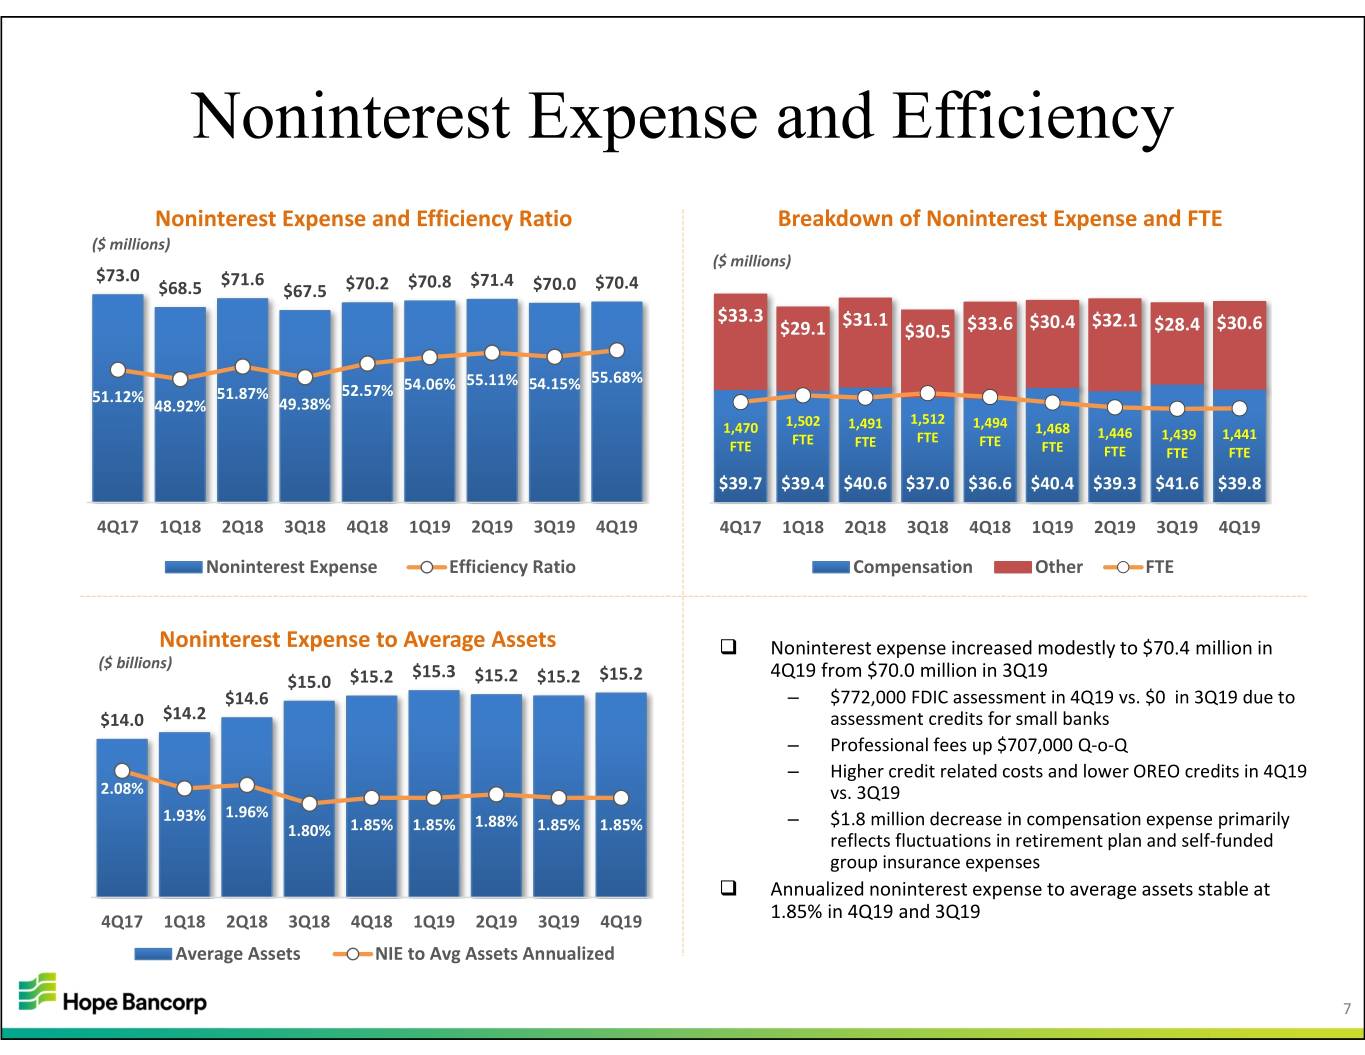
Noninterest Expense and Efficiency Noninterest Expense and Efficiency Ratio Breakdown of Noninterest Expense and FTE ($ millions) ($ millions) $73.0 $71.6 $70.8 $71.4 $68.5 $67.5 $70.2 $70.0 $70.4 $33.3 $31.1 $32.1 $29.1 $30.5 $33.6 $30.4 $28.4 $30.6 54.06% 55.11% 54.15% 55.68% 51.12% 51.87% 52.57% 48.92% 49.38% 1,502 1,491 1,512 1,494 1,470 1,468 1,446 1,441 FTE FTE FTE FTE 1,439 FTE FTE FTE FTE FTE $39.7 $39.4 $40.6 $37.0 $36.6 $40.4 $39.3 $41.6 $39.8 4Q17 1Q18 2Q18 3Q18 4Q18 1Q19 2Q19 3Q19 4Q19 4Q17 1Q18 2Q18 3Q18 4Q18 1Q19 2Q19 3Q19 4Q19 Noninterest Expense Efficiency Ratio Compensation Other FTE Noninterest Expense to Average Assets Noninterest expense increased modestly to $70.4 million in ($ billions) $15.3 4Q19 from $70.0 million in 3Q19 $15.0 $15.2 $15.2 $15.2 $15.2 $14.6 – $772,000 FDIC assessment in 4Q19 vs. $0 in 3Q19 due to $14.0 $14.2 assessment credits for small banks – Professional fees up $707,000 Q‐o‐Q – Higher credit related costs and lower OREO credits in 4Q19 2.08% vs. 3Q19 1.96% 1.93% 1.88% – $1.8 million decrease in compensation expense primarily 1.80% 1.85% 1.85% 1.85% 1.85% reflects fluctuations in retirement plan and self‐funded group insurance expenses Annualized noninterest expense to average assets stable at 4Q17 1Q18 2Q18 3Q18 4Q18 1Q19 2Q19 3Q19 4Q19 1.85% in 4Q19 and 3Q19 Average Assets NIE to Avg Assets Annualized 7
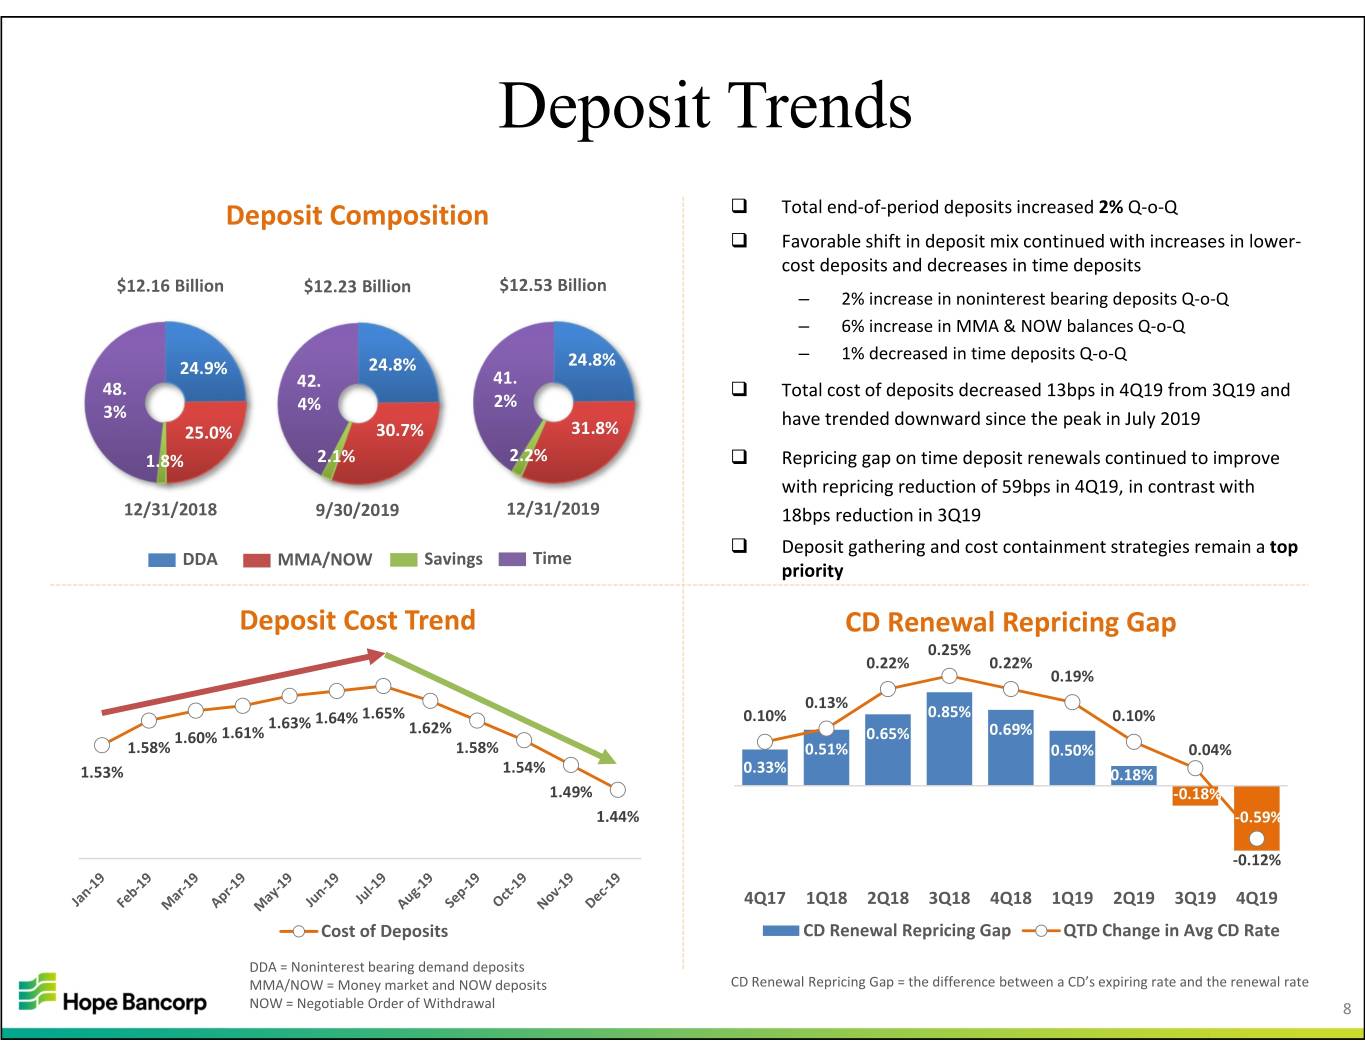
Deposit Trends Deposit Composition Total end‐of‐period deposits increased 2% Q‐o‐Q Favorable shift in deposit mix continued with increases in lower‐ cost deposits and decreases in time deposits $12.16 Billion $12.23 Billion $12.53 Billion – 2% increase in noninterest bearing deposits Q‐o‐Q – 6% increase in MMA & NOW balances Q‐o‐Q – 1% decreased in time deposits Q‐o‐Q 24.9% 24.8% 24.8% 41. 48. 42. Total cost of deposits decreased 13bps in 4Q19 from 3Q19 and 4% 2% 3% have trended downward since the peak in July 2019 25.0% 30.7% 31.8% 1.8% 2.1% 2.2% Repricing gap on time deposit renewals continued to improve with repricing reduction of 59bps in 4Q19, in contrast with 12/31/2018 9/30/2019 12/31/2019 18bps reduction in 3Q19 Deposit gathering and cost containment strategies remain a top DDA MMA/NOW Savings Time priority Deposit Cost Trend CD Renewal Repricing Gap 0.25% 0.22% 0.22% 0.19% 0.13% 1.64% 1.65% 0.10% 0.85% 0.10% 1.63% 1.62% 1.60% 1.61% 0.65% 0.69% 1.58% 1.58% 0.51% 0.50% 0.04% 1.53% 1.54% 0.33% 0.18% 1.49% ‐0.18% 1.44% ‐0.59% ‐0.12% 4Q17 1Q18 2Q18 3Q18 4Q18 1Q19 2Q19 3Q19 4Q19 Cost of Deposits CD Renewal Repricing Gap QTD Change in Avg CD Rate DDA = Noninterest bearing demand deposits MMA/NOW = Money market and NOW deposits CD Renewal Repricing Gap = the difference between a CD’s expiring rate and the renewal rate NOW = Negotiable Order of Withdrawal 8
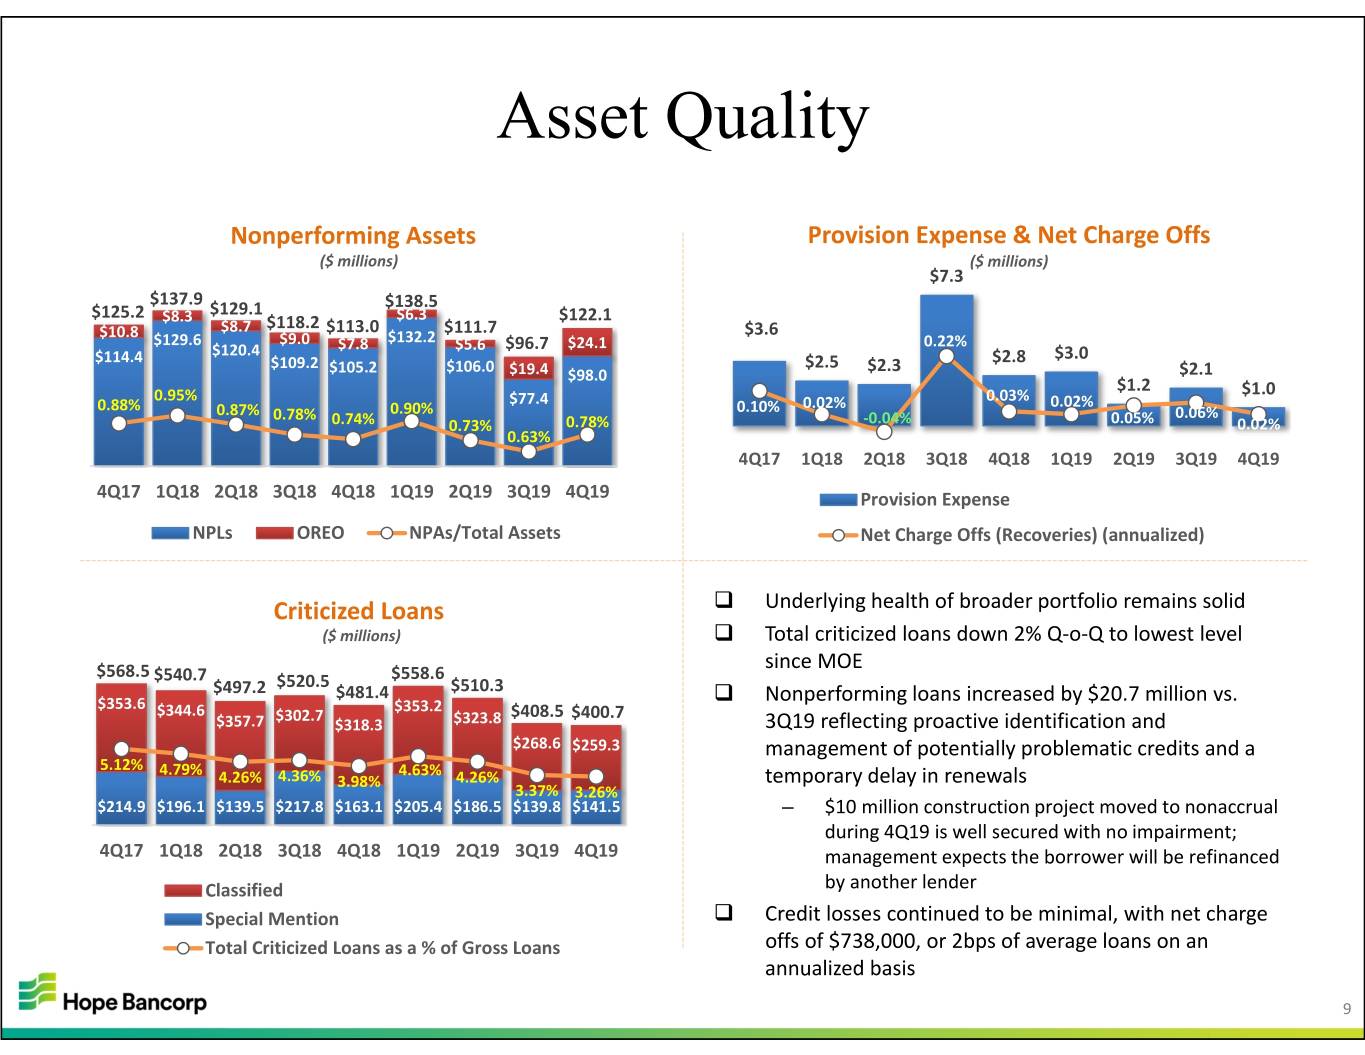
Asset Quality Nonperforming Assets Provision Expense & Net Charge Offs ($ millions) ($ millions) $7.3 $137.9 $138.5 $125.2 $8.3 $129.1 $6.3 $122.1 $10.8 $8.7 $118.2 $113.0 $111.7 $3.6 $129.6 $9.0 $7.8 $132.2 $5.6 $96.7 $24.1 0.22% $114.4 $120.4 $2.8 $3.0 $109.2 $106.0 $2.5 $2.3 $105.2 $19.4 $98.0 $2.1 $1.2 0.95% 0.03% $1.0 0.88% $77.4 0.02% 0.02% 0.87% 0.78% 0.90% 0.10% 0.06% 0.74% 0.73% 0.78% ‐0.04% 0.05% 0.02% 0.63% 4Q17 1Q18 2Q18 3Q18 4Q18 1Q19 2Q19 3Q19 4Q19 4Q17 1Q18 2Q18 3Q18 4Q18 1Q19 2Q19 3Q19 4Q19 Provision Expense NPLs OREO NPAs/Total Assets Net Charge Offs (Recoveries) (annualized) Criticized Loans Underlying health of broader portfolio remains solid ($ millions) Total criticized loans down 2% Q‐o‐Q to lowest level $568.5 since MOE $540.7 $520.5 $558.6 $497.2 $481.4 $510.3 Nonperforming loans increased by $20.7 million vs. $353.6 $353.2 $344.6 $302.7 $408.5 $400.7 $357.7 $318.3 $323.8 3Q19 reflecting proactive identification and $268.6 $259.3 management of potentially problematic credits and a 5.12% 4.79% 4.63% 4.26% 4.36% 3.98% 4.26% temporary delay in renewals 3.37% 3.26% $214.9 $196.1 $139.5 $217.8 $163.1 $205.4 $186.5 $139.8 $141.5 – $10 million construction project moved to nonaccrual during 4Q19 is well secured with no impairment; 4Q17 1Q18 2Q18 3Q18 4Q18 1Q19 2Q19 3Q19 4Q19 management expects the borrower will be refinanced Classified by another lender Special Mention Credit losses continued to be minimal, with net charge Total Criticized Loans as a % of Gross Loans offs of $738,000, or 2bps of average loans on an annualized basis 9
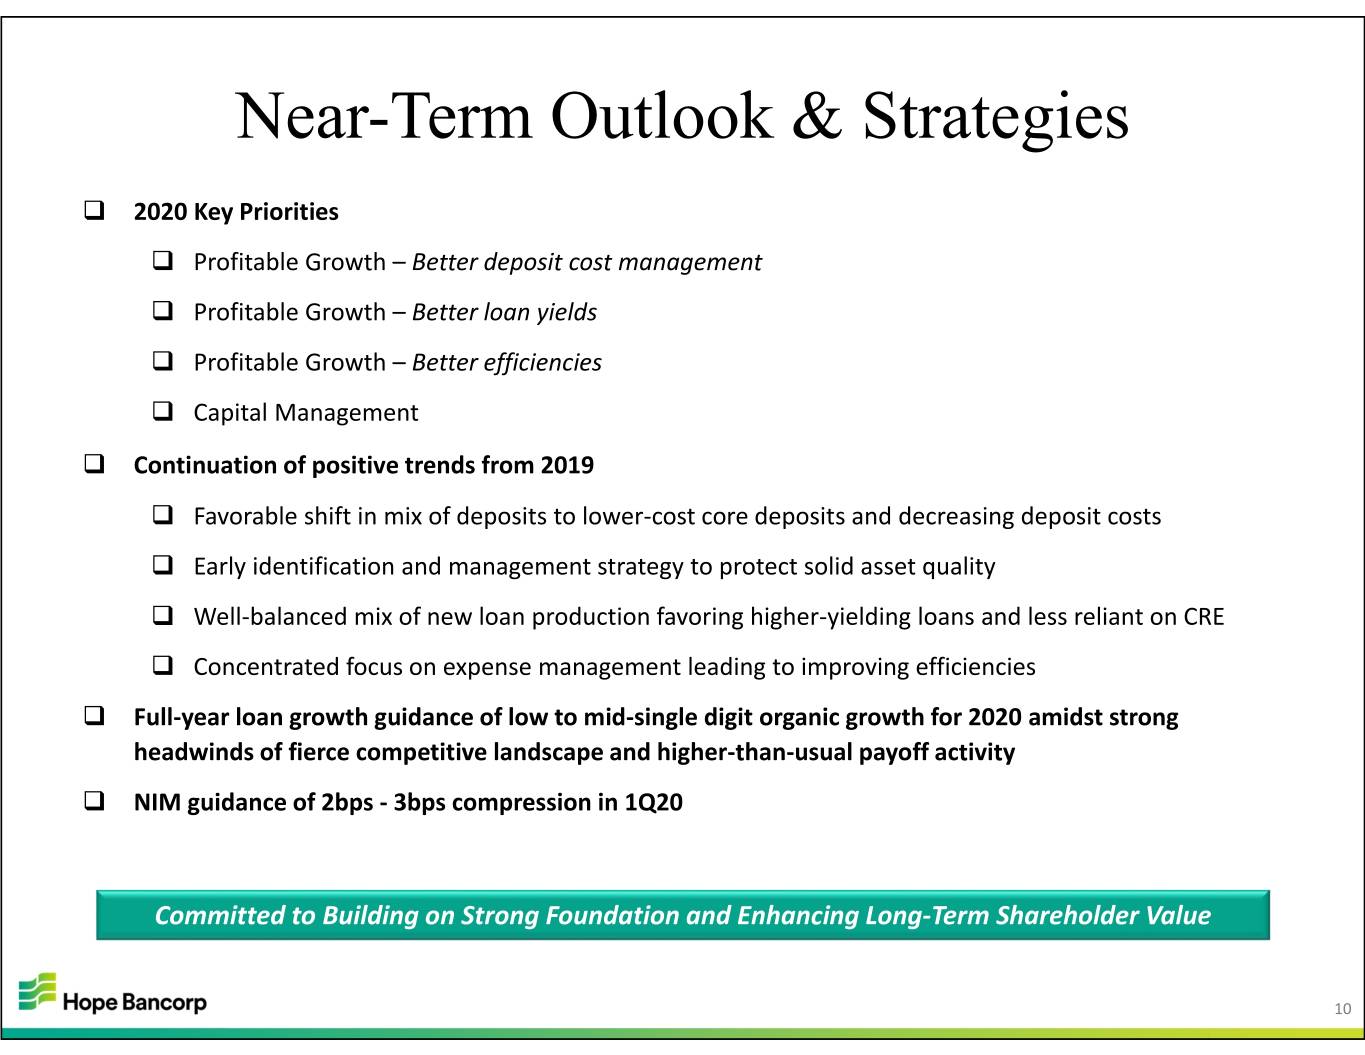
Near-Term Outlook & Strategies 2020 Key Priorities Profitable Growth – Better deposit cost management Profitable Growth – Better loan yields Profitable Growth – Better efficiencies Capital Management Continuation of positive trends from 2019 Favorable shift in mix of deposits to lower‐cost core deposits and decreasing deposit costs Early identification and management strategy to protect solid asset quality Well‐balanced mix of new loan production favoring higher‐yielding loans and less reliant on CRE Concentrated focus on expense management leading to improving efficiencies Full‐year loan growth guidance of low to mid‐single digit organic growth for 2020 amidst strong headwinds of fierce competitive landscape and higher‐than‐usual payoff activity NIM guidance of 2bps ‐ 3bps compression in 1Q20 Committed to Building on Strong Foundation and Enhancing Long‐Term Shareholder Value 10

2019 Fourth Quarter Earnings Conference Call Q&A 11
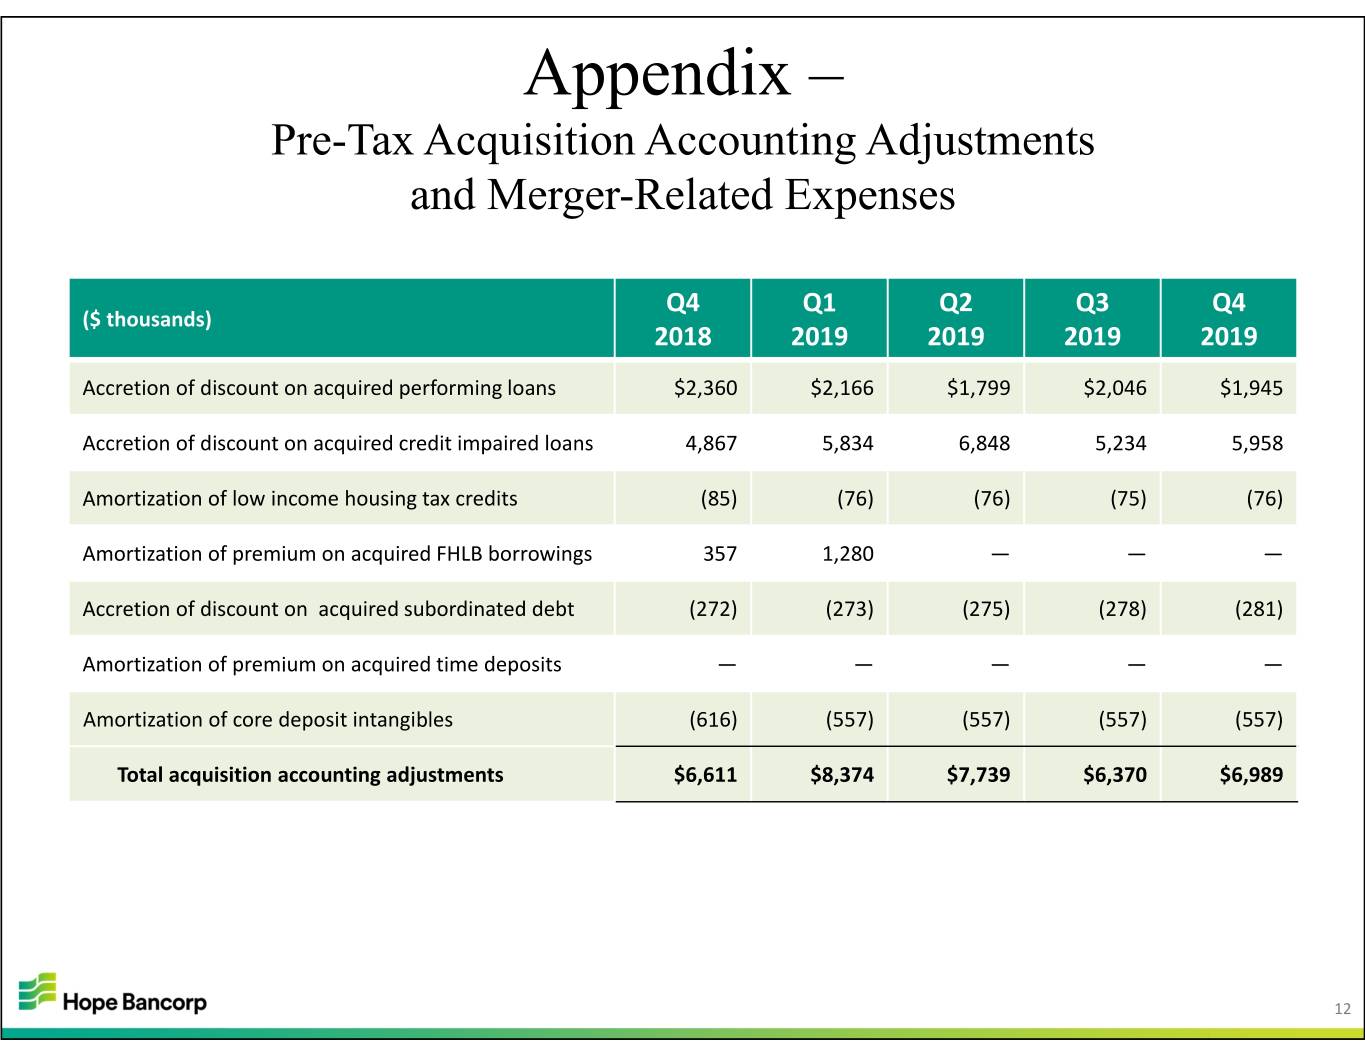
Appendix – Pre-Tax Acquisition Accounting Adjustments and Merger-Related Expenses Q4 Q1 Q2 Q3 Q4 ($ thousands) 2018 2019 2019 2019 2019 Accretion of discount on acquired performing loans $2,360 $2,166 $1,799 $2,046 $1,945 Accretion of discount on acquired credit impaired loans 4,867 5,834 6,848 5,234 5,958 Amortization of low income housing tax credits (85) (76) (76) (75) (76) Amortization of premium on acquired FHLB borrowings 357 1,280 — — — Accretion of discount on acquired subordinated debt (272) (273) (275) (278) (281) Amortization of premium on acquired time deposits————— Amortization of core deposit intangibles (616) (557) (557) (557) (557) Total acquisition accounting adjustments $6,611 $8,374 $7,739 $6,370 $6,989 12


