
1 2020 Fourth Quarter Earnings Conference Call Wednesday, January 27, 2021

2 Forward Looking Statements & Additional Disclosures This presentation may contain statements regarding future events or the future financial performance of the Company that constitute forward-looking statements within the meaning of Section 27A of the Securities Act of 1933, as amended, and Section 21E of the Securities Exchange Act of 1934, as amended. These forward-looking statements relate to, among other things, expectations regarding the business environment in which we operate, projections of future performance, perceived opportunities in the market, and statements regarding our business strategies, objectives and vision. Forward- looking statements include, but are not limited to, statements preceded by, followed by or that include the words “will,” “believes,” “expects,” “anticipates,” “intends,” “plans,” “estimates” or similar expressions. With respect to any such forward-looking statements, the Company claims the protection provided for in the Private Securities Litigation Reform Act of 1995. These statements involve risks and uncertainties. The Company’s actual results, performance or achievements may differ significantly from the results, performance or achievements expressed or implied in any forward-looking statements. The risks and uncertainties include, but are not limited to: possible deterioration in economic conditions in our areas of operation; interest rate risk associated with volatile interest rates and related asset-liability matching risk; liquidity risks; risk of significant non-earning assets, and net credit losses that could occur, particularly in times of weak economic conditions or times of rising interest rates; the failure of or changes to assumptions and estimates underlying the Company’s allowances for credit losses, including the timing and effects of the implementation of the current expected credit losses model; and regulatory risks associated with current and future regulations, and the COVID-19 pandemic and its impact on our financial position, results of operations, liquidity, and capitalization. For additional information concerning these and other risk factors, see the Company’s most recent Annual Report on Form 10-K. The Company does not undertake, and specifically disclaims any obligation, to update any forward-looking statements to reflect the occurrence of events or circumstances after the date of such statements except as required by law.
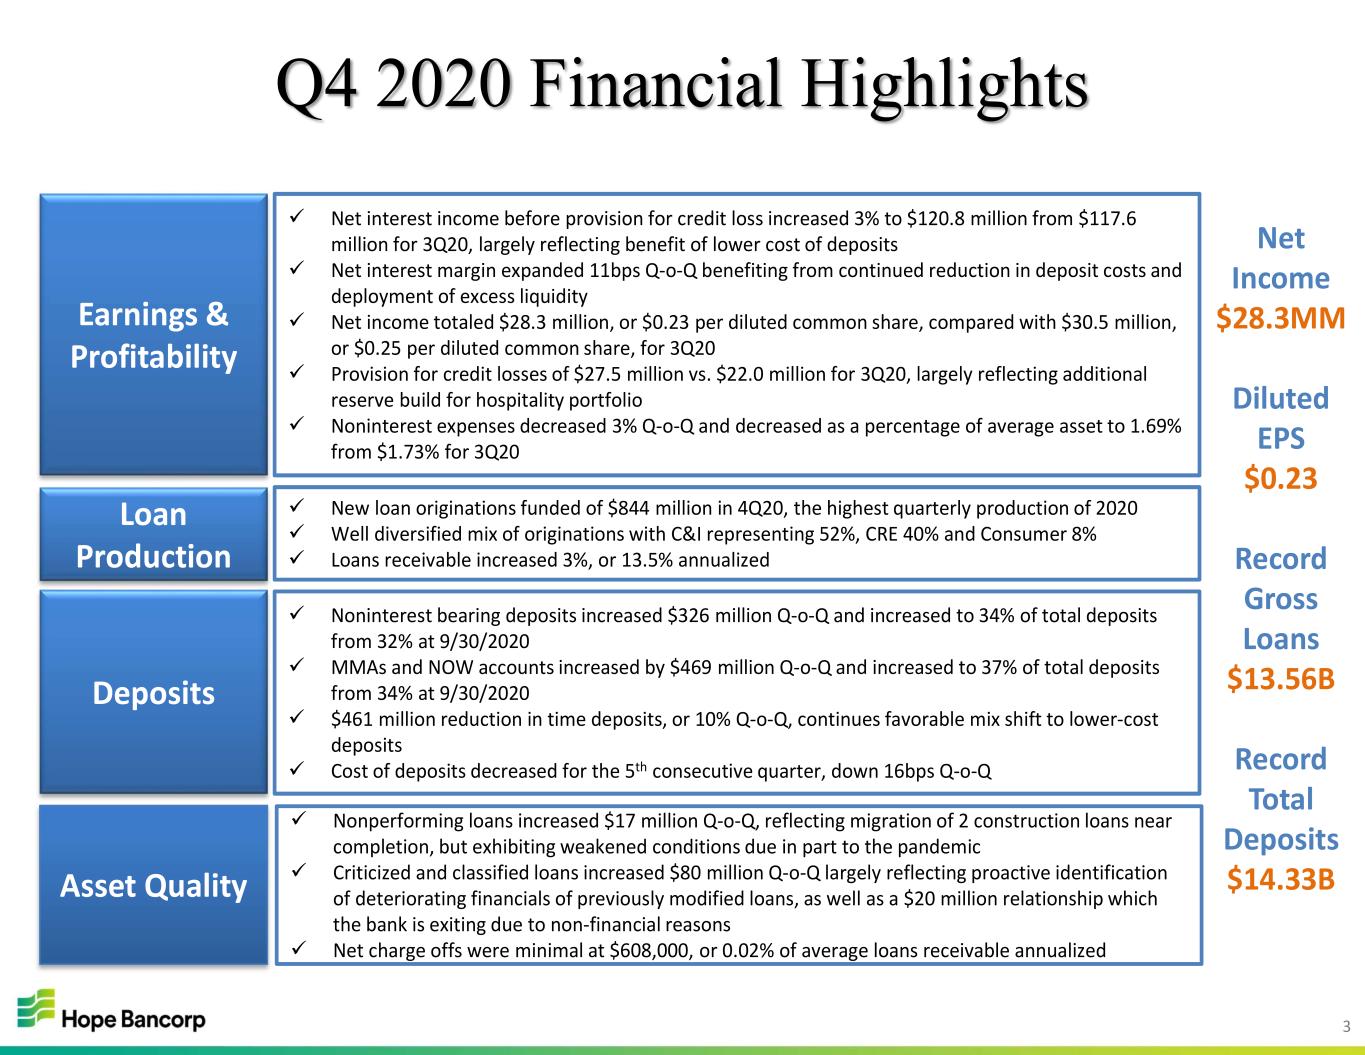
3 Q4 2020 Financial Highlights Earnings & Profitability Loan Production Asset Quality Net interest income before provision for credit loss increased 3% to $120.8 million from $117.6 million for 3Q20, largely reflecting benefit of lower cost of deposits Net interest margin expanded 11bps Q-o-Q benefiting from continued reduction in deposit costs and deployment of excess liquidity Net income totaled $28.3 million, or $0.23 per diluted common share, compared with $30.5 million, or $0.25 per diluted common share, for 3Q20 Provision for credit losses of $27.5 million vs. $22.0 million for 3Q20, largely reflecting additional reserve build for hospitality portfolio Noninterest expenses decreased 3% Q-o-Q and decreased as a percentage of average asset to 1.69% from $1.73% for 3Q20 New loan originations funded of $844 million in 4Q20, the highest quarterly production of 2020 Well diversified mix of originations with C&I representing 52%, CRE 40% and Consumer 8% Loans receivable increased 3%, or 13.5% annualized Nonperforming loans increased $17 million Q-o-Q, reflecting migration of 2 construction loans near completion, but exhibiting weakened conditions due in part to the pandemic Criticized and classified loans increased $80 million Q-o-Q largely reflecting proactive identification of deteriorating financials of previously modified loans, as well as a $20 million relationship which the bank is exiting due to non-financial reasons Net charge offs were minimal at $608,000, or 0.02% of average loans receivable annualized Deposits Noninterest bearing deposits increased $326 million Q-o-Q and increased to 34% of total deposits from 32% at 9/30/2020 MMAs and NOW accounts increased by $469 million Q-o-Q and increased to 37% of total deposits from 34% at 9/30/2020 $461 million reduction in time deposits, or 10% Q-o-Q, continues favorable mix shift to lower-cost deposits Cost of deposits decreased for the 5th consecutive quarter, down 16bps Q-o-Q Net Income $28.3MM Diluted EPS $0.23 Record Gross Loans $13.56B Record Total Deposits $14.33B
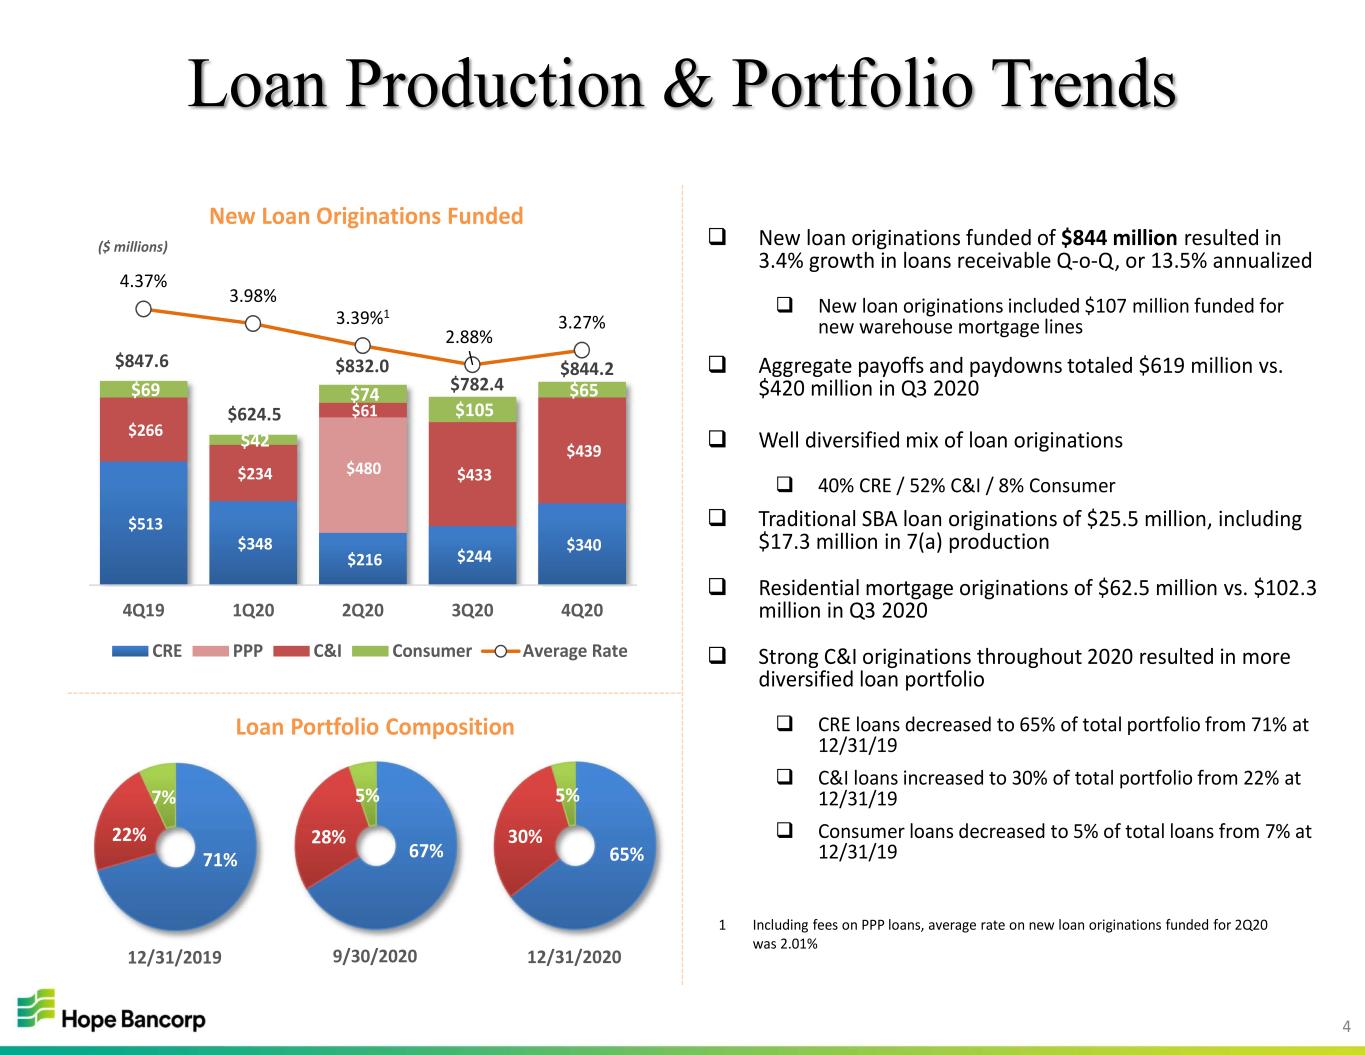
4 $513 $348 $216 $244 $340 $266 $234 $61 $433 $439 $69 $42 $74 $105 $65 4.37% 3.98% 3.39%1 2.88% 3.27% 4Q19 1Q20 2Q20 3Q20 4Q20 New Loan Originations Funded CRE PPP C&I Consumer Average Rate Loan Production & Portfolio Trends New loan originations funded of $844 million resulted in 3.4% growth in loans receivable Q-o-Q, or 13.5% annualized New loan originations included $107 million funded for new warehouse mortgage lines Aggregate payoffs and paydowns totaled $619 million vs. $420 million in Q3 2020 Well diversified mix of loan originations 40% CRE / 52% C&I / 8% Consumer Traditional SBA loan originations of $25.5 million, including $17.3 million in 7(a) production Residential mortgage originations of $62.5 million vs. $102.3 million in Q3 2020 Strong C&I originations throughout 2020 resulted in more diversified loan portfolio CRE loans decreased to 65% of total portfolio from 71% at 12/31/19 C&I loans increased to 30% of total portfolio from 22% at 12/31/19 Consumer loans decreased to 5% of total loans from 7% at 12/31/1967% 28% 5% 65% 30% 5% 12/31/20209/30/2020 Loan Portfolio Composition ($ millions) $782.4 $844.2$847.6 $832.0 $624.5 71% 22% 7% 12/31/2019 1 Including fees on PPP loans, average rate on new loan originations funded for 2Q20 was 2.01% $480
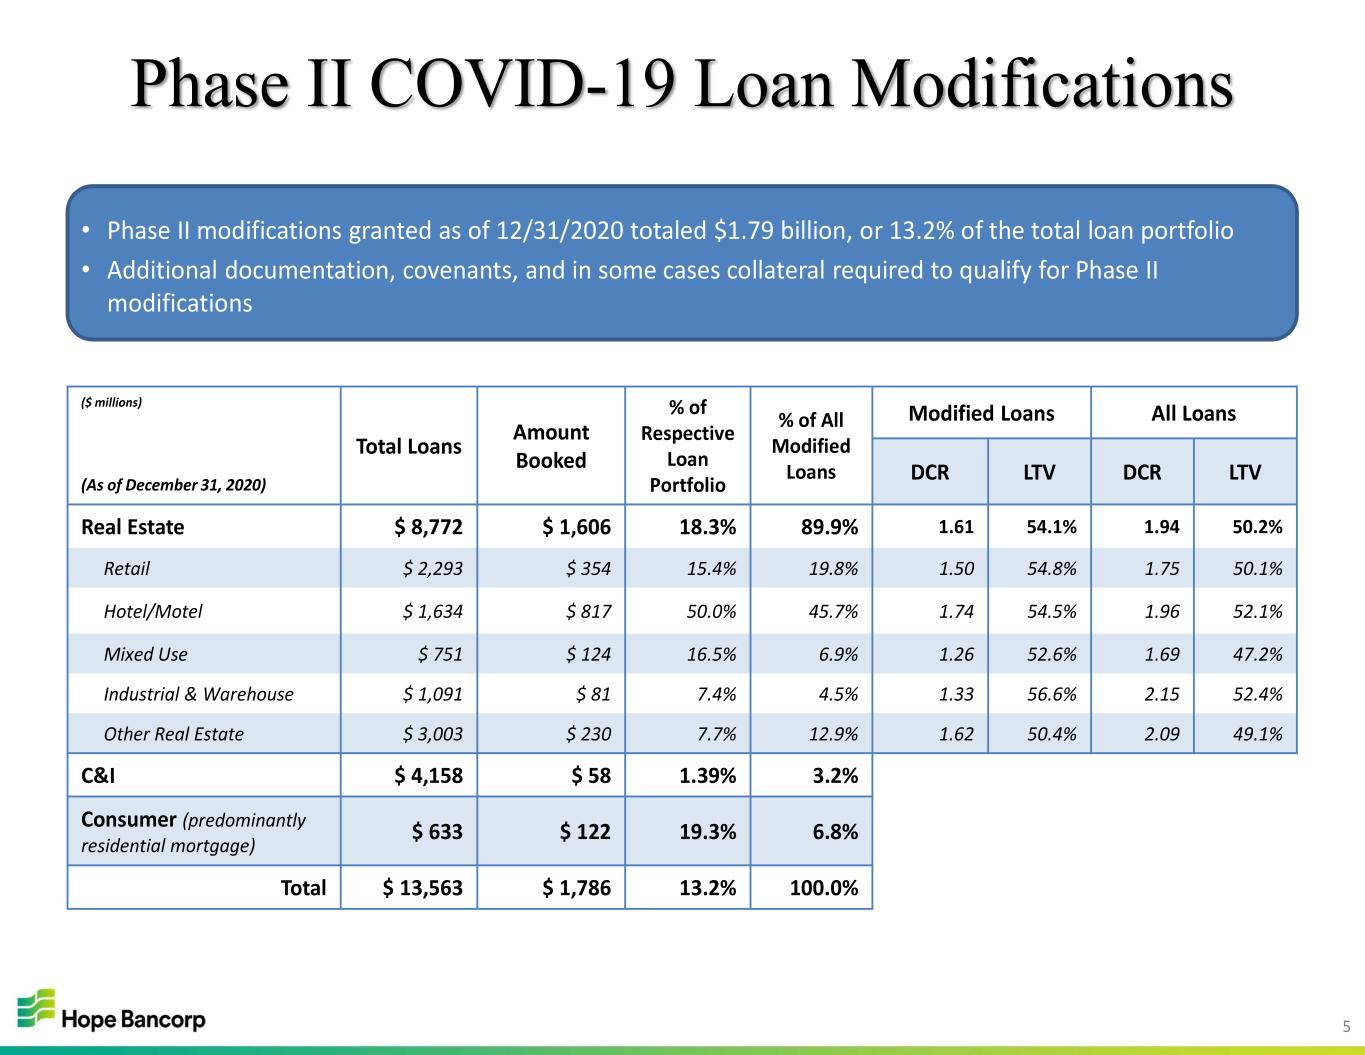
5 Phase II COVID-19 Loan Modifications • Phase II modifications granted as of 12/31/2020 totaled $1.79 billion, or 13.2% of the total loan portfolio • Additional documentation, covenants, and in some cases collateral required to qualify for Phase II modifications ($ millions) (As of December 31, 2020) Total Loans Amount Booked % of Respective Loan Portfolio % of All Modified Loans Modified Loans All Loans DCR LTV DCR LTV Real Estate $ 8,772 $ 1,606 18.3% 89.9% 1.61 54.1% 1.94 50.2% Retail $ 2,293 $ 354 15.4% 19.8% 1.50 54.8% 1.75 50.1% Hotel/Motel $ 1,634 $ 817 50.0% 45.7% 1.74 54.5% 1.96 52.1% Mixed Use $ 751 $ 124 16.5% 6.9% 1.26 52.6% 1.69 47.2% Industrial & Warehouse $ 1,091 $ 81 7.4% 4.5% 1.33 56.6% 2.15 52.4% Other Real Estate $ 3,003 $ 230 7.7% 12.9% 1.62 50.4% 2.09 49.1% C&I $ 4,158 $ 58 1.39% 3.2% Consumer (predominantly residential mortgage) $ 633 $ 122 19.3% 6.8% Total $ 13,563 $ 1,786 13.2% 100.0%
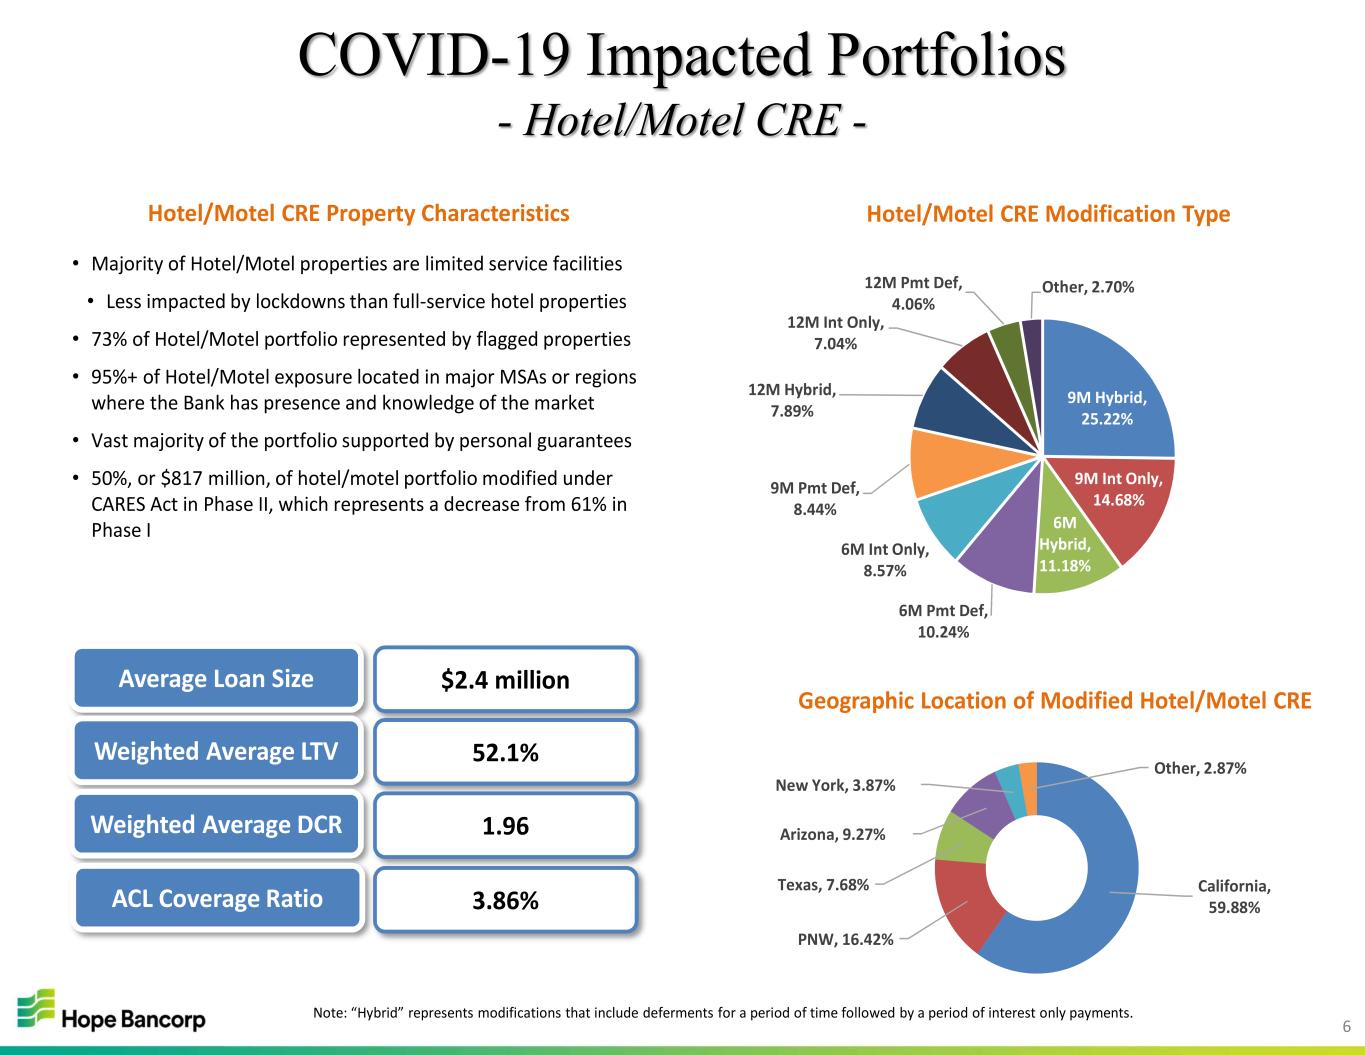
6 Hotel/Motel CRE Property Characteristics • Majority of Hotel/Motel properties are limited service facilities • Less impacted by lockdowns than full-service hotel properties • 73% of Hotel/Motel portfolio represented by flagged properties • 95%+ of Hotel/Motel exposure located in major MSAs or regions where the Bank has presence and knowledge of the market • Vast majority of the portfolio supported by personal guarantees • 50%, or $817 million, of hotel/motel portfolio modified under CARES Act in Phase II, which represents a decrease from 61% in Phase I COVID-19 Impacted Portfolios - Hotel/Motel CRE - $2.4 million 52.1% 1.96 Average Loan Size Weighted Average LTV Weighted Average DCR 9M Hybrid, 25.22% 9M Int Only, 14.68% 6M Hybrid, 11.18% 6M Pmt Def, 10.24% 6M Int Only, 8.57% 9M Pmt Def, 8.44% 12M Hybrid, 7.89% 12M Int Only, 7.04% 12M Pmt Def, 4.06% Other, 2.70% California, 59.88% PNW, 16.42% Texas, 7.68% Arizona, 9.27% New York, 3.87% Other, 2.87% Hotel/Motel CRE Modification Type Geographic Location of Modified Hotel/Motel CRE 3.86%ACL Coverage Ratio Note: “Hybrid” represents modifications that include deferments for a period of time followed by a period of interest only payments.
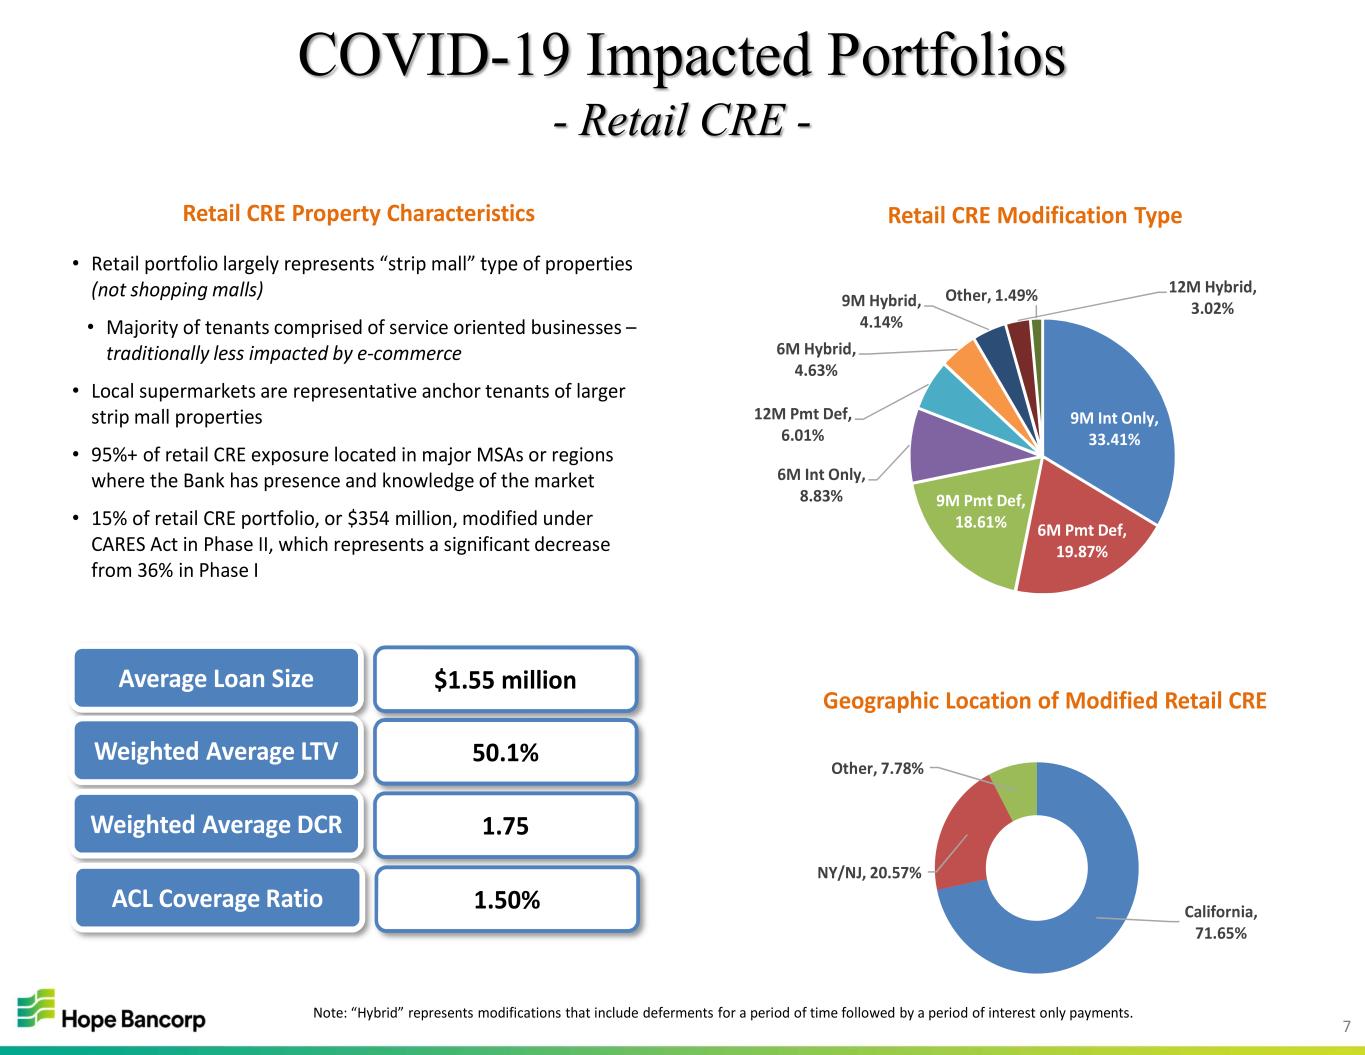
7 Retail CRE Property Characteristics • Retail portfolio largely represents “strip mall” type of properties (not shopping malls) • Majority of tenants comprised of service oriented businesses – traditionally less impacted by e-commerce • Local supermarkets are representative anchor tenants of larger strip mall properties • 95%+ of retail CRE exposure located in major MSAs or regions where the Bank has presence and knowledge of the market • 15% of retail CRE portfolio, or $354 million, modified under CARES Act in Phase II, which represents a significant decrease from 36% in Phase I COVID-19 Impacted Portfolios - Retail CRE - $1.55 million 50.1% 1.75 Average Loan Size Weighted Average LTV Weighted Average DCR 9M Int Only, 33.41% 6M Pmt Def, 19.87% 9M Pmt Def, 18.61% 6M Int Only, 8.83% 12M Pmt Def, 6.01% 6M Hybrid, 4.63% 9M Hybrid, 4.14% 12M Hybrid, 3.02% Other, 1.49% California, 71.65% NY/NJ, 20.57% Other, 7.78% Retail CRE Modification Type Geographic Location of Modified Retail CRE 1.50%ACL Coverage Ratio Note: “Hybrid” represents modifications that include deferments for a period of time followed by a period of interest only payments.

8 $113.5 $119.3 $109.8 $117.6 $120.8 3.16% 3.31% 2.79% 2.91% 3.02% 4Q19 1Q20 2Q20 3Q20 4Q20 Net Interest Income & NIM Net Interest Income NIM Net Interest Income and Margin 5.04% 5.06% 4.23% 4.20% 4.03% 1.79% 1.41% 0.35% 0.16% 0.15% 4Q19 1Q20 2Q20 3Q20 4Q20 Average Loan Yield & Average 1M LIBOR Rate Avg Loan Yield Avg 1M LIBOR Rate Net interest income increased 3% primarily due to lower deposit costs, redeployment of excess liquidity and higher average loan balances 4Q20 net interest margin increased 11bps Q-o-Q reflecting Net interest margin excluding purchase accounting adjustments, expanded 15bps Q-o-Q from 3Q20 Net interest margin expected to continue expansion through 1H 2021 as a benefit of decreasing deposit costs $9.1 $9.4 $10.1 $9.9 $9.5 1.49% 1.34% 0.87% 0.64% 0.48% 1.98% 1.76% 1.17% 0.92% 0.71% 4Q19 1Q20 2Q20 3Q20 4Q20 Average Interest Bearing Deposits & Cost of Deposits Average Interest Bearing Deposits Total Cost of Deposits Cost of Interest Bearing Deposits ($ millions) ($ billions) -9 bps Loan yield reduction -4 bps Accretion decline -3 bps Investment yield decline +11bps Average cash balance decrease +13 bps Deposit cost decline +2bps Average deposit balance decline +1 bps Average FHLB balance decline
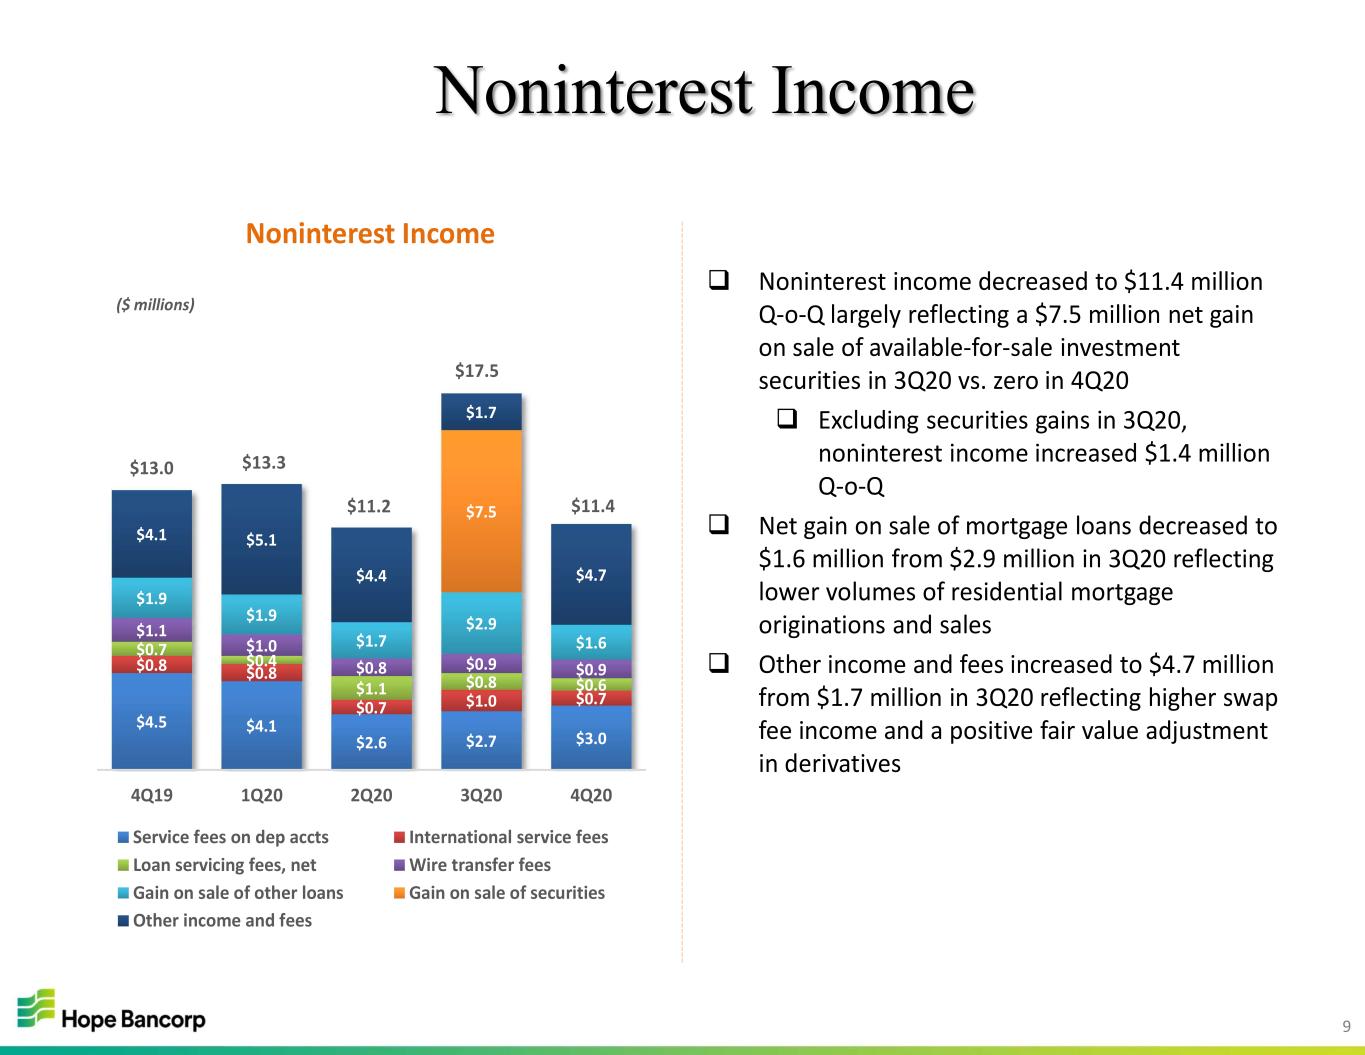
9 $4.5 $4.1 $2.6 $2.7 $3.0 $0.8 $0.8 $0.7 $1.0 $0.7 $0.7 $0.4 $1.1 $0.8 $0.6 $1.1 $1.0 $0.8 $0.9 $0.9 $1.9 $1.9 $1.7 $2.9 $1.6 $7.5 $4.1 $5.1 $4.4 $1.7 $4.7 4Q19 1Q20 2Q20 3Q20 4Q20 Noninterest Income Service fees on dep accts International service fees Loan servicing fees, net Wire transfer fees Gain on sale of other loans Gain on sale of securities Other income and fees Noninterest Income Noninterest income decreased to $11.4 million Q-o-Q largely reflecting a $7.5 million net gain on sale of available-for-sale investment securities in 3Q20 vs. zero in 4Q20 Excluding securities gains in 3Q20, noninterest income increased $1.4 million Q-o-Q Net gain on sale of mortgage loans decreased to $1.6 million from $2.9 million in 3Q20 reflecting lower volumes of residential mortgage originations and sales Other income and fees increased to $4.7 million from $1.7 million in 3Q20 reflecting higher swap fee income and a positive fair value adjustment in derivatives $17.5 $11.4 $13.0 $13.3 $11.2 ($ millions)

10 Noninterest Expense and Efficiency 55.68% 54.42% 55.37% 54.31% 53.77% 1.85% 1.87% 1.60% 1.73% 1.69% 4Q19 1Q20 2Q20 3Q20 4Q20 Efficiency Ratio & Noninterest Expense to Average Assets Efficiency Ratio Noninterest Expense/Avg Assets Noninterest expense decreased 3% to $71.1 million from $73.4 million in 3Q20 – 4Q20 noninterest expense included non-core $2.4 million branch restructuring cost – 3Q20 noninterest expense included non-core FHLB prepayment fee of $3.6 million – Excluding these two non-core items, noninterest expense decreased $1.1 million Q-o-Q Cost management initiatives led to 54bps improvement in efficiency ratio and noninterest expense to average assets improved to 1.69% from 1.73% in 3Q20 ($ millions) $39.8 $42.5 $38.9 $40.7 $40.9 $11.8 $11.7 $11.7 $11.8 $11.3 $2.5 $1.7 $1.3 $1.6 $1.7 $2.4 $2.6 $2.3 $2.2 $2.2 $5.9 $3.3 $1.5 $1.5 $1.8 $0.8 $1.6 $1.7 $1.2 $1.2 $1.6 $2.5 $2.7 $3.6 $1.2 $3.6 $2.4 $5.6 $6.3 $7.0 $7.3 $7.6 1,441 1,458 1,474 1,416 1,408 4Q19 1Q20 2Q20 3Q20 4Q20 Breakdown of Noninterest Expense & FTE Other Branch restructuring costs FHLB Prepayment Fee Credit related & OREO FDIC assessment Professional fees Data processing & communications Adv/Marketing Occupancy & equipment Compensation FTE $73.4 $71.1$70.4 $72.1 $67.0 NIE/AA = Noninterest expense as a percentage of average assets
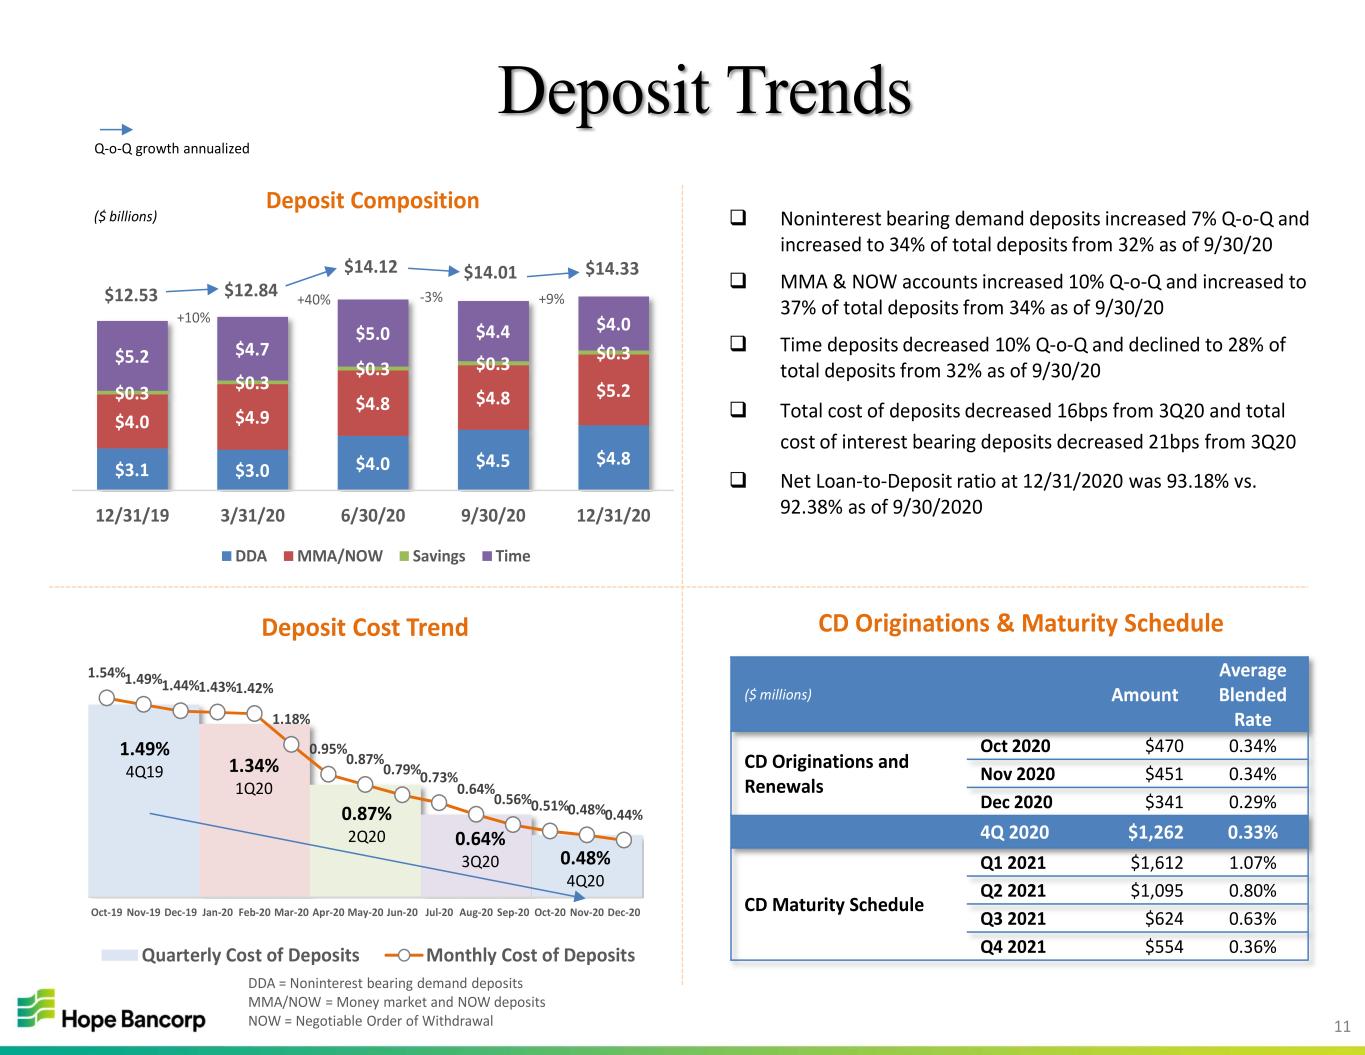
11 $3.1 $3.0 $4.0 $4.5 $4.8 $4.0 $4.9 $4.8 $4.8 $5.2$0.3 $0.3 $0.3 $0.3 $0.3$5.2 $4.7 $5.0 $4.4 $4.0 12/31/19 3/31/20 6/30/20 9/30/20 12/31/20 Deposit Composition DDA MMA/NOW Savings Time Deposit Trends Noninterest bearing demand deposits increased 7% Q-o-Q and increased to 34% of total deposits from 32% as of 9/30/20 MMA & NOW accounts increased 10% Q-o-Q and increased to 37% of total deposits from 34% as of 9/30/20 Time deposits decreased 10% Q-o-Q and declined to 28% of total deposits from 32% as of 9/30/20 Total cost of deposits decreased 16bps from 3Q20 and total cost of interest bearing deposits decreased 21bps from 3Q20 Net Loan-to-Deposit ratio at 12/31/2020 was 93.18% vs. 92.38% as of 9/30/2020 DDA = Noninterest bearing demand deposits MMA/NOW = Money market and NOW deposits NOW = Negotiable Order of Withdrawal $14.12 CD Originations & Maturity Schedule ($ millions) Amount Average Blended Rate CD Originations and Renewals Oct 2020 $470 0.34% Nov 2020 $451 0.34% Dec 2020 $341 0.29% 4Q 2020 $1,262 0.33% CD Maturity Schedule Q1 2021 $1,612 1.07% Q2 2021 $1,095 0.80% Q3 2021 $624 0.63% Q4 2021 $554 0.36% 1.54%1.49%1.44%1.43%1.42% 1.18% 0.95% 0.87% 0.79%0.73% 0.64% 0.56%0.51%0.48%0.44% Oct-19 Nov-19 Dec-19 Jan-20 Feb-20 Mar-20 Apr-20 May-20 Jun-20 Jul-20 Aug-20 Sep-20 Oct-20 Nov-20 Dec-20 Deposit Cost Trend Quarterly Cost of Deposits Monthly Cost of Deposits 0.87% 2Q20 1.34% 1Q20 1.49% 4Q19 0.48% 4Q20 $12.84$12.53 $14.33$14.01 +10% -3% +9%+40% ($ billions) Q-o-Q growth annualized 0.64% 3Q20
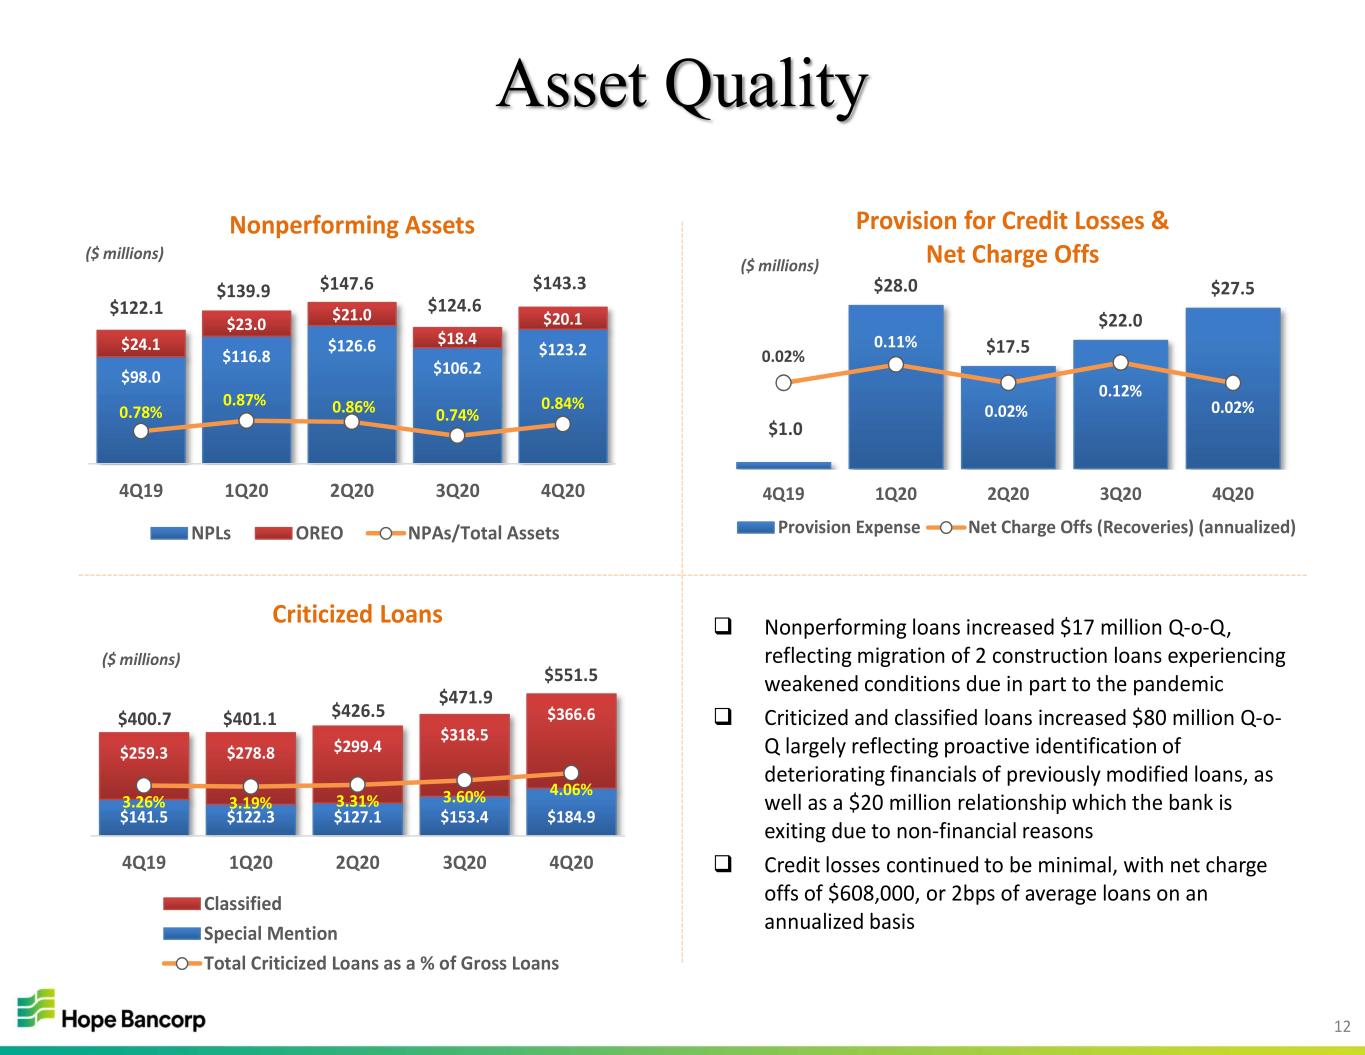
12 $1.0 $28.0 $17.5 $22.0 $27.5 0.02% 0.11% 0.02% 0.12% 0.02% 4Q19 1Q20 2Q20 3Q20 4Q20 Provision for Credit Losses & Net Charge Offs Provision Expense Net Charge Offs (Recoveries) (annualized) ($ millions) Asset Quality Nonperforming loans increased $17 million Q-o-Q, reflecting migration of 2 construction loans experiencing weakened conditions due in part to the pandemic Criticized and classified loans increased $80 million Q-o- Q largely reflecting proactive identification of deteriorating financials of previously modified loans, as well as a $20 million relationship which the bank is exiting due to non-financial reasons Credit losses continued to be minimal, with net charge offs of $608,000, or 2bps of average loans on an annualized basis $98.0 $116.8 $126.6 $106.2 $123.2$24.1 $23.0 $21.0 $18.4 $20.1 0.78% 0.87% 0.86% 0.74% 0.84% 4Q19 1Q20 2Q20 3Q20 4Q20 Nonperforming Assets NPLs OREO NPAs/Total Assets $141.5 $122.3 $127.1 $153.4 $184.9 $259.3 $278.8 $299.4 $318.5 $366.6 3.26% 3.19% 3.31% 3.60% 4.06% 4Q19 1Q20 2Q20 3Q20 4Q20 Criticized Loans Classified Special Mention Total Criticized Loans as a % of Gross Loans ($ millions) ($ millions) $147.6 $124.6 $143.3 $122.1 $139.9 $426.5 $471.9 $551.5 $400.7 $401.1
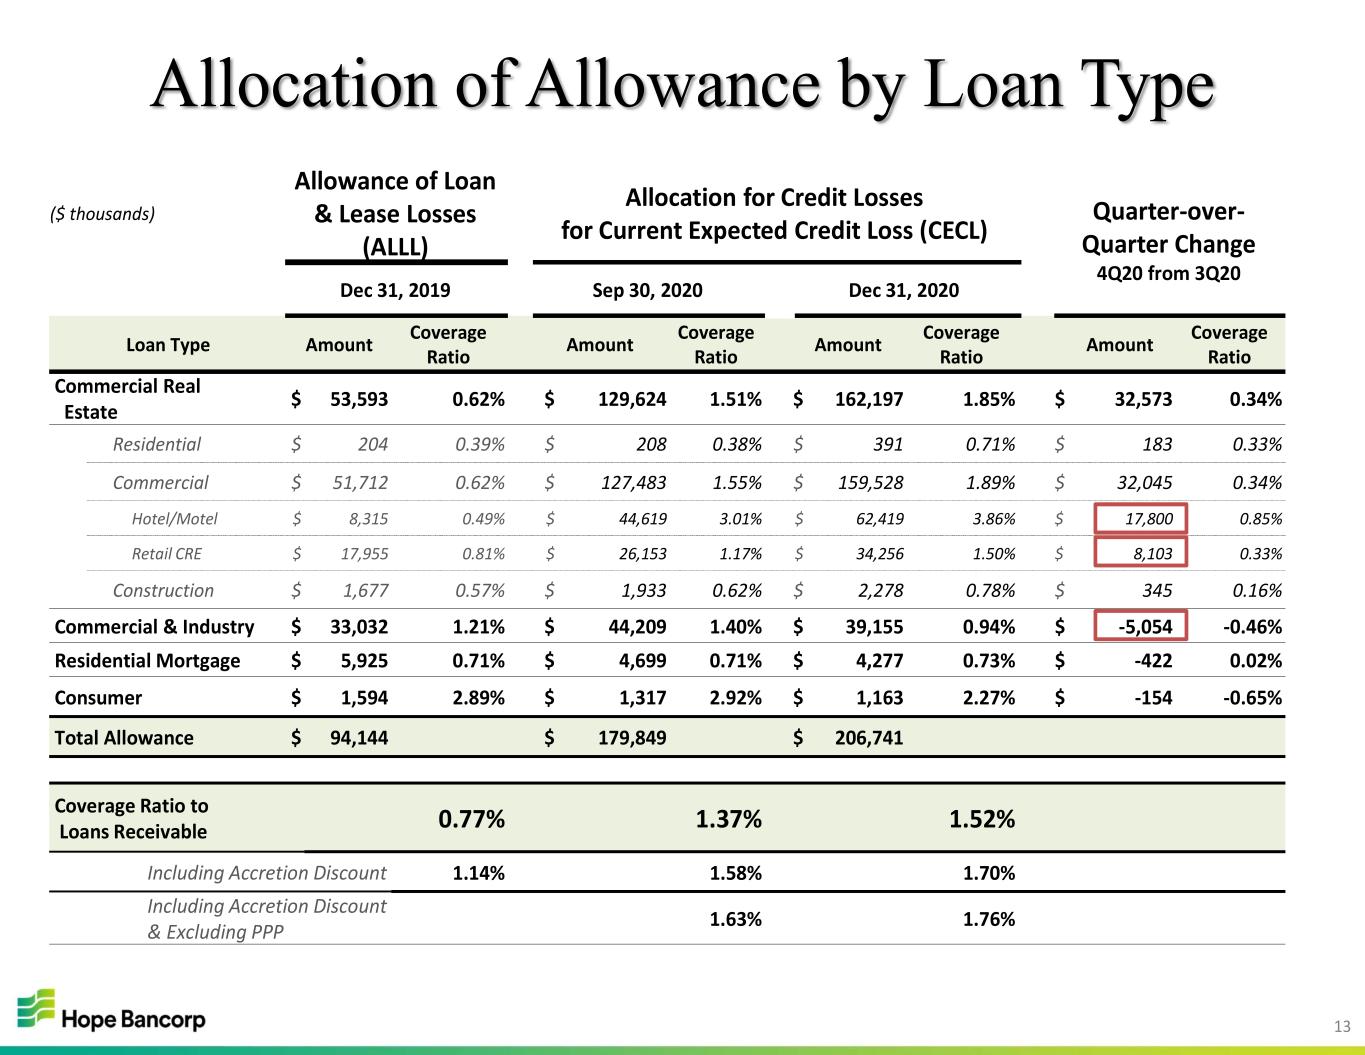
13 Allocation of Allowance by Loan Type ($ thousands) Allowance of Loan & Lease Losses (ALLL) Allocation for Credit Losses for Current Expected Credit Loss (CECL) Quarter-over- Quarter Change 4Q20 from 3Q20 Dec 31, 2019 Sep 30, 2020 Dec 31, 2020 Loan Type Amount Coverage Ratio Amount Coverage Ratio Amount Coverage Ratio Amount Coverage Ratio Commercial Real Estate $ 53,593 0.62% $ 129,624 1.51% $ 162,197 1.85% $ 32,573 0.34% Residential $ 204 0.39% $ 208 0.38% $ 391 0.71% $ 183 0.33% Commercial $ 51,712 0.62% $ 127,483 1.55% $ 159,528 1.89% $ 32,045 0.34% Hotel/Motel $ 8,315 0.49% $ 44,619 3.01% $ 62,419 3.86% $ 17,800 0.85% Retail CRE $ 17,955 0.81% $ 26,153 1.17% $ 34,256 1.50% $ 8,103 0.33% Construction $ 1,677 0.57% $ 1,933 0.62% $ 2,278 0.78% $ 345 0.16% Commercial & Industry $ 33,032 1.21% $ 44,209 1.40% $ 39,155 0.94% $ -5,054 -0.46% Residential Mortgage $ 5,925 0.71% $ 4,699 0.71% $ 4,277 0.73% $ -422 0.02% Consumer $ 1,594 2.89% $ 1,317 2.92% $ 1,163 2.27% $ -154 -0.65% Total Allowance $ 94,144 $ 179,849 $ 206,741 Coverage Ratio to Loans Receivable 0.77% 1.37% 1.52% Including Accretion Discount 1.14% 1.58% 1.70% Including Accretion Discount & Excluding PPP 1.63% 1.76%
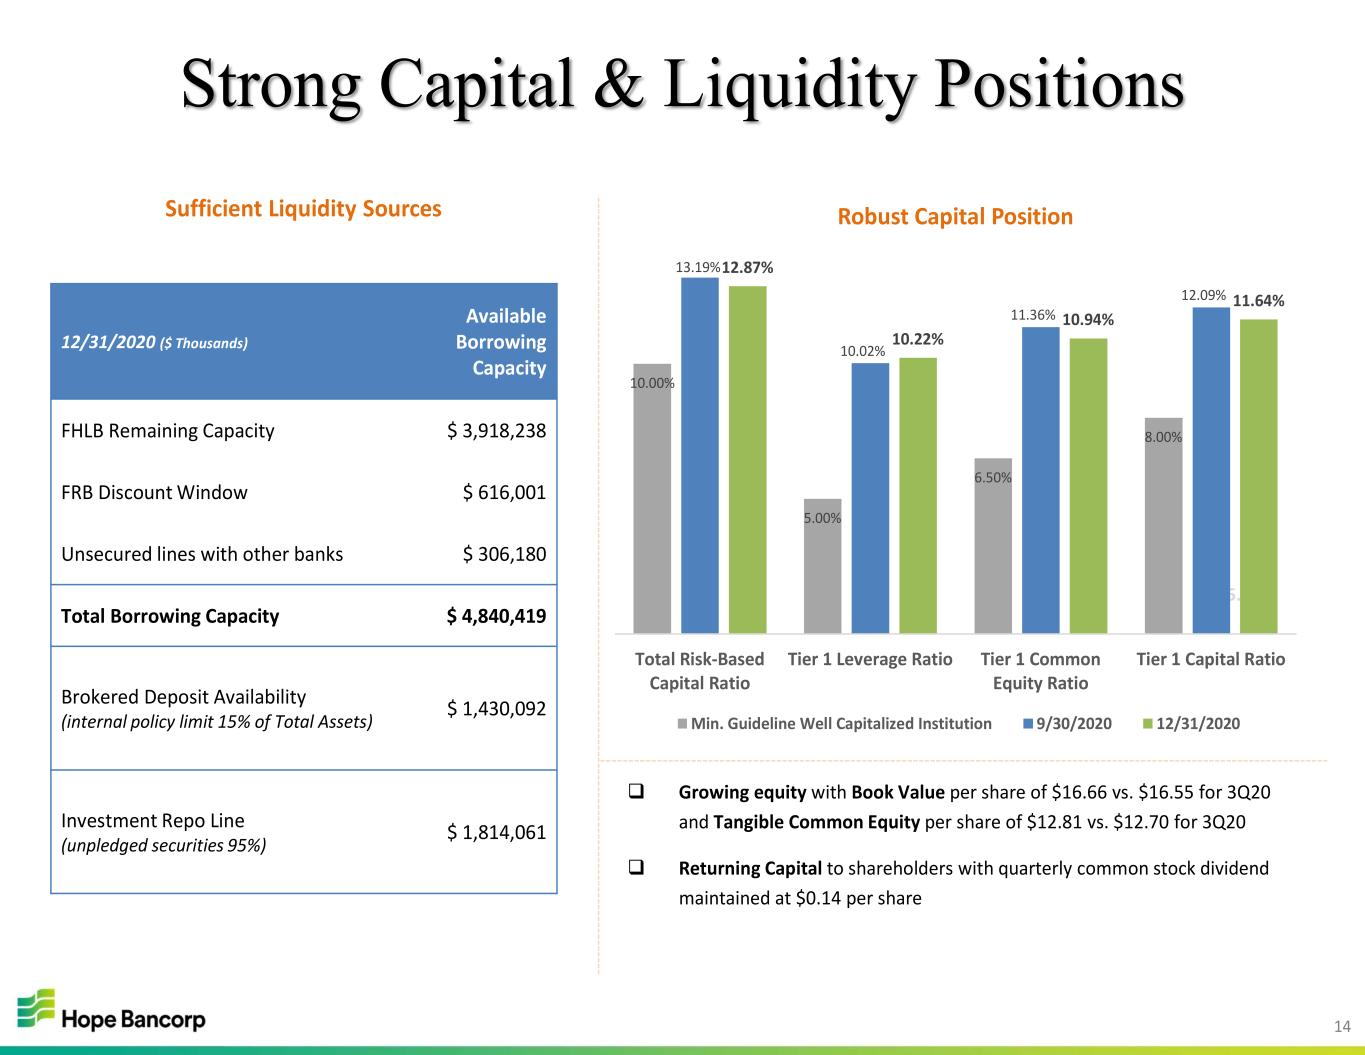
14 Strong Capital & Liquidity Positions 5.00% 12/31/2020 ($ Thousands) Available Borrowing Capacity FHLB Remaining Capacity $ 3,918,238 FRB Discount Window $ 616,001 Unsecured lines with other banks $ 306,180 Total Borrowing Capacity $ 4,840,419 Brokered Deposit Availability (internal policy limit 15% of Total Assets) $ 1,430,092 Investment Repo Line (unpledged securities 95%) $ 1,814,061 Sufficient Liquidity Sources 10.00% 5.00% 6.50% 8.00% 13.19% 10.02% 11.36% 12.09% 12.87% 10.22% 10.94% 11.64% Total Risk-Based Capital Ratio Tier 1 Leverage Ratio Tier 1 Common Equity Ratio Tier 1 Capital Ratio Robust Capital Position Min. Guideline Well Capitalized Institution 9/30/2020 12/31/2020 Growing equity with Book Value per share of $16.66 vs. $16.55 for 3Q20 and Tangible Common Equity per share of $12.81 vs. $12.70 for 3Q20 Returning Capital to shareholders with quarterly common stock dividend maintained at $0.14 per share

15 2020 Achievements Stronger, More Diversified, Relationship Bank Enhanced Deposit Franchise Expense Management Profitable Organic Loan Growth Strong Capital Management CECL Implementation & Reserve Build

16 Near-Term Outlook Mid- to high-single digit loan growth projected for 2021 driven by growth in non-CRE loans Higher trending gain on sale income from growth in residential mortgage origination volumes Continuation of cost management in line with current business environment Net interest margin expansion at least through first half of 2021 due to decreasing deposit costs Meaningful declines in COVID-19 modifications and lower provisioning in 2021 expected to result in enhanced profitability trends Sound management of credit, capital, liquidity and reserves

17 2020 Fourth Quarter Earnings Conference Call Q&A


