2024 Fourth Quarter Earnings Conference Call January 27, 2025

Forward Looking Statements & Additional Disclosures Some statements in this presentation may constitute forward-looking statements within the meaning of Section 27A of the Securities Act of 1933, as amended, and Section 21E of the Securities Exchange Act of 1934, as amended. Forward-looking statements include, but are not limited to, statements preceded by, followed by or that include the words “will,” “believes,” “expects,” “anticipates,” “intends,” “plans,” “estimates” or similar expressions. With respect to any such forward-looking statements, Hope Bancorp claims the protection provided for in the Private Securities Litigation Reform Act of 1995. These statements involve risks and uncertainties. Hope Bancorp’s actual results, performance or achievements may differ significantly from the results, performance or achievements expressed or implied in any forward-looking statements. The closing of the pending transaction with Territorial Bancorp is subject to regulatory approvals and other customary closing conditions. There is no assurance that such conditions will be met or that the pending merger will be consummated within the expected time frame, or at all. If the transaction is consummated, factors that may cause actual outcomes to differ from what is expressed or forecasted in these forward-looking statements include, among things: difficulties and delays in integrating Hope Bancorp and Territorial Bancorp and achieving anticipated synergies, cost savings and other benefits from the transaction; higher than anticipated transaction costs; deposit attrition, operating costs, customer loss and business disruption following the merger, including difficulties in maintaining relationships with employees and customers, may be greater than expected; and required governmental approvals of the merger may not be obtained on its proposed terms and schedule, or without regulatory constraints that may limit growth. Other risks and uncertainties include, but are not limited to: possible renewed deterioration in economic conditions in Hope Bancorp’s areas of operation or elsewhere; interest rate risk associated with volatile interest rates and related asset-liability matching risk; liquidity risks; risk of significant non-earning assets, and net credit losses that could occur, particularly in times of weak economic conditions or times of rising interest rates; the failure of or changes to assumptions and estimates underlying Hope Bancorp’s allowances for credit losses; potential increases in deposit insurance assessments and regulatory risks associated with current and future regulations; the outcome of any legal proceedings that may be instituted against Hope Bancorp; the risk that any announcements relating to the pending transaction could have adverse effects on the market price of the common stock of Hope Bancorp; diversion of management’s attention from ongoing business operations and opportunities; and risks from natural disasters. For additional information concerning these and other risk factors, see Hope Bancorp’s most recent Annual Report on Form 10-K. Hope Bancorp does not undertake, and specifically disclaims any obligation, to update any forward-looking statements to reflect the occurrence of events or circumstances after the date of such statements except as required by law. Additional Information About the Merger and Where to Find It In connection with the pending merger with Territorial Bancorp Inc., Hope Bancorp, Inc. filed with the U.S. Securities and Exchange Commission (the “SEC”) a Registration Statement on Form S-4, which included a Proxy Statement/Prospectus and which was declared effective by the SEC on August 20, 2024, as further supplemented by Hope Bancorp on September 12, 2024. This presentation does not constitute an offer to sell or the solicitation of an offer to buy any securities or a solicitation of any vote or approval. Territorial Bancorp shareholders are encouraged to read the Registration Statement and the Proxy Statement/Prospectus regarding the merger and any other relevant documents filed with the SEC, as well as any amendments or supplements to those documents, because they contain important information about the pending merger. Territorial Bancorp shareholders are able to obtain a free copy of the Proxy Statement/Prospectus, as well as other filings containing information about Hope Bancorp and Territorial Bancorp at the SEC’s Internet site (www.sec.gov). Territorial Bancorp shareholders are also able to obtain these documents, free of charge, from Territorial Bancorp at https://www.tsbhawaii.bank/tsb/investor-relations/. 2
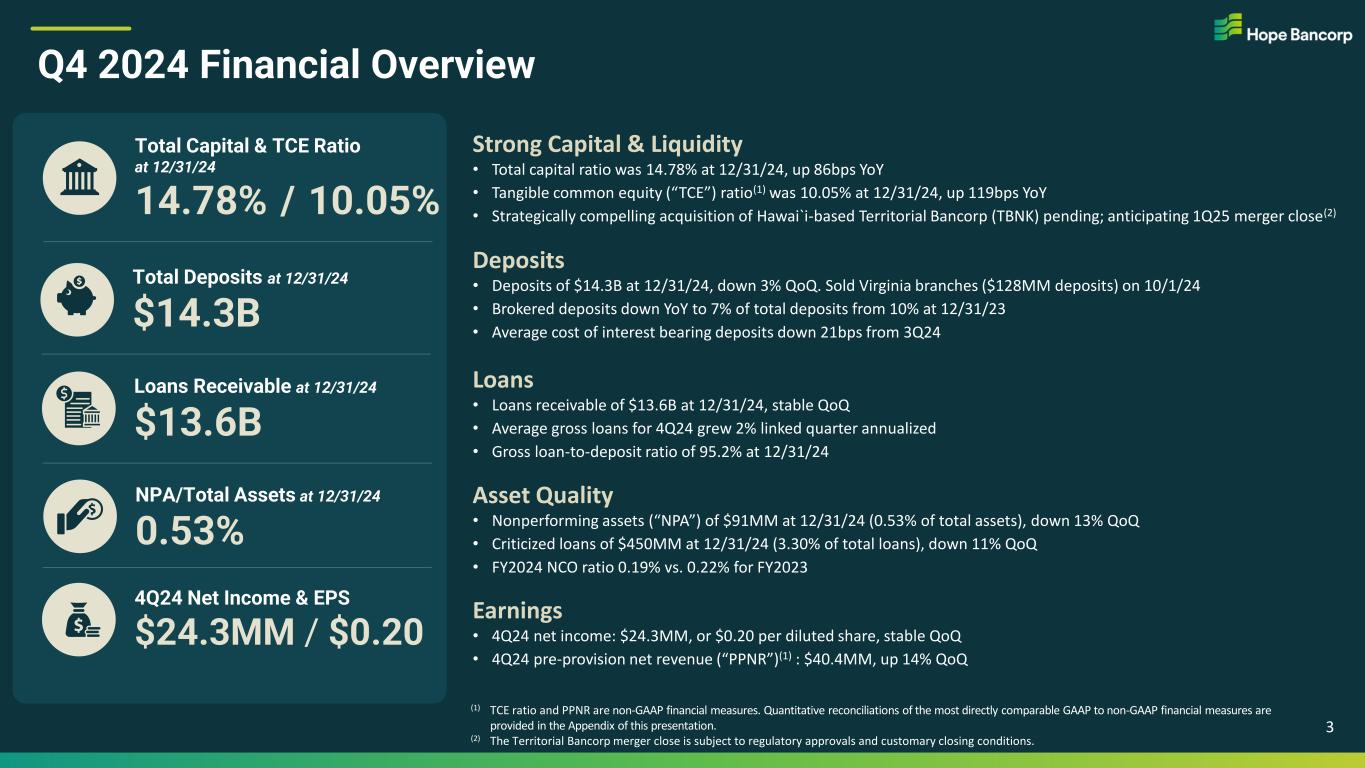
Strong Capital & Liquidity • Total capital ratio was 14.78% at 12/31/24, up 86bps YoY • Tangible common equity (“TCE”) ratio(1) was 10.05% at 12/31/24, up 119bps YoY • Strategically compelling acquisition of Hawai`i-based Territorial Bancorp (TBNK) pending; anticipating 1Q25 merger close(2) Deposits • Deposits of $14.3B at 12/31/24, down 3% QoQ. Sold Virginia branches ($128MM deposits) on 10/1/24 • Brokered deposits down YoY to 7% of total deposits from 10% at 12/31/23 • Average cost of interest bearing deposits down 21bps from 3Q24 Loans • Loans receivable of $13.6B at 12/31/24, stable QoQ • Average gross loans for 4Q24 grew 2% linked quarter annualized • Gross loan-to-deposit ratio of 95.2% at 12/31/24 Asset Quality • Nonperforming assets (“NPA”) of $91MM at 12/31/24 (0.53% of total assets), down 13% QoQ • Criticized loans of $450MM at 12/31/24 (3.30% of total loans), down 11% QoQ • FY2024 NCO ratio 0.19% vs. 0.22% for FY2023 Earnings • 4Q24 net income: $24.3MM, or $0.20 per diluted share, stable QoQ • 4Q24 pre-provision net revenue (“PPNR”)(1) : $40.4MM, up 14% QoQ Q4 2024 Financial Overview Total Capital & TCE Ratio at 12/31/24 14.78% / 10.05% NPA/Total Assets at 12/31/24 0.53% Loans Receivable at 12/31/24 $13.6B Total Deposits at 12/31/24 $14.3B 3 4Q24 Net Income & EPS $24.3MM / $0.20 (1) TCE ratio and PPNR are non-GAAP financial measures. Quantitative reconciliations of the most directly comparable GAAP to non-GAAP financial measures are provided in the Appendix of this presentation. (2) The Territorial Bancorp merger close is subject to regulatory approvals and customary closing conditions.

Strong Capital Ratios 4 Common Equity Tier 1 Capital Ratio • Robust capital ratios: All regulatory capital ratios meaningfully above requirements for “well-capitalized” financial institutions • Proforma capital very strong: Adjustments for the allowance for credit losses (“ACL”) and hypothetical adjustments for investment security marks not otherwise already reflected in equity, still result in very strong capital ratios • Dividend: Quarterly common stock dividend of $0.14 per share, or $0.56 per share annualized. Equivalent to a dividend yield of 4.56% at 12/31/24 • Strategically compelling merger pending: Fixed exchange ratio: 0.8048x HOPE shares per Territorial Bancorp Inc. (TBNK) share in an all-stock transaction. Anticipating merger close in 1Q25, subject to regulatory approvals and customary closing conditions • Equity: Book value per common share of $17.68 & TCE per share(1) of $13.81 at 12/31/24 Tangible Common Equity (“TCE”) Ratio(1) Total Capital Ratio Leverage Ratio Well Capitalized Reg. Minimum 6.50% (1) TCE ratio and TCE per share are non-GAAP financial measures. Quantitative reconciliations of the most directly comparable GAAP to non-GAAP financial measures are provided in the Appendix of this presentation. * Proforma ratios at 12/31/24 are non-GAAP financial measures and reflect (a) inclusion of on- and off-balance sheet ACL not already in capital; (b) treatment of held-to-maturity (“HTM”) securities as if they were available- for-sale (“AFS”), with unrealized losses in accumulated other comprehensive income (“AOCI”); and (c) removal of the AOCI opt-out in calculating regulatory capital. Well Capitalized Reg. Minimum 10.00% Well Capitalized Reg. Minimum 5.00%

Diverse & Granular Deposit Base 5 Noninterest Bearing Demand Deposits 24% Money Market, Interest Bearing Demand & Savings Deposits 36% Time Deposits 40% $14.3B Total Deposits (at 12/31/24) • Brokered deposits at 12/31/24 decreased YoY to 7% of total deposits, down from 10% at 12/31/23 • Consumer deposits at 12/31/24 increased YoY to 40% of total deposits, up from 37% at 12/31/23 • Average consumer deposit account size: approx. $47,000 for 4Q24. Average commercial account size: approx. $210,000 for 4Q24 • Total deposits of $14.3B at 12/31/24, down 3% QoQ • Sale of Virginia branches closed on 10/1/24: $128MM of deposits • Typical 4Q outflows of commercial noninterest bearing demand deposits in the residential mortgage industry Deposit Composition by Product Type Deposit Composition by Customer Type 50% 50% 49% 51% 50% 37% 38% 39% 39% 40% 10% 10% 9% 7% 7% 3% 2% 3% 3% 3% 4Q23 1Q24 2Q24 3Q24 4Q24 Commercial Consumer Brokered Public & Other

Well-Balanced Loan Portfolio 6 Nonowner- Occupied CRE 34% Owner-Occupied CRE 20% C&I 29% Residential Mortgage & Other 8% Multifamily Residential 9% $13.6B Loans Receivable (at 12/31/24) $1.1B Avg Size: $0.6MM $4.6B Avg Size: $1.9MM $2.7B Avg Size: $2.2MM $4.0B Avg Size: $1.5MM $1.2B Avg Size: $2.3MM • Loan portfolio well-diversified across major loan types of nonowner-occupied CRE, C&I, owner-occupied CRE, multifamily residential (“MFR”), and residential mortgage • Loans receivable, excluding loans held for sale, were $13.6B at 12/31/24, stable QoQ • 4Q24 average gross loans increased 2% QoQ on an annualized basis • 4Q24 SBA 7(a) loan sales of $48MM vs. $41MM in 3Q24 • 4Q24 QoQ trends: C&I loans increased 2% and residential mortgage increased 3%; partially offset by a 1% decrease in CRE loans

Diversified CRE Portfolio with Low LTVs Total CRE: Distribution by LTV (excl. SBA) < 50%: 57% > 50% - 55%: 14% > 55% - 60%: 10% > 60% - 65%: 7% > 65% - 70% > 70%: 7%$8.5B CRE Portfolio (at 12/31/24) 47% Weighted Avg LTV(1) (1) Weighted average loan-to-value (“LTV”): Current loan balance divided by updated collateral value. Collateral value updates most recent available appraisal by using CoStar market and property-specific data, including submarket appreciation or depreciation, and changes to vacancy, debt service coverage or rent/sq foot • Total CRE loans of $8.5B at 12/31/24, a decrease of 1% QoQ. Portfolio consists of $4.6B of nonowner-occupied CRE, $2.7B of owner-occupied CRE, and $1.2B of multifamily residential loans • CRE office: represented less than 3% of total loans at 12/31/24 with no central business district exposure 7 $8.5B CRE Portfolio (at 12/31/24) As a % of Total Loans: Avg Loan Size: Weighted Avg LTV(1): 12% Multi-tenant Retail $1,620MM $2.4MM 42.0% 9% Industrial & Warehouse $1,265MM $2.5MM 41.7% 9% Multifamily $1,208MM $2.3MM 60.2% 7% Gas Station & Car Wash $1,028MM $1.8MM 47.4% 6% Mixed Use $772MM $1.9MM 48.0% 6% Hotel/Motel $770M $2.2MM 42.1% 5% Single-tenant Retail $660MM $1.4MM 45.8% 3% Office $394MM $2.2MM 54.2% 6% All Other $811MM $1.5MM 42.9% 5%

LA Fashion District Gateway Cities San Gabriel Valley South Bay LA Koreatown Other LA County (No exposure to downtown LA commercial business district) Orange County San Bernardino County Riverside County Other SoCal San Francisco, $47 Greater SF Bay Area Other NorCal Manhattan Queens County Kings County Other New York New Jersey Texas Washington Illinois Other States Granular CRE Portfolio, Diversified by Submarket 8 CRE Portfolio by Geographic Submarket ($ Millions) Loan Size (at 12/31/24) Balance ($ Millions) # of Loans Average Loan Size ($ Millions) Weighted Average LTV(1) > $30MM $ 287 7 $ 41.0 61.8% $20MM - $30MM $ 625 26 $ 24.0 49.7% $10MM - $20MM $ 1,300 95 $ 13.7 52.0% $5MM - $10MM $ 1,646 242 $ 6.8 48.6% $2MM - $5MM $ 2,389 771 $ 3.1 46.1% < $2MM $ 2,280 3,079 $ 0.7 40.1% Total CRE Portfolio $ 8,527 4,220 $ 2.0 46.7% • Loan-to-value ratios are consistently low across segments by size and by property type • Vast majority of CRE loans have full recourse and personal guarantees • 98.5% of total CRE portfolio was pass-graded at 12/31/24 CRE Portfolio by Size Segment (1) Weighted average LTV: Current loan balance divided by updated collateral value. Collateral value updates most recent available appraisal by using CoStar market and property-specific data, including submarket appreciation or depreciation, and changes to vacancy, debt service coverage or rent/sq foot $8.5B CRE Portfolio (at 12/31/24) SoCal NorCal NY/NJ Texas Washington Illinois Other States $ 2 1 4 $315

Net Interest Income & Net Interest Margin 9 Net Interest Income & Net Interest Margin ($ Millions) $126 $115 $106 $105 $102 2.70% 2.55% 2.62% 2.55% 2.50% 4Q23 1Q24 2Q24 3Q24 4Q24 2.50%2.55% Loan Yield Decline +14bps 4Q24 NIM change: -5bps QoQ Net Interest Income Net Interest Margin (annualized) QoQ Change in Net Interest Margin 3Q24 4Q24 Decrease in Interest Bearing Deposit Cost -13bps Impact of Interest Income Reversal on Nonaccrual Loans -2bps All Other Net Changes • 4Q24 net interest income of $102MM down 3% QoQ. Decrease in interest income (lower loan yields, interest income reversal, plus lower yields on and balances of interest earning cash and deposits at other banks), partially offset by lower interest expense (lower deposit costs) • 4Q24 average cost of interest bearing (“IB”) deposits down 21bps QoQ to 4.38%, down from 4.59% in 3Q24 – Spot rate on IB deposit costs at 12/31/24: 4.21%, down 42bps from 4.63% at 8/31/24 – Cumulative spot beta(1) of 42% on IB deposit costs vs. change in Fed Funds target rate, from 8/31/24 to 12/31/24 • 4Q24 net interest margin (“NIM”) of 2.50% decreased 5bps QoQ. In terms of NIM, the impact from lower IB deposit costs offset the impact from lower loan yields. However, $1.7MM of interest income reversed on loans moving to nonaccrual status impacted NIM by -4bps in 4Q24 -4bps (1) Beta = (Period-to-period change in deposit cost) / (Period-to-period change in benchmark rate). On this slide: (change in spot interest bearing deposit cost 8/31/24 to 12/31/24) / (change in Fed Funds target rate 8/31/24 to 12/31/24)

3.15% 3.36% 3.39% 3.44% 3.32% 4.32% 4.51% 4.54% 4.59% 4.38% 5.50% 5.50% 5.50% 5.43% 4.82% 4Q23 1Q24 2Q24 3Q24 4Q24 Cost of Total Deposits (ann.) Cost of IB Deposits (ann.) Avg Fed Funds Rate Average Loans & Deposits, Yields & Rates 10 Average Deposits Average Loans ($ Billions) ($ Billions) $14.1 $13.7 $13.6 $13.6 $13.6 0.00 2.00 4.00 6.00 8.00 10.00 12.00 14.00 16.00 4Q23 1Q24 2Q24 3Q24 4Q24 11.2 11.1 10.9 11.0 11.0 4.1 3.8 3.6 3.7 3.6 4Q23 1Q24 2Q24 3Q24 4Q24 Avg Interest Bearing ("IB") Deposits Avg Non IB Deposits 6.24% 6.25% 6.20% 6.16% 5.95% 5.50% 5.50% 5.50% 5.43% 4.82% 4Q23 1Q24 2Q24 3Q24 4Q24 Avg Loan Yield (annualized) Avg Fed Funds Rate Avg Loan-to-Deposit Ratio 92% 92% 94% 92% 93% Average Cost of Deposits Relative to Fed Funds Rate Average Loan Yield Relative to Fed Funds Rate $14.5$14.9$15.3 $14.6$14.7
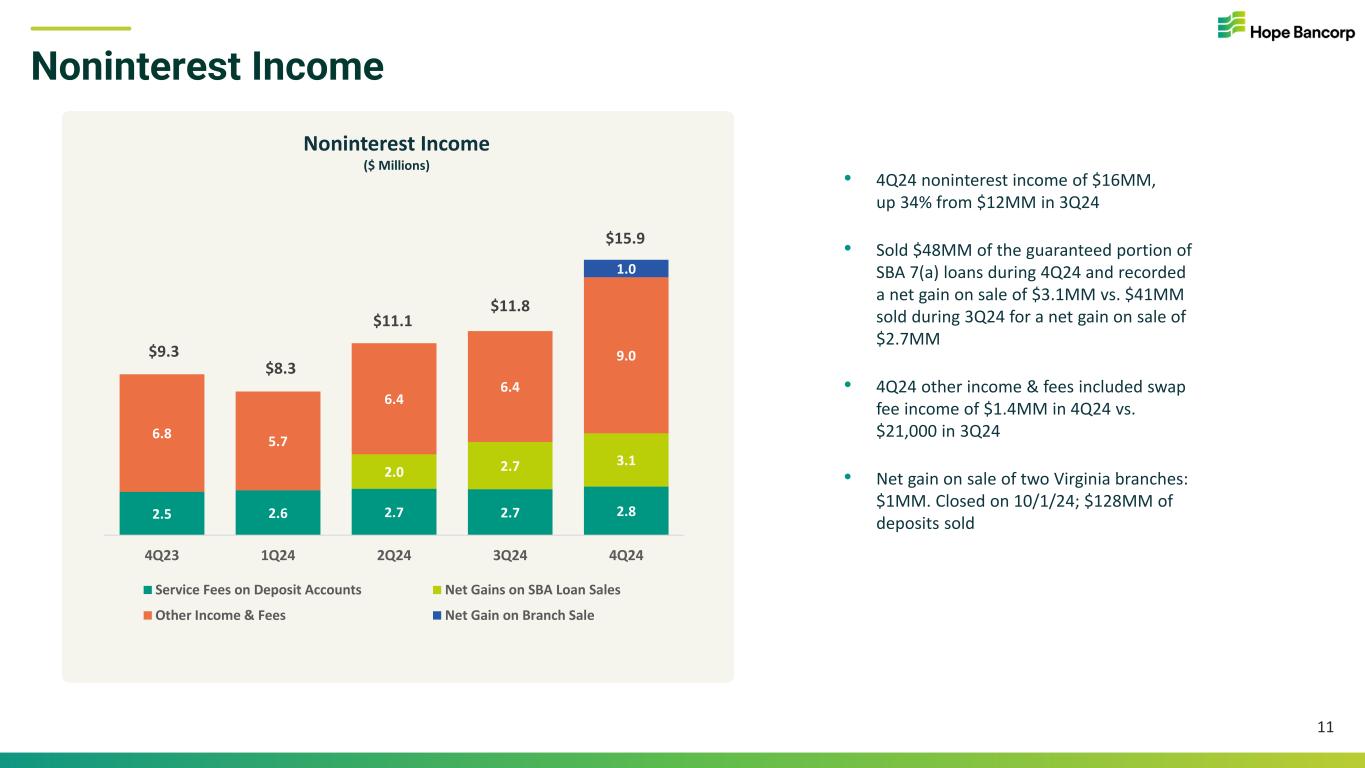
2.5 2.6 2.7 2.7 2.8 2.0 2.7 3.1 6.8 5.7 6.4 6.4 9.0 1.0 4Q23 1Q24 2Q24 3Q24 4Q24 Service Fees on Deposit Accounts Net Gains on SBA Loan Sales Other Income & Fees Net Gain on Branch Sale Noninterest Income 11 Noninterest Income ($ Millions) $11.8 $15.9 $9.3 $8.3 $11.1 • 4Q24 noninterest income of $16MM, up 34% from $12MM in 3Q24 • Sold $48MM of the guaranteed portion of SBA 7(a) loans during 4Q24 and recorded a net gain on sale of $3.1MM vs. $41MM sold during 3Q24 for a net gain on sale of $2.7MM • 4Q24 other income & fees included swap fee income of $1.4MM in 4Q24 vs. $21,000 in 3Q24 • Net gain on sale of two Virginia branches: $1MM. Closed on 10/1/24; $128MM of deposits sold
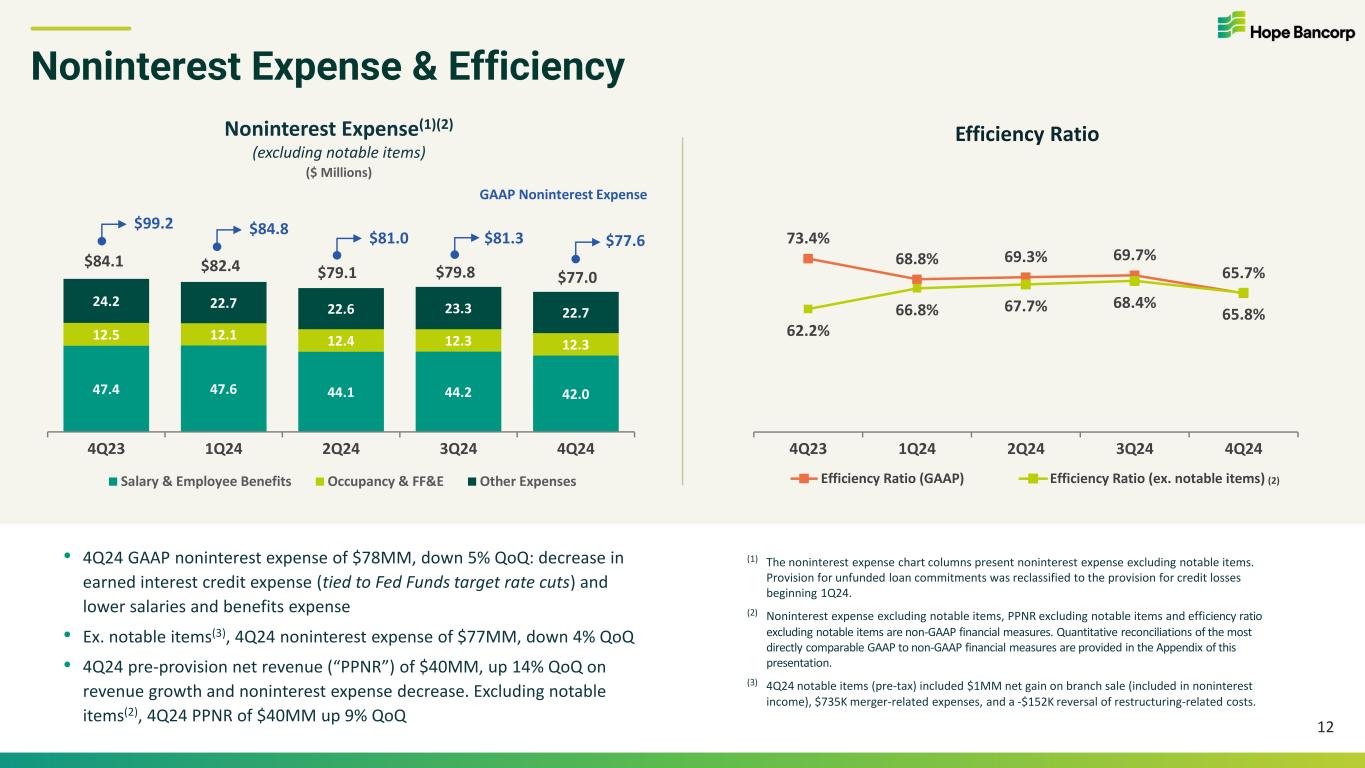
73.4% 68.8% 69.3% 69.7% 65.7% 62.2% 66.8% 67.7% 68.4% 65.8% 4Q23 1Q24 2Q24 3Q24 4Q24 Efficiency Ratio (GAAP) Efficiency Ratio (ex. notable items) 47.4 47.6 44.1 44.2 42.0 12.5 12.1 12.4 12.3 12.3 24.2 22.7 22.6 23.3 22.7 4Q23 1Q24 2Q24 3Q24 4Q24 Salary & Employee Benefits Occupancy & FF&E Other Expenses Efficiency Ratio Noninterest Expense & Efficiency 12 $79.8 $77.0 $84.1 $82.4 $79.1 Noninterest Expense(1)(2) (excluding notable items) ($ Millions) • 4Q24 GAAP noninterest expense of $78MM, down 5% QoQ: decrease in earned interest credit expense (tied to Fed Funds target rate cuts) and lower salaries and benefits expense • Ex. notable items(3), 4Q24 noninterest expense of $77MM, down 4% QoQ • 4Q24 pre-provision net revenue (“PPNR”) of $40MM, up 14% QoQ on revenue growth and noninterest expense decrease. Excluding notable items(2), 4Q24 PPNR of $40MM up 9% QoQ (1) The noninterest expense chart columns present noninterest expense excluding notable items. Provision for unfunded loan commitments was reclassified to the provision for credit losses beginning 1Q24. (2) Noninterest expense excluding notable items, PPNR excluding notable items and efficiency ratio excluding notable items are non-GAAP financial measures. Quantitative reconciliations of the most directly comparable GAAP to non-GAAP financial measures are provided in the Appendix of this presentation. (3) 4Q24 notable items (pre-tax) included $1MM net gain on branch sale (included in noninterest income), $735K merger-related expenses, and a -$152K reversal of restructuring-related costs. GAAP Noninterest Expense $77.6 $99.2 $84.8 $81.0 (2) $81.3
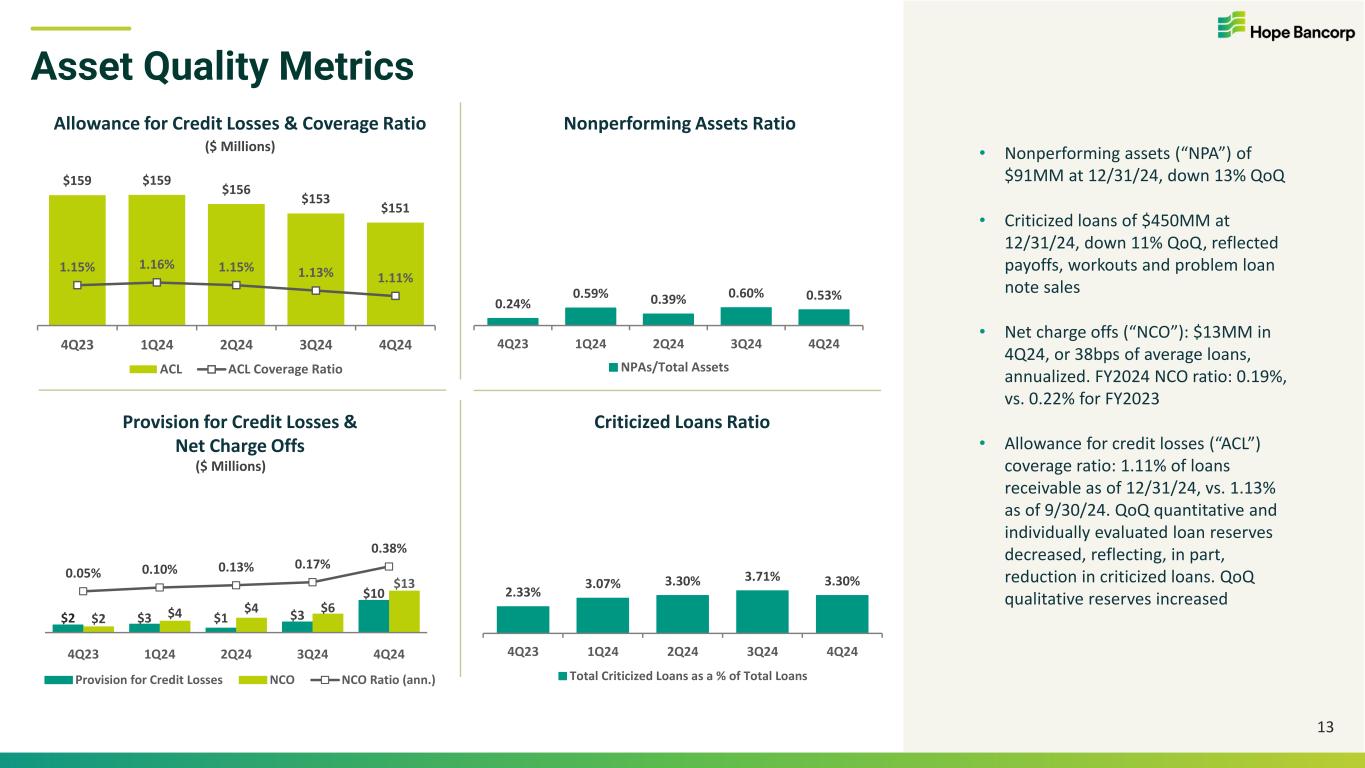
$159 $159 $156 $153 $151 1.15% 1.16% 1.15% 1.13% 1.11% 4Q23 1Q24 2Q24 3Q24 4Q24 ACL ACL Coverage Ratio • Nonperforming assets (“NPA”) of $91MM at 12/31/24, down 13% QoQ • Criticized loans of $450MM at 12/31/24, down 11% QoQ, reflected payoffs, workouts and problem loan note sales • Net charge offs (“NCO”): $13MM in 4Q24, or 38bps of average loans, annualized. FY2024 NCO ratio: 0.19%, vs. 0.22% for FY2023 • Allowance for credit losses (“ACL”) coverage ratio: 1.11% of loans receivable as of 12/31/24, vs. 1.13% as of 9/30/24. QoQ quantitative and individually evaluated loan reserves decreased, reflecting, in part, reduction in criticized loans. QoQ qualitative reserves increased Asset Quality Metrics 13 Provision for Credit Losses & Net Charge Offs Nonperforming Assets RatioAllowance for Credit Losses & Coverage Ratio Criticized Loans Ratio $2 $3 $1 $3 $10 $2 $4 $4 $6 $13 0.05% 0.10% 0.13% 0.17% 0.38% 4Q23 1Q24 2Q24 3Q24 4Q24 Provision for Credit Losses NCO NCO Ratio (ann.) 2.33% 3.07% 3.30% 3.71% 3.30% 4Q23 1Q24 2Q24 3Q24 4Q24 Total Criticized Loans as a % of Total Loans ($ Millions) ($ Millions) 0.24% 0.59% 0.39% 0.60% 0.53% 4Q23 1Q24 2Q24 3Q24 4Q24 NPAs/Total Assets
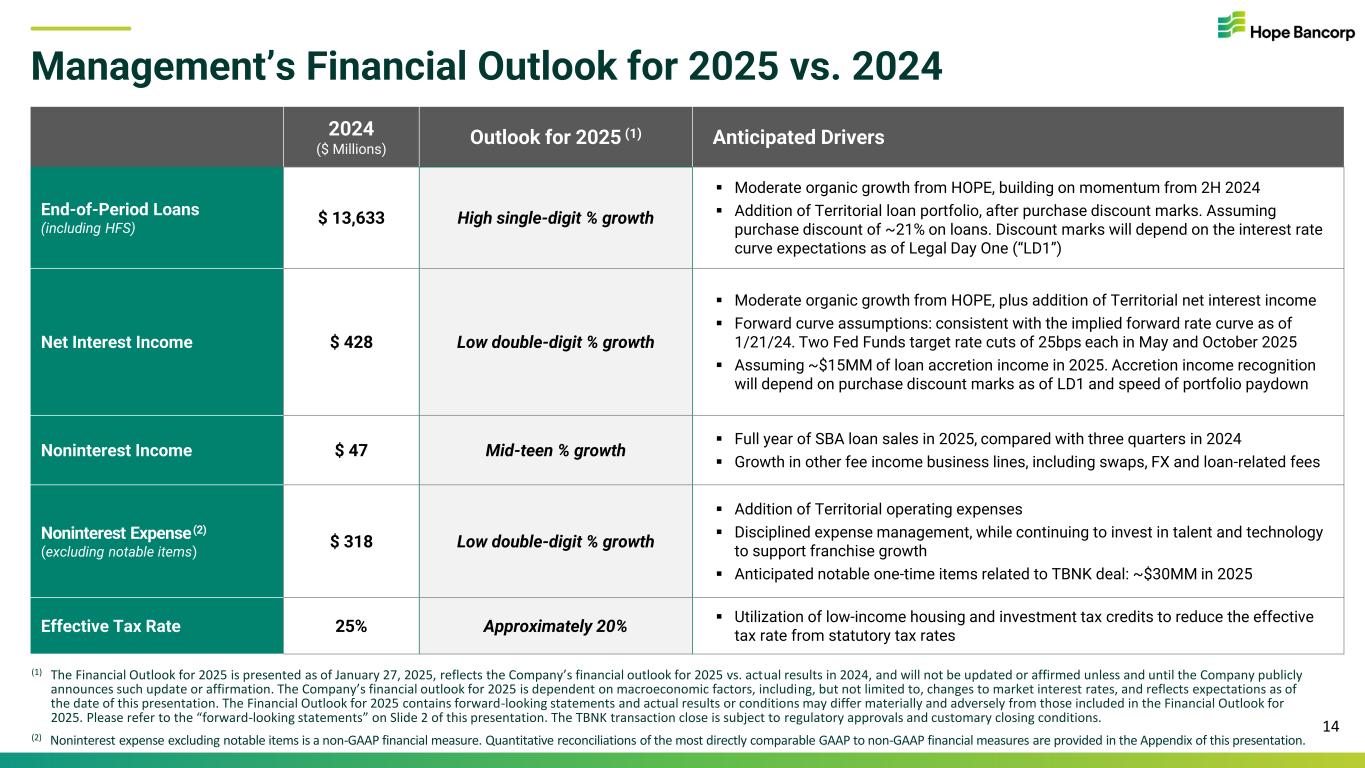
Management’s Financial Outlook for 2025 vs. 2024 14 2024 ($ Millions) Outlook for 2025 (1) Anticipated Drivers End-of-Period Loans (including HFS) $ 13,633 High single-digit % growth ▪ Moderate organic growth from HOPE, building on momentum from 2H 2024 ▪ Addition of Territorial loan portfolio, after purchase discount marks. Assuming purchase discount of ~21% on loans. Discount marks will depend on the interest rate curve expectations as of Legal Day One (“LD1”) Net Interest Income $ 428 Low double-digit % growth ▪ Moderate organic growth from HOPE, plus addition of Territorial net interest income ▪ Forward curve assumptions: consistent with the implied forward rate curve as of 1/21/24. Two Fed Funds target rate cuts of 25bps each in May and October 2025 ▪ Assuming ~$15MM of loan accretion income in 2025. Accretion income recognition will depend on purchase discount marks as of LD1 and speed of portfolio paydown Noninterest Income $ 47 Mid-teen % growth ▪ Full year of SBA loan sales in 2025, compared with three quarters in 2024 ▪ Growth in other fee income business lines, including swaps, FX and loan-related fees Noninterest Expense (2) (excluding notable items) $ 318 Low double-digit % growth ▪ Addition of Territorial operating expenses ▪ Disciplined expense management, while continuing to invest in talent and technology to support franchise growth ▪ Anticipated notable one-time items related to TBNK deal: ~$30MM in 2025 Effective Tax Rate 25% Approximately 20% ▪ Utilization of low-income housing and investment tax credits to reduce the effective tax rate from statutory tax rates (1) The Financial Outlook for 2025 is presented as of January 27, 2025, reflects the Company’s financial outlook for 2025 vs. actual results in 2024, and will not be updated or affirmed unless and until the Company publicly announces such update or affirmation. The Company’s financial outlook for 2025 is dependent on macroeconomic factors, including, but not limited to, changes to market interest rates, and reflects expectations as of the date of this presentation. The Financial Outlook for 2025 contains forward-looking statements and actual results or conditions may differ materially and adversely from those included in the Financial Outlook for 2025. Please refer to the “forward-looking statements” on Slide 2 of this presentation. The TBNK transaction close is subject to regulatory approvals and customary closing conditions. (2) Noninterest expense excluding notable items is a non-GAAP financial measure. Quantitative reconciliations of the most directly comparable GAAP to non-GAAP financial measures are provided in the Appendix of this presentation.

(1) The Medium-Term Targets reflect the Company’s current projections for 2027 and beyond; not all targets will be reached at the same time, and some may be reached on a quarterly basis before the annual basis. The Company’s Medium-Term Targets are presented as of January 27, 2025, and will not be updated or affirmed unless and until the Company publicly announces such update or affirmation. Macroeconomic assumptions underpinning the Company’s Medium-Term Targets reflect the current forward interest rate curve and assume ongoing positive economic growth over the medium term, but at a slower pace when compared with 2024. The Medium-Term Targets and macroeconomic assumptions contain forward-looking statements and actual results or conditions may differ materially and adversely from those included in the Medium-Term Targets. Please refer to the “forward-looking statements” on Slide 2 of this presentation. High single-digit % growth Targeting balanced growth across all business lines in normalized operating environment Planning to maintain loan-to- deposit ratio ~95% or lower Loan Growth >10% Targeting medium-term annual revenue growth to outpace loan growth, augmented by fee income growth and expanding net interest margin due to improved funding mix Revenue Growth ~50% Target efficiency ratio, to be achieved via revenue growth, expense management discipline, and operational process improvement Efficiency Ratio 1.2%+ Targeting attractive levels of returns driven by improved profitability Return on Avg Assets Medium-Term Targets(1) 15

Appendix 16

Summary Balance Sheet 17 ($ in millions, except per share data) 12/31/24 9/30/24 QoQ % change 12/31/23 YoY % change Cash and due from banks $ 458.2 $ 680.9 (32.7)% $ 1,929.0 (76.2)% Investment securities 2,075.6 2,177.3 (4.7)% 2,408.9 (13.8)% Federal Home Loan Bank (“FHLB”) stock and other investments 57.2 57.2 0.0 % 61.0 (6.2)% Gross loans 13,632.8 13,643.7 (0.1)% 13,857.0 (1.6)% Allowance for credit losses (150.5) (153.3) (1.8)% (158.7) (5.2)% Goodwill and intangible assets 466.8 467.2 (0.1)% 468.4 (0.3)% Other assets 513.9 481.2 6.8 % 565.9 (9.2)% Total assets $ 17,054.0 $ 17,354.2 (1.7)% $ 19,131.5 (10.9)% Deposits $ 14,327.5 $ 14,729.5 (2.7)% $ 14,753.8 (2.9)% Borrowings & other debt 348.6 209.2 66.6 % 1,904.0 (81.7)% Other liabilities 243.4 245.7 (0.9)% 352.5 (30.9)% Total liabilities $ 14,919.5 $ 15,184.4 (1.7)% $ 17,010.3 (12.3)% Total stockholders’ equity $ 2,134.5 $ 2,169.8 (1.6)% $ 2,121.2 0.6 % Book value per share $17.68 $17.97 (1.6)% $17.66 0.1 % Tangible common equity (“TCE”) per share(1) $13.81 $14.10 (2.1)% $13.76 0.4 % Tangible common equity ratio(1) 10.05% 10.08% 8.86% Loan-to-deposit ratio 95.2% 92.6% 93.9% (1) TCE per share and TCE ratio are non-GAAP financial measures. Quantitative reconciliations of the most directly comparable GAAP to non-GAAP financial measures are provided in the Appendix of this presentation.
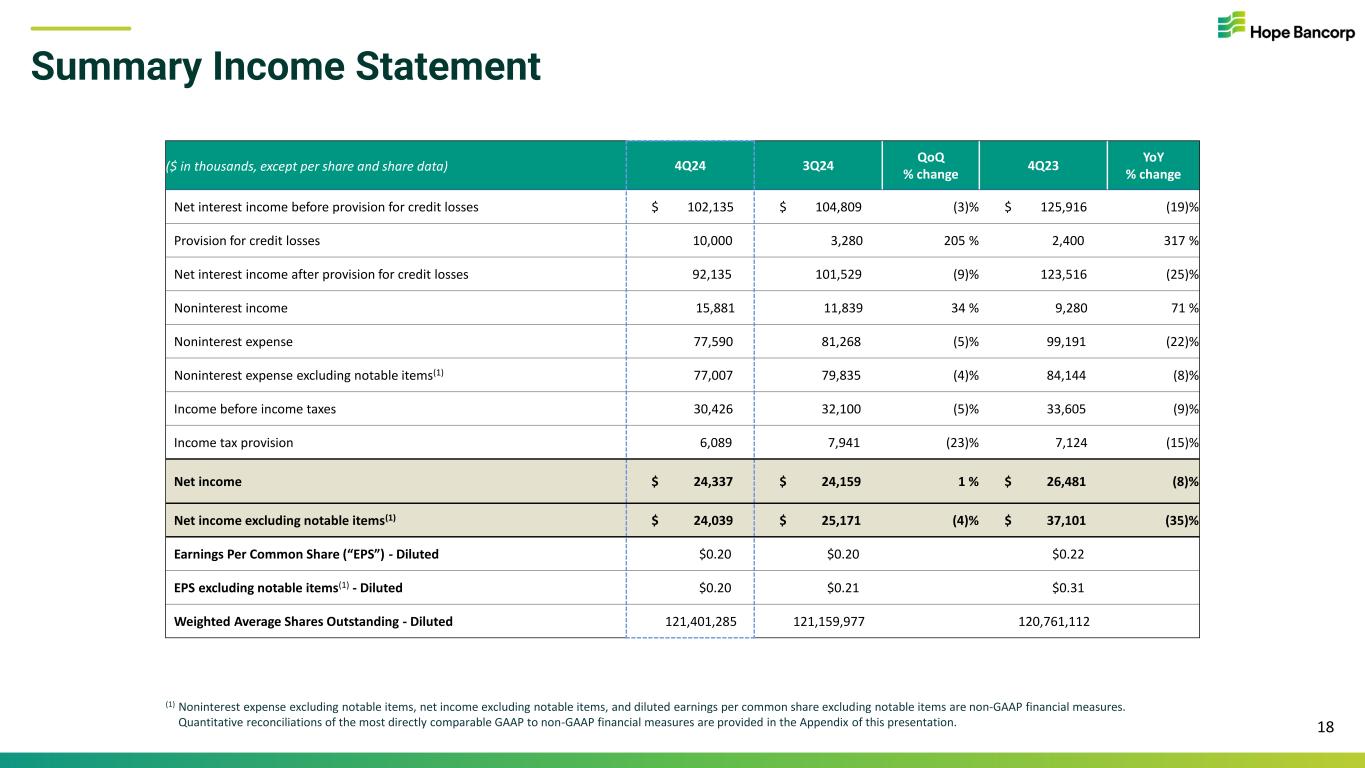
Summary Income Statement 18 ($ in thousands, except per share and share data) 4Q24 3Q24 QoQ % change 4Q23 YoY % change Net interest income before provision for credit losses $ 102,135 $ 104,809 (3)% $ 125,916 (19)% Provision for credit losses 10,000 3,280 205 % 2,400 317 % Net interest income after provision for credit losses 92,135 101,529 (9)% 123,516 (25)% Noninterest income 15,881 11,839 34 % 9,280 71 % Noninterest expense 77,590 81,268 (5)% 99,191 (22)% Noninterest expense excluding notable items(1) 77,007 79,835 (4)% 84,144 (8)% Income before income taxes 30,426 32,100 (5)% 33,605 (9)% Income tax provision 6,089 7,941 (23)% 7,124 (15)% Net income $ 24,337 $ 24,159 1 % $ 26,481 (8)% Net income excluding notable items(1) $ 24,039 $ 25,171 (4)% $ 37,101 (35)% Earnings Per Common Share (“EPS”) - Diluted $0.20 $0.20 $0.22 EPS excluding notable items(1) - Diluted $0.20 $0.21 $0.31 Weighted Average Shares Outstanding - Diluted 121,401,285 121,159,977 120,761,112 (1) Noninterest expense excluding notable items, net income excluding notable items, and diluted earnings per common share excluding notable items are non-GAAP financial measures. Quantitative reconciliations of the most directly comparable GAAP to non-GAAP financial measures are provided in the Appendix of this presentation.
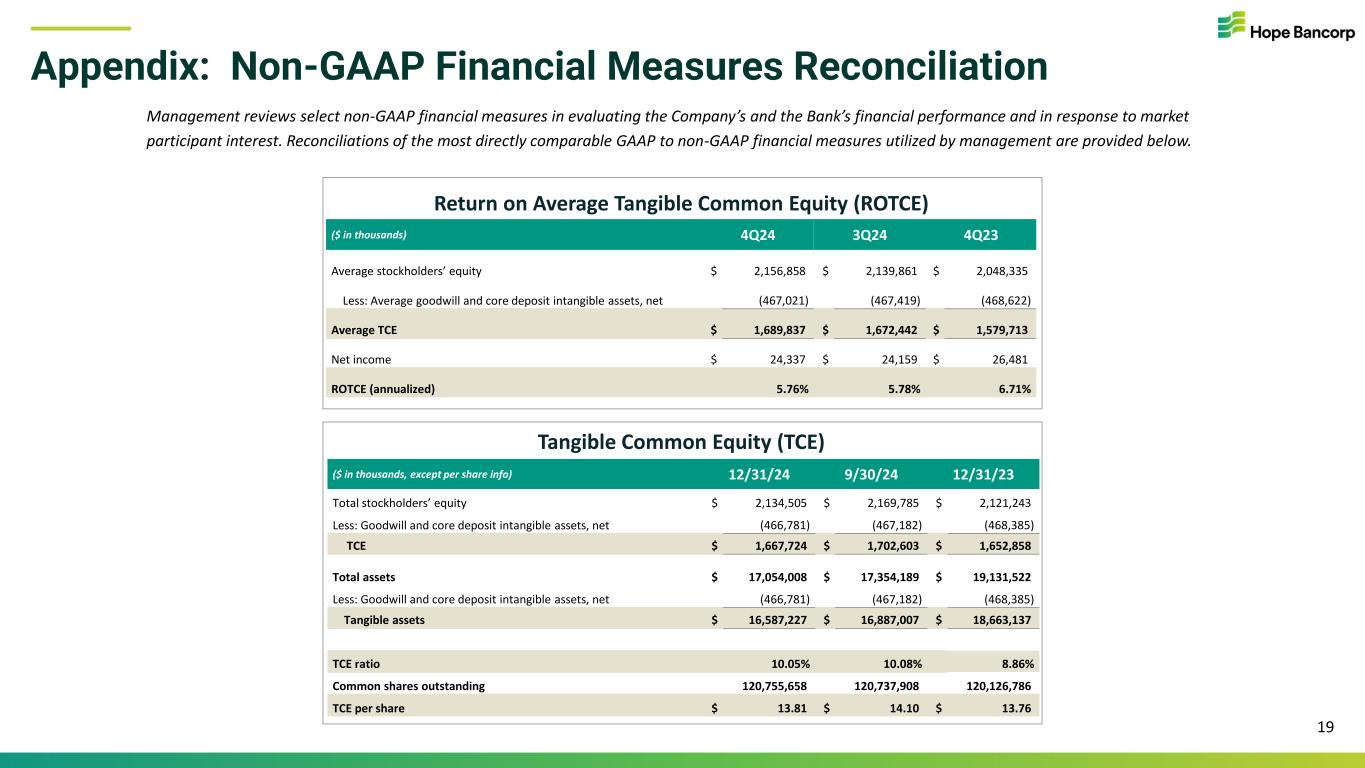
Appendix: Non-GAAP Financial Measures Reconciliation Management reviews select non-GAAP financial measures in evaluating the Company’s and the Bank’s financial performance and in response to market participant interest. Reconciliations of the most directly comparable GAAP to non-GAAP financial measures utilized by management are provided below. Tangible Common Equity (TCE) 19 Return on Average Tangible Common Equity (ROTCE) ($ in thousands, except per share info) 12/31/24 9/30/24 12/31/23 Total stockholders’ equity $ 2,134,505 $ 2,169,785 $ 2,121,243 Less: Goodwill and core deposit intangible assets, net (466,781) (467,182) (468,385) TCE $ 1,667,724 $ 1,702,603 $ 1,652,858 Total assets $ 17,054,008 $ 17,354,189 $ 19,131,522 Less: Goodwill and core deposit intangible assets, net (466,781) (467,182) (468,385) Tangible assets $ 16,587,227 $ 16,887,007 $ 18,663,137 TCE ratio 10.05% 10.08% 8.86% Common shares outstanding 120,755,658 120,737,908 120,126,786 TCE per share $ 13.81 $ 14.10 $ 13.76 ($ in thousands) 4Q24 3Q24 4Q23 Average stockholders’ equity $ 2,156,858 $ 2,139,861 $ 2,048,335 Less: Average goodwill and core deposit intangible assets, net (467,021) (467,419) (468,622) Average TCE $ 1,689,837 $ 1,672,442 $ 1,579,713 Net income $ 24,337 $ 24,159 $ 26,481 ROTCE (annualized) 5.76% 5.78% 6.71%
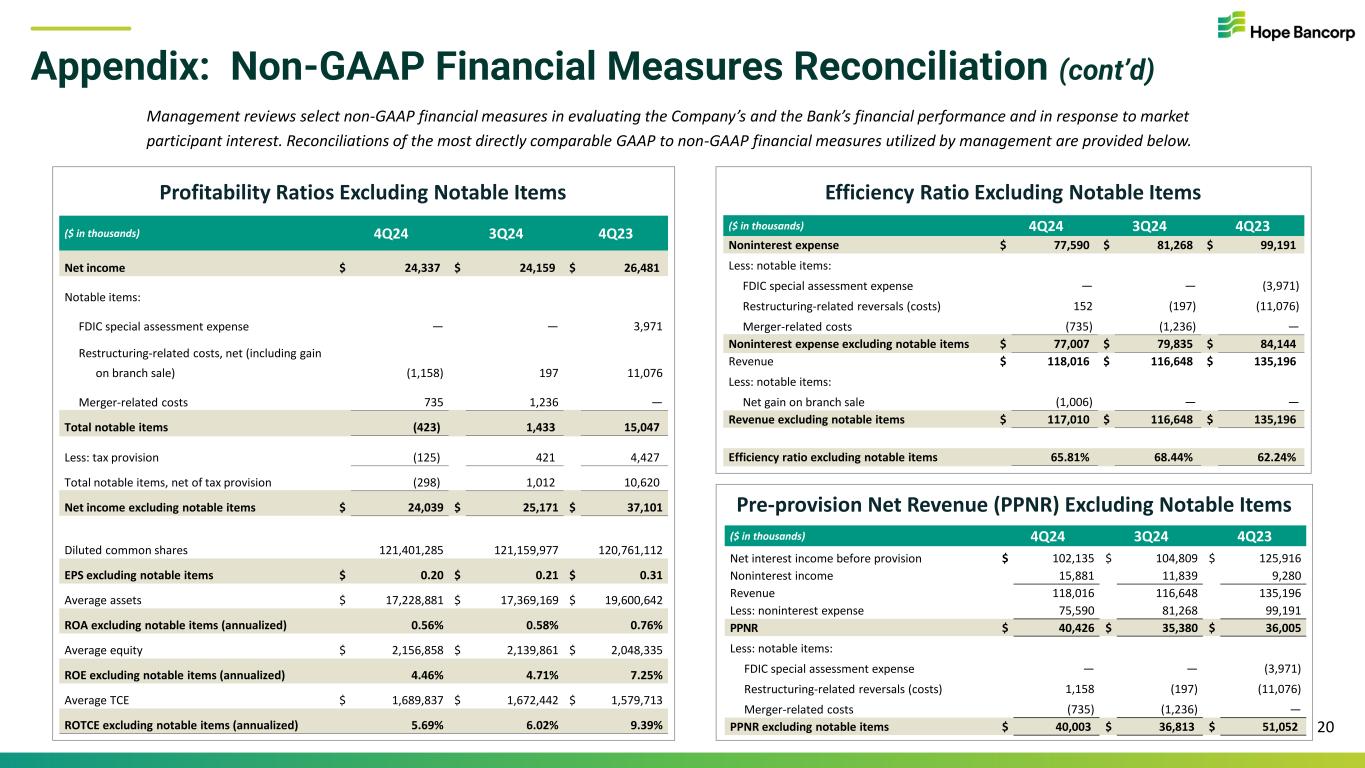
Appendix: Non-GAAP Financial Measures Reconciliation (cont’d) Management reviews select non-GAAP financial measures in evaluating the Company’s and the Bank’s financial performance and in response to market participant interest. Reconciliations of the most directly comparable GAAP to non-GAAP financial measures utilized by management are provided below. 20 ($ in thousands) 4Q24 3Q24 4Q23 Noninterest expense $ 77,590 $ 81,268 $ 99,191 Less: notable items: FDIC special assessment expense — — (3,971) Restructuring-related reversals (costs) 152 (197) (11,076) Merger-related costs (735) (1,236) — Noninterest expense excluding notable items $ 77,007 $ 79,835 $ 84,144 Revenue $ 118,016 $ 116,648 $ 135,196 Less: notable items: Net gain on branch sale (1,006) — — Revenue excluding notable items $ 117,010 $ 116,648 $ 135,196 Efficiency ratio excluding notable items 65.81% 68.44% 62.24% Efficiency Ratio Excluding Notable Items ($ in thousands) 4Q24 3Q24 4Q23 Net income $ 24,337 $ 24,159 $ 26,481 Notable items: FDIC special assessment expense — — 3,971 Restructuring-related costs, net (including gain on branch sale) (1,158) 197 11,076 Merger-related costs 735 1,236 — Total notable items (423) 1,433 15,047 Less: tax provision (125) 421 4,427 Total notable items, net of tax provision (298) 1,012 10,620 Net income excluding notable items $ 24,039 $ 25,171 $ 37,101 Diluted common shares 121,401,285 121,159,977 120,761,112 EPS excluding notable items $ 0.20 $ 0.21 $ 0.31 Average assets $ 17,228,881 $ 17,369,169 $ 19,600,642 ROA excluding notable items (annualized) 0.56% 0.58% 0.76% Average equity $ 2,156,858 $ 2,139,861 $ 2,048,335 ROE excluding notable items (annualized) 4.46% 4.71% 7.25% Average TCE $ 1,689,837 $ 1,672,442 $ 1,579,713 ROTCE excluding notable items (annualized) 5.69% 6.02% 9.39% Profitability Ratios Excluding Notable Items Pre-provision Net Revenue (PPNR) Excluding Notable Items ($ in thousands) 4Q24 3Q24 4Q23 Net interest income before provision $ 102,135 $ 104,809 $ 125,916 Noninterest income 15,881 11,839 9,280 Revenue 118,016 116,648 135,196 Less: noninterest expense 75,590 81,268 99,191 PPNR $ 40,426 $ 35,380 $ 36,005 Less: notable items: FDIC special assessment expense — — (3,971) Restructuring-related reversals (costs) 1,158 (197) (11,076) Merger-related costs (735) (1,236) — PPNR excluding notable items $ 40,003 $ 36,813 $ 51,052


