EXHIBIT 99.1
Filed by Nara Bancorp, Inc.
Pursuant to Rule 425 under the Securities Act of 1933
and deemed filed pursuant to Rule 14a-12 under the
Securities Exchange Act of 1934
Subject Company: Nara Bancorp, Inc.
SEC Registration Statement No.: 000-50245
Additional Information and Where to Find It
In connection with the proposed merger, Nara Bancorp, Inc. will file with the SEC a Registration Statement on Form S-4 that will include a Joint Proxy Statement/Prospectus of Center Financial Corporation and Nara Bancorp, as well as other relevant documents concerning the proposed transaction. Shareholders are urged to read the Registration Statement and the Joint Proxy Statement/Prospectus regarding the merger when it becomes available and any other relevant documents filed with the Securities and Exchange Commission (“SEC”), as well as any amendments or supplements to those documents, because they will contain important information. You will be able to obtain a free copy of the Joint Proxy Statement/Prospectus, as well as other filings containing information about Nara Bancorp and Center Financial at the SEC’s Internet site (www.sec.gov). You will also be able to obtain these documents, free of charge, from Nara at www.narabank.com under the tab “Investor Relations” and then under the heading “SEC Filings” or from Center Financial at www.centerbank.com under the tab “Investor Relations” and then under the heading “SEC Filings.”
Participants in Solicitation
Nara Bancorp, Center Financial and their respective directors, executive officers, management and employees may be deemed to be participants in the solicitation of proxies in respect of the merger. Information concerning Nara Bancorp’s participants is set forth in the proxy statement, dated May 24, 2010, for Nara Bancorp’s 2010 annual meeting of stockholders as filed with the SEC on Schedule 14A. Information concerning Center Financial’s participants is set forth in the proxy statement, dated April 30, 2010, for Center Financial’s 2010 annual meeting of stockholders as filed with the SEC on Schedule 14A. Additional information regarding the interests of participants of Nara Bancorp and Center Financial in the solicitation of proxies in respect of the merger will be included in the registration statement and joint proxy statement/prospectus to be filed with the SEC.
Forward-Looking Statements
These documents contain statements regarding the proposed transaction between Nara Bancorp and Center Financial, the expected timetable for completing the transaction, future financial and operating results, benefits and synergies of the proposed transaction and other statements about the future expectations, beliefs, goals, plans or prospects of the management of each of Nara Bancorp and Center Financial. These statements are based on current expectations, estimates, forecasts and projections and management assumptions about the future performance of each of Nara Bancorp and Center Financial and the combined company, as well as the businesses and markets in which they do and are expected to operate. These statements constitute forward-looking statements within the meaning of the U.S. Private Securities Litigation Reform Act of 1995. Words such as “expects,” “believes,” “estimates,” “anticipates,” “targets,” “goals,” “projects,” “intends,” “plans, “seeks,” and variations of such words and similar expressions are intended to identify such forward-looking statements which are not statements of historical fact. These forward-looking statements are not guarantees of future performance and involve certain risks, uncertainties and assumptions that are difficult to assess. Actual outcomes and results may differ materially from what is expressed or forecasted in such forward-looking statements. The closing of the proposed transaction is subject to regulatory approval, the approval of the shareholders of both Nara Bancorp and Center Financial, and other customary closing conditions, the receipt of which . There is no assurance that such conditions will be met or that the proposed transaction will be consummated within expected time frame, or at all. If the transaction is consummated, factors that may cause actual outcomes to differ from what is expressed or forecasted in these forward-looking statements include, among things: difficulties and delays in integrating Nara Bancorp and Center Financial and achieving anticipated synergies, cost savings and other benefits from the transaction; higher than anticipated transaction costs; deposit attrition, operating costs, customer loss and business disruption following the merger, including difficulties in maintaining relationships with employees, may be greater than expected; required governmental approvals of the merger may not be obtained on its proposed terms and schedule, or without regulatory constraints that may limit growth; competitive pressures among depository and other financial institutions may increase significantly and have an effect on revenues; the strength of the United States economy in general, and of the local economies in which the combined company will operate, may be different than expected, which could result in, among other things, a deterioration in credit quality or a reduced demand for credit and have a negative effect on the combined company’s loan portfolio and allowance for loan losses; changes in the U.S. legal and regulatory framework; and adverse conditions in the stock market, the public debt market and other capital markets (including changes in interest rate conditions) which would negatively affect the combined company’s business and operating results. For a more complete list and description of such risks and uncertainties, refer to Nara Bancorp’s Form 10-K for the year ended December 31, 2009, as amended, and Center Financial’s Form 10-K for the year ended December 31, 2009, as amended, as well as other filings made by Nara Bancorp and Center Financial with the SEC. Except as required under the U.S. federal securities laws and the rules and regulations of the SEC, Nara Bancorp and Center Financial disclaim any intention or obligation to update any forward-looking statements after the distribution of this press release, whether as a result of new information, future events, developments, changes in assumptions or otherwise.
|
EXHIBIT 99.1 
|
Transforming the Korean-American Banking Landscape
Merger of Equals
NARA BANCORP, INC. CENTER FINANCIAL CORPORATION
Additional Information
In connection with the proposed transaction between Nara Bancorp, Inc. (“NARA”) and Center Financial Corporation (“CLFC”), NARA will file with the Securities and Exchange Commission (“SEC”) a Registration Statement on Form S-4 that will include a Joint Proxy Statement/Prospectus of CLFC and NARA, as well as other relevant documents concerning the proposed transaction. Shareholders are urged to read the Registration Statement and the Joint Proxy Statement/Prospectus regarding the merger when it becomes available and any other relevant documents filed with the SEC, as well as any amendments or supplements to those documents, because they will contain important information. The Joint Proxy Statement/Prospectus, as well as other filings containing information about NARA and CLFC, are available free of charge at the SEC’s Internet site (www.sec.gov). These documents are also available free of charge from NARA at www.narabank.com under the tab “Investor Relations” and then under the heading “SEC Filings” or from CLFC at www.centerbank.com under the tab “Investor Relations” and then under the heading “SEC Filings.”
Participants In Solicitation
NARA, CLFC and their respective directors, executive officers, management and employees may be deemed to be participants in the solicitation of proxies in respect of the merger. Information concerning NARA’s participants is set forth in the proxy statement, dated May 24, 2010, for NARA’s 2010 annual meeting of stockholders as filed with the SEC on Schedule 14A. Information concerning CLFC’s participants is set forth in the proxy statement, dated April 30, 2010, for CLFC’s 2010 annual meeting of stockholders as filed with the SEC on Schedule 14A. Additional information regarding the interests of participants of NARA and CLFC in the solicitation of proxies in respect of the merger will be included in the Registration Statement on Form S-4 and the Joint Proxy Statement/Prospectus to be filed with the SEC.
Forward-Looking Statements
This presentation contains statements regarding the proposed transaction between NARA and CLFC, the expected timetable for completing the transaction, future financial and operating results, benefits and synergies of the proposed transaction and other statements about the future expectations, beliefs, goals, plans or prospects of the management of each of NARA and CLFC. These statements are based on current expectations, estimates, forecasts and projections and management assumptions about the future performance of each of NARA and CLFC and the combined company, as well as the businesses and markets in which they do and are expected to operate. These statements constitute forward-looking statements within the meaning of the U.S. Private Securities Litigation Reform Act of 1995. Words such as “expects,” “believes,” “estimates,” “anticipates,” “targets,” “goals,” “projects,” “intends,” “plans, “seeks” and variations of such words and similar expressions are intended to identify such forward-looking statements which are not statements of historical fact. These forward-looking statements are not guarantees of future performance and involve certain risks, uncertainties and assumptions that are difficult to assess. Actual outcomes and results may differ materially from what is expressed or forecasted in such forward-looking statements. Factors that may cause actual outcomes to differ from what is expressed or forecasted in these forward-looking statements include, among things: the ability to consummate the proposed transaction; difficulties and delays in obtaining regulatory approvals for the proposed transaction; difficulties and delays in achieving synergies and cost savings; potential difficulties in meeting conditions set forth in the merger agreement; and economic, competitive, governmental and technological factors affecting NARA and CLFC. For a more complete list and description of such risks and uncertainties, refer to NARA’s Annual Report on Form 10-K for the year ended December 31, 2009, as amended, and CLFC’s Annual Report on Form 10-K for the year ended December 31, 2009, as amended, as well as other filings made by NARA and CLFC with the SEC. Except as required under the U.S. federal securities laws and the rules and regulations of the SEC, NARA and CLFC disclaim any intention or obligation to update any forward-looking statements after the distribution of this presentation, whether as a result of new information, future events, developments, changes in assumptions or otherwise.
|
|
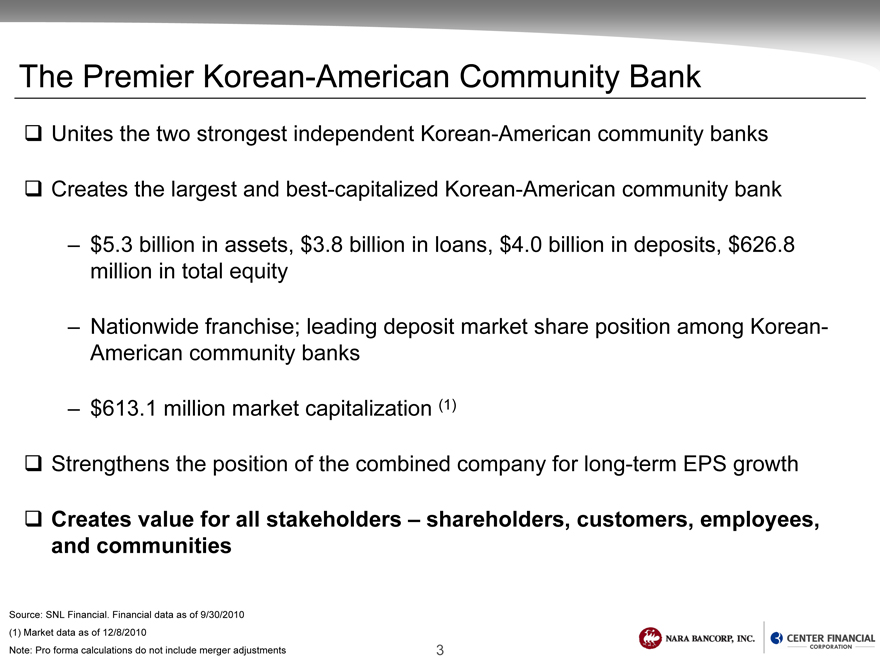
The Premier Korean-American Community Bank
Unites the two strongest independent Korean-American community banks
Creates the largest and best-capitalized Korean-American community bank
$5.3 billion in assets, $3.8 billion in loans, $4.0 billion in deposits, $626.8 million in total equity
Nationwide franchise; leading deposit market share position among Korean-American community banks
$613.1 million market capitalization (1)
Strengthens the position of the combined company for long-term EPS growth
Creates value for all stakeholders – shareholders, customers, employees, and communities
Source: SNL Financial. Financial data as of 9/30/2010 (1) Market data as of 12/8/2010
Note: Pro forma calculations do not include merger adjustments
Strategic Opportunities
Capitalize on leading Korean-American bank position to capture additional market share
Leverage pro forma scale and breadth of combined organization:
Improve efficiency of pro forma franchise
Employ best practices integration approach to products, people and operations
Capitalize on available revenue enhancements (e.g. SBA, international trade finance)
Provide full range of products and services to larger customer base
Strong capital and liquidity position will accelerate growth potential in existing and new attractive markets
Focus on creating long-term shareholder value
Merger Benefits
Positions the pro forma company to more effectively compete in the changing economic and regulatory environment
Accretive to earnings
– Significantly enhanced operating leverage with realizable synergies
Enhances ability to grow organically and acquisitively
Improved leverage in dealing with Korean national banks in trade finance relationships
Deepest bench of management talent in the Korean-American banking industry
– Improves ability to retain and attract critical talent
– Complementary Board of Directors with a strong mix of Korean-American community members and professional expertise
Better positions the pro forma company for TARP repayment and resumed dividends
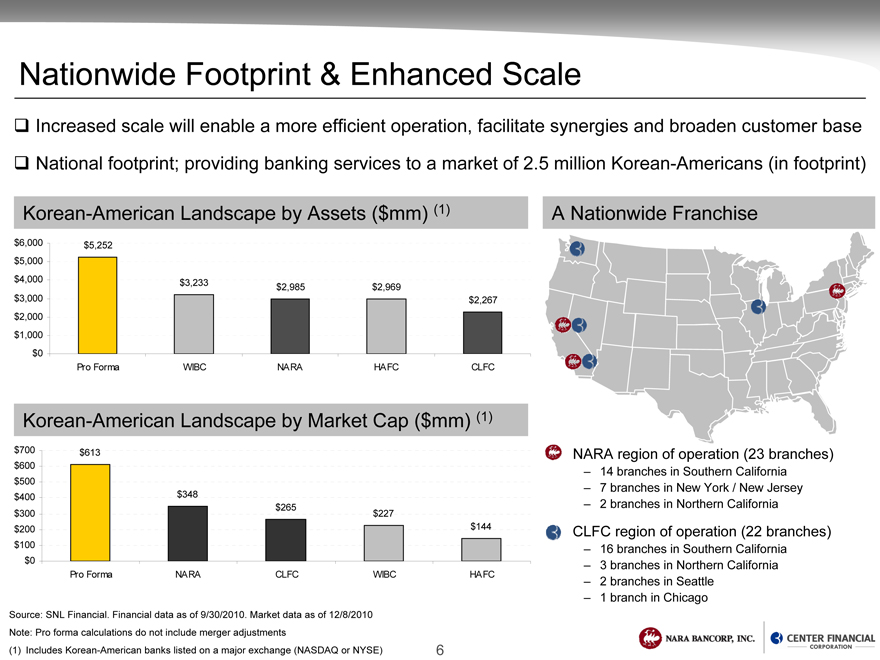
Nationwide Footprint & Enhanced Scale
Increased scale will enable a more efficient operation, facilitate synergies and broaden customer base
National footprint; providing banking services to a market of 2.5 million Korean-Americans (in footprint)
Korean-American Landscape by Assets ($mm) (1)
$6,000 $5,252
$5,000
$4,000 $3,233
$2,985 $2,969
$3,000 $2,267
$2,000
$1,000
$0
Pro Forma WIBC NARA HAFC CLFC
Korean-American Landscape by Market Cap ($mm) (1)
$700 $613
$600
$500
$400 $348
$265
$300 $227
$200 $144
$100
$0
Pro Forma NARA CLFC WIBC HAFC
A Nationwide Franchise
NARA region of operation (23 branches)
– 14 branches in Southern California
– 7 branches in New York / New Jersey
– 2 branches in Northern California
CLFC region of operation (22 branches)
– 16 branches in Southern California
– 3 branches in Northern California
– 2 branches in Seattle
– 1 branch in Chicago
Source: SNL Financial. Financial data as of 9/30/2010. Market data as of 12/8/2010 Note: Pro forma calculations do not include merger adjustments (1) Includes Korean-American banks listed on a major exchange (NASDAQ or NYSE)
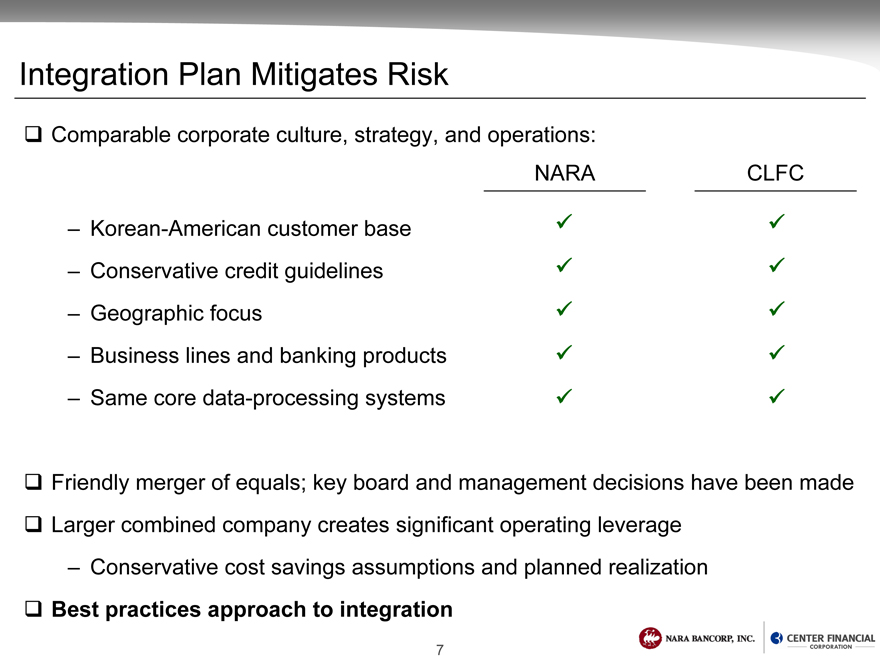
Integration Plan Mitigates Risk
Comparable corporate culture, strategy, and operations:
NARA CLFC
– Korean-American customer base
– Conservative credit guidelines
– Geographic focus
– Business lines and banking products
– Same core data-processing systems
Friendly merger of equals; key board and management decisions have been made
Larger combined company creates significant operating leverage
– Conservative cost savings assumptions and planned realization
Best practices approach to integration
7
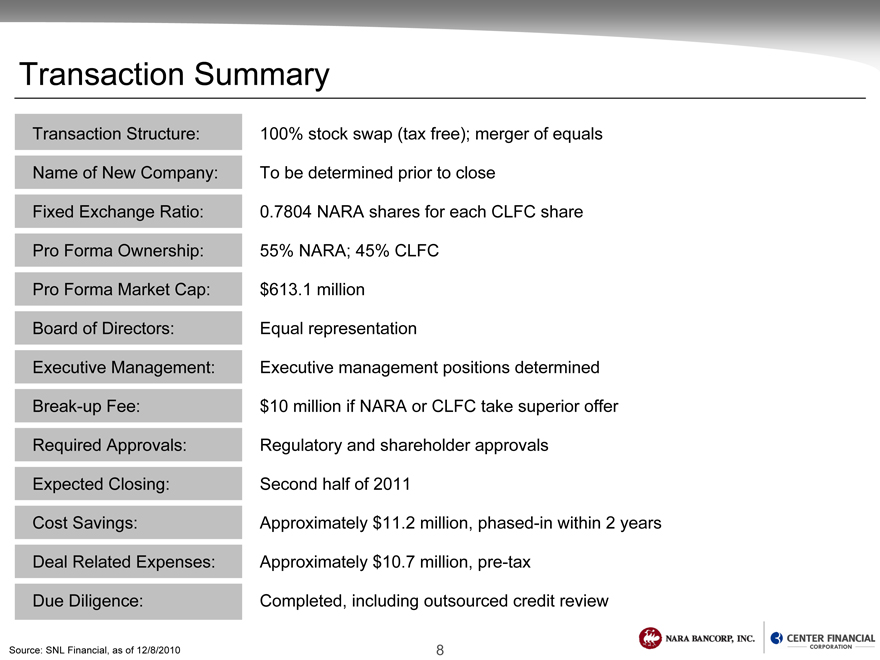
Transaction Summary
Transaction Structure: 100% stock swap (tax free); merger of equals
Name of New Company: To be determined prior to close
Fixed Exchange Ratio: 0.7804 NARA shares for each CLFC share
Pro Forma Ownership: 55% NARA; 45% CLFC
Pro Forma Market Cap: $613.1 million
Board of Directors: Equal representation
Executive Management: Executive management positions determined
Break-up Fee: $10 million if NARA or CLFC take superior offer
Required Approvals: Regulatory and shareholder approvals
Expected Closing: Second half of 2011
Cost Savings: Approximately $11.2 million, phased-in within 2 years
Deal Related Expenses: Approximately $10.7 million, pre-tax
Due Diligence: Completed, including outsourced credit review
Source: SNL Financial, as of 12/8/2010
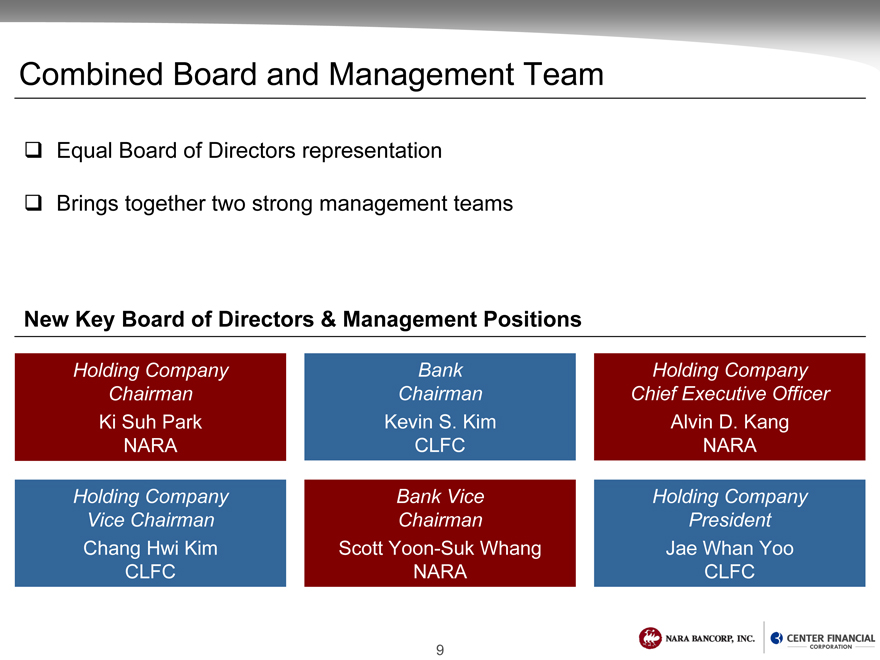
Combined Board and Management Team
Equal Board of Directors representation
Brings together two strong management teams
New Key Board of Directors & Management Positions
Holding Company Bank Holding Company
Chairman Chairman Chief Executive Officer
Ki Suh Park Kevin S. Kim Alvin D. Kang
NARA CLFC NARA
Holding Company Bank Vice Holding Company
Vice Chairman Chairman President
Chang Hwi Kim Scott Yoon-Suk Whang Jae Whan Yoo
CLFC NARA CLFC
9
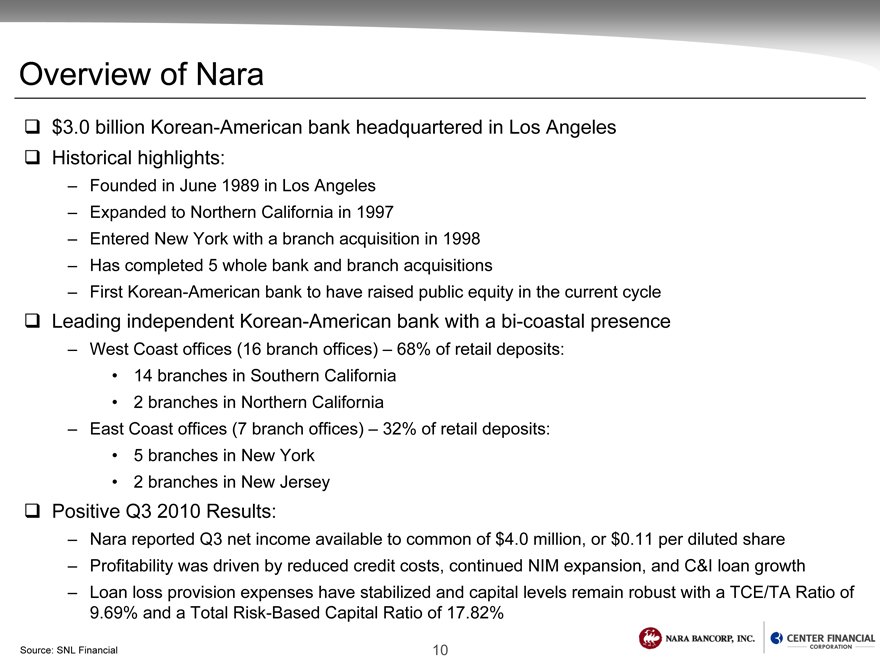
Overview of Nara
$3.0 billion Korean-American bank headquartered in Los Angeles
Historical highlights:
– Founded in June 1989 in Los Angeles
– Expanded to Northern California in 1997
– Entered New York with a branch acquisition in 1998
– Has completed 5 whole bank and branch acquisitions
– First Korean-American bank to have raised public equity in the current cycle
Leading independent Korean-American bank with a bi-coastal presence
– West Coast offices (16 branch offices) – 68% of retail deposits:
• 14 branches in Southern California
• | 2 branches in Northern California |
– East Coast offices (7 branch offices) – 32% of retail deposits:
• | 2 branches in New Jersey |
Positive Q3 2010 Results:
– Nara reported Q3 net income available to common of $4.0 million, or $0.11 per diluted share
– Profitability was driven by reduced credit costs, continued NIM expansion, and C&I loan growth
– Loan loss provision expenses have stabilized and capital levels remain robust with a TCE/TA Ratio of 9.69% and a Total Risk-Based Capital Ratio of 17.82%
Source: SNL Financial
Overview of Center
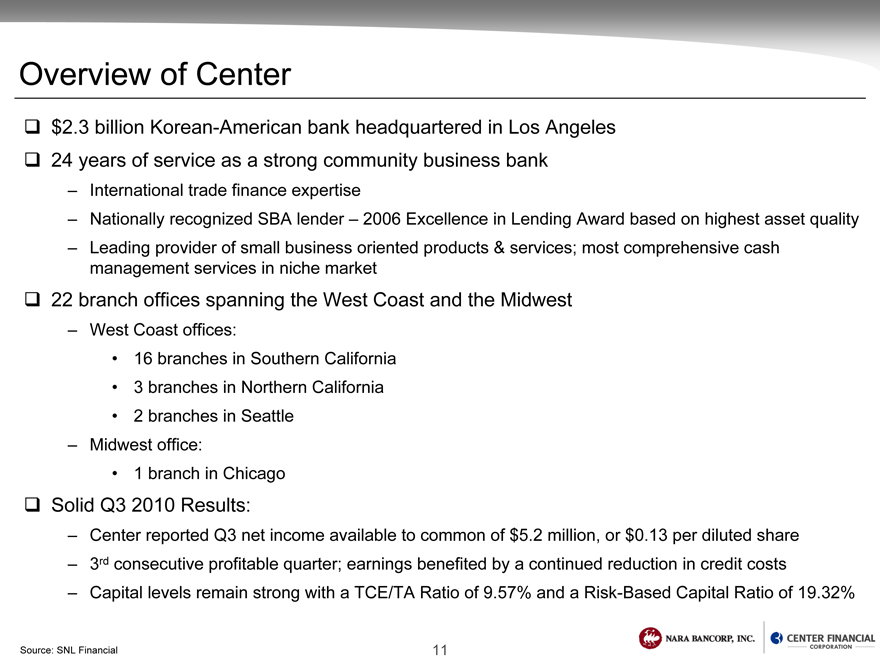
$2.3 billion Korean-American bank headquartered in Los Angeles
24 years of service as a strong community business bank
– International trade finance expertise
– Nationally recognized SBA lender – 2006 Excellence in Lending Award based on highest asset quality
– Leading provider of small business oriented products & services; most comprehensive cash management services in niche market
22 branch offices spanning the West Coast and the Midwest
– West Coast offices:
• 16 branches in Southern California
• | 3 branches in Northern California |
– Midwest office:
Solid Q3 2010 Results:
– Center reported Q3 net income available to common of $5.2 million, or $0.13 per diluted share
– 3rd consecutive profitable quarter; earnings benefited by a continued reduction in credit costs
– Capital levels remain strong with a TCE/TA Ratio of 9.57% and a Risk-Based Capital Ratio of 19.32%
Source: SNL Financial
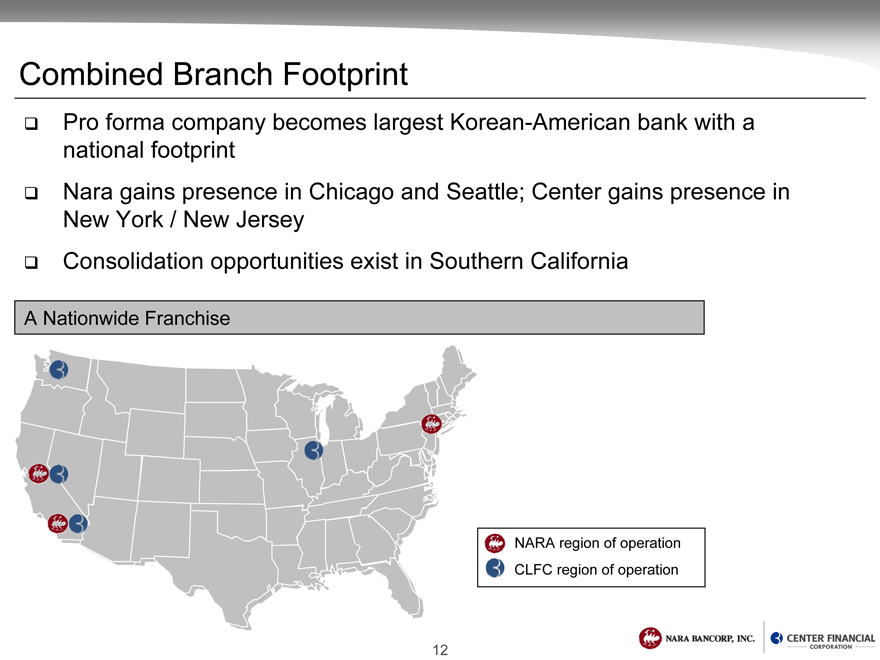
Combined Branch Footprint
Pro forma company becomes largest Korean-American bank with a national footprint
Nara gains presence in Chicago and Seattle; Center gains presence in New York / New Jersey
Consolidation opportunities exist in Southern California
A Nationwide Franchise
NARA region of operation CLFC region of operation
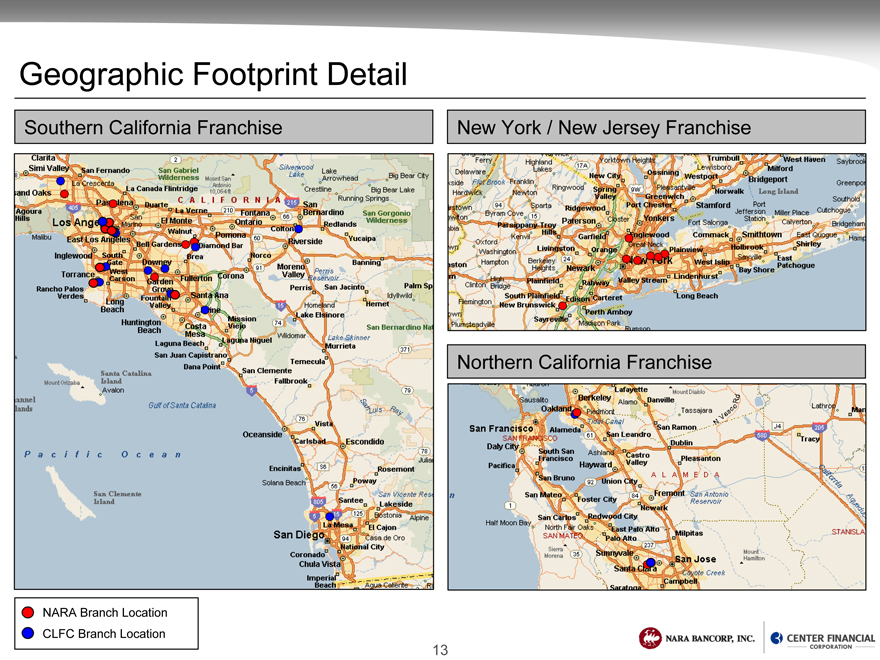
Geographic Footprint Detail
Southern California Franchise
New York / New Jersey Franchise
Northern California Franchise
NARA Branch Location CLFC Branch Location
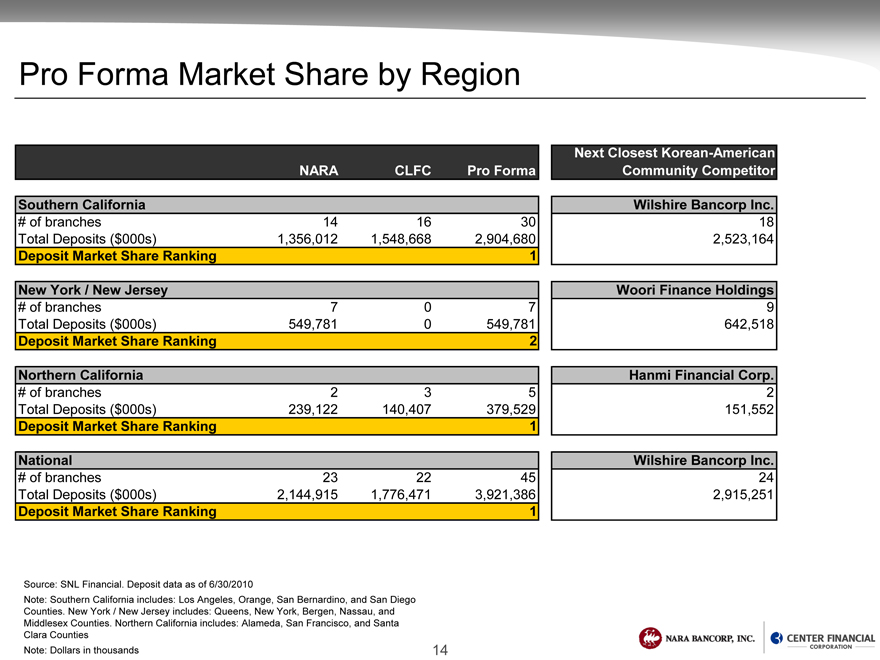
Pro Forma Market Share by Region
Next Closest Korean-American
NARA CLFC Pro Forma Community Competitor
Southern California Wilshire Bancorp Inc.
# of branches 14 16 30 18
Total Deposits ($000s) 1,356,012 1,548,668 2,904,680 2,523,164
Deposit Market Share Ranking 1
New York / New Jersey Woori Finance Holdings
# of branches 7 0 7 9
Total Deposits ($000s) 549,781 0 549,781 642,518
Deposit Market Share Ranking 2
Northern California Hanmi Financial Corp.
# of branches 2 3 5 2
Total Deposits ($000s) 239,122 140,407 379,529 151,552
Deposit Market Share Ranking 1
National Wilshire Bancorp Inc.
# of branches 23 22 45 24
Total Deposits ($000s) 2,144,915 1,776,471 3,921,386 2,915,251
Deposit Market Share Ranking 1
Source: SNL Financial. Deposit data as of 6/30/2010
Note: Southern California includes: Los Angeles, Orange, San Bernardino, and San Diego Counties. New York / New Jersey includes: Queens, New York, Bergen, Nassau, and Middlesex Counties. Northern California includes: Alameda, San Francisco, and Santa Clara Counties Note: Dollars in thousands
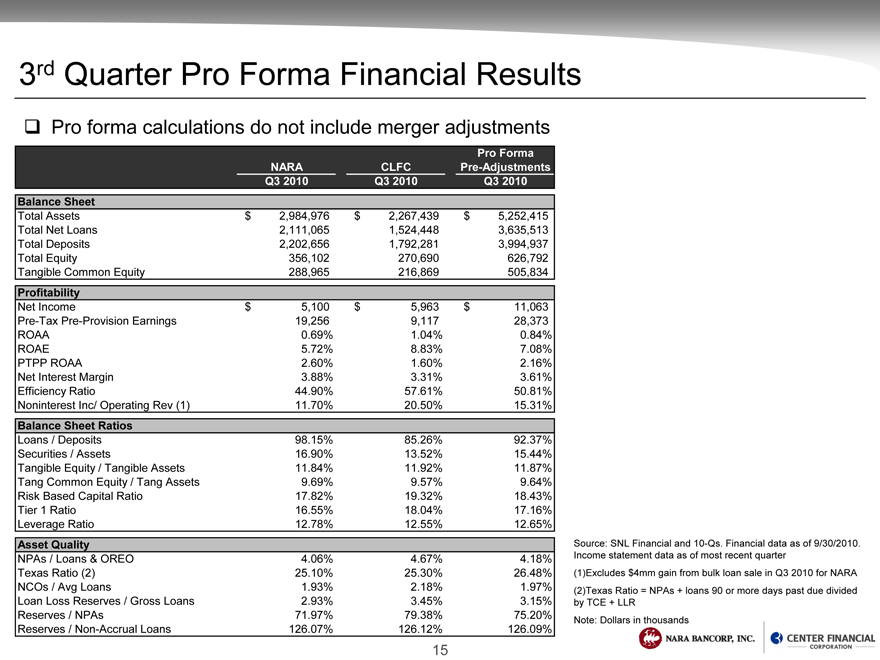
3rd Quarter Pro Forma Financial Results
Pro forma calculations do not include merger adjustments
Pro Forma
NARA CLFC Pre-Adjustments
Q3 2010 Q3 2010 Q3 2010
Balance Sheet
Total Assets $ 2,984,976 $ 2,267,439 $ 5,252,415
Total Net Loans 2,111,065 1,524,448 3,635,513
Total Deposits 2,202,656 1,792,281 3,994,937
Total Equity 356,102 270,690 626,792
Tangible Common Equity 288,965 216,869 505,834
Profitability
Net Income $ 5,100 $ 5,963 $ 11,063
Pre-Tax Pre-Provision Earnings 19,256 9,117 28,373
ROAA 0.69% 1.04% 0.84%
ROAE 5.72% 8.83% 7.08%
PTPP ROAA 2.60% 1.60% 2.16%
Net Interest Margin 3.88% 3.31% 3.61%
Efficiency Ratio 44.90% 57.61% 50.81%
Noninterest Inc/ Operating Rev (1) 11.70% 20.50% 15.31%
Balance Sheet Ratios
Loans / Deposits 98.15% 85.26% 92.37%
Securities / Assets 16.90% 13.52% 15.44%
Tangible Equity / Tangible Assets 11.84% 11.92% 11.87%
Tang Common Equity / Tang Assets 9.69% 9.57% 9.64%
Risk Based Capital Ratio 17.82% 19.32% 18.43%
Tier 1 Ratio 16.55% 18.04% 17.16%
Leverage Ratio 12.78% 12.55% 12.65%
Asset Quality
NPAs / Loans & OREO 4.06% 4.67% 4.18%
Texas Ratio (2) 25.10% 25.30% 26.48%
NCOs / Avg Loans 1.93% 2.18% 1.97%
Loan Loss Reserves / Gross Loans 2.93% 3.45% 3.15%
Reserves / NPAs 71.97% 79.38% 75.20%
Reserves / Non-Accrual Loans 126.07% 126.12% 126.09%
Source: SNL Financial and 10-Qs. Financial data as of 9/30/2010. Income statement data as of most recent quarter (1) Excludes $4mm gain from bulk loan sale in Q3 2010 for NARA (2) Texas Ratio = NPAs + loans 90 or more days past due divided by TCE + LLR
Note: Dollars in thousands
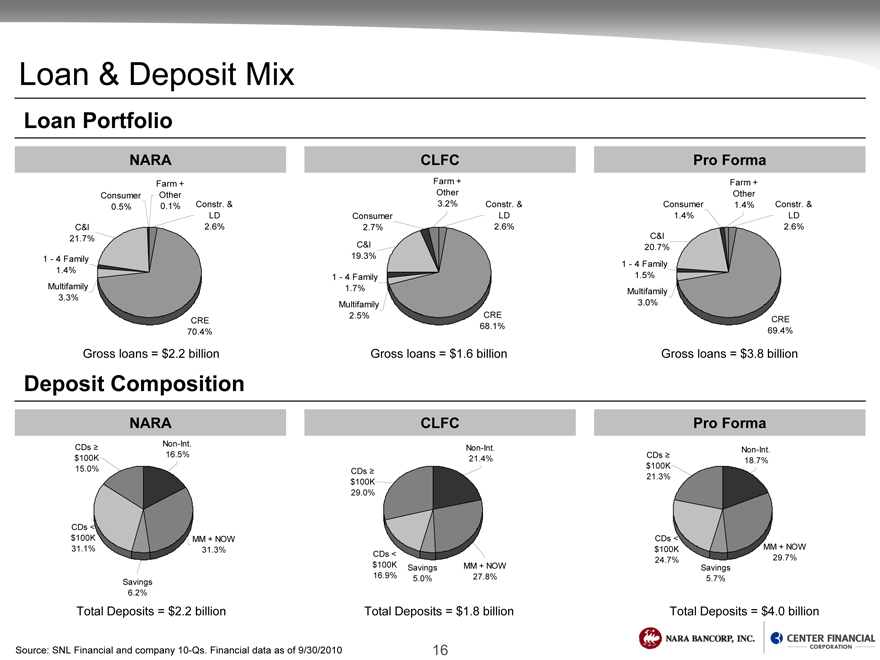
Loan & Deposit Mix
Loan Portfolio
NARA
Farm +
Consumer Other
LD
C&I 2.6%
21.7%
1.4%
Multifamily
3.3%
CRE
70.4%
Gross loans = $2.2 billion
CLFC
Farm +
Other
Consumer LD
C&I
19.3%
1.7%
Multifamily
68.1%
Gross loans = $1.6 billion
Pro Forma
Farm +
Other
Consumer 1.4% Constr. &
1.4% LD
2.6%
C&I
20.7%
1.5%
Multifamily
3.0%
CRE
69.4%
Gross loans = $3.8 billion
Deposit Composition
NARA
CDs³ Non-Int.
$100K 16.5%
15.0%
CDs <
$100K MM + NOW
Savings
6.2%
Total Deposits = $2.2 billion
CLFC
Non-Int.
21.4%
CDs³
$100K
29.0%
CDs <
$100K Savings MM + NOW
Total Deposits = $1.8 billion
Pro Forma
Non-Int.
CDs³ 18.7%
$100K
21.3%
CDs <
$100K MM + NOW
Savings
5.7%
Total Deposits = $4.0 billion
Source: SNL Financial and company 10-Qs. Financial data as of 9/30/2010
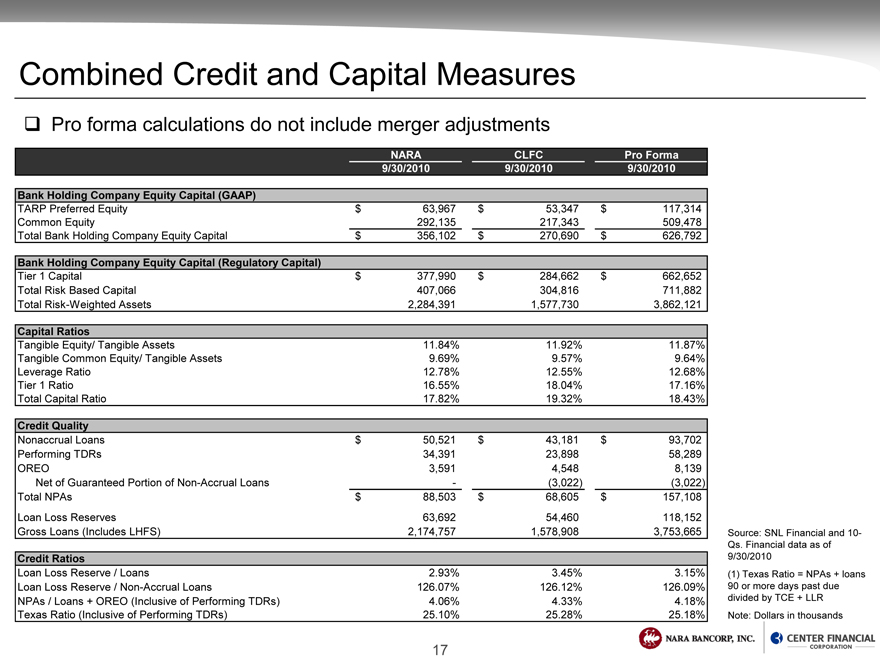
Combined Credit and Capital Measures
Pro forma calculations do not include merger adjustments
NARA CLFC Pro Forma
9/30/2010 9/30/2010 9/30/2010
Bank Holding Company Equity Capital (GAAP)
TARP Preferred Equity $ 63,967 $ 53,347 $ 117,314
Common Equity 292,135 217,343 509,478
Total Bank Holding Company Equity Capital $ 356,102 $ 270,690 $ 626,792
Bank Holding Company Equity Capital (Regulatory Capital)
Tier 1 Capital $ 377,990 $ 284,662 $ 662,652
Total Risk Based Capital 407,066 304,816 711,882
Total Risk-Weighted Assets 2,284,391 1,577,730 3,862,121
Capital Ratios
Tangible Equity/ Tangible Assets 11.84% 11.92% 11.87%
Tangible Common Equity/ Tangible Assets 9.69% 9.57% 9.64%
Leverage Ratio 12.78% 12.55% 12.68%
Tier 1 Ratio 16.55% 18.04% 17.16%
Total Capital Ratio 17.82% 19.32% 18.43%
Credit Quality
Nonaccrual Loans $ 50,521 $ 43,181 $ 93,702
Performing TDRs 34,391 23,898 58,289
OREO 3,591 4,548 8,139
Net of Guaranteed Portion of Non-Accrual Loans -(3,022)(3,022)
Total NPAs $ 88,503 $ 68,605 $ 157,108
Loan Loss Reserves 63,692 54,460 118,152
Gross Loans (Includes LHFS) 2,174,757 1,578,908 3,753,665
Credit Ratios
Loan Loss Reserve / Loans 2.93% 3.45% 3.15%
Loan Loss Reserve / Non-Accrual Loans 126.07% 126.12% 126.09%
NPAs / Loans + OREO (Inclusive of Performing TDRs) 4.06% 4.33% 4.18%
Texas Ratio (Inclusive of Performing TDRs) 25.10% 25.28% 25.18%
Source: SNL Financial and 10-Qs. Financial data as of 9/30/2010 (1) Texas Ratio = NPAs + loans 90 or more days past due divided by TCE + LLR
Note: Dollars in thousands
Pro Forma Financial Impact
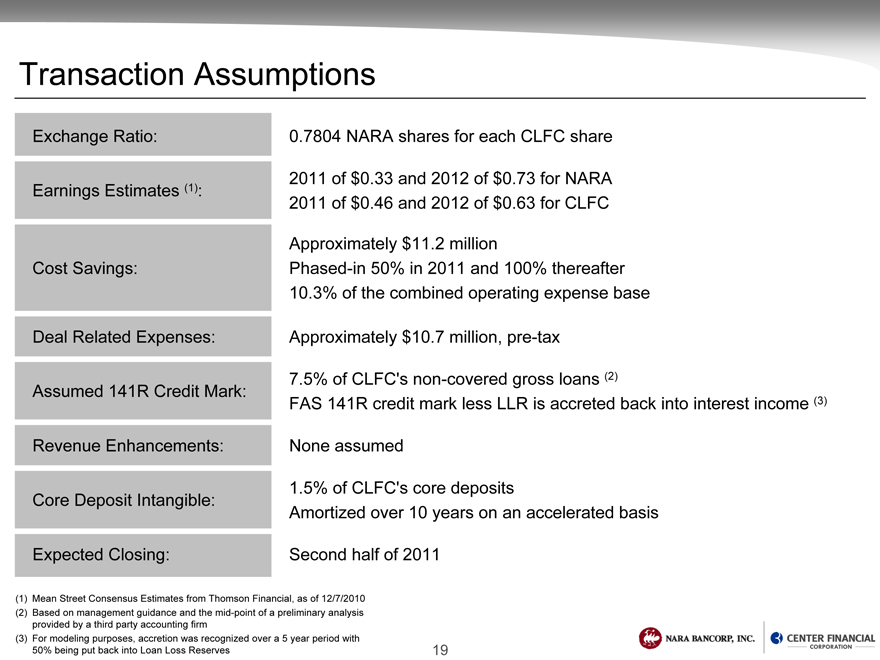
Transaction Assumptions
Exchange Ratio: 0.7804 NARA shares for each CLFC share
2011 of $0.33 and 2012 of $0.73 for NARA
Earnings Estimates (1):
2011 of $0.46 and 2012 of $0.63 for CLFC
Approximately $11.2 million
Cost Savings: Phased-in 50% in 2011 and 100% thereafter
10.3% | of the combined operating expense base |
Deal Related Expenses: Approximately $10.7 million, pre-tax
7.5% | of CLFC’s non-covered gross loans (2) |
Assumed 141R Credit Mark:
FAS 141R credit mark less LLR is accreted back into interest income (3)
Revenue Enhancements: None assumed
1.5% | of CLFC’s core deposits |
Core Deposit Intangible:
Amortized over 10 years on an accelerated basis
Expected Closing: Second half of 2011
(1) Mean Street Consensus Estimates from Thomson Financial, as of 12/7/2010 (2) Based on management guidance and the mid-point of a preliminary analysis provided by a third party accounting firm (3) For modeling purposes, accretion was recognized over a 5 year period with 50% being put back into Loan Loss Reserves
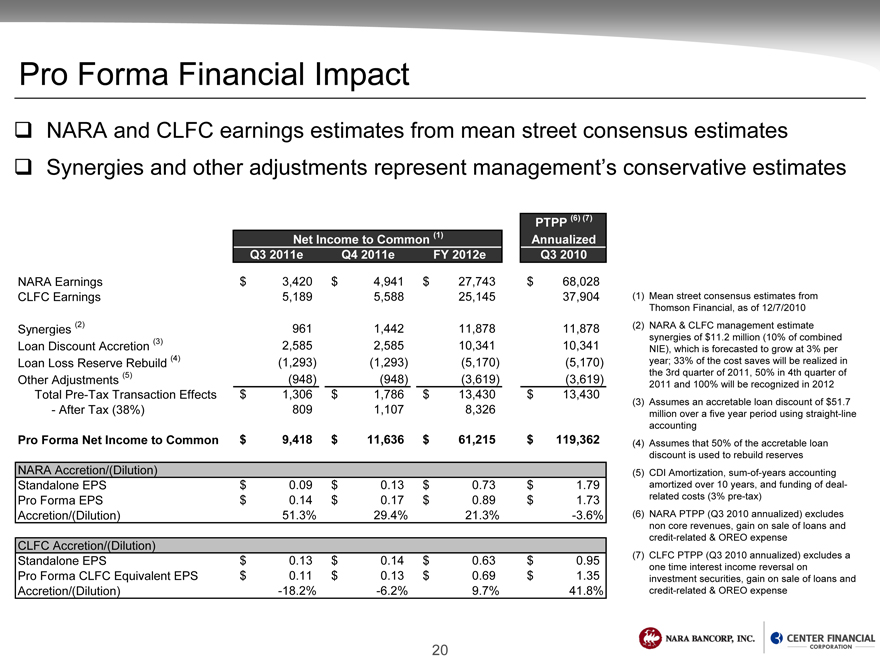
Pro Forma Financial Impact
NARA and CLFC earnings estimates from mean street consensus estimates
Synergies and other adjustments represent management’s conservative estimates
PTPP (6) (7)
Net Income to Common (1) Annualized
Q3 2011e Q4 2011e FY 2012e Q3 2010
NARA Earnings $ 3,420 $ 4,941 $ 27,743 $ 68,028
CLFC Earnings 5,189 5,588 25,145 37,904
Synergies (2) 961 1,442 11,878 11,878
Loan Discount Accretion (3) 2,585 2,585 10,341 10,341
Loan Loss Reserve Rebuild (4)(1,293)(1,293)(5,170)(5,170)
Other Adjustments (5)(948)(948)(3,619)(3,619)
Total Pre-Tax Transaction Effects $ 1,306 $ 1,786 $ 13,430 $ 13,430
- After Tax (38%) 809 1,107 8,326
Pro Forma Net Income to Common $ 9,418 $ 11,636 $ 61,215 $ 119,362
NARA Accretion/(Dilution)
Standalone EPS $ 0.09 $ 0.13 $ 0.73 $ 1.79
Pro Forma EPS $ 0.14 $ 0.17 $ 0.89 $ 1.73
Accretion/(Dilution) 51.3% 29.4% 21.3% -3.6%
CLFC Accretion/(Dilution)
Standalone EPS $ 0.13 $ 0.14 $ 0.63 $ 0.95
Pro Forma CLFC Equivalent EPS $ 0.11 $ 0.13 $ 0.69 $ 1.35
Accretion/(Dilution) -18.2% -6.2% 9.7% 41.8%
(1) | Mean street consensus estimates from Thomson Financial, as of 12/7/2010 |
(2) NARA & CLFC management estimate synergies of $11.2 million (10% of combined NIE), which is forecasted to grow at 3% per year; 33% of the cost saves will be realized in the 3rd quarter of 2011, 50% in 4th quarter of 2011 and 100% will be recognized in 2012
(3) | Assumes an accretable loan discount of $51.7 million over a five year period using straight-line accounting |
(4) | Assumes that 50% of the accretable loan discount is used to rebuild reserves |
(5) | CDI Amortization, sum-of-years accounting amortized over 10 years, and funding of deal-related costs (3% pre-tax) |
(6) NARA PTPP (Q3 2010 annualized) excludes non core revenues, gain on sale of loans and credit-related & OREO expense
(7) CLFC PTPP (Q3 2010 annualized) excludes a one time interest income reversal on investment securities, gain on sale of loans and credit-related & OREO expense
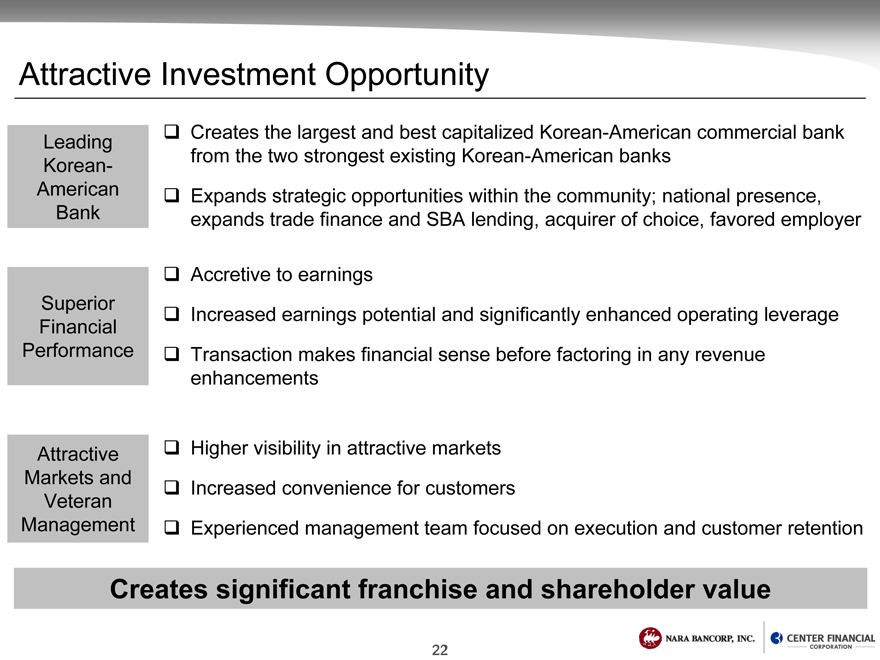
Attractive Investment Opportunity
Attractive Investment Opportunity
Leading Creates the largest and best capitalized Korean-American commercial bank
Korean- from the two strongest existing Korean-American banks
American Expands strategic opportunities within the community; national presence,
Bank expands trade finance and SBA lending, acquirer of choice, favored employer
Accretive to earnings
Superior Increased earnings potential and significantly enhanced operating leverage
Financial
Performance Transaction makes financial sense before factoring in any revenue
enhancements
Attractive Higher visibility in attractive markets
Markets and Increased convenience for customers
Veteran
Management Experienced management team focused on execution and customer retention
Creates significant franchise and shareholder value
Appendix
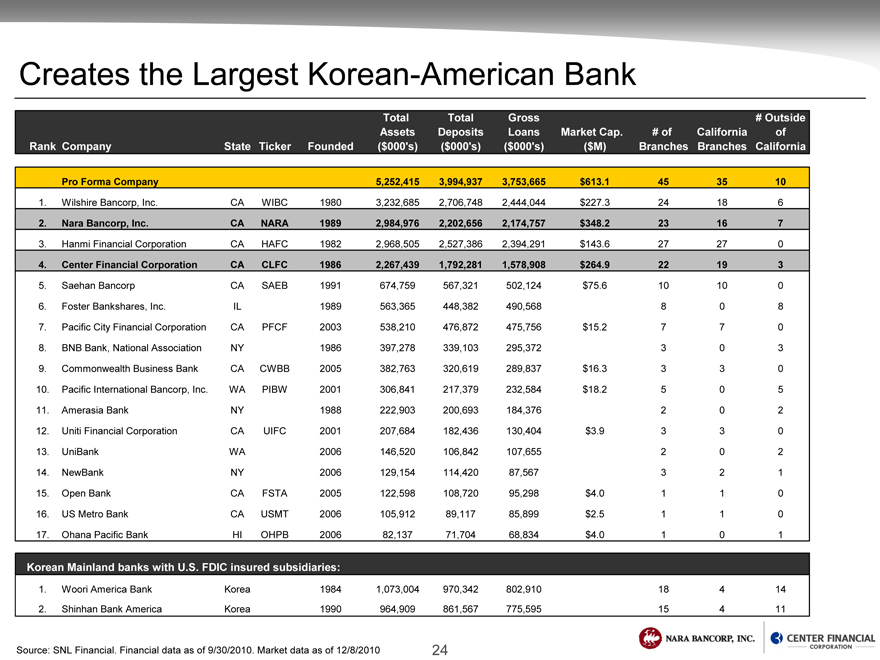
Creates the Largest Korean-American Bank
Total Total Gross # Outside
Assets Deposits Loans Market Cap. # of California of
Rank Company State Ticker Founded($000’s)($000’s)($000’s)($M) Branches Branches California
Pro Forma Company 5,252,415 3,994,937 3,753,665 $613.1 45 35 10
1. | Wilshire Bancorp, Inc. CA WIBC 1980 3,232,685 2,706,748 2,444,044 $227.3 24 18 6 |
2. | Nara Bancorp, Inc. CA NARA 1989 2,984,976 2,202,656 2,174,757 $348.2 23 16 7 |
3. | Hanmi Financial Corporation CA HAFC 1982 2,968,505 2,527,386 2,394,291 $143.6 27 27 0 |
4. | Center Financial Corporation CA CLFC 1986 2,267,439 1,792,281 1,578,908 $264.9 22 19 3 |
5. | Saehan Bancorp CA SAEB 1991 674,759 567,321 502,124 $75.6 10 10 0 |
6. | Foster Bankshares, Inc. IL 1989 563,365 448,382 490,568 8 0 8 |
7. | Pacific City Financial Corporation CA PFCF 2003 538,210 476,872 475,756 $15.2 7 7 0 |
8. | BNB Bank, National Association NY 1986 397,278 339,103 295,372 3 0 3 |
9. | Commonwealth Business Bank CA CWBB 2005 382,763 320,619 289,837 $16.3 3 3 0 |
10. | Pacific International Bancorp, Inc. WA PIBW 2001 306,841 217,379 232,584 $18.2 5 0 5 |
11. | Amerasia Bank NY 1988 222,903 200,693 184,376 2 0 2 |
12. | Uniti Financial Corporation CA UIFC 2001 207,684 182,436 130,404 $3.9 3 3 0 |
13. | UniBank WA 2006 146,520 106,842 107,655 2 0 2 |
14. | NewBank NY 2006 129,154 114,420 87,567 3 2 1 |
15. | Open Bank CA FSTA 2005 122,598 108,720 95,298 $4.0 1 1 0 |
16. | US Metro Bank CA USMT 2006 105,912 89,117 85,899 $2.5 1 1 0 |
17. | Ohana Pacific Bank HI OHPB 2006 82,137 71,704 68,834 $4.0 1 0 1 |
Korean Mainland banks with U.S. FDIC insured subsidiaries:
1. | Woori America Bank Korea 1984 1,073,004 970,342 802,910 18 4 14 |
2. | Shinhan Bank America Korea 1990 964,909 861,567 775,595 15 4 11 |
Source: SNL Financial. Financial data as of 9/30/2010. Market data as of 12/8/2010
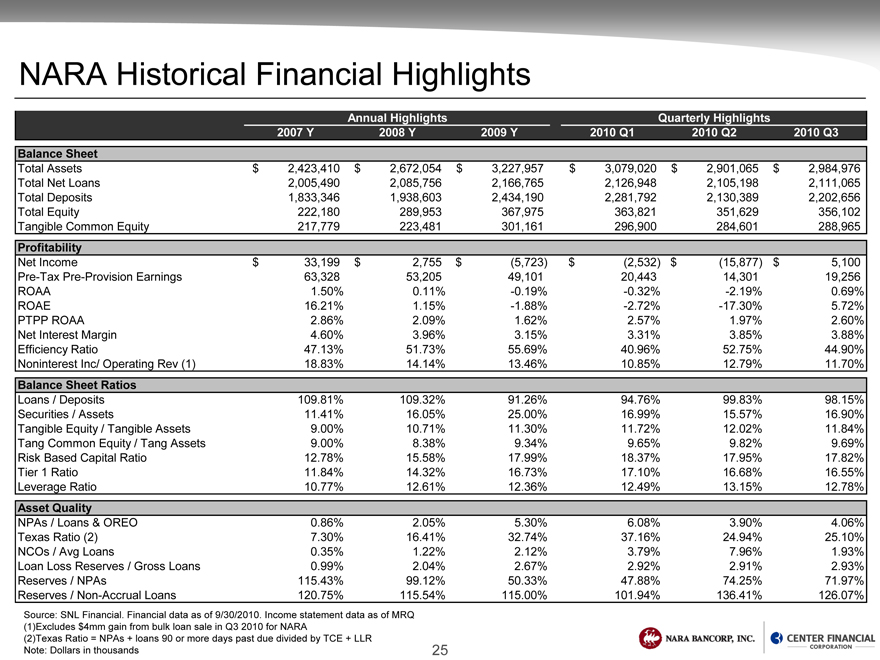
NARA Historical Financial Highlights
Annual Highlights Quarterly Highlights
2007 Y 2008 Y 2009 Y 2010 Q1 2010 Q2 2010 Q3
Balance Sheet
Total Assets $ 2,423,410 $ 2,672,054 $ 3,227,957 $ 3,079,020 $ 2,901,065 $ 2,984,976
Total Net Loans 2,005,490 2,085,756 2,166,765 2,126,948 2,105,198 2,111,065
Total Deposits 1,833,346 1,938,603 2,434,190 2,281,792 2,130,389 2,202,656
Total Equity 222,180 289,953 367,975 363,821 351,629 356,102
Tangible Common Equity 217,779 223,481 301,161 296,900 284,601 288,965
Profitability
Net Income $ 33,199 $ 2,755 $(5,723) $ (2,532) $(15,877) $ 5,100
Pre-Tax Pre-Provision Earnings 63,328 53,205 49,101 20,443 14,301 19,256
ROAA 1.50% 0.11% -0.19% -0.32% -2.19% 0.69%
ROAE 16.21% 1.15% -1.88% -2.72% -17.30% 5.72%
PTPP ROAA 2.86% 2.09% 1.62% 2.57% 1.97% 2.60%
Net Interest Margin 4.60% 3.96% 3.15% 3.31% 3.85% 3.88%
Efficiency Ratio 47.13% 51.73% 55.69% 40.96% 52.75% 44.90%
Noninterest Inc/ Operating Rev (1) 18.83% 14.14% 13.46% 10.85% 12.79% 11.70%
Balance Sheet Ratios
Loans / Deposits 109.81% 109.32% 91.26% 94.76% 99.83% 98.15%
Securities / Assets 11.41% 16.05% 25.00% 16.99% 15.57% 16.90%
Tangible Equity / Tangible Assets 9.00% 10.71% 11.30% 11.72% 12.02% 11.84%
Tang Common Equity / Tang Assets 9.00% 8.38% 9.34% 9.65% 9.82% 9.69%
Risk Based Capital Ratio 12.78% 15.58% 17.99% 18.37% 17.95% 17.82%
Tier 1 Ratio 11.84% 14.32% 16.73% 17.10% 16.68% 16.55%
Leverage Ratio 10.77% 12.61% 12.36% 12.49% 13.15% 12.78%
Asset Quality
NPAs / Loans & OREO 0.86% 2.05% 5.30% 6.08% 3.90% 4.06%
Texas Ratio (2) 7.30% 16.41% 32.74% 37.16% 24.94% 25.10%
NCOs / Avg Loans 0.35% 1.22% 2.12% 3.79% 7.96% 1.93%
Loan Loss Reserves / Gross Loans 0.99% 2.04% 2.67% 2.92% 2.91% 2.93%
Reserves / NPAs 115.43% 99.12% 50.33% 47.88% 74.25% 71.97%
Reserves / Non-Accrual Loans 120.75% 115.54% 115.00% 101.94% 136.41% 126.07%
Source: SNL Financial. Financial data as of 9/30/2010. Income statement data as of MRQ (1) Excludes $4mm gain from bulk loan sale in Q3 2010 for NARA
(2) Texas Ratio = NPAs + loans 90 or more days past due divided by TCE + LLR
Note: Dollars in thousands
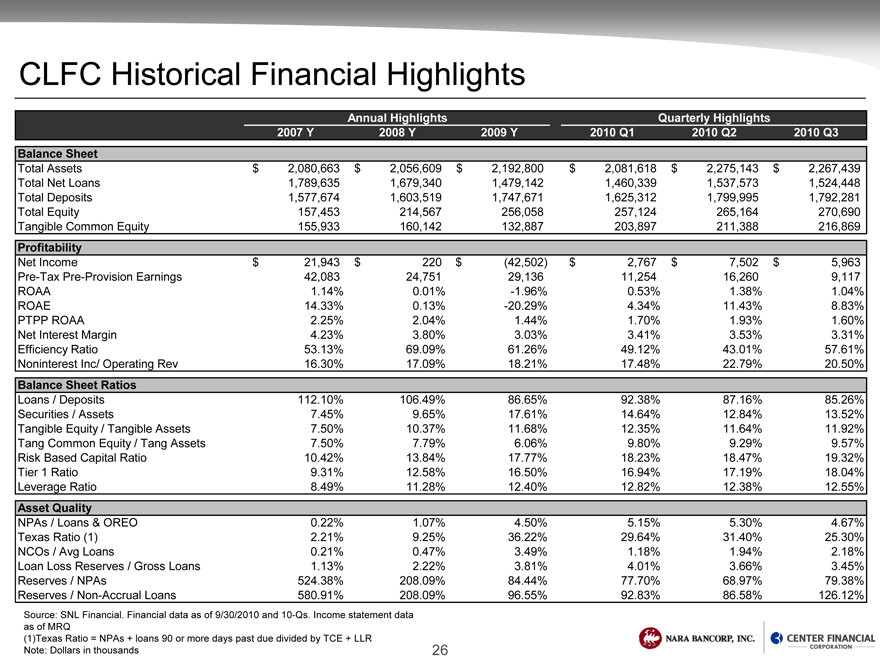
CLFC Historical Financial Highlights
Annual Highlights Quarterly Highlights
2007 Y 2008 Y 2009 Y 2010 Q1 2010 Q2 2010 Q3
Balance Sheet
Total Assets $ 2,080,663 $ 2,056,609 $ 2,192,800 $ 2,081,618 $ 2,275,143 $ 2,267,439
Total Net Loans 1,789,635 1,679,340 1,479,142 1,460,339 1,537,573 1,524,448
Total Deposits 1,577,674 1,603,519 1,747,671 1,625,312 1,799,995 1,792,281
Total Equity 157,453 214,567 256,058 257,124 265,164 270,690
Tangible Common Equity 155,933 160,142 132,887 203,897 211,388 216,869
Profitability
Net Income $ 21,943 $ 220 $(42,502) $ 2,767 $ 7,502 $ 5,963
Pre-Tax Pre-Provision Earnings 42,083 24,751 29,136 11,254 16,260 9,117
ROAA 1.14% 0.01% -1.96% 0.53% 1.38% 1.04%
ROAE 14.33% 0.13% -20.29% 4.34% 11.43% 8.83%
PTPP ROAA 2.25% 2.04% 1.44% 1.70% 1.93% 1.60%
Net Interest Margin 4.23% 3.80% 3.03% 3.41% 3.53% 3.31%
Efficiency Ratio 53.13% 69.09% 61.26% 49.12% 43.01% 57.61%
Noninterest Inc/ Operating Rev 16.30% 17.09% 18.21% 17.48% 22.79% 20.50%
Balance Sheet Ratios
Loans / Deposits 112.10% 106.49% 86.65% 92.38% 87.16% 85.26%
Securities / Assets 7.45% 9.65% 17.61% 14.64% 12.84% 13.52%
Tangible Equity / Tangible Assets 7.50% 10.37% 11.68% 12.35% 11.64% 11.92%
Tang Common Equity / Tang Assets 7.50% 7.79% 6.06% 9.80% 9.29% 9.57%
Risk Based Capital Ratio 10.42% 13.84% 17.77% 18.23% 18.47% 19.32%
Tier 1 Ratio 9.31% 12.58% 16.50% 16.94% 17.19% 18.04%
Leverage Ratio 8.49% 11.28% 12.40% 12.82% 12.38% 12.55%
Asset Quality
NPAs / Loans & OREO 0.22% 1.07% 4.50% 5.15% 5.30% 4.67%
Texas Ratio (1) 2.21% 9.25% 36.22% 29.64% 31.40% 25.30%
NCOs / Avg Loans 0.21% 0.47% 3.49% 1.18% 1.94% 2.18%
Loan Loss Reserves / Gross Loans 1.13% 2.22% 3.81% 4.01% 3.66% 3.45%
Reserves / NPAs 524.38% 208.09% 84.44% 77.70% 68.97% 79.38%
Reserves / Non-Accrual Loans 580.91% 208.09% 96.55% 92.83% 86.58% 126.12%
Source: SNL Financial. Financial data as of 9/30/2010 and 10-Qs. Income statement data as of MRQ
(1)Texas Ratio = NPAs + loans 90 or more days past due divided by TCE + LLR
Note: Dollars in thousands