Exhibit 99.1

September 2013
Highlights YTD 2013
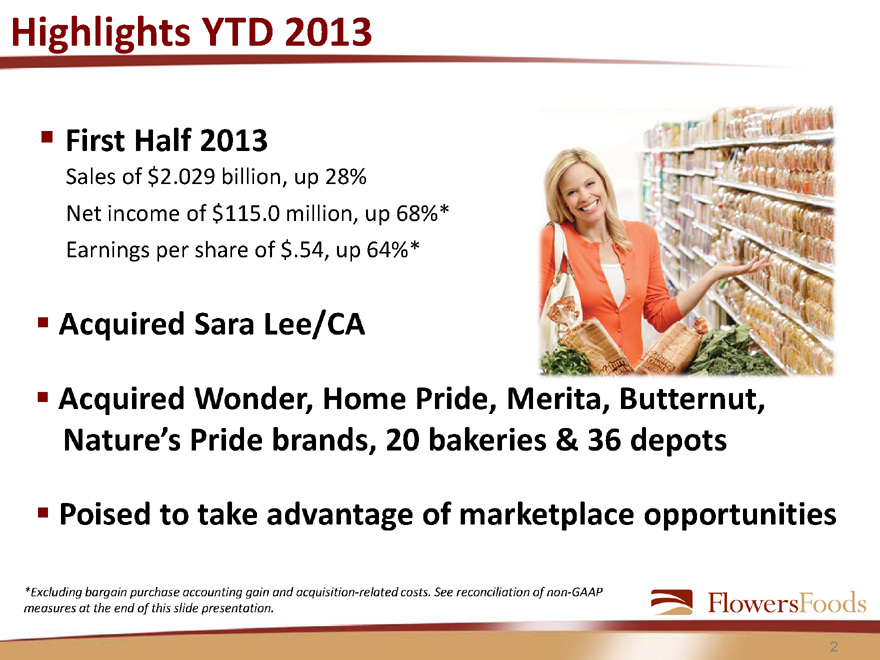
First Half 2013
Sales of $2.029 billion, up 28%
Net income of $115.0 million, up 68%* Earnings per share of $.54, up 64%*
Acquired Sara Lee/CA
Acquired Wonder, Home Pride, Merita, Butternut, Nature’s Pride brands, 20 bakeries & 36 depots
Poised to take advantage of marketplace opportunities
*Excluding bargain purchase accounting gain and acquisition-related costs. See reconciliation of non-GAAP measures at the end of this slide presentation.
2
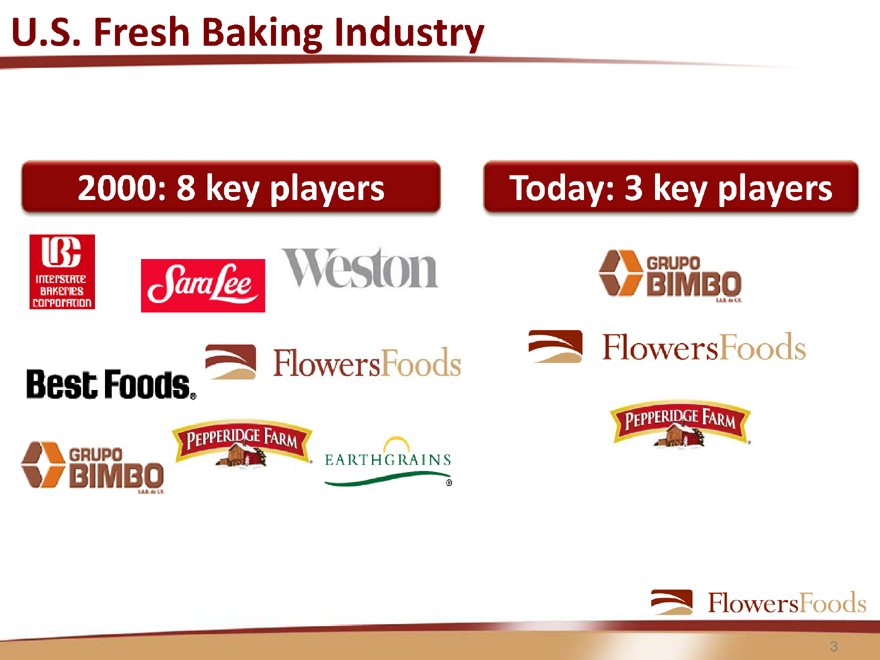
U.S. Fresh Baking Industry
2000: 8 key players
Today: 3 key players
3
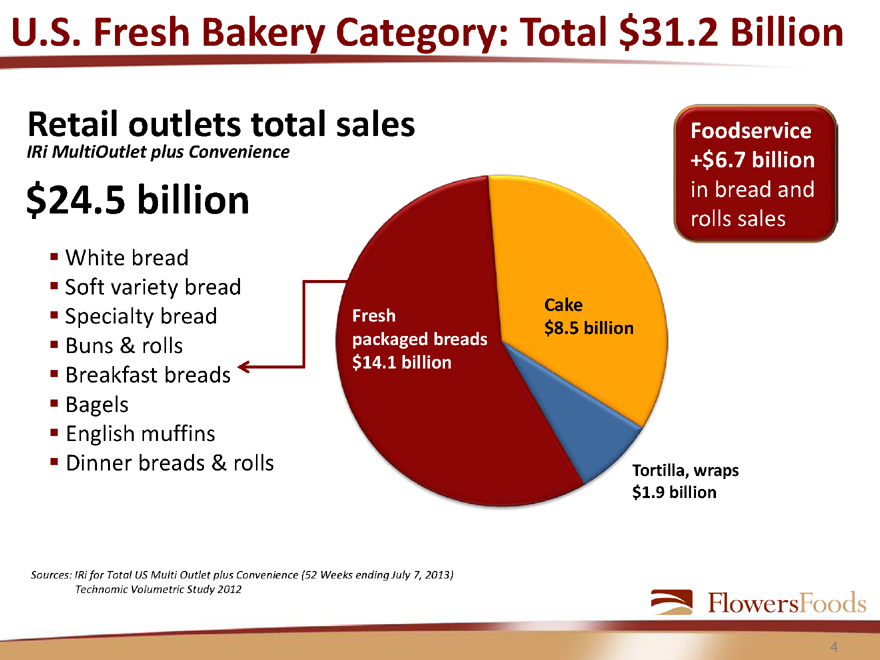
U.S. Fresh Bakery Category: Total $31.2 Billion
Retail outlets total sales
IRi MultiOutlet plus Convenience
$24.5 billion
White bread Soft variety bread Specialty bread Buns & rolls
Breakfast breads
Bagels
English muffins Dinner breads & rolls
Foodservice
+$6.7 billion in bread and rolls sales
Fresh packaged breads
$14.1 billion
Cake
$8.5 billion
Tortilla, wraps
$1.9 billion
Sources: IRi for Total US Multi Outlet plus Convenience (52 Weeks ending July 7, 2013) Technomic Volumetric Study 2012
4
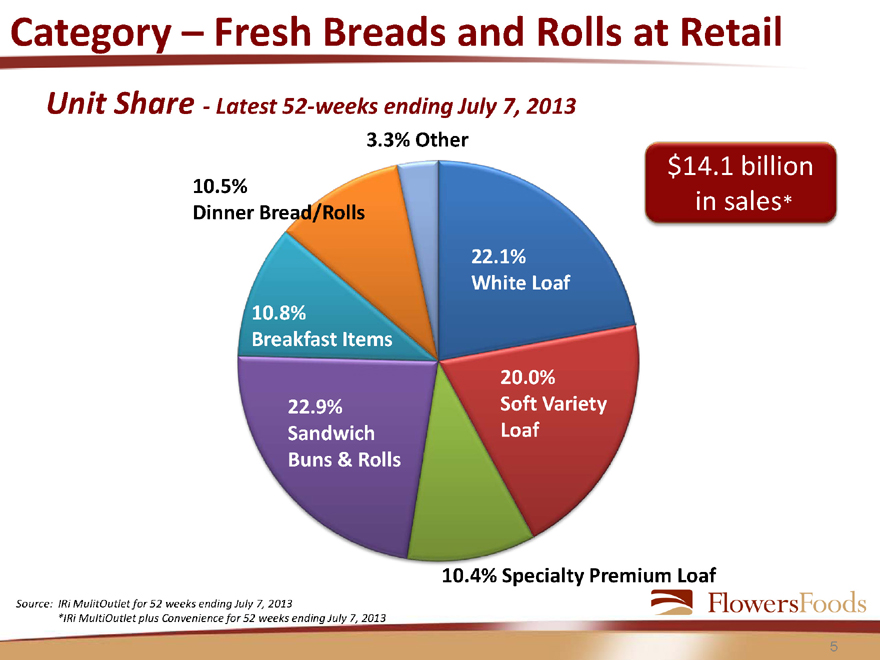
Category – Fresh Breads and Rolls at Retail
Unit Share - Latest 52-weeks ending July 7, 2013
3.3% Other
$14.1 billion in sales*
10.5%
Dinner Bread/Rolls
22.1% White Loaf
10.8%
Breakfast Items
22.9% Sandwich Buns & Rolls
20.0% Soft Variety Loaf
10.4% Specialty Premium Loaf
Source: IRi MulitOutlet for 52 weeks ending July 7, 2013
*IRi MultiOutlet plus Convenience for 52 weeks ending July 7, 2013
5
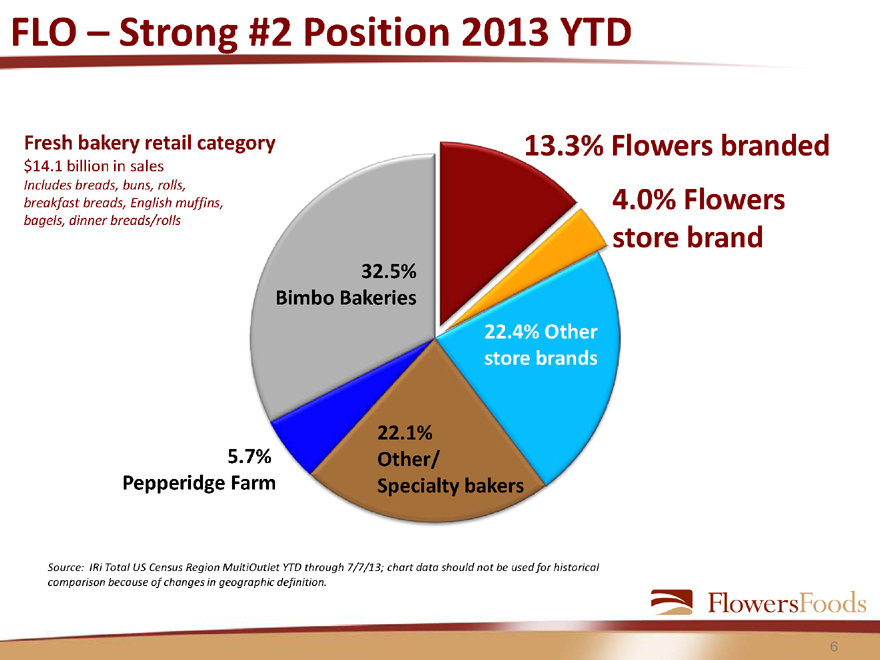
FLO – Strong #2 Position 2013 YTD
Fresh bakery retail category
$14.1 billion in sales
Includes breads, buns, rolls, breakfast breads, English muffins, bagels, dinner breads/rolls
13.3% Flowers branded
4.0% Flowers store brand
32.5%
Bimbo Bakeries
22.4% Other store brands
5.7%
Pepperidge Farm
22.1% Other/
Specialty bakers
Source: IRi Total US Census Region MultiOutlet YTD through 7/7/13; chart data should not be used for historical comparison because of changes in geographic definition.
6
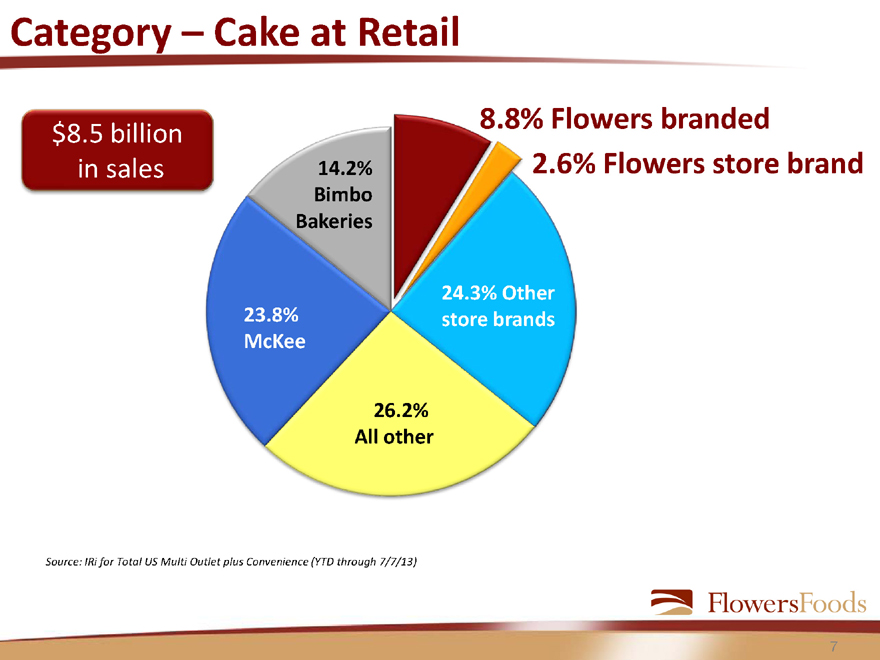
Category – Cake at Retail
$8.5 billion in sales
8.8% Flowers branded
2.6% Flowers store brand
14.2% Bimbo Bakeries
23.8% McKee
24.3% Other store brands
26.2%
All other
Source: IRi for Total US Multi Outlet plus Convenience (YTD through 7/7/13)
7
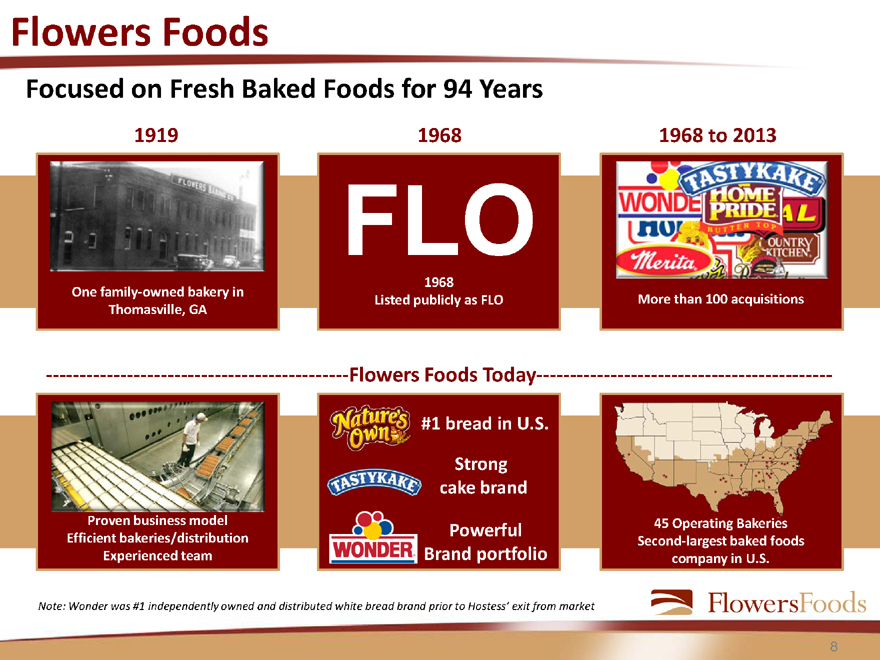
Flowers Foods
Focused on Fresh Baked Foods for 94 Years
1919
One family-owned bakery in Thomasville, GA
1968
1968 Listed publicly as FLO
1968 to 2013
More than 100 acquisitions
Flowers Foods Today
Proven business model Efficient bakeries/distribution Experienced team
#1 bread in U.S. Strong cake brand Powerful Brand portfolio
45 Operating Bakeries Second-largest baked foods company in U.S.
Note: Wonder was #1 independently owned and distributed white bread brand prior to Hostess’ exit from market
8
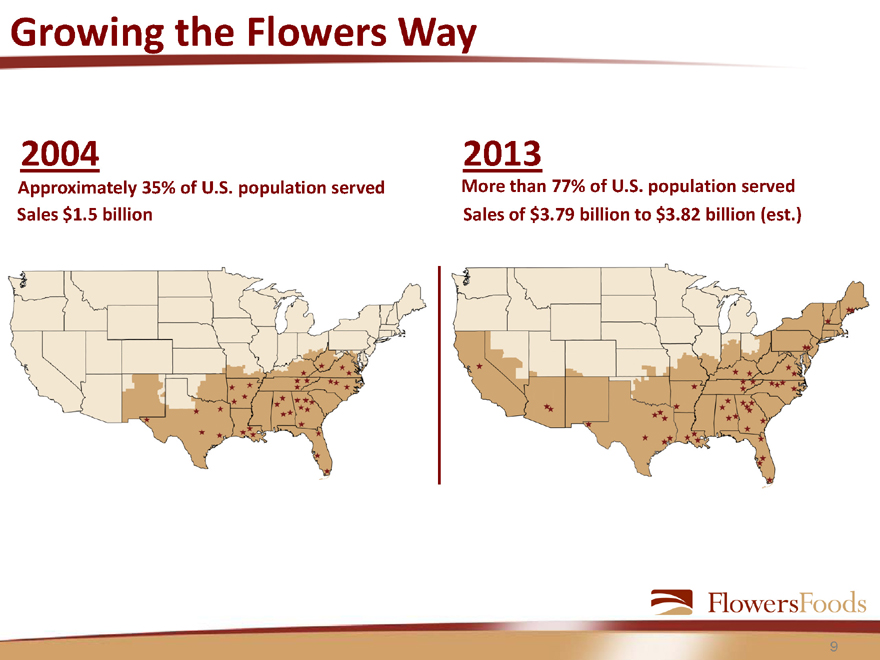
Growing the Flowers Way
2004
Approximately 35% of U.S. population served Sales $1.5 billion
2013
More than 77% of U.S. population served Sales of $3.79 billion to $3.82 billion (est.)
9
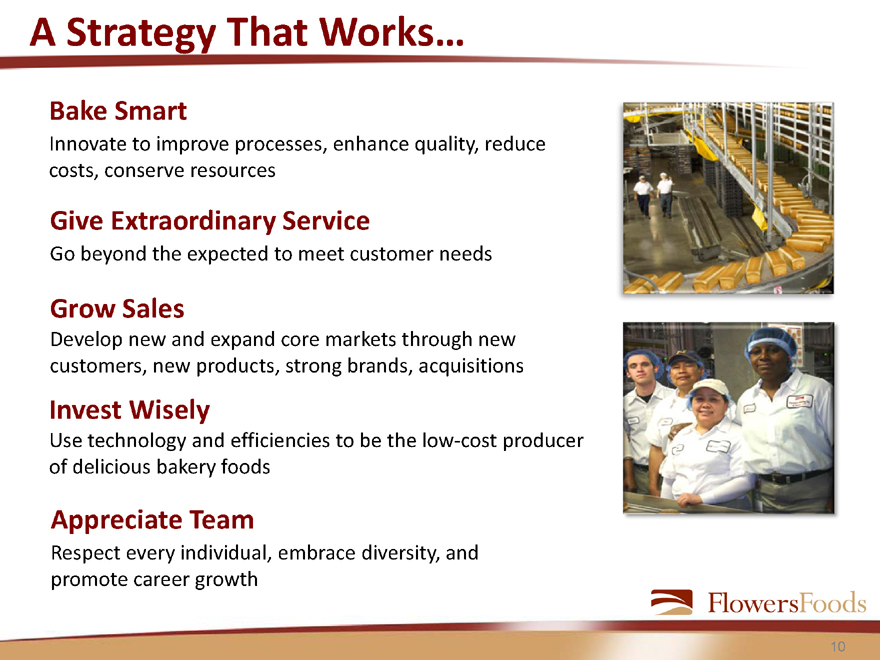
A Strategy That Works…
Bake Smart
Innovate to improve processes, enhance quality, reduce costs, conserve resources
Give Extraordinary Service
Go beyond the expected to meet customer needs
Grow Sales
Develop new and expand core markets through new customers, new products, strong brands, acquisitions
Invest Wisely
Use technology and efficiencies to be the low-cost producer of delicious bakery foods
Appreciate Team
Respect every individual, embrace diversity, and promote career growth
10
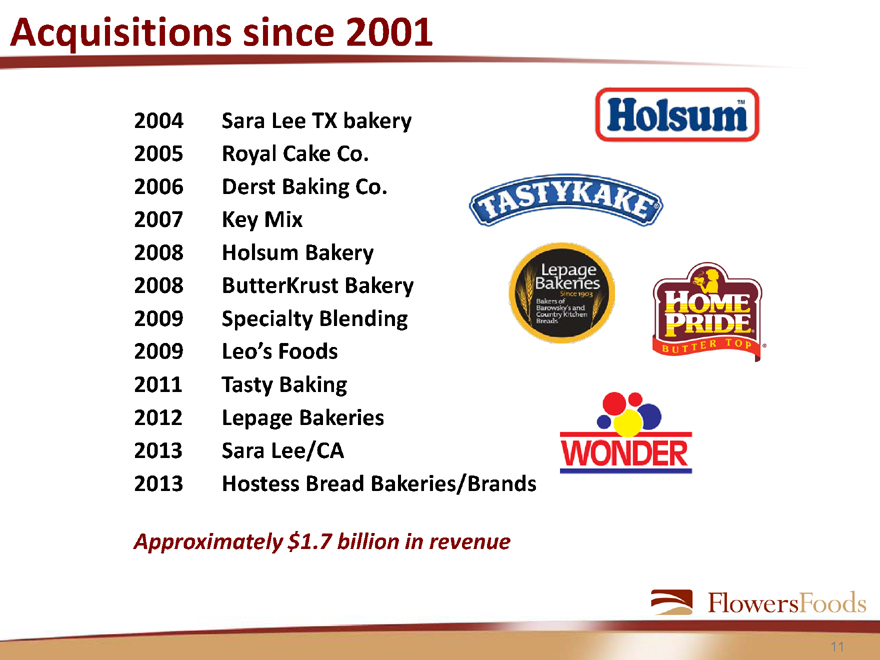
Acquisitions since 2001
2004 Sara Lee TX bakery
2005 Royal Cake Co.
2006 Derst Baking Co.
2007 Key Mix
2008 Holsum Bakery
2008 ButterKrust Bakery
2009 Specialty Blending
2009 Leo’s Foods
2011 Tasty Baking
2012 Lepage Bakeries
2013 Sara Lee/CA
2013 Hostess Bread Bakeries/Brands
Approximately $1.7 billion in revenue
11
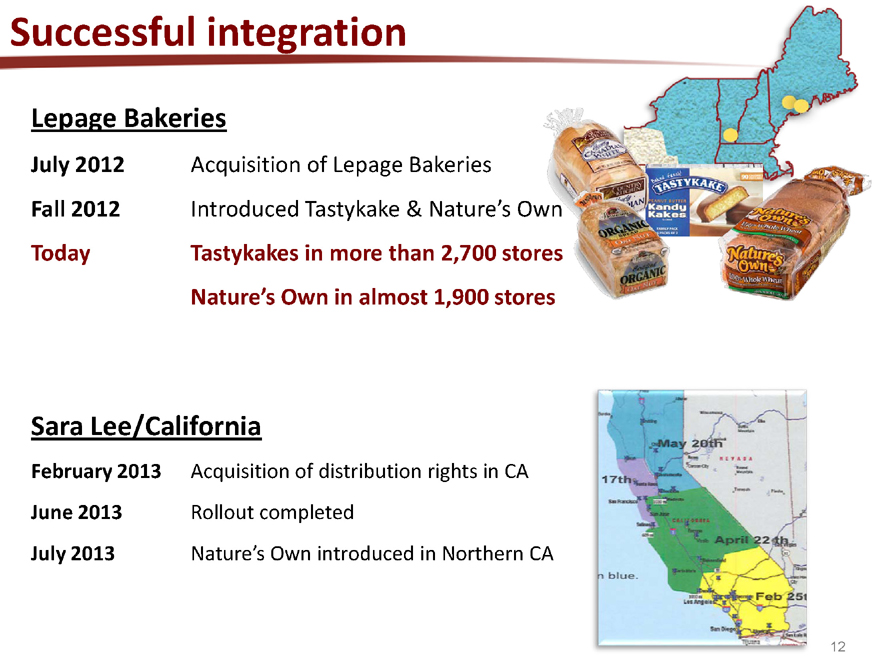
Successful integration
Lepage Bakeries
July 2012 Acquisition of Lepage Bakeries
Fall 2012 Introduced Tastykake & Nature’s Own
Today Tastykakes in more than 2,700 stores
Nature’s Own in almost 1,900 stores
Sara Lee/California
February 2013 Acquisition of distribution rights in CA
June 2013 Rollout completed
July 2013 Nature’s Own introduced in Northern CA
12
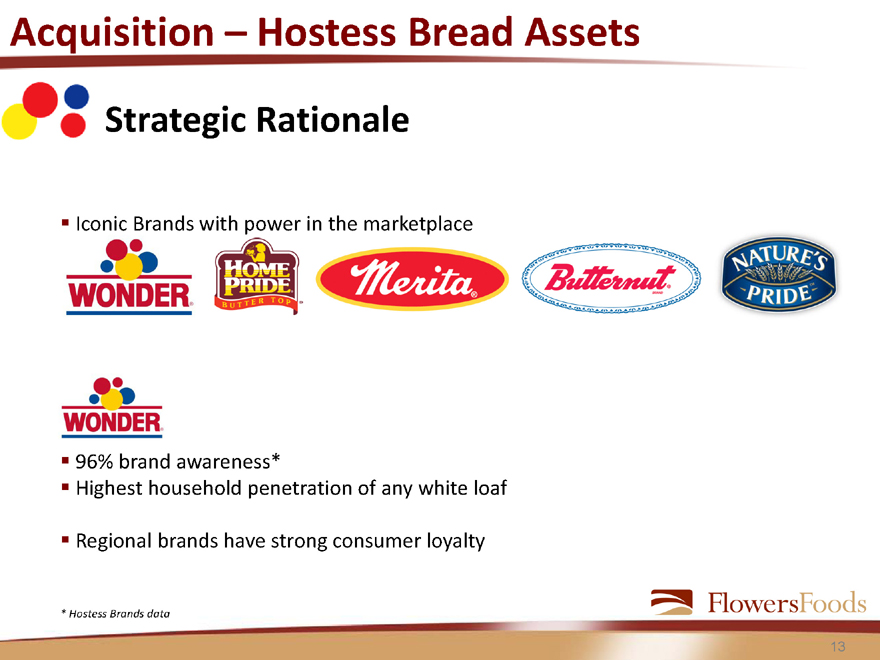
Acquisition – Hostess Bread Assets
Strategic Rationale
Iconic Brands with power in the marketplace
96% brand awareness*
Highest household penetration of any white loaf
Regional brands have strong consumer loyalty
* Hostess Brands data
13
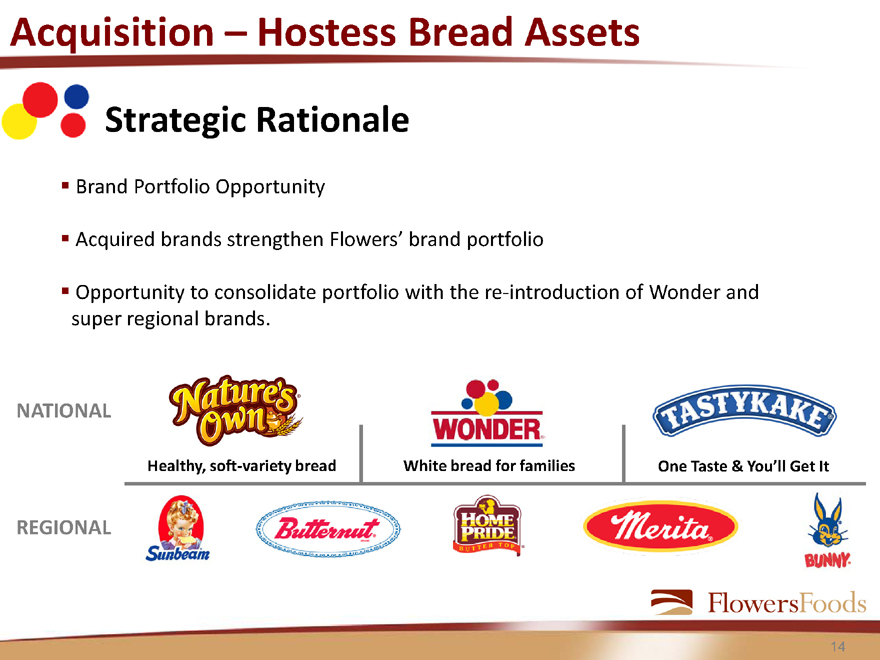
Acquisition – Hostess Bread Assets
Strategic Rationale
Brand Portfolio Opportunity
Acquired brands strengthen Flowers’ brand portfolio
Opportunity to consolidate portfolio with the re-introduction of Wonder and super regional brands.
NATIONAL
REGIONAL
Healthy, soft-variety bread
White bread for families
One Taste & You’ll Get It
14
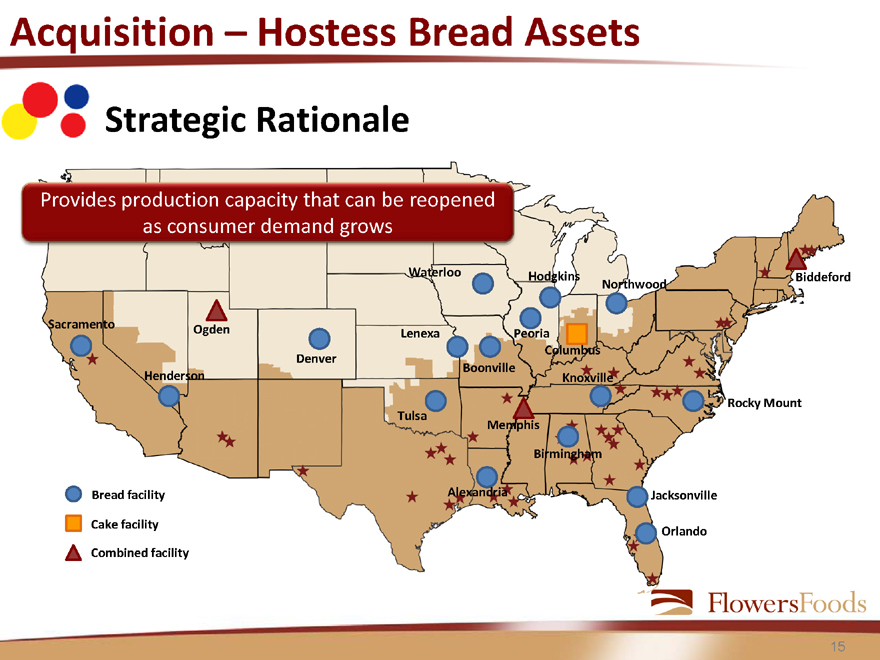
Acquisition – Hostess Bread Assets
Strategic Rationale
Provides production capacity that can be reopened as consumer demand grows
Bread facility
Cake facility Combined facility
15
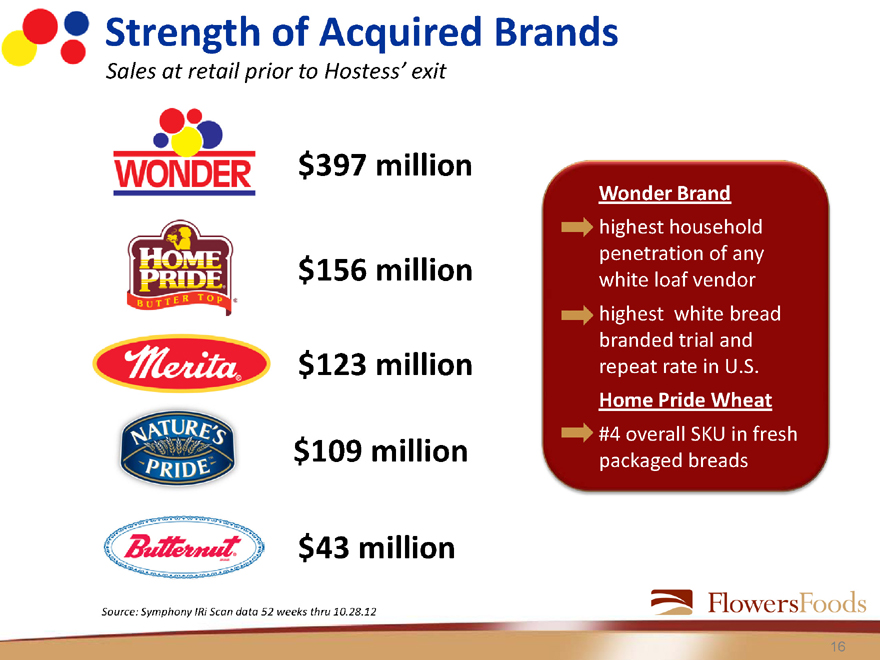
Strength of Acquired Brands
Sales at retail prior to Hostess’ exit
$397 million
$156 million
$123 million
$109 million
$43 million
Wonder Brand highest household penetration of any white loaf vendor highest white bread branded trial and repeat rate in U.S.
Home Pride Wheat
#4 overall SKU in fresh packaged breads
Source: Symphony IRi Scan data 52 weeks thru 10.28.12
16

Brands Reintroduction – early Fall 2013
17
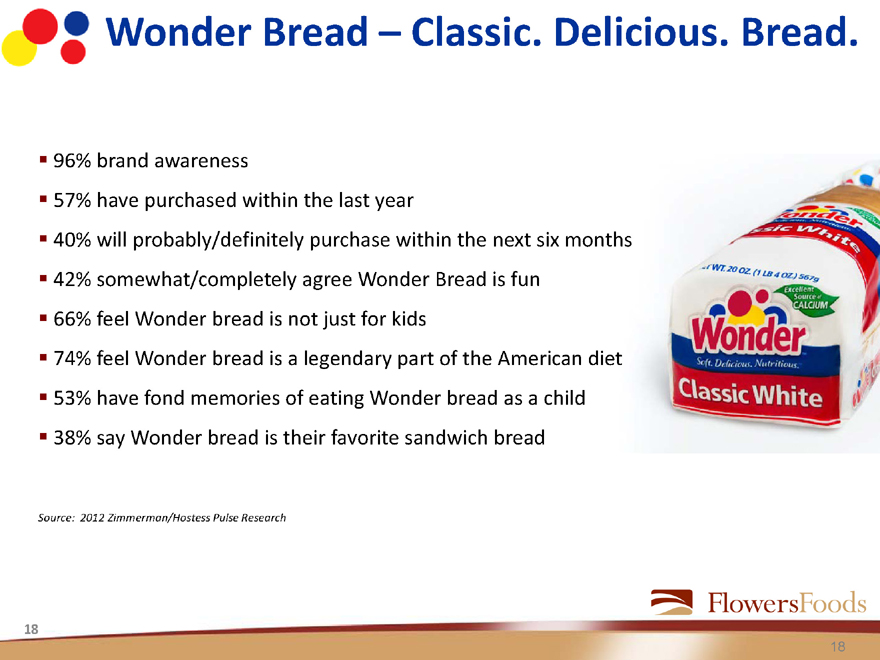
Wonder Bread – Classic. Delicious. Bread.
96% brand awareness
57% have purchased within the last year
40% will probably/definitely purchase within the next six months 42% somewhat/completely agree Wonder Bread is fun 66% feel Wonder bread is not just for kids 74% feel Wonder bread is a legendary part of the American diet 53% have fond memories of eating Wonder bread as a child 38% say Wonder bread is their favorite sandwich bread
Source: 2012 Zimmerman/Hostess Pulse Research
18
18

Marketing Initiative NASCAR Sponsorship
19
Children’s Miracle Network Sponsorship
Wonder’s back—and gives back!
20
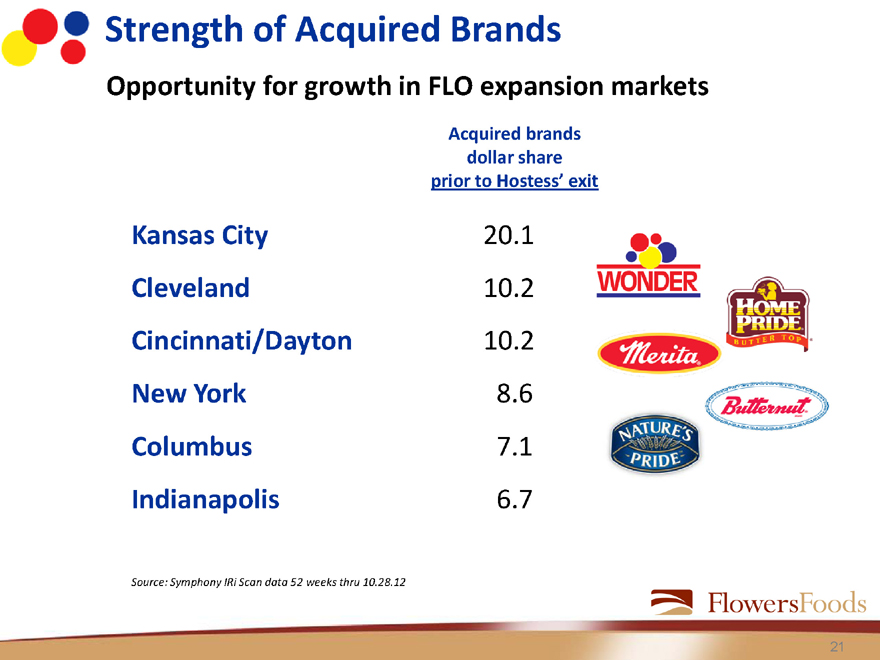
Strength of Acquired Brands
Opportunity for growth in FLO expansion markets
Acquired brands dollar share prior to Hostess’ exit
Kansas City 20.1
Cleveland 10.2
Cincinnati/Dayton 10.2
New York 8.6
Columbus 7.1
Indianapolis 6.7
Source: Symphony IRi Scan data 52 weeks thru 10.28.12
21

Strength of Acquired Brands
Opportunity for growth in Flowers’ expansion markets
Acquired brands
dollar share FLO Current
prior to Hostess’ exit Dollar Share
Kansas City 20.1 0
Cleveland 10.2 0
Cincinnati/Dayton 10.2 4.3
New York 8.6 0.5
St. Louis 8.6 7.7
Columbus 7.1 1.3
Indianapolis 6.7 6.2
Source:
Symphony IRi Scan data for Hostess brands 52 weeks thru October 28, 2012 Symphony IRi Scan for FLO brands latest 4 weeks ending August 4, 2013
22
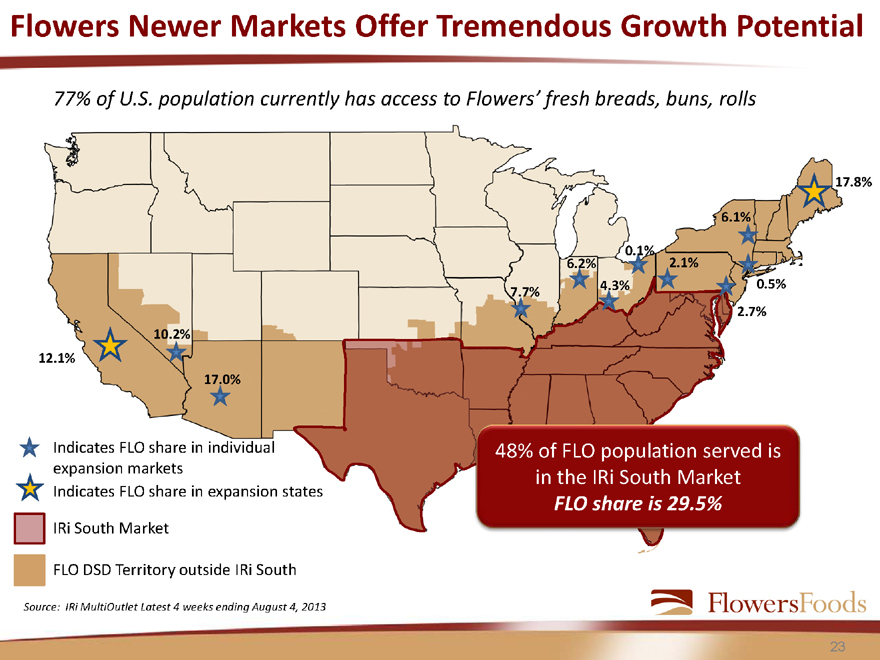
Flowers Newer Markets Offer Tremendous Growth Potential
77% of U.S. population currently has access to Flowers’ fresh breads, buns, rolls
Indicates FLO share in individual expansion markets Indicates FLO share in expansion states
IRi South Market
FLO DSD Territory outside IRi South
48% of FLO population served is in the IRi South Market
FLO share is 29.5%
Source: IRi MultiOutlet Latest 4 weeks ending August 4, 2013
23
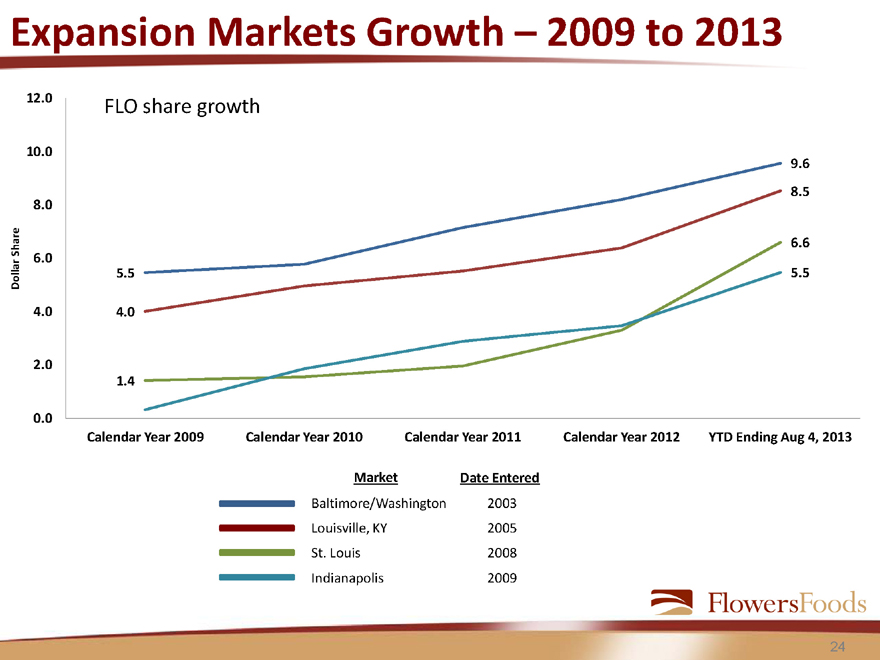
Expansion Markets Growth – 2009 to 2013
FLO share growth
12.0
10.0
8.0
6.0
4.0
2.0
0.0
Calendar Year 2009 Calendar Year 2010 Calendar Year 2011 Calendar Year 2012 YTD Ending Aug 4, 2013
Market Date Entered
Baltimore/Washington 2003
Louisville, KY 2005
St. Louis 2008
Indianapolis 2009
24
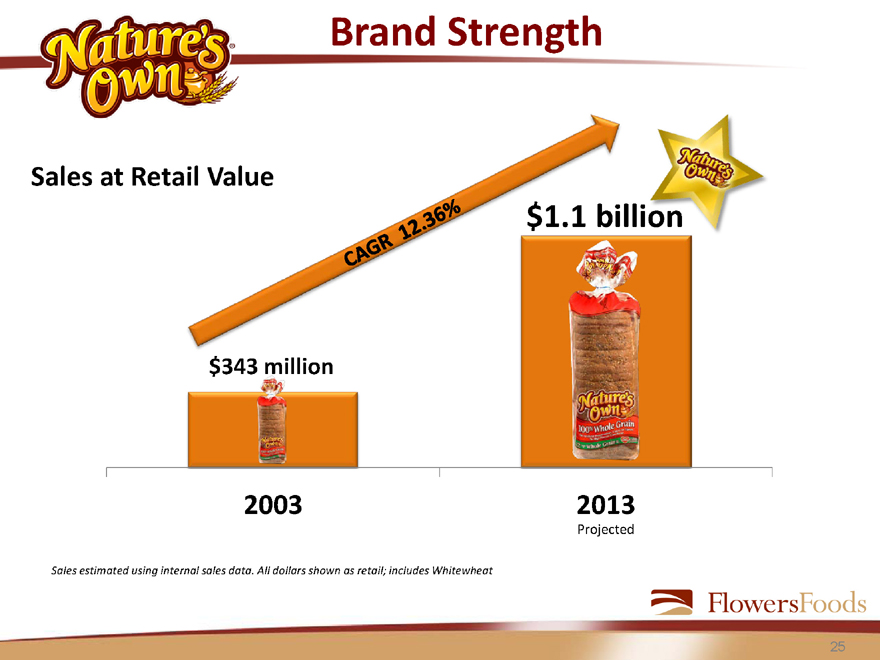
Brand Strength
Sales at Retail Value
$343 million
2003 2013
Projected
Sales estimated using internal sales data. All dollars shown as retail; includes Whitewheat
25
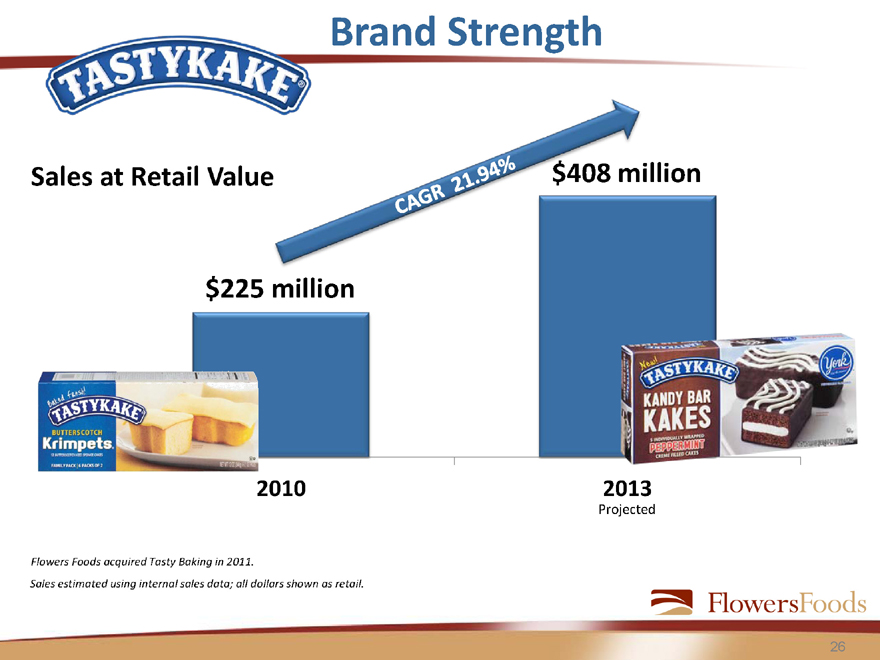
Brand Strength
Sales at Retail Value
$408 million
$225 million
2010
2013
Projected
Flowers Foods acquired Tasty Baking in 2011.
Sales estimated using internal sales data; all dollars shown as retail.
26
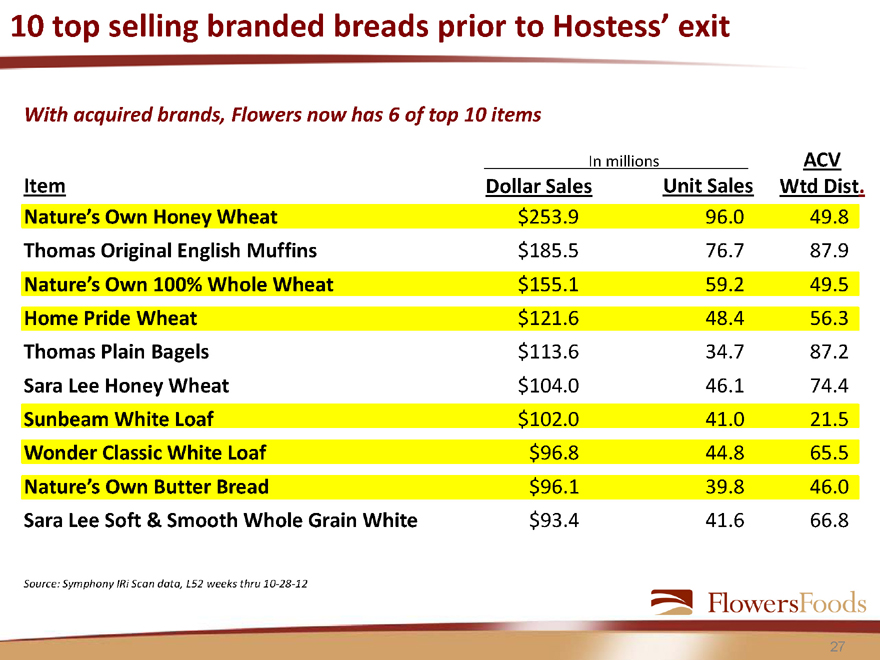
10 top selling branded breads prior to Hostess’ exit
With acquired brands, Flowers now has 6 of top 10 items
In millions ACV
Item Dollar Sales Unit Sales Wtd Dist.
Nature’s Own Honey Wheat $253.9 96.0 49.8
Thomas Original English Muffins $185.5 76.7 87.9
Nature’s Own 100% Whole Wheat $155.1 59.2 49.5
Home Pride Wheat $121.6 48.4 56.3
Thomas Plain Bagels $113.6 34.7 87.2
Sara Lee Honey Wheat $104.0 46.1 74.4
Sunbeam White Loaf $102.0 41.0 21.5
Wonder Classic White Loaf $96.8 44.8 65.5
Nature’s Own Butter Bread $96.1 39.8 46.0
Sara Lee Soft & Smooth Whole Grain White $93.4 41.6 66.8
Source: Symphony IRi Scan data, L52 weeks thru 10-28-12
27
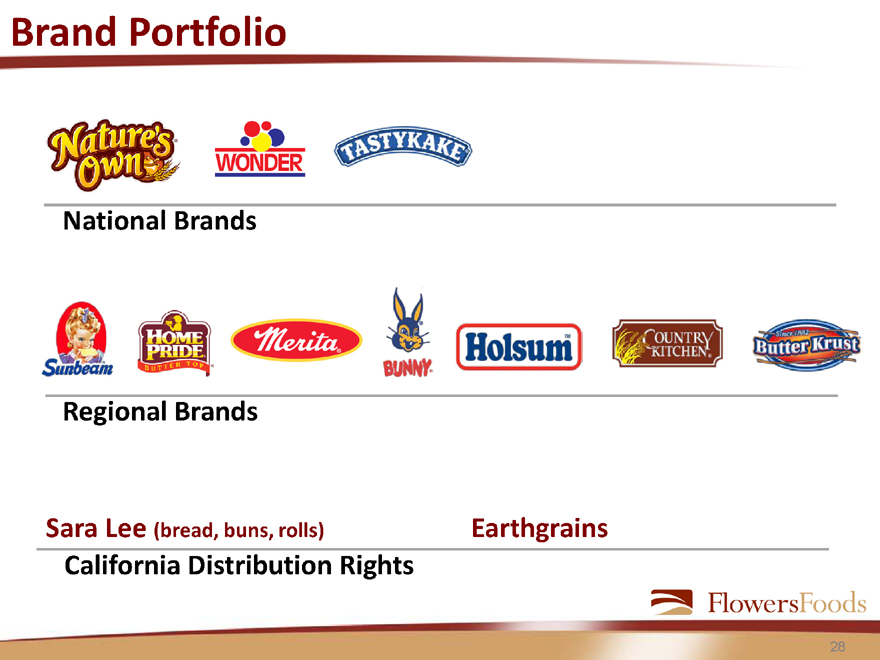
Brand Portfolio
National Brands
Regional Brands
Sara Lee (bread, buns, rolls) Earthgrains
California Distribution Rights
28
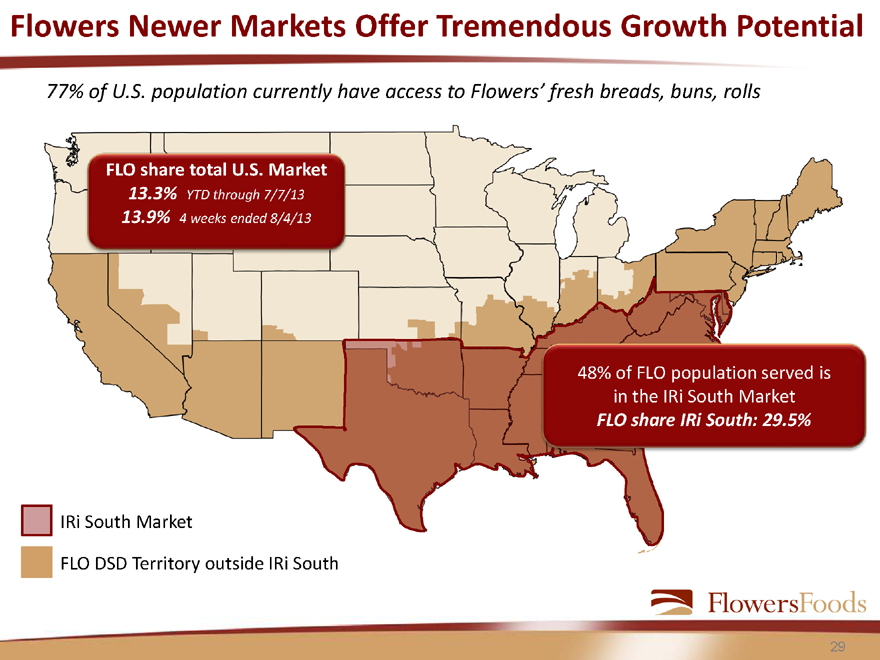
Flowers Newer Markets Offer Tremendous Growth Potential
77% of U.S. population currently have access to Flowers’ fresh breads, buns, rolls
FLO share total U.S. Market
13.3% YTD through 7/7/13
13.9% 4 weeks ended 8/4/13
48% of FLO population served is in the IRi South Market
FLO share IRi South: 29.5%
IRi South Market
FLO DSD Territory outside IRi South
29

Growing
THE FLOWERS WAY
30
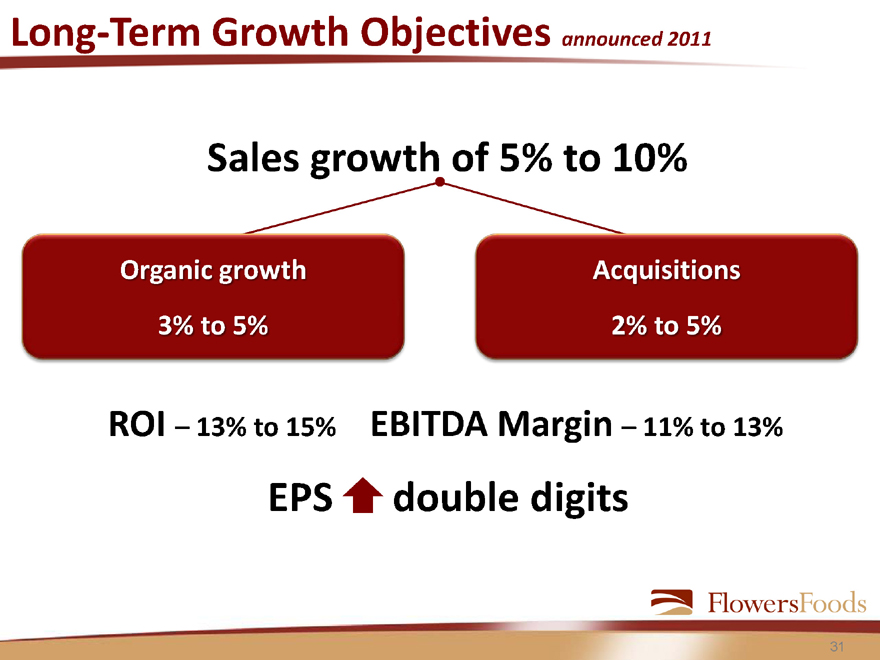
Long-Term Growth Objectives announced 2011
Sales growth of 5% to 10%
Organic growth
3% to 5%
Acquisitions
2% to 5%
ROI – 13% to 15% EBITDA Margin – 11% to 13%
EPS
double digits
31
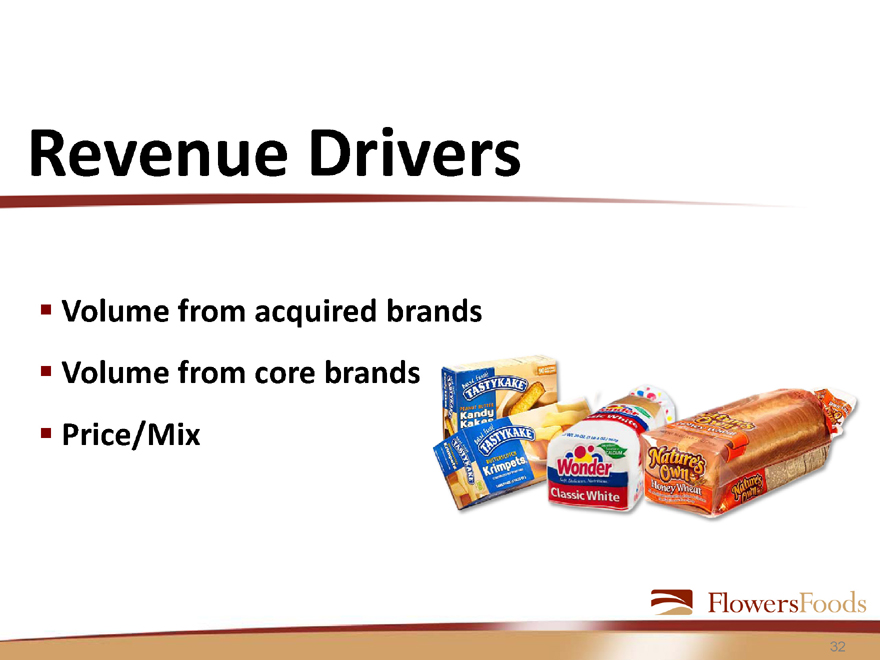
Revenue Drivers
Volume from acquired brands
Volume from core brands
Price/Mix
32
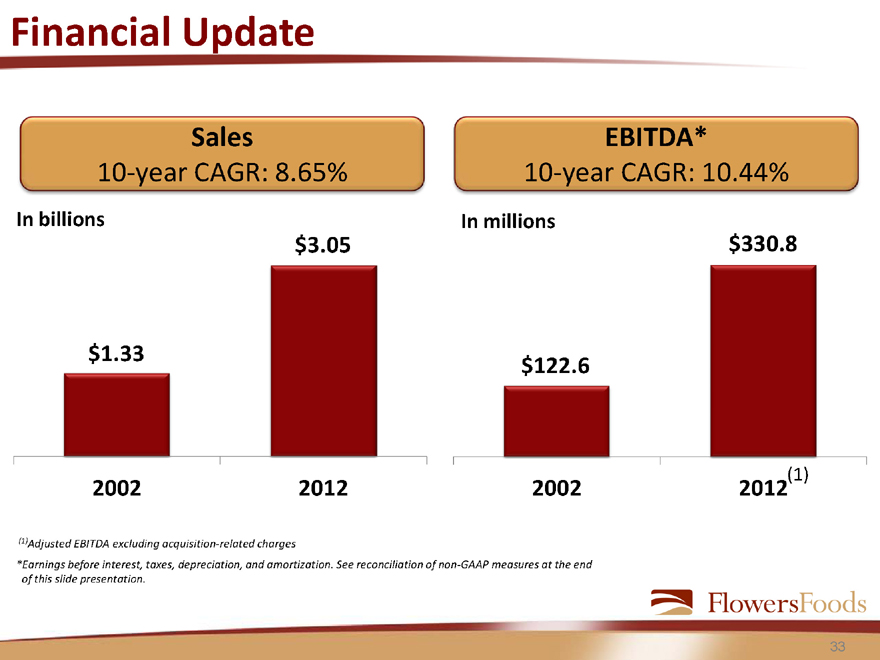
Financial Update
Sales 10-year CAGR: 8.65%
EBITDA*
10-year CAGR: 10.44%
In billions
$3.05
$1.33
In millions
$330.8
$122.6
2002 2012
2002 2012(1)
(1)Adjusted EBITDA excluding acquisition-related charges
*Earnings before interest, taxes, depreciation, and amortization. See reconciliation of non-GAAP measures at the end of this slide presentation.
33
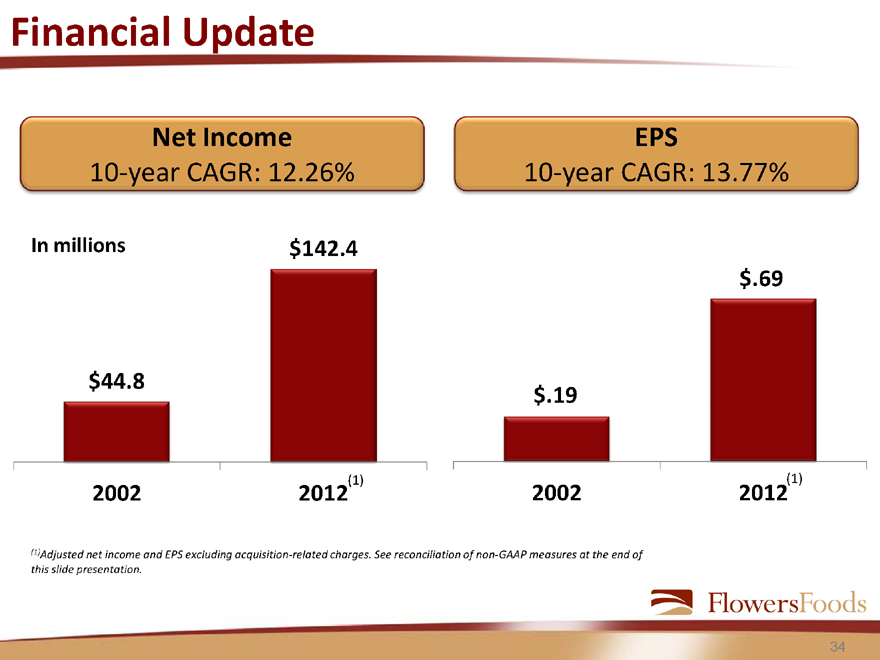
Financial Update
Net Income
10-year CAGR: 12.26%
EPS
10-year CAGR: 13.77%
In millions
$44.8
$142.4
$.19
$.69
2002
2012(1)
2002
(1)
2012
(1)Adjusted net income and EPS excluding acquisition-related charges. See reconciliation of non-GAAP measures at the end of this slide presentation.
34
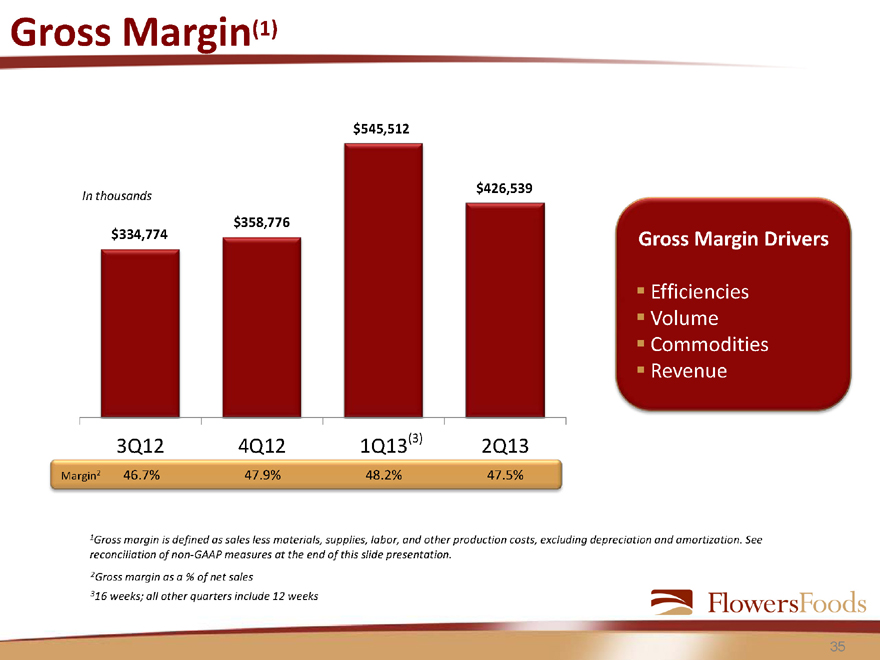
Gross Margin(1)
In thousands
$334,774
$358,776
$545,512
$426,539
Gross Margin Drivers
Efficiencies Volume Commodities Revenue
3Q12 4Q12 1Q13 (3) 2Q13
Margin2 46.7% 47.9% 48.2% 47.5%
1Gross margin is defined as sales less materials, supplies, labor, and other production costs, excluding depreciation and amortization. See reconciliation of non-GAAP measures at the end of this slide presentation.
2Gross margin as a % of net sales
316 weeks; all other quarters include 12 weeks
35
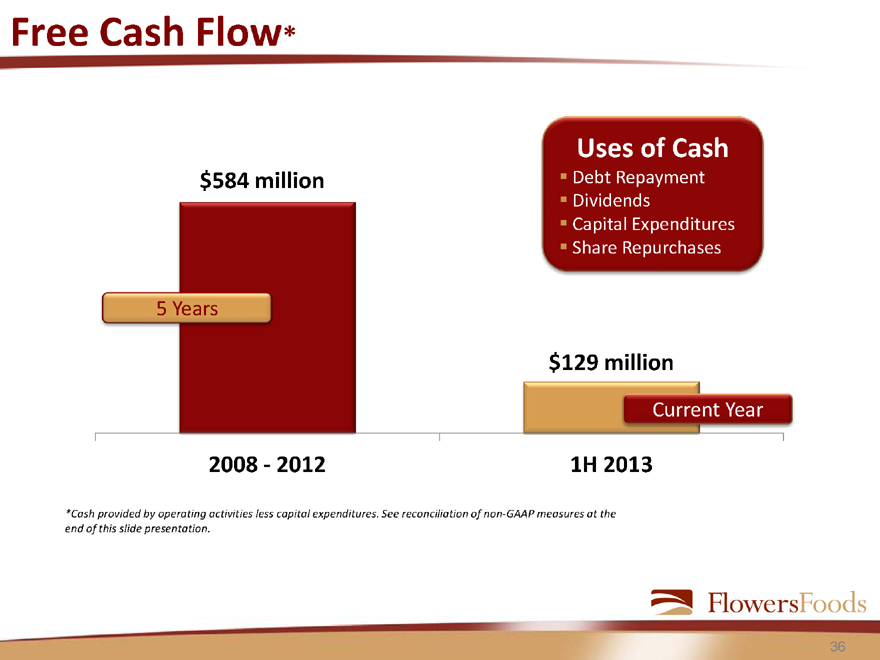
Free Cash Flow*
$584 million
5 Years
2008 - 2012
Uses of Cash
Debt Repayment Dividends Capital Expenditures Share Repurchases
$129 million
Current Year
1H 2013
*Cash provided by operating activities less capital expenditures. See reconciliation of non-GAAP measures at the end of this slide presentation.
36
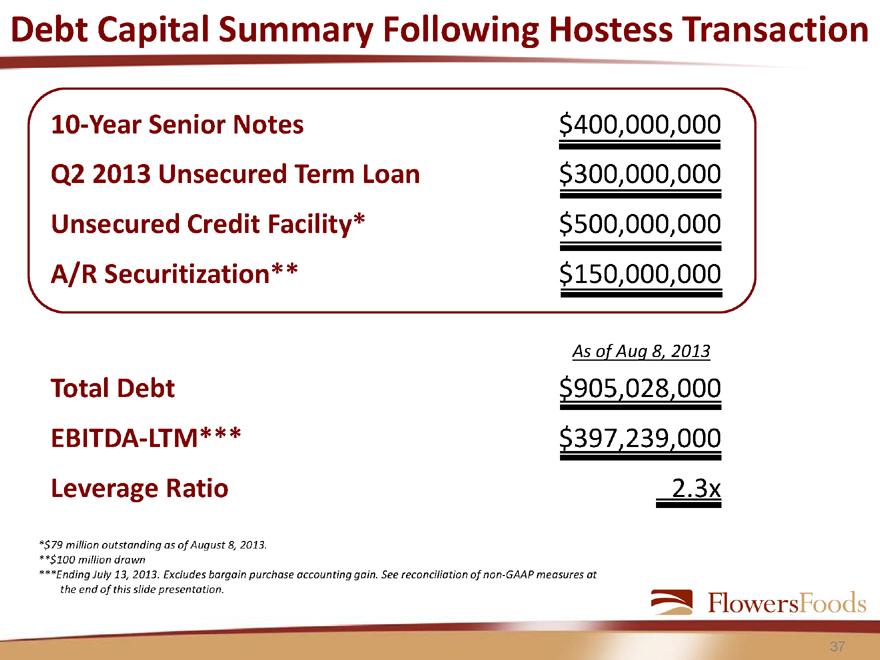
Debt Capital Summary Following Hostess Transaction
10-Year Senior Notes $400,000,000
Q2 2013 Unsecured Term Loan $300,000,000
Unsecured Credit Facility* $500,000,000
A/R Securitization** $150,000,000
As of Aug 8, 2013
Total Debt $905,028,000
EBITDA-LTM*** $397,239,000
Leverage Ratio 2.3x
*$79 million outstanding as of August 8, 2013.
**$100 million drawn
***Ending July 13, 2013. Excludes bargain purchase accounting gain. See reconciliation of non-GAAP measures at the end of this slide presentation.
37
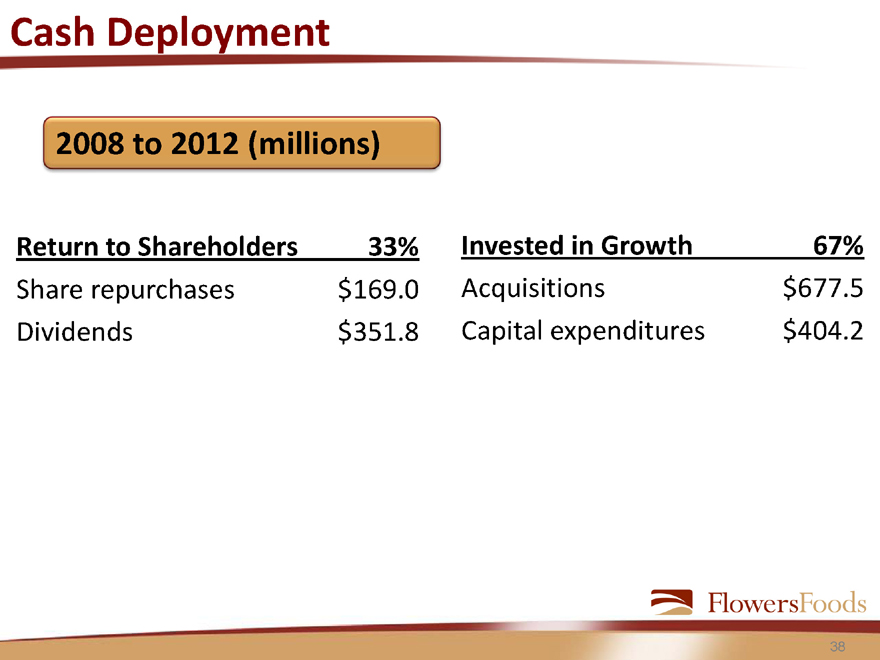
Cash Deployment
2008 to 2012 (millions)
Return to Shareholders 33%
Share repurchases $169.0
Dividends $351.8
Invested in Growth 67%
Acquisitions $677.5
Capital expenditures $404.2
38
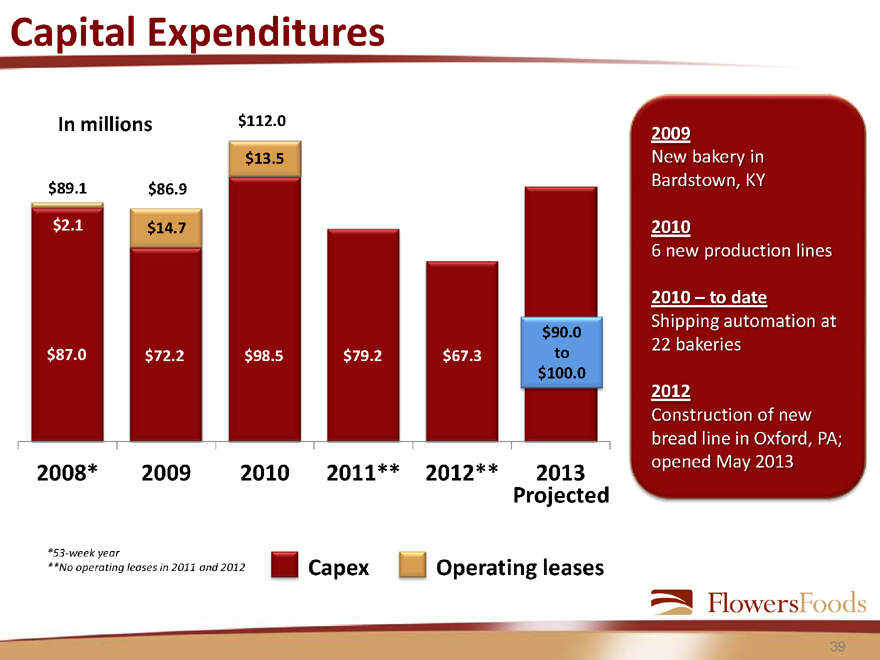
Capital Expenditures
In millions
$89.1
$2.1
$87.0
$86.9
$14.7
$72.2
$112.0
$13.5
$98.5
$79.2
$67.3
$90.0 to $100.0
2008* 2009 2010 2011** 2012** 2013
Projected
2009
New bakery in
Bardstown, KY
2010
6 new production lines
2010 – to date
Shipping automation at
22 bakeries
2012
Construction of new
bread line in Oxford, PA;
opened May 2013
*53-week year
**No operating leases in 2011 and 2012
Capex
Operating leases
39
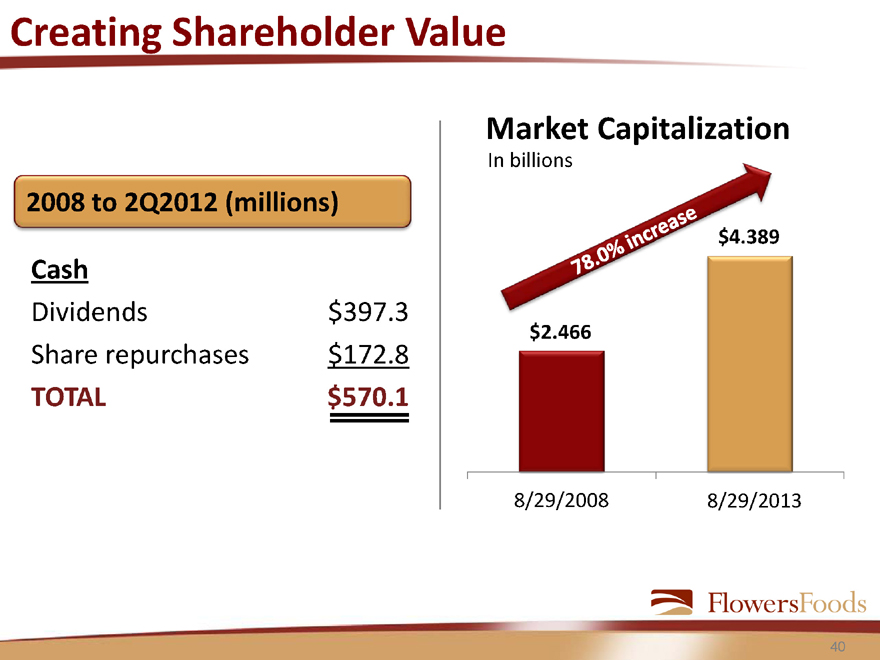
Creating Shareholder Value
2008 to 2Q2012 (millions)
Cash
Dividends $397.3
Share repurchases $172.8
TOTAL $570.1
Market Capitalization
In billions
78.0% increase
$2.466
8/29/2008
8/29/2013
40
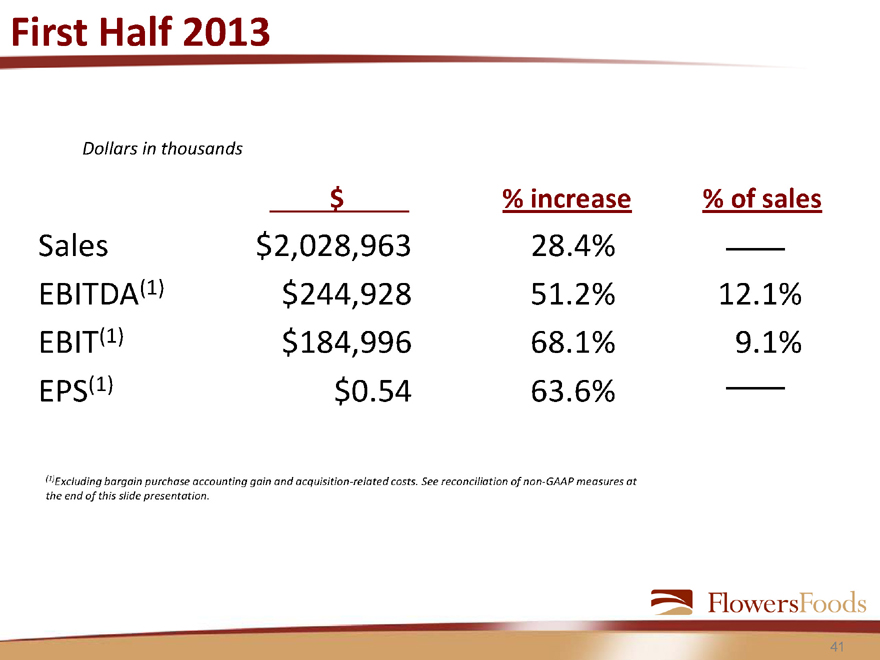
First Half 2013
Dollars in thousands
$ % increase % of sales
Sales $2,028,963 28.4%
EBITDA(1) $244,928 51.2% 12.1%
EBIT(1) $184,996 68.1% 9.1%
EPS(1) $0.54 63.6%
(1)Excluding bargain purchase accounting gain and acquisition-related costs. See reconciliation of non-GAAP measures at the end of this slide presentation.
41
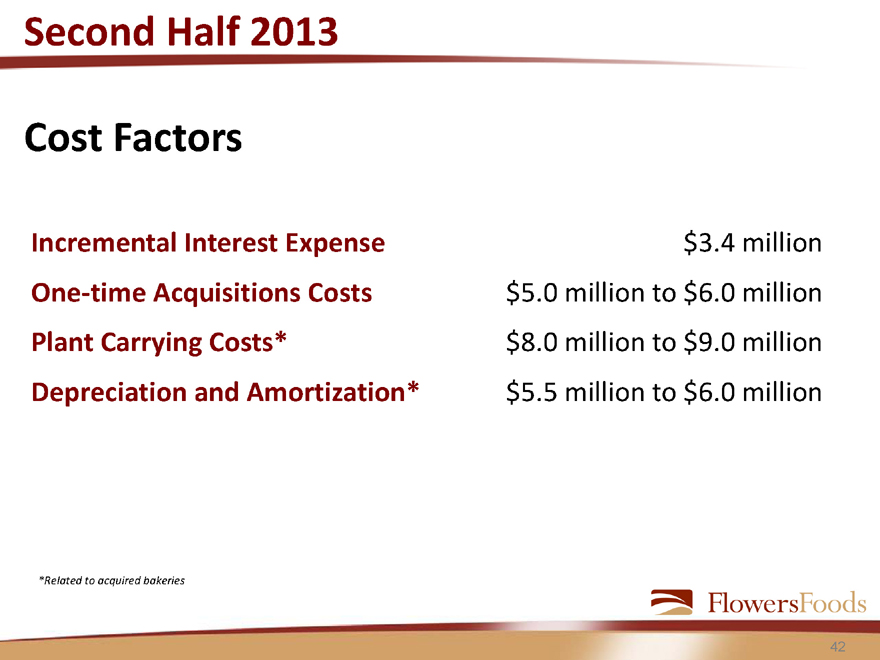
Second Half 2013
Cost Factors
Incremental Interest Expense One-time Acquisitions Costs Plant Carrying Costs* Depreciation and Amortization*
$3.4 million
$5.0 million to $6.0 million
$8.0 million to $9.0 million
$5.5 million to $6.0 million
*Related to acquired bakeries
42
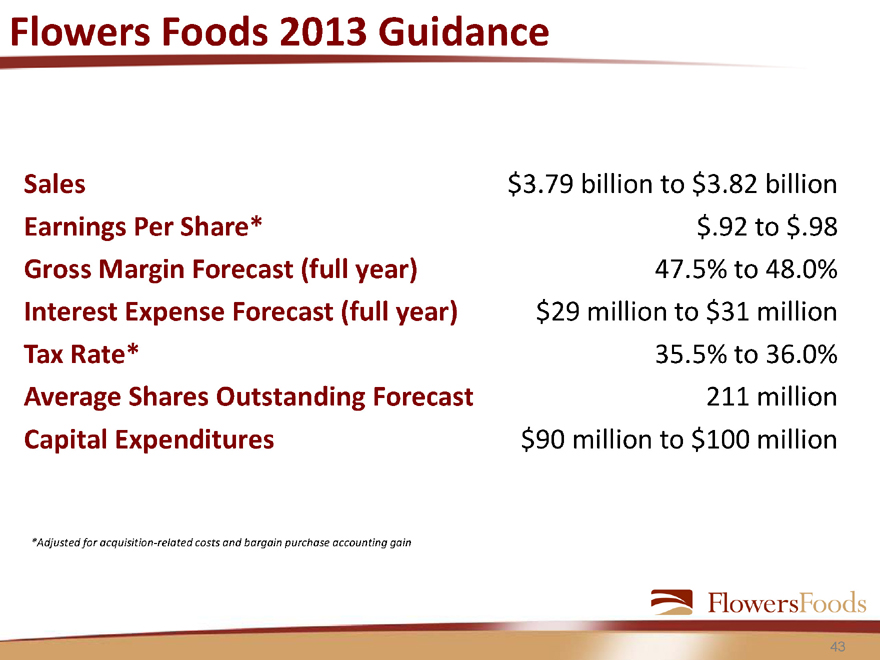
Flowers Foods 2013 Guidance
Sales $3.79 billion to $3.82 billion
Earnings Per Share* $.92 to $.98 Gross Margin Forecast (full year) 47.5% to 48.0% Interest Expense Forecast (full year) $29 million to $31 million
Tax Rate* 35.5% to 36.0%
Average Shares Outstanding Forecast 211 million
Capital Expenditures $90 million to $100 million
*Adjusted for acquisition-related costs and bargain purchase accounting gain
43
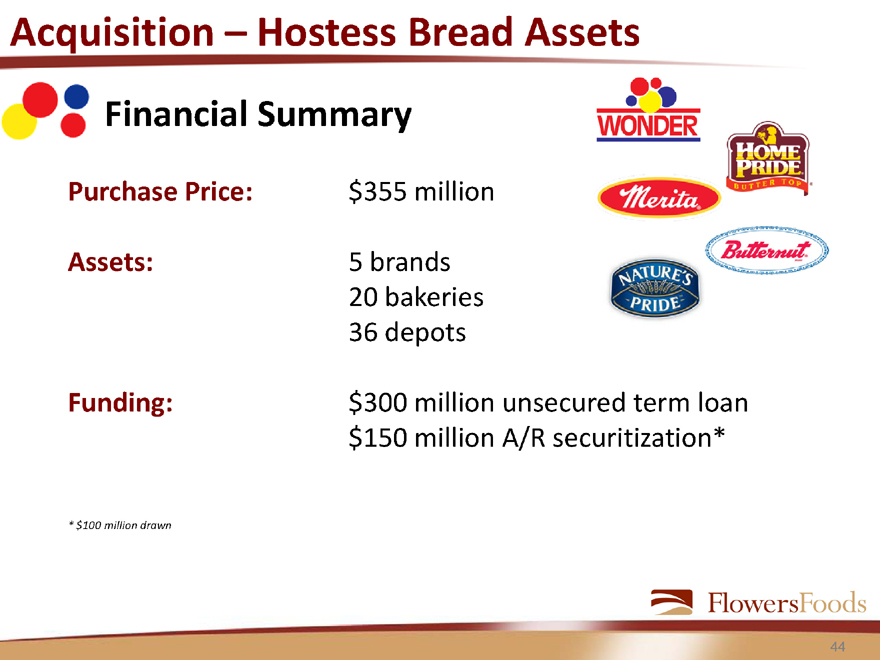
Acquisition – Hostess Bread Assets
Financial Summary
Purchase Price: $355 million
Assets: 5 brands
20 bakeries
36 depots
Funding: $300 million unsecured term loan
$150 million A/R securitization*
* $100 million drawn
44
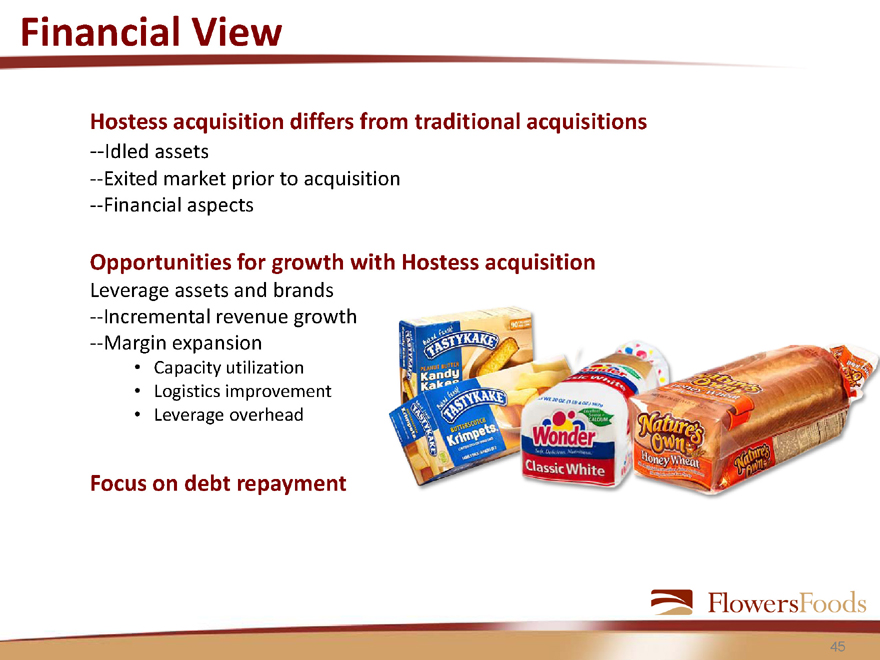
Financial View
Hostess acquisition differs from traditional acquisitions
—Idled assets
—Exited market prior to acquisition
—Financial aspects
Opportunities for growth with Hostess acquisition
Leverage assets and brands
—Incremental revenue growth
—Margin expansion
Capacity utilization
Logistics improvement
Leverage overhead
Focus on debt repayment
45
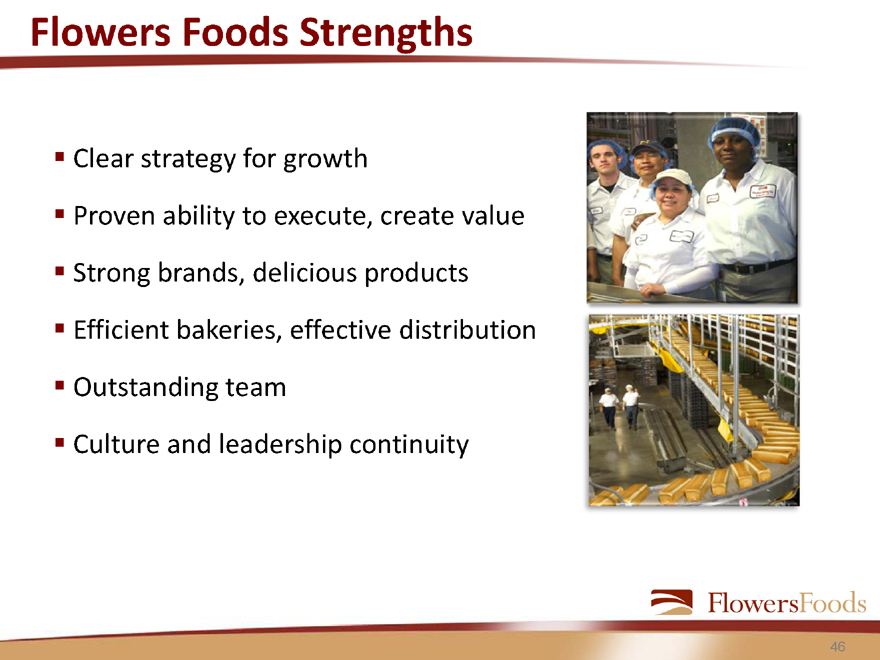
Flowers Foods Strengths
Clear strategy for growth
Proven ability to execute, create value
Strong brands, delicious products
Efficient bakeries, effective distribution
Outstanding team
Culture and leadership continuity
46

Growing
THE FLOWERS WAY
47
Safe Harbor
Today’s presentation includes forward-looking statements within the meaning of the Safe Harbor provisions of the Private Securities Litigation Reform Act of 1995, particularly statements regarding future financial and operating results of Flowers Foods and its business. These statements are based on management’s current expectations or beliefs, and are subject to uncertainty and changes in circumstances.
Actual results may vary materially from those expressed or implied by the statements, due to changes in economic, business, competitive, strategic, or regulatory factors, and factors affecting the operation of the business of Flowers Foods. Those factors could include, among others, our ability to successfully integrate recent acquisitions, such as the acquisition of certain Hostess bread brands, our ability to achieve expected sales of acquired Hostess products as a result of Hostess’ extended liquidation and the absorption of demand for Hostess products by our competitors, and our ability to realize other expected benefits from recent acquisitions, including the acquisition of certain Hostess bread brands.
More detailed information about these factors may be found in filings by Flowers Foods with the Securities and Exchange Commission, especially its Form 10-K, in the sections entitled “Forward Looking Statements.” Flowers Foods is under no obligation and expressly disclaims any such obligation to update or alter its forward-looking statements, whether as a result of new information, future events or otherwise.
48
Information Regarding Non-GAAP Financial Measures
The company prepares its consolidated financial statements in accordance with U.S. Generally Accepted Accounting Principles (GAAP). However, from time to time, the company may present in its public statements, press releases, and SEC filings, non-GAAP financial measures such as EBITDA. The company defines EBITDA as earnings from continuing operations before interest, income taxes, depreciation, amortization, and income attributable to non-controlling interest. The company believes that EBITDA is a useful tool for managing the operations of its business and is an indicator of the company’s ability to incur and service indebtedness and generate free cash flow. The company also believes that EBITDA measures are commonly reported and widely used by investors and other interested parties as measures of a company’s operating performance and debt servicing ability because EBITDA measures assist in comparing performance on a consistent basis without regard to depreciation or amortization, which can vary significantly depending upon accounting methods and non-operating factors (such as historical cost). EBITDA is also a widely-accepted financial indicator of a company’s ability to incur and service indebtedness. Adjusted EBITDA, adjusted net income, adjusted diluted earnings per share, and adjusted EBIT margin excludes additional costs that we consider important to present to investors. These include, but are not limited to, the costs of closing a plant or costs associated with merger-related activities. We believe that financial information excluding certain transactions not considered to be part of the ongoing business improves the comparability of earnings results. We believe investors will be able to better understand our earnings results if these transactions are excluded from the results. These non-GAAP financial measures are measures of performance not defined by accounting principles generally accepted in the Unites States and should be considered in addition to, not in lieu of, GAAP reported measures. EBITDA should not be considered an alternative to (a) income from operations or net income (loss) as a measure of operating performance; (b) cash flows provided by operating, investing, and financing activities (as determined in accordance with GAAP) as a measure of the company’s ability to meet its cash needs; or (c) any other indicator of performance or liquidity that has been determined in accordance with GAAP. Our method of calculating EBITDA, adjusted EBITDA, adjusted net income, adjusted diluted earnings per share, and adjusted EBIT margin may differ from the methods used by other companies, and, accordingly, may not be comparable to similarly titled measures used by other companies. Gross margin excluding depreciation and amortization is used as a performance measure to provide additional transparent information regarding our results of operations on a consolidated and segment basis. Changes in depreciation and amortization are separately discussed and include depreciation and amortization for materials, supplies, labor and other production costs and operating activities. Presentation of gross margin includes depreciation and amortization in the materials, supplies, labor, and other production costs according to GAAP. Our method of presenting gross margin excludes the depreciation and amortization components, as discussed above. This presentation may differ from the methods used by other companies and may not be comparable to similarly titled measures used by other companies. Free cash flow (operating cash flow less capital expenditures) is presented because it represents cash available to pursue opportunities that enhance shareholder value, such as developing new products, making acquisitions, paying dividends, and reducing debt. The following reconciliations provide a reconciliation of our net income, the most comparable GAAP financial measure to EBITDA and adjusted EBITDA, a reconciliation of adjusted diluted earnings per share, a reconciliation of adjusted net income, a reconciliation of our gross margin excluding depreciation and amortization to GAAP gross margin, a reconciliation of adjusted EBIT, and a reconciliation of free cash flow.
49
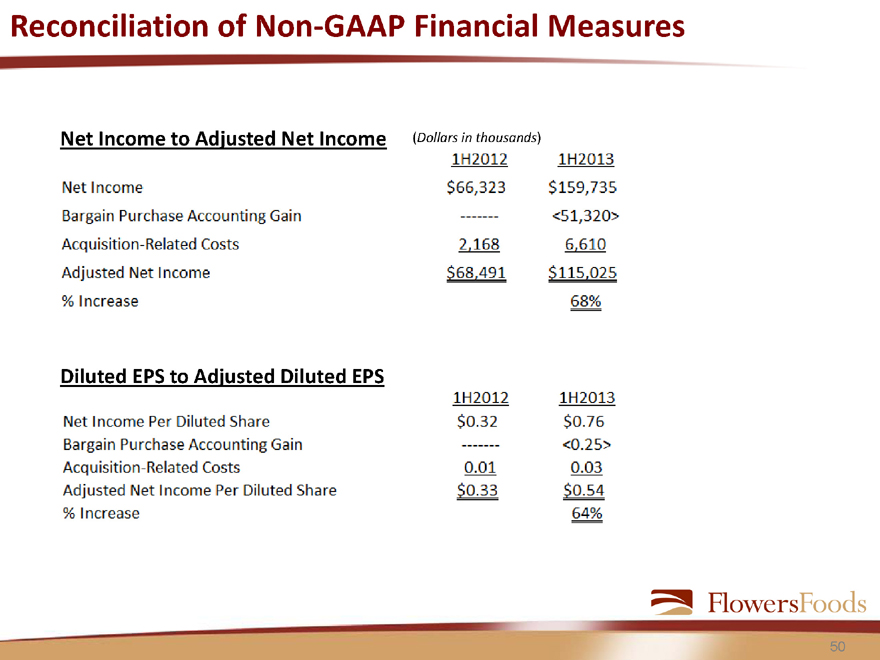
Reconciliation of Non-GAAP Financial Measures
Net Income to Adjusted Net Income (Dollars in thousands)
1H2012 1H2013
Net Income $66,323 $159,735
Bargain Purchase Accounting Gain ------- <51,320>
Acquisition-Related Costs 2,168 6,610
Adjusted Net Income $68,491 $115,025
% Increase 68%
Diluted EPS to Adjusted Diluted EPS
1H2012 1H2013
Net Income Per Diluted Share $0.32 $0.76
Bargain Purchase Accounting Gain ------- <0.25>
Acquisition-Related Costs 0.01 0.03
Adjusted Net Income Per Diluted Share $0.33 $0.54
% Increase 64%
50
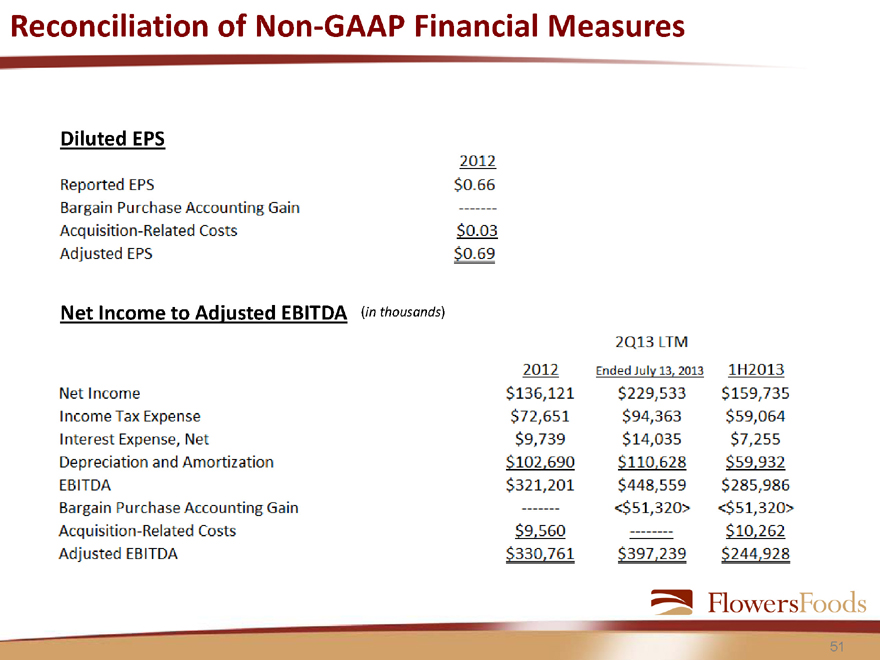
Reconciliation of Non-GAAP Financial Measures
Diluted EPS
2012
Reported EPS $0.66
Bargain Purchase Accounting Gain -------
Acquisition-Related Costs $0.03
Adjusted EPS $0.69
Net Income to Adjusted EBITDA (in thousands)
2Q13 LTM
2012 Ended July 13, 2013 1H2013
Net Income $136,121 $229,533 $159,735
Income Tax Expense $72,651 $94,363 $59,064
Interest Expense, Net $9,739 $14,035 $7,255
Depreciation and Amortization $102,690 $110,628 $59,932
EBITDA $321,201 $448,559 $285,986
Bargain Purchase Accounting Gain ------- <$51,320> <$51,320>
Acquisition-Related Costs $9,560 ------- $10,262
Adjusted EBITDA $330,761 $397,239 $244,928
51
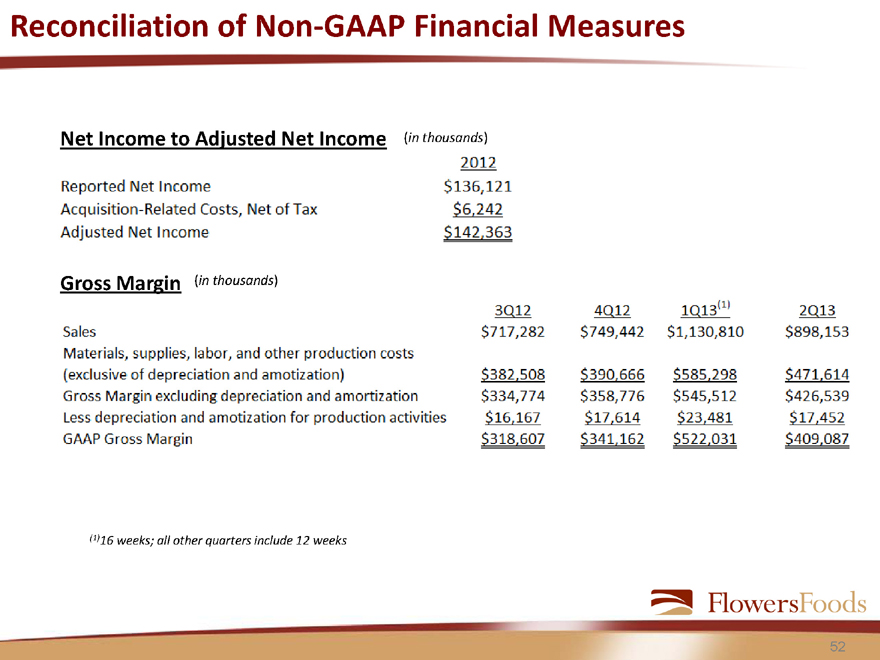
Reconciliation of Non-GAAP Financial Measures
Net Income to Adjusted Net Income (in thousands)
2012
Reported Net Income $136,121
Acquisition-Related Costs, Net of Tax $6,242
Adjusted Net Income $142,363
Gross Margin (in thousands)
3Q12 4Q12 1Q13(1) 2Q13
Sales $717,282 $749,442 $1,130,810 $898,153
Materials, supplies, labor, and other production costs (exclusive of depreciation and amotization) $382,508 $390,666 $585,298 $471,614
Gross Margin excluding depreciation and amortization $334,774 $358,776 $545,512 $426,539
Less depreciation and amotization for production activities $16,167 $17,614 $23,481 $17,452
GAAP Gross Margin $318,607 $341,162 $522,031 $409,087
(1)16 weeks; all other quarters include 12 weeks
52
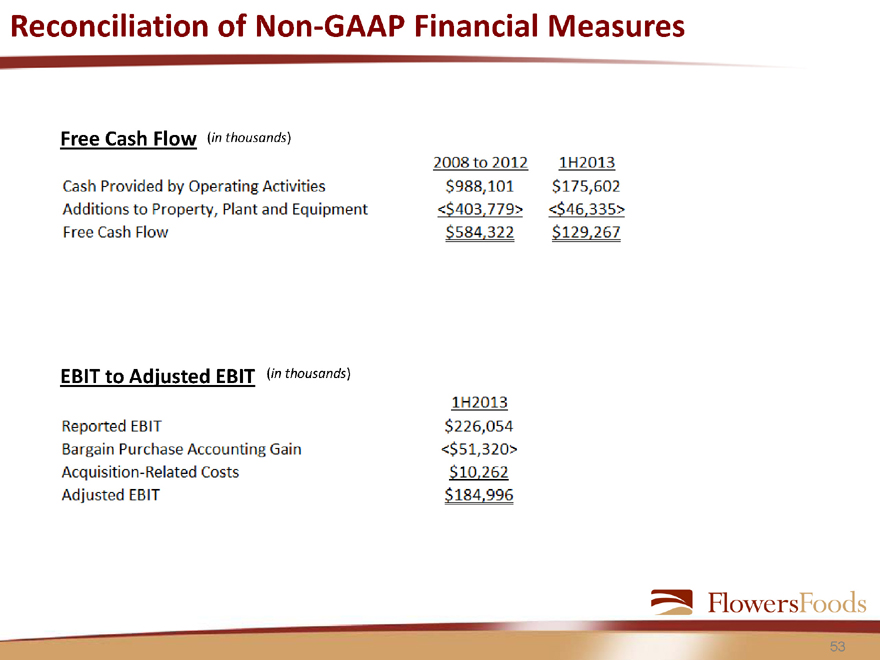
Reconciliation of Non-GAAP Financial Measures
Free Cash Flow (in thousands)
2008 to 2012 1H2013
Cash Provided by Operating Activites $988,101 $175,602
Additions to Property, Plant and Equipment <$403,779> <$46,335>
Free Cash Flow $584,322 $129,267
EBIT to Adjusted EBIT (in thousands)
1H2013
Reported EBIT $226,054
Bargain Purchase Accounting Gain <$51,320>
Acquisition-Related Costs $10,262
Adjusted EBIT $184,996
53