As filed with the Securities and Exchange Commission on April 11, 2019
UNITED STATES SECURITIES AND EXCHANGE COMMISSION
Washington, DC 20549
FORM20-F
Annual Report Pursuant to Section 13 or 15(d) of the Securities
Exchange Act of 1934
for the fiscal year ended December 31, 2018
Commission file number:1-16269
AMÉRICA MÓVIL, S.A.B. DE C.V.
(exact name of registrant as specified in its charter)
America Mobile
(translation of registrant’s name into English)
United Mexican States
(jurisdiction of incorporation)
Lago Zurich 245, Plaza Carso / Edificio Telcel Colonia Ampliación Granada, Miguel Hidalgo 11529 Mexico City, Mexico
(address of principal executive offices)
Daniela Lecuona Torras
Lago Zurich 245, Plaza Carso / Edificio
Telcel, Piso 16, Colonia Ampliación Granada, Miguel Hidalgo, 11529 Mexico City,
Mexico Telephone: (5255) 2581-3700
Facsimile: (5255) 2581-4422
E-mail: daniela.lecuona@americamovil.com
(name, telephone,e-mail and/or facsimile number and address of company contact person) Securities registered pursuant to Section 12(b) of the Act:
| | |
| Title of each class: | | Name of each exchange on which registered: |
| A Shares, without par value | | New York Stock Exchange |
| L Shares, without par value | | New York Stock Exchange |
| 5.000% Senior Notes Due 2019 | | New York Stock Exchange |
| 5.000% Senior Notes Due 2020 | | New York Stock Exchange |
| 3.125% Senior Notes Due 2022 | | New York Stock Exchange |
| 6.375% Notes Due 2035 | | New York Stock Exchange |
| 6.125% Notes Due 2037 | | New York Stock Exchange |
| 6.125% Senior Notes Due 2040 | | New York Stock Exchange |
| 4.375% Senior Notes Due 2042 | | New York Stock Exchange |
Securities registered pursuant to Section 12(g) of the Act: None
Securities for which there is a reporting obligation pursuant to Section 15(d) of the Act: None
The number of outstanding shares of each of the registrant’s classes of capital or common stock as of December 31, 2018:
| | |
| 20,602 million | | AA Shares |
| 567 million | | A Shares |
| 44,887 million | | L Shares |
Indicate by check mark if the registrant is a well-known seasoned issuer, as defined in Rule 405 of the Securities Act. ☒ Yes ☐ No
If this report is an annual or transition report, indicate by check mark if the registrant is not required to file reports pursuant to Section 13 or 15(d) of the Securities Exchange Act of 1934. ☐ Yes ☒ No
Indicate by check mark whether the registrant: (1) has filed all reports required to be filed by Section 13 or 15(d) of the Securities Exchange Act of 1934 during the preceding 12 months (or for such shorter period that the registrant was required to file such reports) and (2) has been subject to such filing requirements for the past 90 days. ☒ Yes ☐ No
Indicate by check mark whether the registrant has submitted electronically every Interactive Data File required to be submitted pursuant to Rule 405 of RegulationS-T (§ 232.405 of this Chapter) during the preceding 12 months (or for such shorter period that the registrant was required to submit such files). ☒ Yes ☐ No
Indicate by check mark whether the registrant is a large accelerated filer, an accelerated filer, anon-accelerated filer, or an emerging growth company. See the definitions of “large accelerated filer,” “accelerated filer,” and “emerging growth company” in Rule12b-2 of the Exchange Act.
Large accelerated filer ☒ Accelerated filer ☐ Non-accelerated filer ☐ Emerging growth company ☐
If an emerging growth company that prepares its financial statements in accordance with U.S. GAAP, indicate by check mark if the registrant has elected not to use the extended transition period for complying with any new or revised financial accounting standards† provided pursuant to Section 13(a) of the Exchange Act. ☐
† The term “new or revised financial accounting standard” refers to any update issued by the Financial Accounting Standards Board to its Accounting Standards Codification after April 5, 2012.
Indicate by check mark which basis of accounting the registrant has used to prepare the financial statements included in this filing:
| | | | |
| U.S. GAAP ☐ | | International Financial Reporting Standards as issued by the International Accounting Standards Board ☒ | | Other ☐ |
If “other” has been checked in response to the previous question, indicate by check mark which financial statement item the registrant has elected to follow.
Item 17 ☐ Item 18 ☐
If this is an annual report, indicate by check mark whether the registrant is a shell company (as defined in Rule12b-2 of the Exchange Act).
☐ Yes ☒ No

2018 ANNUAL REPORT FORM 20-F


(See Form20-F Cross Reference Guide on page 114)
We prepared our audited consolidated financial statements included in this annual report in accordance with International Financial Reporting Standards as issued by the International Accounting Standards Board (“IFRS”). The selected financial information should be read in conjunction with, and is qualified in its entirety by reference to, our audited consolidated financial statements.
We present our financial statements in Mexican pesos. This annual report contains translations of various peso amounts into U.S. dollars at specified rates solely for your convenience. You should not construe these translations as representations that the peso amounts actually represent the U.S. dollar amounts or could be converted into U.S. dollars at the rate indicated. Unless otherwise indicated, we have translated U.S. dollar amounts from pesos at the exchange rate of Ps.19.6829 to U.S.$1.00, which was the rate reported by Banco de México on December 31, 2018, as published in the Official Gazette of the Federation (Diario Oficial de la Federación, or “Official Gazette”).
We have not included earnings or dividends on a per American Depositary Share (“ADS”) basis. Each L Share ADS represents 20 L Shares and each A Share ADS represents 20 A Shares.
2
| | | | | | | | | | | | | | | | | | | | | | | | |
| | | FOR THE YEAR ENDED DECEMBER 31,(1) | | | | | |
| | | 2014 | | | 2015 | | | 2016 | | | 2017 | | | 2018 | | | 2018 | |
| | | (in millions of Mexican pesos, except share and per share amounts) | | | (in millions of U.S. dollars,
except share
and per share amounts) | |
| |
| STATEMENT OF COMPREHENSIVE INCOME DATA: | |
| | | | | | | |
| Operating revenues | | Ps. | 848,580 | | | Ps. | 893,738 | | | Ps. | 975,412 | | | Ps. | 1,021,634 | | | Ps. | 1,038,208 | | | U.S.$ | 52,747 | |
| | | | | | | |
| Operating costs and expenses | | | 692,026 | | | | 752,325 | | | | 865,802 | | | | 921,490 | | | | 898,651 | | | | 45,657 | |
| | | | | | | |
| Depreciation and amortization | | | 114,994 | | | | 125,715 | | | | 148,526 | | | | 160,175 | | | | 155,713 | | | | 7,911 | |
| | | | | | | |
| Operating income | | | 156,554 | | | | 141,413 | | | | 109,610 | | | | 100,144 | | | | 139,557 | | | | 7,090 | |
| | | | | | | |
| Net profit for the year | | Ps. | 47,498 | | | Ps. | 36,961 | | | Ps. | 12,079 | | | Ps. | 32,155 | | | Ps. | 54,517 | | | U.S.$ | 2,770 | |
| |
| NET PROFIT ATTRIBUTABLE FOR THE YEAR TO: | |
| | | | | | | |
| Equity holders of the parent | | Ps. | 46,146 | | | Ps. | 35,055 | | | Ps. | 8,650 | | | Ps. | 29,326 | | | Ps. | 52,566 | | | U.S.$ | 2,670 | |
| | | | | | | |
| Non-controlling interests | | | 1,352 | | | | 1,906 | | | | 3,429 | | | | 2,829 | | | | 1,951 | | | | 100 | |
| | | | | | | |
| Net profit for the year | | Ps. | 47,498 | | | Ps. | 36,961 | | | Ps. | 12,079 | | | Ps. | 32,155 | | | Ps. | 54,517 | | | U.S.$ | 2,770 | |
| |
| EARNINGS PER SHARE: | |
| | | | | | | |
| Basic | | Ps. | 0.67 | | | Ps. | 0.52 | | | Ps. | 0.13 | | | Ps. | 0.44 | | | Ps. | 0.79 | | | U.S.$ | 0.04 | |
| | | | | | | |
| Diluted | | Ps. | 0.67 | | | Ps. | 0.52 | | | Ps. | 0.13 | | | Ps. | 0.44 | | | Ps. | 0.79 | | | U.S.$ | 0.04 | |
| | | | | | | |
| Dividends declared per share (2) | | Ps. | 0.24 | | | Ps. | 0.26 | | | Ps. | 0.28 | | | Ps. | 0.30 | | | Ps. | 0.32 | | | U.S.$ | 0.02 | |
| |
| WEIGHTED AVERAGE NUMBER OF SHARES OUTSTANDING (MILLIONS): | |
| | | | | | | |
| Basic | | | 69,254 | | | | 66,869 | | | | 65,693 | | | | 65,909 | | | | 66,055 | | | | | |
| | | | | | | |
| Diluted | | | 69,254 | | | | 66,869 | | | | 65,693 | | | | 65,909 | | | | 66,055 | | | | | |
| |
| BALANCE SHEET DATA: | |
| | | | | | | |
| Property, plant and equipment, net | | Ps. | 588,106 | | | Ps. | 573,529 | | | Ps. | 701,190 | | | Ps. | 676,343 | | | Ps. | 640,001 | | | U.S.$ | 32,516 | |
| | | | | | | |
| Total assets | | | 1,278,357 | | | | 1,296,487 | | | | 1,515,042 | | | | 1,486,212 | | | | 1,429,223 | | | | 72,613 | |
| | | | | | | |
| Short-term debt and current portion of long-term debt | | | 57,806 | | | | 119,590 | | | | 82,607 | | | | 51,746 | | | | 96,230 | | | | 4,889 | |
| | | | | | | |
| Long-term debt | | | 545,949 | | | | 563,627 | | | | 625,194 | | | | 646,139 | | | | 542,692 | | | | 27,572 | |
| | | | | | | |
| Capital stock | | | 96,383 | | | | 96,338 | | | | 96,338 | | | | 96,339 | | | | 96,338 | | | | 4,895 | |
| | | | | | | |
| Total equity | | | 234,639 | | | | 160,854 | | | | 271,024 | | | | 260,634 | | | | 245,872 | | | | 12,492 | |
| |
| NUMBER OF OUTSTANDING SHARES (MILLIONS): | |
| | | | | | | |
| AA Shares | | | 23,384 | | | | 23,384 | | | | 20,635 | | | | 20,602 | | | | 20,602 | | | | | |
| | | | | | | |
| A Shares | | | 649 | | | | 625 | | | | 592 | | | | 567 | | | | 546 | | | | | |
| | | | | | | |
| L Shares | | | 44,120 | | | | 41,990 | | | | 44,571 | | | | 44,901 | | | | 44,887 | | | | | |
| |
(1) As of December 31, 2018, we owned 51.0% of the total outstanding shares of Telekom Austria AG (“Telekom Austria” or “TKA”). We began consolidating Telekom Austria from July 1, 2014. Prior to July 1, 2014, we accounted for Telekom Austria using the equity method, which affects the comparability of our results for 2014 through 2018. (2) Figures for each year provided represent the annual dividend declared at the general shareholders’ meeting that year. For information on dividends paid per share trans- lated into U.S. dollars, see “Share Ownership and Trading—Dividends” under Part IV of this annual report. | |
3


HISTORY AND CORPORATE INFORMATION
América Móvil, S.A.B. de C.V. (“América Móvil,” “we” or the “Company”) is a sociedad anónima bursátil de capital variable organized under the laws of Mexico.
We were established in September 2000 when Teléfonos de México, S.A.B. de C.V. (“Telmex”), a fixed-line Mexican telecommunications operator privatized in 1990, spun off to us its wireless operations in Mexico and other countries. We have made significant acquisitions throughout Latin America, the United States, the Caribbean and Europe, and we have also expanded our businesses organically. In 2010, we acquired control of Telmex and Telmex Internacional, S.A.B. de C.V. (“Telmex Internacional”) in a series of public tender offers.
Our principal executive offices are located at Lago Zurich 245, Plaza Carso / Edificio Telcel, Colonia Ampliación Granada, Miguel Hidalgo, 11529, Mexico City, Mexico. Our telephone number at this location is (5255) 2581-3700.
BUSINESS OVERVIEW
We provide telecommunications services in 25 countries. We are a leading telecommunications services provider in Latin America, ranking first in wireless, fixed-line, broadband and Pay TV services based on the number of revenue generating units (“RGUs”).
Our largest operations are in Mexico and Brazil, which together account for over half of our total RGUs and where we have the largest market share based on RGUs. We also have operations in 16 other countries in the Americas and seven countries in Central and Eastern Europe as of December 31, 2018. For a list of our principal subsidiaries, see note 2 a(ii) to our audited consolidated financial statements and “Additional Information—Exhibit 8.1” under Part VII of this annual report.
We intend to build on our position as leaders in integrated telecommunications services in Latin America and the Caribbean, and to grow in other parts of the world by continuing to expand our subscriber base through the development of our existing businesses and strategic acquisitions when opportunities arise. We have developed world-class integrated telecommunications platforms to offer our customers new services and enhanced communications solutions with higher data speed transmissions at lower prices. We continue investing in our networks to increase coverage and implement new technologies to optimize our network capabilities. See “Operating and Financial Review and Prospects—Overview” under Part II of this annual report for a discussion on the seasonality of our business.
6
RECENT DEVELOPMENTS
Acquisition of Nextel Operations in Brazil
In March 2019, we entered into an agreement to acquire 100% of the outstanding shares of Nextel Telecomunicações Ltda. (“Nextel Brazil”) from NII Holdings Inc. (“NII”) and AI Brazil Holdings B.V. for U.S.$905 million. The transaction is subject to the satisfaction of certain customary closing conditions, including the approval of the stockholders of NII and receipt of regulatory and antitrust approvals from Brazilian government authorities. Nextel Brazil provides nationwide mobile telecommunications services.
Acquisition of Telefónica’s Operations in Guatemala and El Salvador
In January 2019, we entered into an agreement to acquire 100% of the outstanding shares of Telefónica Móviles Guatemala, S.A. (“Telefónica Guatemala”) for U.S.$333 million and 99.3% of the outstanding shares of Telefónica Móviles El Salvador, S.A. de C.V. (“Telefónica El Salvador”) for U.S.$315 million. The acquired companies provide mobile and fixed telecommunications services, including voice, data and Pay TV in Guatemala and El Salvador, respectively. The Telefónica Guatemala acquisition was completed on January 24, 2019. The completion of the Telefónica El Salvador acquisition is subject to certain customary closing conditions, including regulatory approval.
7
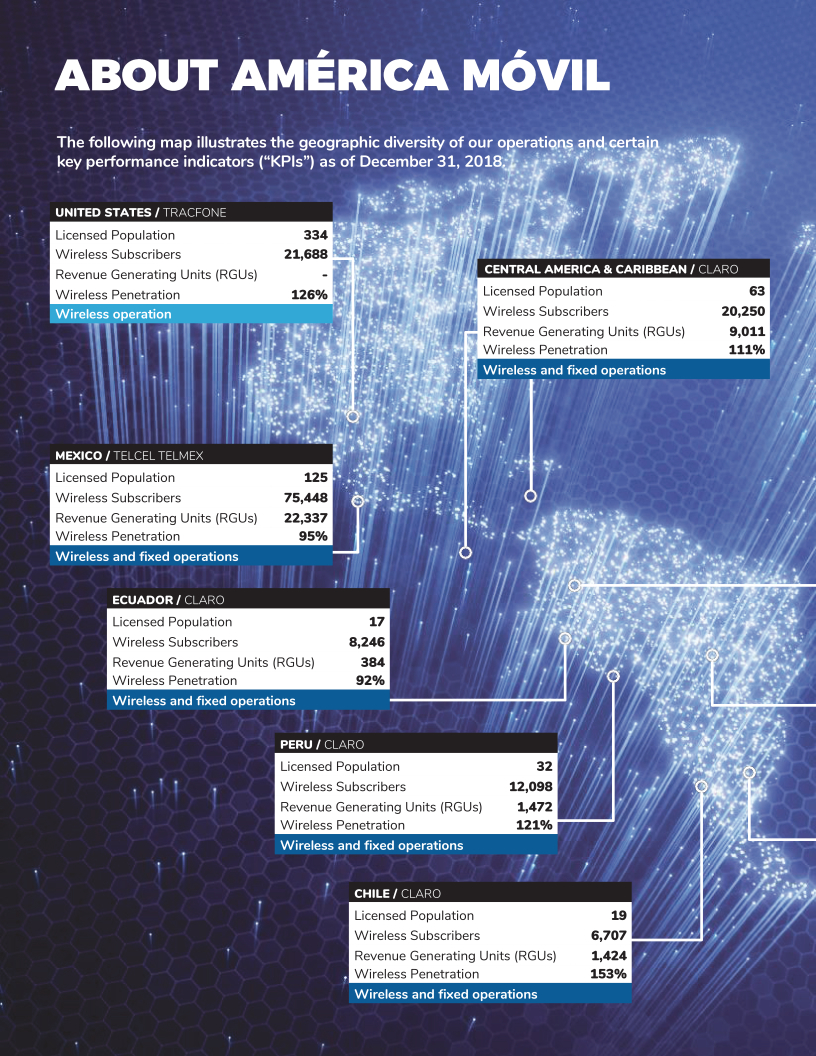
ABOUT AMERICA MOVIL The following map illustrates the geographic diversity of our operations and certain key performance indicators ("KPIs") as of December 31, 2018. UNITED STATES / TRACFONE Licensed Population 334 Wireless Subscribers 21,688 Revenue Generating Units (RGUs) - Wireless Penetration 126% Wireless operation CENTRAL AMERICA & CARIBBEAN / CLARO Licensed Population 63 Wireless Subscribers 20,250 Revenue Generating Units (RGUs) 9,011 Wireless Penetration 111% Wireless and fixed operations MEXICO / TELCEL TELMEX Licensed Population 125 Wireless Subscribers 75,448 Revenue Generating Units (RGUs) 22,337 Wireless Penetration 95% Wireless and fixed operations ECUADOR / CLARO Licensed Population 17 Wireless Subscribers 8,246 Revenue Generating Units (RGUs) 384 Wireless Penetration 92% Wireless and fixed operations
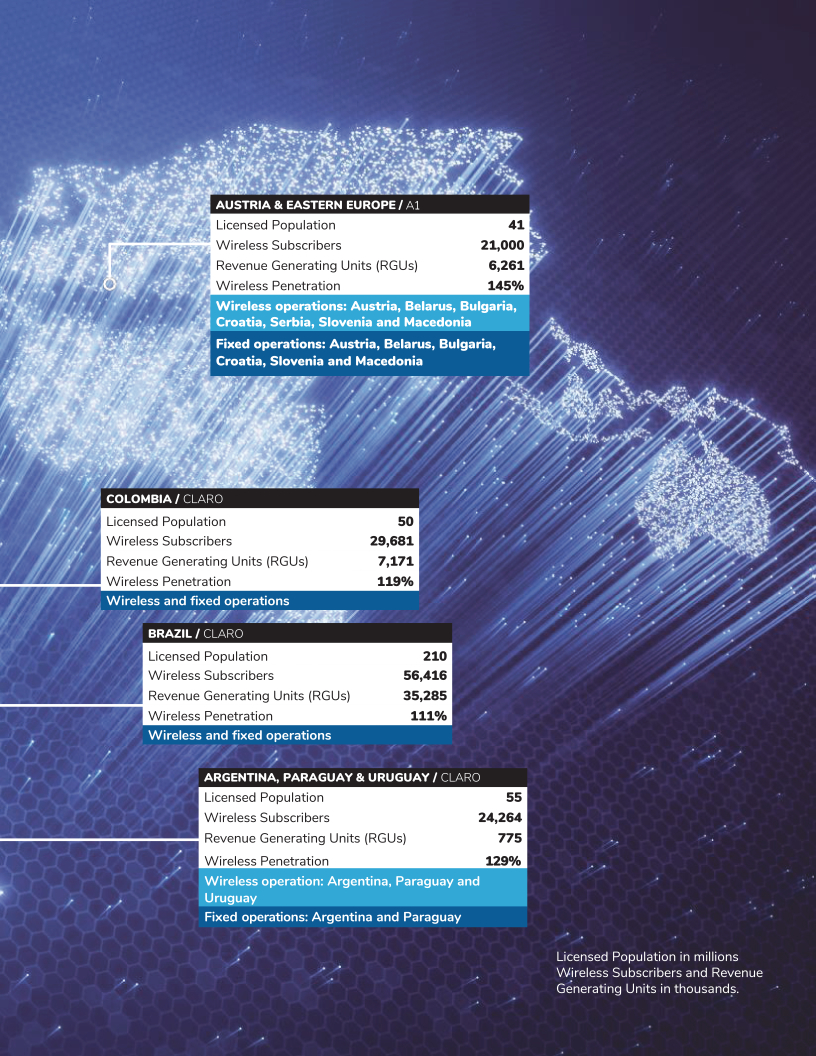 PERU / CLARO Licensed Population 32 Wireless Subscribers 12,098 Revenue Generating Units (RGUs) 1,472 Wireless Penetration 121% Wireless and fixed operations CHILE / CLARO Licensed Population 19 Wireless Subscribers 6,707 Revenue Generating Units (RGUs) 1,424 Wireless Penetration 153% Wireless and fixed operations AUSTRIA & EASTERN EUROPE Licensed Population 41 Wireless Subscribers 21,000 Revenue Generating Units (RGUs) 6,261 Wireless Penetration 145% Wireless operations: Austria, Belarus, Bulgaria, Croatia, Serbia, Slovenia and Macedonia Fixed operations: Austria, Belarus, Bulgaria, Croatia, Slovenia and Macedonia COLOMBIA / CLARO Licensed Population 50 Wireless Subscribers 29,681 Revenue Generating Units (RGUs) 7,171 Wireless Penetration 119% Wireless and fixed operations BRAZIL / CLARO Licensed Population 210 Wireless Subscribers 56,416 Revenue Generating Units (RGUs) 35,285 Wireless Penetration 111% Wireless and fixed operations ARGENTINA, PARAGUAY & URUGUAY / CLARO Licensed Population 55 Wireless Subscribers 24,264 Revenue Generating Units (RGUs) 775 Wireless Penetration 129% Wireless operation: Argentina, Paraguay and Uruguay Fixed operations: Argentina and Paraguay Licensed Population in millions Wireless Subscribers and Revenue Generating Units in thousands
KEY PERFORMANCE INDICATORS
We have identified certain KPIs that help measure the performance of our operations. The table of our KPIs below includes the number of our wireless subscribers and our fixed RGUs, which together make up the total RGUs, in the countries where we operate. Wireless subscribers consist of the number of prepaid and postpaid subscribers to our wireless services. Fixed RGUs consist of fixed voice, fixed data and Pay TV units (which include customers of our Pay TV services and, separately, of certain other digital services). The figures below reflect total wireless subscribers and fixed RGUs of all our consolidated subsidiaries, without adjustments to reflect our equity interest, in the following reportable segments:
| • | | Southern Cone (Argentina, Chile, Paraguay and Uruguay); |
| • | | Andean Region (Ecuador and Peru); |
| • | | Central America (Costa Rica, El Salvador, Guatemala, Honduras, Nicaragua and Panama); |
| • | | the Caribbean (the Dominican Republic and Puerto Rico); |
| • | | Europe (Austria, Belarus, Bulgaria, Croatia, Macedonia, Serbia and Slovenia). |
| | | | | | | | | | | | |
| | | AS OF DECEMBER 31, | |
| | | 2016 | | | | 2017 | | | | 2018 | |
| | | (in thousands) | |
| WIRELESS SUBSCRIBERS: | | | | | | | | | | | | |
| Mexico Wireless | | | 72,953 | | | | 73,855 | | | | 75,448 | |
| Brazil | | | 60,171 | | | | 59,022 | | | | 56,416 | |
| Colombia | | | 28,954 | | | | 29,353 | | | | 29,681 | |
| Southern Cone | | | 30,377 | | | | 31,076 | | | | 30,971 | |
| Andean Region | | | 20,801 | | | | 20,352 | | | | 20,344 | |
| Central America | | | 15,085 | | | | 15,927 | | | | 14,364 | |
| Caribbean | | | 5,453 | | | | 5,637 | | | | 5,887 | |
| United States | | | 26,070 | | | | 23,132 | | | | 21,688 | |
| Europe | | | 20,708 | | | | 20,658 | | | | 21,000 | |
| Total Wireless Subscribers | | | 280,572 | | | | 279,012 | | | | 275,798 | |
| FIXED RGUS: | | | | | | | | | | | | |
| Mexico Fixed | | | 22,178 | | | | 21,851 | | | | 22,337 | |
| Brazil | | | 36,716 | | | | 35,904 | | | | 35,285 | |
| Colombia | | | 6,304 | | | | 6,753 | | | | 7,171 | |
| Southern Cone | | | 1,942 | | | | 2,023 | | | | 2,199 | |
| Andean Region | | | 1,820 | | | | 1,765 | | | | 1,856 | |
| Central America | | | 5,392 | | | | 5,811 | | | | 6,465 | |
| Caribbean | | | 2,663 | | | | 2,700 | | | | 2,546 | |
| Europe | | | 5,900 | | | | 6,036 | | | | 6,261 | |
| Total Fixed RGUs | | | 82,915 | | | | 82,844 | | | | 84,120 | |
| Total RGUs | | | 363,488 | | | | 361,856 | | | | 359,919 | |
PRINCIPAL BRANDS
We operate in all of our geographic segments under the Claro brand name, except in Mexico, the United States and Europe, where we principally do business under the brand names listed below.
| | | | |
COUNTRY | | PRINCIPAL BRANDS | | SERVICES AND PRODUCTS |
Mexico | | Telcel | | Wireless voice Wireless data |
| | | Telmex Infinitum | | Fixed voice Fixed data |
| United States | | TracFone | | Wireless voice Wireless data |
| | | Straight Talk | | Wireless voice Wireless data |
| Europe | | A1(1) | | Wireless vocie Wireless data Fixed voice Fixed data Pay TV |
(1) Since 2017, Telekom Austria has been extending a rollout of the A1 brand to all its regional operating companies. |
SERVICES AND PRODUCTS
We offer a wide range of services and products that vary by market, including wireless voice, wireless data and value-added services, fixed voice, fixed data, broadband and IT services, Pay TV andover-the-top (“OTT”) services.
Wireless Operations
In 2018, our wireless voice and data operations generated revenues of Ps. 529.2 billion, representing 51.0% of our consolidated revenues. As of December 31, 2018, our wireless operations represented approximately 76.6% of our total RGUs.
Voice and Data
Our wireless subsidiaries provide voice communication services across the countries in which they operate. We offer international roaming services to our wireless subscribers through a network of cellular service providers with which our wireless subsidiaries have entered into international roaming agreements around the world, and who provide GSM, 3G and4G-LTE roaming services.
10
The voice and data plans are either “postpaid,” where the customer is billed monthly for the previous month, or “prepaid,” where the customer pays in advance for a specified volume of use over a specified period. Postpaid plans increased as a percentage of the wireless base from 25.3% in December 2017 to 27.5% as of December 31, 2018, while prepaid plans represented 72.5%.
Our wireless voice services are offered under a variety of plans to meet the needs of different market segments. In addition, we often bundle wireless data communications services together with wireless voice services. Our wireless subsidiaries had approximately 276 million wireless voice and data subscribers as of December 31, 2018.
Prepaid customers typically generate lower levels of usage and are often unwilling or financially ineligible to purchase postpaid plans. Our prepaid plans have been instrumental to increase wireless penetration in Latin America and Eastern Europe to levels similar to those of developed markets. Additionally, prepaid plans entail little to no risk ofnon-payment, as well as lower customer acquisition costs and billing expenses, compared to the average postpaid plan.
In general, our average rates per minute of wireless voice are very competitive for both prepaid and postpaid plans. The rates in 2018 decreased an average of 11.12%, at constant exchange rates relative to 2017. In addition, the plans we offer our retail customers include selective discounts and promotions that reduce the rates our customers pay.
Value-Added Services
As part of our wireless data business, our subsidiaries offer value-added services that include Internet access, messaging and other wireless entertainment and corporate services through GSM/EDGE, 3G and 4G LTE networks. Internet services include roaming capability and wireless Internet connectivity for feature phones, smartphones, tablets and laptops, including data transmission,e-mail services, instant messaging, content streaming and interactive applications. For example, in Mexico, our website for our wireless services (www.telcel.com) through
Radiomóvil Dipsa, S.A. de C.V (“Telcel”), offers a wide range of services and content such as video, music, games and other applications, which our subscribers can access from mobile devices. In addition, we offer other wireless services, including wireless security services, mobile payment solutions,machine-to-machine services, mobile banking, virtual private network (“VPN”) services, video calls and Personal Communications Service (“PCS”).
Fixed Operations
In 2018, our fixed voice, data, broadband and IT solutions had revenues of Ps.222.6 billion, representing 21.4% of our consolidated revenues. As of December 31, 2018, our fixed operations represented approximately 23.4% of our total RGUs, compared to 22.9% as of December 31, 2017.
Voice
Our fixed voice services include local, domestic and international long-distance and public telephone services, under a variety of plans to meet the needs of different market segments, specifically tailored to our residential and corporate clients.
Data
We offer data services, including data centers, data administration and hosting services to our residential and corporate clients under a variety of plans.
Broadband
We provide residential broadband access through hybrid fiber-coaxial (“HFC”) or fiber-optic cable. These services are typically bundled with voice services and are competitively priced as a function of the desired or available speed. As a complement to these services, we offer a number of products such as home networking and smart home services.
11
IT Solutions
Our subsidiaries provide a number of different IT solutions for small businesses and large corporations. We also provide specific solutions to the industrial, financial, government and tourism sectors, among others.
Pay TV
We offer Pay TV through cable and satellite TV subscriptions to both retail and corporate customers under a variety of plans. As of December 31, 2018, we had approximately 21.5 million Pay TV RGUs, a decrease of approximately 88.2 thousand Pay TV RGUs from the prior year.
Equipment, Accessories and Computer Sales
Equipment, accessories and computer sales revenues primarily include revenues from the sale of handsets, accessories and other equipment.
Other Services
Other services include revenues from other businesses, such as telephone directories, call center services, wireless security services, advertising, media and software development services.
OTT Services
We sell video, audio and other media content that is delivered through the internet directly from the content provider to the viewer or end user. Our most important service is ClaroVideo, anon-demand internet streaming video provider with more than 25,000 content titles sold across all the Latin American and Caribbean markets in which we operate. We offer bundled packages of ClaroVideo, which may include:
| • | | Subscription video on demand, providing unlimited access to a catalogue of over 15,000 titles for a fixed monthly subscription fee; |
| • | | Transactional video on demand and electronic sell-through, offering the option to rent or buy new content releases; and |
| • | | Add-on services such as subscription and other OTT services through a platform payment system, including access to FOX, HBO and Noggin. |
We also offer an advertised and unlimited music streaming and downloading service in 16 countries in Latin America and Europe through ClaroMúsica, with access to more than 50,000 titles across all music genres.
Services and Products by Country
The following table is a summary of our principal services rendered and products produced as of December 31, 2018 in the countries in which we operate.
12
| | | | | | | | |
| | | | |
| | | WIRELESS VOICE, DATA AND VALUE
ADDED SERVICES(1) | | FIXED VOICE,
BROADBAND, DATA
AND IT SERVICES(2) | | PAY TV | | OTT SERVICES(3) |
| | | | | |
| Argentina | | ✓ | | ✓ | | ✓ | | ✓ |
| | | | | |
| Austria | | ✓ | | ✓ | | ✓ | | ✓ |
| | | | | |
| Belarus | | ✓ | | ✓ | | ✓ | | ✓ |
| | | | | |
| Brazil | | ✓ | | ✓ | | ✓ | | ✓ |
| | | | | |
| Bulgaria | | ✓ | | ✓ | | ✓ | | ✓ |
| | | | | |
| Chile | | ✓ | | ✓ | | ✓ | | ✓ |
| | | | | |
| Colombia | | ✓ | | ✓ | | ✓ | | ✓ |
| | | | | |
| Costa Rica | | ✓ | | ✓ | | ✓ | | ✓ |
| | | | | |
| Croatia | | ✓ | | ✓ | | ✓ | | ✓ |
| | | | | |
| Dominican Republic | | ✓ | | ✓ | | ✓ | | ✓ |
| | | | | |
| Ecuador | | ✓ | | ✓ | | ✓ | | ✓ |
| | | | | |
| El Salvador | | ✓ | | ✓ | | ✓ | | ✓ |
| | | | | |
| Guatemala | | ✓ | | ✓ | | ✓ | | ✓ |
| | | | | |
| Honduras | | ✓ | | ✓ | | ✓ | | ✓ |
| | | | | |
| Macedonia | | ✓ | | ✓ | | ✓ | | |
| | | | | |
| Mexico | | ✓ | | ✓ | | | | ✓(4) |
| | | | | |
| Nicaragua | | ✓ | | ✓ | | ✓ | | ✓ |
| | | | | |
| Panama | | ✓ | | ✓ | | ✓ | | ✓ |
| | | | | |
| Paraguay | | ✓ | | ✓ | | ✓ | | ✓ |
| | | | | |
| Peru | | ✓ | | ✓ | | ✓ | | ✓ |
| | | | | |
| Puerto Rico | | ✓ | | ✓ | | ✓ | | ✓ |
| | | | | |
| Serbia | | ✓ | | | | | | |
| | | | | |
| Slovenia | | ✓ | | ✓ | | ✓ | | ✓ |
| | | | | |
| Uruguay | | ✓ | | | | | | ✓ |
| | | | | |
| United States | | ✓ | | | | | | |
| |
(1) Includes voice communication and international roaming services, interconnection and termination services, SMS, MMS,e-mail, mobile browsing, entertainment and gaming applications. (2) Includes local calls, national and international long-distance. (3) Includes ClaroVideo and ClaroMúsica. (4) Services provided bynon-concessionaire subsidiaries. |
13
Our networks are one of our main competitive advantages. Today, we own and operate one of the largest integrated platforms based on our covered population across 17 countries in Latin America and are in the process of expanding our network in Europe.
INFRASTRUCTURE
For the year ended December 31, 2018, our capital expenditures totaled Ps.151.8 billion, which allowed us to increase our network, to expand our capacity and to upgrade our systems to operate with the latest technologies. With fully convergent platforms, we are able to deliver high-quality voice, video and data products.
As of December 31, 2018, the main components of our infrastructure were comprised of:
| • | | Base stations: 241,990 base stations with 2G, 3G and 4G technologies (of which approximately 65% are equipped with 3G and 4G capabilities) across Latin America and Europe. |
| • | | Fiber-optic network: More than 859 thousand km. Our network passed approximately 75 million homes. |
| • | | Submarine cable system: Capacity of more than 189 thousand km in submarine cable, including theAMX-1 submarine cable that extends 17,500 km and connects the United States to Central and South America with 11 landing points and provides international connectivity to all of our subsidiaries in these geographic areas. |
| • | | Satellites: Six. Star One S.A. (“Star One”) has the most extensive satellite system in Latin America, with a fleet that covers the United States, Mexico, Central America and South America. We use these satellites to supply capacity for DTH services for Claro TV throughout Brazil and in other DTH Operations, as well as cellular backhaul, video |
| | | broadcast and corporate data networks. In 2015 and 2016, we launched the Star One D1 and the Star One C4 to replace two limited capacity satellites. |
| • | | Data centers: 27. We use our data centers to manage a number of cloud solutions, such as Infrastructure as a Service (“IAAS”), Software as a Service (“SAAS”), security solutions and unified communications. |
In the United States, we do not own any wireless telecommunications facilities or hold any wireless spectrum licenses. Instead, we purchase airtime through agreements with wireless service providers and resell airtime to customers. Through these agreements, we have a nationwide “virtual” network, covering almost all areas in which wireless services are available.
TECHNOLOGY
Our primary wireless networks use GSM/EDGE, 3G and 4G LTE technologies, which we offer in most of the countries where we operate. We aim to increase the speed of transmission of our data services and have been expanding our 3G and 4G LTE coverage. In 2018, we rolled out our 4.5G coverage in most of our operations.
We transmit wireless calls and data through radio frequencies that we use under spectrum licenses. Spectrum is a limited resource, and, as a result, we may face spectrum and capacity constraints on our wireless network. We continue to invest significant capital in expanding our network capacity and reach and to address spectrum and capacity constraints on amarket-by-market basis. In 2018, we spent Ps.4.2 billion on the acquisition of spectrum licenses, mainly in Paraguay and Argentina.
The table below presents a summary of the population covered by our network, by country, as of December 31, 2018.
14
| | | | | | | | | | | | |
GENERATION TECHNOLOGY | |
| | | GSM | | | | UMTS | | | | LTE | |
| | (% of covered population) | |
| | | | |
Argentina | | | 98 | | | | 91 | | | | 88 | |
| | | | |
Austria | | | 100 | | | | 98 | | | | 98 | |
| | | | |
Belarus | | | 99 | | | | 99 | | | | — | |
| | | | |
Brazil | | | 93 | | | | 94 | | | | 81 | |
| | | | |
Bulgaria | | | 100 | | | | 100 | | | | 99 | |
| | | | |
Chile | | | 99 | | | | 97 | | | | 94 | |
| | | | |
Colombia | | | 92 | | | | 79 | | | | 61 | |
| | | | |
Costa Rica | | | 74 | | | | 80 | | | | 40 | |
| | | | |
Croatia | | | 99 | | | | 99 | | | | 99 | |
| | | | |
Dominican Republic | | | 100 | | | | 99 | | | | 94 | |
| | | | |
Ecuador | | | 96 | | | | 76 | | | | 59 | |
| | | | |
El Salvador | | | 91 | | | | 82 | | | | 64 | |
| | | | |
Guatemala | | | 89 | | | | 81 | | | | 62 | |
| | | | |
Honduras | | | 86 | | | | 81 | | | | 52 | |
| | | | |
Macedonia | | | 100 | | | | 100 | | | | 99 | |
| | | | |
Mexico | | | 93 | | | | 94 | | | | 86 | |
| | | | |
Nicaragua | | | 85 | | | | 80 | | | | 46 | |
| | | | |
Panama | | | 84 | | | | 84 | | | | 67 | |
| | | | |
Paraguay | | | 76 | | | | 73 | | | | 53 | |
| | | | |
Peru | | | 87 | | | | 80 | | | | 73 | |
| | | | |
Puerto Rico | | | 80 | | | | 96 | | | | 86 | |
| | | | |
Serbia | | | 99 | | | | 98 | | | | 98 | |
| | | | |
Slovenia | | | 100 | | | | 100 | | | | 99 | |
| | | | |
Uruguay | | | 96 | | | | 91 | | | | 80 | |
15
We operate in an intensely competitive industry. Competitive factors within our industry include pricing, brand recognition, service and product offerings, customer experience, network coverage and quality, development and deployment of technologies, availability of additional spectrum licenses and regulatory developments.
Our principal competitors differ, depending on the geographical market and the types of service we offer. We compete against other providers, of wireless, broadband and Pay TV that operate on a multi-national level, such as AT&T Inc., Teléfonica and Millicom, as well as various providers that operate on a nationwide level, such as Telecom Argentina and TIM. Competition remains intense as a result of saturation in the fixed and wireless
market, increased network investment by our competitors, the development and deployment of new technologies, the introduction of new products and services, new market entrants, the availability of additional spectrum, both licensed and unlicensed, and regulatory changes.
The effects of competition on our subsidiaries depend, in part, on the size, service offerings, financial strength and business strategies of their competitors, regulatory developments and the general economic and business climate in the countries in which they operate, including demand growth, interest rates, inflation and exchange rates. The effects could include loss of market share and pressure to reduce rates. See “Regulation” under Part VI and “Risk Factors” under Part III of this annual report.
|
ACQUISITIONS, OTHER INVESTMENTS AND DIVESTITURES |
Geographic diversification has been a key to our financial success, as it has provided for greater stability in our cash flow and profitability and has contributed to our strong credit ratings. In recent years, we have been evaluating the expansion of our operations to regions outside of Latin America. We believe that Europe and other areas beyond Latin America present opportunities for investment in the telecommunications sector that could benefit us and our shareholders over the long term.
We continue to seek investment opportunities in telecommunications and related companies worldwide, including in markets where we are already present, and we often have several possible acquisitions under consideration. We can give no assurance as to the extent, timing or cost of such investments.
We may pursue opportunities in Latin America or in other areas in the world. Some of the assets that we acquire may require significant funding for capital expenditures.
We continue to make incremental acquisitions in areas that we consider accretive to our existing operations. For additional information on our acquisitions and investments, see Recent Developments above and note 12 to our audited consolidated financial statements included in this annual report.
16
|
MARKETING, SALES AND DISTRIBUTION, CUSTOMER SERVICES |
MARKETING
We advertise our services and products through different channels with consistent and distinct branding and targeted marketing. We advertise via print, radio, television, digital media, sports event sponsorships and other outdoor advertising campaigns. In 2018, our efforts were mainly focused on promoting our 4.5G LTE services, leveraging the speed and quality of our networks and our fixed bundled offers, which compete on broadband speed and premium content.
We build on the strength of our well-recognized brand names to increase consumer awareness and customer loyalty. Building brand recognition is crucial for our business, and we have managed to position our brands as those of a premium carrier in most countries where we operate. For example, Claro is the most valuable telecom brand in the Latin America region, according to the Telecoms 300 2018 report by Brand Finance. BrandZ’s Top 50 Most Valuable Latin American Brands 2018 list ranked Telcel among thetop-ten brands in Latin America. In the same year, BrandZ also named Telcel and Telmex as the highest recognized telecom brands in Mexico, and Telcel and Claro as two of the highest-ranked telecom brands in Latin America. In addition, Embratel and NET, our brands in Brazil, are among the top fifteen most valuable brands in the country. A 2018 study by Austrian Brand Monitor found that
A1, the brand name behind Telekom Austria, ranked number one in the Austrian telecommunications market for brand awareness, as well as for brand perception as a premium brand.
SALES AND DISTRIBUTION
Our extensive sales and distribution channels help us attract new customers and develop new business opportunities. We primarily sell our services and products through a network of retailers and service centers for retail customers and a dedicated sales force for corporate customers, with more than 450,000 points of sale and almost 2,800 customer service centers. Our subsidiaries also sell their services and products online.
CUSTOMER SERVICES
We give priority to providing our customers with quality customer care and support, with approximately 120,000 employees dedicated to customer service. We focus our efforts on constantly improving our customers’ experience by leveraging our commercial offerings and our sales and distribution networks. Customers may make inquiries by calling a toll-free telephone number, accessing our subsidiaries’ web sites and social media accounts or visiting one of the customer sales and service centers located throughout the countries we serve.
17


PART II OPERATING AND FINANCIAL REVIEW AND PROSPECTS
INTRODUCTION
Segments
We have operations in 25 countries, which are aggregated for financial reporting purposes into ten reportable segments. Our operations in Mexico are presented in two segments—Mexico Wireless and Mexico Fixed, which consist principally of Telcel and Telmex, respectively. Our headquarters operations are allocated to the Mexico Wireless segment. Financial information about our segments is presented in note 22 to our audited consolidated financial statements included in this annual report.
The factors that drive our financial performance differ in the various countries where we operate, including subscriber acquisition costs, the competitive landscape, the regulatory environment, economic factors and interconnection rates, among others. Accordingly, our results of operations in each period reflect a combination of these effects on our different segments.
Constant Currency Presentation
Our financial statements are presented in Mexican pesos, but our operations outside Mexico account for a significant portion of our revenues. Currency variations between the Mexican peso and the currencies of ournon-Mexican subsidiaries, especially the Euro, U.S. dollar, Brazilian real, Colombian and Argentine peso, affect our results of operations as reported in Mexican pesos. In the following discussion regarding our operating results, we include a discussion of the change in the different components of our revenues between periods at constant exchange rates, i.e., using the same exchange rate to translate the local-currency results of ournon-Mexican operations for both periods. We believe that this additional information helps investors better understand the performance of ournon-Mexican operations and their contribution to our consolidated results.
Effects of Exchange Rates
Our results of operations are affected by changes in currency exchange rates. In 2018 compared to 2017, the Mexican peso was stronger against some of our operating currencies (including the Brazilian Real and the Argentine Peso) and weaker against others (including the U.S. Dollar and the Euro).
Since most of our debt is issued by América Móvil out of Mexico, to the extent that our functional currency, the Mexican peso, appreciates or depreciates against the currencies in which our indebtedness is denominated, we
may incur foreign exchange gains or losses that are recorded as other comprehensive income in our consolidated statements of financial position.
Changes in exchange rates also affect the fair value of derivative financial instruments that we use to manage our currency-risk exposure, which are generally not accounted for as hedging instruments. In 2018, the Mexican peso and the Brazilian real weakened against the currencies in which most of our indebtedness is denominated. We recorded net foreign exchange losses of Ps.7.3 billion and net fair value losses on derivatives of Ps.4.7 billion. In 2017, the Mexican peso and the Brazilian real weakened against the currencies in which most of our indebtedness is denominated. We recorded net foreign exchange losses of Ps.13.8 billion, partially offset by net fair value gains on derivatives of Ps.8.2 billion. See note 7 to our audited consolidated financial statements included in this annual report.
Recent Changes in Accounting Standards
We adopted IFRS 15 on revenue recognition for the first time in 2018 using the modified retrospective method, which does not require us to restate our financial information from prior periods. The impact of applying IFRS 15 to our audited consolidated financial statements in 2018 was not significant, see note 2 i) to our audited consolidated financial statements included in this annual report.
We have adopted IFRS 16 on leasing as of January 1, 2019 using the modified retrospective method. The implementation of IFRS 16 will have a significant impact on our consolidated statements of financial position by requiring that we recognizeright-of-use assets and lease liabilities. In our consolidated statements of comprehensive income, we expect the impact of the new standard will be to increase interest expense and depreciation while reducing other operating costs, without a significant impact on net income. The future impact of IFRS 16 on our results of operations will depend not only on the lease agreements in effect at the time of adoption but also on any new lease agreements. For more information, see note 23 to our audited consolidated financial statements included in this annual report.
Effects of Regulation
We operate in a regulated industry. Our results of operations and financial condition have been, and will continue to be, affected by regulatory actions and changes. Significant regulatory developments are presented in more detail in “Regulation” under Part VI and “Risk Factors” under Part III of this annual report.
20
|
COMPOSITION OF OPERATING REVENUES |
In 2018, our total operating revenues were Ps.1,038.2 billion.
Revenues from wireless and fixed voice services primarily include charges from monthly subscriptions, usage charges billed to customers and usage charges billed to other service providers for calls completed on our network. The primary drivers of revenues from monthly subscription charges are the number of total RGUs and the prices of our service packages. The primary driver of revenues from usage charges (airtime, international and long-distance calls and interconnection costs) is traffic, which is represented by the number of total RGUs and their average usage.
Revenues from wireless and fixed data services primarily include charges for data, cloud, internet and OTT services and the usage from our data centers. In addition, revenues from value-added services and IT solutions to corporate clients contribute to our results for wireless and fixed data services, respectively. Revenues from IT solutions to our corporate clients mainly consist of revenues from installing and leasing dedicated links and revenues from VPN services.
Pay TV revenues consist primarily of charges from subscription services, additional programming, includingon-demand programming, and advertising.
Equipment, accessories and computer sales revenues primarily include revenues from the sale of handsets, accessories and other equipment such as office equipment, household appliances and electronics. Most of our sales in handsets are driven by the number of new customers and contract renewals.
Other services primarily include revenues from other businesses, such as advertising and news companies, entertainment content distribution, telephone directories, call center services, wireless security services, network infrastructure services and a software development company.
Seasonality of our Business
Our business is subject to a certain degree of seasonality, characterized by a higher number of new customers during the fourth quarter of each year. We believe this seasonality is mainly driven by the Christmas shopping season. Revenue also tends to decrease during the months of August and September, when family expenses shift towards school supplies in many of the countries in which we operate, mainly Mexico.
General Trends Affecting Operating Results
Our results of operations in 2018 reflected several continuing long-term trends, including:
| • | | intense competition, with growing costs for marketing and subscriber acquisition and retention, as well as declining customer prices; |
| • | | changes in the telecommunications regulatory environment; |
| • | | growing demand for data services over fixed and wireless networks, as well as for smartphones and devices with data service capabilities; |
| • | | declining demand for voice services; and |
| • | | growing operating costs reflecting, among other things, higher costs for Pay TV, customer care services and managing larger and more complex networks. |
These trends are broadly characteristic of our businesses in all regions in recent years, and they have affected comparable telecommunications providers as well. Our performance in recent years has also been affected by ongoing regulatory changes in Mexico.
21
CONSOLIDATED RESULTS OF OPERATIONS FOR 2018 AND 2017
Operating Revenues
Total operating revenues for 2018 increased by 1.6%, or Ps.16.6 billion, over 2017. At constant exchange rates, total operating revenues for 2018 increased by 3.5% over 2017. This increase principally reflects increases in revenues from our mobile and fixed data services, and equipment, accessories and computer sales operations, which were partially offset by a decrease in revenues from our mobile and fixed voice services.
REVENUES SERVICES.Revenues services for 2018 decreased by 1.7%, or Ps.14.8 billion, over 2017. At constant exchange rates, revenues services for 2018 increased by 0.5% over 2017. This increase principally reflects increases in revenues from our mobile voice and fixed and mobile data services, which were partially offset by a decrease in revenues from our fixed voice services.
SALES OF EQUIPMENT, ACCESSORIES AND COMPUTERS.Sales of equipment, accessories and computer sales revenues for 2018 increased by 21.9%, or Ps.31.3 billion, over 2017. At constant exchange rates, revenues from sales of equipment, accessories and computer sales for 2018 increased by 22.1% over 2017. This increase principally reflects higher sales of data-enabled devices and accesories.
Operating Costs and Expenses
COST OF SALES. Cost of sales was Ps.180.0 billion for 2018, an increase of 5.8% from Ps.170.2 billion in 2017. At constant exchange rates, cost of sales for 2018 increased by 5.5% over 2017. This increase principally reflects sales ofhigher-end smartphones provided to our postpaid subscribers and an increase in handset financing plans.
COST OF SERVICES.Cost of services was Ps.328.8 billion for 2018, an increase of 0.8% from Ps.326.2 billion in 2017. At constant exchange rates, cost of services for 2018 increased by 2.8% over 2017. This increase principally reflects an increase in costs related to network operations, including energy and leasing tower sites, third-party technical and IT services, as well as TV content acquisition, which was partially offset by our coporate cost-savings program.
COMMERCIAL, ADMINISTRATIVE AND GENERAL EXPENSES.Commercial, administrative and general expenses for 2018 decreased by 5.6%, or Ps.13.4 billion, over 2017. As a percentage of operating revenues, commercial, administrative and general expenses were 21.9% for 2018, as compared to 23.6% for 2017. At constant exchange rates, commercial, administrative and general expenses for 2018 decreased by 3.8% over 2017. This decrease principally reflects a decrease in costs related to customer services, systems development and local taxes.
OTHER EXPENSES.Other expenses for 2018 decreased by Ps.17.4 billion over 2017, principally reflecting the payment in 2017 of an arbitration award granted in Colombia.
DEPRECIATION AND AMORTIZATION.Depreciation and amortization for 2018 decreased by 2.8%, or Ps.4.5 billion, over 2017. As a percentage of operating revenues, depreciation and amortization was 15.0% for 2018, as compared to 15.7% for 2017. At constant exchange rates, depreciation and amortization for 2018 decreased by 1.8% over 2017.
Operating Income
Operating income for 2018 increased by 39.4%, or Ps.39.4 billion, over 2017. Operating margin (operating income as a percentage of operating revenues) was 13.4% for 2018, as compared to 9.8% for 2017.
Non-Operating Items
NET INTEREST EXPENSE.Net interest expense (interest expense less interest income) for 2018 decreased by 22.8%, or Ps.6.3 billion, over 2017. This decrease principally reflects the favorable resolution of certain tax contingencies.
FOREIGN CURRENCY EXCHANGE LOSS, NET.We recorded a net foreign currency exchange loss of Ps.7.3 billion for 2018, compared to our net foreign currency exchange loss of Ps.13.8 billion for 2017. The loss principally reflects the depreciation of some of the currencies in which our indebtedness is denominated, particularly the Euro and the pound sterling.
VALUATION OF DERIVATIVES, INTEREST COST FROM LABOR OBLIGATIONS AND OTHER FINANCIAL ITEMS, NET. We recorded a loss of Ps.10.2 billion for 2018 on the
22
valuation of derivatives, interest cost from labor obligations and other financial items, net, compared to a loss of Ps.1.9 billion for 2017. The loss in 2018 principally reflects a derivatives loss, which was partially offset by gains in our monetary position.
INCOME TAX.Our income tax expense for 2018 increased by 86.3%, or Ps.21.5 billion, over 2017. This increase principally reflects higher pretax income due to a smaller foreign exchange loss in 2018 compared to 2017.
Our effective corporate income tax rate as a percentage of profit before income tax was 46.0% for 2018, compared to 43.7% for 2017. This rate differed from the Mexican statutory rate of 30% and changed year over year principally as a result of changes in permanent items such as local tax inflation effects and other impacts ofnon-taxable items.
Net Profit
We recorded a net profit of Ps.54.5 billion for 2018, an increase of 69.5%, or Ps.22.4 billion, over 2017.
CONSOLIDATED RESULTS OF OPERATIONS FOR 2017 AND 2016
Operating Revenues
Total operating revenues for 2017 increased by 4.7%, or Ps.46.2 billion, over 2016. At constant exchange rates, total operating revenues for 2017 increased by 2.0% over 2016. This increase principally reflects increases in revenues from our mobile data, fixed data and Pay TV operations, which were partially offset by a decrease in revenues from our mobile voice and fixed voice operations.
MOBILE VOICE.Mobile voice revenues for 2017 decreased by 8.5%, or Ps.20.6 billion, over 2016. At constant exchange rates, mobile voice revenues for 2017 decreased by 10.8% over 2016. This decrease principally reflects reduced interconnection rates and traffic in international and domestic long-distance calls, which was driven by higher data usage due to the growing use of social networking platforms.
FIXED VOICE.Fixed voice revenues for 2017 decreased by 5.7%, or Ps.5.4 billion, over 2016. At constant exchange rates, fixed voice revenues for 2017 decreased by 9.1% over
2016. This decrease principally reflects reduced interconnection rates and traffic in international and domestic long-distance calls, which was driven by the growing use of wireless technology and broadband voice services, such as WiFi calling.
MOBILE DATA.Mobile data revenues for 2017 increased by 20.1%, or Ps.51.6 billion, over 2016. At constant exchange rates, mobile data revenues for 2017 increased by 18.8% over 2016. This increase principally reflects the increased use of mobile data services, such as media and content downloading, web browsing, content streaming andmachine-to-machine services, which was driven in part by the growing use of social networking apps and content downloading on tablets and notebooks.
FIXED DATA.Fixed data revenues for 2017 increased by 10.3%, or Ps.13.0 billion, over 2016. At constant exchange rates, fixed data revenues for 2017 increased by 5.9% over 2016. This increase principally reflects the growth in residential broadband services and corporate data services, such as cloud, dedicated links and data center services.
PAY TV.Pay TV revenues for 2017 increased by 11.0%, or Ps.8.6 billion, over 2016. At constant exchange rates, Pay TV revenues for 2017 increased by 2.3% over 2016. This increase principally reflects growth in our subscriber base and higher revenues driven by the cross-marketing of bundled packages and new TV channel packages, particularly in Colombia, Central America and the Caribbean.
EQUIPMENT, ACCESSORIES AND COMPUTER SALES. Equipment, accessories and computer sales revenues for 2017 decreased by 0.2%, or Ps.0.3 billion, over 2016. At constant exchange rates, revenues from equipment, accessories and computer sales for 2017 decreased by 0.7% over 2016. This decrease principally reflects lower sales ofhigher-end smartphones, other data-enabled devices and tablets, which were partially offset by higher sales oflower-end smartphones due to subsidies provided to our postpaid subscribers and handset financing plans.
OTHER SERVICES.Revenues from other services for 2017 decreased by 2.1%, or Ps.0.7 billion, over 2016. At constant exchange rates, revenues from other services for 2017 decreased by 5.0% over 2016. This decrease principally
23
reflects lower revenues from advertising and media services, online content, wireless security services, telephone directories and call center services.
Operating Costs and Expenses
COST OF SALES AND SERVICES.Cost of sales and services for 2017 increased by 2.3%, or Ps.11.3 billion, over 2016, representing 48.6% of operating revenues for 2017, as compared to 49.7% of operating revenues for 2016. At constant exchange rates, cost of sales and services for 2017 decreased by 0.2% over 2016.
Cost of sales was Ps.170.2 billion for 2017, a decrease of 1.4% from Ps.172.5 billion in 2016. This decrease principally reflects higher sales oflower-end smartphones, which were driven by subsidies provided to our postpaid subscribers and an increase in handset financing plans, and improvements in the inventory management of our handsets.
Cost of services was Ps.326.2 billion for 2017, an increase of 4.4% from Ps.312.6 billion in 2016. This increase principally reflects an increase in costs related to network operations, including energy and leasing tower sites, third-party technical and IT services, as well as TV content acquisition.
COMMERCIAL, ADMINISTRATIVE AND GENERAL EXPENSES.Commercial, administrative and general expenses for 2017 increased by 5.5%, or Ps.12.5 billion, over 2016. As a percentage of operating revenues, commercial, administrative and general expenses were 23.6% for 2017, as compared to 23.4% for 2016. At constant exchange rates, commercial, administrative and general expenses for 2017 increased by 2.2% over 2016. This increase principally reflects an increase in costs related to customer services, allowance for doubtful accounts, systems development and local taxes.
Telcel and Telmex, like other Mexican companies, are required by law to pay their employees, in addition to their agreed compensation and benefits, profit sharing in an aggregate amount equal to 10.0% of each entity’s taxable income. Our subsidiaries in Ecuador and Peru are also required to pay employee profit sharing at rates of 15.0% and 10.0% of taxable income, respectively. We account for these profit sharing contributions under commercial, administrative and general expenses.
OTHER EXPENSES.Other expenses for 2017 increased by Ps.20.2 billion over 2016, principally reflecting the payment
of an arbitration award granted in Colombia. For further information on this arbitration proceeding, see note 16 to our audited consolidated financial statements included in this annual report.
DEPRECIATION AND AMORTIZATION.Depreciation and amortization for 2017 increased by 7.8%, or Ps.11.6 billion, over 2016. As a percentage of operating revenues, depreciation and amortization was 15.7% for 2017, as compared to 15.2% for 2016. At constant exchange rates, depreciation and amortization for 2017 increased by 3.4% over 2016. This increase principally reflects investments in our networks and the acceleration of amortizing the costs of various brands of Telekom Austria.
Operating Income
Operating income for 2017 decreased by 8.6%, or Ps.9.5 billion, over 2016. Operating margin (operating income as a percentage of operating revenues) was 9.8% for 2017, as compared to 11.2% for 2016. Excluding the effects of the approximately U.S.$1.0 billion arbitration payment in Colombia, operating income increased by 8.3%, or Ps.9.1 billion, over 2016.
Non-Operating Items
NET INTEREST EXPENSE.Net interest expense (interest expense less interest income) for 2017 decreased by 7.7%, or Ps.2.3 billion, over 2016. This decrease principally reflects lower interest expense due to the amortization of debt during this period.
FOREIGN CURRENCY EXCHANGE LOSS, NET.We recorded a net foreign currency exchange loss of Ps.13.8 billion for 2017, compared to our net foreign currency exchange loss of Ps.40.4 billion for 2016. The loss in both periods principally reflects the appreciation of some of the currencies in which our indebtedness is denominated, particularly the U.S. dollar, the Euro and the pound sterling.
VALUATION OF DERIVATIVES, INTEREST COST FROM LABOR OBLIGATIONS AND OTHER FINANCIAL ITEMS, NET.We recorded a loss of Ps.1.9 billion for 2017 on the valuation of derivatives, interest cost from labor obligations and other financial items, net, compared to a loss of Ps.16.2 billion for 2016. The net loss in 2017 principally reflects the interest cost of labor obligations, which was partially offset by a gain in valuation of derivatives.
24
EQUITY INTEREST IN NET INCOME OF ASSOCIATED COMPANIES.Our share of the net income of associated companies accounted for under the equity method was Ps.0.1 billion in 2017, as compared to Ps.0.2 billion for 2016.
INCOME TAX.Our income tax expense for 2017 increased by 118.8%, or Ps.13.5 billion, over 2016. This increase principally reflects the effect of a smaller foreign exchange loss than the one observed in 2016.
Our effective corporate income tax rate as a percentage of profit before income tax was 43.7% for 2017, compared to
48.6% for 2016. This rate differed from the Mexican statutory rate of 30% and changed year over year principally as a result of changes in permanent items such as the valuation of derivatives and other impacts ofnon-taxable items. We are evaluating the impact of the U.S. income tax reform on our U.S. operations, but we do not expect a material impact on our effective corporate income tax rate.
Net Profit
We recorded a net profit of Ps.32.2 billion for 2017, an increase of 166.2%, or Ps.20.1 billion, over 2016.
25
SEGMENT RESULTS OF OPERATIONS
We discuss below the operating results of each reportable segment. Notes 2 z) and 22 to our audited consolidated financial statements describe how we translate the financial statements of ournon-Mexican subsidiaries. Exchange rate changes between the Mexican peso and the currencies in which our subsidiaries operate affect our reported results in Mexican pesos and the comparability of reported results between periods.
The following table sets forth the exchange rates used to translate the results of our significantnon-Mexican operations, as expressed in Mexican pesos per foreign currency unit, and the change from the rate used in the prior period indicated. The U.S. dollar is our functional currency in several of the countries or territories in which we operate in addition to the United States, including Ecuador, Puerto Rico, Panama and El Salvador.
| | | | | | | | | | | | | | | | | | | | |
MEXICAN PESOS PER FOREIGN CURRENCY UNIT (AVERAGE FOR THE PERIOD) | |
| | | | | | 2016/2017 | | | | | | 2017/2018 | | | | |
| | | 2016 | | | % CHANGE | | | 2017 | | | % CHANGE | | | 2018 | |
| | | | | | |
Brazilian real | | | 5.3868 | | | | 10.2 | | | | 5.9346 | | | | (10.8 | ) | | | 5.2937 | |
| | | | | | |
Colombian peso | | | 0.0061 | | | | 4.9 | | | | 0.0064 | | | | 1.6 | | | | 0.0065 | |
| | | | | | |
Argentine peso | | | 1.2632 | | | | (9.0 | ) | | | 1.1489 | | | | (36.4 | ) | | | 0.7311 | |
| | | | | | |
U.S. dollar | | | 18.6529 | | | | 1.5 | | | | 18.9400 | | | | 1.6 | | | | 19.2397 | |
| | | | | | |
Euro | | | 20.6334 | | | | 3.5 | | | | 21.3649 | | | | 6.3 | | | | 22.7101 | |
The tables below set forth operating revenues and operating income for each of our segments for the years indicated.
| | | | | | | | | | | | | | | | |
YEAR ENDED DECEMBER 31, 2018 | |
| | | OPERATING REVENUES | | | OPERATING INCOME | |
| | | (in millions of
Mexican pesos) | | | (as a % of total
operating revenues) | | | (in millions of
Mexican pesos) | | | (as a % of total
operating income) | |
| | | | | |
Mexico Wireless | | Ps. | 224,557 | | | | 21.6 | % | | Ps. | 57,451 | | | | 41.2 | % |
| | | | | |
Mexico Fixed | | | 96,081 | | | | 9.3 | | | | 8,086 | | | | 5.8 | |
| | | | | |
Brazil | | | 193,306 | | | | 18.6 | | | | 23,495 | | | | 16.8 | |
| | | | | |
Colombia | | | 75,805 | | | | 7.3 | | | | 14,389 | | | | 10.3 | |
| | | | | |
Southern Cone | | | 102,350 | | | | 9.9 | | | | 16,976 | | | | 12.2 | |
| | | | | |
Andean Region | | | 55,787 | | | | 5.4 | | | | 5,004 | | | | 3.6 | |
| | | | | |
Central America | | | 45,033 | | | | 4.3 | | | | 4,868 | | | | 3.5 | |
| | | | | |
United States | | | 153,266 | | | | 14.8 | | | | 2,665 | | | | 1.9 | |
| | | | | |
Caribbean | | | 36,640 | | | | 3.5 | | | | 5,812 | | | | 4.2 | |
| | | | | |
Europe | | | 100,716 | | | | 9.7 | | | | 4,732 | | | | 3.4 | |
| | | | | |
Eliminations | | | (45,333 | ) | | | (4.4 | ) | | | (3,921 | ) | | | (2.9 | ) |
| | | | | |
Total | | Ps. | 1,038,208 | | | | 100.0 | % | | Ps. | 139,557 | | | | 100.0 | % |
26
| | | | | | | | | | | | | | | | |
YEAR ENDED DECEMBER 31, 2017 | |
| | | OPERATING REVENUES | | | OPERATING INCOME | |
| | | (in millions of
Mexican pesos) | | | (as a % of total
operating revenues) | | | (in millions of
Mexican pesos) | | | (as a % of total
operating income) | |
| | | | | |
Mexico Wireless | | Ps. | 206,771 | | | | 20.2 | % | | Ps. | 50,666 | | | | 50.6 | % |
| | | | | |
Mexico Fixed | | | 98,485 | | | | 9.6 | | | | 7,922 | | | | 7.9 | |
| | | | | |
Brazil | | | 215,322 | | | | 21.1 | | | | 11,601 | | | | 11.6 | |
| | | | | |
Colombia | | | 72,740 | | | | 7.1 | | | | (4,704 | ) | | | (4.7 | ) |
| | | | | |
Southern Cone | | | 82,344 | | | | 8.1 | | | | 11,676 | | | | 11.7 | |
| | | | | |
Andean Region | | | 56,571 | | | | 5.5 | | | | 5,650 | | | | 5.6 | |
| | | | | |
Central America | | | 44,282 | | | | 4.3 | | | | 5,252 | | | | 5.2 | |
| | | | | |
United States | | | 148,590 | | | | 14.5 | | | | 2,915 | | | | 2.9 | |
| | | | | |
Caribbean | | | 35,215 | | | | 3.4 | | | | 4,752 | | | | 4.7 | |
| | | | | |
Europe | | | 93,644 | | | | 9.2 | | | | 4,524 | | | | 4.5 | |
| | | | | |
Eliminations | | | (32,330 | ) | | | (3.0 | ) | | | (111 | ) | | | (0.0 | ) |
| | | | | |
Total | | Ps. | 1,021,634 | | | | 100.0 | % | | Ps. | 100,143 | | | | 100.0 | % |
| | | | | | | | | | | | | | | | |
YEAR ENDED DECEMBER 31, 2016 | |
| | | OPERATING REVENUES | | | OPERATING INCOME | |
| | | (in millions of
Mexican pesos) | | | (as a % of total
operating revenues) | | | (in millions of
Mexican pesos) | | | (as a % of total
operating income) | |
| | | | | |
Mexico Wireless | | Ps. | 203,567 | | | | 20.9 | % | | Ps. | 48,220 | | | | 44.0 | % |
| | | | | |
Mexico Fixed | | | 102,216 | | | | 10.5 | | | | 12,276 | | | | 11.2 | |
| | | | | |
Brazil | | | 197,357 | | | | 20.2 | | | | 6,325 | | | | 5.8 | |
| | | | | |
Colombia | | | 67,589 | | | | 6.9 | | | | 11,210 | | | | 10.2 | |
| | | | | |
Southern Cone | | | 72,330 | | | | 7.4 | | | | 8,317 | | | | 7.6 | |
| | | | | |
Andean Region | | | 56,131 | | | | 5.8 | | | | 6,087 | | | | 5.6 | |
| | | | | |
Central America | | | 42,421 | | | | 4.3 | | | | 3,831 | | | | 3.5 | |
| | | | | |
United States | | | 140,856 | | | | 14.4 | | | | 1,221 | | | | 1.1 | |
| | | | | |
Caribbean | | | 36,498 | | | | 3.7 | | | | 6,143 | | | | 5.6 | |
| | | | | |
Europe | | | 86,979 | | | | 8.9 | | | | 5,389 | | | | 4.9 | |
| | | | | |
Eliminations | | | (30,532 | ) | | | (3.0 | ) | | | 591 | | | | 0.5 | |
| | | | | |
Total | | Ps. | 975,412 | | | | 100.0 | % | | Ps. | 109,610 | | | | 100.0 | % |
27
INTERPERIOD SEGMENT COMPARISONS
The following discussion addresses the financial performance of each of our reportable segments, first by comparing results for 2018 and 2017 and then by comparing results for 2017 and 2016. In theyear-to- year comparisons for each segment, we include percentage changes in operating revenues, percentage changes in operating income and operating margin (operating income as a percentage of operating revenues), in each case calculated based on the segment financial information presented in note 22 to our audited consolidated financial statements, which is prepared in accordance with IFRS.
Each reportable segment includes all income, cost and expense eliminations that occurred between subsidiaries within the reportable segment. The Mexico Wireless segment also includes corporate income, costs and expenses.
Comparisons in the following discussion are calculated using figures in Mexican pesos. We also include percentage changes in adjusted segment operating revenues, adjusted segment operating income and adjusted operating margin (adjusted operating income as a percentage of adjusted operating revenues). The adjustments eliminate (i) certain intersegment transactions, (ii) for ournon-Mexican segments, the effects of exchange rate changes and (iii) for the Mexican Wireless segment only, revenues and costs of group corporate activities and other businesses that are allocated to the Mexico Wireless segment.
2018 COMPARED TO 2017
Mexico Wireless
The number of prepaid wireless subscribers for 2018 increased by 1.4% over 2017, and the number of postpaid wireless subscribers increased by 5.8%, resulting in an increase in the total number of wireless subscribers in Mexico of 2.2%, or 1.5 million, to approximately 75.0 million as of December 31, 2018.
Segment operating revenues for 2018 increased by 8.6% over 2017. Adjusted segment operating revenues for 2018 increased by 11.4% over 2017. This increase in segment operating revenues principally reflects an increase of 11.7% in mobile data revenues, driven by increased use of value-
added services by our wireless subscribers, including activity from messaging, content downloading, mobile applications and social media, and an increase in revenues from service plans offering higher data capacity.
Segment operating income for 2018 increased by 13.4% over 2017. Adjusted segment operating income for 2018 increased by 20.2% over 2017.
Segment operating margin was 25.6% in 2018, as compared to 24.5% in 2017. Adjusted segment operating margin for this segment was 31.1% in 2018, as compared to 28.8% in 2017. This increase in segment operating margin for 2018 principally reflects costs related to interconnection rates, licensing fees, mobile site infrastructure rentals, maintenance and roaming charges.
Mexico Fixed
The number of fixed voice RGUs in Mexico for 2018 increased by 1.0% over 2017, and the number of broadband RGUs in Mexico increased by 3.8%, resulting in an increase in total fixed RGUs in Mexico of 2.2% over 2017, or 486 thousand, to approximately 22.0 million as of December 31, 2018.
Segment operating revenues for 2018 decreased by 2.4% over 2017. Adjusted segment operating revenues for 2018 decreased by 3.8% over 2017. This decrease in segment operating revenues principally reflects a decrease in fixed voice revenues of 4.4%, driven by RGU disconnections, a decrease in long-distance calls and a decrease in fixed data revenues of 0.7%, which was partially offset by higher revenues from broadband and corporate network services.
Segment operating income for 2018 increased by 2.1% over 2017. Adjusted segment operating income for 2018 decreased by 18.1% over 2017. This decrease principally reflects lower revenues from long-distance services and equipment sales.
Segment operating margin was 8.4% in 2018, as compared to 8.0% in 2017. Adjusted segment operating margin was 3.7% in 2018, as compared to 4.3% in 2017. This decrease in segment operating margin for 2018 principally reflects increases in costs associated with customer service and service quality improvements, as well as network maintenance.
28
Brazil
The number of prepaid wireless subscribers for 2018 decreased by 14.9% over 2017, and the number of postpaid wireless subscribers increased by 15.6%, resulting in a decrease in the total number of wireless subscribers in Brazil of 4.4%, or 2.6 million, to approximately 56.0 million as of December 31, 2018. The number of fixed voice RGUs for 2018 decreased by 5.0% over 2017, the number of broadband RGUs increased by 5.0%, and the number of Pay TV RGUs decreased by 3.1%, resulting in a decrease in total fixed RGUs in Brazil of 1.7%, or 619 thousand, to approximately 35.0 million as of December 31, 2018.
Segment operating revenues for 2018 decreased by 10.2% over 2017. Adjusted segment operating revenues for 2018 increased by 0.5% over 2017. This increase in segment operating revenues principally reflects higher mobile data and fixed data revenues of 31.0% and 7.6%, respectively, in 2018 over 2017. The increase in mobile data revenues in 2018 principally reflects the usage of social networking platforms, cloud services and content, and fixed data revenues increased principally due to an increase in broadband RGUs and corporate network services. The increase in segment operating revenues was partially offset by a decrease in mobile voice, fixed voice and Pay TV revenues of 31.9%, 17.5% and 5.2%, respectively, in 2018 over 2017, driven by RGU disconnections and lower traffic reflecting a decrease in disposable income.
Segment operating income for 2018 increased by 102.5% over 2017. Adjusted segment operating income for 2018 increased by 172.4% over 2017. This increase principally reflects the favorable resolution of certain tax contingencies.
Segment operating margin was 12.2% in 2018, as compared to 5.4% in 2017. Adjusted segment operating margin was 11.3% in 2018, as compared to 4.2% in 2017. This increase in segment operating margin for 2018 principally reflects synergy gains in marketing, network maintenance, information technology, subscriber acquisition and customer service related to the ongoing integration of our three Brazilian subsidiaries, which have collectively driven our costs down.
Colombia
The number of prepaid wireless subscribers for 2018 increased by 0.4% over 2017, and the number of postpaid wireless subscribers increased by 3.7%, resulting in an increase in the total number of wireless subscribers in Colombia of 1.1%, or 328 thousand, to approximately 30.0 million as of December 31, 2018. The number of fixed voice RGUs for 2018 increased by 10.1% over 2017, the number of broadband RGUs increased by 6.4% and the number of Pay TV RGUs increased by 2.8%, resulting in an increase in total fixed RGUs in Colombia of 6.2%, or 418 thousand, to approximately 7.1 million as of December 31, 2018.
Segment operating revenues for 2018 increased by 4.2% over 2017. Adjusted segment operating revenues for 2018 increased by 2.6% over 2017. This increase in segment operating revenues principally reflects increases in fixed data revenues, mobile data revenues, fixed voice revenues and Pay TV revenues, which increased by 8.9%, 3.2%, 9.0% and 8.6%, respectively, in 2018, principally due to an increase in sales of bundled packages of wireless services, higher demand for data plans and an increase in subscribers for internet services. The increase in segment operating revenues was partially offset by a decrease of 8.1% in mobile voice revenues, driven by more competitive commercial offerings in response to pricing pressure from competitors.
Segment operating income for 2018 was Ps.14.4 billion, compared to a segment operating loss of Ps 4.7 billion in 2017. This change is principally due to the payment in 2017 of an arbitration award granted in Colombia. Adjusted segment operating income for 2018 increased by 576.5% over 2017.
Segment operating margin was 19.0% in 2018, as compared to (6.5%) in 2017. Adjusted segment operating margin was 23.3% in 2018, as compared to (5.0%) in 2017. This increase in segment operating margin for 2018 principally reflects Comcel’s cost savings program.
29
Southern Cone—Argentina, Chile, Paraguay and Uruguay
The number of prepaid wireless subscribers for 2018 decreased by 1.4% over 2017, and the number of postpaid wireless subscribers increased by 1.7%, resulting in a decrease in the total number of wireless subscribers in our Southern Cone segment of 0.3%, or 105 thousand, to approximately 31.0 million as of December 31, 2018. The number of fixed voice RGUs for 2018 increased by 8.3% over 2017, the number of broadband RGUs increased by 12.6%, and the number of Pay TV RGUs increased by 6.1%, resulting in an increase in total fixed RGUs in our Southern Cone segment of 8.7%, or 175 thousand, to approximately 2.2 million as of December 31, 2018.
Segment operating revenues for 2018 increased by 24.3% over 2017. Adjusted segment operating revenues for 2018 increased by 17.4% over 2017. This increase principally reflects an increase of 33.4% in Argentina, Paraguay and Uruguay. This increase was driven by higher data usage, particularly in the form of mobile data, video streaming, content downloading and service package purchases in Argentina, Paraguay and Uruguay and in the form of Pay TV, corporate network and broadband services in Chile. For this segment, we analyze results in Argentina, Paraguay and Uruguay in terms of the Argentine peso, because Argentina accounts for the major portion of the operations in these three countries.
Segment operating income for 2018 increased by 45.4% over 2017. Adjusted segment operating income for 2018 increased by 52.1% over 2017. This increase principally reflects an increase in adjusted operating income of 41.0% in Argentina, Paraguay and Uruguay, which was partially offset by a decrease in adjusted operating loss of 16.2% in Chile.
Segment operating margin was 16.6% in 2018, as compared to 14.2% in 2017. Adjusted segment operating margin was 20.2% in 2018, which increased in comparison to 17.0% in 2017. This increase in the segment operating margin for 2018 principally reflects the cost saving programs of our subsidiaries in the Southern Cone.
Andean Region—Ecuador and Peru
The number of prepaid wireless subscribers for 2018 decreased by 0.1% over 2017, and the number of postpaid wireless subscribers increased by 0.2%, resulting in a decrease in the total number of wireless subscribers in our Andean Region segment of 0.04%, or 8 thousand, to approximately 20.3 million as of December 31, 2018. The number of fixed voice RGUs for 2018 increased by 2.9% over 2017, the number of broadband RGUs increased by 12.4% and the number of Pay TV RGUs decreased by 3.2%, resulting in an increase in total fixed RGUs in our Andean Region segment of 5.2%, or 91 thousand, to approximately 1.8 million as of December 31, 2018.
Segment operating revenues for 2018 decreased by 1.4% over 2017. Adjusted segment operating revenues for 2018 decreased by 2.0% over 2017. This decrease principally reflects a decrease of 0.1% in Ecuador and a decrease of 4.3% in Peru. This decrease was driven by lower revenues from our wireless and fixed voice operations, an increase in tax obligations and bad debt expenses in Ecuador and competitive pricing practices, bundled packages and smartphones subsidies in Peru, which was partially offset by higher revenues from mobile data and higher revenues from fixed data, especially broadband and corporate data services.
Segment operating income for 2018 decreased by 11.4% over 2017. Adjusted segment operating income for 2018 decreased by 5.5% over 2017. This decrease principally reflects a decrease of 15.4% in Peru and a decrease of 0.1% in Ecuador.
Segment operating margin was 9.0% in 2018, as compared to 10.0% in 2017. Adjusted segment operating margin was 15.1% in 2018, as compared to 15.9% in 2017. This decrease in the segment operating margin for 2018 principally reflects gains from our cost- savings program and lower direct taxes in Ecuador as well as operation, information technology, marketing and sales costs, which was partially offset by postpaid subscriber acquisition costs driven by a more aggressively competitive environment in Peru.
30
Central America—Guatemala, El Salvador, Honduras, Nicaragua, Panama and Costa Rica
The number of prepaid wireless subscribers for 2018 decreased by 11.3% over 2017, and the number of postpaid wireless subscribers decreased by 1.5%, resulting in a decrease in the total number of wireless subscribers in our Central America segment of 9.8%, or approximately 1.6 million, to approximately 14.3 million as of December 31, 2018. The number of fixed voice RGUs for 2018 increased by 8.7% over 2017, the number of broadband RGUs increased by 16.0% and the number of Pay TV RGUs increased by 3.2%, resulting in an increase in total fixed RGUs in our Central America segment of 11.3%, or 654 thousand, to approximately 6.4 million as of December 31, 2018.
Segment operating revenues for 2018 increased by 1.7% over 2017. Adjusted segment operating revenues for 2018 were unchanged over 2017.
Segment operating income for 2018 decreased by 7.3% over 2017. Adjusted segment operating income for 2018 decreased by 6.7% over 2017. This decrease principally reflects a decrease of 14.9% in Guatemala and a decrease of 131.5% in Honduras, which was partially offset by an increase of 18.3% in El Salvador, an increase of 3.1% in Nicaragua, an increase of 30.2% in Panama and an increase of 27.7% in Costa Rica.
Segment operating margin was 10.8% in 2018, as compared to 11.9% in 2017. Adjusted segment operating margin was 12.2% in 2018, as compared to 13.1% in 2017. This decrease in segment operating margin for 2018 principally reflects higher costs related to doubtful accounts, aone-time charge related to the settlement of an interconnection dispute in Guatemala and an unusual charge arising from a government challenge to tax credits in Honduras.
Caribbean—Dominican Republic and Puerto Rico
The number of prepaid wireless subscribers for 2018 increased by 4.8% over 2017, and the number of postpaid wireless subscribers increased by 3.7%, resulting in an increase in the total number of wireless subscribers in our Caribbean segment of 4.4%, or approximately 250 thousand, to approximately 5.9 million as of December 31, 2018. The
number of fixed voice RGUs for 2018 decreased by 8.1% over 2017, the number of broadband RGUs decreased by 6.4% and the number of Pay TV RGUs increased by 3.9%, resulting in a decrease in total fixed RGUs in our Caribbean segment of 5.7%, or 154 thousand, to approximately 2.6 million as of December 31, 2018.
Segment operating revenues for 2018 increased by 4.0% over 2017. Adjusted segment operating revenues for 2018 increased by 2.6% over 2017. This increase in segment operating revenues principally reflects an increase in segment mobile data revenues and an increase in Pay TV revenues in the Dominican Republic, which was partially offset by lower revenues from wireless and fixed voice services in Puerto Rico. We analyze segment results in U.S. dollars because it is the functional currency of our operations in Puerto Rico, and the currency of the Dominican Republic is relatively stable against the U.S. dollar.
Segment operating income for 2018 increased by 22.3% over 2017. Adjusted segment operating income for 2018 increased by 20.7% over 2017. This increase principally reflects an increase of 21.9% in the Dominican Republic and an increase of 730.5% in Puerto Rico.
Segment operating margin was 15.9% in 2018, as compared to 13.5% in 2017. Adjusted segment operating margin was 16.3% in 2018, as compared to 13.8% in 2017. This increase in segment operating margin for 2018 principally reflects lower unusual costs in 2018 related to the reconstruction and operation of our networks in the aftermath of Hurricane Maria, as well as increased revenues in the Dominican Republic and our corporate cost-savings program.
United States
The number of prepaid wireless subscribers for 2018 decreased by 6.2% over 2017, or approximately 1.4 million, to approximately 22.0 million total wireless subscribers in the United States as of December 31, 2018.
Segment operating revenues for 2018 increased by 3.1% over 2017. Adjusted segment operating revenues for 2018 increased by 1.6% over 2017. This increase in segment operating revenues principally reflects higher mobile voice and data usage and revenues driven by the success of existing unlimited data plans and increased equipment sales ofhigher-end smartphones.
31
Segment operating income for 2018 decreased by 8.6% over 2017. Adjusted segment operating income for 2018 decreased by 17.4% over 2017.
Segment operating margin was 1.7% in 2018, as compared to 2.0% in 2017. Adjusted segment operating margin was 6.8% in 2018, as compared to 8.4% in 2017. This decrease in segment operating margin for 2018 principally reflects an increase in content costs as a result of increased data usage.
Europe
The number of prepaid wireless subscribers for 2018 decreased by 5.8% over 2017, and the number of postpaid wireless subscribers increased by 4.1%, resulting in an increase in the total number of wireless subscribers in our Europe segment of 1.7%, or approximately 342 thousand, to approximately 21.0 million as of December 31, 2018. The number of fixed voice RGUs for 2018 decreased by 2.9% over 2017, the number of broadband RGUs increased by 2.4% and the number of Pay TV RGUs increased by 15.9%, resulting in an increase in total fixed RGUs in our Europe segment of 3.7%, or 224 thousand, to approximately 6.2 million as of December 31, 2018.
Segment operating revenues for 2018 increased by 7.6% over 2017. Adjusted segment operating revenues for 2018 increased by 1.2% over 2017. This increase in segment operating revenues principally reflects an increase in high-value customers in the mobile business and an ongoing strong fixed-line business, along with an increase in connectivity. We analyze segment results in euros because it is the functional currency in our operations in Europe.
Segment operating income for 2018 increased by 4.6% over 2017. Adjusted segment operating income for 2018 decreased by 4.3% over 2017.
Segment operating margin was 4.7% in 2018, as compared to 4.8% in 2017. Adjusted segment operating margin was 4.8% in 2018, as compared to 5.0% in 2017. This decrease in segment operating margin for 2018 principally reflects increases in costs related to marketing and subscriber acquisition.
2017 COMPARED TO 2016
Mexico Wireless
The number of prepaid wireless subscribers for 2017 increased by 0.2% over 2016, and the number of postpaid wireless subscribers increased by 6.2%, resulting in an increase in the total number of wireless subscribers in Mexico of 1.2%, or 902 thousand, to approximately 73.9 million as of December 31, 2017.
Segment operating revenues for 2017 increased by 1.6% over 2016. Adjusted segment operating revenues for 2017 increased by 1.2% over 2016. This increase in segment operating revenues principally reflects an increase of 18.9% in mobile data revenues, driven by increased use of value-added services by our wireless subscribers, including activity from messaging, content downloading, mobile applications and social media, and an increase in revenues from service plans offering higher data capacity. The increase in segment operating revenues was partially offset by a decrease of 24.0% in mobile voice revenues, reflecting a decrease in the average wireless rates per user.
Segment operating income for 2017 increased by 5.1% over 2016. Adjusted segment operating income for 2017 increased by 0.9% over 2016.
Segment operating margin was 24.5% in 2017, as compared to 23.7% in 2016. Adjusted segment operating margin for this segment was 28.8% in 2017, which remained stable in comparison to 28.9% in 2016. The segment operating margin in 2017 principally reflects costs related to interconnection rates, licensing fees, mobile site infrastructure rentals, maintenance and roaming charges.
Mexico Fixed
The number of fixed voice RGUs in Mexico for 2017 decreased by 2.8% over 2016, and the number of broadband RGUs in Mexico increased by 0.4%, resulting in a decrease in total fixed RGUs in Mexico of 1.5% over 2016, or 327 thousand, to approximately 21.9 million as of December 31, 2017.
32
Segment operating revenues for 2017 decreased by 3.7% over 2016. Adjusted segment operating revenues for 2017 decreased by 3.9% over 2016. This decrease in segment operating revenues principally reflects a fall in fixed voice revenues of 8.2%, driven by RGU disconnections and a fall in long-distance calls. The decrease in segment operating revenues was partially offset by an increase in fixed data revenues of 2.9%, principally due to higher revenues from broadband and corporate network services.
Segment operating income for 2017 decreased by 35.5% over 2016. Adjusted segment operating income for 2017 decreased by 49.1% over 2016.
Segment operating margin was 8.0% in 2017, as compared to 12.0% in 2016. Adjusted segment operating margin was 4.3% in 2017, as compared to 8.3% in 2016. The decrease in the segment operating margin in 2017 principally reflects increases in costs associated with customer service and service quality improvements, as well as network maintenance.
Brazil
The number of prepaid wireless subscribers for 2017 decreased by 7.6% over 2016, and the number of postpaid wireless subscribers increased by 11.1%, resulting in a decrease in the total number of wireless subscribers in Brazil of 1.9%, or 1.1 million, to approximately 59.0 million as of December 31, 2017. The number of fixed voice RGUs for 2017 decreased by 2.8% over 2016, the number of broadband RGUs increased by 4.2%, and the number of Pay TV RGUs decreased by 5.3%, resulting in a decrease in total fixed RGUs in Brazil of 2.2%, or 812 thousand, to approximately 35.9 million as of December 31, 2017.
Segment operating revenues for 2017 increased by 9.1% over 2016. Adjusted segment operating revenues for 2017 decreased by 1.4% over 2016. This decrease in segment operating revenues principally reflects a fall in mobile voice, fixed voice and Pay TV revenues of 18.8%, 15.1% and 0.4%, respectively, in 2017 over 2016, driven by RGU disconnections and lower traffic reflecting a decrease in disposable income following an overall economic downturn in the country. The decrease in segment operating revenues was partially offset by higher mobile data and fixed data revenues of 28.1% and 5.2%, respectively, in 2017 over 2016. Mobile data revenues increased principally due to the
usage of social networking platforms, cloud services and content, and fixed data revenues increased principally due to an increase in broadband RGUs and corporate network services.
Segment operating income for 2017 increased by 83.4% over 2016. Adjusted segment operating income for 2017 increased by 81.1% over 2016.
Segment operating margin was 5.4% in 2017, as compared to 3.2% in 2016. Adjusted segment operating margin was 4.2% in 2017, as compared to 2.3% in 2016. The increase in segment operating margin in 2017 principally reflects synergy gains in marketing, network maintenance, information technology, subscriber acquisition and customer service related to the ongoing integration of our three Brazilian subsidiaries, which have collectively driven our costs down.
Colombia
The number of prepaid wireless subscribers for 2017 increased by 0.4% over 2016, and the number of postpaid wireless subscribers increased by 5.0%, resulting in an increase in the total number of wireless subscribers in Colombia of 1.4%, or 399 thousand, to approximately 29.4 million as of December 31, 2017. The number of fixed voice RGUs for 2017 increased by 11.1% over 2016, the number of broadband RGUs increased by 8.1% and the number of Pay TV RGUs increased by 3.3%, resulting in an increase in total fixed RGUs in Colombia of 7.1%, or 450 thousand, to approximately 6.8 million as of December 31, 2017.
Segment operating revenues for 2017 increased by 7.6% over 2016. Adjusted segment operating revenues for 2017 increased by 2.8% over 2016. This increase in segment operating revenues principally reflects increases in fixed data revenues, mobile data revenues, fixed voice revenues and Pay TV revenues, which increased by 9.7%, 14.3%, 11.7% and 15.9%, respectively, in 2017, principally due to an increase in sales of bundled packages of wireless services, higher demand for data plans and an increase in subscribers for internet services. The increase in segment operating revenues was partially offset by a decrease of 13.9% in mobile voice revenues, driven by more competitive commercial offerings in response to pricing pressure from competitors.
33
Segment operating income for 2017 decreased by 142.0% over 2016. Adjusted segment operating income for 2017 decreased by 125.2% over 2016. Excluding the effects of the approximately U.S.$1.0 billion arbitration payment in Colombia, adjusted segment operating income for 2017 increased by 15.2%.
Segment operating margin was (6.5)% in 2017, as compared to 16.6% in 2016. Adjusted segment operating margin was (5.0)% in 2017, as compared to 20.5% in 2016. The decrease in segment operating margin for 2017 principally reflects higher costs related to the arbitration payment in Colombia, content licensing and maintenance of our networks, which was partially offset by Comcel’s cost savings program.
Southern Cone—Argentina, Chile, Paraguay and Uruguay
The number of prepaid wireless subscribers for 2017 increased by 2.0% over 2016, and the number of postpaid wireless subscribers increased by 2.9%, resulting in an increase in the total number of wireless subscribers in our Southern Cone segment of 2.3%, or 699 thousand, to approximately 31.1 million as of December 31, 2017. The number of fixed voice RGUs for 2017 increased by 4.6% over 2016, the number of broadband RGUs increased by 9.1%, and the number of Pay TV RGUs increased by 0.6%, resulting in an increase in total fixed RGUs in our Southern Cone segment of 4.2%, or 81 thousand, to approximately 2.0 million as of December 31, 2017.
Segment operating revenues for 2017 increased by 13.8% over 2016. Adjusted segment operating revenues for 2017 increased by 19.0% over 2016. This increase principally reflects an aggregate increase of 22.5% in Argentina, Paraguay and Uruguay and an increase of 10.9% in Chile. This increase was driven by higher data usage, particularly in the form of mobile data, video streaming, content downloading and service package purchases, in Argentina and Chile. For this segment, we analyze results in Argentina, Paraguay and Uruguay in terms of the Argentine peso, because Argentina accounts for the major portion of the operations in these three countries.
Segment operating income for 2017 increased by 40.4% over 2016. Adjusted segment operating income for 2017 increased by 56.2% over 2016. This increase principally reflects an increase in adjusted operating income of 16.8%
in Argentina, Paraguay and Uruguay, which was partially offset by an increase in adjusted operating loss of 30.8% in Chile.
Segment operating margin was 14.2% in 2017, as compared to 11.5% in 2016. Adjusted segment operating margin was 17.0% in 2017, which remained stable in comparison to 17.0% in 2016. The segment operating margin in 2017 principally reflected the cost saving programs of our subsidiaries in the Southern Cone.
Andean Region—Ecuador and Peru
The number of prepaid wireless subscribers for 2017 decreased by 4.3% over 2016, and the number of postpaid wireless subscribers increased by 2.5%, resulting in a decrease in the total number of wireless subscribers in our Andean Region segment of 2.2%, or 450 thousand, to approximately 20.4 million as of December 31, 2017. The number of fixed voice RGUs for 2017 decreased by 7.1% over 2016, the number of broadband RGUs increased by 5.4% and the number of Pay TV RGUs decreased by 7.8%, resulting in a decrease in total fixed RGUs in our Andean Region segment of 3.0%, or 55 thousand, to approximately 1.8 million as of December 31, 2017.
Segment operating revenues for 2017 increased by 0.8% over 2016. Adjusted segment operating revenues for 2017 decreased by 2.4% over 2016. This decrease principally reflects a decrease of 8.9% in Ecuador, which was partially offset by an increase of 3.6% in Peru. This decrease was driven by lower revenues from our wireless and fixed voice operations, an increase in tax obligations and bad debt expenses in Ecuador and competitive pricing practices in Peru, which were partially offset by higher revenues from mobile data and higher revenues from fixed data, especially broadband and corporate data services.
Segment operating income for 2017 decreased by 7.2% over 2016. Adjusted segment operating income for 2017 increased by 0.9% over 2016. This increase principally reflects an increase of 138.7% in Peru, which was partially offset by a decrease of 21.4% in Ecuador.
Segment operating margin was 10.0% in 2017, as compared to 10.8% in 2016. Adjusted segment operating margin was 15.9% in 2017, as compared to 15.1% in 2016. This increase principally reflects gains from our cost-savings program and
34
lower direct taxes in Ecuador as well as operation, information technology, marketing and sales costs, which was partially offset by postpaid subscriber acquisition costs driven by a more aggressively competitive environment in Peru.
Central America—Guatemala, El Salvador, Honduras, Nicaragua, Panama and Costa Rica
The number of prepaid wireless subscribers for 2017 increased by 5.4% over 2016, and the number of postpaid wireless subscribers increased by 6.7%, resulting in an increase in the total number of wireless subscribers in our Central America segment of 5.6%, or approximately 842 thousand, to approximately 15.9 million as of December 31, 2017. The number of fixed voice RGUs for 2017 decreased by 0.1% over 2016, the number of broadband RGUs increased by 15.1% and the number of Pay TV RGUs increased by 3.9%, resulting in an increase in total fixed RGUs in our Central America segment of 7.8%, or 419 thousand, to approximately 5.8 million as of December 31, 2017.
Segment operating revenues for 2017 increased by 4.4% over 2016. Adjusted segment operating revenues for 2017 increased by 3.2% over 2016. This increase principally reflects higher mobile data, fixed data and Pay TV revenues in Central America, which was partially offset by decreases in mobile voice and fixed voice in Guatemala, El Salvador, Honduras, Nicaragua and Costa Rica and decreases in mobile voice and Pay TV in Panama. For this purpose, we analyze adjusted segment results in U.S. dollars because it is the functional currency for our operations in El Salvador and Panama, and the currencies in Costa Rica, Guatemala, Honduras and Nicaragua are relatively stable against the U.S. dollar.
Segment operating income for 2017 increased by 37.1% over 2016. Adjusted segment operating income for 2017 increased by 41.2% over 2016. This increase principally reflects an increase of 4.2% in Guatemala, an increase of 10.2% in El Salvador, an increase of 56.2% in Honduras, an increase of 41.2% in Nicaragua, an increase of 30.0% in Panama and an increase of 1.4% in Costa Rica.
Segment operating margin was 11.9%, as compared to 9.0% in 2016. Adjusted segment operating margin was 13.1% in
2017, as compared to 9.6% in 2016. This increase principally reflects lower costs related to maintenance, customer service and customer acquisition.
Caribbean—Dominican Republic and Puerto Rico
The number of prepaid wireless subscribers for 2017 increased by 3.0% over 2016, and the number of postpaid wireless subscribers increased by 4.1%, resulting in an increase in the total number of wireless subscribers in our Caribbean segment of 3.4%, or approximately 184 thousand, to approximately 5.6 million as of December 31, 2017. The number of fixed voice RGUs for 2017 decreased by 1.3% over 2016, the number of broadband RGUs increased by 1.6% and the number of Pay TV RGUs increased by 11.4%, resulting in an increase in total fixed RGUs in our Caribbean segment of 1.4%, or 37 thousand, to approximately 2.7 million as of December 31, 2017.
Segment operating revenues for 2017 decreased by 3.5% over 2016. Adjusted segment operating revenues for 2017 decreased by 5.5% over 2016. This decrease in segment operating revenues principally reflects lower revenues from wireless and fixed voice services in Puerto Rico, which was partially offset by an increase in segment mobile data revenues and an increase in Pay TV revenues in the Dominican Republic. We analyze segment results in U.S. dollars because it is the functional currency in our operations in Puerto Rico, and the currency in the Dominican Republic is relatively stable against the U.S. dollar.
Segment operating income for 2017 decreased by 22.6% over 2016. Adjusted segment operating income for 2017 decreased by 23.8% over 2016. This decrease principally reflects a decrease of 5.7% in the Dominican Republic and a decrease of 102.2% in Puerto Rico.
Segment operating margin was 13.5% in 2017, as compared to 16.8% in 2016. Adjusted segment operating margin was 13.8% in 2017, as compared to 17.2% in 2016. This decrease principally reflects higher unusual costs related to the reconstruction and operation of our networks in the aftermath of Hurricane Maria and bad debt expense in Puerto Rico and higher costs related to upgrades to our information technology systems in the Dominican Republic, which were partially offset by our corporate cost-savings program.
35
United States
The number of prepaid wireless subscribers for 2017 decreased by 11.3% over 2016, or approximately 2.9 million, to approximately 23.1 million total wireless subscribers in the United States as of December 31, 2017.
Segment operating revenues for 2017 increased by 5.5% over 2016. Adjusted segment operating revenues for 2017 increased by 4.1% over 2016. This increase in segment operating revenues principally reflects higher mobile voice and data usage and revenues driven by the success of existing unlimited data plans, principally those offered under our Straight Talk brand and our recently acquired Walmart Family Mobile brand.
Segment operating income for 2017 increased by 138.8% over 2016. Adjusted segment operating income for 2017 increased by 15.0% over 2016.
Segment operating margin was 2.0% in 2017, as compared to 0.9% in 2016. Adjusted segment operating margin was 8.4% in 2017, as compared to 7.6% in 2016. This increase principally reflects a decrease in subscriber acquisition costs.
Europe
The number of prepaid wireless subscribers for 2017 decreased by 10.4% over 2016, and the number of postpaid wireless subscribers increased by 3.6%, resulting in a decrease in the total number of wireless subscribers in our
Europe segment of 0.2%, or approximately 50 thousand, to approximately 20.7 million as of December 31, 2017. The number of fixed voice RGUs for 2017 decreased by 3.7% over 2016, the number of broadband RGUs increased by 3.3% and the number of Pay TV RGUs increased by 10.7%, resulting in an increase in total fixed RGUs in our Europe segment of 2.3%, or 136 thousand, to approximately 6.0 million as of December 31, 2017.
Segment operating revenues for 2017 increased by 7.7% over 2016. Adjusted segment operating revenues for 2017 increased by 4.1% over 2016. This increase in segment operating revenues principally reflects higher revenues in Pay TV as well as mobile and fixed data, which were partially offset by lower revenues from wireless and fixed voice services due to the negative effects of the elimination of retail roaming in the EU in June 2017 and April 2016, as well as losses in the prepaid segment. We analyze segment results in euros because it is the functional currency in our operations in Europe.
Segment operating income for 2017 decreased by 16.0% over 2016. Adjusted segment operating income for 2017 decreased by 16.3% over 2016.
Segment operating margin was 4.8% in 2017, as compared to 6.2% in 2016. Adjusted segment operating margin was 5.0% in 2017, as compared to 6.2% in 2016. The decrease principally reflects increases in costs related to marketing, subscriber acquisitions and local taxes.
36
|
LIQUIDITY AND CAPITAL RESOURCES |
FUNDING REQUIREMENTS
We generate substantial cash flows from our operations. On a consolidated basis, our cash flows from operating activities were Ps.248.3 billion in 2018, compared to Ps.217.8 billion in 2017. Our cash and cash equivalents amounted to Ps.21.7 billion at December 31, 2018, compared to Ps.24.3 billion at December 31, 2017.
We believe our working capital is sufficient for our present requirements. We use the cash that we generate from our operations and from borrowings principally for the following purposes:
| • | | Capital expenditures.We make substantial capital expenditures to continue expanding and improving our networks in each country in which we operate. Our capital expenditures on plant, property and equipment and acquisition or renewal of licenses were Ps.151.8 billion in 2018, Ps.136.7 billion in 2017, and Ps.155.0 billion in 2016. The amount of these capital expenditures varies significantly from year to year, depending on acquisition opportunities, concession renewal schedules and the need for more spectrum. We have budgeted capital expenditures for 2019 of approximately U.S.$8.5 billion (Ps.169.0 billion), which will be primarily funded by our operating activities. |
| • | | Acquisitions.In some years, we have made substantial expenditures on acquisitions. In 2019 we entered into agreements to acquire Nextel Brazil, Telefónica Guatemala and Telefónica El Salvador. See “Recent Developments” under Part I in this annual report. |
| • | | Indebtedness.We must pay interest on our indebtedness and repay principal when due. As of December 31, 2018, we had approximately Ps.96.2 billion of principal and amortization due in 2019. |
| • | | Dividends.We pay regular dividends. We paid Ps.22.4 billion in dividends in 2018 and Ps.16.1 billion in 2017. Our shareholders approved on April 9, 2019 the payment of a Ps.0.35 ordinary cash dividend per share in two installments in 2019. See “Share Ownership and Trading—Dividends” under Part IV in this annual report. |
| • | | Share repurchases.We regularly repurchase our own shares. We spent Ps.511.4 million repurchasing our own shares in the open market in 2018 and Ps.1.2 billion in 2017. Our shareholders have authorized additional repurchases, and as of March 31, 2019, we have spent Ps.171 million repurchasing our shares in the open market in 2019, but whether we will continue to do so will depend on our operating cash flow and on various other considerations, including market prices and our other capital requirements. |
OFF-BALANCE SHEET ARRANGEMENTS
As of December 31, 2018, we had nooff-balance sheet arrangements that require disclosure under applicable SEC regulations.
37
|
LIQUIDITY AND CAPITAL RESOURCES |
CONTRACTUAL OBLIGATIONS
The following table summarizes certain contractual obligations as of December 31, 2018. Many of our obligations are denominated in currencies other than Mexican pesos. The table does not include accounts payable, pension liabilities, interest payments or payments under derivatives contracts. See note 16 to our audited consolidated financial statements included in this annual report.
| | | | | | | | | | | | | | | | | | | | |
PAYMENTS DUE BY PERIOD | |
| | | | | | LESS THAN | |
| | | Total | | | 1 Year | | | 1-3 Years | | | 4-5 Years | | | After 5 Years | |
| | | (in millions of Mexican pesos) | |
| |
| CONTRACTUAL OBLIGATIONS AS OF DECEMBER 31, 2018 | |
| | | | | | |
| Equipment leases, real estate leases and mobile site rentals | | Ps. | 138,052 | | | Ps. | 24,057 | | | Ps. | 37,652 | | | Ps. | 26,317 | | | Ps. | 50,026 | |
| | | | | | |
| Short-term debt | | | 96,230 | | | | 96,230 | | | | — | | | | — | | | | — | |
| | | | | | |
| Long-term debt | | | 542,692 | | | | — | | | | 263,402 | | | | 53,923 | | | | 225,367 | |
| | | | | | |
| Purchase obligations | | | 225,085 | | | | 88,234 | | | | 123,528 | | | | 13,323 | | | | — | |
| | | | | | |
| Total | | Ps. | 1,002,059 | | | Ps. | 208,521 | | | Ps. | 424,582 | | | Ps. | 93,563 | | | Ps. | 275,393 | |
Other than the amounts in the table above, we had no other outstanding material purchase commitments as of December 31, 2018. We enter into a number of supply, advertising and other contracts in the ordinary course of business, but those contracts are not material to our liquidity.
BORROWINGS
In addition to cash flows generated from operations, we rely on a combination of borrowings from a range of different sources, including the international capital markets, capital markets in Mexico and other countries where we operate, international and local banks, equipment suppliers and export credit agencies. We seek to maintain access to diverse sources of funding. In managing our funding, we generally seek to keep our leverage, as measured by the ratio of net debt to EBITDA, at a level that is consistent with maintaining the ratings given to our debt by the principal credit rating agencies. Our total consolidated indebtedness as of December 31, 2018 was Ps.638.9 billion, of which Ps.96.2 billion was short-term debt (including the current portion of long- term debt), compared to Ps.697.9 billion as of December 31, 2017.
Management defines net debt as total debt minus cash and cash equivalents, minus marketable securities (including KPN shares) or other short-term investments. As of December 31, 2018, we had net debt of Ps.568.2 billion, compared to Ps.614.5 billion as of December 31, 2017. Without taking into account the effects of derivative financial instruments that we use to manage our interest rate and currency risk, approximately 88.7% of our indebtedness at December 31, 2018 was denominated in currencies other than Mexican pesos (approximately 34.6% of suchnon-Mexican peso debt in U.S. dollars and 65.4% in other currencies), and approximately 5.9% of our consolidated debt obligations bore interest at floating rates. After the effects of derivative transactions and excluding the debt owned by Telekom Austria, approximately 29.3% of our net debt as of December 31, 2018 was denominated in Mexican pesos.
The weighted average cost of all our third-party debt at December 31, 2018 (excluding commissions and reimbursement of certain lenders for Mexican taxes withheld) was approximately 4.3% per annum.
Our major categories of indebtedness at December 31, 2018 are summarized in the table below. The majority of our consolidated indebtedness is owed by América Móvil and most of the remaining debt is owed by Telekom Austria, in which we own a 51% interest. See also note 14 to our audited consolidated financial statements included in this annual report.
38
| | | | |
DEBT | |
(millions of Mexican pesos) | | | |
| | |
SENIOR NOTES | | | | |
| | |
DENOMINATED IN U.S. DOLLARS | | | | |
| | |
América Móvil 5.000% Senior Notes due 2019 | | Ps. | 14,762 | |
| | |
Telmex 5.500% Senior Notes due 2019 | | | 7,428 | |
| | |
América Móvil 5.000% Senior Notes due 2020 | | | 41,823 | |
| | |
América Móvil 3.125% Senior Notes due 2022 | | | 31,493 | |
| | |
América Móvil 6.375% Senior Notes due 2035 | | | 19,315 | |
| | |
América Móvil 6.125% Senior Notes due 2037 | | | 7,267 | |
| | |
América Móvil 6.125% Senior Notes due 2040 | | | 39,366 | |
| | |
América Móvil 4.375% Senior Notes due 2042 | | | 22,635 | |
| | |
Total | | Ps. | 184,089 | |
| | |
DENOMINATED IN MEXICAN PESOS | | | | |
| | |
América Móvil 6.000% Senior Notes due 2019 | | Ps. | 10,000 | |
| | |
América Móvil 8.600% Domestic Senior Notes due 2020 | | | 7,000 | |
| | |
América Móvil 6.450% Senior Notes due 2022 | | | 22,500 | |
| | |
América Móvil 7.125% Senior Notes due 2024 | | | 11,000 | |
| | |
América Móvil 0.000% Domestic Senior Notes due 2025 | | | 4,629 | |
| | |
América Móvil 8.460% Senior Notes due 2036 | | | 7,872 | |
| | |
Telmex 8.360% Domestic Senior Notes due 2037 | | | 5,000 | |
| | |
Total | | Ps. | 68,001 | |
| | |
DENOMINATED IN EURO | | | | |
| | |
América Móvil 4.125% Senior Notes due 2019 | | Ps. | 22,559 | |
| | |
América Móvil B.V. 0.000% Exchangeable Bonds due 2020 | | | 64,108 | |
| | |
América Móvil 3.000% Senior Notes due 2021 | | | 22,558 | |
| | |
TKA 3.125% Senior Notes due 2021 | | | 17,569 | |
| | |
TKA 4.000% Senior Notes due 2022 | | | 18,028 | |
| | |
América Móvil 4.750% Senior Notes due 2022 | | | 16,919 | |
| | |
TKA 3.500% Senior Notes due 2023 | | | 7,132 | |
| | |
América Móvil 3.259% Senior Notes due 2023 | | | 16,919 | |
| | |
América Móvil 1.500% Senior Notes due 2024 | | | 19,175 | |
| | |
TKA 1.500% Senior Notes due 2026 | | | 16,919 | |
| | |
América Móvil 2.125% Senior Notes due 2028 | | | 14,663 | |
| | |
Total | | Ps. | 236,549 | |
| | |
DENOMINATED IN POUND STERLING | | | | |
| | |
América Móvil 5.000% Senior Notes due 2026 | | Ps. | 12,551 | |
| | |
América Móvil 5.750% Senior Notes due 2030 | | | 16,316 | |
| | |
América Móvil 4.948% Senior Notes due 2033 | | | 7,530 | |
| | |
América Móvil 4.375% Senior Notes due 2041 | | | 18,826 | |
| | |
Total | | Ps. | 55,223 | |
39
|
LIQUIDITY AND CAPITAL RESOURCES |
| | | | |
DEBT | |
(millions of Mexican pesos) | | | |
| | |
DENOMINATED IN JAPANESE YEN | | | | |
| | |
América Móvil 2.950% Senior Notes due 2039 | | Ps. | 2,335 | |
| | |
Total | | Ps. | 2,335 | |
| | |
DENOMINATED IN CHILEAN PESOS | | | | |
| | |
América Móvil 3.961% Senior Notes due 2035 | | Ps. | 3,905 | |
| | |
Total | | Ps. | 3,905 | |
| | |
DENOMINATED IN BRAZILIAN REAIS | | | | |
| | |
Claro Brasil 102.400% of CDI Domestic Senior Notes due 2019 | | Ps. | 5,080 | |
| | |
Claro Brasil 103.250% of CDI Domestic Senior Notes due 2019 | | | 1,829 | |
| | |
Claro Brasil 103.900% of CDI Domestic Senior Notes due 2019 | | | 5,080 | |
| | |
Claro Brasil 102.900% of CDI Domestic Senior Notes due 2020 | | | 7,619 | |
| | |
Claro Brasil 104.000% of CDI Domestic Senior Notes due 2021 | | | 5,587 | |
| | |
Claro Brasil 104.250% of CDI Domestic Senior Notes due 2021 | | | 7,696 | |
| | |
Total | | Ps. | 32,891 | |
| | |
HYBRID NOTES | | | | |
| | |
DENOMINATED IN EURO: | | | | |
| | |
América Móvil Euro NC10 (Euro Series B) Capital Securities due 2073 | | Ps. | 12,407 | |
| | |
Total | | Ps. | 12,407 | |
| | |
DENOMINATED IN POUND STERLING | | | | |
| | |
América Móvil GBP NC7 Capital Securities due 2073 | | Ps. | 13,806 | |
| | |
Total | | Ps. | 13,806 | |
| | |
BANK DEBT AND OTHER | | | | |
| | |
DENOMINATED IN U.S. DOLLARS | | Ps. | 11,699 | |
| | |
DENOMINATED IN MEXICAN PESOS | | Ps. | 4,500 | |
| | |
DENOMINATED IN EUROS | | Ps. | 5,527 | |
| | |
DENOMINATED IN CHILEAN PESOS | | Ps. | 64 | |
| | |
DENOMINATED IN BRAZILIAN REAIS | | Ps. | 27 | |
| | |
DENOMINATED IN PERUVIAN SOLES | | Ps. | 7,899 | |
| | |
Total | | Ps. | 29,716 | |
| | |
Total Debt | | Ps. | 638,922 | |
| | |
Less short-term debt and current portion of long-term debt | | Ps. | 96,230 | |
| | |
Total Long-term Debt | | Ps. | 542,692 | |
| | |
EQUITY: | | | | |
| | |
Capital stock | | Ps. | 96,338 | |
| | |
Total retained earnings | | | 237,255 | |
| | |
Other comprehensive income (loss) items | | | (137,598 | ) |
| | |
Non-controlling interest | | | 49,877 | |
| | |
Total Equity | | Ps. | 245,872 | |
| | |
Total Capitalization (total long-term debt plus equity) | | Ps. | 788,564 | |
40
Additional information about certain categories of our indebtedness is provided below:
| • | | Mexican peso-denominated international notes.Our 8.46% senior notes due 2036 are denominated in Mexican pesos, but all amounts in respect of the notes are payable in U.S. dollars, unless a holder of notes elects to receive payment in Mexican pesos in accordance with specified procedures. |
| • | | Mexican peso-denominated domestic notes.Our domestic senior notes (certificados bursátiles) sold in the Mexican capital markets have varying maturities, ranging from 2019 through 2037, and bear interest at fixed rates. |
| • | | Global peso notes program.The global peso notes program was established in November 2012. Since its establishment, we have issued peso-denominated notes that can be distributed and traded on a seamless basis in Mexico and internationally. The notes are registered with the SEC in the United States and with the CNBV in Mexico. |
| • | | International notes.We have outstanding debt securities in the international markets denominated in U.S. dollars, pound sterling and euros. We have also issued debt securities in the local markets in Switzerland and Japan. |
| • | | Hybrid notes.We have outstanding two series of Capital Securities maturing in 2073: one series denominated in euros totaling€550 million, and one series denominated in pound sterling in the amount of £550 million. The Capital Securities are subject to redemption at our option at varying dates beginning in 2023 for the euro-denominated series and beginning in 2020 for the sterling-denominated series. Our hybrid notes are deeply subordinated, and when they were issued, the principal rating agencies stated that they would treat only half of the principal amount as indebtedness for purposes of evaluating our leverage (an analysis referred to as 50.0% equity credit). |
| • | | Bank loans.At December 31, 2018, we had approximately Ps.29.7 billion outstanding under a number of bank facilities bearing interest at fixed and variable rates. We also have two revolving syndicated credit facilities—one for U.S.$2.5 billion expiring in November 2019 and one for the Euro equivalent of U.S.$2.0 billion expiring in May 2021. As long as the facilities are committed, a commitment fee is paid. As of December 31, 2018, these |
| | | credit facilities were undrawn. Both facilities include covenants that limit our ability to incur secured debt, to effect a merger in which the surviving entity would not be América Móvil or to sell substantially all of our assets. In addition, both facilities require us to maintain a consolidated ratio of debt to EBITDA not greater than 4.0 to 1.0 and a consolidated ratio of EBITDA to interest expense not less than 2.5 to 1.0. As of the date of this annual report, we are in compliance with these covenants. Telekom Austria also has an undrawn revolving syndicated credit facility for€1.0 billion (the “TKA Facility”) expiring in November 2019. The TKA Facility includes covenants that limit Telekom Austria’s ability to incur secured debt, effect certain mergers or sell substantially all of its assets and our ability to transfer control over, or reduce our share ownership in, Telekom Austria. For more information, see note 14 to our audited consolidated financial statements included in this annual report. |
| • | | Options involving KPN and TKA shares. The Company has entered into certain option contracts related to shares that are or have been a strategic investment for the Company. These options include a sale of call options related to our KPN shares with an exercise period that will expire in May 2020 and the sale of a cash-settled put option related to TKA shares that will expire in August 2023. See note 7 to our audited consolidated financial statements included in this annual report. |
Some of the public securities issued by América Móvil in international and Mexican capital markets are guaranteed by Telcel. As of December 31, 2018, we had, on an unconsolidated basis, unsecured and unsubordinated indebtedness of approximately Ps.509.7 billion (U.S.$25.9 billion), excluding guarantees of subsidiaries’ indebtedness. As of December 31, 2018, our subsidiaries had indebtedness (excluding guarantees of indebtedness of us and our other subsidiaries) of approximately Ps.129.2 billion (U.S.$6.6 billion).
41
We regularly assess our interest rate and currency exchange exposures in order to determine how to manage the risk associated with these exposures. We have indebtedness denominated in currencies other than the currency of our operating environments, and we have expenses for operations and for capital expenditures in a variety of currencies. We use derivatives to adjust the resulting exchange rate and interest rate exposures. We do not use derivatives to hedge the exchange rate exposures that arise from having operations in different countries.
Our practices vary from time to time depending on our judgment of the level of risk, expectations as to exchange or interest rate movements and the costs of using derivative financial instruments. We may stop using derivative financial instruments or modify our practices at any time.
As of December 31, 2018, we had derivatives positions with an aggregate net fair value liability of Ps.11.8 billion, which are described in note 7 to our audited consolidated financial statements. For additional information, see note 2 v) to our audited consolidated financial statements included in this annual report.
42
|
CRITICAL ACCOUNTING POLICIES AND ESTIMATES |
USE OF ESTIMATES IN CERTAIN ACCOUNTING POLICIES
In preparing our financial statements, we make estimates concerning a variety of matters. Some of these matters are highly uncertain, and our estimates involve judgments we make based on the information available to us. In the discussion below, we have identified several of these matters for which our financial presentation would be materially affected if either (i) we used different estimates that we could reasonably have used or (ii) in the future, we change our estimates in response to changes that are reasonably likely to occur.
The discussion addresses only those estimates that we consider most important based on the degree of uncertainty and the likelihood of a material impact if we used a different estimate. There are many other areas in which we use estimates about uncertain matters, but the reasonably likely effect of changed or different estimates is not material to our financial presentation.
ESTIMATED USEFUL LIVES OF PLANT, PROPERTY AND EQUIPMENT
We estimate the useful lives of particular classes of plant, property and equipment in order to determine the amount of depreciation expense to be recorded in each period. Depreciation expense is a significant element of our costs and expenses, amounting in 2018 to Ps.129.1 billion, or 14.4% of our operating costs and expenses. See note 10 to our audited consolidated financial statements included in this annual report.
We currently depreciate most of our property, plant and equipment based on an estimated useful life determined upon the expected particular conditions of operations and maintenance in each of the countries in which we operate.
The estimates are based on our historical experience with similar assets, anticipated technological changes and other factors, taking into account the practices of other telecommunications companies. We review estimated useful lives each year to determine whether they should be changed, and, at times, we have changed them for particular classes of assets. We may shorten the estimated useful life of an asset class in response to technological changes,
changes in the market or other developments, which would result in higher depreciation expense.
IMPAIRMENT OF LONG-LIVED ASSETS
We have large amounts of long-lived assets, including property, plant and equipment, intangible assets, investments in associates and goodwill, on our balance sheet. Under IFRS, we are required to test long-lived assets for impairment when circumstances indicate a potential impairment or, in some cases, at least on an annual basis. The impairment analysis for long-lived assets requires us to estimate the recovery value of the asset, which is the greater of its fair value (minus any disposal costs) and its value in use. To estimate the fair value of a long-lived asset, we typically take into account recent market transactions, or, if no such transactions can be identified, we use a valuation model that requires the making of certain assumptions and estimates. Similarly, to estimate the value in use of long-lived assets, we typically make various assumptions about the future prospects for the business to which the asset relates, consider market factors specific to that business and estimate discounted future cash flows to be generated by that business. Based on this impairment analysis, including all assumptions and estimates related thereto, as well as guidance provided by IFRS relating to the impairment of long-lived assets, we determine whether we need to recognize an impairment to reduce the carrying value of the asset as stated on our balance sheet. Assumptions and estimates about future values and remaining useful lives are complex and often subjective. They can be affected by a variety of factors, including external factors, such as industry and economic trends, and internal factors, such as changes in our business strategy and our internal forecasts. Different assumptions and estimates could materially impact our reported financial results. More conservative assumptions of the anticipated future benefits from these businesses could result in impairment charges, which would decrease net income and result in lower asset values on our balance sheet. Conversely, less conservative assumptions could result in lower or no impairment charges, higher net income and higher asset values. See note 2 ab) to our audited consolidated financial statements included in this annual report.
43
|
CRITICAL ACCOUNTING POLICIES AND ESTIMATES |
DEFERRED INCOME TAXES
We are required to estimate our income taxes in each of the jurisdictions in which we operate. This process involves thejurisdiction-by-jurisdiction estimation of actual current tax exposure and the assessment of temporary differences resulting from the differing treatment of certain items, such as accruals and amortization, for tax and financial reporting purposes, as well as net operating loss carry forwards and other tax credits. These items result in deferred tax assets and liabilities, which are included in our consolidated balance sheets. We must assess, in the course of our tax planning procedures, the fiscal years of the reversal of our deferred tax assets and liabilities, and if there will be future taxable profits in those periods to support the recognition of the deferred tax assets. Significant management judgment is required in determining our provisions for income taxes, deferred tax assets and liabilities. The analysis is based on estimates of future taxable income in the jurisdictions in which the group operates and the period over which the deferred tax assets and liabilities will be recoverable or settled. If actual results differ from these estimates, or if we adjust these estimates in future periods, our financial position and results of operations may be materially affected.
We record deferred tax assets based on the amount that we believe is more likely than not to be realized. In assessing the future realization of deferred tax assets, we consider future taxable income and ongoing tax planning strategies. In the event that our estimates of projected future taxable income and benefits from tax planning strategies are lowered, or changes in current tax regulations are enacted that would impose restrictions on the timing or the extent of our ability to utilize the tax benefits of net operating loss carry forwards in the future, an adjustment to the recorded amount of deferred tax assets would be made.
ACCRUALS
Accruals are recorded when, at the end of the period, we have a present obligation as a result of past events whose settlement requires an outflow of resources that is considered probable and can be measured reliably. This
obligation may be legal or constructive, arising from, but not limited to, regulation, contracts, common practice or public commitments which have created a valid expectation for third parties that we will assume certain responsibilities. The amount recorded is the best estimation performed by our management in respect of the expenditure that will be required to settle the obligations, considering all the information available at the date of our financial statements, including the opinion of external experts, such as legal advisors or consultants. Accruals are adjusted to account for changes in circumstances for ongoing matters and the establishment of additional accruals for new matters.
If we are unable to reliably measure the obligation, no accrual is recorded and information is then presented in the notes to our audited consolidated financial statements. Because of the inherent uncertainties in this estimation, actual expenditures may be different from the originally estimated amount recognized.
LABOR OBLIGATIONS
We recognize liabilities on our balance sheet and expenses in our statement of comprehensive income to reflect our obligations related to our post-retirement seniority premiums, pension and retirement plans in the countries in which we operate and offer defined contribution and benefit pension plans. The amounts we recognize are determined on an actuarial basis that involves many estimates and assumptions for post-retirement pension and termination benefits in accordance with IFRS.
We use estimates in four specific areas that have a significant effect on these amounts: (i) the rate of return we assume our labor obligation plans will achieve on their investments, (ii) the rate of increase in salaries that we assume we will observe in future years, (iii) the discount rates that we use to calculate the present value of our future obligations and (iv) the expected rate of inflation. The assumptions we have applied are identified in note 17 to our audited consolidated financial statements included in this annual report. These estimates are determined based on actuarial studies performed by independent experts using the projected unit-credit method.
44


PART III RISK FACTORS
RISKS RELATING TO OUR OPERATIONS
Competition in the telecommunications industry is intense and could adversely affect the revenues and profitability of our operations
Our businesses face substantial competition. We expect that competition will intensify in the future as a result of the entry of new competitors, the development of new technologies, products and services and convergence. We also expect consolidation in the telecommunications industry, as companies respond to the need for cost reduction and additional spectrum. This trend may result in larger competitors with greater financial, technical, promotional and other resources to compete with our businesses.
Among other things, our competitors could:
| • | | provide higher handset subsidies; |
| • | | offer higher commissions to retailers; |
| • | | provide free airtime or other services (such as internet access); |
| • | | offer services at lower costs through double, triple and quadruple play packages or other pricing strategies; |
| • | | expand their networks faster; or |
| • | | develop and deploy improved technologies faster, such as 5G LTE technology. |
Competition can lead us to increase advertising and promotional spending and to reduce prices for services and handsets. These developments may lead to lower operating margins, greater choices for customers and increasing movement of customers among competitors, which may make it difficult for us to retain or add new customers. The cost of adding new customers may also continue to increase, reducing profitability even if customer growth continues.
Our ability to compete successfully will depend on our coverage, the quality of our network and service, our rates, customer service, effective marketing, our success in selling double, triple and quadruple play packages and our ability to anticipate and respond to various competitive factors affecting the telecommunications industry, including new
services and technologies, changes in consumer preferences, demographic trends, economic conditions and discount pricing strategies by competitors.
If we are unable to respond to competition and compensate for declining prices by adding new customers, increasing usage and offering new services, our revenues and profitability could decline.
Governmental or regulatory actions could adversely affect our operations
Our operations are subject to extensive government regulation and can be adversely affected by changes in law, regulation or regulatory policy. The licensing, construction, operation, sale, resale and interconnection arrangements of telecommunications systems in Latin America and elsewhere are regulated to varying degrees by government or regulatory authorities. Any of these authorities having jurisdiction over our businesses could adopt or change regulations or take other actions that could adversely affect our operations. In particular, the regulation of prices that operators may charge for their services and environmental matters, including renewable energy and climate change regulation, could have a material adverse effect by reducing our profit margins. See “Regulation” under Part VI for a discussion on the functional separation of Telmex and Telnor wholesale services, “Legal Proceedings” under Part VII and Note 16 to our audited consolidated financial statements included in this annual report.
In addition, changes in political administrations could lead to the adoption of policies concerning competition and taxation of communications services. For example, since 2013, Mexico has implemented reforms to the telecommunications sector that aim to promote more competition and investment by imposing asymmetric regulation upon economic agents deemed “preponderant or dominant.” In other countries, we could also face policies such as preferences for local over foreign ownership of communications licenses and assets or for government over private ownership, which could make it more cumbersome or impossible for us to continue to develop our businesses. Restrictions such as those described above could result in lower revenues and require capital investments, all of which could materially adversely affect our businesses and results of operations.
48
Our failure to meet or maintain quality of service goals and standards could result in fines and other adverse consequences
The terms of the concessions under which our subsidiaries operate require them to meet certain service quality goals, including, for example, minimum call completion rates, maximum busy circuits rates, operator availability and responsiveness to repair requests. Failure to meet service quality obligations in the past has resulted in the imposition of material fines by regulatory entities. We are also subject to and may be subject to additional claims by customers, including class actions, seeking remedies for service problems. Our ability to comply with these obligations in the future may be affected by factors beyond our control and, accordingly, we cannot assure that we will be able to comply with them.
Dominant carrier related regulations could adversely affect our business by limiting our ability to pursue competitive and profitable strategies
Our regulators are authorized to impose specific requirements as to rates (including termination rates), quality of service, access to active or passive infrastructure and information, among other matters, on operators that are determined to have substantial market power in a specific market. We cannot predict what steps regulatory authorities might take in response to determinations regarding substantial market power in the countries in which we operate. However, adverse determinations against our subsidiaries could result in material restrictions on our operations. We may also face additional regulatory restrictions and scrutiny as a result of our provision of combined services.
If dominant carrier regulations are imposed on our business in the future, they could likely reduce our flexibility to adopt competitive market policies and impose specific tariff requirements or other special regulations on us, such as additional requirements regarding disclosure of information or quality of service. Any such new regulation could have a material adverse effect on our operations.
Changes in the regulatory framework for telecommunications services in Mexico may have a material adverse effect on our business and results of operations
The Mexican legal framework for the regulation of telecommunications and broadcasting services has changed, beginning with constitutional amendments in 2013, implementing legislation in 2014, and the establishment in 2014 of a new regulator, the Federal Telecommunications Institute (Instituto Federal deTelecomunicaciones, or the “IFT”). The IFT determined in 2014 that our operating subsidiaries in Mexico are part of an “economic interest group” that is a “preponderant economic agent” in the Mexican telecommunications sector, and, based on this determination, the IFT has imposed extensive asymmetric regulations on our Mexican fixed-line and wireless businesses. The asymmetric regulations took effect in 2015 and were amended in 2017, when the IFT added new requirements, including the functional separation of certain assets used to provide local loop unbundling services. For further information, see “Regulation” under Part III of this annual report. The IFT measures and biennial reviews of the asymmetric measures applicable to us have adversely affected the results of our Mexican operations, and we expect that those effects will continue.
We must continue to acquire additional radio spectrum capacity and upgrade our networks in order to expand our customer base and maintain the quality of our wireless services
Licensed radio spectrum is essential to our growth and the quality of our wireless services and for the operation and deployment of our networks, including new generation networks such as 5G LTE technology, to offer improved data and value-added services. We obtain most of our radio spectrum through auctions conducted by governments of the countries in which we operate. Participation in spectrum auctions in most of these countries requires prior government authorization, and we may be subject to caps on our ability to acquire additional spectrum. Our inability to acquire additional radio spectrum capacity could affect our ability to compete successfully because it could result in,
49
among other things, a decrease in the quality of our network and service and in our ability to meet the demands of our customers.
In the event we are unable to acquire additional radio spectrum capacity, we can increase the density of our network by building more cell and switch sites, but such measures are costly and may be subject to local restrictions and regulatory approvals, and they would not meet our needs as effectively.
We have concessions and licenses for fixed terms, and the government may revoke or terminate them as well as reacquire the assets under our concession under various circumstances, some of which are beyond our control
Our concessions and licenses have specified terms, ranging typically from five to 20 years, and are generally subject to renewal upon payment of a fee, but renewal is not assured. The loss of, or failure to renew, any one concession could have a material adverse effect on our business and results of operations. Our ability to renew concessions and the terms of renewal are subject to a number of factors beyond our control, including the prevalent regulatory and political environment at the time of renewal. Fees are typically established at the time of renewal. As a condition for renewal, we may be required to agree to new and stricter terms and service requirements. In some of the jurisdictions where we operate and under certain circumstances, mainly in connection with fixed services, we may be required to transfer certain assets covered by some of our concessions to the government pursuant to valuation methodologies that vary in each jurisdiction. It is uncertain whether reversion would ever be applied in many of the jurisdictions where we operate and how reversion provisions would be interpreted in practice. For further information, see “Regulation” under Part VI of this annual report and note 16 to our audited consolidated financial statements included in this annual report.
In addition, the regulatory authorities in the jurisdictions in which we operate can revoke our concessions under certain circumstances. In Mexico, for example, the Federal Law on Telecommunications and Broadcasting gives the
government the right to expropriate our concessions or to take over the management of our networks, facilities and personnel in cases of failures to meet obligations under our concession agreements, imminent danger to national security, internal peace or the national economy, natural disasters and public unrest. See “Regulation” under Part VI of this annual report.
We continue to look for acquisition opportunities, and any future acquisitions and related financing could have a material effect on our business, results of operations and financial condition
We continue to look for investment opportunities in telecommunications and related companies worldwide, including in markets where we are already present, and we often have several possible acquisitions under consideration. Any future acquisitions, and related financing and acquired indebtedness, could have a material effect on our business, results of operations and financial condition, but we cannot provide assurances that we will complete any of them. In addition, we may incur significant costs and expenses as we integrate these companies in our systems, controls and networks.
We are subject to significant litigation
Some of our subsidiaries are subject to significant litigation that, if determined adversely to our interests, may have a material adverse effect on our business, results of operations, financial condition or prospects. Our significant litigation is described in “Regulation” under Part VI and in note 16 to our audited consolidated financial statements included in this annual report.
We are contesting significant tax assessments
We and some of our subsidiaries have been notified of tax assessments for significant amounts by the tax authorities of the countries in which we operate, especially in Brazil, Mexico and Ecuador. The tax assessments relate to, among other things, alleged improper deductions and underpayments. We are contesting these tax assessments in several administrative and legal proceedings, and our challenges are at various stages. If determined adversely to
50
us, these proceedings may have a material adverse effect on our business, results of operations, financial condition or prospects. In addition, in some jurisdictions, challenges to tax assessments require the posting of a bond or security for the contested amount, which may reduce our flexibility in operating our business. Our significant tax assessments are described in note 16 to our audited consolidated financial statements included in this annual report.
Failure to comply with anti-corruption, anti- bribery and anti-money laundering laws could harm our reputation, subject us to substantial fines and adversely affect our business
We operate in multiple jurisdictions and are subject to complex regulatory frameworks with increased enforcement activities worldwide. Our governance and compliance processes may not prevent future breaches of legal, accounting or governance standards and regulations. We may be subject to breaches of our code of ethics, anti-corruption policies and business conduct protocols and to instances of fraudulent behavior, corrupt practices and dishonesty by our employees, contractors or other agents. Our failure to comply with applicable laws and other regulatory requirements could harm our reputation, subject us to substantial fines, sanctions or penalties and adversely affect our business and ability to access financial markets.
A system failure could cause delays or interruptions of service, which could have an adverse effect on our operations
We need to continue to provide our subscribers with a reliable service over our network. Some of the risks to our network and infrastructure include the following:
| • | | physical damage to access lines and fixed networks; |
| • | | power surges or outages; |
| • | | malicious actions, such as theft or misuse of customer data; |
| • | | limitations on the use of our radio bases; |
| • | | disruptions beyond our control. |
In Brazil, for example, our satellite operations may be affected if we experience a delay in launching new satellites to replace those currently in use when they reach the end of their operational lives. Such delay may occur because of, among other reasons, construction delays, unavailability of launch vehicles and/or launch failures. In addition, in 2017, our operations in Puerto Rico suffered significant damage in the aftermath of Hurricane Maria, and our operations in Mexico experienced network overloads and power outages following the earthquake on September 19, 2017.
We have instituted measures to reduce these risks. However, there is no assurance that any measures we implement will be effective in preventing system failures under all circumstances. System failures may cause interruptions in services or reduced capacity for our customers, either of which may have an adverse effect on our operations due to, for example, increased expenses, potential legal liability, loss of existing and potential subscribers, reduced user traffic, decreased revenues and reputational harm.
Cybersecurity incidents and other breaches of network or information technology security could have an adverse effect on our business and our reputation
Cybersecurity incidents, and other tactics designed to gain access to and exploit sensitive information by breaching critical systems of large companies, are evolving and have been increasing in both sophistication and occurrence in recent years. While we employ a number of measures to prevent, detect and mitigate such incidents, there is no guarantee that we will be able to adequately anticipate or prevent one. Cybercrime, including attempts to overload our servers with denial-of-service attacks, theft, social engineering, phishing, ransomware or similar disruptions from unauthorized access or attempted unauthorized access to our systems could result in the destruction, misuse or release of personal information or other sensitive data. As of the date of this annual report, we have no knowledge of any significant compromise or material financial or data loss related to a cybersecurity incident.
51
However, it is difficult to detect or prevent evolving forms of cybersecurity incidents, and our systems, and those of our third-party service providers and of our customers, are vulnerable to cybersecurity incidents.
In the event that our systems are breached or damaged for any reason, we may suffer loss or unavailability of data and interruptions to our business operations. If such an event occurs, the unauthorized disclosure, loss or unavailability of data and the disruption to our fixed-line or wireless networks may have a material adverse effect on our business and results of operations. The costs associated with a cybersecurity incident could include increased expenditures on information and cybersecurity measures, damage to our reputation, loss of existing customers and business partners and lead to financial losses from remedial actions and potential liability, including possible litigation and sanctions. Any of these occurrences may result in a material adverse effect on our results of operations and financial condition.
Failure to achieve proper data governance could lead to data mismanagement
We process large amounts of personally identifiable information of customers and employees and are subject to various compliance, security, privacy, data quality and regulatory requirements. Failure to achieve proper data governance could lead to data mismanagement which in turn could result in data loss, regulatory investigations or sanctions, and cybersecurity risk.
If our churn rate increases, our business could be negatively affected
The cost of acquiring a new subscriber is much higher than the cost of maintaining an existing subscriber. Accordingly, subscriber deactivations, or “churn,” could have a material negative impact on our operating income, even if we are able to obtain one new subscriber for each lost subscriber. A substantial majority of our subscribers are prepaid, and we do not have long-term contracts with them. Our average churn rate on a consolidated basis was 4.2% for the year ended December 31, 2018 and 4.1% for the year ended December 31, 2017. If we experience an increase in our churn rate, our ability to achieve revenue growth could be materially impacted. In addition, a decline in general
economic conditions could lead to an increase in churn, particularly among our prepaid subscribers.
We rely on key suppliers to provide equipment that we need to operate our business
We rely upon various key suppliers to provide us with handsets, network equipment or services, which we need to expand and operate our business. Our key suppliers include Huawei, Ericsson and Alcatel. If these suppliers fail to provide equipment or service to us on a timely basis, we could experience disruptions, which could have an adverse effect on our revenues and results of operations. In addition, we might be unable to satisfy requirements under our concessions.
Government or regulatory actions with respect to certain suppliers may impact us. For example, the government of the United States and Canada, among others, are currently conducting a regulatory review of certain international suppliers of network equipment and technologies to evaluate potential risks. We are currently unable to predict the outcome of such reviews, including any possible restrictions placed on our key suppliers , and as a result we cannot determine their potential impact on our business.
Our ability to pay dividends and repay debt depends on our subsidiaries’ ability to pay dividends and make other transfers to us
We are a holding company with no significant assets, other than the shares of our subsidiaries and our holdings of cash and cash equivalents. Our ability to pay dividends and repay debt depends on the continued transfer to us of dividends and other income from our subsidiaries. The ability of our subsidiaries to pay dividends and make other transfers to us may be limited by various regulatory, contractual and legal constraints that affect them.
We may fail to realize the benefits anticipated from acquisitions, divestments and significant investments we make from time to time
The business growth opportunities, revenue benefits, cost savings and other benefits we anticipated to result from our acquisitions, divestments and significant investments may not be achieved as expected, or may be delayed. Our
52
divestments may also adversely affect our prospects. For example, we may be unable to fully implement our business plans and strategies for the combined businesses due to regulatory limitations, and we may face regulatory restrictions in our provision of combined services in some of the countries in which we operate. To the extent that we incur higher integration costs or achieve lower revenue benefits or fewer cost savings than expected, or if we are required to recognize impairments of acquired assets, investments or goodwill, our results of operations and financial condition may suffer.
A downgrade of Mexico’s credit rating could affect us
Credit rating agencies regularly evaluate Mexico and its sovereign rating based on various factors including macroeconomic trends, tax and budgetary conditions and indebtedness metrics. If Mexico’s sovereign credit rating is downgraded by credit rating agencies, the rating of our securities may also be downgraded, which could negatively affect our financing costs and the market price of our securities.
RISKS RELATING TO THE TELECOMMUNICATIONS INDUSTRY GENERALLY
Changes in the telecommunications industry could affect our future financial performance
The telecommunications industry continues to experience significant changes as new technologies are developed that offer subscribers an array of choices for their communications needs. These changes include, among others, regulatory changes, evolving industry standards, ongoing improvements in the capacity and quality of digital technology, shorter development cycles for new products and changes inend-user needs and preferences. There is uncertainty as to the pace and extent of growth in subscriber demand, and as to the extent to which prices for airtime, broadband access, Pay TV and fixed-line rental may continue to decline. Our ability to compete in the delivery of high-quality internet and broadband services is particularly important, given the increasing contribution of revenues from data services to our overall growth. If we are unable to
meet future advances in competing technologies on a
timely basis or at an acceptable cost, we could lose subscribers to our competitors. In general, the development of new services in our industry requires us to anticipate and respond to the varied and continually changing demands of our subscribers. It also requires significant capital expenditure, including investment in the continual maintenance and upgrading of our networks, in order to expand coverage, increase our capacity to absorb higher bandwidth usage and adapt to new technologies. We may not be able to accurately predict technological trends or the success of new services in the market. In addition, there could be legal or regulatory restraints to our introduction of new services. If these services fail to gain acceptance in the marketplace, or if costs associated with implementation and completion of the introduction of these services materially increase, our ability to retain and attract subscribers could be adversely affected. This is true across many of the services we provide, including wireless and cable technology.
The intellectual property used by us, our suppliers or service providers may infringe on intellectual property rights owned by others
Some of our products and services use intellectual property that we own or license from others. We also provide content we receive from content producers and distributors, such as ringtones, text games, video games, video, including TV programs and movies, wallpapers or screensavers, and we outsource services to service providers, including billing and customer care functions, that incorporate or utilize intellectual property. We and some of our suppliers, content distributors and service providers have received, and may receive in the future, assertions and claims from third parties that the content, products or software utilized by us or our suppliers, content producers and distributors and service providers infringe on the patents or other intellectual property rights of these third parties. These claims could require us or an infringing supplier, content distributor or service provider to cease engaging in certain activities, including selling, offering and providing the relevant products and services. Such claims and assertions also could subject us to costly litigation and significant liabilities for damages or royalty payments, or require us to cease certain activities or prevent us from selling certain products or services.
53
Concerns about health risks relating to the use of wireless handsets and base stations may adversely affect our business
Portable communications devices have been alleged to pose health risks, including cancer, due to radio frequency emissions. Lawsuits have been filed in the United States against certain participants in the wireless industry alleging various adverse health consequences as a result of wireless phone usage, and our subsidiaries may be subject to similar litigation in the future. Research and studies are ongoing, and there can be no assurance that further research and studies will not demonstrate a link between radio frequency emissions and health concerns. Any negative findings in these studies could adversely affect the use of wireless technology and, as a result, our future financial performance.
Developments in the telecommunications sector have resulted, and may result, in substantial write-downs of the carrying value of certain of our assets
Where the circumstances require, we review the carrying value of each of our assets, subsidiaries and investments in associates to assess whether those carrying values can be supported by the future discounted cash flows expected to be derived from such assets. Whenever we consider that due to changes in the economic, regulatory, business or political environment, our goodwill, investments in associates, intangible assets or fixed assets may be impaired, we consider the necessity of performing certain valuation tests, which may result in impairment charges. The recognition of impairments of tangible, intangible and financial assets could adversely affect our results of operations. See “Critical Accounting Policies and Estimates—Impairment of Long-Lived Assets” under Part II of this annual report.
RISKS RELATING TO OUR CONTROLLING SHAREHOLDERS, CAPITAL STRUCTURE AND TRANSACTIONS WITH AFFILIATES
Members of one family may be deemed to control us and may exercise their control in a manner that may differ from the interest of other shareholders
Based on reports of beneficial ownership of our shares filed with the SEC, Carlos Slim Helú, a member of our Board of Directors, together with his sons, daughters and grandchildren (together, the “Slim Family”), including his two sons, Carlos Slim Domit and Patrick Slim Domit, who serve as the Chairman and Vice Chairman of our Board of Directors, respectively, may be deemed to control us. The Slim Family may be able to elect a majority of the members of our Board of Directors and to determine the outcome of other actions requiring a vote of our shareholders. The interests of the Slim Family may diverge from the interests of our other investors.
We have significant transactions with affiliates
We engage in various transactions with Telesites, S.A.B. de C.V. (“Telesites”) and certain subsidiaries of Grupo Carso, S.A.B. de C.V. (“Grupo Carso”) and Grupo Financiero Inbursa, S.A.B. de C.V. (“Grupo Financiero Inbursa”), all which may be deemed for certain purposes to be under common control with América Móvil.
These transactions occur in the ordinary course of business. Transactions with affiliates may create the potential for conflicts of interest.
We also make investments together with related parties, sell investments to related parties and buy investments from related parties. For more information about our transactions with affiliates, see “Related Party Transactions” under Part IV of this annual report.
Our bylaws restrict transfers of shares in some circumstances
Our bylaws provide that any acquisition or transfer of more than 10.0% of our capital stock by any person or group of persons acting together requires the approval of our Board of Directors. You may not acquire or transfer more than
54
10.0% of our capital stock without the approval of our Board of Directors. See “Bylaws—Restrictions of Certain Transfers” under Part IV of this annual report.
The protections afforded to minority shareholders in Mexico are different from those in the United States
Under Mexican law, the protections afforded to minority shareholders are different from those in the United States. In particular, the law concerning fiduciary duties of directors is not as fully developed as in other jurisdictions, the procedure for class actions is different, and there are different procedural requirements for bringing shareholder lawsuits. As a result, in practice it may be more difficult for minority shareholders of América Móvil to seek remedies against us or our directors or controlling shareholders than it would be for shareholders of a company incorporated in another jurisdiction, such as the Delaware.
Holders of L Shares and L Share ADSs have limited voting rights
Our bylaws provide that holders of L Shares are not permitted to vote, except on such limited matters as, among others, the transformation or merger of América Móvil or the cancellation of registration of the L Shares with the Mexican Securities Registry (Registro Nacional de Valores, or “RNV”) maintained by the CNBV or any stock exchange on which they are listed. If you hold L Shares or L Share ADSs, you will not be able to vote on most matters, including the declaration of dividends, which are subject to a shareholder vote in accordance with our bylaws.
Holders of ADSs are not entitled to attend shareholders’ meetings, and they may only vote through the depositary
Under our bylaws, a shareholder is required to deposit its shares with a custodian in order to attend a shareholders’ meeting. A holder of ADSs will not be able to meet this requirement and, accordingly, is not entitled to attend shareholders’ meetings. A holder of ADSs is entitled to instruct the depositary as to how to vote the shares represented by ADSs, in accordance with procedures provided for in the deposit agreements, but a holder of ADSs will not be able to vote its shares directly at a shareholders’ meeting or to appoint a proxy to do so.
Our bylaws may only be enforced in Mexico
Our bylaws provide that legal actions relating to the execution, interpretation or performance of the bylaws may be brought only in Mexican courts. As a result, it may be difficult fornon-Mexican shareholders to enforce their shareholder rights pursuant to the bylaws.
It may be difficult to enforce civil liabilities against us or our directors, officers and controlling persons
América Móvil is organized under the laws of Mexico, with its principal place of business in Mexico City, and most of our directors, officers and controlling persons reside outside the United States. In addition, all or a substantial portion of our assets and their assets are located outside of the United States. As a result, it may be difficult for investors to effect service of process within the United States on such persons or to enforce judgments against them, including in any action based on civil liabilities under U.S. federal securities laws. There is doubt as to the enforceability against such persons in Mexico, whether in original actions or in actions to judgments of U.S. courts, of liabilities based solely on U.S. federal securities laws.
You may not be entitled to participate in future preemptive rights offerings
Under Mexican law, if we issue new shares for cash as part of certain capital increases, we must grant our shareholders the right to purchase a sufficient number of shares to maintain their existing ownership percentage in América Móvil. Rights to purchase shares in these circumstances are known as preemptive rights. Our shareholders do not have preemptive rights in certain circumstances such as mergers, convertible debentures, public offers and placement of repurchased shares. We may not be legally permitted to allow holders of ADSs or holders of L Shares or A Shares in the United States to exercise any preemptive rights in any future capital increase unless we file a registration statement with the U.S. Securities and Exchange Commission (the “SEC”) with respect to that future issuance of shares. At the time of any future capital increase, we will evaluate the costs and potential liabilities associated with filing a registration statement with the SEC and any other factors that we consider important to determine whether we will file such a registration statement.
55
We cannot assure you that we will file a registration statement with the SEC to allow holders of ADSs or U.S. holders of L Shares or A Shares to participate in a preemptive rights offering. As a result, the equity interest of such holders in América Móvil may be diluted proportionately. In addition, under current Mexican law, it is not practicable for the depositary to sell preemptive rights and distribute the proceeds from such sales to ADS holders.
RISKS RELATING TO DEVELOPMENTS IN MEXICO AND OTHER COUNTRIES
Economic, political and social conditions in Latin America, the United States, the Caribbean and Europe may adversely affect our business
Our financial performance may be significantly affected by general economic, political and social conditions in the markets where we operate. Many countries in Latin America and the Caribbean, including Mexico, Brazil and Argentina, have undergone significant economic, political and social crises in the past, and these events may occur again in the future. We cannot predict whether changes in political administrations will result in changes in governmental policy and whether such changes will affect our business. Factors related to economic, political and social conditions that could affect our performance include:
| • | | significant governmental influence over local economies; |
| • | | substantial fluctuations in economic growth; |
| • | | high levels of inflation, including hyperinflation; |
| • | | changes in currency values; |
| • | | exchange controls or restrictions on expatriation of earnings; |
| • | | high domestic interest rates; |
| • | | changes in governmental economic, tax, labor or other policies; |
| • | | imposition of trade barriers; |
| • | | changes in law or regulation; and |
| • | | overall political, social and economic instability. |
Adverse economic, political and social conditions in Latin America, the United States, the Caribbean or in Europe may inhibit demand for telecommunication services and create uncertainty regarding our operating environment or may affect our ability to renew our licenses and concessions, to maintain or increase our market share or profitability and may have an adverse impact on future acquisitions, which could have a material adverse effect on our company. In addition, the perception of risk in the countries in which we operate may have a negative effect on the trading price of our shares and ADSs and may restrict our access to international financial markets.
In various countries where we operate, for example, elections took place during 2018, which could lead to economic, political and social changes over which we have no control. Our business may also be especially affected by conditions in Mexico and Brazil, two of our largest markets. Mexican elections in July 2018 resulted in a new president and in a new Congress with a majority of members in both houses representing a different political party from the parties that have been in power in the past. We cannot predict what changes in policy the Mexican administration may adopt, or their impact on our operations. Additionally, in Mexico, economic conditions are strongly impacted by those of the United States. There is continuing uncertainty regarding U.S. policies with respect to matters of importance to Mexico and its economy, particularly with respect to trade and migration.
Possible replacement of the LIBOR benchmark interest rate may have an impact on our business
On July 27, 2017, the U.K. Financial Conduct Authority (the authority that regulates LIBOR) announced that it would phase out LIBOR as a benchmark by the end of 2021. It is unclear whether new methods of calculating LIBOR will be established such that it continues to exist after 2021. Potential changes, or uncertainty related to such potential changes may adversely affect the market for loans with LIBOR-indexed interest rates. When LIBOR ceases to exist, we may need to amend the credit and loan agreements with our lenders that utilize LIBOR as a factor in determining the interest rate based on a new standard that is established, if any. There is no guarantee that a transition from LIBOR to an alternative will not result in financial market disruptions,
56
significant increases in benchmark rates, or borrowing costs to borrowers, any of which could have an adverse effect on our business, results of operations and financial condition.
Changes in exchange rates could adversely affect our financial condition and results of operations
We are affected by fluctuations in the value of the currencies in which we conduct operations compared to the currencies in which our indebtedness is denominated. Such changes result in exchange losses or gains on our net indebtedness and accounts payable. In 2018, we reported net foreign exchange losses of Ps.7.3 billion.
In addition, currency fluctuations between the Mexican peso and the currencies of ournon-Mexican subsidiaries affect our results as reported in Mexican pesos. Currency fluctuations are expected to continue to affect our financial income and expense.
Major depreciation of the currencies in which we conduct operations could cause governments to impose exchange controls that would limit our ability to transfer funds between us and our subsidiaries
Major depreciation of the currencies in which we conduct operations may result in disruption of the international foreign exchange markets and may limit our ability to transfer or to convert such currencies into U.S. dollars and other currencies for the purpose of making timely payments of interest and principal on our indebtedness. For example, although the Mexican government does not currently restrict, and for many years has not restricted, the right or ability of Mexican or foreign persons or entities to
convert Mexican pesos into U.S. dollars or to transfer other currencies out of Mexico, it could institute restrictive exchange rate policies in the future. Similarly, the Brazilian government may impose temporary restrictions on the conversion of Brazilian reais into foreign currencies and on the remittance to foreign investors of proceeds from investments in Brazil whenever there is a serious imbalance in Brazil’s balance of payments or a reason to foresee a serious imbalance. In the past, the government of Argentina has adopted restrictions on access to the foreign exchange market and the transfer of foreign currency outside Argentina. The Argentine government could impose further exchange controls or restrictions on the movement of capital and take other measures in the future in response to capital flight or a significant depreciation of the Argentine peso.
Developments in other countries may affect the market price of our securities and adversely affect our ability to raise additional financing
The market value of securities of Mexican companies is, to varying degrees, affected by economic and market conditions in other countries, including the United States, the European Union (the “EU”) and emerging market countries. Although economic conditions in such countries may differ significantly from economic conditions in Mexico, investors’ reactions to developments in any of these other countries may have an adverse effect on the market value of securities of Mexican issuers. Crises in the United States, the EU and emerging market countries may diminish investor interest in securities of Mexican issuers. This could materially and adversely affect the market price of our securities, and could also make it more difficult for us to access the capital markets and finance our operations in the future on acceptable terms or at all.
57


The following table sets forth our capital structure as of March 31, 2019.
| | | | | | | | | | | | |
SERIES | | NUMBER OF SHARES (MILLIONS) | | | PERCENT OF CAPITAL | | | COMBINED A SHARES AND AA SHARES(1) | |
| | | | |
L Shares (no par value) | | | 44,883 | | | | 68.0 | % | | | — | |
| | | | |
AA Shares (no par value) | | | 20,602 | | | | 31.2 | % | | | 97.5 | % |
| | | | |
A Shares (no par value) | | | 539 | | | | 0.8 | % | | | 2.5 | % |
| | | | |
Total(2) | | | 66,024 | | | | 100.0 | % | | | 100.0 | % |
|
(1) The AA Shares and A Shares of América Móvil, together, are entitled to elect a majority of our directors. Holders of L Shares are entitled to limited voting rights under our bylaws. See “Bylaws—Voting Rights” under this Part IV. (2) Figures in the table may not recalculate exactly due to rounding. |
According to reports of beneficial ownership of our shares filed with the SEC, the Slim Family may be deemed to control us through their interests in a Mexican trust that holds AA Shares and L Shares for their benefit (the “Family Trust”), their interest in Inversora Carso, S.A. de C.V., including its subsidiary Control Empresarial de Capitales, S.A. de C.V. and their direct ownership of our shares. See “Management—Directors” and “Management—Executive Committee” under Part V and “Related Party Transactions” under this Part IV of this annual report.
The following table identifies owners of more than 5.0% of any series of our shares as of March 31, 2019. Except as described in the table below and the accompanying notes, we are not aware of any holder of more than 5.0% of any series of our shares. Figures below do not include L Shares that would be held by each shareholder upon conversion of AA Shares or A Shares, as provided for under our bylaws. See “Bylaws—Shareholders’ Equity” under this Part IV and “Management—Share Ownership of Directors and Senior Management” under Part V of this annual report.
| | | | | | | | |
SHAREHOLDER | | SHARES OWNED (MILLIONS) | | | PERCENT OF CLASS(1) | |
| |
AA SHARES: | |
| | | |
Family Trust(2) | | | 10,894 | | | | 52.9% | |
| | | |
Inversora Carso(3) | | | 4,381 | | | | 21.3% | |
| | | |
Carlos Slim Helú | | | 1,879 | | | | 9.1% | |
| |
L SHARES: | |
| | | |
Inversora Carso(3) | | | 6,020 | | | | 13.4% | |
| | | |
Family Trust(2) | | | 5,998 | | | | 13.4% | |
| | | |
Carlos Slim Helú | | | 3,072 | | | | 6.8% | |
| | | |
BlackRock, Inc.(4) | | | 2,918 | | | | 6.5% | |
|
(1) Percentage figures are based on the number of shares outstanding as of March 31, 2019. (2) The Family Trust is a Mexican trust that holds AA Shares and L Shares for the benefit of members of the Slim Family. In addition to shares held by the Family Trust, members of the Slim Family, including Carlos Slim Helú, directly own an aggregate of 3,558 million AA Shares and 9,570 million L Shares representing 17.3% and 21.3%, respectively, of each series. According to beneficial reports filed with the SEC, none of these members of the Slim Family, other than Carlos Slim Helú, individually directly own more than 5.0% of any class of our shares. (3) Includes shares owned by subsidiaries of Inversora Carso. Based on beneficial ownership reports filed with the SEC, Inversora Carso is a Mexican sociedad anónima de capital variable and may be deemed to be controlled by the Slim Family. (4) Based on beneficial ownership reports filed with the SEC. |
As of March 31, 2019, 15.9% of the outstanding L Shares were represented by L Share ADSs, each representing the right to receive 20 L Shares, and 99.9% of the L Share ADSs were held by 7,077 registered holders with addresses in the United States. As of such date, 35.9% of the A Shares were held in the form of A Share ADSs, each representing the right to receive 20 A Shares, and 99.8% of the A Share ADSs were held by 3,450 registered holders with addresses in the United States. Each A Share may be exchanged at the option of the holder for one L Share.
We have no information concerning the number of holdings or holders with registered addresses in the United States that hold:
| • | | A Shares not represented by ADSs; or |
| • | | L Shares not represented by ADSs. |
60
|
RELATED PARTY TRANSACTIONS |
Our subsidiaries purchase materials or services from a variety of companies that may be deemed for certain purposes to be under common control with us, including Telesites, Grupo Carso and Grupo Financiero Inbursa and their respective subsidiaries.
These services include insurance and banking services provided by Grupo Financiero Inbursa and its subsidiaries. In addition, we sell products in Mexico through the Sanborns and Sears Operadora México, S.A. de C.V. (“Sears”) store chains. Some of our subsidiaries also purchase network construction services and materials from subsidiaries of Grupo Carso. Our subsidiaries purchase these materials and services on terms no less favorable than they could obtain from unaffiliated parties, and would have access to other sources if our related parties ceased to provide them on competitive terms.
We and Telesites have entered into an agreement providing for site usage fees, annual price escalations and fixed annual charges that permit us to install apre-determined amount of equipment at the sites and provide for incremental fee payments if capacity use is exceeded. The principal economic terms of the agreement conform to the reference terms published by Telesites and approved by IFT.
Note 6 to our audited consolidated financial statements included in this annual report provides additional information about our related party transactions.
61
We regularly pay cash dividends on our shares. The table below sets forth the nominal amount of dividends paid per share on each date indicated, in Mexican pesos and translated into U.S. dollars at the exchange rate reported by Banco de México, as published in the Official Gazette, for each of the respective payment dates.
| | | | | | |
| | |
Payment Date | | Pesos Per Share | | | Dollar Per Share | |
| | | |
November 12, 2018 | | Ps. 0.16 | | U.S.$ | 0.0080 | |
| | | |
July 16, 2018 | | Ps. 0.16 | | U.S.$ | 0.0085 | |
| | | |
November 13, 2017 | | Ps. 0.15 | | U.S.$ | 0.0079 | |
| | | |
July 17, 2017 | | Ps. 0.15 | | U.S.$ | 0.0085 | |
| | | |
November 14, 2016 | | Ps. 0.14 | | U.S.$ | 0.0068 | |
| | | |
July 15, 2016 | | Ps. 0.14 | | U.S.$ | 0.0076 | |
| | | |
November 13, 2015 | | Ps. 0.13 | | U.S.$ | 0.0078 | |
| | | |
September 25, 2015 | | Ps. 0.30 | | U.S.$ | 0.0177 | |
| | | |
July 17, 2015 | | Ps. 0.13 | | U.S.$ | 0.0082 | |
| | | |
November 14, 2014 | | Ps. 0.12 | | U.S.$ | 0.0082 | |
| | | |
July 18, 2014 | | Ps. 0.12 | | U.S.$ | 0.0082 | |
We have offered our shareholders the option to receive a scrip dividend in the form of either cash, Series L shares or a combination thereof and may continue to do so in the future.
On April 9, 2019, our shareholders approved a cash dividend of Ps.0.35 per share, of which Ps.0.18 per share is payable on July 15, 2019 and Ps.0.17 is payable on November 11, 2019.
The declaration, amount and payment of dividends by América Móvil is determined by majority vote of the holders of AA Shares and A Shares, generally on the recommendation of the Board of Directors, and depends on our results of operations, financial condition, cash requirements, future prospects and other factors considered relevant by the holders of AA Shares and A Shares.
Our bylaws provide that holders of AA Shares, A Shares and L Shares participate equally on aper-share basis in dividend payments and other distributions, subject to certain preferential dividend rights of holders of L Shares. See “Bylaws—Dividend Rights” and “Bylaws—Preferential Rights of L Shares” under this Part IV.
Our shares and ADSs are listed on the following markets:
| | | | |
| | |
Security | | Stock Exchange | | Ticker Symbol |
| | | |
L Shares | | Mexican Stock Exchange—Mexico City | | AMXL |
| | | |
L Share ADSs | | New York Stock Exchange—New York | | AMX |
| | | |
A Shares | | Mexican Stock Exchange—Mexico City | | AMXA |
| | | |
A Share ADSs | | New York Stock Exchange—New York | | AMOV |
62
Below is a brief summary of certain significant provisions in our current bylaws and Mexican law. It does not purport to be complete and is qualified by reference to the bylaws themselves. An English translation of our bylaws has been filed with the SEC as an exhibit and is incorporated by reference to this annual report. For a description of our Board of Directors, Executive and Audit and Corporate Practices Committees and External Auditor, see “Management” under Part V of this annual report.
Organization
We are a sociedad anónima bursátil de capital variable organized under Mexican law.
Shareholders’ Equity
We have three classes of outstanding shares: AA Shares, A Shares and L Shares, all without par value, fully paid andnon-assessable.
AA Shares and A Shares have full voting rights
L Shares may vote only in limited circumstances as described under “—Voting Rights” under this Part IV.
The rights of all series of shares are generally identical except for voting rights and the limitations on nonMexican ownership of AA Shares and A Shares. The AA Shares must always represent at least 51.0% of the combined AA Shares and A Shares. At least 20.0% of our outstanding shares must consist of AA Shares, and not more than 80% can be A Shares and L Shares.
Each AA Share or A Share may be exchanged at the option of the holder for one L Share, provided that the AA Shares may never represent less than 20.0% of our outstanding shares or less than 51.0% of our combined AA Shares and A Shares.
Any capital increase must be represented by new shares of each series in proportion to the number of shares of each series outstanding.
Voting Rights
Each AA Share or A Share entitles the holder to one vote at any shareholders meeting.
Each L Share entitles the holder to one vote at any meeting at which L Shares are entitled to vote. L Shares are entitled to vote to elect only two members of the Board and the corresponding alternate directors, as well as on the following limited matters: our transformation from one type of company to another; any merger involving us; the extension of our authorized corporate duration; our voluntary dissolution; any change in our corporate purpose; any transaction that represents 20.0% or more of the Company’s consolidated assets; any change in our jurisdiction of incorporation; removal of our shares from listing on the Mexican Stock Exchange or any foreign exchange; and any action that would prejudice the rights of L Shares. A resolution on any of the specified matters requires the affirmative vote of both a majority of all outstanding shares and a majority of the AA Shares and the A Shares voting together.
Shares of any series are also entitled to vote as a class on any action that would prejudice the rights of that series and are entitled to judicial relief against any action taken without their vote.
Shareholders’ Meetings
General shareholders’ meetings may be ordinary or extraordinary. Extraordinary general meetings are those called to consider certain specified matters, including, principally, changes to the bylaws, liquidation, merger and transformation, as well as to consider the removal of our shares from listing on the Mexican Stock Exchange or any foreign stock exchange. General meetings called to consider all other matters are ordinary meetings.
An ordinary general meeting of AA Shares and A Shares must be held each year to consider the approval of the financial statements for the preceding fiscal year, to elect directors and to determine the allocation of the profits. Transactions that represent 20.0% or more of our consolidated assets in any fiscal year must be approved by an ordinary general shareholder meeting of all shareholders, including L Shares. All other matters on which L Shares are entitled to vote would be considered at an extraordinary general meeting.
The two directors elected by the L Shares are elected at a special meeting of L Shares. A special meeting of the L Shares must be held each year for the election of directors.
63
The quorum for an ordinary general meeting of the AA Shares and A Shares is 50.0% of such shares, and action may be taken by a majority of the shares present. If a quorum is not available, a second meeting may be called at which action may be taken by a majority of the AA Shares and A Shares present, regardless of the number of such shares. Special meetings of L Shares are governed by the same rules applicable to ordinary general meetings of AA Shares and A Shares. The quorum for an extraordinary general meeting at which L Shares may not vote is 75.0% of the AA Shares and A Shares, and the quorum for an extraordinary general meeting at which L Shares are entitled to vote is 75.0% of the outstanding capital stock. If a quorum is not available in either case, a second meeting may be called and action may be taken, provided a majority of the shares entitled to vote is present. Whether on first or second call, actions at an extraordinary general meeting may be taken by a majority vote of the AA Shares and A Shares outstanding and, on matters which L Shares are entitled to vote, a majority vote of all the capital stock.
Holders of 20.0% of our outstanding capital stock may have any shareholder action set aside by filing a complaint with a Mexican court of law within 15 days after the close of the meeting at which such action was taken and showing that the challenged action violates Mexican law or our bylaws. In addition, any holder of our capital stock may bring an action at any time within five years challenging any shareholder action. Relief under these provisions is only available to holders who were entitled to vote on, or whose rights as shareholders were adversely affected by, the challenged shareholder action and whose shares were not represented when the action was taken or, if represented, voted against it.
Shareholders’ meetings may be called by the Board, its chairman, its corporate secretary, the Chairman of the Audit and Corporate Practices Committee or a Mexican court of law. The Chairman of the Board or the Chairman of the Audit and Corporate Practices Committee may be required to call a meeting of shareholders by the holders of 10.0% of the outstanding shares. Notice of meetings must be published at least 15 days prior to the meeting.
A shareholder is required to deposit its shares with a custodian in order to attend a shareholders’ meeting. A holder of ADSs will not be able to meet this requirement, and accordingly is not entitled to attend shareholders’
meetings. A holder of ADSs is entitled to instruct the depositary as to how to vote the shares represented by ADSs, in accordance with procedures provided for in the deposit agreements. However, a holder of ADSs will not be able to vote its shares directly at a shareholders’ meeting or to appoint a proxy to do so.
Dividend Rights
At the annual ordinary general meeting of AA Shares and A Shares, the Board submits our financial statements for the previous fiscal year to the holders of AA Shares and A Shares for approval. Once financial statements are approved, the allocation of our net profits is determined, and we must allocate 5.0% of such net profits to a legal reserve, which is not thereafter available for distribution except as a stock dividend, until the amount of the legal reserve equals 20.0% of our capital stock. The remainder of net profits is available for distribution.
All shares outstanding are entitled to participate in a dividend or other distribution. L shares are entitled to a nominal preference with respect to dividends or liquidation, but the preference has no economic significance.
Preemptive Rights
In new issuances of shares, each shareholder has a preferential right to subscribe for a sufficient number of shares of the same series to maintain its existing proportionate holdings, except in certain circumstances such as mergers, convertible debentures, public offers and placement of treasury or repurchased shares. These rights cannot be traded separately from the shares. As a result, there is no trading market for such rights. Holders of ADSs may exercise these rights only through the depositary. We are not required to take steps that may be necessary to make this possible.
Limitations on Share Ownership
AA Shares and A Shares may be owned only by holders that qualify as Mexican investors as defined in the Foreign Investment Law (Ley de Inversión Extranjera) and our bylaws. AA Shares can only be held or acquired by Mexican citizens, Mexican corporations whose capital stock is held completely by Mexican citizens or other Mexican qualified investors.Non-Mexican investors cannot hold AA Shares except through trusts that effectively neutralize their votes.
64
If a foreign government or state acquires our AA Shares, such shares would immediately be rendered without effect or value.
We have a foreign exclusion clause that restricts ownership of our shares to holders that qualify as Mexican investors. It does not apply to the L Shares, and, under transitional provisions adopted by our shareholders, it does not limit foreign ownership of A Shares outstanding as of the date of the shareholders’ meeting approving the amendment.
Restrictions on Certain Transfers
Any transfer of more than 10.0% of our voting shares, in one or more transactions, by any person or group of persons acting in concert, requires prior approval by our Board. If the Board denies such approval, however, it shall designate an alternate transferee, who must pay market price for the shares as quoted on the Mexican Stock Exchange.
Restrictions on Deregistration in Mexico
Our shares are registered with the RNV maintained by the CNBV.
If we wish to cancel our registration, or if it is cancelled by the CNBV, we are required to conduct a public offer to purchase all of the outstanding shares prior to such cancellation. Such offer shall exclude our controlling group of shareholders. If, after the public offer is concluded, there are still outstanding shares held by the general public, we will be required to create a trust for a period of six months, with funds in an amount sufficient to purchase, at the same price as the offer price, the number of outstanding shares held by the public that did not participate in the offer.
Unless the CNBV authorizes otherwise, upon the prior approval of the Board, which must take into account the opinion of the Audit and Corporate Practices Committee, the offer price will be the higher of (i) the average of the closing price during the previous 30 days on which the shares may have been quoted or (ii) the book value of the shares in accordance with the most recent quarterly report submitted to the CNBV and to the Mexican Stock Exchange.
The voluntary cancellation of the registration shall be subject to (i) the prior authorization of the CNBV and (ii) the authorization of not less than 95.0% of the outstanding capital stock in a general extraordinary shareholders’ meeting.
Tender Offer Requirement
Certain significant acquisitions of our capital stock may require the purchaser to make a tender offer.
Other Provisions
EXCLUSIVE JURISDICTION.Our bylaws provide that legal actions relating to the execution, interpretation or performance of the bylaws shall be brought only in Mexican courts.
PURCHASE OF OUR OWN SHARES.We may repurchase our shares on the Mexican Stock Exchange at any time at the then-prevailing market price. Any such repurchase must conform to guidelines established by the Board, and the amount available to repurchase shares must be approved by the general ordinary shareholders’ meeting. The economic and voting rights corresponding to repurchased shares may not be exercised during the period in which we own such shares, and such shares are not deemed to be outstanding for purposes of calculating any quorum or vote at any shareholders’ meeting during such period.
CONFLICT OF INTEREST.A shareholder that votes on a business transaction in which its interest conflicts with our interests may be liable for damages, but only if the transaction would not have been approved without its vote.
WITHDRAWAL RIGHTS.Whenever a shareholders meeting approve a change of corporate purposes, change of nationality of the corporation or transformation from one type of company to another, any shareholder entitled to vote on such change that has voted against may withdraw and receive the book value of its shares, provided this right is exercised within 15 days following the meeting.
65
American Depositary Shares
Citibank, N.A. (“the Depositary”) serves as the depositary for our ADSs and our American Depository Receipts (“ADR”) program. ADS holders are required to pay various fees to the Depositary, and the Depositary may refuse to provide any service for which a fee is assessed until the applicable fee has been paid.
ADS holders are required to pay the Depositary amounts in respect of expenses incurred by the Depositary or its agents on behalf of ADS holders, including expenses arising from (i) taxes or other governmental charges, (ii) registration fees payable to us that may be applicable to the transfer of shares upon deposits to or withdrawals from the ADS program, (iii) cable, telex and facsimile transmission, (iv) conversion of foreign currency into U.S. dollars, (v) compliance with exchange control regulations and other regulatory requirements or (vi) servicing of the ADSs or the shares underlying ADSs. The Depositary may decide in its sole discretion to seek payment either by billing holders or by deducting the fee from one or more cash dividends or other cash distributions.
ADS holders are also required to pay additional fees for certain services provided by the Depositary, as set forth in the table below.
| | |
DEPOSITARY SERVICE | | FEE PAYABLE BY ADS HOLDERS |
| | |
Issuance and delivery of ADSs, including in connection with share distributions, purchase rights, sales and stock splits | | Up to U.S.$5.00 per 100 ADSs (or a fraction thereof) |
| | |
Cash distributions | | Up to U.S.$5.00 per 100 ADSs (or a fraction thereof) |
| | |
Surrender, withdrawal or cancellation | | Up to U.S.$5.00 per 100 ADSs (or a fraction thereof) |
| | |
Share distributions other than ADSs or rights to purchase additional ADSs (i.e.,spin-off shares) | | Up to U.S.$5.00 per 100 ADSs (or a fraction thereof) |
| | |
ADS services | | Up to U.S.$5.00 per 100 ADSs (or a fraction thereof) held on the applicable record date(s) established by the Depositary |
Payments by the Depositary
The Depositary reimburses us for certain expenses we incur in connection with the ADR program, subject to a ceiling agreed between us and the Depositary from time to time. These reimbursable expenses currently include legal and accounting fees, listing fees, investor relations expenses and fees payable to service providers for the distribution of material to ADS holders. During the year ended December 31, 2018, the Depositary reimbursed us a total of U.S.$2.1 million for reimbursable expenses.
66
|
PURCHASES OF EQUITY SECURITIES BY THE ISSUER AND AFFILIATED PURCHASERS |
We periodically repurchase our L Shares and A Shares on the open market using funds authorized by our shareholders specifically for the repurchase of L Shares and A Shares by us at our discretion. In the annual ordinary shareholders’ meeting held on April 9, 2019, our shareholders authorized an allocation of Ps.3.0 billion to repurchase L Shares and A Shares from April 2019 to April 2020.
The following tables set out information concerning purchases of our L Shares and A Shares by us and our affiliated purchasers in 2018. We did not repurchase our L Shares or A Shares other than through the share repurchase program.
| | | | | | | | | | | | | | | | |
PERIOD | | TOTAL NUMBER
OF L SHARES
PURCHASED(1) | | | AVERAGE PRICE
PER L SHARES | | | TOTAL NUMBER OF L SHARES
PURCHASED AS PART OF
PUBLICLY ANNOUNCED
PLANS OR PROGRAMS | | | APPROXIMATE MEXICAN PESO
VALUE OF L SHARES THAT MAY
YET BE PURCHASED UNDER THE
PLANS OR PROGRAMS(2) | |
| | | | | |
January 2018 | | | 4,300,000 | | | | Ps. 16.82 | | | | 4,300,000 | | | Ps. | 2,186,861,427 | |
| | | | | |
February 2018 | | | 1,318,000 | | | | 17.26 | | | | 1,318,000 | | | | 2,162,900,627 | |
| | | | | |
March 2018 | | | — | | | | — | | | | — | | | | 2,162,900,627 | |
| | | | | |
April 2018 | | | — | | | | — | | | | — | | | | 2,162,900,627 | |
| | | | | |
May 2018 | | | 2,560,156 | | | | 16.14 | | | | 2,560,156 | | | | 2,958,688,268 | |
| | | | | |
June 2018 | | | 2,080,000 | | | | 15.49 | | | | 2,080,000 | | | | 2,926,474,720 | |
| | | | | |
July 2018 | | | 3,210,000 | | | | 16.15 | | | | 3,210,000 | | | | 2,874,640,889 | |
| | | | | |
August 2018 | | | 2,680,000 | | | | 15.86 | | | | 2,680,000 | | | | 2,832,132,042 | |
| | | | | |
September 2018 | | | 2,081,508 | | | | 15.45 | | | | 2,081,508 | | | | 2,799,978,412 | |
| | | | | |
October 2018 | | | 7,880,400 | | | | 14.46 | | | | 7,880,400 | | | | 2,686,010,961 | |
| | | | | |
November 2018 | | | 4,988,725 | | | | 13.09 | | | | 4,988,725 | | | | 2,620,438,367 | |
| | | | | |
December 2018 | | | 2,918,607 | | | | 13.94 | | | | 2,918,607 | | | | 2,579,763,369 | |
Total | | | 34,017,396 | | | | | | | | 34,017,396 | | | | | |
| |
(1) This includes purchases by us and our affiliated purchasers in 2018. (2) This is the approximate peso amount available at the end of the period for purchases of both L Shares and A Shares pursuant to our share repurchase program. | |
| | | | | | | | | | | | | | | | |
PERIOD | | TOTAL NUMBER
OF A SHARES
PURCHASED(1) | | | AVERAGE PRICE
PER A SHARES | | | TOTAL NUMBER OF A SHARES
PURCHASED AS PART OF
PUBLICLY ANNOUNCED
PLANS OR PROGRAMS | | | APPROXIMATE MEXICAN PESO
VALUE OF A SHARES THAT MAY
YET BE PURCHASED UNDER THE
PLANS OR PROGRAMS(2) | |
| | | | | |
January 2018 | | | 130,382 | | | | Ps. 17.07 | | | | 130,382 | | | Ps. | 2,186,861,427 | |
| | | | | |
February 2018 | | | 74,987 | | | | 16.22 | | | | 74,987 | | | | 2,162,900,627 | |
| | | | | |
March 2018 | | | — | | | | — | | | | — | | | | 2,162,900,627 | |
| | | | | |
April 2018 | | | — | | | | — | | | | — | | | | 2,162,900,627 | |
| | | | | |
May 2018 | | | — | | | | — | | | | — | | | | 2,958,688,268 | |
| | | | | |
June 2018 | | | — | | | | — | | | | — | | | | 2,926,474,720 | |
| | | | | |
July 2018 | | | — | | | | — | | | | — | | | | 2,874,640,889 | |
| | | | | |
August 2018 | | | — | | | | — | | | | — | | | | 2,832,132,042 | |
| | | | | |
September 2018 | | | — | | | | — | | | | — | | | | 2,799,978,412 | |
| | | | | |
October 2018 | | | — | | | | — | | | | — | | | | 2,686,010,961 | |
| | | | | |
November 2018 | | | 20,248 | | | | 13.65 | | | | 20,248 | | | | 2,620,438,367 | |
| | | | | |
December 2018 | | | — | | | | — | | | | — | | | | 2,579,763,369 | |
Total | | 225,617 | | | | | | 225,617 | | | | |
| |
(1) This includes purchases by us and our affiliated purchasers in 2018. (2) This is the approximate peso amount available at the end of the period for purchases of both L Shares and A Shares pursuant to our share repurchase program. | |
67
|
TAXATION OF SHARES AND ADSS |
The following summary contains a description of certain Mexican federal and U.S. federal income tax consequences of the acquisition, ownership and disposition of L Shares, A Shares, L Share ADSs or A Share ADSs, but it does not purport to be a comprehensive description of all of the tax considerations that may be relevant to a decision to purchase, hold or sell shares or ADSs.
This discussion does not constitute, and should not be considered as, legal or tax advice to holders. The discussion is for general information purposes only and is based upon the federal tax laws of Mexico (including the Mexican Income Tax Law(Ley del Impuesto sobre la Renta) and the United States in effect on the date of this annual report, including the Convention for the Avoidance of Double Taxation and the Prevention of Fiscal Evasion and the protocols thereto between the United States and Mexico currently in force (together, the “Tax Treaty”) and the agreement between the United States and Mexico concerning the exchange of information with respect to tax matters. The Tax Treaty is subject to change, and such changes may have retroactive effects. Holders of shares or ADSs should consult their own tax advisors as to the Mexican, U.S. or other tax consequences of the purchase, ownership and disposition of shares or ADSs, including, in particular, the effect of any foreign, state or local tax laws.
MEXICAN TAX CONSIDERATIONS
The following is a general summary of the principal consequences under the Mexican Income Tax Law and the rules and regulations thereunder, as currently in effect, of an investment in shares or ADSs by a holder that is not a resident of Mexico and that will not hold shares or ADSs or a beneficial interest therein in connection with the conduct of a trade or business through a permanent establishment in Mexico (a “nonresident holder”).
For purposes of Mexican taxation, the definition of residence is highly technical and residence arises in several situations. Generally, an individual is a resident of Mexico if he or she has established his or her home or center of vital interests in Mexico, and a corporation is considered a resident if it has its place of effective management in Mexico. However, any determination of residence should take into account the particular situation of each person or legal entity.
If a legal entity or an individual is deemed to have a permanent establishment in Mexico for Mexican tax purposes, all income attributable to that permanent establishment will be subject to Mexican income taxes, in accordance with applicable tax laws.
This summary does not purport to be a comprehensive description of all the Mexican tax considerations that may be relevant to a decision to purchase, own or dispose of the shares. In particular, this summary (i) does not describe any tax consequences arising under the laws of any state, locality, municipality or taxing jurisdiction other than certain federal laws of Mexico and (ii) does not address all of the Mexican tax consequences that may be applicable to specific holders of the shares, including a holder:
| • | | whose shares were not acquired through the Mexican Stock Exchange or other markets authorized by the Ministry of Finance and Public Credit (Secretaría de Hacienda y Crédito Público) or the Mexican Federal Tax Code; |
| • | | of shares or ADSs that control us; |
| • | | that holds 10.0% or more of our shares; |
| • | | that is part of a group of persons for purposes of Mexican law that controls us (or holds 10.0% or more of our shares); or |
| • | | that is a resident of Mexico or is a corporation resident in a tax haven (as defined by the Mexican Income Tax Law). |
Tax Treaties
Provisions of the Tax Treaty that may affect the taxation of certain U.S. holders (as defined below) are summarized below.
The Mexican Income Tax Law has established procedural requirements for a nonresident holder to be entitled to benefits under any of the tax treaties to which Mexico is a party, including on dispositions and dividends. These procedural requirements include, among others, the obligation to (i) prove tax treaty residence, (ii) file tax calculations made by an authorized certified public accountant or an informational tax statement, as the case may be, and (iii) appoint representatives in Mexico for taxation purposes. Parties related to the issuer may be subject to additional procedural requirements.
68
Payment of Dividends
Dividends, either in cash or in kind, paid with respect to L Shares, A Shares, L Share ADSs or A Share ADSs will generally be subject to a 10.0% Mexican withholding tax (provided that no Mexican withholding tax will apply to distributions of net taxable profits generated before 2014).
Taxation of Dispositions
The tax rate on income realized by a nonresident holder from a disposition of shares through the Mexican Stock Exchange is generally 10.0%, which is applied to the net gain realized on the disposition. This tax is payable through withholding made by intermediaries. However, such withholding does not apply to a nonresident holder who certifies that the holder is resident in a country with which Mexico has entered into an income tax treaty.
The sale or other transfer or disposition of shares not carried out through the Mexican Stock Exchange and not held in the form of ADSs will be subject to a 25% tax rate in Mexico, which is applicable to the gross proceeds realized from the sale. Alternatively, a nonresident holder may, subject to certain requirements, elect to pay taxes on the net gain realized from the sale of shares at a rate of 35%.
The sale or disposition of ADSs through securities exchanges or markets recognized under the Mexican federal tax code (which includes the NYSE) by nonresidents who are residents of a country with which Mexico has entered into an income tax treaty is not subject to income tax in Mexico under the current tax rules. The tax treatment of such transfer of ADSs by nonresidents who are also not residents of a country with which Mexico has entered into an income tax treaty is not clear under the current Mexican tax rules.
Pursuant to the Tax Treaty, gains realized by a U.S. resident that is eligible to receive benefits pursuant to the Tax Treaty from the sale or other disposition of shares or ADSs, even if the sale or disposition is not carried out under the circumstances described in the preceding paragraphs, will not be subject to Mexican income tax, provided that the gains are not attributable to a permanent establishment or a fixed base in Mexico, and further provided that such U.S. holder owned less than 25% of the shares representing our capital stock (including ADSs), directly or indirectly, during
the12-month period preceding such disposition. U.S. residents should consult their own tax advisors as to their possible eligibility under the Tax Treaty.
Gains and gross proceeds realized by other nonresident holders that are eligible to receive benefits pursuant to other income tax treaties to which Mexico is a party may be exempt from Mexican income tax, in whole or in part.Non-U.S. holders should consult their own tax advisors as to their possible eligibility under such treaties.
Other Mexican Taxes
A nonresident holder generally will not be liable for estate, inheritance or similar taxes with respect to its holdings of shares or ADSs; provided, however, that gratuitous transfers of shares or ADSs may, in certain circumstances, result in the imposition of a Mexican tax upon the recipient. There are no Mexican stamp, issue registration or similar taxes payable by a nonresident holder with respect to shares or ADSs.
U.S. FEDERAL INCOME TAX CONSIDERATIONS
The following is a summary of certain U.S. federal income tax consequences to U.S. holders (as defined below) of the acquisition, ownership and disposition of shares or ADSs. The summary does not purport to be a comprehensive description of all of the tax consequences of the acquisition, ownership or disposition of shares or ADSs. The summary applies only to U.S. holders that will hold their shares or ADSs as capital assets and does not apply to special classes of U.S. holders, such as dealers in securities or currencies, holders with a functional currency other than the U.S. dollar, holders of 10.0% or more of our shares measured by vote or value (whether held directly or through ADSs or both),tax-exempt organizations, banks, insurance companies or other financial institutions, holders liable for the alternative minimum tax, securities traders electing to account for their investment in their shares or ADSs on amark-to-market basis, entities that are treated for U.S. federal income tax purposes as partnerships or other pass-through entities or equity holders therein and persons holding their shares or ADSs in a hedging transaction or as part of a straddle or conversion transaction.
69
|
TAXATION OF SHARES AND ADSS |
For purposes of this discussion, a “U.S. holder” is a holder of shares or ADSs that is:
| • | | a citizen or resident of the United States of America, |
| • | | a corporation (or other entity taxable as a corporation) organized under the laws of the United States of America or any state thereof or |
| • | | otherwise subject to U.S. federal income taxation on a net income basis with respect to the shares or ADSs. |
Each U.S. holder should consult such holder’s own tax advisor concerning the overall tax consequences to it of the ownership or disposition of shares or ADSs that may arise under foreign, state and local laws.
Treatment of ADSs
In general, a U.S. holder of ADSs will be treated as the owner of the shares represented by those ADSs for U.S. federal income tax purposes. Deposits or withdrawals of shares by U.S. holders in exchange for ADSs will not result in the realization of gain or loss for U.S. federal income tax purposes. U.S. holders that withdraw any shares should consult their own tax advisors regarding the treatment of any foreign currency gain or loss on any pesos received in respect of such shares.
Taxation of Distributions
In general, a U.S. holder will treat the gross amount of distributions we pay, without reduction for Mexican withholding tax, as dividend income for U.S. federal income tax purposes to the extent of our current and accumulated earnings and profits. Because we do not expect to maintain calculations of our earnings and profits under U.S. federal income tax principles, it is expected that distributions paid to U.S. holders generally will be reported as dividends. In general, the gross amount of any dividends will be includible in the gross income of a U.S. holder as ordinary income on the day on which the dividends are received by the U.S. holder, in the case of shares, or by the depositary, in the case of ADSs.
Dividends will be paid in pesos and will be includible in the income of a U.S. holder in a U.S. dollar amount calculated by reference to the exchange rate in effect on the date that they are received by the U.S. holder, in the case of shares, or
by the depositary, in the case of ADSs (regardless of whether such pesos are in fact converted into U.S. dollars on such date). If such dividends are converted into U.S. dollars on the date of such receipt, a U.S. holder generally should not be required to recognize foreign currency gain or loss in respect of the dividends. U.S. holders should consult their own tax advisors regarding the treatment of foreign currency gain or loss, if any, on any pesos received by a U.S. holder or depositary that are converted into U.S. dollars on a date subsequent to receipt. Dividends paid by us will not be eligible for the dividends-received deduction allowed to corporations under the U.S. Internal Revenue Code of 1986, as amended (the “Code”).
The amount of Mexican tax withheld generally will give rise to a foreign tax credit or deduction for U.S. federal income tax purposes. Dividends generally will constitute “passive category income” for purposes of the foreign tax credit (or, in the case of certain U.S. holders, “general category income”). The foreign tax credit rules are complex. U.S. holders should consult their own tax advisors with respect to the implications of those rules for their investments in our shares or ADSs.
Subject to certain exceptions for short-term and hedged positions, the U.S. dollar amount of dividends received by an individual with respect to the shares or ADSs will be subject to taxation at reduced rates if the dividends are “qualified dividends.” Dividends paid on the shares or ADSs will be treated as qualified dividends if (i) (A) the shares or ADSs are readily tradable on an established securities market in the United States or (B) we are eligible for the benefits of a comprehensive tax treaty with the United States which the U.S. Treasury determines is satisfactory for purposes of this provision and which includes an exchange of information program, and (ii) we were not, in the year prior to the year in which the dividend was paid, and are not, in the year in which the dividend is paid, a passive foreign investment company (“PFIC”). The ADSs are listed on the NYSE, and will qualify as readily tradable on an established securities market in the United States so long as they are so listed. In addition, the U.S. Treasury has determined that the Tax Treaty meets the requirements for reduced rates of taxation, and we believe we are eligible for the benefits of the Tax Treaty. Based on our audited consolidated financial statements, we believe that we were not treated as a PFIC for U.S. federal income tax purposes with respect to the
70
2017 and 2018 taxable year. In addition, based on our audited consolidated financial statements and our current expectations regarding the value and nature of our assets, the sources and nature of our income, we do not anticipate becoming a PFIC for the 2019 taxable year. Holders of shares or ADSs should consult their own tax advisors regarding the availability of the reduced dividend tax rate in the light of their own particular circumstances.
Distributions of additional shares or ADSs to U.S. holders with respect to their shares or ADSs that are made as part of a pro rata distribution to all of our shareholders generally will not be subject to U.S. federal income tax.
Taxation of Dispositions
A U.S. holder generally will recognize capital gain or loss on the sale or other disposition of the shares or ADSs in an amount equal to the difference between the U.S. holder’s basis in such shares or ADSs (in U.S. dollars) and the amount realized on the disposition (in U.S. dollars, determined at the spot rate on the date of disposition if the amount realized is denominated in a foreign currency). Gain or loss recognized by a U.S. holder on such sale or other disposition generally will be long-term capital gain or loss if, at the time of disposition, the shares or ADSs have been held for more than one year. Long-term capital gain recognized by a U.S. holder that is an individual is taxable at reduced rates. The deductibility of a capital loss is subject to limitations.
Gain, if any, realized by a U.S. holder on the sale or other disposition of the shares or ADSs generally will be treated as U.S. source income for U.S. foreign tax credit purposes. Consequently, if a Mexican withholding tax is imposed on the sale or disposition of the shares, a U.S. holder that does not receive significant foreign source income from other sources may not be able to derive effective U.S. foreign tax credit benefits in respect of such Mexican taxes. U.S. holders should consult their own tax advisors regarding the application of the foreign tax credit rules to their investment in, and disposition of, the shares or ADSs.
Information Reporting and Backup Withholding
Dividends on, and proceeds from the sale or other disposition of, the shares or ADSs paid to a U.S. holder generally may be subject to the information reporting requirements of the Code and may be subject to backup withholding unless the holder:
| • | | establishes that it is an exempt recipient, if required, or |
| • | | provides an accurate taxpayer identification number on a properly completed Internal Revenue Service FormW-9 and certifies that no loss of exemption from backup withholding has occurred. |
The amount of any backup withholding from a payment to a holder will be allowed as a credit against the U.S. holder’s U.S. federal income tax liability and may entitle such holder to a refund, provided that certain required information is timely furnished to the Internal Revenue Service.
U.S. Tax Consequences forNon-U.S. holders
DISTRIBUTIONS.A holder of shares or ADSs that is, with respect to the United States, a foreign corporation or a nonresident alien individual (a“non-U.S. holder”) will generally not be subject to U.S. federal income or withholding tax on dividends received on shares or ADSs, unless such income is effectively connected with the conduct by the holder of a U.S. trade or business.
DISPOSITIONS.Anon-U.S. holder of shares or ADSs will not be subject to U.S. federal income or withholding tax on gain realized on the sale of shares or ADSs, unless:
| • | | such gain is effectively connected with the conduct by the holder of a U.S. trade or business or |
| • | | in the case of gain realized by an individual holder, the holder is present in the United States for 183 days or more in the taxable year of the sale and certain other conditions are met. |
INFORMATION REPORTING AND BACKUP WITHHOLDING. Althoughnon-U.S. holders generally are exempt from backup withholding, anon-U.S. holder may be required to comply with certification and identification procedures in order to establish its exemption from information reporting and backup withholding.
71


DIRECTORS
Our Board of Directors has broad authority to manage our company. Our bylaws provide for the Board of Directors to consist of between five and 21 directors and allow for the election of an equal number of alternate directors. Directors need not be shareholders. A majority of our directors and a majority of the alternate directors must be Mexican citizens and elected by Mexican shareholders.
A majority of the holders of the AA Shares and A Shares voting together elect a majority of the directors and alternate directors, provided that any holder or group of holders of at least 10.0% of the total AA Shares and A Shares is entitled to name one director and one alternate director. Two directors and two alternate directors, if any, are elected by a majority vote of the holders of L Shares. Each alternate director may attend meetings of the Board of Directors and vote in the absence of the corresponding director. Directors and alternate directors are elected or reelected at each annual general meeting of shareholders and each annual ordinary special meeting of holders of L Shares, and each serves until a successor is elected and takes office. In accordance with the Mexican Securities Market Law (Ley del Mercado de Valores), the determination as to the independence of our directors is made by our shareholders, though the CNBV may challenge this determination. Pursuant to our bylaws and the Mexican Securities Market Law, at least 25.0% of our directors must be independent. In order to have a quorum for a meeting of
the Board of Directors, a majority of those present must be Mexican nationals.
At the annual general shareholders’ meeting held on April 9, 2019, the current members of the Board of Directors, as well as all current members of the Executive Committee and the Audit and Corporate Practices Committee, were reelected, and the Corporate Secretary and the Corporate Pro Secretary were reappointed, with 14 directors elected by the AA Shares and A Shares voting together and two directors elected by the L Shares.
Our bylaws provide that the members of the Board of Directors are elected for a term of one year. Pursuant to Mexican law, members of the Board continue in their positions after the expiration of their terms for up to an additional30-day period if new members are not elected. Furthermore, in certain circumstances provided under the Mexican Securities Market Law, the Board of Directors may elect temporary directors who then may be elected or replaced at the shareholders’ meetings.
The names and positions of the members of the Board reelected or elected for the first time at the annual general shareholders’ meeting held on April 9, 2019, their year of birth, and information concerning their committee membership and principal business activities outside América Móvil are set forth below:
74
Directors elected by holders of Series AA and Series A Shares:
| | | | |
CARLOS SLIM DOMIT Chairman of the Board and the Executive Committee | | Born: | | 1967 |
| | First elected: | | 2011 |
| | Term expires: | | 2020 |
| | Principal occupation: | | Chairman of the Board of Telmex |
| | Other directorships: | | Chairman of the Board of Grupo Carso, Grupo Sanborns, S.A.B. de C.V. (“Grupo Sanborns”) and U.S. Commercial Corp, S.A. de C.V. |
| | Business experience: | | Chief Executive Officer of Sanborn Hermanos, S.A. de C.V. (“Sanborn Hermanos”) |
PATRICK SLIM DOMIT Vice Chairman and Member of the Executive Committee | | Born: | | 1969 |
| | First elected: | | 2004 |
| | Term expires: | | 2020 |
| | Principal occupation: | | Vice Chairman of our Board of Directors |
| | Other directorships: | | Director of Grupo Carso, Impulsora del Desarrollo y el Empleo en América Latina, S.A.B. de C.V. (“IDEAL”) and Telmex |
| | Business experience: | | Chief Executive Officer of Grupo Carso and Vice President of Commercial Markets of Telmex |
DANIEL HAJJ ABOUMRAD Director and Member of the Executive Committee | | Born: | | 1966 |
| | First elected: | | 2000 |
| | Term expires: | | 2020 |
| | Principal occupation: | | Chief Executive Officer of América Móvil |
| | Other directorships: | | Director of Grupo Carso and Telmex |
| | Business experience: | | Chief Executive Officer of Compañía Hulera Euzkadi, S.A. de C.V. |
CARLOS SLIM HELÚ Director | | Born: | | 1940 |
| | First elected: | | 2015 |
| | Term expires: | | 2020 |
| | Principal occupation and Business experience: | | Chairman of the Board of Minera Frisco, S.A.B. de C.V. and Carso Infraestructura y Construcción, S.A. de C.V.; Director of IDEAL, Grupo Sanborns and Inmuebles Carso, S.A. de C.V. (“Inmuebles Carso”) |
75
| | | | |
LUIS ALEJANDRO SOBERÓN KURI Director | | Born: | | 1960 |
| | First elected: | | 2000 |
| | Term expires: | | 2020 |
| | Principal occupation: | | Chief Executive Officer and Chairman of the Board of Serinem México, S.A. de C.V. (a subsidiary of Corporación Interamericana de Entretenimiento, S.A.B. de C.V. (“CIE”)) |
| | Other directorships: | | Director of CIE; Director of Banco Nacional de México, S.A. |
| | Business experience: | | Various positions at CIE |
CARLOS BREMER GUTIÉRREZ Director and Member of the Audit and Corporate Practices Committee | | Born: | | 1960 |
| | First elected: | | 2004 |
| | Term expires: | | 2020 |
| | Principal occupation: | | Chief Executive Officer of Value Grupo Financiero, S.A.B. de C.V. and Value S.A. de C.V., Casa de Bolsa |
| | Other directorships: | | Chairman of Value Grupo Financiero, S.A.B. de C.V. and Director of Grupo GICSA, S.A.B. de C.V. |
| | Business experience: | | Various positions at Value Grupo Financiero, S.A.B. de C.V. |
FRANCISCO MEDINA CHÁVEZ Director | | Born: | | 1956 |
| | First elected: | | 2018 |
| | Term expires: | | 2020 |
| | Principal occupation: | | Chief Executive Officer and Chairman of Grupo Fame, S.A. de C.V., and Chairman of Grupo Altozano |
| | Other directorships: | | Director of Banamex Citigroup México and Telmex |
| | Business experience: | | Director of Aeromexico and Mitsui Mexico |
76
| | | | |
ERNESTO VEGA VELASCO Director, Chairman of the Audit and Corporate Practices Committee | | Born: | | 1937 |
| | First elected: | | 2007 |
| | Term expires: | | 2020 |
| | Principal occupation: | | Retired. Member of the board of directors and audit and corporate practices, planning and finance and evaluation and compensation committees of certain companies. |
| | Other directorships: | | Director of Kuo, S.A.B. de C.V., Dine, S.A.B. de C.V., Inmuebles Carso, IDEAL; and Industrias Peñoles, S.A.B. de C.V. |
| | Business experience: | | Various positions in Desc Group, including Corporate Vice-President |
RAFAEL MOISÉS KALACH MIZRAHI Director and Member of the Audit and Corporate Practices Committee | | Born: | | 1946 |
| | First elected: | | 2012 |
| | Term expires: | | 2020 |
| | Principal occupation: | | Chairman and Chief Executive Officer of Grupo Kaltex, S.A. de C.V. (“Grupo Kaltex”) |
| | Other directorships: | | Director of Telmex and Grupo Carso |
| | Business experience: | | Various positions in Grupo Kaltex |
ANTONIO COSÍO PANDO Director | | Born: | | 1968 |
| | First elected: | | 2015 |
| | Term expires: | | 2020 |
| | Principal occupation: | | Vice President of Grupo Hotelero las Brisas, S.A. de C.V. (“Grupo Brisas”), Compañía Industrial Tepeji del Río, S.A. de C.V., and Bodegas de Santo Tomás, S.A. de C.V. |
| | Other directorships: | | Director of Grupo Financiero Inbursa, Inmuebles Carso, Grupo Carso, Grupo Sanborns, Corporación Actinver S.A.B. de C.V., Grupo Aeromexico S.A.B. de C.V., and Telmex |
| | Business experience: | | Various positions in Grupo Brisas and Compañía Industrial Tepeji del Río, S.A. de C.V. |
77
| | | | |
ARTURO ELÍAS AYUB Director | | Born: | | 1966 |
| | First elected: | | 2011 |
| | Term expires: | | 2020 |
| | Principal occupation: | | Head of Strategic Alliances, Communications and Institutional Relations of Telmex; Chief Executive Officer of Fundación Telmex |
| | Other directorships: | | Chairman of the Board of Publicidad y Contenido Editori- al, S.A. de C.V.; Director of Grupo Sanborns, Grupo Carso, Sears and TM&MS LLC |
| | Business experience: | | Chief Executive Officer of Sociedad Comercial Cadena, President of Pastelería Francesa (El Globo) and President of Club Universidad Nacional, A.C. |
OSCAR VON HAUSKE SOLÍS Director | | Born: | | 1957 |
| | First elected: | | 2011 |
| | Term expires: | | 2020 |
| | Principal occupation: | | Chief Fixed-line Operations Officer of América Móvil |
| | Other directorships: | | Member of Telekom Austria’s Supervisory Board |
| | Business experience: | | Chief Executive Officer of Telmex Internacional, Chief Systems and Telecommunications Operators Officer of Telmex and member of KPN’s supervisory board |
LOUIS C. CAMILLERI Director | | Born: | | 1955 |
| | First elected: | | 2011 |
| | Term expires: | | 2020 |
| | Principal occupation: | | Chairman of Philip Morris International |
| | Other directorships: | | Director of Ferrari N.V. |
| | Business experience: | | Chairman and Chief Executive Officer of Altria and various positions in Philip Morris International |
VANESSA HAJJ SLIM Director | | Born: | | 1997 |
| | First elected: | | 2018 |
| | Term expires: | | 2020 |
78
Directors elected by holders of Series L Shares:
| | | | |
PABLO ROBERTO GONZÁLEZ GUAJARDO Director and Member of the Audit and Corporate Practices Committee | | Born: | | 1967 |
| | First elected: | | 2007 |
| | Term expires: | | 2020 |
| | Principal occupation: | | Chief Executive Officer of Kimberly Clark de México |
| | Other directorships: | | Director of Kimberly Clark de México, S.A.B de C.V. (“Kimberly Clark de México”), Grupo Sanborns, and Grupo Lala, S.A.B. de C.V. |
| | Business experience: | | Various positions in the Kimberly Clark Corporation and Kimberly Clark de México, as well as Director of Acciones y Valores Banamex S.A. de C.V. Casa de Bolsa |
DAVID IBARRA MUÑOZ Director | | Born: | | 1930 |
| | First elected: | | 2000 |
| | Term expires: | | 2020 |
| | Principal occupation: | | Retired |
| | Other directorships: | | Director of Grupo Financiero Inbursa, IDEAL and Grupo Carso |
| | Business experience: | | Chief Executive Officer of Nacional Financiera, S.N.C., served in the Mexican Ministry of Finance and Public Credit |
The annual ordinary general shareholders’ meeting held on April 9, 2019, determined that the following directors are independent: Messrs. Ernesto Vega Velasco, Carlos Bremer Gutiérrez, Pablo Roberto González Guajardo, David Ibarra Muñoz, Antonio Cosío Pando, Louis C. Camilleri, Rafael Moisés Kalach Mizrahi, Luis Alejandro Soberón Kuri and Francisco Medina Chávez.
Alejandro Cantú Jiménez, our General Counsel, serves as Corporate Secretary and Rafael Robles Miaja as CorporatePro-Secretary.
Daniel Hajj Aboumrad and Arturo Elías Ayub aresons-in-law of Carlos Slim Helú andbrothers-in-law of Patrick Slim Domit and Carlos Slim Domit. Patrick Slim Domit and Carlos Slim Domit are sons of Carlos Slim Helú. Vanessa Hajj Slim is the daughter of Daniel Hajj Aboumrad and the granddaughter of Carlos Slim Helú.
EXECUTIVE COMMITTEE
Our bylaws provide that the Executive Committee may generally exercise the powers of the Board of Directors, with certain exceptions. In addition, the Board of Directors is required to consult the Executive Committee before deciding on certain matters set forth in the bylaws, and the Executive Committee must provide its views within 10 calendar days following a request from the Board of Directors, the Chief Executive Officer or the Chairman of the Board of Directors. If the Executive Committee is unable to make a recommendation within ten calendar days, or if a majority of the Board of Directors or any other corporate body duly acting within its mandate determines in good faith that action cannot be deferred until the Executive Committee makes a recommendation, the Board of Directors is authorized to act without such recommendation. The Executive Committee may not delegate its powers to special delegates orattorneys-in-fact.
79
The Executive Committee is elected from among the directors and alternate directors by a majority vote of the holders of common shares (AA Shares and A Shares). The majority of its members must be Mexican citizens and elected by Mexican shareholders. The current members of the Executive Committee are Messrs. Carlos Slim Domit, Patrick Slim Domit and Daniel Hajj Aboumrad. See “Major Shareholders” under Part IV of this annual report.
AUDIT AND CORPORATE PRACTICES COMMITTEE
Our Audit and Corporate Practices Committee is comprised of independent members of the Board of Directors. The Audit and Corporate Practices Committee consists of Messrs. Ernesto Vega Velasco (Chairman), Rafael Moisés Kalach Mizrahi, Pablo Roberto González Guajardo and Carlos Bremer Gutiérrez. The mandate of the Audit and Corporate Practices Committee is to assist our Board of Directors in overseeing our operations, establish and monitor procedures and controls in order to ensure that the financial information we distribute is useful, appropriate and reliable and accurately reflects our financial position. In particular, the Audit and Corporate Practices Committee is required to, among other things:
| • | | provide opinions to the Board of Directors on certain matters as provided by the Mexican Securities Market Law; |
| • | | call shareholders’ meetings and recommend inclusion of matters it deems appropriate on the agenda; |
| • | | inform the Board of Directors of our internal controls and their adequacy; |
| • | | select our auditors, review andpre-approve the scope and terms of their engagement and determine their compensation; |
| • | | monitor the performance of our auditors andre-evaluate the terms of their engagement; |
| • | | recommend procedures for preparing financial statements and internal controls; |
| • | | monitor internal controls and accounting for specified types of matters; |
| • | | propose procedures for the preparation of financial statements for internal use that are consistent with the published financial statements; |
| • | | assist the Board of Directors in preparing reports as provided by the Mexican Securities Market Law; |
| • | | discuss with our auditors the annual financial statements and the accounting principles being applied in the annual and the interim financial statements and, based on such discussions, recommend their approval to the Board of Directors; |
| • | | resolve disagreements between our management and auditors relating to our financial statements; |
| • | | request the opinion of independent experts when deemed appropriate or when required by law; |
| • | | approve services to be provided by our auditors or establish policies and procedures for thepre-approval of services by our auditors; |
| • | | obtain from our auditors a report that includes a discussion of critical accounting policies used by us, any alternative accounting treatments for material items that have been discussed by management with our auditors and any other written communications between our auditors and management; |
| • | | report to the Board of Directors on its activities; |
| • | | develop procedures for the receipt, retention and treatment of complaints regarding accounting, internal controls or auditing matters, including for the confidential submission of concerns regarding such matters by employees; |
| • | | evaluate the performance of the external auditors; |
| • | | review and discuss our financial statements and advise the Board of Directors of the committee’s recommendations for approval of such financial statements; |
| • | | receive and analyze recommendations and observations to its functions from shareholders, members of the Board of Directors and senior management and receive the authority to act upon such recommendations and observations; |
80
| • | | recommend to the Board of Directors procedures for the selection and succession of our Chief Executive Officer and our other principal executives; |
| • | | propose criteria for evaluating executive performance; |
| • | | analyze the proposals of the Chief Executive Officer concerning the structure and amount of compensation for our senior executives and raise them with the Board of Directors; |
| • | | review new executive compensation programs and the operations of existing programs; |
| • | | establish contracting practices to avoid excessive payments to executives; |
| • | | assist the Board of Directors in developing appropriate personnel policies; |
| • | | participate with the Board of Directors in developing a plan for employees to invest in our L Shares and review the implementation of such plan; and |
| • | | perform any other functions the Board of Directors may delegate to the Audit and Corporate Practices Committee. |
Under certain circumstances specified in our bylaws, the Audit and Corporate Practices Committee is required to provide its opinion to the Board of Directors. The Company is required to make public disclosure of any Board action that is inconsistent with the opinion of the Audit and Corporate Practices Committee.
In addition, pursuant to our bylaws, the Audit and Corporate Practices Committee is in charge of our corporate governance functions under the Mexican securities laws and regulations and is required to submit an annual report to the Board of Directors with respect to our corporate and audit practices. The Audit and Corporate Practices Committee must request the opinions of our executive officers for purposes of preparing this annual report. The Board of Directors must seek the opinion of the Audit and Corporate Practices Committee regarding any transaction with a related party that is outside the ordinary course of our business as defined under the Mexican Securities Market Law. Each member of the Audit and Corporate Practices Committee is independent, as determined by our shareholders pursuant to the Mexican Securities Market Law and as defined under Rule10A-3 under the Exchange.
SENIOR MANAGEMENT
The names, responsibilities and prior business experience of our senior officers are as follows:
| | | | |
DANIEL HAJJ ABOUMRAD Chief Executive Officer | | Appointed: | | 2000 |
| | Business experience: | | Director of Telmex; Chief Executive Officer of Compañía Hulera Euzkadi, S.A. de C.V. |
CARLOS JOSÉ GARCÍA MORENO ELIZONDO Chief Financial Officer | | Appointed: | | 2001 |
| | Business experience: | | General Director of Public Credit at the Ministry of Finance and Public Credit; Managing Director of UBS Warburg; Associate Director of Financing at Petróleos Mexicanos (Pemex); Member of Telekom Austria’s Supervisory Board; Member of KPN Supervisory Board |
ALEJANDRO CANTÚ JIMÉNEZ General Counsel | | Appointed: | | 2001 |
| | Business experience: | | Member of Telekom Austria’s Supervisory Board; Attorney at Mijares, Angoitia, Cortés y Fuentes, S.C. |
81
| | | | |
| | | |
OSCAR VON HAUSKE SOLÍS Chief Fixed-line Operations Officer | | Appointed: | | 2010 |
| | Business experience: | | Chief Executive Officer of Telmex Internacional; Chief Systems and Telecommunications Officer of Telmex; Head of Finance at Grupo Condumex, S.A. de C.V.; Director of Telmex, Telmex Internacional, Empresa Brasileira de Telecomunicações S.A. (“Embratel”), and Net Serviços de Comunicação S.A. (“Net Serviços”); Member of Telekom Austria’s Supervisory Board |
ANGEL ALIJA GUERRERO Chief Wireless Operations Officer | | Appointed: | | 2012 |
| | Business experience: | | Various positions in América Móvil |
AUDIT COMMITTEE FINANCIAL EXPERT
Our Board of Directors has determined that Ernesto Vega Velasco qualifies as an “audit committee financial expert,” and Mr. Vega Velasco is independent under the definition of independence applicable to us under the rules of the NYSE.
COMPENSATION OF DIRECTORS AND SENIOR MANAGEMENT
The aggregate compensation paid to our directors (including compensation paid to members of our Audit and Corporate Practices Committee) and senior management in 2018 was approximately Ps.5.3 million and Ps.70.1 million, respectively. None of our directors is a party to any contract with us or any of our subsidiaries that provides for benefits upon termination of employment. We do not provide pension, retirement or similar benefits to our directors in their capacity as directors. Our executive officers are eligible for retirement and severance benefits required by Mexican law on the same terms as all other employees, and we do not separately set aside, accrue or determine the amount of our costs that is attributable to executive officers.
82
SHARE OWNERSHIP OF DIRECTORS AND SENIOR MANAGEMENT
Carlos Slim Domit, Chairman of our Board of Directors, holds 647 million (or 3.1%) of our AA Shares and 1,567 million (or 3.5%) of our L Shares directly. Patrick Slim Domit, Vice Chairman of our Board of Directors, holds 323 million (or 1.6%) of our AA Shares and 859 million (or 1.9%) of our L Shares directly. Carlos Slim Helú, member of our Board of Directors, holds 1,879 million (or 9.1%) of our AA Shares and 3,072 million (or 6.8%) of our L shares directly. In addition, according to beneficial ownership reports filed with the SEC, Patrick Slim Domit and Carlos Slim Domit are beneficiaries of a trust that owns shares of the Company. See “Major Shareholders” under Part IV and “Bylaws—Shareholders’ Equity” under Part IV of this annual report.
Except as described above, according to information provided to us by our directors and members of senior management, none of our directors or executive officers is the beneficial owner of more than 1.0% of any class of our capital stock.
83
Our corporate governance practices are governed by our bylaws, the Mexican Securities Market Law and the regulations issued by the CNBV. We also comply with the Mexican Code of Best Corporate Practices (Código de Mejores Prácticas Corporativas). On an annual basis, we file a report with the Mexican Banking and securities Commission and the Mexican Stock Exchange regarding our compliance with the Mexican Code of Best Corporate Practices.
The table below discloses the significant differences between our corporate governance practices and those required for U.S. companies under the NYSE listing standards.
| | |
NYSE STANDARDS | | OUR CORPORATE GOVERNANCE PRACTICES |
DIRECTOR INDEPENDENCE |
| Majority of board of directors must be independent. §303A.01. “Controlled companies” are exempt from this requirement. A controlled company is one in which more than 50.0% of the voting power is held by an individual, group or another company, rather than the public. §303A.00. As a controlled company, we would be exempt from this requirement if we were a U.S. issuer. | | Pursuant to the Mexican Securities Market Law, our shareholders are required to appoint a board of directors of no more than 21 members, 25% of whom must be independent. Certain persons are per senon-independent, including insiders, control persons, major suppliers and any relatives of such persons. In accordance with the Mexican Securities Market Law, our shareholders’ meeting is required to make a determination as to the independence of our directors, though such determination may be challenged by the CNBV. There is no exemption from the independence requirement for controlled companies. Currently, the majority of our Board of Directors in independent. |
EXECUTIVE SESSIONS |
Non-management directors must meet at regularly scheduled executive sessions without management. Independent directors should meet alone in an executive session at least once a year. §303A.03. | | Ournon-management directors have not held executive sessions without management in the past, and they are not required to do so. |
NOMINATING/CORPORATE GOVERNANCE COMMITTE |
| Nominating/corporate governance committee composed entirely of independent directors is required. The committee must have a charter specifying the purpose, duties and evaluation procedures of the committee. §303A.04. | | Mexican law requires us to have one or more committees that oversee certain corporate practices, including the appointment of directors and executives. Under the Mexican Securities Market Law, committees overseeing certain corporate practices must be composed of independent directors. However, in the case of controlled companies, such as ours, only a majority of the committee members must be independent. |
| “Controlled companies” are exempt from these requirements. §303A.00. As a controlled company, we would be exempt from this requirement if we were a U.S. issuer. | | Currently, we do not have a nominating committee, and we are not required to have one. Our Audit and Corporate Practices Committee, which is composed of independent directors, oversees our corporate practices, including the compensation and appointment of directors and executives. |
84
| | |
NYSE STANDARDS | | OUR CORPORATE GOVERNANCE PRACTICES |
COMPENSATION COMMITTEE |
Compensation committee composed entirely of independent directors is required, which must evaluate and approve executive officer compensation. The committee must have a charter specifying the purpose, duties and evaluation procedures of the committee. §303A.02(a)(ii) and §303A.05. “Controlled companies” are exempt from this requirement. §303A.00. | | We currently do not have a compensation committee, and we are not required to have one. Our Audit and Corporate Practices Committee, which is comprised solely of independent directors, evaluates and approves the compensation of management (including our CEO) and directors. |
AUDIT COMMITTEE |
| Audit committee satisfying the independence and other requirements of Rule10A-3 under the Exchange Act and the additional requirements under the NYSE standards is required. §§303A.06 and 303A.07. | | We have an audit and corporate practices committee of four members. Each member of the Audit and Corporate Practices Committee is independent, as independence is defined under the Mexican Securities Market Law, and also meets the independence requirements of Rule10A-3 under the U.S. Securities Exchange Act of 1934, as amended. Our Audit and Corporate Practices Committee operates primarily pursuant to (1) a written charter adopted by our Board of Directors, which assigns to the Committee responsibility over those matters required by Rule10A-3 (2) our bylaws and (3) Mexican law. For a more detailed description of the duties of our audit and corporate practices committee, see “Management” under Part V of this annual report. |
EQUITY COMPENSATION PLANS |
| Equity compensation plans and all material revisions thereto require shareholder approval, subject to limited exemptions. §§303A.08 and 312.03. | | Shareholder approval is expressly required under Mexican law for the adoption or amendment of an equity compensation plan. Such plans must provide for similar treatment of executives in comparable positions. |
SHAREHOLDER APPROVAL FOR ISSUANCE OF SECURITIES |
Issuances of securities (1) that will result in a change of control of the issuer, (2) that are to a related party or someone closely related to a related party, (3) that have voting power equal to at least 20.0% of the outstanding common stock voting power before such issuance or (4) that will increase the number of shares of common stock by at least 20.0% of the number of outstanding shares before such issuance requires shareholder approval. §§312.03(b)-(d). | | Mexican law requires us to obtain shareholder approval for any issuance of equity securities. Under certain circumstances, however, we may sell treasury stock subject to the approval of our Board of Directors. |
CODE OF BUSINESS CONDUCT AND ETHICS |
Corporate governance guidelines and a code of business conduct and ethics are required, with disclosure of any waiver for directors or executive officers. The code must contain compliance standards and procedures that will facilitate the effective operation of the code. §303A.10. | | We have adopted a code of ethics, which applies to all of our directors and executive officers and other personnel. For more information, see “Corporate Governance—Code of Ethics” under Part V of this annual report. |
85
| | |
NYSE STANDARDS | | OUR CORPORATE GOVERNANCE PRACTICES |
CONFLICTS OF INTEREST |
| Determination of how to review and oversee related party transactions is left to the listed company. The audit committee or comparable body, however, could be considered the forum for such review and oversight. §314.00. Certain issuances of common stock to a related party require shareholder approval. §312.03(b). | | In accordance with Mexican law, an independent audit committee must provide an opinion to the board of directors regarding any transaction with a related party that is outside of the ordinary course of business, which must be approved by the board of directors. Pursuant to the Mexican Securities Market Law, our Board of Directors may establish certain guidelines regarding related party transactions that do not require specific board approval. |
SOLICITATION OF PROXIES |
| Solicitation of proxies and provision of proxy materials is required for all meetings of shareholders. Copies of such proxy solicitations are to be provided to NYSE. §§402.01 and 402.04. | | We are not required to solicit proxies from our shareholders. In accordance with Mexican law and our bylaws, we inform shareholders of all meetings by public notice, which states the requirements for admission to the meeting. Under the deposit agreement relating to our ADSs, holders of our ADSs receive notices of shareholders’ meetings and, where applicable, instructions on how to instruct the depositary to vote at the meeting. Under the deposit agreement relating to our ADS, we may direct the voting of any ADS as to which no voting instructions are received by the depositary, except with respect to any matter where substantial opposition exists or that materially and adversely affects the rights of holders. |
86
(A) DISCLOSURE CONTROLS AND PROCEDURES We carried out an evaluation under the supervision and with the participation of our management, including our Chief Executive Officer and Chief Financial Officer, of the effectiveness of our disclosure controls and procedures as of December 31, 2018. Based upon our evaluation, our Chief Executive Officer and Chief Financial Officer concluded that our disclosure controls and procedures were effective to provide reasonable assurance that information required to be disclosed by us in the reports that we file or submit under the Exchange Act is recorded, processed, summarized and reported within the time periods specified in the applicable rules and forms, and that it is accumulated and communicated to our management, including our Chief Executive Officer and Chief Financial Officer, as appropriate to allow timely decisions regarding required disclosure.
(B) MANAGEMENT’S ANNUAL REPORT ON INTERNAL CONTROL OVER FINANCIAL REPORTING Our management is responsible for establishing and maintaining adequate internal control over financial reporting, as defined in Rules13a-15(f) and15d-15(f) under the Exchange Act. Under the supervision and with the participation of our management, including our Chief Executive Officer, Chief Financial Officer and other personnel, we conducted an evaluation of the effectiveness of our internal control over financial reporting based on the framework in Internal Control—Framework (2013) issued by the Committee of Sponsoring Organizations of the Treadway Commission.
Our internal control over financial reporting is a process designed to provide reasonable assurance regarding the reliability of financial reporting and the preparation of financial statements for external purposes in accordance with IFRS. Our internal control over financial reporting includes those policies and procedures that (i) pertain to the maintenance of records that, in reasonable detail, accurately and fairly reflect the transactions and dispositions of our assets, (ii) provide reasonable assurance that transactions are recorded as necessary to permit preparation of financial statements in accordance with IFRS and that our receipts and expenditures are being made only in accordance with authorizations of our management and directors and (iii) provide reasonable assurance regarding prevention or timely detection of unauthorized acquisition, use or disposition of our assets that could have a material effect on our financial statements.
Because of the inherent limitations in all control systems, internal control over financial reporting may not prevent or detect misstatements. Also, projections of any evaluation of effectiveness to future periods are subject to the risk that controls may become inadequate because of changes in conditions or that the degree of compliance with the policies or procedures may deteriorate.
Based on our evaluation under the framework in Internal Control—Integrated Framework, our management concluded that our internal control over financial reporting was effective as of December 31, 2018.
Mancera, S.C. (“Mancera”), a member practice of Ernst & Young Global Limited, an independent registered public accounting firm, our independent auditor, issued an attestation report on our internal control over financial reporting on April 11, 2019.
(C) ATTESTATION REPORT OF THE REGISTERED PUBLIC ACCOUNTING FIRM
REPORT OF INDEPENDENT REGISTERED PUBLIC ACCOUNTING FIRM
The Board of Directors and Shareholders of
América Móvil, S.A.B. de C.V.
Opinion on Internal Control over Financial Reporting
We have audited América Móvil, S.A.B. de C.V. and subsidiaries’ internal control over financial reporting as of December 31, 2018, based on criteria established in Internal Control—Integrated Framework issued by the Committee of Sponsoring Organizations of the Treadway Commission (2013 framework) (the COSO criteria). In our opinion, América Móvil, S.A.B. de C.V. and subsidiaries (the Company) maintained, in all material respects, effective internal control over financial reporting as of December 31, 2018, based on the COSO criteria.
87
We also have audited, in accordance with the standards of the Public Company Accounting Oversight Board (United States) (PCAOB), the consolidated statements of financial position of the Company as of December 31, 2018 and 2017, the related consolidated statements of comprehensive income, changes in shareholders’ equity and cash flows for each of three years in the period ended December 31, 2018, and the related notes, and our report dated April 11, 2019 expressed an unqualified opinion thereon.
Basis for Opinion
The Company´s management is responsible for maintaining effective internal control over financial reporting and for its assessment of the effectiveness of internal control over financial reporting included in the accompanying Management’s Annual Report on Internal Control over Financial Reporting. Our responsibility is to express an opinion on the Company´s internal control over financial reporting based on our audit. We are a public accounting firm registered with the PCAOB and are required to be independent with respect to the Company in accordance with the U.S. federal securities laws and the applicable rules and regulations of the Securities and Exchange Commission and the PCAOB.
We conducted our audit in accordance with the standards of the PCAOB. Those standards require that we plan and perform the audit to obtain reasonable assurance about whether effective internal control over financial reporting was maintained in all material respects.
Our audit included obtaining an understanding of internal control over financial reporting, assessing the risk that a material weakness exists, testing and evaluating the design and operating effectiveness of internal control based on the assessed risk, and performing such other procedures as we considered necessary in the circumstances. We believe that our audit provides a reasonable basis for our opinion.
Definitions and Limitations of Internal Control over Financial Reporting
A company’s internal control over financial reporting is a process designed to provide reasonable assurance regarding the reliability of financial reporting and the preparation of financial statements for external purposes in accordance with generally accepted accounting principles. A company’s internal control over financial reporting includes those policies and procedures that (1) pertain to the maintenance of records that, in reasonable detail, accurately and fairly reflect the transactions and dispositions of the assets of the company; (2) provide reasonable assurance that transactions are recorded as necessary to permit preparation of financial statements in accordance with generally accepted accounting principles, and that receipts and expenditures of the company are being made only in accordance with authorizations of management and directors of the company; and (3) provide reasonable assurance regarding prevention or timely detection of unauthorized acquisition, use or disposition of the company’s assets that could have a material effect on the financial statements.
Because of its inherent limitations, internal control over financial reporting may not prevent or detect misstatements. Also, projections of any evaluation of effectiveness to future periods are subject to the risk that controls may become inadequate because of changes in conditions, or that the degree of compliance with the policies or procedures may deteriorate.
/s/ MANCERA, S.C.
Mexico City, Mexico
April 11, 2019
(D) CHANGES IN INTERNAL CONTROL OVER FINANCIAL REPORTING.
There has been no change in our internal control over financial reporting during 2018 that has materially affected, or is reasonably likely to materially affect, our internal control over financial reporting.
88
Our Code of Ethics codifies the ethical principles that govern our business and promotes, among other things, honest and ethical conduct, full, fair, accurate, timely and understandable disclosure in reports and documents that we file with, or submit to, the SEC, compliance with applicable governmental laws, rules and regulations, the prompt internal reporting of violations of the Code of Ethics and accountability for adherence to the Code of Ethics. Our Code of Ethics applies to all of our officers, senior management, directors and employees.
The full text of our Code of Ethics may be found on our website at www.americamovil.com.
|
CORPORATE SUSTAINABILITY REPORT |
We have a corporate sustainability committee that seeks to foster greater operational efficiencies, promote social responsibility and adopt environmentally friendly initiatives.
Our corporate sustainability reports are available on our website at www.americamovil.com.
89


PART VI REGULATION
MEXICO
Legal Framework
Over the last five years, a new legal framework for the regulation of telecommunications and broadcasting services has been developed in Mexico. This legal framework is based on constitutional amendments passed in June 2013, the Federal Law on Telecommunications and Broadcasting(Ley Federal de Telecomunicaciones y Radiodifusión) enacted in July 2014 and the Federal Law on Economic Competition (Ley Federal de Competencia Económica) enacted in May 2014.
Under the current legal framework, the IFT may determine whether there is a “preponderant economic agent” in the telecommunications sector, based on number of customers, traffic or network capacity. In 2014, the IFT determined that an “economic interest group” consisting of us and our Mexican operating subsidiaries (Telcel, Telmex andTeléfonos del Noroeste, S.A. de C.V. (“Telnor”)), as well as Grupo Carso and Grupo Financiero Inbursa, constitutes the “preponderant economic agent” in the telecommunications sector, based on a finding that we serve more than half of the customers in Mexico, as measured by the IFT on a national basis.
The IFT has authority to impose on any preponderant economic agent a special regulatory regime. The special regime is referred to as “asymmetric” regulation because it applies to one sector participant and not to the others. Pursuant to the IFT’s determination that we are part of a group constituting a preponderant economic agent, we are subject to extensive asymmetric regulations in the telecom sector, which impacts our Mexican fixed-line and wireless businesses. See “—Asymmetric Regulation of the Preponderant Economic Agent” and “—Functional Separation of Telmex and Telnor Wholesale Services” under this Part VI. This legal framework has had a substantial impact on our business and operations in Mexico.
Principal Regulatory Authorities
The IFT is an autonomous authority that regulates telecommunications and broadcasting. It is headed by seven commissioners appointed by the President, and ratified by the Senate, from among candidates nominated by an evaluation committee. The IFT has authority over the
application of legislation specific to the telecommunications and broadcasting sectors, and also over competition legislation as it applies to those sectors. The Mexican Ministry of Communications and Transportation (Secretaría de Comunicaciones y Transportes) retains regulatory authority over a few specific public policy matters.
The Mexican government has certain powers in its relations with concessionaires, including the right to take over the management of an operator’s networks, facilities and personnel in cases of imminent danger to national security, public order or the national economy, natural disasters and public unrest, as well as to ensure continuity of public services.
Telecommunications operators are also subject to regulation by the Federal Consumer Bureau (Procuraduría Federal del Consumidor) under the Federal Consumer Protection Law (Ley Federal de Protección al Consumidor), which regulates publicity, quality of services and information required to be provided to consumers.
Asymmetric Regulation of the Preponderant Economic Agent
We are currently subject to extensive specific asymmetric measures based on the IFT’s determination that we, our Mexican operating subsidiaries (Telcel, Telmex and Telnor) and certain affiliates constitute the preponderant economic agent in the telecommunications sector. Below is a summary of what we believe are the most important measures.
| • | | INTERCONNECTION RATES.The Federal Law on Telecommunications and Broadcasting provides that we are not permitted to charge other carriers for the termination services we provide in our networks. These provisions were declared unconstitution by the Mexican Supreme Court (Suprema Corte de Justicia de la Nación) in August 2017 with respect to wireless services and in April 2018 with respect to fixed services. As a result, the IFT ruled that, as of January 1, 2018, in the case of Telcel, and as of January 1, 2019, in the case of Telmex, we are able to charge other carriers for terminating calls to our networks at asymmetric rates established by the IFT. We continue to pay such carriers for their interconnection services in accordance with the fixed and mobile rates set by the IFT. |
92
| • | | SHARING OF WIRELESS INFRASTRUCTURE AND SERVICES.We must provide other carriers access to (i) passive infrastructure, including towers, sites, ducts and rights of way, (ii) elements of our network that allow other carriers and mobile virtual network operators (“MVNOs”) to use our network or resell those services we provide to our customers and (iii) domestic roaming services, in each case, pursuant to IFTpre-approved reference terms (ofertas públicas de referencia). If we cannot reach an agreement with other carriers or MVNOs, our rates may be determined by the IFT using along-run average incremental costs methodology or, in the case of MVNOs, a “retail-minus” methodology. |
For mobile services, the IFT has the right to verify, through a replicability test, that mobile virtual network operators can match our end user rates.
| • | | SHARING OF FIXED INFRASTRUCTURE AND SERVICES.We must provide other carriers access to (i) passive infrastructure, including towers, sites, ducts and rights of way, (ii) elements of our network that allow other carriers to use our network or resell those services we provide to our customers and (iii) our dedicated links. If we cannot reach an agreement with other carriers, our rates may be determined by the IFT using along-run average incremental cost methodology. |
For fixed services, the IFT has the right to verify, through a replicability test, that other competitors can match our end user rates.
| • | | ACCESS TO LOCAL LOOP.We must offer other carriers access to elements of our local network separately on terms and conditions (including rates)pre-approved by the IFT. The IFT has also ordered the legal and functional separation of the provision of wholesale regulated fixed services related to local loop (acceso local) and shared access and use of passive infrastructure. See “Functional Separation of Telmex and Telnor Wholesale Services” under this Part VI. |
| • | | CERTAIN OBLIGATIONS RELATING TO RETAIL SERVICES.Rates for the provision of telecommunications services to our customers are subject to the IFT’s prior authorization. |
We are also subject to certain obligations and restrictions relating to the sale of our services and products; such obligations include unlocking mobile devices for our customers and offering individually all services that we previously offered under a bundled plan.
| • | | CONTENT.We are subject to specific limitations on acquisitions of exclusive transmission rights to “relevant” content (contenidos audiovisuales relevantes), as determined from time to time by the IFT, including the Mexican national team soccer matches, the opening and closing ceremonies and certain matches of the FIFA World Cup, the semifinal and final matches of the Liga MX soccer tournament and the Super Bowl. |
| • | | PUBLICATION OF REFERENCE TERMS.We are subject to obligations related to the publication of reference terms for all wholesale and interconnection services that are subject to asymmetric regulation. |
The measures are transitory and may be amended or eliminated by the IFT, or terminated if it determines effective competition conditions exist in the telecommunications sector or if we cease to be considered a preponderant economic agent. The IFT reviews the impact of the asymmetrical measures every two years and may modify or eliminate measures or set forth new measures. In March 2017, the IFT issued a resolution that modified and added asymmetrical regulations for mobile and fixed services, including the legal and functional separation of Telmex and Telnor wholesale services, among other measures. The IFT will begin a new review in the first quarter of 2019, which is expected to be completed in the first quarter of 2020. The new review may result in changes, which could include additional or reduced asymmetric regulations or the structural separation or divesture of assets of the preponderant economic agent.
We have challenged the determination that we are a preponderant economic agent and the asymmetric regulations in court. These challenges were denied in the case of Telmex, Telnor and the Company, and a final resolution is still pending in the case of Telcel. However, IFT’s determinations are not suspended while legal challenges against them are resolved.
93
Functional Separation of Telmex and Telnor Wholesale Services
In March 2018, we received notice of an IFT resolution directed to the Company setting forth the terms under which we are required to separate the provision of wholesale regulated fixed services by Telmex and Telnor (the “Separation Plan”).
The Separation Plan establishes, among other provisions, the following:
| • | | WHOLESALE UNIT.Telmex and Telnor must establish a business unit to provide certain wholesale services to other concessionaires, including interconnection,co- location for interconnection, intercity and international long-distance dedicated links, resale of telephone lines, broadband and bundles, as well as certain passive infrastructure services, including shared use of towers. |
| • | | NEW COMPANIES.Telmex and Telnor are required to establish separate new corporations (the “New Companies”) to provide wholesale services related to the elements of the access network, including local access dedicated links, as well as those services related to passive infrastructure associated with the access network, such as ducts, poles and rights of way. The New Companies will be direct subsidiaries of Telmex. The main features of the New Companies are as follows: |
Financial Viability.The Separation Plan contemplates that the New Companies will be financially viable. The implementation and consequences of this requirement are uncertain, both with respect to the initial composition of the New Companies’ assets and resources and with respect to their subsequent operations. The prices and terms of the services to be provided are generally subject to IFT regulation, which could affect the viability and financial requirements of the New Companies.
Corporate Governance.The New Companies will have their own corporate governance, including: (i) a board of directors with at least seven members, of which a majority (including the Chairman) must be independent; (ii) a Chief Executive Officer and senior officers appointed by the boards of directors, different and independent from those of our Mexican concessionaire subsidiaries; (iii) an independent external auditor; (iv) an Audit Committee chaired by an independent member of the board of
directors; and (v) a Regulatory Compliance Committee entirely composed of independent members. The bylaws of the New Companies must be previously approved by the IFT. Independence for these purposes is used as defined under Mexican Securities Market Law.
| • | | Personnel.The New Companies must have the personnel necessary to operate their assets and to provide wholesale services required by the Separation Plan. |
| • | | Systems and Procedures.The New Companies must have procedures, operating and management systems that are independent from those Telmex and Telnor. |
| • | | Branding.The New Companies must have their own branding distinct from América Móvil’s concessionaire subsidiaries. The brands must be dissociated from those of Telmex and Telnor within four years. |
| • | | Principal Offices.The New Companies must have their own principal offices distinct from those of América Móvil’s concessionaire subsidiaries. |
We have until March of 2020 to implement the Separation Plan. As of the date of this annual report, Telmex and Telnor have complied with all milestones of the implementation plan approved by the IFT. The implementation will be complex, and many features remain uncertain and will require further development in consultation with the IFT. As a result, we are not yet able to identify all the possible consequences, but some of the consequences could have a material adverse impact on us.
We have challenged the resolution in Mexican courts. However, legal challenges will not suspend the implementation of the Separation Plan and may not be finally determined before the Separation Plan is fully implemented.
Substantial Market Power Investigations
In 2007, the Federal Antitrust Commission (Comisión Federal de CompetenciaEconómica, or “Cofeco”) initiated two substantial market power investigations against Telcel and determined that Telcel had substantial market power in the mobile termination services market and in the nationwide wireless voice and data services market. Telcel filed challenges against both decisions, and a final resolution of these challenges is still pending. If upheld,
94
these decisions would allow the IFT to impose additional requirements as to rates, quality of service and information, among other matters.
In 2007, Cofeco initiated various investigations to evaluate whether Telmex and its subsidiary Telnor have substantial power in the markets for termination, origination, transit and wholesale dedicated-link circuits. Cofeco issued final resolutions concluding that Telmex and Telnor have substantial power in all four markets, which were challenged by Telmex and Telnor. The challenges related to each one of these markets have been denied, effectively upholding Cofeco’s findings. Consequently, the IFT may impose specific tariff requirements or other special regulations with respect to the matters for which the challenges were denied, such as additional requirements regarding disclosure of information or quality of service.
In the case of the market for wholesale dedicated-link leasing, the IFT’s predecessor, Cofetel, published an agreement in the Official Gazette, establishing requirements regarding tariffs, quality of service and information for dedicated-link circuits. Telmex and Telnor have filed petitions for relief against such resolutions, which are still pending. The regulation that could arise from these investigations has been already implemented by the IFT through the special regulatory regime for preponderant agents. However, given the uncertainty of the IFT´s actions, we are not able to identify all possible consequences and as a result an adverse resolution could have an impact on the Company’s future revenues in this market.
Concessions
Under the current legal framework, a carrier of public telecommunications networks, such as Telcel or Telmex, must operate under a concession. The IFT is an autonomous federal agency that grants new or extends existing concessions, which may only be granted to a Mexican citizen or corporation that has agreed to the concession terms and may not be transferred or assigned
without the approval of the IFT. There are two types of concessions:
| • | | NETWORK CONCESSIONS.Telcel, Telmex and its subsidiary Telnor hold network concessions, granted under the previous regulatory framework, to provide specified types of services. Their ability to migrate to the new regime of unified concessions and, consequently, to provide any and all telecommunications and broadcasting services, is subject to conditions,as described under “Migration of Concessions and Additional Services” below. |
| • | | SPECTRUM CONCESSIONS.Telcel holds multiple concessions, granted under both the previous and current regulatory frameworks, to provide wireless services that utilize frequencies of radio-electric spectrum. These concessions have terms of 15 to 20 years and may be extended for an additional term of equal length. |
A public telecommunications concessionaire is required by law to establish an open-network architecture that permits interconnection and interoperability.
Termination of Concessions
Mexican legislation provides that under certain circumstances, some assets of a concessionaire may be acquired by the federal government upon termination of these concessions.
There is no specific guidance or precedent for applying these provisions, so the scope of assets covered, the compensation to the concessionaire and the procedures to be followed would depend on the type of concession, the type of assets and the interpretation of applicable legislation by the competent authorities at the time.
Migration of Concessions and Additional Services
The new legislative framework established the unified concession (concesión única), which allows the holder to provide all types of telecommunications and broadcasting services, and a regime under which an existing concession can be migrated to the new unified concession at the end of its term or upon request by the concession holder. A unified
95
concession has a term of up to 30 years, extendable for up to an equal term. Also, under this new framework a current concession may be modified to add services not previously contemplated therein.
However, as a result of our preponderant economic agent status, Telcel, Telmex and Telnor are subject to additional conditions for the migration to a unified concession or the addition of a service, such as Pay TV, to a current concession, including in certain cases (i) payment of any new concession fee to be determined by the IFT,
(ii) compliance with current requirements under the network concession, the 2013 constitutional amendments, the 2014 legislation and any additional measures imposed by the IFT on the preponderant economic agent and (iii) such other requirements, terms and conditions as the IFT may establish in the concession itself. We expect the process of migration or additional services to be lengthy and complex. Consequently, Telcel, Telmex and Telnor may not be able to provide certain additional services, such as Pay TV and broadcasting, in the near term.
Telcel’s Concessions
Telcel operates under several different network and spectrum concessions covering particular frequencies and regions, holding an average of 175.16 MHz of capacity in
Mexico’s nine regions in the 850 MHz, 1900 MHz,1.7/2.1 GHz and 2.5 GHz bands. The following table summarizes Telcel’s concessions.
| | | | | | | | |
FREQUENCY | | COVERAGE AREA | | INITIAL DATE | | TERMINATION DATE | | FEE STRUCTURE |
| | | | | |
| Band A (1900 MHz) | | Nationwide | | Sep.1999 | | Oct. 2039 | | Annual |
| | | | | |
| Band D (1900MHz) | | Nationwide | | Oct. 1998 | | Oct. 2038 | | Annual |
| | | | | |
| Band B (850 MHz) | | Regions 1, 2, 3 | | Aug. 2011 | | Aug. 2026 | | Annual |
| | | | | |
| Band B (850 MHz) | | Regions 4, 5 | | Aug. 2010 | | Aug. 2025 | | Annual |
| | | | | |
| Band B (850 MHz) | | Regions 6, 7, 8 | | Oct. 2011 | | Oct. 2026 | | Annual |
| | | | | |
| Band B (850 MHz) | | Region 9 | | Oct. 2015 | | Oct. 2030 | | Annual |
| | | | | |
| Band F (1900MHz) | | Nationwide | | Apr. 2005 | | Apr. 2025 | | Annual |
| | | | | |
| Bands A and B (1.7/2.1 GHz) | | Nationwide | | Oct. 2010 | | Oct. 2030 | | Annual |
| | | | | |
| Bands H, I and J (1.7/2.1 GHz) | | Nationwide | | May 2016 | | Oct. 2030 | | Annual |
| | | | | |
| Band 7 (2.5 GHz) | | 75% of the population | | Jul. 2017 | | Jan. 2024 – Nov. 2028 | | Annual |
Concession Fees
All of Telcel’s concessions granted or renewed on or after January 1, 2003 are required to pay annual fees for the use and exploitation of radio spectrum bands. The amounts payable are set forth by the annual Federal Fees Law (Ley Federal de Derechos) and vary depending on the relevant region and radio spectrum band.
Telmex’s Concessions
Telmex’s concession was granted in 1976 and is currently set to expire in 2026. In December 2016, the IFT granted Telmex a30-year extension of this concession, which will become effective in 2026 and will be valid until 2056. The new terms of this concession will be issued in early 2023.
Telmex’s subsidiary, Telnor, holds a separate concession, which covers one state and two municipalities in northwestern Mexico and will expire in 2026. The IFT also granted Telnor a30-year extension of its concession, which will be effective in 2026 and will be valid until 2056. The material terms of Telnor’s concession are similar to those of Telmex’s concession.
In addition, Telmex currently holds concessions for the use of frequencies to provide wireless local access, as well aspoint-to-point andpoint-to-multipoint transmission. Telmex obtained these concessions for a term of up to 20 years that may be extended for additional20-year terms with approval from the IFT. These Telmex concessions, including the 3.5 GHz band, will expire in October 2020 and the extension process is currently under review with the IFT.
96
In 2018, Telmex was notified of a resolution issued by the IFT, through which the IFT imposed a fine of Ps.2.5 billion derived from an alleged breach in 2013 and 2014 of certain minimum quality of service goals for dedicated link services. Telmex has exercised all legal remedies challenging such resolution and a final resolution is pending.
Rates for Wireless Service
Wireless services concessionaires are generally free to establish the prices they charge customers for telecommunications services. Wireless rates are not subject to a price cap or any other form of price regulation. The interconnection rates concessionaires charge other operators are also generally established by agreement between the parties and, if the parties cannot agree, may be imposed by the IFT, subject to certain guidelines, cost models and criteria. The IFT publishes at the end of the year the rates they would impose in the event of a dispute, eliminating all incentives for a negotiation among the parties. The establishment of interconnection rates has resulted, and may in the future result, in disputes between carriers and with the IFT.
As a result of the preponderance determination, Telcel’s retail prices are subject topre-approval by the IFT before they can take effect. In addition, the 2014 legislation established that preponderant economic agents may not charge termination rates. See “— Asymmetric Regulation of the Preponderant Economic Agent” under this Part VI.
The IFT is also authorized to impose specific rate requirements on any carrier that is determined by the IFT to have substantial market power under the Federal Antitrust Law (Ley Federal de Competencia Económica) and the 2014 legislation. For more information on litigation related to the Federal Antitrust Law and the 2014 legislation, see “—Substantial Market Power Investigations” under this Part VI.
Rates for Fixed Service
Telmex’s concessions subject its rates for basic retail telephone services in any period, including installation, monthly rent, measured local-service and long-distance service, to a ceiling on the price of a “basket” of such services, weighted to reflect the volume of each service
provided by Telmex during the preceding period. Telmex is required to file a survey with the IFT every four years with its projections of units of operation for basic services, costs and prices. Telmex is free to determine the structure of its own rates, with the exception of domestic long-distance rates, which were eliminated in 2015 under the 2014 legislation, and of the residential fixed-line rates, which have a cap based on thelong-run average incremental cost. As a result of the preponderance determination, Telmex’s retail prices are subject topre-approval by the IFT before they can take effect.
The price ceiling varies directly with the Mexican National Consumer Price Index (Indice Nacional de Precios al Consumidor), allowing Telmex to raise nominal rates to keep pace with inflation (minus a productivity factor set for the telecommunications industry), subject to consultation with the IFT. Telmex has not raised its nominal rates for many years. Under Telmex’s concession, the price ceiling is also adjusted downward periodically to pass on the benefits of Telmex’s increased productivity to its customers. The IFT sets a periodic adjustment for every four-year period to permit Telmex to maintain an internal rate of return equal to its weighted average cost of capital.
In addition, basic retail telephone services, as well as broadband services and “calling party pays” charges, are subject to a separate price ceiling structure based on productivity indicators. In each case, Telmex is required to submit a survey on productivity indicators to the IFT every two years, including a total factor productivity. The IFT establishes the productivity factor that will apply over the next two years, and, based on this, the IFT will approve the customer prices before they can take effect.
Prices for Telmex’s wholesale services are established by the IFT based on thelong-run average incremental cost model methodology.
BRAZIL
Legal Framework and Principal Regulatory Authorities
The Brazilian Telecommunications Law (Lei Geral das Telecomunicações Brasileiras) provides the framework for telecommunications regulation. The primary telecommunications regulator in Brazil is the
97
Telecommunications Agency (Agência Nacional deTelecomunicações, or “Anatel”), which has the authority to grant concessions and licenses in connection with telecommunications services and the use of orbits, except broadcasting, and to adopt regulations that are legally binding on telecommunications services providers.
As of the date of this annual report, the Brazilian congress is considering legislation to modernize the current concession-based model to an authorization-based model. The telecom reform bill under review would allow fixed-line concessionaires, such as Claro Brasil, to provide services under an authorization instead of a concession, as long as certain investment-related obligations are met. We are currently unable to assess the impact that such legislation would have in our operations.
Licenses
In 2014, we simplified our corporate structure, and our subsidiaries Embratel, Embratel Participações S.A. (“Embrapar”) and Net Serviços were merged into Claro Brasil, with all licenses previously granted to our subsidiaries transferred to Claro Brasil. Following its acquisition of Brasil Telecomunicações S.A. in 2016, Claro Brasil relinquished the cable TV and data services licenses it had been transferred by Embrapar and Net Serviços.
In 2018 subsidiary Star One merged into Claro Brasil. As a result, all Brasilian satellite operation rights previously granted to Star One were transferred under the same terms and conditions to Claro Brasil. The satellite operation rights(AMC-12) covering regions outside of Brazil were relinquished by Star One before the merger.
Our Brazilian subsidiaries hold licenses for the telecommunications services listed below and expect to continue acquiring spectrum if Anatel conducts additional public auctions, although Claro Brazil, like all of its peer competitors, is subject to a cap on the additional spectrum it may acquire per frequency band.
| | | | |
SUBSIDIARY | | LICENSE | | TERMINATION DATE |
Claro Brasil | | Fixed Local Voice Services | | Indefinite |
| | | |
| | | Domestic and International Long-Distance | | 2025 |
| | | |
| | | Voice Services | | Indefinite |
| | | |
| | | Personal Communication Services | | Indefinite |
| | | |
| | | Data Services | | Indefinite |
| | | |
| | | Cable TV Services | | Indefinite |
| | | |
| | | Mobile Maritime Services | | Indefinite |
| | | |
| | | Global Mobile Satellite Services | | Indefinite |
| | | |
Claro TV | | DTH TV Services | | Indefinite |
| | | |
| | | Data Services | | Indefinite |
| | | |
Americel S.A. | | Data Services | | Indefinite |
| | | |
Primesys | | Data Services | | Indefinite |
| | | |
Telmex do Brasil | | Data Services | | Indefinite |
In addition, Claro Brasil has various orbital position authorizations for our satellite operations, which expire between 2020 and 2027, and licenses to provide PCS, which expire between 2020 and 2032.
Concessions
Claro Brasil holds two fixed-line concessions to provide domestic and international long-distance telephone services. The remaining telecommunications services provided by Claro Brasil are governed by a system of licenses instead of concession arrangements.
Concession Fees
Claro Brasil is required to pay a biennial fee equal to 2.0% of net revenues from wireless services, except for the final year of the15-year term of its PCS authorizations, in which the fee equals 1.0% of net revenues from wireless services.
98
Claro Brasil is also required to pay a biennial fee during the term of its domestic and international long-distance concessions equal to 2.0% of the revenues from long- distance telephone services, net of taxes and social contributions, for the year preceding the payment.
Termination of Concessions
Our domestic and international long-distance fixed-line concessions provide that certain of our assets deemed “indispensable” for the provision of these services will revert to the Brazilian state upon termination of these concession. Compensation for those assets would be their depreciated cost. See note 16 to our audited consolidated financial statements included in this annual report.
Regulation of Rates
Anatel regulates rates (tariffs and prices) for all telecommunications services, except for fixed-line broadband services, Pay TV and satellite capacity rates, which are not regulated. In general, PCS license-holders and fixed local voice services license-holders are authorized to increase basic plan rates annually. Domestic long-distance concession-holders may adjust rates annually only for inflation (less a factor determined by Anatel based on the productivity of each operator during the year). Claro Brasil may set international long-distance and mobile rates freely, provided that it gives Anatel and the public advance notice.
Regulation of Wholesale Market Competition
In November 2012, Anatel approved the General Competition Plan (Plano Geral de Metas da Competição, or “PGMC”), a comprehensive regulatory framework aimed at increasing competition in the telecommunications sector. The PGMC imposes asymmetric measures upon economic groups determined by Anatel to have significant market power in any of the five wholesale markets in the telecommunications sector, on the basis of several criteria, including having over 20.0% of market share in the applicable market.
In 2012, Claro Brasil and three of its primary competitors were determined to have significant market power in the mobile wireless termination and national roaming markets. As a result, Claro Brasil was required to reduce mobile termination rates to 75.0% of the 2013 rates by February
2014, and to 50.0% of the 2013 rates by February 2015. In July 2014, Anatel established termination rates for mobile services applicable to operators with significant market power through 2019. Claro Brasil is also required to publish, and Anatel must approve, its reference roaming prices for voice, data and SMS on a semi-annual basis, among other measures.
In addition, Embratel was determined to have significant market power in the market for long-distance leased lines, Claro Brasil and Embratel were determined to have significant market power in the telecommunications infrastructure market, and Net Serviços was determined to have significant market power in the local coaxial transmissions market, together with several of their mobile and fixed-line competitors. Following the merger of Embratel and Net Serviços into Claro Brasil in 2014, Claro Brasil is required to publish, and Anatel must approve, its reference offers in each of these markets. Moreover, wholesale contracts entered into by operators determined to have significant market power for the sale of such operators’ services are overseen for compliance purposes by independent third-party companies.
In 2018, Anatel approved Claro Brasil’s most recent wholesale reference offers with respect to national roaming, telecommunications infrastructure, long- distance leased lines, wireless termination rates, internet network interconnection and internet links, which are reviewed and approved by Anatel on an annual basis.
Anatel also reviews its determination of which operators have significant market power on a quadrennial basis. Anatel began its first review of all telecom operators in 2014 and published the most recent list of operators with significant market power for each of the relevant markets in 2018. In addition to the review, in 2018 Anatel changed some of the asymmetric measures applicable under the PGMC and added two new wholesale markets covering high capacity transport and fixed termination rates. Anatel has determined that Claro Brasil has significant market power in eight wholesale markets.
Network Usage Fees and Fixed-Line Interconnection Rates
In July 2014, Anatel approved a resolution establishing the reference terms for fees charged by operators in connection
99
with the use of their mobile network and leased lines and set a price cap on fees charged for fixed network usage by operators deemed to have significant market power. Such fees, based on costs of allocation services (coubicación), have been applicable since February 2016.
Fixed-line operators determined by Anatel to have significant market power in the local fixed-line market may freely negotiate interconnection rates, subject to a price cap established by Anatel.
Other Obligations
Under applicable law and our concessions, Claro Brasil has an obligation to (i) comply with certain coverage obligations to ensure universal access to its fixed-line voice services, (ii) contribute to the funding of the country’s transition from analogue to digital TV, (iii) meetquality-of-service targets and (iv) comply with applicable telecommunications services consumer rights.
COLOMBIA
Legal Framework and Principal Regulatory Authorities
The Information and Communications Ministry (Ministerio de Tecnologías de la Información y las Comunicaciones, or “ICT Ministry”) and the Communications Regulatory Commission (Comisión de Regulación de Comunicaciones, or “CRC”) are responsible for overseeing and regulating the telecommunications sector. The main audiovisual regulatory authority in Colombia with respect to Pay TV services is the National Television Authority (Autoridad Nacional de Televisión, or “ANTV”). Claro is also subject to supervision by other government entities responsible for enforcing other regulations, such as antitrust rules or those protecting consumer rights.
Concessions
Comunicación Celular S.A. (“Comcel”) is qualified to provide fixed and mobile services and was included in the registry of networks and services administered by the ICT Ministry. Such general authorization superseded all of Comcel’s former concession contracts, and, consequently, such former concessions were terminated.
As a result of the termination of Comcel’s former concessions, the ICT Ministry and Comcel began
discussions with respect to the liquidation of the agreements governing those concessions. In light of the decision of the Colombian Constitutional Court (Corte Constitucional de Colombia) holding that certain laws limiting the reversion of assets of telecommunications providers did not apply to concessions granted prior to 1998 and, consequently, that reversion of assets under those earlier concessions would be governed by their contractual terms, the ICT Ministry obtained a domestic award ordering Comcel to revert assets under its earlier concessions to the Colombian government. Comcel challenged such award and the Company filed an international arbitration claim against Colombia arising from Colombia’s measures. For further information on these proceedings, see note 16 to our audited consolidated financial statements included in this annual report.
Licenses and Permits
Comcel holds licenses to provide mobile services in the spectrum frequency bands shown in the table below.
| | | | |
FREQUENCY | | BANDWIDTH | | TERMINATION
DATE |
850 MHz | | 25 MHz | | Mar. 2024 |
1900 MHz | | 10 MHz | | Dec. 2019 |
| | | 5 MHz | | Sept. 2021 |
| | | 15 MHz | | Apr. 2024 |
| | | 5 MHz | | June 2019(1) |
2.5 GHz | | 30 MHz | | Aug. 2023 |
(1) Refers to a temporary license, which we renew on an annual basis. |
In 2013, Telmex Colombia S.A. obtained permission to provide Pay TV services under any available technology, pursuant to ANTV’s unified licensing system. The permission will expire in 2020 and may be renewed at the appropriate time for another10-year term.
In 2017, the ICT Ministry issued a decree approving a higher cap on spectrum acquisitions by operators in low and high frequency bands. This new cap allows Comcel to participate in future spectrum auctions. The ICT Ministry has released its plan to conduct spectrum auctions in the 700 MHz and 1900 MHz bands. Further specifications on the auctions will be published by the ICT Ministry during the third quarter of 2019, while the final resolution containing the auctions’ terms and conditions will be published by the fourth quarter of 2019.
100
Asymmetric Charges
In 2012, the CRC issued resolutions seeking to correct an alleged market failure and imposing the following measures on Comcel: (i) asymmetric charges for mobile and incoming long-distance call terminations by other operators on Comcel’s wireless network, with access rates lower than the rates we pay our competitors, and (ii) restrictions on the rates we charge our users for calls outside our network(off-net calls), which must not exceed the rates we charge for calls within our network(on-net calls). These asymmetric access charges ended in December 2016.
In January 2017, the Colombian government approved symmetrical access charges among established operators like Comcel, Movistar and Tigo. However, under current regulation, new market entrants continue to receive a higher rate than operators for a limited period.
In 2017, the CRC issued a resolution updating the list of relevant telecommunication markets by adding the mobile services market (including bundled mobile voice and data services) and by also including the mobile service market in the list of relevant markets subject toex-ante regulation. In connection with the mobile services market, the CRC initiated a proceeding to evaluate Comcel’s substantial market power in this new market and, if applicable, the imposition of asymmetric regulatory measures that could affect Comcel. As of the date of this annual report, a resolution is pending.
SOUTHERN CONE
ARGENTINA
Following the election of President Mauricio Macri in 2015, the Argentine government issued a Decree of Necessity and Urgency (Decreto de Necesidad y Urgencia, or “DNU”) to create a new communications ministry and regulator to oversee the telecommunications and media sectors. The National Communications Agency (Ente Nacional de Comunicaciones, or “Enacom”) is now the main telecommunications regulatory authority in Argentina and became operational in 2016.
As part of the measures passed under the DNU, fixed and mobile services providers are prohibited from providing DTH technology, which is currently the fastest way to provide Pay TV services. In 2017, the Argentine government issued a
decree allowing telecommunications providers, including AMX Argentina S.A. (“AMX Argentina”), to provide Pay TV services via cable within a limited number of territories as of January 2018 and to the rest of the country as of January 2019. AMX Argentina has obtained the permissions necessary to provide Pay TV services via cable in accordance with the decree to the territories approved by Enacom.
AMX Argentina holds licenses in the 700 MHz, 900 MHz, 1700/2100 MHz (AWS), 1900 MHz and 2600 MHz frequency bands, some of which expire in 15 years and some of which have no expiration date. Each license also contains certain coverage parameters, reporting and service requirements and provides Enacom a revocation right upon a material breach of the license terms.
All telecommunications providers in Argentina must contribute approximately 1.0% of their monthly revenues to finance the provision of telecommunications services in underserved areas and to underserved persons. All providers must also meet certainquality-of-service requirements.
CHILE
The General Telecommunications Law (Ley General de Telecomunicaciones) establishes the legal framework for telecommunications services in Chile, including the regulation of concessions, permits, rates and interconnection. The main regulatory agency of the telecommunications sector is the Chilean Transportation and Communications Ministry (Ministerio de Transportes y Telecomunicaciones), which acts primarily through the Undersecretary of Telecommunications (Subsecretaría de Telecomunicaciones, “SUBTEL”).
Claro Chile S.A. (“Claro Chile”) holds concessions to provide mobile and fixed-line services in the 700MHz, 850 MHz, 1900 MHz, 2.6 GHz, 3.4 GHz and 5.8 GHz frequency bands. Except for the concession to provide services in the 850 MHz frequency, which has an indefinite termination date, the concessions to provide services in the 700 MHz, 1900 MHz, 2.6 GHz, 3.4 GHz and 5.8 GHz frequencies have termination dates that vary from 2027 to 2045. Claro Chile also holds license to provide DTH technology services until 2024 and a license with an indefinite term to provide Pay TV services. In 2018, the Chilean Supreme Court (Corte
101
Suprema de Justicia) issued a ruling requiring Claro to return 20 MHz of spectrum acquired through a band auction because Claro exceeded the limit of spectrum any given operator is permitted to hold. The return of such spectrum, including if and how such return should be implemented, is currently under discussion before the Competition Court (Tribunal de Defensa de laLibre Competencia, or the “TDLC”). In addition, pursuant to the ruling, and in order to increase the maximum limit, SUBTEL initiated a review of such limit of spectrum through a regulatory proceeding initiated before the TDLC which is in progress.
In 2018, SUBTEL issued a ruling to freeze Claro Chile´s use of 50 MHz in the 3.5 MHz band for the provision of wireless fixed services. Claro Chile has challenged such ruling. SUBTEL subsequently issued a new ruling unfreezing 30 MHz, allowing Claro Chile to provide wireless fixed services. Claro Chile has withdrawn its challenge, while the other 20 MHz remains temporarity frozen.
Some of Claro Chile’s concessions impose additional requirements, such as coverage, reporting and service quality requirements. The Chilean Transportation and Communications Ministry is authorized to terminate any concession in the event of specified breaches under the terms of such concessions. Additionally, Claro Chile’s concession in the 700 MHz band imposes certain obligations to expand mobile and data services in rural areas. In 2017, the Undersecretary of Telecommunication approved Claro Chile’s expansion project in connection with its obligations under its concession in the 700 MHz band.
PARAGUAY
The National Telecommunications Commission of Paraguay (Comisión Nacional de Telecomunicaciones de Paraguay) is in charge of supervising the telecommunications industry in Paraguay. It is authorized to cancel licenses in the event of specified breaches of the terms of a license.
AMX Paraguay, S.A. (“AMX Paraguay”) holds licenses to operate in the 1900 MHz and the 1700/2100 MHz bands. AMX Paraguay also holds a nationwide internet access and data transmission license. In addition, AMX Paraguay holds licenses to provide DTH services and cable TV services.
Additionally, in January 2018, AMX Paraguay participated in a spectrum auction and was awarded a license to provide telecommunications services in the 700 MHz band. In November 2018, the Telecommunications Commission of Paraguay granted the renewal of spectrum license in the 1900 MHz band. These licenses are renewable, subject to regulatory approval, and contain coverage, reporting and service requirements.
URUGUAY
The Regulatory Unit of Communications Services(Unidad Reguladora de Servicios de Comunicaciones) is in charge of the regulation of the telecommunications industry in Uruguay.
AM Wireless Uruguay, S.A. holds licenses to operate in the 1900 MHz, 1700/2100 MHz and 700 MHz frequency bands that expire in 2024, 2033 and 2037, respectively, and Telstar, S.A. holds licenses to provide international long-distance communications and mobile data services that have no expiration date
The license initially granted to Flimay S.A. (“Flimay”) to provide DTH technology services in Uruguay has been contested by the government since 2012. In 2017, the executive branch of Uruguay held under a new ruling that Flimay does not have a valid license to provide DTH services in the country. Flimay requested this ruling be voided, but in February 2018, the executive branch of Uruguay, with support from the Administrative Court (TCA), requested the process be closed. As of the date of this annual report, a decision on Flimay’s appeal is pending.
ANDEAN REGION
ECUADOR
The primary regulatory authorities for our mobile and fixed-line operations are the National Telecommunications, Regulation and Control Agency (Agencia de Regulación y Control de las Telecomunicaciones, or “Arcotel”) and the Telecommunications and Information Society Ministry(Ministerio de Telecomunicaciones y Sociedad de la Información, or “Mintel”). Arcotel is responsible for the licensing and oversight of radio-electric spectrum use and telecommunications services provisions. Mintel is responsible for the promotion of equal access to telecommunications services.
102
The Telecommunications Law (Ley Orgánica de Telecomunicaciones), adopted in 2015, serves as the legal framework for telecommunications services. It established new regulations for operators with significant market power, new penalties based on their gross incomes as well as additional fees also based on an operator’s gross income, but that can vary depending on the size of their market share. Consorcio Ecuatoriano de Telecomunicaciones, S.A. (“Conecel”) has been deemed to have significant market power in the advanced wireless services market, and as a result, such fee payments are made on a quarterly basis on the dates established by Arcotel.
For fiscal year 2018, Conecel has an obligation to pay the Ecuadorian government 3.0% of its wireless services for 2018, which represents approximately Ps.1.0 billion (U.S.$29.9 million). As of the date of this annual report, Conecel has paid the Ecuadorian government Ps.0.8 billion (U.S.$22.4 million), which represents 3.0% of such revenues generated in the first three quarters of 2018. Conecel has made a provision for Ps.0.3 billion (U.S.$7.5 million), which corresponds to the approximate amount owed for the fourth quarter of 2018 and will be paid in due course. An arbitration proceeding to partially void the payment by Conecel of such fees was conducted and a decision in favor of the government was reached. Conecel has appeal this decision and, as of the date of this annual report, a decision on Conecel’s appeal is pending.
Conecel holds concessions to operate in the 850MHz, 1900 MHz and AWS bands, which include concessions for PCS that expire in 2023. The PCS concession containsquality-of- service requirements for successful call completions, SMS delivery times, customer service, geographic coverage and other service conditions.
Conecel also holds licenses to provide internet value- added services, Pay TV Services (through DTH technology) and bearer services, expiring in 2021, 2023 and 2032, respectively.
Conecel, following the acquisition of Ecuador Telecom, S.A. in 2016, also holds a concession to offer fixed-line voice, public telephone and domestic and international long- distance wholesale services, as well as a license to provide Pay TV (through HFC technology) that expires in 2031.
Recalculation of Concession Fees
Arcotel initiated several proceedings to recalculate the variable portion of the concession fees payable under Conecel’s concessions, which, as of the date of this annual report, is equivalent to 2.93% of Conecel’s annual subscriber base revenues, in addition to its contribution for Universal Service (Servicio Universal 1%). These recalculation proceedings with Arcotel remain ongoing.
In 2018, Conecel paid Arcotel U.S.$11.9 million based on its annual revenues for the 2015 period and is required to pay U.S.$13 million based on its annual revenues for the 2016 period. However, Conecel obtained a judicial order that suspended the collection process for the 2016 period.
For its Universal Service contribution, Conecel is required to pay U.S.$5 million for the 2015 period and U.S.$6 million for the 2016 period. However, Conocel obtained a judicial order that suspended the collection process for the 2015 and 2016 periods.
PERU
The Supervisory Agency for Private Investment in Telecommunication (Organismo Supervisor de la Inversión Privada en Telecomunicaciones, or “OSIPTEL”) is in charge of the regulation of the telecommunications industry in Peru. The Ministry of Transport and Communications (Ministerio de Transportes y Comunicaciones or “MTC”) grants concessions, permits and licenses. The Telecommunications Law (Decreto Supremo N°013-93-TCC Ley de Telecomunicaciones), adopted in 1993, serves as the legal framework for telecommunications services.
América Móvil Perú, S.A.C. (“Claro Perú”) holds nationwide concessions to provide wireless, PCS, fixed-line, local wholesale, domestic and international long-distance, Pay TV services (through DTH and HFC technologies), public telephone and value-added services (including internet access). The concessions allow Claro Perú to operate on the 450 MHz, 700 MHz, 850 MHz, 1900 MHz, 3.5 GHz and 10.5 GHz bands. As part of Claro Perú’s acquisition of Olo del Perú S.A.C., TVS Wireless S.A.C. and their respective subsidiaries in 2016, Claro has a resale agreement with such companies to operate in certain regions on the 2.5 GHz band.
103
Each of the concessions was awarded by the MTC and covers a20-year period. The concessions contain coverage, reporting, service requirement and spectral efficiency goals. The MTC is authorized to cancel any of the concessions in the case of specified breaches of its terms.
The MTC has drafted a spectrum refarming proposal on the 2.5 Ghz band considering a new band distribution that grants 80 Mhz nationwide to Olo del Peru S.A.C. and TVS Wireless S.A.C. Currently, the spectrum refarming process is subject to comments from the public. A final decision on the proposal will be issue in July 2019.
EUROPE AND OTHER JURISDICTIONS
European Legal Framework and Principal Regulatory Authorities
The telecommunications regulatory framework in the EU is based on five Directives (“Framework”, “Access and Interconnection”, “Authorization”, “Universal Service and Users’ Rights” and “Privacy and Data Protection”) that apply to all EU member countries and regulate all forms of fixed and wireless services, internet, broadcasting and transmission services. Austria, Bulgaria, Croatia and Slovenia are EU member countries. Macedonia and Serbia, candidates for accession to the EU, are expected to gradually harmonize their regulatory frameworks with the EU’s framework.
In each European country in which we operate, we are also subject to a domestic telecommunications regulatory framework and to oversight by one or more local regulators.
Licenses
| | | | | | | | | | |
COUNTRY | | FREQUENCY | | TERMINATION DATE |
| | | |
AUSTRIA | | | | 800 MHz | | | | | Dec. 2029 | |
| | | |
| | | | 900 MHz | | | | | Dec. 2034 | |
| | | |
| | | | 1800 MHz | | | | | Dec. 2034 | |
| | | |
| | | | 2100 MHz | | | | | Dec. 2020 | |
| | | |
| | | | 2600 MHz | | | | | Dec. 2026 | |
| | | |
BULGARIA | | | | 900 MHz | | | | | June 2024 | |
| | | |
| | | | 1800 MHz | | | | | June 2024 | |
| | | |
| | | | 2100 MHz | | | | | Apr. 2025 | |
| | | |
CROATIA | | | | 800 MHz | | | | | Oct. 2024 | |
| | | |
| | | | 900 MHz | | | | | Oct. 2024 | |
| | | |
| | | | 1800 MHz | | | | | Oct. 2024 | |
| | | |
| | | | 2100 MHz | | | | | Oct. 2024 | |
| | | |
BELARUS | | | | 900 MHz | | | | | Dec. 2020 | |
| | | |
| | | | 1800 MHz | | | | | Dec. 2020 | |
| | | |
| | | | 2100 MHz | | | | | Dec. 2020 | |
| | | |
SLOVENIA | | | | 800 MHz | | | | | May 2029 | |
| | | |
| | | | 900 MHz | | | | | Jan. 2031 | |
| | | |
| | | | 1800 MHz | | | | | Jan. 2031 | |
| | | |
| | | | 2600 MHz | | | | | May 2029 | |
| | | |
| | | | 2100 MHz | | | | | Sept. 2021 | |
| | | |
SERBIA | | | | 800 MHz | | | | | Jan. 2026 | |
| | | |
| | | | 900 MHz | | | | | Nov. 2026 | |
| | | |
| | | | 1800 MHz | | | | | Nov. 2026 | |
| | | |
| | | | 2100 MHz | | | | | Nov. 2026 | |
| | | |
MACEDONIA | | | | 800 MHz | | | | | Dec. 2033 | |
| | | |
| | | | 1800 MHz | | | | | Dec. 2033 | |
| | | |
| | | | 900 MHz | | | | | Sept. 2023 | |
| | | |
| | | | 2100 MHz | | | | | Feb. 2028 | |
104
OTHER JURISDICTIONS
| | | | |
COUNTRY | | PRINCIPAL REGULATORY AUTHORITIES | | CONCESSION AND LICENSES |
| | | |
COSTA RICA | | Superintendency of Telecommunications (Superintendencia de Telecomunicaciones) Ministry of Science, Technology and Telecommunications (Ministerio de Ciencia, Tecnología y Telecomunicaciones) | | • Concessions in the AWS and 1800 MHz bands that expire in 2032 • Concessions in the 2100 MHz band that expire in 2026 • License to operate Pay TV services using DTH technology that will expire in 2027 |
| | | |
EL SALVADOR | | Electricity and Telecommunications Superintendency (Superintendencia General de Electricidad y Telecomunicaciones) | | • Concession of 50 MHz in the 1900 MHz band of which 30 MHz that expire in 2038, 10 MHz that expire in 2041 and 10 MHz that expire in 2028 • Concession to provide public telephone service that expires in 2027 • Licenses to provide Pay TV Services through HFC and DTH technologies have an indefinite term |
| | | |
GUATEMALA | | Guatemalan Telecommunications Agency (Superintendencia de Telecomunicaciones) | | • Licenses to use 12 MHz in the 900 MHz band and 40 MHz in the 1900 MHz band that all expire in 2033 • Concession of 50 MHz in the 3.5 GHz band that will expire in 2033 |
| | | |
NICARAGUA | | Nicaraguan Telecommunications and Mailing Institute (Instituto Nicaragüense de Telecomunicaciones y Correos) | | • Concessions in the 700 MHz, 850 MHz, 1900 MHz and 1700/2100 MHz bands that all expire in 2032 • Concession of 50 MHz in the 3.5 GHz band that will expire in 2042 • Licenses to provide DTH technology that will expire in January 2028(re- newal granted in 2018) and Pay TV services that has an indefinite term |
| | | |
HONDURAS | | Honduran National Telecommunications Commission (Comisión Nacional de Telecomunicaciones) | | • Concessions to use 80 MHz in the 1900 MHz PCS band and 40 MHz in theLTE-4G 1700/2100 MHz band that all expire in 2033 • Licenses to operate Pay TV services through (i) HFC technology that will expire in 2027 and (ii) DTH technology that will expire in 2020 |
| | | |
PANAMA | | National Authority of Public Services (Autoridad Nacional de los Servicios Públicos) | | • License to use 40 MHz in the 1900 MHz and 20 MHz in the 700 MHz bands that all expire in 2028 • Licenses to provide fixed local and long-distance services that expire in 2030 |
105
| | | | |
COUNTRY | | PRINCIPAL REGULATORY AUTHORITIES | | CONCESSION AND LICENSES |
| | | | | • License to provide Internet service that expires in 2033 • Licenses to provide international long-distance, value-added services, interactive television, and Pay TV service through DTH and IPTV tech- nologies, which expire in 2028, 2030, 2037 and 2034, respectively |
| | | |
UNITED STATES | | The FCC | | • International Section 214 Authorization (Claro Enterprise Solutions). |
| | | |
DOMINICAN REPUBLIC | | Dominican Institute of Telecommunications (Instituto Dominicano de las Telecomunicaciones) | | • Concessions to use 25 MHz in the 800 MHz band, 30 MHz in the 1900 MHz band, 80 MHz in the 2.5/2.7 GHz band, 30 MHz in the 3.5 GHz band and 40 MHz in the 1.7/2.1 GHz (AWS) band that expire in 2030 • Licenses to provide Pay TV Services through DTH and IPTV technologies that expire in 2030 |
| | | |
PUERTO RICO | | FCC and the Telecommunications Regulatory Board of Puerto Rico | | • Concessions to use the 700 MHz, 1900 MHz and the 30 GHz bands that expire in 2021, 2027 and 2019, respectively • Concessions to use the 800 MHz that expire in March 2018 (for which an application for renewal has been submitted), 2020, 2021 and 2026 • Concessions to use the 1.7/2.1 GHz bands that expire in 2026 and 2028 • Long-term transfer lease concessions to use 35.6 MHz of the 2.5 GHz EBS band that expire in 2020, 2022, 2023, 2025 and 2026 • Franchise to operate Pay TV Services using IPTV technology that expires in 2030 |
106
PAGE INTENTIONALLY BLANK


PART VII ADDITIONAL INFORMATION
Many of our employees are members of labor unions with which we conduct collective negotiations on wages, benefits and working conditions. We believe that we have good current relations with our workforce.
The following table sets forth the total number of employees and a breakdown of employees by main category of activity and geographic location, as of the end of each year in the three-year period ended December 31, 2018.
| | | | | | | | | | | | |
| | | DECEMBER 31, | |
| | | 2016 | | | 2017 | | | 2018 | |
NUMBER OF EMPLOYEES | | | 194,431 | | | | 191,851 | | | | 189,448 | |
CATEGORY OF ACTIVITY: | | | | | | | | | | | | |
Wireless | | | 78,887 | | | | 78,910 | | | | 77,845 | |
Fixed | | | 97,104 | | | | 94,496 | | | | 92,429 | |
Other businesses | | | 18,440 | | | | 18,445 | | | | 19,174 | |
GEOGRAPHIC LOCATION: | | | | | | | | | | | | |
Mexico | | | 90,306 | | | | 88,417 | | | | 88,613 | |
South America | | | 65,817 | | | | 64,619 | | | | 62,500 | |
Central America | | | 9,767 | | | | 9,694 | | | | 9,586 | |
United States | | | 848 | | | | 852 | | | | 848 | |
Caribbean | | | 9,488 | | | | 9,311 | | | | 9,195 | |
Europe | | | 18,205 | | | | 18,958 | | | | 18,706 | |
In each of the countries in which we operate, we are party to various legal proceedings in the ordinary course of business. These proceedings include tax, labor, antitrust, contractual matters and administrative and judicial proceedings concerning regulatory matters such as interconnection and tariffs. We are party to a number of proceedings regarding our compliance with administrative rules and regulations and concession standards.
Our material legal proceedings are described in note 16 to our audited consolidated financial statements included in this annual report and in “Regulation” under Part VI of this annual report.
110
|
PRINCIPAL ACCOUNTANT FEES AND SERVICES |
AUDIT ANDNON-AUDIT FEES
The following table sets forth the fees billed to us and our subsidiaries by our independent registered public accounting firm, Mancera, during the fiscal years ended December 31, 2017 and 2018:
| | | | | | | | |
| | | YEAR ENDED DECEMBER 31, | |
| | | 2017 | | | 2018 | |
| | | (in millions of Mexican pesos) | |
| | | |
Audit fees(1) | | | Ps. 245 | | | | Ps. 248 | |
| | | |
Audit-related fees(2) | | | 31 | | | | 23 | |
| | | |
Tax fees(3) | | | 34 | | | | 30 | |
| | | |
Total fees | | | Ps. 310 | | | | Ps 301 | |
|
|
(1) Audit fees represent the aggregate fees billed by Mancera and its Ernst & Young Global affiliated firms in connection with the audit of our annual financial statements and statutory and regulatory audits. (2) Audit-related fees represent the aggregate fees billed by Mancera and its Ernst & Young Global affiliated firms for the review of reports on our operations submitted to IFT and attestation services that are not required by statute or regulation. (3) Tax fees represent fees billed by Mancera and its Ernst & Young Global affiliated firms for tax compliance services, tax planning services and tax advice services. |
AUDIT AND CORPORATE PRACTICES COMMITTEE APPROVAL POLICIES AND PROCEDURES
Our audit and corporate practices committee has established policies and procedures for the engagement of our independent auditors for services.
Our audit and corporate practices committee expressly approves any engagement of our independent auditors for audit ornon-audit services provided to us or our subsidiaries. Prior to providing any service that requires specificpre-approval, our independent auditor and our Chief Financial Officer present to the audit committee a request for approval of services in which they confirm that the request complies with the applicable rules.
111
We file reports, including annual reports on Form20-F, and other information with the SEC pursuant to the rules and regulations of the SEC that apply to foreign private issuers.
Any filings we make electronically will be available to the public over the internet at the SEC’s web site at www.sec.gov and at our website at www.americamovil.com. This URL is intended to be an inactive textual reference only. It is not intended to be an active hyperlink to our website. The information on our website, which might be accessible through a hyperlink resulting from this URL, is not incorporated into this annual report.
The following documents have been filed with the SEC as exhibits to this annual report:
Omitted from the exhibits filed with this annual report are certain instruments and agreements with respect to long-term debt of América Móvil, none of which authorizes securities in a total amount that exceeds 10% of the total assets of América Móvil. We hereby agree to furnish to the SEC copies of any such omitted instruments or agreements as the Commission requests.
112
|
FORWARD-LOOKING STATEMENTS |
Some of the information contained or incorporated by reference in this annual report constitutes “forward-looking statements” within the meaning of the safe harbor provisions of the Private Securities Litigation Reform Act of 1995. Although we have based these forward-looking statements on our expectations and projections about future events, it is possible that actual events may differ materially from our expectations. In many cases, we include, together with the forward-looking statements themselves, a discussion of factors that may cause actual events to differ from our forward-looking statements.
Examples of forward-looking statements include the following:
| • | | projections of our commercial, operating or financial performance, our financing, our capital structure or our other financial items or ratios; |
| • | | statements of our plans, objectives or goals, including those relating to acquisitions, competition and rates; |
| • | | statements concerning regulation |
| • | | or regulatory developments; |
| • | | statements about our future economic performance or that of Mexico or other countries in which we operate; |
| • | | competitive developments in the telecommunications sector; |
| • | | other factors and trends affecting the telecommunications industry generally and our financial condition in particular; and |
| • | | statements of assumptions underlying the foregoing statements. |
We use words such as “believe,” “anticipate,” “plan,” “expect,” “intend,” “target,” “estimate,” “project,” “predict,” “forecast,” “guideline,” “should” and other similar expressions to identify forward-looking statements, but they are not the only way we identify such statements.
Forward-looking statements involve inherent risks and uncertainties. We caution you that a number of important factors could cause actual results to differ materially from the plans, objectives, expectations, estimates and intentions expressed in such forward-looking statements. These factors, some of which are discussed under “Risk Factors,” include economic and political conditions and government policies in Mexico, Brazil, Colombia, Europe and elsewhere, inflation rates, exchange rates, regulatory developments, technological improvements, customer demand and competition. We caution you that the foregoing list of factors is not exclusive and that other risks and uncertainties may cause actual results to differ materially from those in forward-looking statements. You should evaluate any statements made by us in light of these important factors.
Forward-looking statements speak only as of the date they are made. We undertake no obligation to publicly update or revise any forward-looking statements, whether as a result of new information or future events or for any other reason.
113
|
FORM20-F CROSS REFERENCE GUIDE |
| | | | | | |
ITEM | | FORM20-F CAPTION | | LOCATION IN THIS REPORT | | PAGE |
| | | | |
| 1 | | IDENTITY OF DIRECTORS, SENIOR MANAGEMENT AND ADVISERS | | Not applicable | | — |
| | | | |
| 2 | | OFFER STATISTICS AND EXPECTED TIMETABLE | | Not applicable | | — |
| | | | |
| 3 | | KEY INFORMATION | | | | |
| | | | |
| | | 3A Selected financial data | | Selected financial data | | 2 |
| | | | |
| | | 3B Capitalization and indebtedness | | Not applicable | | — |
| | | | |
| | | 3C Reasons for the offer and use of proceeds | | Not applicable | | — |
| | | | |
| | | 3D Risk factors | | Risk factors | | 47 |
| | | | |
| 4 | | INFORMATION ON THE COMPANY | | | | |
| | | | |
| | | 4A History and development of the Company | | Information on the Company | | 5 |
| | | Note 10—Property, Plant and Equipment, Net | | F-42 |
| | | Liquidity and capital resources | | 37 |
| | | Additional Information | | 112 |
| | | | |
| | | 4B Business overview | | Information on the Company | | 5 |
| | Regulation | | 91 |
| | | | |
| | | 4C Organizational structure | | Exhibit 8.1 | | — |
| | | | |
| | | 4D Property, plant and equipment | | Information on the Company | | 5 |
| | Note 10—Property Plant and Equipment, Net | | F-42 |
| | Liquidity and capital resources | | 37 |
| | Regulation | | 91 |
| | | | |
| 4A | | Unresolved staff comments | | None | | — |
| | | | |
| 5 | | OPERATING AND FINANCIAL REVIEW AND PROSPECTS | | | | |
| | | | |
| | | 5A Operating results | | Overview | | 20 |
| | | Results of operations | | 22 |
| | | Regulation | | 91 |
| | | Liquidity and capital resources | | 37 |
| | | | |
| | | 5B Liquidity and capital resources | | Note 14—Debt | | F-53 |
| | | | |
| | | 5C Research and development, patents and licenses, etc. | | Not applicable | | — |
| | | | |
| | | 5D Trend information | | Overview | | 20 |
| | | | |
| | | | | Results of operations | | 22 |
| | | | |
| | | 5EOff-balance sheet arrangements | | Off-balance sheet arrangement | | 37 |
| | | | |
| | | 5F Tabular disclosure of contractual obligations | | Contractual obligations | | 38 |
| | | | |
| 6 | | DIRECTORS, SENIOR MANAGEMENT AND EMPLOYEES | | | | |
| | | | |
| | | 6A Directors and senior management | | Management | | 74 |
| | | | |
| | | 6B Compensation | | Management | | 83 |
| | | | |
| | | 6C Board practices | | Management | | 74 |
| | | Management | | 83 |
| | | | |
| | | 6D Employees | | Employees | | 110 |
114
| | | | | | | | |
ITEM | | FORM20-F CAPTION | | LOCATION IN THIS REPORT | | PAGE | |
| | | | |
| | | 6E Share ownership | | Major shareholders | | | 60 | |
| | | Management | | | 83 | |
| | | | |
| 7 | | MAJOR SHAREHOLDERS AND RELATED PARTY TRANSACTIONS | | | | | | |
| | | | |
| | | 7A Major shareholders | | Major shareholders | | | 60 | |
| | | | |
| | | 7B Related party transactions | | Related party transactions | | | 61 | |
| | | | |
| | | 7C Interests of experts and counsel | | Not applicable | | | — | |
| | | | |
| 8 | | FINANCIAL INFORMATION | | | | | | |
| | | | |
| | | 8A Consolidated statements and other financial information | | Consolidated Financial Statements | | | 119 | |
| | | Dividends | | | 62 | |
| | | Note 16—Commitments and Contingencies | | | F-60 | |
| | | | |
| | | 8B Significant changes | | Not applicable | | | — | |
| | | | |
| 9 | | THE OFFER AND LISTING | | | | | | |
| | 9A Offer and listing details | | Trading markets | | | 62 | |
| | 9B Plan of distribution | | Not applicable | | | — | |
| | 9C Markets | | Trading markets | | | 62 | |
| | 9D Selling shareholders | | Not applicable | | | — | |
| | 9E Dilution | | Not applicable | | | — | |
| | 9F Expenses of the issue | | Not applicable | | | — | |
| | | | |
| 10 | | ADDITIONAL INFORMATION | | | | | | |
| | 10A Shareholders’ equity | | Bylaws | | | 63 | |
| | 10B Memorandum and articles of association | | Bylaws | | | 63 | |
| | 10C Material contracts | | Information on the Company | | | 5 | |
| | | | Results of operations | | | 22 | |
| | | | Related party transactions | | | 61 | |
| | | | Regulation | | | 91 | |
| | | | |
| | | 10D Exchange controls | | Additional information | | | 112 | |
| | | | |
| | | 10E Taxation | | Taxation of shares and ADSs | | | 68 | |
| | | | |
| | | 10F Dividends and paying agents | | Not applicable | | | — | |
| | | | |
| | | 10G Statement by experts | | Not applicable | | | — | |
| | | | |
| | | 10H Documents on display | | Additional information | | | 112 | |
| | | | |
| | | 10I Subsidiary information | | Not applicable | | | — | |
| | | | |
| 11 | | QUANTITATIVE AND QUALITATIVE DISCLOSURES ABOUT MARKET RISK | | Risk management | | | 42 | |
| | | | Note 2 a)—Basis of Preparation of the Consolidated Financial Statements and Summary of Significant Accounting Policies and Practices | | | F-7 | |
115
|
FORM 20-F CROSS REFERENCE GUIDE |
| | | | | | |
ITEM | | FORM20-F CAPTION | | LOCATION IN THIS REPORT | | PAGE |
| | | | |
| 12 | | DESCRIPTION OF SECURITIES OTHER THAN EQUITY SECURITIES | | | | |
| | 12A Debt securities | | Not applicable | | — |
| | | | |
| | | 12B Warrants and rights | | Not applicable | | — |
| | | | |
| | | 12C Other securities | | Not applicable | | — |
| | | | |
| | | 12D American Depositary Shares | | Depositary shares | | 66 |
| | | | |
| 13 | | DEFAULTS, DIVIDEND ARREARAGES AND DELINQUENCIES | | Not applicable | | — |
| | | | |
| 14 | | MATERIAL MODIFICATIONS TO THE RIGHTS OF SECURITY | | | | |
| | | | |
| | | HOLDERS AND USE OF PROCEEDS | | Not applicable | | — |
| | | | |
| 15 | | CONTROLS AND PROCEDURES | | Controls and procedures | | 87 |
| | | | |
| 16A | | AUDIT COMMITTEE FINANCIAL EXPERT | | Management | | 74 |
| | | | |
| 16B | | CODE OF ETHICS | | Code of ethics | | 89 |
| | | | |
| 16C | | PRINCIPAL ACCOUNTANT FEES AND SERVICES | | Principal accountant fees and services | | 111 |
| | | | |
| 16D | | EXEMPTIONS FROM THE LISTING STANDARDS FOR AUDIT COMMITTEES | | Not applicable | | — |
| | | | |
| 16E | | PURCHASES OF EQUITY SECURITIES BY THE ISSUER AND AFFIIATED PURCHASERS | | Purchases of equity securities by the issuer and affiliated purchasers | | 67 |
| | | | |
| 16F | | CHANGE IN REGISTRANT’S CERTIFYING ACCOUNTANT | | Not applicable | | — |
| | | | |
| 16G | | CORPORATE GOVERNANCE | | Corporate governance | | 73 |
| | | | |
| 16H | | MINE SAFETY DISCLOSURE | | Not applicable | | — |
| | | | |
| 17 | | FINANCIAL STATEMENTS | | Not applicable | | — |
| | | | |
| 18 | | FINANCIAL STATEMENTS | | Consolidated Financial statements | | 119 |
| | | | |
| 19 | | EXHIBITS | | Additional Information | | 112 |
116
The registrant hereby certifies that it meets all of the requirements for filing on Form20-F and that it has duly caused and authorized the undersigned to sign this annual report on its behalf.
Dated: April 11, 2019
AMÉRICA MÓVIL, S.A.B. DE C.V.
| | |
| By: | | /s/ Carlos José García Moreno Elizondo |
| Name: | | Carlos José García Moreno Elizondo |
| Title: | | Chief Financial Officer |
| | |
| By: | | /s/ Alejandro Cantú Jiménez |
| Name: | | Alejandro Cantú Jiménez |
| Title: | | General Counsel |
117


PART VIII CONSOLIDATED FINANCIAL STATEMENTS
AMÉRICA MÓVIL, S.A.B. DE C.V. AND SUBSIDIARIES
Consolidated Financial Statements
Years Ended December 31, 2016, 2017 and 2018
with Report of Independent Registered Public Accounting Firm
AMÉRICA MÓVIL, S.A.B. DE C.V. AND SUBSIDIARIES
Consolidated Financial Statements
Years Ended December 31, 2016, 2017, and 2018
Contents:
F-1
REPORT OF INDEPENDENT REGISTERED PUBLIC ACCOUNTING FIRM
The Board of Directors and Shareholders of
América Móvil, S.A.B. de C.V.
Opinion on the Financial Statements
We have audited the accompanying consolidated statements of financial position of América Móvil, S.A.B. de C.V. and subsidiaries (the Company) as of December 31, 2018 and 2017, the related consolidated statements of comprehensive income, changes in shareholders’ equity and cash flows for each of three years in the period ended December 31, 2018, and the related notes (collectively referred to as the “financial statements”). In our opinion, the consolidated financial statements present fairly, in all material respects, the consolidated financial position of the Company as of December 31, 2018 and 2017, and the consolidated results of its operations and its cash flows for each of the three years in the period ended December 31, 2018, in conformity with International Financial Reporting Standards, as issued by the International Accounting Standards Board.
We also have audited, in accordance with the standards of the Public Company Accounting Oversight Board (United States) (PCAOB), the Company´s internal control over financial reporting as of December 31, 2018, based on criteria established in Internal Control-Integrated Framework issued by the Committee of Sponsoring Organizations of the Treadway Commission (2013 Framework) and our report dated April 11, 2019 expressed an unqualified opinion thereon.
Basis for Opinion
These financial statements are the responsibility of the Company´s management. Our responsibility is to express an opinion on the Company´s financial statements based on our audits. We are a public accounting firm registered with the PCAOB and are required to be independent with respect to the Company in accordance with the U.S. federal securities laws and the applicable rules and regulations of the Securities and Exchange Commission and the PCAOB.
We conducted our audits in accordance with the standards of the PCAOB. Those standards require that we plan and perform the audit to obtain reasonable assurance about whether the financial statements are free of material misstatement, whether due to error or fraud. Our audits included performing procedures to assess the risks of material misstatement of the financial statements, whether due to error or fraud, and performing procedures that respond to those risks. Such procedures included examining, on a test basis, evidence regarding the amounts and disclosures in the financial statements. Our audits also included evaluating the accounting principles used and significant estimates made by management, as well as evaluating the overall presentation of the financial statements. We believe that our audits provide a reasonable basis for our opinion.
/s/ MANCERA, S.C.
We have served as the Company´s auditor since 1993.
Mexico City, Mexico
April 11, 2019
F-2
AMÉRICA MÓVIL, S.A.B. DE C.V. AND SUBSIDIARIES
Consolidated Statements of Financial Position
(In thousands of Mexican pesos)
| | | | | | | | | | | | | | | | |
| | | Note | | | At December 31, | |
| | 2017 | | | 2018 | | | 2018
Millions of
U.S. dollars | |
Assets | | | | | | | | | | | | | | | | |
Current assets: | | | | | | | | | | | | | | | | |
Cash and cash equivalents | | | 3 | | | Ps. | 24,270,473 | | | Ps. | 21,659,962 | | | US$ | 1,100 | |
Equity investments at fair value through OCI and other short-term investments | | | 4 | | | | 59,120,676 | | | | 49,015,934 | | | | 2,490 | |
Accounts receivable: | | | | | | | | | | | | | | | | |
Subscribers, distributors, recoverable taxes, contract assets and other, net | | | 5 | | | | 193,776,144 | | | | 216,226,920 | | | | 10,986 | |
Related parties | | | 6 | | | | 868,230 | | | | 1,263,605 | | | | 64 | |
Derivative financial instruments | | | 7 | | | | 8,037,384 | | | | 5,287,548 | | | | 269 | |
Inventories, net | | | 8 | | | | 38,809,565 | | | | 40,305,362 | | | | 2,048 | |
Other current assets, net | | | 9 | | | | 17,352,746 | | | | 15,296,193 | | | | 777 | |
| | | | | | | | | | | | | | | | |
Total current assets | | | | | | Ps. | 342,235,218 | | | Ps. | 349,055,524 | | | US$ | 17,734 | |
Non-current assets: | | | | | | | | | | | | | | | | |
Property, plant and equipment, net | | | 10 | | | Ps. | 676,343,198 | | | Ps. | 640,000,720 | | | US$ | 32,516 | |
Intangibles, net | | | 11 | | | | 143,539,626 | | | | 122,137,703 | | | | 6,205 | |
Goodwill | | | 11 | | | | 151,463,232 | | | | 145,566,497 | | | | 7,396 | |
Investments in associated companies | | | | | | | 3,735,172 | | | | 3,132,707 | | | | 159 | |
Deferred income taxes | | | 13 | | | | 116,571,349 | | | | 111,186,768 | | | | 5,649 | |
Accounts receivable, subscriber, distributors and contract assets, net | | | 5 | | | | 9,786,581 | | | | 15,681,872 | | | | 797 | |
Other assets, net | | | 9 | | | | 42,537,476 | | | | 42,461,601 | | | | 2,157 | |
| | | | | | | | | | | | | | | | |
Total assets | | | | | | Ps. | 1,486,211,852 | | | Ps. | 1,429,223,392 | | | US$ | 72,613 | |
| | | | | | | | | | | | | | | | |
Liabilities and equity | | | | | | | | | | | | | | | | |
Current liabilities: | | | | | | | | | | | | | | | | |
Short-term debt and current portion of long-term debt | | | 14 | | | Ps. | 51,745,841 | | | Ps. | 96,230,634 | | | US$ | 4,889 | |
Accounts payable | | | 15a | | | | 212,673,407 | | | | 221,957,267 | | | | 11,277 | |
Accrued liabilities | | | 15b | | | | 67,752,758 | | | | 56,433,691 | | | | 2,867 | |
Income tax | | | | | | | 9,362,009 | | | | 19,232,191 | | | | 977 | |
Other taxes payable | | | | | | | 24,387,484 | | | | 23,979,334 | | | | 1,218 | |
Derivative financial instruments | | | 7 | | | | 10,602,539 | | | | 13,539,716 | | | | 688 | |
Related parties | | | 6 | | | | 2,540,412 | | | | 2,974,213 | | | | 151 | |
Deferred revenues | | | | | | | 34,272,047 | | | | 32,743,843 | | | | 1,664 | |
| | | | | | | | | | | | | | | | |
Total current liabilities | | | | | | Ps. | 413,336,497 | | | Ps. | 467,090,889 | | | US$ | 23,731 | |
Non-current-liabilities: | | | | | | | | | | | | | | | | |
Long-term debt | | | 14 | | | Ps. | 646,139,058 | | | Ps. | 542,691,819 | | | US$ | 27,572 | |
Deferred income taxes | | | 13 | | | | 11,997,364 | | | | 24,573,441 | | | | 1,248 | |
Income tax | | | | | | | 8,622,500 | | | | 7,891,042 | | | | 401 | |
Deferred revenues | | | | | | | 3,183,727 | | | | 3,239,301 | | | | 165 | |
Derivative financial instruments | | | 7 | | | | 3,756,921 | | | | 3,567,863 | | | | 181 | |
Asset retirement obligations | | | 15c | | | | 18,245,129 | | | | 15,971,601 | | | | 811 | |
Employee benefits | | | 17 | | | | 120,297,139 | | | | 118,325,014 | | | | 6,012 | |
| | | | | | | | | | | | | | | | |
Totalnon-current liabilities | | | | | | Ps. | 812,241,838 | | | Ps. | 716,260,081 | | | US$ | 36,390 | |
| | | | | | | | | | | | | | | | |
Total liabilities | | | | | | Ps. | 1,225,578,335 | | | Ps. | 1,183,350,970 | | | US$ | 60,121 | |
| | | | | | | | | | | | | | | | |
Equity: | | | | | | | | | | | | | | | | |
Capital stock | | | 19 | | | Ps. | 96,338,508 | | | Ps. | 96,338,378 | | | US$ | 4,895 | |
Retained earnings: | | | | | | | | | | | | | | | | |
Prior years | | | | | | | 141,761,677 | | | | 184,689,288 | | | | 9,383 | |
Profit for the year | | | | | | | 29,325,921 | | | | 52,566,197 | | | | 2,670 | |
| | | | | | | | | | | | | | | | |
Total retained earnings | | | | | | | 171,087,598 | | | | 237,255,485 | | | | 12,053 | |
Other comprehensive loss items | | | | | | | (73,261,794 | ) | | | (137,598,218 | ) | | | (6,990 | ) |
| | | | | | | | | | | | | | | | |
Equity attributable to equity holders of the parent | | | | | | | 194,164,312 | | | | 195,995,645 | | | | 9,958 | |
Non-controlling interests | | | | | | | 66,469,205 | | | | 49,876,777 | | | | 2,534 | |
| | | | | | | | | | | | | | | | |
Total equity | | | | | | | 260,633,517 | | | | 245,872,422 | | | | 12,492 | |
| | | | | | | | | | | | | | | | |
Total liabilities and equity | | | | | | Ps. | 1,486,211,852 | | | Ps. | 1,429,223,392 | | | US$ | 72,613 | |
| | | | | | | | | | | | | | | | |
The accompanying notes are an integral part of these consolidated financial statements.
F-3
AMÉRICA MÓVIL, S.A.B. DE C.V. AND SUBSIDIARIES
Consolidated Statements of Comprehensive Income
(In thousands of Mexican pesos, except for earnings per share)
| | | | | | | | | | | | | | | | | | |
| | | Note | | For the year ended December 31 | |
| | 2016 | | | 2017 | | | 2018 | | | 2018
Millions of U.S.
dollars, except
for earnings
per share | |
Operating revenues: | | | | | | | | | | | | | | | | | | |
Revenues services | | | | Ps. | 831,885,365 | | | Ps. | 878,411,323 | | | Ps. | 863,647,642 | | | US$ | 43,878 | |
Sales of equipment | | | | | 143,527,123 | | | | 143,222,212 | | | | 174,560,039 | | | | 8,869 | |
| | | | | | | | | | | | | | | | | | |
| | | | Ps. | 975,412,488 | | | Ps. | 1,021,633,535 | | | Ps. | 1,038,207,681 | | | US$ | 52,747 | |
| | | | | | | | | | | | | | | | | | |
Operating costs and expenses: | | | | | | | | | | | | | | | | | | |
Cost of sales and services | | | | | 485,060,579 | | | | 496,335,746 | | | | 508,822,430 | | | | 25,851 | |
Commercial, administrative and general expenses | | | | | 228,101,116 | | | | 240,634,431 | | | | 227,192,478 | | | | 11,543 | |
Other expenses | | | | | 4,114,562 | | | | 24,345,113 | | | | 6,923,022 | | | | 352 | |
Depreciation and amortization | | 9,10 and 11 | | | 148,525,921 | | | | 160,174,942 | | | | 155,712,580 | | | | 7,911 | |
| | | | | | | | | | | | | | | | | | |
| | | | Ps. | 865,802,178 | | | Ps. | 921,490,232 | | | Ps. | 898,650,510 | | | US$ | 45,657 | |
| | | | | | | | | | | | | | | | | | |
Operating income | | | | Ps. | 109,610,310 | | | Ps. | 100,143,303 | | | Ps. | 139,557,171 | | | US$ | 7,090 | |
| | | | | | | | | | | | | | | | | | |
Interest income | | | | | 4,192,595 | | | | 2,925,648 | | | | 10,646,169 | | | | 541 | |
Interest expense | | | | | (33,862,012 | ) | | | (30,300,781 | ) | | | (31,771,433 | ) | | | (1,614 | ) |
Foreign currency exchange loss, net | | | | | (40,427,407 | ) | | | (13,818,951 | ) | | | (7,261,956 | ) | | | (369 | ) |
Valuation of derivatives, interest cost from labor obligations and other financial items, net | | 21 | | | (16,225,841 | ) | | | (1,943,760 | ) | | | (10,176,316 | ) | | | (517 | ) |
Equity interest in net result of associated companies | | | | | 189,950 | | | | 91,385 | | | | 267 | | | | — | |
| | | | | | | | | | | | | | | | | | |
Profit before income tax | | | | | 23,477,595 | | | | 57,096,844 | | | | 100,993,902 | | | | 5,131 | |
Income tax | | 13 | | | 11,398,856 | | | | 24,941,511 | | | | 46,477,079 | | | | 2,361 | |
| | | | | | | | | | | | | | | | | | |
Net profit for the year | | | | Ps. | 12,078,739 | | | Ps. | 32,155,333 | | | Ps. | 54,516,823 | | | US$ | 2,770 | |
| | | | | | | | | | | | | | | | | | |
Net profit for the year attributable to: | | | | | | | | | | | | | | | | | | |
Equity holders of the parent | | | | Ps. | 8,649,427 | | | Ps. | 29,325,921 | | | Ps. | 52,566,197 | | | US$ | 2,670 | |
Non-controlling interests | | | | | 3,429,312 | | | | 2,829,412 | | | | 1,950,626 | | | | 100 | |
| | | | | | | | | | | | | | | | | | |
| | | | Ps. | 12,078,739 | | | Ps. | 32,155,333 | | | Ps. | 54,516,823 | | | US$ | 2,770 | |
| | | | | | | | | | | | | | | | | | |
Basic and diluted earnings per share attributable to equity holders of the parent | | | | Ps. | 0.13 | | | Ps. | 0.44 | | | Ps. | 0.79 | | | US$ | 0.04 | |
| | | | | | | | | | | | | | | | | | |
Other comprehensive income (loss) items: | | | | | | | | | | | | | | | | | | |
Net other comprehensive (loss) income that may be reclassified to profit or loss in subsequent years: | | | | | | | | | | | | | | | | | | |
Effect of translation of foreign entities | | | | Ps. | 107,498,708 | | | Ps. | (18,309,877 | ) | | Ps. | (64,314,032 | ) | | US$ | (3,268 | ) |
Effect of fair value of derivatives, net of deferred taxes | | | | | 49,129 | | | | 12,292 | | | | — | | | | — | |
Items that will not be reclassified to (loss) or profit in subsequent years: | | | | | | | | | | | | | | | | | | |
Re-measurement of defined benefit plan, net of deferred taxes | | | | | 14,773,399 | | | | (7,046,089 | ) | | | 757,278 | | | | 38 | |
Unrealized (loss) gain on equity investments at fair value, net of deferred taxes | | | | | (6,673,731 | ) | | | 622,424 | | | | (3,765,688 | ) | | | (191 | ) |
| | | | | | | | | | | | | | | | | | |
Total other comprehensive income (loss) items for the year, net of deferred taxes | | 20 | | | 115,647,505 | | | | (24,721,250 | ) | | | (67,322,442 | ) | | | (3,421 | ) |
| | | | | | | | | | | | | | | | | | |
Total comprehensive income (loss) for the year | | | | Ps. | 127,726,244 | | | Ps. | 7,434,083 | | | Ps. | (12,805,619 | ) | | US$ | (651 | ) |
| | | | | | | | | | | | | | | | | | |
Comprehensive income (loss) for the year attributable to: | | | | | | | | | | | | | | | | | | |
Equity holders of the parent | | | | Ps. | 120,974,842 | | | Ps. | 1,201,698 | | | Ps. | (11,770,227 | ) | | US$ | (598 | ) |
Non-controlling interests | | | | | 6,751,402 | | | | 6,232,385 | | | | (1,035,392 | ) | | | (53 | ) |
| | | | | | | | | | | | | | | | | | |
| | | | Ps. | 127,726,244 | | | Ps. | 7,434,083 | | | Ps. | (12,805,619 | ) | | US$ | (651 | ) |
| | | | | | | | | | | | | | | | | | |
The accompanying notes are an integral part of these consolidated financial statements.
F-4
AMÉRICA MÓVIL, S.A.B. DE C.V. AND SUBSIDIARIES
Consolidated Statements of Changes in Shareholders’ Equity
For the year ended December 31, 2016, 2017 and 2018
(In thousands of Mexican pesos)
| | | | | | | | | | | | | | | | | | | | | | | | | | | | | | | | | | | | | | | | |
| | | Capital
stock | | | Legal
reserve | | | Retained
earnings | | | Effect of
derivative
financial
instruments
acquired
for hedging
purposes | | | Unrealized
gain (loss) on
equity
investment at
fair value | | | Re-measurement
of defined
benefit plans | | | Cumulative
translation
adjustment | | | Total equity
attributable to
equity holders
of the parent | | | Non-
controlling
interests | | | Total
equity | |
Balance at December 31, 2015 | | Ps. | 96,338,477 | | | Ps. | 358,440 | | | Ps. | 171,972,999 | | | Ps. | (60,788) | | | Ps. | 4,011 | | | Ps. | (82,844,947) | | | Ps. | (73,490,197) | | | Ps. | 112,277,995 | | | Ps. | 48,576,191 | | | Ps. | 160,854,186 | |
Net profit for the year | | | — | | | | — | | | | 8,649,427 | | | | — | | | | — | | | | — | | | | — | | | | 8,649,427 | | | | 3,429,312 | | | | 12,078,739 | |
Effect of fair value of derivatives, net of deferred taxes | | | — | | | | — | | | | — | | | | 48,496 | | | | — | | | | — | | | | — | | | | 48,496 | | | | 633 | | | | 49,129 | |
Unrealized loss on equity investments at fair value, net of deferred taxes | | | — | | | | — | | | | — | | | | — | | | | (6,673,731 | ) | | | — | | | | — | | | | (6,673,731 | ) | | | — | | | | (6,673,731 | ) |
Remeasurement of defined benefit plan, net of deferred taxes | | | — | | | | — | | | | — | | | | — | | | | — | | | | 14,771,770 | | | | — | | | | 14,771,770 | | | | 1,629 | | | | 14,773,399 | |
Effect of translation of foreign entities | | | — | | | | — | | | | — | | | | — | | | | — | | | | — | | | | 104,178,880 | | | | 104,178,880 | | | | 3,319,828 | | | | 107,498,708 | |
| | | | | | | | | | | | | | | | | | | | | | | | | | | | | | | | | | | | | | | | |
Comprehensive income (loss) for the year | | | — | | | | — | | | | 8,649,427 | | | | 48,496 | | | | (6,673,731 | ) | | | 14,771,770 | | | | 104,178,880 | | | | 120,974,842 | | | | 6,751,402 | | | | 127,726,244 | |
Dividends declared | | | — | | | | — | | | | (18,339,294) | | | | — | | | | — | | | | — | | | | — | | | | (18,339,294 | ) | | | (652,341 | ) | | | (18,991,635 | ) |
Stock dividend (Note 19) | | | 1,512 | | | | — | | | | 4,606,274 | | | | — | | | | — | | | | — | | | | — | | | | 4,607,786 | | | | — | | | | 4,607,786 | |
Repurchase of shares | | | (2,475 | ) | | | — | | | | (7,213,397 | ) | | | — | | | | — | | | | — | | | | — | | | | (7,215,872 | ) | | | — | | | | (7,215,872 | ) |
Partial sale of shares of Telekom Austria (Note 12) | | | — | | | | — | | | | — | | | | — | | | | — | | | | 68,127 | | | | (1,139,192 | ) | | | (1,071,065 | ) | | | 7,394,401 | | | | 6,323,336 | |
Other acquisitions ofnon-controlling interests (Note 12) | | | — | | | | — | | | | (2,319,149 | ) | | | — | | | | — | | | | — | | | | — | | | | (2,319,149 | ) | | | 38,871 | | | | (2,280,278 | ) |
| | | | | | | | | | | | | | | | | | | | | | | | | | | | | | | | | | | | | | | | |
Balance at December 31, 2016 | | | 96,337,514 | | | | 358,440 | | | | 157,356,860 | | | | (12,292 | ) | | | (6,669,720) | | | | (68,005,050 | ) | | | 29,549,491 | | | | 208,915,243 | | | | 62,108,524 | | | | 271,023,767 | |
Net profit for the year | | | — | | | | — | | | | 29,325,921 | | | | — | | | | — | | | | — | | | | — | | | | 29,325,921 | | | | 2,829,412 | | | | 32,155,333 | |
Effect of fair value of derivatives, net of deferred taxes | | | — | | | | — | | | | — | | | | 12,292 | | | | — | | | | — | | | | — | | | | 12,292 | | | | — | | | | 12,292 | |
Unrealized gain on equity investments at fair value, net of deferred taxes | | | — | | | | — | | | | — | | | | — | | | | 622,424 | | | | — | | | | — | | | | 622,424 | | | | — | | | | 622,424 | |
Remeasurement of defined benefit plan, net of deferred taxes | | | — | | | | — | | | | — | | | | — | | | | — | | | | (7,075,606 | ) | | | — | | | | (7,075,606 | ) | | | 29,517 | | | | (7,046,089 | ) |
Effect of translation of foreign entities | | | — | | | | — | | | | — | | | | — | | | | — | | | | — | | | | (21,683,333 | ) | | | (21,683,333 | ) | | | 3,373,456 | | | | (18,309,877 | ) |
| | | | | | | | | | | | | | | | | | | | | | | | | | | | | | | | | | | | | | | | |
Comprehensive income (loss) for the year | | | — | | | | — | | | | 29,325,921 | | | | 12,292 | | | | 622,424 | | | | (7,075,606 | ) | | | (21,683,333 | ) | | | 1,201,698 | | | | 6,232,385 | | | | 7,434,083 | |
Dividends declared | | | — | | | | — | | | | (19,815,470 | ) | | | — | | | | — | | | | — | | | | — | | | | (19,815,470 | ) | | | (1,848,108 | ) | | | (21,663,578 | ) |
Stock dividend (Note 19) | | | 1,264 | | | | — | | | | 4,902,818 | | | | — | | | | — | | | | — | | | | — | | | | 4,904,082 | | | | — | | | | 4,904,082 | |
Repurchase of shares | | | (270 | ) | | | — | | | | (1,040,686 | ) | | | — | | | | — | | | | — | | | | — | | | | (1,040,956 | ) | | | — | | | | (1,040,956 | ) |
Other acquisitions ofnon-controlling interests (Note 12) | | | — | | | | — | | | | (285 | ) | | | — | | | | — | | | | — | | | | — | | | | (285 | ) | | | (23,596 | ) | | | (23,881 | ) |
| | | | | | | | | | | | | | | | | | | | | | | | | | | | | | | | | | | | | | | | |
As of January 1 2018 | | | 96,338,508 | | | | 358,440 | | | | 170,729,158 | | | | — | | | | (6,047,296 | ) | | | (75,080,656 | ) | | | 7,866,158 | | | | 194,164,312 | | | | 66,469,205 | | | | 260,633,517 | |
Effect of adoption of new accounting standards (Note 2i) | | | — | | | | — | | | | 19,598,349 | | | | — | | | | — | | | | — | | | | — | | | | 19,598,349 | | | | 518,440 | | | | 20,116,789 | |
| | | | | | | | | | | | | | | | | | | | | | | | | | | | | | | | | | | | | | | | |
As of January 1 2018 (restated) | | | 96,338,508 | | | | 358,440 | | | | 190,327,507 | | | | — | | | | (6,047,296 | ) | | | (75,080,656 | ) | | | 7,866,158 | | | | 213,762,661 | | | | 66,987,645 | | | | 280,750,306 | |
| | | | | | | | | | | | | | | | | | | | | | | | | | | | | | | | | | | | | | | | |
Net profit for the year | | | — | | | | — | | | | 52,566,197 | | | | — | | | | — | | | | — | | | | — | | | | 52,566,197 | | | | 1,950,626 | | | | 54,516,823 | |
Unrealized loss on equity investments at fair value, net of deferred taxes | | | — | | | | — | | | | — | | | | — | | | | (3,765,688 | ) | | | — | | | | — | | | | (3,765,688 | ) | | | — | | | | (3,765,688 | ) |
Remeasurement of defined benefit plan, net of deferred taxes | | | — | | | | — | | | | — | | | | — | | | | — | | | | 652,722 | | | | — | | | | 652,722 | | | | 104,556 | | | | 757,278 | |
Effect of translation of foreign entities | | | — | | | | — | | | | — | | | | — | | | | — | | | | — | | | | (61,223,458 | ) | | | (61,223,458 | ) | | | (3,090,574 | ) | | | (64,314,032 | ) |
| | | | | | | | | | | | | | | | | | | | | | | | | | | | | | | | | | | | | | | | |
Comprehensive income (loss) for the year | | | — | | | | — | | | | 52,566,197 | | | | | | | | (3,765,688 | ) | | | 652,722 | | | | (61,223,458 | ) | | | (11,770,227 | ) | | | (1,035,392 | ) | | | (12,805,619 | ) |
Dividends declared | | | — | | | | — | | | | (21,134,520 | ) | | | — | | | | — | | | | — | | | | — | | | | (21,134,520 | ) | | | (1,850,462 | ) | | | (22,984,982 | ) |
Hyperinflation adjustment (Note 2i) | | | — | | | | — | | | | 15,826,934 | | | | — | | | | — | | | | — | | | | — | | | | 15,826,934 | | | | — | | | | 15,826,934 | |
Repurchase of shares | | | (130 | ) | | | — | | | | (518,633 | ) | | | — | | | | — | | | | — | | | | — | | | | (518,763 | ) | | | — | | | | (518,763 | ) |
Redemption of hybrid bond (Note 19) | | | — | | | | — | | | | — | | | | — | | | | — | | | | — | | | | — | | | | — | | | | (13,440,120 | ) | | | (13,440,120 | ) |
Other acquisitions ofnon-controlling interests | | | — | | | | — | | | | (170,440 | ) | | | — | | | | — | | | | — | | | | — | | | | (170,440 | ) | | | (784,894 | ) | | | (955,334 | ) |
| | | | | | | | | | | | | | | | | | | | | | | | | | | | | | | | | | | | | | | | |
Balance at December 31, 2018 | | Ps. | 96,338,378 | | | Ps. | 358,440 | | | Ps. | 236,897,045 | | | Ps. | — | | | Ps. | (9,812,984 | ) | | Ps. | (74,427,934 | ) | | Ps. | (53,357,300 | ) | | Ps. | 195,995,645 | | | Ps. | 49,876,777 | | | Ps. | 245,872,422 | |
| | | | | | | | | | | | | | | | | | | | | | | | | | | | | | | | | | | | | | | | |
The accompanying notes are an integral part of these consolidated financial statements.
F-5
AMÉRICA MÓVIL, S.A.B. DE C.V. AND SUBSIDIARIES
Consolidated Statements of Cash Flows
(In thousands of Mexican pesos)
| | | | | | | | | | | | | | | | | | | | |
| | | | | | For the year ended December 31 | |
| | | Note | | | 2016 | | | 2017 | | | 2018 | | | 2018
Millions of
U.S. dollars | |
Operating activities | | | | | | | | | | | | | | | | | | | | |
Profit before income tax | | | | | | Ps. | 23,477,595 | | | Ps. | 57,096,844 | | | Ps. | 100,993,902 | | | US$ | 5,131 | |
Items not requiring the use of cash: | | | | | | | | | | | | | | | | | | | | |
Depreciation | | | 10 | | | | 127,662,344 | | | | 135,206,080 | | | | 129,115,727 | | | | 6,560 | |
Amortization of intangible and other assets | | | 9 and 11 | | | | 20,863,577 | | | | 24,968,862 | | | | 26,596,853 | | | | 1,351 | |
Equity interest in net income of associated companies | | | | | | | (189,950 | ) | | | (91,385 | ) | | | (267 | ) | | | — | |
Loss on sale of property, plant and equipment | | | | | | | 8,059 | | | | 145,225 | | | | 664,777 | | | | 34 | |
Net period cost of labor obligations | | | 17 | | | | 14,240,271 | | | | 13,636,182 | | | | 13,989,100 | | | | 711 | |
Foreign currency exchange loss, net | | | | | | | 34,049,726 | | | | 11,699,985 | | | | 6,148,612 | | | | 312 | |
Interest income | | | | | | | (4,192,595 | ) | | | (2,925,648 | ) | | | (10,646,169 | ) | | | (541 | ) |
Interest expense | | | | | | | 33,862,012 | | | | 30,300,781 | | | | 31,771,433 | | | | 1,614 | |
Employee profit sharing | | | | | | | 2,235,267 | | | | 1,751,312 | | | | 1,500,342 | | | | 76 | |
Loss (gain) in valuation of derivative financial instruments, capitalized interest expense and other, net | | | | | | | 85,216 | | | | (19,010,851 | ) | | | (7,518,445 | ) | | | (382 | ) |
Gain on net monetary positions | | | 21 | | | | — | | | | — | | | | (4,429,145 | ) | | | (225 | ) |
Working capital changes: | | | | | | | | | | | | | | | | | | | | |
Subscribers, distributors, recoverable taxes, contract assets and other, net | | | | | | | (14,192,651 | ) | | | 1,799,095 | | | | (15,420,291 | ) | | | (783 | ) |
Prepaid expenses | | | | | | | 792,979 | | | | 4,588,584 | | | | 3,264,685 | | | | 166 | |
Related parties | | | | | | | 829,632 | | | | (558,651 | ) | | | 38,426 | | | | 2 | |
Inventories | | | | | | | 3,076,159 | | | | (2,991,009 | ) | | | (3,232,136 | ) | | | (164 | ) |
Other assets | | | | | | | (2,944,581 | ) | | | (4,763,394 | ) | | | (6,081,740 | ) | | | (309 | ) |
Employee benefits | | | | | | | (5,384,944 | ) | | | (14,692,218 | ) | | | (14,235,549 | ) | | | (723 | ) |
Accounts payable and accrued liabilities | | | | | | | 18,196,349 | | | | 5,190,137 | | | | 23,997,632 | | | | 1,219 | |
Employee profit sharing paid | | | | | | | (3,297,439 | ) | | | (1,471,946 | ) | | | (1,013,799 | ) | | | (52 | ) |
Financial instruments and other | | | | | | | 28,878,632 | | | | 1,515,668 | | | | 5,286,290 | | | | 269 | |
Deferred revenues | | | | | | | (972,376 | ) | | | (452,913 | ) | | | 38,243 | | | | 2 | |
Interest received | | | | | | | 3,239,845 | | | | 819,940 | | | | 1,215,800 | | | | 62 | |
Income taxes paid | | | | | | | (44,525,073 | ) | | | (23,988,305 | ) | | | (33,713,753 | ) | | | (1,713 | ) |
| | | | | | | | | | | | | | | | | | | | |
Net cash flows provided by operating activities | | | | | | Ps. | 235,798,054 | | | Ps. | 217,772,375 | | | Ps. | 248,330,528 | | | US$ | 12,617 | |
| | | | | | | | | | | | | | | | | | | | |
Investing activities | | | | | | | | | | | | | | | | | | | | |
Purchase of property, plant and equipment | | | | | | | (138,707,157 | ) | | | (119,185,137 | ) | | | (143,888,033 | ) | | | (7,310 | ) |
Acquisition of intangibles | | | | | | | (16,316,738 | ) | | | (17,538,541 | ) | | | (7,933,647 | ) | | | (403 | ) |
Dividends received | | | 21 | | | | 5,740,092 | | | | 2,385,559 | | | | 2,622,237 | | | | 133 | |
Proceeds from sale of plant, property and equipment | | | | | | | 115,600 | | | | 133,349 | | | | 178,532 | | | | 9 | |
Acquisition of businesses, net of cash acquired | | | | | | | (1,823,813 | ) | | | (6,878,793 | ) | | | (310,604 | ) | | | (16 | ) |
Partial sale of shares of associated company | | | | | | | — | | | | 340,040 | | | | 548,484 | | | | 28 | |
Investments in associate companies | | | | | | | (3,487 | ) | | | — | | | | — | | | | — | |
| | | | | | | | | | | | | | | | | | | | |
Net cash flows used in investing activities | | | | | | Ps. | (150,995,503 | ) | | Ps. | (140,743,523 | ) | | Ps. | (148,783,031 | ) | | US$ | (7,559 | ) |
| | | | | | | | | | | | | | | | | | | | |
Financing activities | | | | | | | | | | | | | | | | | | | | |
Loans obtained | | | | | | | 64,281,631 | | | | 143,607,726 | | | | 155,263,221 | | | | 7,888 | |
Repayment of loans | | | | | | | (125,672,444 | ) | | | (171,041,215 | ) | | | (189,314,144 | ) | | | (9,618 | ) |
Interest paid | | | | | | | (32,125,872 | ) | | | (31,196,441 | ) | | | (30,869,017 | ) | | | (1,568 | ) |
Repurchase of shares | | | | | | | (7,021,247 | ) | | | (1,233,371 | ) | | | (511,421 | ) | | | (26 | ) |
Dividends paid | | | | | | | (13,809,957 | ) | | | (16,091,390 | ) | | | (22,369,793 | ) | | | (1,137 | ) |
Derivative financial instruments | | | | | | | (351,213 | ) | | | (71,474 | ) | | | — | | | | — | |
Partial sale of shares in subsidiary | | | | | | | 6,323,336 | | | | — | | | | — | | | | — | |
Redemption of hybrid bond | | | | | | | — | | | | — | | | | (13,440,120 | ) | | | (683 | ) |
Acquisition ofnon-controlling interests | | | | | | | (2,280,278 | ) | | | (11,930 | ) | | | (115,821 | ) | | | (6 | ) |
| | | | | | | | | | | | | | | | | | | | |
Net cash flows used in financing activities | | | | | | Ps. | (110,656,044 | ) | | Ps. | (76,038,095 | ) | | Ps. | (101,357,095 | ) | | US$ | (5,150 | ) |
| | | | | | | | | | | | | | | | | | | | |
Net (decrease) increase in cash and cash equivalents | | | | | | Ps. | (25,853,493 | ) | | Ps. | 990,757 | | | Ps. | (1,809,598 | ) | | US $ | (92 | ) |
| | | | | | | | | | | | | | | | | | | | |
Adjustment to cash flows due to exchange rate fluctuations, net | | | | | | | 3,911,844 | | | | 61,333 | | | | (800,913 | ) | | | (41 | ) |
Cash and cash equivalents at beginning of the year | | | | | | | 45,160,032 | | | | 23,218,383 | | | | 24,270,473 | | | | 1,233 | |
| | | | | | | | | | | | | | | | | | | | |
Cash and cash equivalents at end of the year | | | | | | Ps. | 23,218,383 | | | Ps. | 24,270,473 | | | Ps. | 21,659,962 | | | US$ | 1,100 | |
| | | | | | | | | | | | | | | | | | | | |
Non-cash transactions related to: | | | | | | | | | | | | | | | | | | | | |
Acquisitions of property, plant and equipment in accounts payable at end year | | | | | | Ps. | 13,497,804 | | | Ps. | 18,869,210 | | | Ps. | 19,099,066 | | | US$ | 970 | |
Redemption of exchangeable bond | | | | | | | — | | | | — | | | | 16,446,262 | | | | 836 | |
| | | | | | | | | | | | | | | | | | | | |
Non-cash transactions | | | | | | Ps. | 13,497,804 | | | Ps. | 18,869,210 | | | Ps. | 35,545,328 | | | US$ | 1,806 | |
| | | | | | | | | | | | | | | | | | | | |
The accompanying notes are an integral part of these consolidated financial statements.
F-6
AMÉRICA MÓVIL, S.A.B. DE C.V. AND SUBSIDIARIES
Notes to Consolidated Financial Statements
Years ended December 31, 2016, 2017 and 2018
(In thousands of Mexican pesos [Ps.] and thousands of
U.S. dollars [US$], unless otherwise indicated)
1. Description of the Business and Relevant Events
I. Corporate Information
América Móvil, S.A.B. de C.V. and subsidiaries (hereinafter, the “Company”, “América Móvil” or “AMX”) was incorporated under laws of Mexico on September 25, 2000. The Company provides telecommunications services in 25 countries throughout Latin America, the United States, the Caribbean and Europe. These telecommunications services include mobile and fixed-line voice services, wireless and fixed data services, internet access and Pay TV, over the top and other related services. The Company also sells equipment, accessories and computers.
| • | | Voice services provided by the Company, both wireless and fixed, mainly include the following: airtime, local, domestic and international long-distance services, and network interconnection services. |
| • | | Data services include value added, corporate networks, data and Internet services. |
| • | | Pay TV represents basic services, as well as pay per view and additional programming and advertising services. |
| • | | AMX provides other related services to advertising in telephone directories, publishing and call center services. |
| • | | The Company also provides video, audio and other media content that is delivered through the internet directly from the content provider to the end user. |
In order to provide these services, América Móvil has licenses, permits and concessions (collectively referred to herein as “licenses”) to build, install, operate and exploit public and/or private telecommunications networks and provide miscellaneous telecommunications services (mostly mobile and fixed voice and data services) and to operate frequency bands in the radio-electric spectrum forpoint-to-point andpoint-to-multipoint microwave links. The Company holds licenses in the 24 countries where it has networks, and such licenses have different dates of expiration through 2056.
Certain licenses require the payment to the respective governments of a share in sales determined as a percentage of revenues from services under concession. The percentage is set as either a fixed rate or in some cases based on certain size of the infrastructure in operation.
The corporate offices of América Móvil are located in Mexico City, Mexico, at Lago Zurich 245, Colonia Ampliación Granada, Delegación Miguel Hidalgo, 11529, Mexico City, Mexico.
The accompanying consolidated financial statements were approved for their issuance by the Company’s Chief Financial Officer on April 9, 2019, and subsequent events have been considered through that date.
2. Basis of Preparation of the Consolidated Financial Statements and Summary of Significant Accounting Policies and Practices
a) Basis of preparation
The accompanying consolidated financial statements have been prepared in conformity with International Financial Reporting Standards, as issued by the International Accounting Standards Board (“IASB”) (hereafter referred to as IFRS).
F-7
The consolidated financial statements have been prepared on the historical cost basis, except for the derivative financial instruments, the trust assets of post-employment and other employee benefit plans and the investments in equity at fair value through OCI which are presented at their market value.
Effectively July 1, 2018, the Argentinian economy is considered to be hyperinflationary in accordance with the criteria inIAS 29“Financial Reporting in Hyperinflationary Economies” (“IAS 29”). Accordingly, for the Argentina subsidiaries, we have included, adjustments for hyperinflation and reclassifications as is required by the standard for purposes of presentation of IFRS in the consolidated financial statements.
The preparation of these consolidated financial statements under IFRS requires the use of critical estimates and assumptions that affect the amounts reported for certain assets, liabilities, income and expenses. It also requires that management exercise judgment in the application of the Company’s accounting policies. Actual results could differ from these estimates and assumptions.
The Mexican peso is the functional currency of the Company’s Mexican operations and the consolidated reporting currency of the Company.
i) Changes in Accounting Policies and Disclosures
The Company applied IFRS 15“Revenue from Contracts with Customers”(IFRS 15) and IFRS 9 “Financial Instruments” (IFRS 9) for the first time effective January 1, 2018. The nature and effect of the changes as a result of adoption of these new accounting standards are described below.
The accounting policies applied in the preparation of the consolidated financial statements for the year ended December 31, 2018 are consistent with those used in the preparation of the Company´s consolidated annual financial statements for the years ended December 31, 2017 and 2016, with the exception of the following new standards and amendments to existing standards issued by the IASB, which were mandatory for annual periods beginning on or after January 1, 2018:
a) IFRS 15 Revenue from contract with customer
In May 2014, theIASB issued the new standard IFRS 15. The new standard for revenue recognition aims at standardizing the multitude of regulations previously included in various standards, and may require more judgment and estimates than with the revenue recognition processes that were required under the previously existing revenue recognition standards
IFRS 15 supersedes IAS 11Construction Contracts, IAS 18Revenueand related Interpretations and it applies, with limited exceptions, to all revenue arising from contracts with customers. IFRS 15 establishes a five-step model to account for revenue arising from contracts with customers and requires that revenue be recognized at an amount that reflects the consideration to which an entity expects to be entitled in exchange for transferring goods or services to a customer.
IFRS 15 requires entities to exercise judgment, taking into consideration all of the relevant facts and circumstances when applying each step of the model to contracts with their customers. The standard also specifies the accounting for the incremental costs of obtaining a contract and the costs directly related to fulfilling a contract. In addition, the standard requires relevant disclosures.
The Company adopted IFRS 15 using the modified retrospective method of adoption with the date of initial application on January 1, 2018. Under this method, the standard can be applied either to all contracts at the date of initial application or only to contracts that are not completed at this date. The Company elected to apply the standard to all contracts as of January 1, 2018.
F-8
The cumulative effect of initially applying IFRS 15 was recognized at the date of initial application as an adjustment to the opening balance of retained earnings. Therefore, the comparative information was not restated and continues to be reported under IAS 11, IAS 18 and related Interpretations. The most significant changes in the implementation of IFRS 15 are the earlier recognition of revenue from the sale of goods, and the capitalization and deferral of the incremental contracts acquisition costs over the expected period of benefit.
The effect of adopting IFRS 15 as of January 1, 2018 was, as follows:
| | | | | | | | |
| | | Reference | | | Increase | |
Assets: | | | | | | | | |
Subscribers, distributors, recoverable taxes, contract assets and other, net | | | (a), (b), (c) | | | Ps. | 31,261,436 | |
| | | | | | | | |
Liabilities: | | | | | | | | |
Current liabilities | | | (c) | | | Ps. | 562,651 | |
Deferred income taxes | | | (d) | | | | 8,725,841 | |
| | | | | | | | |
| | | | | | Ps. | 9,288,492 | |
| | | | | | | | |
Equity: | | | | | | | | |
Retained earnings | | | (a), (b), (c), (d) | | | | 21,454,504 | |
Non-controlling interests | | | | | | | 518,440 | |
| | | | | | | | |
Total equity | | | | | | | 21,972,944 | |
| | | | | | | | |
Total liabilities and equity | | | | | | Ps. | 31,261,436 | |
| | | | | | | | |
Set out below are, the impacts of adopting IFRS 15 on the Company´s consolidated financial statements for the year ended December 31, 2018:
| | | | | | | | | | | | | | | | |
| | | Reference | | | As reported | | | Figures without
adoption of IFRS 15 | | | Adjustments | |
Operating revenues: | | | | | | | | | | | | | | | | |
Revenues services | | | (a), (b) | | | Ps. | 863,647,642 | | | Ps. | 881,530,167 | | | Ps. | (17,882,525 | ) |
Sales of equipment | | | (a), (b) | | | | 174,560,039 | | | | 158,721,765 | | | | 15,838,274 | |
| | | | | | | | | | | | | | | | |
| | | | | | | 1,038,207,681 | | | | 1,040,251,932 | | | | (2,044,251 | ) |
| | | | | | | | | | | | | | | | |
Operating costs and expenses: | | | | | | | | | | | | | | | | |
Cost of sales and services | | | | | | Ps. | 508,822,430 | | | Ps. | 509,100,174 | | | Ps. | (277,744 | ) |
Commercial, administrative and general and other expenses | | | (c) | | | | 234,115,500 | | | | 240,010,631 | | | | (5,895,131 | ) |
Depreciation and amortization | | | | | | | 155,712,580 | | | | 155,712,580 | | | | — | |
| | | | | | | | | | | | | | | | |
| | | | | | | 898,650,510 | | | | 904,823,385 | | | | (6,172,875 | ) |
| | | | | | | | | | | | | | | | |
| | | | | | | 139,557,171 | | | | 135,428,547 | | | | 4,128,624 | |
Financial items, net | | | | | | | 38,563,536 | | | | 38,356,359 | | | | 207,177 | |
Equity interest in net result of associated companies | | | | | | | 267 | | | | 267 | | �� | | — | |
Income tax | | | (d) | | | | 46,477,079 | | | | 45,496,698 | | | | 980,381 | |
Non-controlling interests | | | | | | | (1,950,626 | ) | | | (1,950,626 | ) | | | — | |
| | | | | | | | | | | | | | | | |
Net profit for the year | | | | | | Ps. | 52,566,197 | | | Ps. | 49,625,131 | | | Ps. | 2,941,066 | |
| | | | | | | | | | | | | | | | |
F-9
| | | | | | | | | | | | | | | | |
| | | Reference | | | As reported | | | Balances without
adoption of IFRS 15 | | | Adjustments | |
Assets: | | | | | | | | | | | | | | | | |
Current assets: | | | | | | | | | | | | | | | | |
Cash and cash equivalents and equity investments at fair value | | | | | | Ps. | 70,675,896 | | | Ps. | 70,675,896 | | | Ps. | — | |
Subscribers, distributors, recoverable taxes, contract assets and other, net | | | (a), (b), (c) | | | | 216,226,920 | | | | 185,303,634 | | | | 30,923,286 | |
Other current assets, net | | | | | | | 62,152,708 | | | | 62,152,708 | | | | — | |
| | | | | | | | | | | | | | | | |
Total current assets | | | | | | | 349,055,524 | | | | 318,132,238 | | | | 30,923,286 | |
Non-current assets: | | | | | | | | | | | | | | | | |
Property, plant and equipment, net | | | | | | | 640,000,720 | | | | 640,000,720 | | | | — | |
Intangibles and other assets, net | | | | | | | 424,485,276 | | | | 424,485,276 | | | | — | |
Subscribers, distributors, recoverable taxes, contract assets and other, net | | | (a), (b), (c) | | | | 15,681,872 | | | | 10,244,609 | | | | 5,437,263 | |
| | | | | | | | | | | | | | | | |
Total assets | | | | | | Ps. | 1,429,223,392 | | | Ps. | 1,392,862,843 | | | Ps. | 36,360,549 | |
| | | | | | | | | | | | | | | | |
Liabilities and equity: | | | | | | | | | | | | | | | | |
Current liabilities: | | | | | | | | | | | | | | | | |
Short-term debt and current portion of long-term debt | | | | | | Ps. | 96,230,634 | | | Ps. | 96,230,634 | | | Ps. | — | |
Accounts payable and other liabilities | | | | | | | 338,116,412 | | | | 337,448,940 | | | | 667,472 | |
Deferred revenues | | | | | | | 32,743,843 | | | | 32,315,690 | | | | 428,153 | |
| | | | | | | | | | | | | | | | |
Total current liabilities | | | | | | | 467,090,889 | | | | 465,995,264 | | | | 1,095,625 | |
Non-current-liabilities: | | | | | | | | | | | | | | | | |
Long-term debt | | | | | | | 542,691,819 | | | | 542,691,819 | | | | — | |
Deferred income taxes | | | (d) | | | | 24,573,441 | | | | 15,382,500 | | | | 9,190,941 | |
Other liabilities | | | | | | | 148,994,821 | | | | 148,994,821 | | | | — | |
| | | | | | | | | | | | | | | | |
Total liabilities | | | | | | | 1,183,350,970 | | | | 1,173,064,404 | | | | 10,286,566 | |
Total equity | | | (d) | | | | 245,872,422 | | | | 219,798,439 | | | | 26,073,983 | |
| | | | | | | | | | | | | | | | |
Total liabilities and equity | | | | | | Ps. | 1,429,223,392 | | | Ps. | 1,392,862,843 | | | Ps. | 36,360,549 | |
| | | | | | | | | | | | | | | | |
IFRS 15 Revenues from contracts with customers
IFRS 15 establishes a comprehensive framework for determining when to recognize revenue and how much revenue to recognize. The principle core is that an entity should recognize revenue to depict the transfer of promised goods or services to the customer in an amount that reflects the consideration to which the entity expects to be entitled in exchange for those goods or services. The most significant changes in the implementation of IFRS 15 are as follows:
| a. | The Company provides fixed and mobile services. These services are offered independently in contracts with customers or together with the sale of handsets (mobile) under the postpaid model. In accordance with IFRS 15, the transaction price should be assigned to the different performance obligations based on their relative standalone selling price. |
The Company concluded that regarding the provided services, it has market observable information, to determine the standalone selling price of the services. On the other hand, in the case of the sale of bundled mobile phones sold (including service and handset) by the Company, the allocation of the sales is done
F-10
based on their relative standalone selling price of each individual component related to the total bundled price. The result is that more equipment revenue is recognized at the moment of a sale and, therefore, less service revenue from the monthly fee are being recognized under the new standard.
The Company concluded as well that the provided services are satisfied over the time of the contract period, given that the customer simultaneously receives and consumes the benefits provided by the Company.
Such service bundles, voice and data, accomplish the criteria mentioned in IFRS 15 of being substantially similar and of having the same transfer pattern which is why the Company concluded that the revenue from these different services offered to its customers are considered as a single performance obligation with revenue being recognized over time, except for sales of equipment.
| b. | Under IFRS 15, for those contracts with customers in which generally the sale of equipment and other electronic equipment is a single performance obligation, the Company recognizes the revenue at the moment when it transfers control to the customer which generally occurs when such goods are delivered. The latter is consistent with the previous accounting policy. |
| c. | The Company pays commissions to its distributors for obtaining new customers; such commissions were expensed as incurred under the previous accounting. Under IFRS 15, commissions are considered incremental contract acquisition costs that are capitalized and are amortized over the expected period of benefit, during the average duration of customer contracts. |
| d. | In addition to the adjustments described above, other items such as deferred taxes andnon-controlling interests were adjusted to retained earnings as necessary upon adoption of IFRS 15 as of January 1, 2018. |
b) IFRS 9, Financial Instruments
IFRS 9 was issued in July 2014 and replaced IAS 39Financial Instruments and relates to the classification and measurement of financial instruments, impairment; and hedge accounting.
The Company applied IFRS 9 prospectively, with an initial application date of January 1, 2018. The Company has not restated the comparative information, which continues to be reported under IAS 39.
The effect of adopting IFRS 9 as of January 1, 2018 was, as follows:
| | | | | | | | |
| | | Adjustments | | | January 1, 2018 | |
Assets | | | | | | | | |
Trade receivables | | | (a) | | | Ps. | (2,400,783 | ) |
Deferred tax assets | | | (b) | | | | 544,628 | |
| | | | | | | | |
Total assets | | | | | | Ps. | (1,856,155 | ) |
| | | | | | | | |
Equity | | | | | | | | |
Retained earnings | | | (a), (b) | | | Ps. | (1,856,155 | ) |
| | | | | | | | |
Total adjustment on equity | | | | | | Ps. | (1,856,155 | ) |
| | | | | | | | |
IFRS 9 sets out the requirements for recognizing and measuring financial assets and financial liabilities. This new standard includes:
a) Impairment
The adoption of IFRS 9 has fundamentally changed the Company´s accounting for impairment losses for financial assets by replacing IAS 39’s incurred loss approach with a forward-looking expected credit loss approach. IFRS 9 requires the Company to recognize an allowance for expected credit loss for all debt instruments not held at fair value through profit or loss and contract assets.
F-11
Upon adoption of IFRS 9 the Company recognized an impairment on the Company´s trade receivables at fair value Ps 2,400,783 as of January 1, 2018, which resulted in a decrease in Retained earnings. There were no impairment losses that impacted the carrying amount of debt instruments at fair value through OCI in the statements of financial position, which remains at fair value.
b) Other adjustments
In addition to the adjustments described above, other items such as deferred taxes andnon-controlling interests were adjusted to retained earnings as necessary upon adoption of IFRS 9 as of January 1, 2018.
The new requirements of IFRS 9 regarding hedge accounting do not have an effect on the consolidated financial statements as hedge accounting is not applied. The Company continues to consider the hedges to be under IAS 39 as allowed by IFRS 9.
Compared to IAS 39, the application of IFRS 9 had an immaterial effect on the consolidated financial statements in 2018, including classification of financial assets and liabilities.
c) Impact of the application for hyperinflation in Argentina
In the recent years, the Argentina economy has shown high rates of inflation. Although inflation data has not been consistent in recent years and several indexes have coexisted, inflation in Argentina indicates that thethree-year cumulative inflation rate recently exceeded 100%, which is the quantitative reference established by IAS 29. As a result, Argentina is considered a hyperinflationary economy in 2018 and the Company applies hyper-inflation accounting to its subsidiary whose functional currency is the Argentine peso for financial information for periods ending on or after July 1, 2018, however the calculation of the accumulative impact was measured as of January 1, 2019.
In order to restate for hyperinflation its financial statements, the subsidiary used the series of indices defined by resolution JG No. 539/18 issued by the “Federación Argentina de Consejos Profesionales de Ciencias Económicas” (FACPCE), based on the National Consumer Price Index (IPC) published by the Instituto Nacional de Estadística y Censos (INDEC) of the Argentine Republic and the Wholesale Internal Price Index (IPIM) published by FACPCE. The cumulative index December 31, 2018 is 184.255, while on an annual inflation for 2018 is 48%.
The main implications are as follows:
| | • | | Adjustment of the historical cost ofnon-monetary assets and liabilities and equity items from their date of acquisition, or the date of inclusion in the consolidated statements of financial position, to the end of the year, in order to reflect changes in the currency’s purchasing power caused by inflation. |
| | • | | The gain on the net monetary position caused by the impact of inflation in the year is included in the consolidated statements of comprehensive income as part of the caption “Valuation of derivatives, interest cost from labor obligations and other financial items, net. Items in the income statements and in the statements of cash flows are adjusted by the inflation index since their origination, with a balancing entry, and a reconciling item in the statements of cash flows, respectively. |
| | • | | All items in the financial statements of the Argentine company are translated at the closing exchange rate, which at December 31, 2018 was 0.5221 argentine pesos per mexican peso. |
| | • | | Financial information for financial years prior to 2018 are not restated. |
F-12
The main impact in the consolidated financial statements of the Company in 2018 of applying hyperinflationary accounting under IAS 29 are shown below:
| | | | |
| | | Impact of the
application of
hyperinflation
adjustments in
2018 | |
Impact in: | | | | |
Operating revenues | | | Ps. 6,286,140 | |
Operating loss | | | (1,423,252 | ) |
Financial loss | | | (1,289,317 | ) |
Gain on net monetary positions | | | 4,429,145 | |
Income tax | | | (770,928 | ) |
Net profit for the year | | | 945,647 | |
Current assets | | | 1,866,674 | |
Non-current assets | | | 19,796,073 | |
Total liabilities | | | 4,890,166 | |
Total equity(i) | | | 16,772,581 | |
| (i) | This total includes the initial effect of hyperinflation of Ps. 15,826,934 and the net effect on results due to the hyperinflation of the year of Ps. 945,647. |
ii) Basis of consolidation
The consolidated financial statements include the accounts of América Móvil, S.A.B. de C.V. and those subsidiaries over which the Company exercises control. The consolidated financial statements for the subsidiaries were prepared for the same period as the Company´s and applying consistent accounting policies. All of the subsidiary companies operate in the telecommunications sector or related.
Subsidiaries are entities over which the Company has control. Control is achieved when the Company has power over the investee, when it is exposed to, or has rights to, variable returns from its involvement with the investee, and has the ability to use its power over the investee to affect the amount of the investor’s returns. Subsidiaries are consolidated on a line by line basis from the date which control is achieved by the Company. The Company reassesses whether or not it controls an investee if facts and circumstances indicate that there are changes to one or more of the elements of control.
Changes in the Company’s ownership interests in a subsidiary that do not result in the Company losing control over the subsidiary are accounted for as equity transactions. The carrying amounts of the equity attributable to owners of the parent andnon-controlling interests are adjusted to reflect the changes in their relative interests in the subsidiary. Any difference between the carrying amount of thenon-controlling interests and the fair value of the consideration paid or received in the transaction is recognized directly in the equity attributable to the owners.
Subsidiaries are deconsolidated from the date which control ceases. When the Company ceases to have control over a subsidiary, it derecognizes the assets (including any goodwill) and liabilities of the subsidiary at their carrying amounts, derecognizes the carrying amount ofnon-controlling interests in the former subsidiary and recognizes the fair value of any consideration received from the transaction. Any retained interest in the former subsidiary is then remeasured to its fair value.
All intra-Company balances and transactions, and any unrealized gains and losses arising from intra-Company transactions, are eliminated in preparing the consolidated financial statements.
Non-controlling interests represent the portion of profits or losses and net assets not held by the Company.Non-controlling interests are presented separately in the consolidated statements of comprehensive income and in equity in the consolidated statements of financial position separately from Company’s own equity.
F-13
Associates:
An associate is an entity over which the Company has significant influence. Significant influence is the power to participate in the financial and operating policy decisions of the investee but does not have control or joint control over those decisions.
The Company’s investment in associates includes goodwill identified on acquisition, net of any accumulated impairment losses.
The investments in associated companies in which the Company exercises significant influence are accounted for using the equity method, whereby Company recognizes its share in the net profit (losses) and equity of the associate.
The results of operations of the subsidiaries and associates are included in the Company’s consolidated financial statements beginning as of the month following their acquisition and its share of other comprehensive income after acquisition is recognized directly in other comprehensive income.
The Company assesses at each reporting date whether there is objective evidence that investment in associates is impaired. If so, the Company calculates the amount of impairment as the difference between the recoverable amount of the associate and its carrying value.
The equity interest in the most significant subsidiaries at December 31, 2017 and 2018 is as follows:
| | | | | | | | | | | | |
Company name | | Country | | | Equity
interest at
December 31 | |
| | 2017 | | | 2018 | |
Subsidiaries: | | | | | | | | | | | | |
América Móvil B.V.a) | | | Netherlands | | | | 100.0 | % | | | 100.0 | % |
Compañía Dominicana de Teléfonos, S.A. (“Codetel”)b) | | | Dominican Republic | | | | 100.0 | % | | | 100.0 | % |
Sercotel, S.A. de C.V.a) | | | Mexico | | | | 100.0 | % | | | 100.0 | % |
Radiomóvil Dipsa, S.A. de C.V. and subsidiaries (“Telcel”)b) | | | Mexico | | | | 100.0 | % | | | 100.0 | % |
Puerto Rico Telephone Company, Inc.b) | | | Puerto Rico | | | | 100.0 | % | | | 100.0 | % |
Servicios de Comunicaciones de Honduras, S.A. de C.V. (“Sercom Honduras”)b) | | | Honduras | | | | 100.0 | % | | | 100.0 | % |
TracFone Wireless, Inc. (“TracFone”)b) | | | USA | | | | 100.0 | % | | | 100.0 | % |
Claro S.A. (Claro Brasil)b) | | | Brazil | | | | 97.7 | % | | | 98.2 | % |
Telecomunicaciones de Guatemala, S.A. (“Telgua”)b) | | | Guatemala | | | | 99.3 | % | | | 99.3 | % |
Empresa Nicaragüense de Telecomunicaciones, S.A. (“Enitel”) b) | | | Nicaragua | | | | 99.6 | % | | | 99.6 | % |
Compañía de Telecomunicaciones de El Salvador, S.A. de C.V. (“CTE”)b) | | | El Salvador | | | | 95.8 | % | | | 95.8 | % |
Comunicación Celular, S.A. (“Comcel”)b) | | | Colombia | | | | 99.4 | % | | | 99.4 | % |
Telmex Colombia, S.A.b) | | | Colombia | | | | 99.3 | % | | | 99.3 | % |
Consorcio Ecuatoriano de Telecomunicaciones, S.A. (“Conecel”) b) | | | Ecuador | | | | 100.0 | % | | | 100.0 | % |
AMX Argentina, S.A.b) | | | Argentina | | | | 100.0 | % | | | 100.0 | % |
AMX Paraguay, S.A.b) | | | Paraguay | | | | 100.0 | % | | | 100.0 | % |
AM Wireless Uruguay, S.A.b) | | | Uruguay | | | | 100.0 | % | | | 100.0 | % |
Claro Chile, S.A.b) | | | Chile | | | | 100.0 | % | | | 100.0 | % |
América Móvil Perú, S.A.Cb) | | | Peru | | | | 100.0 | % | | | 100.0 | % |
Claro Panamá, S.A.b) | | | Panamá | | | | 100.0 | % | | | 100.0 | % |
Teléfonos de México, S.A.B. de C.V.b) | | | Mexico | | | | 98.8 | % | | | 98.8 | % |
Telekom Austria AGb) | | | Austria | | | | 51.0 | % | | | 51.0 | % |
F-14
| b) | Operating companies of mobile and fixed services |
iii) Basis of translation of financial statements of foreign subsidiaries and associated companies
The operating revenues of foreign subsidiaries jointly represent approximately 72%, 74% and 73% of consolidated operating revenues of 2016, 2017 and 2018, respectively, and their total assets jointly represent approximately 81% and 80% of consolidated total assets at December 31, 2017 and 2018, respectively.
The financial statements of foreign subsidiaries have been prepared under or translated to IFRS in the respective local currency (which is their functional currency) and then translated into the Company´s reporting currency as follows:
| | • | | all monetary assets and liabilities were translated at the closing exchange rate of the period; |
| | • | | allnon-monetary assets and liabilities at the closing exchange rate of the period; |
| | • | | equity accounts are translated at the exchange rate at the time the capital contributions were made and the profits were generated; |
| | • | | revenues, costs and expenses are translated at the average exchange rate of the period, except for the operations of the subsidiaries in Argentina; whose economy is considered hyperinflationary since 2018; |
| | • | | the resulting difference from the translation process is recognized in equity in the caption Cumulative translation adjustment; |
| | • | | the consolidated statements of cash flows presented using the indirect method were translated using the weighted-average exchange rate for the applicable period (except for Argentina), and the resulting difference is shown in the consolidated statements of cash flows under the heading “Adjustment to cash flows due to exchange rate fluctuations, net”. |
The basis of translation for the operations of the subsidiaries in Argentina are described in Note 2i, c)
The difference resulting from the translation process is recognized in equity in the caption “Effect of translation of foreign entities”. At December 31, 2017 and 2018, the cumulative translation adjustment was Ps. 7,866,158 and Ps. (53,357,300), respectively.
b) Revenue recognition
The Company revenues are derived principally from providing the following telecommunications services and products: wireless voice, wireless data and value-added services, fixed voice, fixed data, broadband and IT services, Pay TV andover-the-top (“OTT”) services.
The wireless voices services are offered under a variety of plans. In addition, the Company often bundle wireless data telecommunications services together with voices services. Monthly rent in post- paid is billed based on the associated plan o package rates, corresponding to when the services are provided.
As part the wireless data services, the Company offer value-added services that include Internet access, messaging and other wireless entertainment and corporative services, Revenue from such services are recognized at the time they are provided, on the date the installation or when the services are downloaded. In addition, the Company offer other wireless services, including wireless security services, mobile payments solutions,machine-to-machine services, mobile banking, virtual private network (“VPN”) services, video calls and Personal Communication Services (“PCS”).
F-15
The fixed voices services include local, domestic and international long-distance and public telephone services, under a variety of plans, specifically tailored to our residential and corporate clients. Revenue from the local services are derived from the monthly rent for services and the long-distances revenues are recognized at the time the service is provided.
The Company offer data services, including data centers, data administration and hosting services to our residential and corporate clients under a variety of plans. These revenues are recognized at the time the service is provided.
The residential broadband access are typically bundled with voice services and are competitively priced as a function of the desired or available speed. As a complement to these services, the Company offer a number of products such as home networking and smart home services. In addition, The Company provide different IT solutions for small business and large corporations.
The Company offer Pay TV through cable and satellite TV subscriptions to both retail and corporate customers under a variety of plans. These services are offered through individual subscription plans as well as in bundled packages of services, along with broadband, fixed voice and wireless services. In addition, the Company sell video, audio and other media content that is delivered through the internet directly from the content provider to the viewer or end user. These revenues are recognized at the time the service is provided.
The Company sells to its customers bundles of different services (fixed line, mobile, broadband internet, streaming and pay TV, among others) which elements are evaluated to determine if it is necessary to separate the different identifiable components and apply the income recognition policy corresponding to each element.
Total package revenue is allocated among the identified elements based on their respective standalone selling prices.
Determining standalone selling prices for each identified element requires estimates that are complex due to the nature of the business. A change in estimates of standalone selling prices could affect the apportionment of revenue among the elements and, as a result, the timing of recognition of revenues.
Transaction prices are allocated to the performance obligations by reference to the relative stand-alone selling prices of the products and services. The stand-alone selling prices of products are based on the market prices whereas the standalone selling prices of services are available separately, as services are also offered on a stand-alone basis, i.e. without hardware.
Some subsidiaries have loyalty programs where the Company awards credits customer credit awards referred as “points”. The customer can redeem accrued “points” for awards such as devices, accessories or airtime. The Company provides all awards. The consideration allocated to the award credits is identified as a separate performance obligation; the corresponding liability of the award credits is measured at its fair value. The consideration allocated to award credits amount is recognized as a contract liability until the points are redeemed. Revenue is recognized upon redemption of products by the customer.
c) Cost of sales
The cost of mobile equipment and computers is recognized at the time the client and distributor receives the device that is when the control is are transferred to the customer.
d) Cost of services
The cost of services represents the costs incurred to properly deliver the services to the customers, it includes the network operating costs and licenses related costs and is accounted at the moment in which such services are provided.
F-16
e) Commissions to distributors
The Company pays commissions to its distributors different than those that acquire customers. Such commissions are recognized in “commercial, administrative and general expenses” in the consolidated statements of comprehensive income at the time in which the distributor either reports an activation or reaches certain number of lines activated or obtained at a certain point of time.
f) Cash and cash equivalents
Cash and cash equivalents represent bank deposits and liquid investments with maturities of less than three months. These amounts are stated at cost plus accrued interest, which is similar to their market value.
The Company also maintains restricted cash held as collateral to meet certain contractual obligations. Restricted cash is presented as part of “Other assets” within othernon-current financial assets given that the restrictions are long-term in nature (See Note 9).
g) Equity investments at fair value through OCI and other short-term investments
Equity investments at fair value through OCI and other short-term investments are primarily composed of equity investments and other short-term financial investments. Amounts are initially recorded at their estimated fair value. Fair value adjustments for equity investments are recorded through other comprehensive income, while fair value adjustments for other short-term investments are recorded in the Consolidated Statements of Comprehensive Income as they occur.
h) Inventories
Inventories are initially recognized at historical cost and are valued using the average cost method without exceeding their net realizable value.
The estimate of the realizable value of inventorieson-hand is based on their age and turnover.
i) Business combinations and goodwill
Business combinations are accounted for using the acquisition method, which in accordance with IFRS 3, “Business acquisitions”, consists in general terms as follows:
| (ii) | Determine the acquisition date |
| (iii) | Value the acquired identifiable assets and assumed liabilities |
| (iv) | Recognize the goodwill or a bargain purchase gain |
For acquired subsidiaries, goodwill represents the difference between the purchase price and the fair value of the net assets acquired at the acquisition date. The investment in acquired associates includes goodwill identified on acquisition, net of any impairment loss.
Goodwill is reviewed annually to determine its recoverability or more often if circumstances indicate that the carrying value of the goodwill might not be fully recoverable.
The possible loss of value in goodwill is determined by analyzing the recovery value of the cash generating unit (or the group thereof) to which the goodwill is associated at the time it was originated. If this recoverable amount is lower than the carrying value, an impairment loss is charged to the results of operations. The recoverable amount is determined based on the higher of fair value less cost of disposal or value in use.
F-17
For the years ended December 31, 2016, 2017 and 2018, no impairment losses were recognized for the goodwill shown in the Company’s consolidated statements of financial position.
j) Property, plant and equipment
i) Property, plant and equipment are recorded at acquisition cost, net of accumulated depreciation. Depreciation is computed on the cost of the assets using the straight line method, based on the estimated useful lives of the related assets, beginning the month after they become available for use.
Borrowing costs that are incurred for general financing for construction in progress for periods exceeding six months are capitalized as part of the cost of the asset. During 2016, 2017 and 2018 the borrowing costs that were capitalized amounted to Ps. 2,861,307, Ps. 2,875,034 and Ps. 2,020,288 respectively.
In addition to the purchase price and costs directly attributable to preparing an asset in terms of its physical location and condition for operating as intended by management, when required, the cost also includes the estimated costs of dismantling and removal of the asset and for restoration of the site where it is located (See Note 15c).
ii) The net book value of property, plant and equipment is removed from the consolidated statements of financial position at the time the asset is sold or when no future economic benefits are expected from its use or sale. Any gains or losses on the sale of property, plant and equipment represent the difference between net proceeds of the sale and the net book value of the item at the time of sale. These gains or losses are recognized as either other operating income or other operating expenses upon sale.
iii) The Company periodically assesses the residual values, useful lives and depreciation methods associated with its property, plant and equipment. If necessary, the effects of any changes in accounting estimates is recognized prospectively, at the closing of each period, in accordance with IAS 8, “Accounting Policies, Changes in Accounting Estimates and Errors”.
For property, plant and equipment made up of several components with different useful lives, the major individual components are depreciated over their individual useful lives. Maintenance costs and repairs are expensed as incurred.
Annual depreciation rates are as follows:
| | | | |
Network infrastructure | | | 5 | %-33% |
Buildings and leasehold improvement | | | 2 | %-33% |
Other assets | | | 10 | %-50% |
iv) The carrying value of property, plant and equipment is reviewed if there are indicators of impairment in such assets. If an asset’s recovery value is less than the asset’s net carrying value, the difference is recognized as an impairment loss.
During the years ended December 31, 2016, 2017 and 2018, no impairment losses were recognized.
v) Spare parts for network operation is valued using the average cost method, without exceeding its net realizable value.
The valuation of inventory for network considered obsolete, defective or slow-moving, is reduced to their estimated net realizable value. The estimate of the recovery value of inventories is based on their age and turnover.
F-18
k) Intangibles
i) Licenses
Licenses to operate wireless telecommunications networks granted by the governments of the countries in which the Company operates are recorded at acquisition cost or at fair value at their acquisition date, net of accumulated amortization. Certain licenses require payments to the governments, such payments are recognized in the cost of service and equipment.
The licenses that in accordance with government requirements are categorized as automatically renewable, for a nominal cost and with substantially consistent terms, are considered by the Company as intangible assets with an indefinite useful life. Accordingly, they are not amortized. Licenses are amortized when the Company does not have a basis to conclude that they are indefinite lived. Licenses are amortized using the straight-line method over a period ranging from 3 to 30 years, which represents the usage period of the assets.
The Company has conducted an internal analysis on the applicability of the International Financial Reporting Interpretation Committee (“IFRIC”) No. 12 (Service Concession Agreements) and has concluded that its concessions are outside the scope of IFRIC 12. To determine the applicability of IFRIC 12, the Company analyzes each concession or group of similar concessions in a given jurisdiction. As a threshold matter, the Company identifies those government concessions that provide for the development, financing, operation or maintenance of infrastructure used to render a public service, and that set out performance standards, mechanisms for adjusting prices and arrangements for arbitrating disputes.
With respect to those services, the Company evaluates whether the grantor controls or regulates (i) what services the operator must provide, (ii) to whom it must provide them and (iii) the applicable price (the “Services Criterion”). In evaluating whether the applicable government, as grantor, controls the price at which the Company provides its services, the Company looks at the terms of the concession agreement according to all applicable regulations. If the Company determines that the concession under analysis meets the Services Criterion, then the Company evaluates whether the grantor would hold a significant residual interest in the concession’s infrastructure at the end of the term of the arrangement.
ii) Trademarks
Trademarks are recorded at their fair value at the valuation date when acquired. The useful lives of trademarks are assessed as either definite or indefinite. Trademarks with finite useful lives are amortized using the straight-line method over a period ranging from 1 to 10 years. Trademarks with indefinite useful lives are not amortized, but are tested for impairment annually at the cash generating unit level. The assessment of indefinite life is reviewed annually to determine whether the indefinite life continues to be supportable, if not, the change in useful life from indefinite to definite is made on a prospective basis.
iii) Irrevocable rights of use
Irrevocable rights of use are recognized according to the amount paid for the right and are amortized over the period in which they are granted.
The carrying values of the Company’s licenses and trademarks are reviewed annually and whenever there are indicators of impairment in the value of such assets. When an asset’s recoverable amount, which is the higher of the asset’s fair value, less disposal costs and its value in use (the present value of future cash flows), is less than the asset’s carrying value, the difference is recognized as an impairment loss.
iv) Customer relationships
The value of customer relations is determined and valued at the time that a new subsidiary is acquired, as determined by the Company with the assistance of independent appraisers, and is amortized on a 5 year period.
F-19
During the years ended December 31, 2016, 2017 and 2018, no impairment losses were recognized for licenses, trademarks, irrevocable rights of use or customer relationships.
l) Impairment in the value of long-lived assets
The Company assesses the existence of indicators of impairment in the carrying value of long-lived assets, investments in associates, goodwill and intangible assets according to IAS 36 “Impairment of assets”. When there are such indicators, or in the case of assets whose nature requires an annual impairment analysis (goodwill and intangible assets with indefinite useful lives), the Company estimates the recoverable amount of the asset, which is the higher of its fair value, less disposal costs, and its value in use. Value in use is determined by discounting estimated future cash flows, applying apre-tax discount rate that reflects the time value of money and taking into consideration the specific risks associated with the asset. When the recoverable amount of an asset is below its carrying value, impairment is considered to exist. In this case, the carrying value of the asset is reduced to the asset’s recoverable amount, recognizing the loss in results of operations for the respective period. Depreciation and/or amortization expense of future periods is adjusted based on the new carrying value determined for the asset over the asset’s remaining useful life. Impairment is computed individually for each asset. Recoverable amount is determined for an individual asset, unless the asset does not generate cash inflows that are largely independent of those from other assets or group of assets.
In the estimation of impairments, the Company uses the strategic plans established for the separate cash-generating units to which the assets are assigned. Such strategic plans generally cover a period from 3 to 5 years. For longer periods, beginning in the fifth year, projections are based on such strategic plans while applying a constant or declining expected perpetual growth rate.
Key assumptions used in value in use calculations
The forecasts are made in real terms (net of inflation) and in the functional currency of the subsidiary as of December 31, 2018. Financial forecasts, premises and assumptions are similar to what any other market participant in similar conditions would consider.
Local synergies, that any other market participant would not have taken into consideration to prepare similar forecasted financial information, have not been included.
The assumptions used to develop the financial forecasts were validated for each of the cash generating units (“CGUs”), typically identified by country and by service (in the case of Mexico) taking into consideration the following:
| | • | | Current subscribers and expected growth. |
| | • | | Type of subscribers (prepaid, postpaid, fixed line, multiple services) |
| | • | | Market environment and penetration expectations |
| | • | | New products and services |
| | • | | Economic environment of each country |
| | • | | Expenses for maintaining the current assets |
| | • | | Investments in technology for expanding the current assets |
| | • | | Market consolidation and synergies |
The foregoing forecasts could differ from the results obtained through time; however, the Company prepares its estimates based on the current situation of each of the CGUs.
F-20
The recoverable amounts are based on value in use. The value in use is determined based on the method of discounted cash flows. The key assumptions used in projecting cash flows are:
| | • | | Margin on EBITDA is determined by dividing EBITDA (operating income plus depreciation and amortization) by total revenues. |
| | • | | Margin on CAPEX is determined by dividing capital expenditures (“CAPEX”) by total revenues. |
| | • | | Pre-tax weighted average cost of capital (“WACC”) is used to discount the projected cash flows. |
As discount rate, the Company uses the WACC which was determined for each of the cash generating units and is described in the following paragraphs.
The estimated discount rates to perform the IAS 36 “Impairment of assets”, impairment test for each CGU consider market participants assumptions. Market participants were selected taking into consideration size, operations and characteristics of the business that were similar to those of Company.
The discount rates represent the current market assessment of the risks specific to each CGU, taking into consideration the time value of money and individual risks of the underlying assets that have not been incorporated in the cash flow estimates. The discount rate calculation is based on the specific circumstances of the Company and its operating segments. The WACC takes into account both debt and equity costs. The cost of equity is derived from the expected return on investment for each GCU. The cost of debt is based on the interest-bearing borrowings the Company is obliged to service. Segment-specific risk is incorporated by applying individual beta factors.
The beta factors are evaluated annually based on publicly available market data.
Market participant assumptions are important because, not only do they include industry data for growth rates, but also management assesses how the CGU’s position, relative to its competitors, might change over the forecasted period.
The most significant forward-looking estimates used for the 2017 and 2018 impairment evaluations are shown below:
| | | | | | |
| | | Average margin on
EBITDA | | Average margin on
CAPEX | | Averagepre-tax
discount rate
(WACC) |
2017: | | | | | | |
Europe (7 countries) | | 25.59% - 52.46% | | 7.34% - 14.97% | | 9.06% - 19.04% |
Brazil (fixed line, wireless and TV) | | 35.28% | | 22.13% | | 11.71% |
Puerto Rico | | 23.31% | | 8.31% | | 4.42% |
Dominican Republic | | 45.79% | | 15.55% | | 19.23% |
Mexico (fixed line and wireless) | | 35.48% | | 8.72% | | 16.13% |
Ecuador | | 37.83% | | 10.07% | | 23.57% |
Peru | | 29.64% | | 16.75% | | 13.61% |
El Salvador | | 40.36% | | 17.99% | | 25.14% |
Chile | | 22.04% | | 12.45% | | 6.15% |
Colombia | | 41.93% | | 19.88% | | 19.06% |
Other countries | | 9.16% - 48.18% | | 0.43% - 23.43% | | 7.89% - 24.28% |
F-21
| | | | | | | | | | | | |
| | | Average margin on
EBIDTA | | | Average margin on
CAPEX | | | Average pre-tax
discount rate
(WACC)las | |
2018: | | | | | | | | | | | | |
Europe (7 countries) | | | 22.13% - 41.51% | | | | 8.13% - 19.40% | | | | 8.36% - 22.08% | |
Brazil (fixed line, wireless and TV) | | | 36.43% | | | | 21.88% | | | | 10.38% | |
Puerto Rico | | | 23.86% | | | | 9.89% | | | | 4.81% | |
Dominican Republic | | | 48.64% | | | | 18.43% | | | | 17.66% | |
Mexico (fixed line and wireless) | | | 36.33% | | | | 7.93% | | | | 16.30% | |
Ecuador | | | 39.83% | | | | 11.26% | | | | 24.45% | |
Peru | | | 30.29% | | | | 19.95% | | | | 11.52% | |
El Salvador | | | 45.36% | | | | 22.61% | | | | 18.01% | |
Chile | | | 25.91% | | | | 14.99% | | | | 6.62% | |
Colombia | | | 45.01% | | | | 17.14% | | | | 20.29% | |
Other countries | | | 7.90% - 45.91% | | | | 0.61% - 23.96% | | | | 9.97% - 31.63% | |
Sensitivity to changes in assumptions:
The implications of the key assumptions for the recoverable amount are discussed below:
Margin on CAPEX- The Company performed a sensitivity analysis by increasing its CAPEX by 5% and maintaining all other assumptions the same. The sensitivity analysis would require the Company to adjust the amount of its long-lived assets in its CGUs with potential impairment of approximately Ps. 1,558,823
WACC- Additionally, should the Company increase by 50 base points in WACC per CGU and maintain all other assumptions the same, the carrying amount of the long-lived assets, would be impaired by approximately Ps. 1,135,854.
m) Leases
The determination of whether an agreement is, or contains, a lease is based on the substance of the agreement and requires the Company to assess if performance of the agreement is dependent on the use of a specific asset and whether the agreement transfers the right of use of the asset to the Company.
Operating leases
Leases under which the lessor retains a significant portion of the risks and benefits inherent to the ownership of the leased asset are considered operating leases. Payments made under operating lease agreements are charged to results of operations on a straight-line basis over the rental period.
Finance leases
Lease agreements that substantially transfer all the risks and benefits of ownership of the leased assets to the Company are accounted for as finance leases. Accordingly, upon commencement of the lease, the asset, which is classified based on its nature, and its associated debt are recorded at the lower of the fair value of the leased asset or the present value of the lease payments. Finance lease payments are apportioned between the reduction of lease liability and the finance cost so that a constant interest rate is determined on the outstanding liability balance. Finance costs are charged to results of operations over the life of the agreement.
n) Financial assets and liabilities
Financial assets
Initial recognition and measurement
Financial assets are classified, at initial recognition, as subsequently measured at amortized cost, fair value through other comprehensive income (OCI), and fair value through profit or loss.
F-22
The classification of financial assets at initial recognition depends on the financial asset’s contractual cash flow characteristics and the Company’s business model for managing them, with the exception of trade receivables that do not contain a significant financing component or for which the Company has applied the practical expedient, the Company initially measures a financial asset at its fair value plus, in the case of a financial asset not at fair value through profit or loss, transaction costs.
– Subsequent measurement
For purposes of subsequent measurement, financial assets are classified in four categories:
| | • | | Financial assets at amortized cost (debt instruments) |
| | • | | Financial assets at fair value through OCI with recycling of cumulative gains and losses (debt instruments) |
| | • | | Financial assets designated at fair value through OCI with no recycling of cumulative gains and losses upon derecognition (equity instruments) |
| | • | | Financial assets at fair value through profit or loss |
Financial assets at amortized cost (debt instruments)
The Company measures financial assets at amortized cost if both of the following conditions are met:
| | • | | The financial asset is held within a business model with the objective to hold financial assets in order to collect contractual cash flows, and |
| | • | | The contractual terms of the financial asset give rise on specified dates to cash flows that are solely payments of principal and interest on the principal amount outstanding |
Financial assets at amortized cost are subsequently measured using the effective interest (EIR) method and are subject to impairment. Gains and losses are recognized in profit or loss when the asset is derecognized, modified or impaired.
The Company’s financial assets at amortized cost includes cash and cash equivalents, loans and receivables.
Financial assets at fair value through OCI with recycling of cumulative gains and losses (debt instruments)
The Company measures debt instruments at fair value through OCI if both of the following conditions are met:
| | • | | The financial asset is held within a business model with the objective of both holding to collect contractual cash flows and selling, and |
| | • | | The contractual terms of the financial asset give rise on specified dates to cash flows that are solely payments of principal and interest on the principal amount outstanding |
For debt instruments at fair value through OCI, interest income, foreign exchange revaluation and impairment losses or reversals are recognized in the statements of profit or loss and computed in the same manner as for financial assets measured at amortized cost. The remaining fair value changes are recognized in OCI. Upon derecognition, the cumulative fair value change recognized in OCI is recycled to profit or loss.
Financial assets designated at fair value through OCI with no recycling of cumulative gains and losses upon derecognition (equity instruments)
Upon initial recognition, the Company can elect to classify irrevocably its equity investments as equity instruments designated at fair value through OCI when they meet the definition of equity under IAS 32 Financial Instruments: Presentation and are not held for trading. The classification is determined on an instrument by instrument basis.
F-23
Gains and losses on these financial assets are never recycled to profit or loss. Dividends are recognized as other income in the statements of profit or loss when the right of payment has been established, except when the Company benefits from such proceeds as a recovery of part of the cost of the financial asset, in which case, such gains are recorded in OCI. Equity instruments designated at fair value through OCI are not subject to impairment assessment.
Financial assets at fair value through profit or loss
Financial assets at fair value through profit or loss include financial assets held for trading, financial assets designated upon initial recognition at fair value through profit or loss, or financial assets mandatorily required to be measured at fair value. Financial assets are classified as held for trading if they are acquired for the purpose of selling or repurchasing in the near term. Derivatives, including separated embedded derivatives, are also classified as held for trading unless they are designated as effective hedging instruments. Financial assets with cash flows that are not solely payments of principal and interest are classified and measured at fair value through profit or loss, irrespective of the business model. Notwithstanding the criteria for debt instruments to be classified at amortized cost or at fair value through OCI, as described above, debt instruments may be designated at fair value through profit or loss on initial recognition if doing so eliminates, or significantly reduces, an accounting mismatch.
Financial assets at fair value through profit or loss are carried in the statements of financial position at fair value with net changes in fair value recognized in the consolidated statements of comprehensive income within “Valuation of derivatives, interest cost from labor obligations and other financial items”.
Derecognition of financial assets
A financial asset is primarily derecognized when:
| | • | | The rights to receive cash flows from the asset have expired, or |
| | • | | The Company has transferred its rights to receive cash flows from the asset or has assumed an obligation to pay the received cash flows in full without material delay to a third party under a ‘pass-through’ arrangement; and either (a) the Company has transferred substantially all the risks and rewards of the asset, or (b) the Company has neither transferred nor retained substantially all the risks and rewards of the asset, but has transferred control of the asset |
When the Company has transferred its rights to receive cash flows from an asset or has entered into a passthrough arrangement, it evaluates if, and to what extent, it has retained the risks and rewards of ownership. When it has neither transferred nor retained substantially all the risks and rewards of the asset, nor transferred control of the asset, the Company continues to recognize the transferred asset to the extent of its continuing involvement. In that case, the Company also recognizes an associated liability. The transferred asset and the associated liability are measured on a basis that reflects the rights and obligations that the Company has retained.
Impairment of financial assets
The Company recognizes an allowance for expected credit losses (ECLs) for all debt instruments not held at fair value through profit or loss. ECLs are based on the difference between the contractual cash flows due in accordance with the contract and all the cash flows that the Company expects to receive, discounted at an approximation of the original effective interest rate. The expected cash flows will include cash flows from the sale of collateral held or other credit enhancements that are integral to the contractual terms.
ECLs are recognized in two stages. For credit exposures for which there has not been a significant increase in credit risk since initial recognition, ECLs are provided for credit losses that result from default events that are possible within the next12-months (a12-month ECL). For those credit exposures for which there has been a significant increase in credit risk since initial recognition, a loss allowance is required for credit losses expected over the remaining life of the exposure, irrespective of the timing of the default (a lifetime ECL).
F-24
Forsome trade receivables and contract assetsbased on available information, the Company applies the simplified approach in calculating ECLs. Therefore, the Company does not track changes in credit risk, but instead recognizes a loss allowance based on lifetime ECLs at each reporting date. The Company has established aloss rate approach that is based on its historical credit loss experience, adjusted for forward-looking factors specific to the debtors and the economic environment.
Financial liabilities
Initial recognition
Financial liabilities are classified, at initial recognition, as financial liabilities at fair value through profit or loss, loans and borrowings, payables, or as derivatives designated as hedging instruments in an effective hedge, as appropriate.
All financial liabilities are recognized initially at fair value and, in the case of loans and borrowings and payables, net of directly attributable transaction costs.
The Company’s financial liabilities include trade and other payables, loans and borrowings including bank overdrafts, and derivative financial instruments.
— Subsequent measurement
The measurement of financial liabilities depends on their classification, as described below:
Financial liabilities at fair value through profit or loss financial liabilities at fair value through profit or loss include financial liabilities held for trading and financial liabilities designated upon initial recognition as at fair value through profit or loss. IFRS
Financial liabilities are classified as held for trading if they are incurred for the purpose of repurchasing in the near term. This category also includes derivative financial instruments entered into by the Company that are not designated as hedging instruments in hedge relationships as defined by IFRS 9. Separated embedded derivatives are also classified as held for trading unless they are designated as effective hedging instruments.
Gains or losses on liabilities held for trading are recognized in the statements of profit or loss.
Financial liabilities designated upon initial recognition at fair value through profit or loss are designated at the initial date of recognition, and only if the criteria in IFRS 9 are satisfied. The Company has not designated any financial liability as at fair value through profit or loss.
Loans and borrowings
After initial recognition, interest-bearing loans and borrowings are subsequently measured at amortized cost using the EIR method. Gains and losses are recognized in profit or loss when the liabilities are derecognized as well as through the EIR amortization process.
Amortized cost is calculated by taking into account any discount or premium on acquisition and fees or costs that are an integral part of the EIR. The EIR amortization is included as finance costs in the statements of profit or loss.
Derecognition of financial liabilities
A financial liability is derecognized when the obligation under the liability is discharged, cancelled or expires. When an existing financial liability is replaced by another from the same lender on substantially different terms,
F-25
or the terms of an existing liability are substantially modified, such an exchange or modification is treated as the derecognition of the original liability and the recognition of a new liability. The difference in the respective carrying amounts is recognized in the statements of profit or loss.
Offsetting of financial instruments
Financial assets and financial liabilities are offset and the net amount is reported in the consolidated statements of financial position if there is a currently enforceable legal right to offset the recognized amounts and there is an intention to settle on a net basis, to realize the assets and settle the liabilities simultaneously.
o) Transactions in foreign currency
Transactions in foreign currency are initially recorded at the prevailing exchange rate at the time of the related transactions. Foreign currency denominated assets and liabilities are subsequently translated at the prevailing exchange rate at the financial statements reporting date. Exchange differences determined from the transaction date to the time foreign currency denominated assets and liabilities are settled or translated at the financial statements reporting date are charged or credited to the results of operations.
In determining the spot exchange rate to use on initial recognition of the related asset, expense or income (or part of it) on the derecognition of anon-monetary asset ornon-monetary liability relating to advance consideration, the date of the transaction is the date on which the Company initially recognizes thenon-monetary asset ornon-monetary liability arising from the advance consideration. If there are multiple payments or receipts in advance, the Company determines the transaction date for each payment or receipt of advance consideration.
The exchange rates used for the translation of foreign currencies against the Mexican peso are as follows:
| | | | | | | | | | | | | | | | | | | | | | |
| | | | | Average exchange rate | | | Closing exchange rate
at December 31, | |
Country or Zone | | Currency | | 2016 | | | 2017 | | | 2018 | | | 2017 | | | 2018 | |
Argentina (1) | | Argentine Peso (AR$) | | | 1.2632 | | | | 1.1489 | | | | 0.7311 | | | | 1.0610 | | | | 0.5221 | |
Brazil | | Real (R$) | | | 5.3868 | | | | 5.9346 | | | | 5.2937 | | | | 5.9815 | | | | 5.0797 | |
Colombia | | Colombian Peso (COP$) | | | 0.0061 | | | | 0.0064 | | | | 0.0065 | | | | 0.0066 | | | | 0.0061 | |
Guatemala | | Quetzal | | | 2.4548 | | | | 2.5755 | | | | 2.5591 | | | | 2.6940 | | | | 2.5440 | |
U.S.A.(2) | | US Dollar | | | 18.6529 | | | | 18.9400 | | | | 19.2397 | | | | 19.7867 | | | | 19.6829 | |
Uruguay | | Uruguay Peso | | | 0.6206 | | | | 0.6606 | | | | 0.6274 | | | | 0.6869 | | | | 0.6074 | |
Nicaragua | | Cordoba | | | 0.6515 | | | | 0.6307 | | | | 0.6097 | | | | 0.6428 | | | | 0.6088 | |
Honduras | | Lempira | | | 0.8109 | | | | 0.8007 | | | | 0.7994 | | | | 0.8330 | | | | 0.8031 | |
Chile | | Chilean Peso | | | 0.0276 | | | | 0.0292 | | | | 0.0300 | | | | 0.0322 | | | | 0.0283 | |
Paraguay | | Guaraní | | | 0.0033 | | | | 0.0034 | | | | 0.0034 | | | | 0.0035 | | | | 0.0033 | |
Peru | | Sol (PEN$) | | | 5.5232 | | | | 5.8054 | | | | 5.8517 | | | | 6.0976 | | | | 5.8406 | |
Dominican Republic | | Dominican Peso | | | 0.4048 | | | | 0.3983 | | | | 0.3876 | | | | 0.4095 | | | | 0.3898 | |
Costa Rica | | Colon | | | 0.0338 | | | | 0.0331 | | | | 0.0332 | | | | 0.0346 | | | | 0.0322 | |
European Union | | Euro | | | 20.6334 | | | | 21.3649 | | | | 22.7101 | | | | 23.7539 | | | | 22.5586 | |
Bulgaria | | Lev | | | 10.5483 | | | | 10.9223 | | | | 11.6110 | | | | 12.1406 | | | | 11.5327 | |
Belarus | | New Belarusian Ruble | | | 9.3929 | | | | 9.8087 | | | | 9.4451 | | | | 9.9882 | | | | 9.1319 | |
Croatia | | Croatian Kuna | | | 2.7392 | | | | 2.8619 | | | | 3.0613 | | | | 3.1954 | | | | 3.0435 | |
Macedonia | | Macedonian Denar | | | 0.3350 | | | | 0.3471 | | | | 0.3688 | | | | 0.3861 | | | | 0.3667 | |
Serbia | | Serbian Denar | | | 0.1676 | | | | 0.1762 | | | | 0.1920 | | | | 0.2009 | | | | 0.1907 | |
| (1) | Year-end rates are used for the translation of revenues and expenses if IAS 29 “Financial Reporting in Hyperinflationary Economies” is applied. |
| | Financial reporting in hyperinflationary economies |
F-26
| | Financial statements of Argentina subsidiaries are restated before translation to the reporting currency of the Company and before consolidation in order to reflect the same value of money for all items. Items recognized in the statements of financial position which are not measured at the applicableyear-end measuring unit are restated based on the general price index. Allnon-monetary items measured at cost or amortized cost is restated for the changes in the general price index from the date of transaction or the last hyperinflationary calculation to the reporting date. Monetary items are not restated. All items of shareholders’ equity are restated for the changes in the general price index since their addition or the last hyperinflationary calculation until the end of the reporting period. All items of comprehensive income are restated for the change in a general price index from the date of initial recognition to the reporting date. Gains and losses resulting from thenet-position of monetary items are reported in the consolidated statements of operations in financial result in exchange differences. In accordance with IFRS prior year financial statements were not restated. |
| (2) | Includes U.S.A., Ecuador, El Salvador, Puerto Rico and Panama. |
As of April 9, 2019, the exchange rate between the US dollar and the Mexican Peso was $18.9701.
p) Accounts payable, accrued liabilities and provisions
Liabilities are recognized whenever (i) the Company has current obligations (legal or assumed) resulting from a past event, (ii) when it is probable the obligation will give rise to a future cash disbursement for its settlement, and (iii) the amount of the obligation can be reasonably estimated.
When the effect of the time value of money is significant, the amount of the liability is determined as the present value of the expected disbursements to settle the obligation. The discount rate is determined on apre-tax basis and reflects current market conditions at the financial statements´ reporting date and, where appropriate, the risks specific to the liability. Where discounting is used, an increase in the liability is recognized as finance expense.
Contingent liabilities are recognized only when it is probable they will give rise to a future cash disbursement for their settlement.
Also, contingencies are only recognized when they will generate a loss.
q) Employee benefits
The Company has defined benefit pension plans for its subsidiaries Puerto Rico Telephone Company, Teléfonos de Mexico, Claro Brasil, and Telekom Austria. Claro Brasil also has medical plans and defined contribution plans and Telekom Austria provides retirement benefits to its employees under a defined contribution plan. The Company recognizes the costs of these plans based upon independent actuarial computations and are determined using the projected unit credit method. The latest actuarial computations were prepared as of December 31, 2018.
Mexico
Mexican subsidiaries have the obligation to pay seniority premiums to personnel based on the Mexican Federal labor law which also establishes the obligation to make certain payments to personnel who cease to provide services under certain circumstances. Pensions (for Telmex) and seniority premiums are determined based on the salary of employees in their final year of service, the number of years worked at and their age at the moment of retirement.
The costs of pensions, seniority premiums and severance benefits, are recognized based on calculations by independent actuaries using the projected unit credit method using financial hypotheses, net of inflation.
Telmex has established an irrevocable trust fund and makes annual contributions to that fund.
F-27
Puerto Rico
In Puerto Rico, the Company has noncontributing pension plans for full-time employees, which are tax qualified as they meet Employee Retirement Income Security Act of 1974 requirements.
The pension benefit is composed of two elements:
(i) An employee receives an annuity at retirement if they meet the rule of 85 (age at retirement plus accumulated years of service). The annuity is calculated by applying a percentage times years of services to the last three years of salary.
(ii) The second element is alump-sum benefit based on years of service ranging from 9 to 12 months of salary. Health care and life insurance benefits are also provided to retirees under a separate plan (post-retirement benefits).
Brazil
Claro Brasil provides a defined benefit plan and post-retirement medical assistance plan, and a defined contribution plan, through a pension fund that supplements the government retirement benefit for certain employees.
Under the defined benefit plan, the Company makes monthly contributions to the pension fund equal to 17.5% of the employee’s aggregate salary. In addition, the Company contributes a percentage of the aggregate salary base for funding the post-retirement medical assistance plan for the employees who remain in the defined benefit plan. Each employee makes contributions to the pension fund based on age and salary. All newly hired employees automatically adhere to the defined contribution plan and no further admittance to the defined benefit plan is allowed. For the defined contribution plan, see Note 17.
Austria
Telekom Austria provides retirement benefits to its employees under defined contribution and defined benefit plans.
The Company pays contributions to publicly or privately administered pension or severance insurance plans on mandatory or contractual basis. Once the contributions have been paid, the Company has no further payment obligations. The regular contributions are recognized as employee expenses in the year in which they are due.
All other employee benefit obligations provided in Austria are unfunded defined benefit plans for which the Company records provisions which are calculated using the projected unit credit method. The future benefit obligations are measured using actuarial methods on the basis of an appropriate assessment of the discount rate, rate of employee turnover, rate of compensation increase and rate of increase in pensions.
For severance and pensions, the subsidiary recognizes actuarial gains and losses in other comprehensive income. There-measurement of defined benefit plans relates to actuarial gains and losses only as Telekom Austria holds no plan assets. Interest expense related to employee benefit obligations is reported in“Valuation of derivatives, interests cost from labor obligation and other financial items, net” in the statements of comprehensive income.
Other subsidiaries
For the rest of the Company’s subsidiaries, there are no defined benefit plans or compulsory defined contribution structures. However, certain subsidiaries make contributions to national pension, social security and severance plans in accordance with the percentages and rates established by the applicable social security and labor laws of each country. Such contributions are made to the entities designated by the countries legislation and are recorded as direct labor expenses in the consolidated statements of comprehensive income as they are incurred.
F-28
Remeasurements of defined benefit plans, comprising of actuarial gains and losses, the effect of the asset ceiling, excluding net interest and the return on plan assets (excluding net interest), are recognized immediately in the consolidated statements of financial position with a corresponding debit or credit to retained earnings through OCI in the period in which they occur.Re-measurements are not reclassified to profit or loss in subsequent periods.
Past service costs are recognized in profit or loss on the earlier of:
| (i) | The date of the plan amendment or curtailment, and |
| (ii) | The date that the Company recognizes restructuring-related costs |
Net interest on liability for defined benefits is calculated by applying the discount rate to the net defined benefit liability or asset and it is recognized in the “valuation of derivatives, interest cost from labor obligations and other financial items” in the consolidated statements of comprehensive income. The Company recognizes the changes in the net defined benefit obligation under “Cost of sales and services” and “Commercial, administrative and general expenses” in the consolidated statements of comprehensive income.
Paid absences
The Company recognizes a provision for the cost of paid absences, such as vacation time, based on the accrual method.
r) Employee profit sharing
Employee profit sharing is paid by certain subsidiaries of the Company to its eligible employees. The Company has employee profit sharing in Mexico, Ecuador and Peru. In Mexico, employee profit sharing is computed at the rate of 10% on the individual subsidiaries taxable base adjusted for employee profit sharing purposes as provided by law.
Employee profit sharing is presented as an operating expense in the consolidated statements of comprehensive income.
s) Taxes
Income taxes
Current income tax payable is presented as a short-term liability, net of prepayments made during the year.
Deferred income tax is determined using the liability method based on the temporary differences between the tax values of the assets and liabilities and their book values at the consolidated financial statements reporting date.
Deferred tax assets and liabilities are measured using the tax rates that are expected to be in effect in the period when the asset will materialize or the liability will be settled, based on the enacted tax rates (and tax legislation) that have been enacted or substantially enacted at the financial statements reporting date. The value of deferred tax assets is reviewed by the Company at each financial statements reporting date and is reduced to the extent that it is more likely that the Company will not have sufficient future tax profits to allow for the realization of all or a part of its deferred tax assets. Unrecognized deferred tax assets are revalued at each financial statements reporting date and are recognized when it is more likely that there will be sufficient future tax profits to allow for the realization of these assets.
Deferred taxes relating to items recognized in Other Comprehensive Income are recognized together with the concept that generated such deferred taxes. Deferred taxes consequence on unremitted earnings from subsidiaries
F-29
and associates are considered as temporary differences, when the timing of the reversal of the temporary differences can be controlled and it is probable that the temporary differences will not reverse in the foreseeable future. Taxes withheld on remitted foreign earnings are creditable against Mexican taxes, thus to the extent that a remittance is to be made, the deferred tax would be limited to the incremental difference between the Mexican tax rate and the rate of the remitting country. As of December 31, 2017 and 2018, the Company has not provided for any deferred taxes related to unremitted foreign earnings.
The Company offsets tax assets and liabilities if it has a legally enforceable right to set off current tax assets and current tax liabilities and the deferred tax assets and deferred tax liabilities relate to income taxes levied by the same tax authority.
Sales tax
Revenues, expenses and assets are recognized net of the amount of sales tax, except:
| | • | | When the sales tax incurred on a purchase of assets or services is not recoverable from the taxation authority, in which case, the sales tax is recognized as part of the cost of acquisition of the asset or as part of the expense item, as applicable. |
| | • | | Receivables and payables that are stated with the amount of sales tax included. |
The net amount of sales tax recoverable from, or payable to, the tax authorities is included as part of the current receivables or payables in the consolidated statements of financial position unless they are due in more than a year in which case they are classified asnon-current.
t) Advertising
Advertising expenses are recognized as incurred. For the years ended December 31, 2016, 2017 and 2018, advertising expenses were Ps. 28,180,538, Ps. 28,718,563 and Ps. 26,255,952 , respectively, and are presented in the consolidated statements of comprehensive income in the caption “Commercial, administrative and general expenses”.
u) Earnings per share
Basic and diluted earnings per share are determined by dividing net profit of the year by the weighted-average number of shares outstanding during the year. In determining the weighted average number of outstanding shares, shares repurchased by the Company have been excluded.
v) Financial risks
The main risks associated with the Company’s financial instruments are: (i) liquidity risk, (ii) market risk (foreign currency exchange risk and interest rate risk) and (iii) credit risk and counterparty risk. The Board of Directors approves the policies submitted by management to mitigate these risks.
i) Liquidity risk
Liquidity risk is the risk that the Company may not meet its financial obligations associated with financial instruments when they are due. The Company’s financial obligations and commitments are included in Notes 14 and 16.
ii) Market risk
The Company is exposed to certain market risks derived from changes in interest rates and fluctuations in exchange rates of foreign currencies. The Company’s debt is denominated in foreign currencies, mainly in US
F-30
dollars and euros, other than its functional currency. In order to reduce the risks related to fluctuations in the exchange rate of foreign currency, the Company uses derivative financial instruments such as cross-currency swaps and forwards to adjust exposures resulting from foreign exchange currency. The Company does not use derivatives to hedge the exchange risk arising from having operations in different countries.
Additionally, the Company occasionally uses interest rate swaps to adjust its exposure to the variability of the interest rates or to reduce their financing costs. The Company’s practices vary from time to time depending on judgments about the level of risk, expectations of change in the movements of interest rates and the costs of using derivatives. The Company may terminate or modify a derivative financial instrument at any time. See Note 7 for disclosure of the fair value of derivatives as of December 31, 2017 and 2018.
iii) Credit risk
Credit risk represents the loss that could be recognized in case the counterparties fail to comply with their contractual obligations.
The financial instruments that potentially represent concentrations of credit risk are cash and short-term deposits, trade accounts receivable and financial instruments related to debt and derivatives. The Company’s policy is designed in order to limit its exposure to any one financial institution; therefore, the Company’s financial instruments are contracted with several different financial institutions located in different geographic regions.
The credit risk in accounts receivable is diversified because the Company has a broad customer base that is geographically dispersed. The Company continuously evaluates the credit conditions of its customers and generally does not require collateral to guarantee collection of its accounts receivable. The Company monitors on a monthly basis its collection cycle to avoid deterioration of its results of operations.
A portion of the Company’s cash surplus is invested in short- term deposits with financial institutions with high credit ratings.
iv) Sensitivity analysis for market risks
The Company uses sensitivity analyses to measure the potential losses based on a theoretical increase of 100 basis points in interest rates and a 5% fluctuation in exchange rates:
Interest rate
In the event that the Company’s agreed-upon interest rates at December 31, 2018 increased/(decreased) by 100 basis points, the increase in net interest expense would increase/(decrease) by Ps. 32,136,984 and Ps. (31,773,439), respectively.
Exchange rate fluctuations
Should the Company’s debt at December 31, 2018 of Ps. 638,922,453, suffer a 5% increase/(decrease) in exchange rates, the debt would increase/(decrease) by Ps. 3,165,958 and Ps. (10,940,798), respectively.
w) Derivative financial instruments
Derivative financial instruments are recognized in the consolidated statements of financial position at fair value. Valuations obtained by the Company are compared against those of the financial institutions with which the agreements are entered into, and it is the Company’s policy to compare such fair value to a valuation provided by an independent pricing provider in case of discrepancies. Changes in the fair value of derivatives that do not qualify as hedging instruments are recognized immediately in the line “Valuation of derivatives, interest cost from labor obligations and other financial items, net”.
F-31
The Company is exposed to interest rate and foreign currency risks, which tries to mitigate through a controlled risk management program that includes the use of derivative financial instruments. The Company principally uses to offset the risk of exchange rate and interest rate fluctuations. Additionally, for the years ended December 31, 2017 certain of the Company’s derivative financial instruments had been designated, and had qualified, as cash flow hedges. The effective portion of gains or losses on the cash flow derivatives is recognized in equity under the heading “Effect for fair value of derivatives”, and the ineffective portion is charged to results of operations of the period.
x) Current versusnon-current classification
The Company presents assets and liabilities in its consolidated statements of financial position based oncurrent/non-current classification.
An asset is current when it is either:
| (i) | Expected to be realized or intended to be sold or consumed in the normal operating cycle. |
| (ii) | Held primarily for the purpose of trading. |
| (iii) | Expected to be realized within twelve months after the reporting period. |
| (iv) | Cash and cash equivalents unless restricted from being exchanged or used to settle a liability for at least twelve months after the reporting period. |
A liability is current when:
| | • | | It is expected to be settled in the normal operating cycle. |
| | • | | It is held primarily for the purpose of trading. |
| | • | | It is due to be settled within twelve months after the reporting period. |
| | • | | There is no unconditional right to defer the settlement of the liability for at least twelve months after the reporting period. |
The Company classifies all other assets and liabilities, including deferred tax assets and liabilities, asnon-current.
y) Presentation of consolidated statements of comprehensive income
The costs and expenses shown in the consolidated statements of comprehensive income are presented in combined manner (based on both their function and nature), which allows a better understanding of the components of the Company’s operating income. This classification allows a comparison to the telecommunications industry.
The Company presents operating income in its consolidated statements of comprehensive income since it is a key indicator of the Company’s performance. Operating income represents operating revenues less operating costs and expenses.
The employee benefits expense recognized for the years ended December 31, 2016, 2017 and 2018 of Ps. 46,759,415, Ps. 48,696,331 and Ps. 47,671,143, respectively is presented as “Cost of sales and services” and of Ps. 63,691,855, Ps. 66,920,537 and Ps. 67,936,876, respectively is presented in “Commercial, administrative and general expenses”.
z) Operating segments
Segment information is presented based on information used by management in its decision-making processes. Segment information is presented based on the geographic areas in which the Company operates.
F-32
The management of the Company is responsible for making decisions regarding the resources to be allocated to the Company’s different segments, as well as evaluating the performance of each segment. Intersegment revenues and costs, intercompany balances as well as investments in shares in consolidated entities are eliminated upon consolidation and reflected in the “eliminations” column in Note 22.
None of the segments records revenue from transactions with a single external customer amounting to 10% or more of the revenues.
Aa) Convenience translation
At December 31, 2018, amounts in U.S. dollars have been included in the consolidated financial statements solely for the convenience of the reader and amounts this translation is not accordance with IFRS have been translated from Mexican pesos at December 31, 2018 at an exchange rate of Ps. 19.6829 per U.S. dollar, which was the exchange rate at that date. Such translation should not be construed as a representation that the Mexican peso can be converted to U.S. dollars at the exchange rate in effect on December 31, 2018 or any other exchange rate.
Ab) Significant accounting judgments, estimates and assumptions
In preparing its consolidated financial statements, the Company makes estimates concerning a variety of matters. Some of these matters are highly uncertain, and its estimates involve judgments it makes based on the available information. In the discussion below, the Company has identified several of these matters for which its financial statements would be materially affected if either (1) the Company uses different estimates that it could have reasonably used or (2) in the future América Móvil changes its estimates in response to changes that are reasonably likely to occur.
The following discussion addresses only those estimates that the Company considers most important based on the degree of uncertainty and the likelihood of a material impact had it used a different estimate. There are many other areas in which the Company uses estimates about uncertain matters, but the reasonably likely effect of changed or different estimates is not material to the financial presentation for those other areas.
Estimated useful lives of plant, property and equipment
The Company currently depreciates most of its network infrastructure based on an estimated useful life determined upon the expected particular conditions of operation and maintenance in each of the countries in which it operates. The estimates are based on AMX’s historical experience with similar assets, anticipated technological changes and other factors, taking into account the practices of other telecommunications companies. The Company reviews estimated useful lives each year to determine, for each particular class of assets, whether they should be changed. The Company may shorten/extend the estimated useful life of an asset class in response to technological changes, changes in the market or other developments. This results in increased/decreased depreciation expense. See Notes 2j) and 10.
Impairment of Long-Lived Assets
The Company has large amounts of long-lived assets, including property, plant and equipment, intangible assets, investments in affiliates and goodwill on its consolidated statements of financial position. The Company is required to test long-lived assets for impairment when circumstances indicate a potential impairment or, in some cases, at least on an annual basis. The impairment analysis for long-lived assets requires the Company to estimate the recoverable amount of the asset, which is the higher of its fair value (minus any disposal costs) and its value in use. To estimate the fair value of a long-lived asset, the Company typically takes into account recent market transactions or, if no such transactions can be identified, the Company uses a valuation model that requires making certain assumptions and estimates. Similarly, to estimate the value in use of long-lived assets, the
F-33
Company typically makes various assumptions about the future prospects for the business to which the asset relates, considers market factors specific to that business and estimates future cash flows to be generated by that business. Based on this impairment analysis, including all assumptions and estimates related thereto, as well as guidance provided by IFRS relating to the impairment of long-lived assets different assumptions and estimates could materially impact the Company’s reported financial results. More conservative assumptions of the anticipated future benefits from these businesses could result in impairment charges, which would decrease net income and result in lower asset values on the consolidated statements of financial position. Conversely, less conservative assumptions could result in smaller or no impairment charges, higher net income and higher asset values. The key assumptions used to determine the recoverable amount for the Company’s CGUs, are further explained in Notes 2l), 10 and 11.
Deferred Income Taxes
The Company is required to estimate its income taxes in each of the jurisdictions in which it operates. This process involves thejurisdiction-by-jurisdiction estimation of actual current tax exposure and the assessment of temporary differences resulting from the differing treatment of certain items, such as accruals and amortization, for tax and financial reporting purposes, as well as net operating loss carry-forwards and other tax credits. These items result in deferred tax assets and liabilities as discussed in Note 2 s). The analysis is based on estimates of taxable income in the jurisdictions in which the Company operates and the period on which the deferred tax assets and liabilities will be recovered or settled. If actual results differ from these estimates, or the Company adjusts these estimates in future periods, its financial position and results of operations may be materially affected.
In assessing the future realization of deferred tax assets, the Company considers future taxable income, ongoing planning strategies and future results in its operations. In the event that the estimates of projected future taxable income are lowered, or changes in current tax regulations are enacted that would impose restrictions on the timing or extent of the ability to utilize the tax benefits of net operating loss carry-forwards in the future, an adjustment to the recorded amount of deferred tax assets would be made, with a related charge to income. See Note 13.
Accruals
Accruals are recorded when, at the end of the period, the Company has a present obligation as a result of past events, whose settlement requires an outflow of resources that is considered probable and can be measured reliably. This obligation may be legal or constructive, arising from, but not limited to, regulation, contracts, common practice or public commitments, which have created a valid expectation for third parties that the Company will assume certain responsibilities. The amount recorded is the best estimation performed by the Company’s management in respect of the disbursement that will be required to settle the obligations, considering all the information available at the date of the financial statements, including the opinion of external experts, such as legal advisors or consultants. Accruals are adjusted to account for changes in circumstances for ongoing matters and the establishment of additional accruals for new matters.
If the Company is unable to reliably measure the obligation, no accrual is recorded and information is then presented in the notes to its consolidated financial statements. Because of the inherent uncertainties in these estimations, actual expenditures may be different from the originally estimated amount recognized. See Note 15.
The Company is subject to various claims and contingencies related to tax, labor and legal proceedings as described in Note 16c).
F-34
Labor Obligations
The Company recognizes liabilities on its consolidated statements of financial position and expenses in its statements of comprehensive income to reflect its obligations related to its post-retirement seniority premiums, pension and retirement plans in the countries in which it operates and offer defined contribution and benefit pension plans. The amounts the Company recognizes are determined on an actuarial basis that involves estimations and accounts for post-retirement and termination benefits.
The Company uses estimates in four specific areas that have a significant effect on these amounts: (i) the rate of return the Company assumes its pension plans will earn on its investments, (ii) the salaries increase rate that the Company assumes it will observe in future years, (iii) the discount rates that the Company uses to calculate the present value of its future obligations and (iv) the expected inflation rate. The assumptions applied are further disclosed in Note 17. These estimates are determined based on actuarial studies performed by independent experts using the projected unit-credit method.
ac) Retrospective adjustment
The following amounts in the consolidated statements of comprehensive income for the years ended December 31, 2016 and 2017, have been retrospectively reclassified to conform to the presentation for the year ended December 31, 2018.
In the Consolidated Statements of Comprehensive Income:
| | | | | | | | | | | | |
| | | As reported
2016 | | | Retrospective
reclassification | | | 2016
As adjustments | |
Operating revenues: | | | | | | | | | | | | |
Mobile voice services | | Ps. | 242,302,380 | | | Ps. | (242,302,380 | ) | | Ps. | — | |
Fixed voice services | | | 95,299,154 | | | | (95,299,154 | ) | | | — | |
Mobile data services | | | 256,936,895 | | | | (256,936,895 | ) | | | — | |
Fixed data services | | | 126,278,206 | | | | (126,278,206 | ) | | | — | |
Pay television | | | 78,268,778 | | | | (78,268,778 | ) | | | — | |
Other related services | | | 32,799,952 | | | | (32,799,952 | ) | | | — | |
Revenues services | | | — | | | | 831,885,365 | | | | 831,885,365 | |
| | | | | | | | | | | | |
| | Ps. | 831,885,365 | | | Ps. | — | | | Ps. | 831,885,365 | |
| | | | | | | | | | | | |
| | | | | | | | | | | | |
| | | As reported
2017 | | | Retrospective
reclassification | | | 2017
As adjustments | |
Operating revenues: | | | | | | | | | | | | |
Mobile voice services | | Ps. | 221,751,600 | | | Ps. | (221,751,600 | ) | | Ps. | — | |
Fixed voice services | | | 89,856,743 | | | | (89,856,743 | ) | | | — | |
Mobile data services | | | 308,526,994 | | | | (308,526,994 | ) | | | — | |
Fixed data services | | | 139,277,613 | | | | (139,277,613 | ) | | | — | |
Pay television | | | 86,882,606 | | | | (86,882,606 | ) | | | — | |
Other related services | | | 32,115,767 | | | | (32,115,767 | ) | | | — | |
Revenues services | | | — | | | | 878,411,323 | | | | 878,411,323 | |
| | | | | | | | | | | | |
| | Ps. | 878,411,323 | | | Ps. | — | | | Ps. | 878,411,323 | |
| | | | | | | | | | | | |
3. Cash and Cash Equivalents
Cash and cash equivalents are comprised of short-term deposits with different financial institutions. Cash equivalents only include instruments with purchased maturity of less than three months. The amount includes the amount deposited, plus any interest earned.
F-35
4. Equity investments at fair value through OCI and other short-term investments
As of December 31, 2017 and 2018, equity investments at fair value through OCI and other short-term investments includes an equity investments in KPN for Ps. 46,682,657 and Ps. 39,028,083, respectively, and other short-term investments for Ps. 12,438,019 and Ps. 9,987,851, respectively.
The investment in KPN is carried at fair value with changes in fair value being recognized through other comprehensive (loss) items (equity) in the Company’s consolidated statements of financial position. As of December 31, 2017 and 2018, the Company has recognized in equity changes in fair value of the investment of Ps. 622,424 and Ps. (3,765,688), respectively, net of deferred taxes, through other comprehensive (loss) gain items in equity.
During the years ended December 31, 2016, 2017 and 2018, the Company received dividends from KPN for an amount of Ps. 5,740,092, Ps. 2,370,559 and Ps. 2,605,333, respectively; which are included within “Valuation of derivatives, interest cost from labor obligations, and other financial items, net” in the consolidated statements of comprehensive income. Another short-term investment item of Ps. 9,987,851, as of December 31, 2018 (Ps. 12,438,019 in 2017) represents a cash deposit used to guarantee a short-term obligation for one of the Company’s foreign subsidiaries and are presented at their carrying value, which approximates fair value.
5. Accounts receivable from subscribers, distributors, recoverable taxes contractual assets and other, net
a)An analysis of accounts receivable by component at December 31, 2017 and 2018 is as follows:
| | | | | | | | |
| | | At December 31, | |
| | | 2017 | | | 2018 | |
Subscribers and distributors | | Ps. | 178,722,706 | | | Ps. | 173,053,226 | |
Telecommunications carriers for network interconnection and other services | | | 8,671,416 | | | | 5,543,263 | |
Recoverable taxes(i) | | | 40,477,188 | | | | 46,706,298 | |
Sundry debtors | | | 14,736,340 | | | | 12,685,281 | |
Contractual assets (Note 2i, a) | | | — | | | | 34,718,749 | |
Impairment of trade receivables | | | (39,044,925 | ) | | | (40,798,025 | ) |
| | | | | | | | |
Total net | | Ps. | 203,562,725 | | | Ps. | 231,908,792 | |
| | | | | | | | |
Non-current subscribers, distributors and contractual assets | | | 9,786,581 | | | | 15,681,872 | |
| | | | | | | | |
Total current subscribers, distributors and contractual assets | | Ps. | 193,776,144 | | | Ps. | 216,226,920 | |
| | | | | | | | |
| (i) | In accordance with the favorable resolution obtained from the authorities, in 2018 the subsidiary Claro Brasil recognized a benefit for the exclusion of the Tax on the Circulation of Goods and the Provision of Services (Imposto sobre a Circulação de Mercadorias e Prestação de Serviços, or “ICMS “) in the calculation bases of the Social Integration Program (Social Integration Program, or” PIS “) and the Contribution for the Financing of Social Security (Contribution to or Financing of Social Security, or” COFINS “) in the amount total of Ps. 12,295,869, that includes interest of Ps. 6,127,656. The asset was recognized based on the certainty of obtaining the economic benefit. |
F-36
b) Changes in the allowance for expected credit losses is as follows:
| | | | | | | | | | | | |
| | | For the years ended December 31, | |
| | | 2016 | | | 2017 | | | 2018 | |
Balance at beginning of year | | Ps. | (27,495,158 | ) | | Ps. | (37,351,677 | ) | | Ps. | (39,044,925 | ) |
Increases recorded in expenses | | | (16,987,769 | ) | | | (20,766,362 | ) | | | (19,535,707 | ) |
Adjustment on initial application of IFRS 9 (Note 2i, b) | | | — | | | | — | | | | (2,400,783 | ) |
Write-offs | | | 12,587,567 | | | | 17,713,992 | | | | 15,497,254 | |
Translation effect | | | (5,456,317 | ) | | | 1,359,122 | | | | 4,686,136 | |
| | | | | | | | | | | | |
Balance at end of year | | Ps. | (37,351,677 | ) | | Ps. | (39,044,925 | ) | | Ps. | (40,798,025 | ) |
| | | | | | | | | | | | |
c) The following table shows the aging of accounts receivable at December 31, 2017 and 2018, for subscribers and distributors:
| | | | | | | | | | | | | | | | | | | | | | | | |
| | | Past due | |
| | | Total | | | Unbilled services
provided | | | a-30 days | | | 31-60 days | | | 61-90 days | | | Greater than
90 days | |
December 31, 2017 | | | Ps. 178,722,706 | | | | Ps. 78,384,174 | | | | Ps. 46,758,825 | | | | Ps. 6,780,671 | | | | Ps. 4,375,188 | | | | Ps. 42,423,848 | |
December 31, 2018 | | | Ps. 173,053,226 | | | | Ps. 62,623,654 | | | | Ps. 46,816,302 | | | | Ps. 6,315,277 | | | | Ps. 4,168,952 | | | | Ps. 53,129,041 | |
d) The following table shows the accounts receivable from subscribers and distributors included in the impairments of trade receivables, as of December 31, 2017 and 2018:
| | | | | | | | | | | | |
| | | Total | | | 1-90 days | | | Greater than
90 days | |
December 31, 2017 | | | Ps. 39,044,925 | | | | Ps. 3,807,945 | | | | Ps. 35,236,980 | |
December 31, 2018 | | | Ps. 40,798,025 | | | | Ps. 4,079,803 | | | | Ps. 36,718,222 | |
e) An analysis of contract assets and liabilities at December 31, 2018 is as follows:
| | | | |
| | | 2018 | |
Contract Assets: | | | | |
Balance at the beginning of the year | | Ps. | 29,640,953 | |
Additions | | | 32,029,279 | |
Disposals | | | (25,243,487 | ) |
Translation effect | | | (1,707,996 | ) |
| | | | |
Balance at the end of the year | | Ps. | 34,718,749 | |
Non-current contract assets | | Ps. | 5,437,263 | |
| | | | |
Current portion contracts assets | | Ps. | 29,281,486 | |
F-37
6. Related Parties
a) The following is an analysis of the balances with related parties as of December 31, 2017 and 2018. All of the companies were considered affiliates of América Móvil since the Company’s principal shareholders are either direct or indirect shareholders in the related parties.
| | | | | | | | |
| | | 2017 | | | 2018 | |
Accounts receivable: | | | | | | | | |
Sears Roebuck de México, S.A. de C.V. | | Ps. | 211,491 | | | Ps. | 264,976 | |
Sanborns Hermanos, S.A. | | | 91,233 | | | | 312,706 | |
Patrimonial Inbursa, S.A. | | | 246,874 | | | | 214,180 | |
Carso Infraestructura y Construcción, S.A. de C.V. and Subsidiaries | | | 89,585 | | | | 179,852 | |
Grupo Condumex, S.A. de C.V. and Subsidiaries | | | 47,269 | | | | 35,007 | |
Operadora de Sites Mexicanos, S.A. de C.V. | | | 14,252 | | | | 16,634 | |
Other | | | 167,526 | | | | 240,250 | |
| | | | | | | | |
Total | | Ps. | 868,230 | | | Ps. | 1,263,605 | |
| | | | | | | | |
| | |
| | | 2017 | | | 2018 | |
Accounts payable: | | | | | | | | |
Carso Infraestructura y Construcción, S.A. de C.V. and Subsidiaries | | Ps. | 947,761 | | | Ps. | 1,403,414 | |
Grupo Condumex, S.A. de C.V. and Subsidiaries | | | 812,427 | | | | 784,678 | |
Grupo Financiero Inbursa, S.A.B. de C.V. | | | 38,847 | | | | 235,745 | |
Fianzas Guardiana Inbursa, S.A. de C.V. | | | 276,633 | | | | 227,014 | |
PC Industrial, S.A. de C.V. and Subsidiaries | | | 136,859 | | | | 83,502 | |
Enesa, S.A. de C.V. and Subsidiaries | | | 50,609 | | | | 22,630 | |
Other | | | 277,276 | | | | 217,230 | |
| | | | | | | | |
Total | | Ps. | 2,540,412 | | | Ps. | 2,974,213 | |
| | | | | | | | |
For the years ended December 31, 2016, 2017 and 2018, the Company has not recorded any impairment of receivables in connection with amounts owed by related parties.
F-38
b) For the years ended December 31, 2016, 2017 and 2018, the Company conducted the following transactions with related parties:
| | | | | | | | | | | | |
| | | 2016 | | | 2017 | | | 2018 | |
Investments and expenses: | | | | | | | | | | | | |
Construction services, purchases of materials, inventories and property, plant and equipment (i) | | Ps. | 9,917,280 | | | Ps. | 11,030,944 | | | Ps. | 7,211,960 | |
Rent of towers | | | 4,748,503 | | | | 5,326,366 | | | | 6,168,592 | |
Insurance premiums, fees paid for administrative and operating services, brokerage services and others(ii) | | | 4,118,469 | | | | 4,135,578 | | | | 4,134,380 | |
Other services | | | 1,899,818 | | | | 2,802,667 | | | | 1,864,017 | |
| | | | | | | | | | | | |
| | Ps. | 20,684,070 | | | Ps. | 23,295,555 | | | Ps. | 19,378,949 | |
| | | | | | | | | | | | |
Revenues: | | | | | | | | | | | | |
Revenues services | | Ps. | 411,076 | | | Ps. | 416,047 | | | Ps. | 679,220 | |
Sales of equipment | | | 2,679,591 | | | | 2,313,840 | | | | 1,296,204 | |
| | | | | | | | | | | | |
| | Ps. | 3,090,667 | | | Ps. | 2,729,887 | | | Ps. | 1,975,424 | |
| | | | | | | | | | | | |
| i) | In 2018, this amount includes Ps.5,622,791 (Ps. 9,829,991 in 2017 and Ps. 9,547,530 in 2016) for network construction services and construction materials purchased from subsidiaries of Grupo Carso, S.A.B. de C.V. (Grupo Carso). |
| ii) | In 2018, this amount includes Ps. 778,191 (Ps. 789,253 in 2017 and Ps. 812,247 in 2016) for network maintenance services performed by Grupo Carso subsidiaries; Ps. 13,784 in 2018 (Ps. 15,695 in 2017, and Ps. 705,074 in 2016) for software services provided by an associate; Ps. 2,541,703 in 2018 (Ps. 3,330,038 in 2017 and Ps. 2,406,058 in 2016) for insurance premiums with Seguros Inbursa S.A. and Fianzas Guardiana Inbursa, S.A., which, in turn, places most of such insurance with reinsurers. |
c) The aggregate compensation paid to the Company’s, directors (including compensation paid to members of the Audit and Corporate Practices Committee), and senior management in 2018 was approximately Ps. 5,300 and Ps. 70,100, respectively. None of the Company’s directors is a party to any contract with the Company or any of its subsidiaries that provides for benefits upon termination of employment. The Company does not provide pension, retirement or similar benefits to its directors in their capacity as directors. The Company’s executive officers are eligible for retirement and severance benefits required by Mexican law on the same terms as all other employees.
d) Österreichische Bundes- und Industriebeteiligungen GmbH (ÖBIB) is considered a related party due to it is a significantnon-controlling shareholder in Telekom Austria. Through Telekom Austria, América Móvil is related to the Republic of Austria and its subsidiaries, which are mainly ÖBB Group, ASFINAG Group and Post Group as well as Rundfunk und Telekom Reguliegungs-GmbH, all of which these are related parties. In 2016, 2017 and 2018, none of the individual transactions associated with government agencies or government-owned entities of Austria were considered significant to América Móvil.
7. Derivative Financial Instruments
To mitigate the risks of future increases in interest rates and foreign exchange rates for the servicing of its debt, the Company has entered into derivative contracts inover-the-counter transactions carried out with financial institutions. In 2018 the weighted-average interest rate of the total debt including the impact of interest rate derivatives held by the Company is 4.1% (4.0% and 3.7% in 2017 and 2016, respectively).
F-39
An analysis of the derivative financial instruments contracted by the Company at December 31, 2017 and 2018 is as follows:
| | | | | | | | | | | | | | | | |
| | | At December 31, | |
| | | 2017 | | | 2018 | |
Instrument | | Notional amount in
millions | | | Fair Value | | | Notional amount in
millions | | | Fair Value | |
Assets: | | | | | | | | | | | | | | | | |
Swaps US Dollar-Mexican peso | | US$ | 2,800 | | | | Ps.4,766,102 | | | US$ | 3,490 | | | | Ps. 2,058,831 | |
Swaps Euro-Mexican peso | | € | — | | | | — | | | | — | | | | — | |
SwapsYen-US Dollar | | ¥ | 13,000 | | | | 521,270 | | | ¥ | 13,000 | | | | 581,948 | |
Forwards US Dollar-Mexican peso | | US$ | 1,744 | | | | 1,600,666 | | | | — | | | | — | |
Forwards USDollar-Brazilian real | | US$ | 100 | | | | 44,280 | | | US$ | 150 | | | | 126,287 | |
Swaps SwissFranc-US Dollar | | CHF | 475 | | | | 178,710 | | | | — | | | | — | |
SwapsEuro-Brazilian real | | € | 450 | | | | 359,671 | | | € | 300 | | | | 1,080,552 | |
Interest rate swap | | | Ps.200 | | | | 916 | | | | — | | | | — | |
Forwards Brazilian Real-US Dollar | | | — | | | | — | | | BRL $ | 2,823 | | | | 1,107,630 | |
ForwardsEuro-Brazilian real | | € | 400 | | | | 330,427 | | | € | 150 | | | | 123,005 | |
Forwards US Dollar-Swiss franc | | CHF | 75 | | | | 121,981 | | | | — | | | | — | |
ForwardsEuro-US Dollar | | € | 204 | | | | 113,361 | | | € | 710 | | | | 209,295 | |
| | | | | | | | | | | | | | | | |
Total Assets | | | | | | | Ps. 8,037,384 | | | | | | | | Ps. 5,287,548 | |
| | | | | | | | | | | | | | | | |
| | | | | | | | | | | | | | | | |
| | | At December 31, | |
| | | 2017 | | | 2018 | |
Instrument | | Notional amount in
millions | | | Fair Value | | | Notional amount in
millions | | | Fair Value | |
Liabilities: | | | | | | | | | | | | | | | | |
Swaps US Dollar-Euro | | US$ | 2,092 | | | Ps. | (8,340,970) | | | US$ | 2,025 | | | Ps. | (5,114,863) | |
Swaps Pound sterling-Euro | | £ | 740 | | | | (3,376,091) | | | £ | 740 | | | | (4,027,312) | |
Swap Poundsterling-US Dollar | | £ | 2,010 | | | | (1,676,636) | | | £ | 2,010 | | | | (5,836,607) | |
Forwards US Dollar-Mexican Peso | | | — | | | | — | | | US$ | 977 | | | | (772,704) | |
Forwards Euro-US Dollar | | | — | | | | — | | | € | 950 | | | | (333,586) | |
Call spread option | | € | 750 | | | | (48,422) | | | | — | | | | — | |
Put option | | € | 374 | | | | (482,645) | | | € | 374 | | | | (988,669) | |
Call spread option | | € | 3,000 | | | | (434,696) | | | € | 3,000 | | | | (33,838) | |
| | | | | | | | | | | | | | | | |
Total Liabilities | | | | | | Ps. | (14,359,460) | | | | | | | Ps. | (17,107,579) | |
| | | | | | | | | | | | | | | | |
Non-current liability | | | | | | Ps. | (3,756,921) | | | | | | | Ps. | (3,567,863) | |
| | | | | | | | | | | | | | | | |
Total current liability | | | | | | Ps. | (10,602,539) | | | | | | | Ps. | (13,539,716) | |
| | | | | | | | | | | | | | | | |
The changes in the fair value of these derivative financial instruments for the years ended December 31, 2016, 2017 and 2018 amounted to a gain (loss) of Ps. (9,622,233), Ps. 8,192,567 and Ps. (4,686,407). Such amounts are included in the consolidated statements of comprehensive income as part of the caption “Valuation of derivatives interest cost from labor obligations and other financial items, net”.
F-40
The maturities of the notional amount of the derivatives are as follows:
| | | | | | | | | | | | | | | | | | | | | | | | |
Instrument | | Notional
amount in
millions | | | 2019 | | | 2020 | | | 2021 | | | 2022 | | | 2023 Thereafter | |
Assets | | | | | | | | | | | | | | | | | | | | | | | | |
Swaps US Dollar-Mexican peso | | US$ | | | | | — | | | | — | | | | — | | | | 1,600 | | | | 1,890 | |
SwapsYen-US Dollar | | ¥ | | | | | — | | | | — | | | | — | | | | — | | | | 13,000 | |
SwapsEuro-Brazilian real | | € | | | | | 300 | | | | — | | | | — | | | | — | | | | — | |
Forwards Brazilian Real-US Dollar | | | BRL | | | | 1,680 | | | | — | | | | 1,143 | | | | — | | | | — | |
Forwards Euro-Brazilian Real | | € | | | | | 150 | | | | — | | | | — | | | | — | | | | — | |
Forwards US Dollar-Brazilian Real | | US$ | | | | | 150 | | | | — | | | | — | | | | — | | | | — | |
Forwards Euro-US Dollar | | € | | | | | 710 | | | | — | | | | — | | | | — | | | | — | |
Liabilities | | | | | | | | | | | | | | | | | | | | | | | | |
Swaps US Dollar-Euro | | US$ | | | | | 25 | | | | — | | | | — | | | | — | | | | 2,000 | |
Swaps Pound sterling-Euro | | £ | | | | | — | | | | — | | | | — | | | | — | | | | 740 | |
Swap Poundsterling-US Dollar | | £ | | | | | — | | | | 550 | | | | — | | | | — | | | | 1,460 | |
Forwards US Dollar-Mexican Peso | | US$ | | | | | 977 | | | | — | | | | — | | | | — | | | | — | |
Forwards Euro-US Dollar | | € | | | | | 950 | | | | — | | | | — | | | | — | | | | — | |
Put option | | € | | | | | — | | | | — | | | | — | | | | — | | | | 374 | |
Call spread option | | € | | | | | — | | | | 3,000 | | | | — | | | | — | | | | — | |
8. Inventories, net
An analysis of inventories at December 31, 2017 and 2018 is as follows:
| | | | | | | | |
| | | 2017 | | | 2018 | |
Mobile phones, accessories, computers, TVs, cards and other materials | | | Ps. 42,262,511 | | | | Ps. 43,723,492 | |
Less: Reserve for obsolete and slow-moving inventories | | | (3,452,946 | ) | | | (3,418,130 | ) |
| | | | | | | | |
Total | | | Ps. 38,809,565 | | | | Ps. 40,305,362 | |
| | | | | | | | |
For the years ended December 31, 2016, 2017 and 2018, the cost of inventories recognized in cost of sales was Ps. 172,495,376, Ps. 170,154,336 and Ps. 180,013,986 respectively.
F-41
9. Other assets, net
An analysis of other assets at December 31, 2017 and 2018 is as follows:
| | | | | | | | |
| | | 2017 | | | 2018 | |
Current portion: | | | | | | | | |
Advances to suppliers (different from PP&E and inventories) | | | Ps. 9,536,654 | | | | Ps. 12,931,247 | |
Prepaid insurance | | | 683,091 | | | | 949,590 | |
Costs of mobile equipment and computers associated with deferred revenues | | | 6,182,010 | | | | 599,628 | |
Other | | | 950,991 | | | | 815,728 | |
| | | | | | | | |
| | | Ps. 17,352,746 | | | | Ps.15,296,193 | |
| | | | | | | | |
Non-current portion: | | | | | | | | |
Recoverable taxes | | | Ps. 12,249,372 | | | | Ps. 11,514,455 | |
Prepayments for the use of fiber optics | | | 4,361,668 | | | | 3,985,216 | |
Prepaid expenses and judicial deposits (1) | | | 25,926,436 | | | | 26,961,930 | |
| | | | | | | | |
Total | | | Ps. 42,537,476 | | | | Ps. 42,461,601 | |
| | | | | | | | |
For the years ended December 31, 2016, 2017 and 2018, amortization expense for other assets was Ps. 1,340,609, Ps. 620,680 and Ps. 798,243, respectively.
| (1) | Judicial deposits represent cash and cash equivalents pledged in order to fulfill the collateral requirements for tax contingencies mainly in Brazil. At December 31, 2017 and 2018, the amount for these deposits is Ps. 20,288,382 and Ps. 18,172,342, respectively. Based on its evaluation of the underlying contingencies, the Company believes that such amounts are recoverable. |
10. Property, Plant and Equipment, net
a)An analysis of property, plant and equipment, net at December 31, 2016, 2017 and 2018 is as follows:
| | | | | | | | | | | | | | | | | | | | | | | | | | | | |
| | | At December 31,
2015 | | | Additions | | | Retirements | | | Business
combinations | | | Translation
effect of Foreign
Subsidiaries | | | Depreciation
for
the year | | | At December 31,
2016 | |
Cost | | | | |
Network in operation and equipment | | Ps. | 641,384,702 | | | Ps. | 101,794,197 | | | Ps. | (8,963,076 | ) | | Ps. | 1,873,445 | | | Ps. | 235,186,745 | | | Ps. | — | | | Ps. | 971,276,013 | |
Land and buildings | | | 54,794,386 | | | | 2,900,511 | | | | (2,845,298 | ) | | | 3,839 | | | | 7,281,973 | | | | — | | | | 62,135,411 | |
Other assets | | | 106,468,602 | | | | 24,368,918 | | | | (10,717,096 | ) | | | 69,937 | | | | 24,736,655 | | | | — | | | | 144,927,016 | |
Construction in process and advances plant suppliers(1) | | | 38,850,776 | | | | 70,517,319 | | | | (70,911,593 | ) | | | 11,255 | | | | 11,252,127 | | | | — | | | | 49,719,884 | |
Spare parts for operation of the network | | | 20,342,389 | | | | 34,010,751 | | | | (27,641,919 | ) | | | 5,520 | | | | 1,566,307 | | | | — | | | | 28,283,048 | |
| | | | | | | | | | | | | | | | | | | | | | | | | | | | |
Total | | | 861,840,855 | | | | 233,591,696 | | | | (121,078,982 | ) | | | 1,963,996 | | | | 280,023,807 | | | | — | | | | 1,256,341,372 | |
| | | | | | | | | | | | | | | | | | | | | | | | | | | | |
Accumulated depreciation | | | | | | | | | | | | | | | | | | | | | | | | | | | | |
Network in operation and equipment | | | 236,731,728 | | | | — | | | | (1,968,376 | ) | | | — | | | | 153,147,349 | | | | 107,976,385 | | | | 495,887,086 | |
Buildings | | | 4,567,588 | | | | — | | | | (975,284 | ) | | | — | | | | 3,709,952 | | | | 3,179,066 | | | | 10,481,322 | |
Other assets | | | 47,057,084 | | | | — | | | | (25,099,710 | ) | | | — | | | | 10,396,438 | | | | 16,105,885 | | | | 48,459,697 | |
Spare parts for operation of the network | | | (44,423 | ) | | | — | | | | (54,280 | ) | | | — | | | | 20,896 | | | | 401,008 | | | | 323,201 | |
| | | | | | | | | | | | | | | | | | | | | | | | | | | | |
Total | | Ps. | 288,311,977 | | | Ps. | — | | | Ps. | (28,097,650 | ) | | Ps. | — | | | Ps. | 167,274,635 | | | Ps. | 127,662,344 | | | Ps. | 555,151,306 | |
| | | | | | | | | | | | | | | | | | | | | | | | | | | | |
Net Cost | | Ps. | 573,528,878 | | | Ps. | 233,591,696 | | | Ps. | (92,981,332 | ) | | Ps. | 1,963,996 | | | Ps. | 112,749,172 | | | Ps. | (127,662,344 | ) | | Ps. | 701,190,066 | |
| | | | | | | | | | | | | | | | | | | | | | | | | | | | |
F-42
| | | | | | | | | | | | | | | | | | | | | | | | | | | | |
| | | At December 31,
2016 | | | Additions | | | Retirements | | | Business
combinations | | | Effect of
translation
of foreign
subsidiaries | | | Depreciation
for
the year | | | At December 31,
2017 | |
Cost | | | | | | | | | | | | | | | | | | | | | | | | | | | | |
Network in operation and equipment | | | Ps. 971,276,013 | | | | Ps. 78,272,882 | | | | Ps. (21,657,715 | ) | | Ps. | 599,306 | | | | Ps.(38,824,540 | ) | | | Ps. — | | | | Ps. 989,665,946 | |
Land and buildings | | | 62,135,411 | | | | 2,858,996 | | | | (415,219 | ) | | | 27,686 | | | | (2,022,685 | ) | | | — | | | | 62,584,189 | |
Other assets | | | 144,927,016 | | | | 19,287,525 | | | | (8,112,571 | ) | | | 80,734 | | | | (5,866,897 | ) | | | — | | | | 150,315,807 | |
Construction in process and advances plant suppliers(1) | | | 49,719,884 | | | | 66,383,381 | | | | (41,279,573 | ) | | | 34,705 | | | | (737,023 | ) | | | — | | | | 74,121,374 | |
Spare parts for operation of the network | | | 28,283,048 | | | | 27,013,148 | | | | (27,979,816 | ) | | | 3,576 | | | | (728,358 | ) | | | — | | | | 26,591,598 | |
| | | | | | | | | | | | | | | | | | | | | | | | | | | | |
Total | | | 1,256,341,372 | | | | 193,815,932 | | | | (99,444,894 | ) | | | 746,007 | | | | (48,179,503 | ) | | | — | | | | 1,303,278,914 | |
| | | | | | | | | | | | | | | | | | | | | | | | | | | | |
Accumulated depreciation | | | | | | | | | | | | | | | | | | | | | | | | | | | | |
Network in operation and equipment | | | 495,887,086 | | | | — | | | | (21,214,724 | ) | | | — | | | | (32,860,339 | ) | | | 110,533,486 | | | | 552,345,509 | |
Buildings | | | 10,481,322 | | | | — | | | | (1,568,542 | ) | | | — | | | | (940,054 | ) | | | 2,682,559 | | | | 10,655,285 | |
Other assets | | | 48,459,697 | | | | — | | | | (4,572,509 | ) | | | — | | | | (2,251,958 | ) | | | 21,724,299 | | | | 63,359,529 | |
Spare parts for operation of the network | | | 323,201 | | | | — | | | | (9,205 | ) | | | — | | | | (4,339 | ) | | | 265,736 | | | | 575,393 | |
| | | | | | | | | | | | | | | | | | | | | | | | | | | | |
Total | | | Ps. 555,151,306 | | | | Ps. — | | | | Ps. (27,364,980 | ) | | Ps. | — | | | | Ps.(36,056,690 | ) | | | Ps. 135,206,080 | | | | Ps. 626,935,716 | |
| | | | | | | | | | | | | | | | | | | | | | | | | | | | |
Net Cost | | | Ps. 701,190,066 | | | | Ps. 193,815,932 | | | | Ps. (72,079,914 | ) | | Ps. | 746,007 | | | | Ps. (12,122,813 | ) | | | Ps. (135,206,080 | ) | | | Ps. 676,343,198 | |
| | | | | | | | | | | | | | | | | | | | | | | | | | | | |
| | | | | | | | | | | | | | | | | | | | | | | | | | | | |
| | | At December 31,
2017 | | | Additions | | | Retirements | | | Business
combinations | | | Effect of
translation of
foreign
subsidiaries and
hyperinflation
adjustment
| | | Depreciation
for
the year | | | At December 31,
2018 | |
Cost | | | | | | | | | | | | | | | | | | | | | | | | | | | | |
Network in operation and equipment | | | Ps. 989,665,946 | | | | Ps. 68,900,443 | | | | Ps. (1,610,246 | ) | | | Ps. 128,246 | | | | Ps. (87,888,453 | ) | | | — | | | | Ps. 969,195,936 | |
Land and buildings | | | 62,584,189 | | | | 4,429,433 | | | | (3,987,671 | ) | | | 8,874 | | | | (5,904,499 | ) | | | — | | | | 57,130,326 | |
Other assets | | | 150,315,807 | | | | 25,268,252 | | | | (13,377,798 | ) | | | 2,578 | | | | (12,399,702 | ) | | | — | | | | 149,809,137 | |
Construction in process and advances plant suppliers(1) | | | 74,121,374 | | | | 92,285,397 | | | | (76,978,798 | ) | | | 1,379 | | | | (8,336,823 | ) | | | — | | | | 81,092,529 | |
Spare parts for operation of the network | | | 26,591,598 | | | | 49,380,349 | | | | (44,626,488 | ) | | | 1,939 | | | | (2,902,869 | ) | | | — | | | | 28,444,529 | |
| | | | | | | | | | | | | | | | | | | | | | | | | | | | |
Total | | | 1,303,278,914 | | | | 240,263,874 | | | | (140,581,001 | ) | | | 143,016 | | | | (117,432,346 | ) | | | — | | | | 1,285,672,457 | |
| | | | | | | | | | | | | | | | | | | | | | | | | | | | |
Accumulated depreciation | | | | | | | | | | | | | | | | | | | | | | | | | | | | |
Network in operation and equipment | | | 552,345,509 | | | | — | | | | (28,712,096 | ) | | | — | | | | (67,907,227 | ) | | | 104,279,361 | | | | 560,005,547 | |
Buildings | | | 10,655,285 | | | | — | | | | (2,311,442 | ) | | | — | | | | (2,157,996 | ) | | | 2,625,102 | | | | 8,810,949 | |
Other assets | | | 63,359,529 | | | | — | | | | (2,418,837 | ) | | | — | | | | (6,579,983 | ) | | | 22,172,785 | | | | 76,533,494 | |
Spare parts for operation of the network | | | 575,393 | | | | — | | | | (160,696 | ) | | | — | | | | (131,429 | ) | | | 38,479 | | | | 321,747 | |
| | | | | | | | | | | | | | | | | | | | | | | | | | | | |
Total | | | Ps. 626,935,716 | | | | Ps. — | | | | Ps. (33,603,071 | ) | | | Ps. — | | | | Ps. (76,776,635 | ) | | | Ps. 129,115,727 | | | | Ps. 645,671,737 | |
| | | | | | | | | | | | | | | | | | | | | | | | | | | | |
Net Cost | | | Ps. 676,343,198 | | | | Ps.240,263,874 | | | | Ps. (106,977,930 | ) | | | Ps. 143,016 | | | | Ps. (40,655,711 | ) | | | Ps. (129,115,727 | ) | | | Ps. 640,000,720 | |
| | | | | | | | | | | | | | | | | | | | | | | | | | | | |
| (1) | Construction in progress includes fixed and mobile network facilities as well as satellite developments and fiber optic which is in the process of being installed. |
The completion period of construction in progress is variable and depends upon the type of plant and equipment under construction.
b) At December 31, 2017 and 2018, property, plant and equipment include the following assets under capital leases:
| | | | | | | | |
| | | 2017 | | | 2018 | |
Assets under capital leases | | | Ps. 8,116,532 | | | | Ps.7,770,681 | |
Accumulated depreciation | | | (3,475,014 | ) | | | (3,530,241 | ) |
| | | | | | | | |
| | | Ps. 4,641,518 | | | | Ps. 4,240,440 | |
| | | | | | | | |
F-43
c) At December 31, 2018 and 2017, Claro Brasil has land and buildings and other equipment that are pledged in guarantee of legal proceedings in the amount of Ps.3,166,882 and Ps. 3,521,082, respectively.
d) Relevant information related to the computation of the capitalized borrowing costs is as follows:
| | | | | | | | | | | | |
| | | Year ended December 31, | |
| | | 2016 | | | 2017 | | | 2018 | |
Amount invested in the acquisition of qualifying assets | | | Ps. 52,974,400 | | | | Ps. 49,642,370 | | | | Ps. 45,456,630 | |
Capitalized interest | | | 2,861,307 | | | | 2,875,034 | | | | 2,020,288 | |
Capitalization rate | | | 5.4% | | | | 5.8% | | | | 4.4% | |
Capitalized interest is being amortized over a period of estimated useful life of the related assets.
e) On October 20, 2017, our subsidiary Star One signed a contract with SSL — Space Systems Loral for construction of the Star One D2 satellite, which will be equipped with transponders 52 in the C and Ku bands, 20 Gbps of capacity in Band Ka and a certain capacity inX-band. The cost of this Project is estimated to be approximately Ps. 6,391,104 (US$ 323,000) and the launch will take place at the end of 2019. At December 31, 2018 and 2017 the amount recorded in Construction in progress amounts to Ps. 2,896,399 (R$551,528) and Ps. 916,240 (R$153,179), respectively.
11. Intangible assets, net and goodwill
a)An analysis of intangible assets at December 31, 2016, 2017 and 2018 is as follows:
| | | | | | | | | | | | | | | | | | | | | | | | | | | | |
| | | For the year ended December 31, 2016 | |
| | | Balance at
beginning of
year | | | Acquisitions | | | Acquisitions
in business
combinations | | | Disposals and
other | | | Amortization
of the year | | | Effect of
translation of
foreign
subsidiaries | | | Balance at end
of year | |
Licenses and rights of use | | Ps. | 175,295,775 | | | Ps. | 9,129,949 | | | Ps. | 360,144 | | | Ps. | 1,269,478 | | | Ps. | — | | | Ps. | 56,684,016 | | | Ps. | 242,739,362 | |
Accumulated amortization | | | (84,846,524 | ) | | | — | | | | — | | | | — | | | | (10,255,271 | ) | | | (31,606,303 | ) | | | (126,708,098 | ) |
| | | | | | | | | | | | | | | | | | | | | | | | | | | | |
Net | | | 90,449,251 | | | | 9,129,949 | | | | 360,144 | | | | 1,269,478 | | | | (10,255,271 | ) | | | 25,077,713 | | | | 116,031,264 | |
| | | | | | | | | | | | | | | | | | | | | | | | | | | | |
Trademarks | | | 22,824,013 | | | | — | | | | 101,655 | | | | (13,820 | ) | | | — | | | | 4,877,302 | | | | 27,789,150 | |
Accumulated amortization | | | (11,523,707 | ) | | | — | | | | — | | | | — | | | | (330,576 | ) | | | (3,367,974 | ) | | | (15,222,257 | ) |
| | | | | | | | | | | | | | | | | | | | | | | | | | | | |
Net | | | 11,300,306 | | | | — | | | | 101,655 | | | | (13,820 | ) | | | (330,576 | ) | | | 1,509,328 | | | | 12,566,893 | |
| | | | | | | | | | | | | | | | | | | | | | | | | | | | |
Customer relationships | | | 18,394,407 | | | | — | | | | 1,904,503 | | | | — | | | | — | | | | 5,946,598 | | | | 26,245,508 | |
Accumulated amortization | | | (3,962,875 | ) | | | — | | | | — | | | | — | | | | (3,231,518 | ) | | | (5,240,681 | ) | | | (12,435,074 | ) |
| | | | | | | | | | | | | | | | | | | | | | | | | | | | |
Net | | | 14,431,532 | | | | — | | | | 1,904,503 | | | | — | | | | (3,231,518 | ) | | | 705,917 | | | | 13,810,434 | |
| | | | | | | | | | | | | | | | | | | | | | | | | | | | |
Software licenses | | | 8,782,768 | | | | 3,854,066 | | | | 26,871 | | | | (829,680 | ) | | | — | | | | 1,040,771 | | | | 12,874,796 | |
Accumulated amortization | | | (2,424,598 | ) | | | (41,185 | ) | | | (8,367 | ) | | | 829,680 | | | | (3,469,461 | ) | | | (9,809 | ) | | | (5,123,740 | ) |
| | | | | | | | | | | | | | | | | | | | | | | | | | | | |
Net | | | 6,358,170 | | | | 3,812,881 | | | | 18,504 | | | | — | | | | (3,469,461 | ) | | | 1,030,962 | | | | 7,751,056 | |
| | | | | | | | | | | | | | | | | | | | | | | | | | | | |
Content rights | | | 2,634,527 | | | | 2,242,556 | | | | — | | | | (217,057 | ) | | | — | | | | 216,272 | | | | 4,876,298 | |
Accumulated amortization | | | (428,746 | ) | | | — | | | | — | | | | (1,612 | ) | | | (2,236,141 | ) | | | — | | | | (2,666,499 | ) |
| | | | | | | | | | | | | | | | | | | | | | | | | | | | |
Net | | | 2,205,781 | | | | 2,242,556 | | | | — | | | | (218,669 | ) | | | (2,236,141 | ) | | | 216,272 | | | | 2,209,799 | |
| | | | | | | | | | | | | | | | | | | | | | | | | | | | |
Total of intangibles, net | | Ps. | 124,745,040 | | | Ps. | 15,185,386 | | | Ps. | 2,384,806 | | | Ps. | 1,036,989 | | | Ps. | (19,522,967 | ) | | Ps. | 28,540,192 | | | Ps. | 152,369,446 | |
| | | | | | | | | | | | | | | | | | | | | | | | | | | | |
Goodwill (Note 12) | | Ps. | 137,113,716 | | | Ps. | — | | | Ps. | 3,953,023 | | | Ps. | (356,832 | ) | | Ps. | — | | | Ps. | 11,922,728 | | | Ps. | 152,632,635 | |
| | | | | | | | | | | | | | | | | | | | | | | | | | | | |
F-44
| | | | | | | | | | | | | | | | | | | | | | | | | | | | |
| | | For the year ended December 31, 2017 | |
| | | Balance at
beginning of
year | | | Acquisitions | | | Acquisitions
in business
combinations | | | Disposals and
other | | | Amortization
of the year | | | Effect of
translation of
foreign
subsidiaries | | | Balance at end
of year | |
Licenses and rights of use | | Ps. | 242,739,362 | | | Ps. | 12,347,051 | | | Ps. | 53,923 | | | Ps. | (1,037,458 | ) | | Ps. | — | | | Ps. | (6,689,054 | ) | | Ps. | 247,413,824 | |
Accumulated amortization | | | (126,708,098 | ) | | | — | | | | — | | | | 244,564 | | | | (11,879,489 | ) | | | 4,233,585 | | | | (134,109,438 | ) |
| | | | | | | | | | | | | | | | | | | | | | | | | | | | |
Net | | | 116,031,264 | | | | 12,347,051 | | | | 53,923 | | | | (792,894 | ) | | | (11,879,489 | ) | | | (2,455,469 | ) | | | 113,304,386 | |
| | | | | | | | | | | | | | | | | | | | | | | | | | | | |
Trademarks | | | 27,789,150 | | | | 127,823 | | | | 82,868 | | | | (29,804 | ) | | | — | | | | 809,175 | | | | 28,779,212 | |
Accumulated amortization | | | (15,222,257 | ) | | | — | | | | — | | | | 34,464 | | | | (3,179,461 | ) | | | (474,151 | ) | | | (18,841,405 | ) |
| | | | | | | | | | | | | | | | | | | | | | | | | | | | |
Net | | | 12,566,893 | | | | 127,823 | | | | 82,868 | | | | 4,660 | | | | (3,179,461 | ) | | | 335,024 | | | | 9,937,807 | |
| | | | | | | | | | | | | | | | | | | | | | | | | | | | |
Customer relationships | | | 26,245,508 | | | | — | | | | 512,667 | | | | (882,338 | ) | | | — | | | | 1,109,877 | | | | 26,985,714 | |
Accumulated amortization | | | (12,435,074 | ) | | | — | | | | — | | | | 882,338 | | | | (3,769,777 | ) | | | (806,982 | ) | | | (16,129,495 | ) |
| | | | | | | | | | | | | | | | | | | | | | | | | | | | |
Net | | | 13,810,434 | | | | — | | | | 512,667 | | | | — | | | | (3,769,777 | ) | | | 302,895 | | | | 10,856,219 | |
| | | | | | | | | | | | | | | | | | | | | | | | | | | | |
Software licenses | | | 12,874,796 | | | | 3,351,200 | | | | — | | | | (1,698,118 | ) | | | — | | | | 527,720 | | | | 15,055,598 | |
Accumulated amortization | | | (5,123,740 | ) | | | — | | | | — | | | | 1,212,669 | | | | (3,699,363 | ) | | | (204,727 | ) | | | (7,815,161 | ) |
| | | | | | | | | | | | | | | | | | | | | | | | | | | | |
Net | | | 7,751,056 | | | | 3,351,200 | | | | — | | | | (485,449 | ) | | | (3,699,363 | ) | | | 322,993 | | | | 7,240,437 | |
| | | | | | | | | | | | | | | | | | | | | | | | | | | | |
Content rights | | | 4,876,298 | | | | 2,099,084 | | | | — | | | | (63,137 | ) | | | — | | | | (194,803 | ) | | | 6,717,442 | |
Accumulated amortization | | | (2,666,499 | ) | | | — | | | | — | | | | (195,658 | ) | | | (1,820,092 | ) | | | 165,584 | | | | (4,516,665 | ) |
| | | | | | | | | | | | | | | | | | | | | | | | | | | | |
Net | | | 2,209,799 | | | | 2,099,084 | | | | — | | | | (258,795 | ) | | | (1,820,092 | ) | | | (29,219 | ) | | | 2,200,777 | |
| | | | | | | | | | | | | | | | | | | | | | | | | | | | |
Total of intangibles, net | | Ps. | 152,369,446 | | | Ps. | 17,925,158 | | | Ps. | 649,458 | | | Ps. | (1,532,478 | ) | | Ps. | (24,348,182 | ) | | Ps. | (1,523,776 | ) | | Ps. | 143,539,626 | |
| | | | | | | | | | | | | | | | | | | | | | | | | | | | |
Goodwill (Note 12) | | Ps. | 152,632,635 | | | Ps. | — | | | Ps. | 951,348 | | | Ps. | (134,525 | ) | | Ps. | — | | | Ps. | (1,986,226 | ) | | Ps. | 151,463,232 | |
| | | | | | | | | | | | | | | | | | | | | | | | | | | | |
| | | | | | | | | | | | | | | | | | | | | | | | | | | | |
| | | For the year ended December 31, 2018 | |
| | | Balance at
beginning of
year | | | Acquisitions | | | Acquisitions
in business
combinations | | | Disposals and
other | | | Amortization
of the year | | | Effect of
translation of
foreign
subsidiaries
and
Hyperinflation
adjustment | | | Balance at end
of year | |
Licenses and rights of use | | Ps. | 247,413,824 | | | Ps. | 4,227,244 | | | | — | | | Ps. | 1,508,274 | | | | — | | | Ps. | (19,670,368 | ) | | Ps. | 233,478,974 | |
Accumulated amortization | | | (134,109,438 | ) | | | — | | | | — | | | | (1,005,877 | ) | | | (11,347,089 | ) | | | 16,281,825 | | | | (130,180,579 | ) |
| | | | | | | | | | | | | | | | | | | | | | | | | | | | |
Net | | | 113,304,386 | | | | 4,227,244 | | | | | | | | 502,397 | | | | (11,347,089 | ) | | | (3,388,543 | ) | | | 103,298,395 | |
| | | | | | | | | | | | | | | | | | | | | | | | | | | | |
Trademarks | | | 28,779,212 | | | | 159,958 | | | | 6,631 | | | | — | | | | | | | | (738,635 | ) | | | 28,207,166 | |
Accumulated amortization | | | (18,841,405 | ) | | | — | | | | — | | | | — | | | | (4,973,602 | ) | | | 275,046 | | | | (23,539,961 | ) |
| | | | | | | | | | | | | | | | | | | | | | | | | | | | |
Net | | | 9,937,807 | | | | 159,958 | | | | 6,631 | | | | — | | | | (4,973,602 | ) | | | (463,589 | ) | | | 4,667,205 | |
| | | | | | | | | | | | | | | | | | | | | | | | | | | | |
Customer relationships | | | 26,985,714 | | | | 74,637 | | | | 15,556 | | | | — | | | | | | | | (1,532,839 | ) | | | 25,543,068 | |
Accumulated amortization | | | (16,129,495 | ) | | | | | | | | | | | — | | | | (3,754,312 | ) | | | 1,122,270 | | | | (18,761,537 | ) |
| | | | | | | | | | | | | | | | | | | | | | | | | | | | |
Net | | | 10,856,219 | | | | 74,637 | | | | 15,556 | | | | — | | | | (3,754,312 | ) | | | (410,569 | ) | | | 6,781,531 | |
| | | | | | | | | | | | | | | | | | | | | | | | | | | | |
Software licenses | | | 15,055,598 | | | | 2,004,550 | | | | 3,006 | | | | (905,610 | ) | | | — | | | | (1,848,286 | ) | | | 14,309,258 | |
Accumulated amortization | | | (7,815,161 | ) | | | — | | | | | | | | 2,677,848 | | | | (3,491,629 | ) | | | 924,139 | | | | (7,704,803 | ) |
| | | | | | | | | | | | | | | | | | | | | | | | | | | | |
Net | | | 7,240,437 | | | | 2,004,550 | | | | 3,006 | | | | 1,772,238 | | | | (3,491,629 | ) | | | (924,147 | ) | | | 6,604,455 | |
| | | | | | | | | | | | | | | | | | | | | | | | | | | | |
Content rights | | | 6,717,442 | | | | 850,779 | | | | — | | | | — | | | | — | | | | (18,512 | ) | | | 7,549,709 | |
Accumulated amortization | | | (4,516,665 | ) | | | — | | | | — | | | | — | | | | (2,231,978 | ) | | | (14,949 | ) | | | (6,763,592 | ) |
| | | | | | | | | | | | | | | | | | | | | | | | | | | | |
Net | | | 2,200,777 | | | | 850,779 | | | | — | | | | — | | | | (2,231,978 | ) | | | (33,461 | ) | | | 786,117 | |
| | | | | | | | | | | | | | | | | | | | | | | | | | | | |
Total of intangibles, net | | Ps. | 143,539,626 | | | Ps. | 7,317,168 | | | Ps. | 25,193 | | | Ps. | 2,274,635 | | | Ps. | (25,798,610 | ) | | Ps. | (5,220,309 | ) | | Ps. | 122,137,703 | |
| | | | | | | | | | | | | | | | | | | | | | | | | | | | |
Goodwill | | Ps. | 151,463,232 | | | Ps. | 1,455 | | | Ps. | 333,284 | | | Ps. | (1,094,861 | ) | | | — | | | Ps. | (5,136,613 | ) | | Ps. | 145,566,497 | |
| | | | | | | | | | | | | | | | | | | | | | | | | | | | |
F-45
b) The aggregate carrying amount of goodwill is allocated as follows:
| | | | | | | | |
| | | 2017 | | | 2018 | |
Europe (7 countries) | | | Ps. 53,143,542 | | | | Ps. 53,066,729 | |
Brazil (Fixed, wireless and TV) | | | 24,708,740 | | | | 21,388,124 | |
Puerto Rico | | | 17,463,394 | | | | 17,463,394 | |
Dominican Republic | | | 14,186,723 | | | | 14,186,723 | |
Colombia | | | 13,981,033 | | | | 12,770,381 | |
México | | | 9,852,912 | | | | 9,856,601 | |
Peru | | | 3,958,110 | | | | 3,086,981 | |
Chile | | | 2,834,134 | | | | 2,576,214 | |
El Salvador | | | 2,510,577 | | | | 2,510,577 | |
Ecuador | | | 2,155,385 | | | | 2,155,385 | |
Other countries | | | 6,668,682 | | | | 6,505,388 | |
| | | | | | | | |
| | | Ps. 151,463,232 | | | | Ps. 145,566,497 | |
| | | | | | | | |
c) The following is a description of the major changes in the “Licenses and rights of use” caption during the years ended December 31, 2016, 2017 and 2018:
2016 Acquisitions
i) In February 2016, the Company´s subsidiary in Paraguay was granted with the use of 30 MHz of spectrum in the 1700/2100 Mhz frequency. The total cost was Ps. 830,719 (US$ 46,000).
ii) In February 2016, the Company through its subsidiary Radiomóvil Dipsa, S.A. de C.V. (Telcel), acquired through an auction a total of 20MHz in the national wideAWS-1 band and 40 MHz in theAWS-3 band. The concession expires in October 2030. The Company paid an amount of Ps. 2,098,060.
iii) In May 2016, Mtel, located in Bulgaria, acquired 2 x 5 MHz in the1,800-MHz spectrum for Ps. 135,441 (EUR 6,212). During 2016, Telekom Austria paid Ps. 410,713 (EUR 18,837) for the renewals referring to an obligation obtained from concessions granted in previous years.
iv) On May 26, 2016, the Company’s subsidiary in Peru acquired spectrum in a public auction of the 700 MHz band. The frequency band expires in 2036. The cost of the spectrum was Ps. 5,627,316 (PEN$. 1,002,523).
v) In July 2016, Ecuador Telecom acquired a license to operate TV in Ecuador for a period that ends in 2031. The amount paid was Ps. 27,700 (US$ 1,500).
2017 Acquisitions
i) In 2017, Claro Brasil increased its licenses value by Ps. 3,592,034 due to the cleaning process of the 700 MHz national frequency acquired in September 2014.
ii) On February 24, 2017 Radiomóvil Dipsa renewed its 8.4 MHz national license by paying Ps. 917,431, and on July 14, 2017, it acquired 43 concession titles for frequencies of 2.5 GHz in the amount of Ps. 5,305,498.
iii) Additionally, in 2017, the Company acquired other licenses in Chile, Europe, Uruguay and others countries in the amount of Ps. 2,532,088.
2018 Acquisitions
i. In December, Dominican Republic acquired radio spectrum totaling Ps 709,829 (RD$ 1,831,427) with a useful life of 11 years.
F-46
ii. Additionally, in 2018, the Company acquired other licenses in Paraguay, Puerto Rico, Europe, Argentina, Chile and others countries in the amount of Ps. 3,517,415.
Amortization of intangibles for the years ended December 31, 2016, 2017 and 2018 amounted to Ps. 19,522,968, Ps. 24,348,182and Ps. 25,798,610 respectively.
Some of the jurisdictions in which the Company operates can revoke their concessions under certain circumstances such as imminent danger to national security, national economy and natural disasters.
12. Business combinations, acquisitions, sale andnon-controlling interest
a)The following is a description of the major acquisitions of investments in associates and subsidiaries during the years ended December 31, 2016 and 2017:
Acquisitions and sale 2016
a) In January 2016, in order to expand and strengthen its operations in Brazil, the Company through its Brazilian subsidiary, acquired a controlling interest of 99.99% in Brazil Telecomunicações S.A. (“BRTel”), a company operating in the market for Pay TV, Internet and broadband services and serving various municipalities of Brazil under the BLUE brand. The amount paid for the business acquisition was Ps. 1,088,668, net of acquired cash. The goodwill recognized amounted to Ps. 1,046,253.
b) In May 2016, the Company acquired an additionalnon-controlling interest of 1.8% in Tracfone Wireless Inc. thereby obtaining 100% of its capital stock. The amount paid was Ps. 2,300,553 (US$ 124,673). This transaction was recorded as an equity transaction, and therefore, no gain or loss was recognized.
c) In May 2016, the Company through his subsidiary, América Móvil Perú, S.A.C. acquired 100% of the capital stock of Olo del Perú S.A.C. (“Olo”), and TVS Wireless S.A.C. (“TVS”). Olo and TVS provide telecommunications services throughout Peru and hold radio spectrum in the 2.5 GHz band. The transaction was conditioned to the obtention of the approval of the Peruvian regulator, such approval was finally obtained in December 2016. The amount of the transaction was Ps. 1,854,379 (US$. 102,343) net of acquired cash. In May 2016 the Company paid Ps. 152,214 (US$ 7,554) and in January 2017, after the approval, Ps. 2,079,095 (US$ 94,789). The goodwill recognized amounted to Ps. 1,454,333 in December 2016, Ps. 188,452 in December 2017 and Ps. 329,366 in December 2018.
d) Based on a 2014 shareholder agreement, the Company agreed to ensure a minimal free float of Telekom Austria shares in the market. Consequently, in July 2016, the Company sold shares corresponding to 7.8% of the outstanding common stock of Telekom Austria AG. This sale reduced the overall shareholding of América Movil in Telekom Austria AG from 59.70% to 51.89%. Additionally, in August 2016, the Company sold 0.89% of the outstanding common stock of Telekom Austria AG. Following the successful completion of this transaction, AMX’s stake was reduced to 51.0%. The amount of cash received for these transactions was Ps. 6,323,336. As América Móvil still retains control over Telekom Austria AG, these transactions were recorded as equity transactions.
e) In September 2016, the Company, through his subsidiary Tracfone, acquired certain assets ofT-Mobile, that represented a business, which included the brands known as Walmart Mobile and Go Smart. These assets were acquired in order to expand the Company’s distribution channels, add an incremental revenue stream, and assist in the growth of subscribers. There was no cash exchanged in the acquisition. The goodwill recognized amounted to Ps. 1,251,464.
f) In November 2016, Telekom Austria Group acquired 100% of the Belarusian fixed-line operator Atlant Telecom (Atlant) and its subsidiary TeleSet. After the acquisition, Atlant was renamed velcom ACS. Both
F-47
companies are the leading privately owned fixed-line operators in Belarus offering fixed-line broadband, IPTV and cable TV as well as a video and audio library. The acquisition of Atlant and TeleSet is a further step in Telekom Austria Group’s convergence strategy. The final allocation of consideration transferred will be determined once all necessary information regarding identifiable assets is available. The amount paid for the business acquisition was Ps. 582,931, net of acquired cash. The goodwill recognized amounted to Ps. 200,973.
Acquisitions 2017
a) In February 2017, Telekom Austria Group acquired 97.68% of Metronet telekomunikacije through its Croatian subsidiary Vipnet. Metronet is one of the leading alternative fixed business solutions providers in Croatia. The fair values of the assets acquired and liabilities assumed at the acquisition date are reported in the Europe segment. The amount paid for the business acquisition was Ps. 1,550,534, net of acquired cash. The goodwill recognized amounted to Ps. 502,574.
b) During 2017, the Company acquired through its subsidiaries, other entities for which if paid Ps. 3,249,164, net of acquired cash. The identified goodwill has been allocated to the Europe segment. The goodwill recognized amounted to Ps. 260,355.
c) The Company acquired an additionalnon-controlling interest in its Mexican entities for an amount of Ps. 23,881.
b) Consolidated subsidiaries withnon-controlling interests
The Company has control over Telekom Austria, which has a materialnon-controlling interest. Set out below is summarized information as of December 31, 2017 and 2018 of TKA’s consolidated financial statements. The amounts disclosed for this subsidiary are before inter-company eliminations and using the same accounting policies of América Móvil.
Selected financial data from the statements of financial position
| | | | | | | | |
| | | December 31, | |
| | | 2017 | | | 2018 | |
Assets: | | | | | | | | |
Current assets | | Ps. | 29,128,486 | | | Ps. | 29,854,542 | |
Non-current assets | | | 150,225,260 | | | | 131,407,408 | |
| | | | | | | | |
Total assets | | Ps. | 179,353,746 | | | Ps. | 161,261,950 | |
| | | | | | | | |
Liabilities and equity: | | | | | | | | |
Current liabilities | | Ps. | 30,192,384 | | | Ps. | 36,822,034 | |
Non-current liabilities | | | 89,048,150 | | | | 80,023,800 | |
| | | | | | | | |
Total liabilities | | | 119,240,534 | | | | 116,845,834 | |
Equity attributable to equity holders of the parent | | | 25,808,318 | | | | 22,621,625 | |
Non-controlling interest(1) | | | 34,304,894 | | | | 21,794,491 | |
| | | | | | | | |
Total equity | | Ps. | 60,113,212 | | | Ps. | 44,416,116 | |
| | | | | | | | |
Total liabilities and equity | | Ps. | 179,353,746 | | | Ps. | 161,261,950 | |
| | | | | | | | |
| (1) | In 2017 this amount includes Ps. 14,942,886 for the subordinated perpetual fixed rate bond (see Note 19). |
F-48
Summarized statements of comprehensive income
| | | | | | | | | | | | |
| | | For the year ended December 31, | |
| | | 2016 | | | 2017 | | | 2018 | |
Operating revenues | | Ps. | 85,185,177 | | | Ps. | 93,644,173 | | | Ps. | 100,716,444 | |
Operating costs and expenses | | | 81,590,233 | | | | 86,920,692 | | | | 95,984,880 | |
| | | | | | | | | | | | |
Operating income | | Ps. | 3,594,944 | | | Ps. | 6,723,481 | | | Ps. | 4,731,564 | |
| | | | | | | | | | | | |
Net income | | Ps. | 7,065,770 | | | Ps. | 5,656,132 | | | Ps. | 3,809,694 | |
| | | | | | | | | | | | |
Total comprehensive income | | Ps. | 8,450,837 | | | Ps. | 7,737,797 | | | Ps. | 5,047,838 | |
| | | | | | | | | | | | |
Net income attributable to: | | | | | | | | | | | | |
Equity holders of the parent | | Ps. | 3,241,556 | | | Ps. | 2,884,627 | | | Ps. | 1,942,944 | |
Non-controlling interest | | | 3,824,214 | | | | 2,771,505 | | | | 1,866,750 | |
| | | | | | | | | | | | |
| | Ps. | 7,065,770 | | | Ps. | 5,656,132 | | | Ps. | 3,809,694 | |
| | | | | | | | | | | | |
Comprehensive income attributable to: | | | | | | | | | | | | |
Equity holders of the parent | | Ps. | 4,311,801 | | | Ps. | 3,978,263 | | | Ps. | 2,574,397 | |
Non-controlling interest | | | 4,139,036 | | | | 3,759,534 | | | | 2,473,441 | |
| | | | | | | | | | | | |
| | Ps. | 8,450,837 | | | Ps. | 7,737,797 | | | Ps. | 5,047,838 | |
| | | | | | | | | | | | |
13. Income Taxes
As explained previously in these consolidated financial statements, the Company is a Mexican corporation which has numerous consolidated subsidiaries operating in different countries. Presented below is a discussion of income tax matters that relates to the Company’s consolidated operations, its Mexican operations and significant foreign operations.
| i) | Consolidated income tax matters |
The composition of income tax expense for the years ended December 31, 2016, 2017 and 2018 is as follows:
| | | | | | | | | | | | |
| | | 2016 | | | 2017 | | | 2018 | |
In Mexico: | | | | | | | | | | | | |
Current year income tax | | Ps. | 14,316,005 | | | Ps. | 16,568,274 | | | Ps. | 28,572,414 | |
Deferred income tax | | | (12,086,232 | ) | | | 2,582,287 | | | | (2,688,727 | ) |
Foreign: | | | | | | | | | | | | |
Current year income tax | | | 15,367,903 | | | | 13,524,729 | | | | 19,898,728 | |
Deferred income tax | | | (6,198,820 | ) | | | (7,733,779 | ) | | | 694,664 | |
| | | | | | | | | | | | |
| | Ps. | 11,398,856 | | | Ps. | 24,941,511 | | | Ps. | 46,477,079 | |
| | | | | | | | | | | | |
F-49
Deferred tax related to items recognized in OCI during the year:
| | | | | | | | | | | | |
| | | For the years ended December 31, | |
| | | 2016 | | | 2017 | | | 2018 | |
Remeasurement of defined benefit plans | | Ps. | (7,734,732 | ) | | Ps. | 3,032,403 | | | Ps. | 408,735 | |
Effect of financial instruments acquired for hedging purposes | | | (21,046 | ) | | | (5,337 | ) | | | | |
Equity investments at fair value | | | 2,858,452 | | | | (266,753 | ) | | | 1,613,667 | |
Other | | | 136,879 | | | | — | | | | (8,922 | ) |
| | | | | | | | | | | | |
Deferred tax benefit (expense) recognized in OCI | | Ps. | (4,760,447 | ) | | Ps. | 2,760,313 | | | Ps. | 2,013,480 | |
| | | | | | | | | | | | |
A reconciliation of the statutory income tax rate in Mexico to the consolidated effective income tax rate recognized by the Company is as follows:
| | | | | | | | | | | | |
| | | Year ended December 31, | |
| | | 2016 | | | 2017 | | | 2018 | |
Statutory income tax rate in Mexico | | | 30.0% | | | | 30.0% | | | | 30.0% | |
Impact ofnon-deductible andnon-taxable items: | | | | | | | | | | | | |
Tax inflation effects | | | 15.9% | | | | 17.8% | | | | 7.3% | |
Derivatives | | | 8.0% | | | | 1.0% | | | | 0.4% | |
Employee benefits | | | 4.4% | | | | 2.2% | | | | 1.3% | |
Other | | | 9.8% | | | | 2.6% | | | | 6.3% | |
| | | | | | | | | | | | |
Effective tax rate on Mexican operations | | | 68.1% | | | | 53.6% | | | | 45.3% | |
Use of unrecognized tax credits in Brazil | | | (0.6% | ) | | | (0.4% | ) | | | — | |
Equity interest in net loss of associated companies | | | (0.2% | ) | | | — | | | | — | |
Dividends received from associates | | | (7.9% | ) | | | (1.2% | ) | | | (0.8% | ) |
Foreign subsidiaries and othernon-deductible items, net | | | (10.8% | ) | | | (8.3% | ) | | | 1.5% | |
| | | | | | | | | | | | |
Effective tax rate | | | 48.6% | | | | 43.7% | | | | 46.0% | |
| | | | | | | | | | | | |
An analysis of temporary differences giving rise to the net deferred tax liability is as follows:
| | | | | | | | | | | | | | | | | | | | |
| | | Consolidated statements of financial position | | | Consolidated statements of comprehensive income | |
| | | 2017 | | | 2018 | | | 2016 | | | 2017 | | | 2018 | |
Provisions | | | Ps.26,268,666 | | | | Ps.20,781,421 | | | | Ps.1,622,132 | | | | Ps.1,579,604 | | | | Ps.1,841,705 | |
Deferred revenues | | | 7,461,802 | | | | 6,866,120 | | | | (12,128 | ) | | | (965,010 | ) | | | 3,632,051 | |
Tax losses carry forward | | | 38,332,408 | | | | 27,881,491 | | | | 12,706,245 | | | | (323,506 | ) | | | (5,833,660 | ) |
Property, plant and equipment (1) | | | (9,929,129 | ) | | | (11,756,590 | ) | | | 2,445,783 | | | | 1,974,753 | | | | 453,493 | |
Inventories | | | 2,003,049 | | | | 2,106,976 | | | | (229,571 | ) | | | 519,046 | | | | 81,270 | |
Licenses and rights of use (1) | | | (2,455,877 | ) | | | (3,896,788 | ) | | | 54,182 | | | | 348,201 | | | | 961,402 | |
Employee benefits | | | 33,253,071 | | | | 33,673,874 | | | | 3,616,952 | | | | 1,225,310 | | | | 1,128,209 | |
Other | | | 9,639,995 | | | | 10,956,823 | | | | (1,918,543 | ) | | | 793,094 | | | | (270,407 | ) |
| | | | | | | | | | | | | | | | | | | | |
Net deferred tax assets | | | Ps.104,573,985 | | | | Ps.86,613,327 | | | | | | | | | | | | | |
| | | | | | | | | | | | | | | | | | | | |
Deferred tax expense in net profit for the year | | | | Ps.18,285,052 | | | | Ps.5,151,492 | | | | Ps.1,994,063 | |
| | | | | | | | | | | | | | | | | | | | |
| (1) | As of December 31, 2018, the balance included the effects of hyperinflation. |
F-50
Reconciliation of deferred tax assets and liabilities, net:
| | | | | | | | | | | | |
| | | 2016 | | | 2017 | | | 2018 | |
Opening balance as of January 1, | | Ps. | 69,817,147 | | | Ps. | 98,589,818 | | | Ps. | 104,573,985 | |
Deferred tax benefit | | | 18,285,052 | | | | 5,151,492 | | | | 1,994,063 | |
Translation effect | | | 15,273,228 | | | | (1,687,276 | ) | | | (8,854,010 | ) |
Deferred tax benefit (expense) recognized in OCI | | | (4,760,447 | ) | | | 2,760,313 | | | | 2,013,480 | |
Deferred taxes acquired in business combinations | | | (25,162 | ) | | | (240,362 | ) | | | (25,827 | ) |
Hyperinflationary effect in Argentina | | | — | | | | — | | | | (4,907,151 | ) |
Effect of adoption of IFRS 9 (Note 2ai) | | | — | | | | — | | | | 544,628 | |
Effect of adoption of IFRS 15 (Note 2ai) | | | — | | | | — | | | | (8,725,841 | ) |
| | | | | | | | | | | | |
Closing balance as of December 31, | | Ps. | 98,589,818 | | | Ps. | 104,573,985 | | | Ps. | 86,613,327 | |
| | | | | | | | | | | | |
Presented in the consolidated statements of financial position as follows: | | | | | | | | | | | | |
Deferred income tax assets | | Ps. | 112,651,699 | | | Ps. | 116,571,349 | | | Ps. | 111,186,768 | |
Deferred income tax liabilities | | | (14,061,881 | ) | | | (11,997,364 | ) | | | (24,573,441 | ) |
| | | | | | | | | | | | |
| | Ps. | 98,589,818 | | | Ps. | 104,573,985 | | | Ps. | 86,613,327 | |
| | | | | | | | | | | | |
The deferred tax assets are in tax jurisdictions in which the Company considers that based on financial projections of its cash flows, results of operations and synergies between subsidiaries, will generate sufficient taxable income in subsequent periods to utilize or realize such assets.
The Company does not recognize a deferred tax liability related to the undistributed earnings of its subsidiaries, because it currently does not expect these earnings to be taxable or to be repatriated in the near future. The Company’s policy has been to distribute the profits when it has paid the corresponding taxes in its home jurisdiction and the tax can be accredited in Mexico.
At December 31, 2017 and 2018, the balance of the contributed capital account (“CUCA”) is Ps. 510,832,194 and Ps. 536,278,717, respectively. On January 1, 2014, theCuenta de Utilidad Fiscal Neta(“CUFIN”) is computed on an América Móvil’s stand-alone basis. The balance of the América Móvil’s stand-alone basis CUFIN amounted to Ps. 225,105,342 and Ps. 276,185,284 as of December 31, 2017 and 2018, respectively.
Corporate tax rate
The income tax rate applicable in Mexico from 2016 through 2018 was 30%.
| ii) | Significant foreign income tax matters |
The foreign subsidiaries determine their taxes on profits based on their individual taxable income, in accordance with the specific tax regimes of each country.
F-51
The combined income before taxes and the combined provision for taxes of such subsidiaries in 2016, 2017 and 2018 are as follows:
| | | | | | | | | | | | |
| | | 2016 | | | 2017 | | | 2018 | |
Combined income before taxes | | Ps. | 45,697,258 | | | Ps. | 38,286,046 | | | Ps. | 66,314,883 | |
Combined tax provision differences
notdeducible-not cumulative in
the foreign subsidiaries | | Ps. | 9,169,083 | | | Ps. | 5,790,950 | | | Ps. | 20,593,392 | |
The effective income tax rate for the Company’s foreign jurisdictions was 20% in 2016, 15% in 2017 and 31% in 2018 as shown in the table above. The statutory tax rates in these jurisdictions vary, although many approximate 21% to 40%. The primary difference between the statutory rates and the effective rates in 2016, 2017 and 2018 was attributable to dividends received from KPN and othernon-deductible items andnon-taxable income.
a) At December 31, 2018, the available tax loss carryforwards recorded in deferred tax assets are as follows on a country by country basis:
| | | | | | | | |
Country | | Balance of available tax
loss carryforwards at
December 31, 2018 | | | Tax loss carryforward
benefit | |
Brazil | | | Ps. 59,695,441 | | | | Ps. 20,296,450 | |
Austria | | | 20,128,833 | | | | 5,032,208 | |
Mexico | | | 6,043,603 | | | | 1,813,081 | |
Colombia | | | 2,239,486 | | | | 739,030 | |
Nicaragua | | | 2,403 | | | | 722 | |
| | | | | | | | |
Total | | | Ps. 88,109,766 | | | | Ps. 27,881,491 | |
| | | | | | | | |
b) The tax loss carryforwards in the different countries in which the Company operates have the following terms and characteristics:
bi)The Company has accumulated Ps. 59,695,441 in net operating loss carryforwards (NOL’s) in Brazil as of December 31, 2018. In Brazil there is no expiration of the NOL’s. However, the NOL´s amount used against taxable income in each year may not exceed 30% of the taxable income for such year. Consequently, in the year in which taxable income is generated, the effective tax rate is 25% rather than the 34% corporate tax rate.
The Company believes that it is more likely than not that the accumulated balances of its net deferred tax assets are recoverable, based on the positive evidence of the Company to generate future taxable income related to the same taxation authority which will result in taxable amounts against which the available tax losses can be utilized before they expire. Positive evidence includes the Company’s recent restructure in 2017 of its operations in Brazil, resulting in an organizational structure that is anticipated to be more efficient and profitable and generated taxable income in 2018.
bii)The Company has accumulated Ps. 20,128,833 in NOL’s in Austria as of December 31, 2018. In Austria, the NOL´s have no expiration, but its annual usage is limited to 75% of the taxable income of the year. The realization of deferred tax assets is dependent upon the expected generation of future taxable income during the periods in which these temporary differences become deductible.
biii) The Company has accumulated $ 6,043,603 of tax losses in Mexico. The Mexican Tax Law establishes an optional regime for group companies called: Of the Optional Regime for Groups of Companies. For these purposes, the integrating (controlling) company must own more than 80% of the shares with voting rights of the
F-52
integrated (controlled) companies. In general terms, the Integration regime allows to differ, for each of the companies that make up the group, and for up to three years, or sooner if certain assumptions are made, the whole of the ISR that results from considering the determination of the individual ISR to its charge is the effect derived from recognizing, indirectly, the tax losses incurred by the companies in the group for the year in question.
The company estimates that there is positive evidence that allows it to use these losses, these should be reduced to the extent that it is considered likely that there will be sufficient taxable profits to allow them to recover in full or in part, the losses will only be compensated when there is a right legally required and are approved by the tax authorities in Mexico.
a) The Company’s short- and long-term debt consists of the following:
| | | | | | | | | | | | |
At December 31, 2017 | | | (Thousands of
Mexican pesos) | |
Currency | | Loan | | Interest rate | | Maturity | | | Total | |
Senior Notes | | | | | | | | | | | | |
U.S. dollars | | | | | | | | | | | | |
| | Fixed-rate Senior notes (i) | | 5.000% | | | 2019 | | | Ps. | 14,840,025 | |
| | Fixed-rate Senior notes (i) | | 5.500% | | | 2019 | | | | 7,467,145 | |
| | Fixed-rate Senior notes (i) | | 5.000% | | | 2020 | | | | 42,043,077 | |
| | Fixed-rate Senior notes (i) | | 3.125% | | | 2022 | | | | 31,658,720 | |
| | Fixed-rate Senior notes (i) | | 6.375% | | | 2035 | | | | 19,417,282 | |
| | Fixed-rate Senior notes (i) | | 6.125% | | | 2037 | | | | 7,305,744 | |
| | Fixed-rate Senior notes (i) | | 6.125% | | | 2040 | | | | 39,573,400 | |
| | Fixed-rate Senior notes (i) | | 4.375% | | | 2042 | | | | 22,754,705 | |
| | | | | | | | | | | | |
| | Subtotal U.S. dollars | | | | | | | | Ps. | 185,060,098 | |
| | | | | | | | | | | | |
Mexican pesos | | | | | | | | | | | | |
| | Domestic Senior notes (i) | | 8.110% | | | 2018 | | | Ps. | 1,750,000 | |
| | Domestic Senior notes (i) | | 8.270% | | | 2018 | | | | 1,160,110 | |
| | Domestic Senior notes (i) | | 8.600% | | | 2020 | | | | 7,000,000 | |
| | Domestic Senior notes (i) | | 0.000% | | | 2025 | | | | 4,409,873 | |
| | Domestic Senior notes (i) | | 8.360% | | | 2037 | | | | 5,000,000 | |
| | Fixed-rate Senior notes (i) | | 6.000% | | | 2019 | | | | 10,000,000 | |
| | Fixed-rate Senior notes (i) | | 6.450% | | | 2022 | | | | 22,500,000 | |
| | Fixed-rate Senior notes (i) | | 7.125% | | | 2024 | | | | 11,000,000 | |
| | Fixed-rate Senior notes (i) | | 8.460% | | | 2036 | | | | 7,871,700 | |
| | | | | | | | | | | | |
| | Subtotal Mexican pesos | | | | | | | | Ps. | 70,691,683 | |
| | | | | | | | | | | | |
Euros | | | | | | | | | | | | |
| | Fixed-rate Senior notes (i) | | 1.000% | | | 2018 | | | Ps. | 14,252,360 | |
| | Fixed-rate Senior notes (i) | | 4.125% | | | 2019 | | | | 23,753,933 | |
| | Exchangeable Bonds (i) | | 0.000% | | | 2020 | | | | 67,504,878 | |
| | Fixed-rate Senior notes (i) | | 3.000% | | | 2021 | | | | 23,753,933 | |
| | Fixed-rate Senior notes (i) | | 3.125% | | | 2021 | | | | 18,727,775 | |
| | Fixed-rate Senior notes (i) | | 4.000% | | | 2022 | | | | 19,333,685 | |
| | Fixed-rate Senior notes (i) | | 4.750% | | | 2022 | | | | 17,815,450 | |
| | Fixed-rate Senior notes (i) | | 3.500% | | | 2023 | | | | 7,594,262 | |
| | Fixed-rate Senior notes (i) | | 3.259% | | | 2023 | | | | 17,815,450 | |
| | Fixed-rate Senior notes (i) | | 1.500% | | | 2024 | | | | 20,190,843 | |
| | Fixed-rate Senior notes (i) | | 1.500% | | | 2026 | | | | 17,815,450 | |
| | Fixed-rate Senior notes (i) | | 2.125% | | | 2028 | | | | 15,440,057 | |
| | | | | | | | | | | | |
| | Subtotal Euros | | | | | | | | Ps. | 263,998,076 | |
| | | | | | | | | | | | |
F-53
| | | | | | | | | | | | |
At December 31, 2017 | | | (Thousands of
Mexican pesos) | |
Currency | | Loan | | Interest rate | | Maturity | | | Total | |
Pounds sterling | | | | | | | | | | | | |
| | Fixed-rate Senior notes (i) | | 5.000% | | | 2026 | | | Ps. | 13,368,884 | |
| | Fixed-rate Senior notes (i) | | 5.750% | | | 2030 | | | | 17,379,549 | |
| | Fixed-rate Senior notes (i) | | 4.948% | | | 2033 | | | | 8,021,330 | |
| | Fixed-rate Senior notes (i) | | 4.375% | | | 2041 | | | | 20,053,326 | |
| | | | | | | | | | | | |
| | Subtotal Pounds sterling | | | | | | | | Ps. | 58,823,089 | |
| | | | | | | | | | | | |
Swiss francs | | | | | | | | | | | | |
| | Fixed-rate Senior notes (i) | | 1.125% | | | 2018 | | | Ps. | 11,169,748 | |
| | | | | | | | | | | | |
| | Subtotal Swiss francs | | | | | | | | Ps. | 11,169,748 | |
| | | | | | | | | | | | |
Brazilian reais | | | | | | | | | | | | |
| | Debenture (i) | | 102.900% of CDI | | | 2020 | | | Ps. | 8,972,204 | |
| | Promissory Note (i) | | 102.400% of CDI | | | 2019 | | | | 5,981,469 | |
| | Debenture (i) | | 103.900% of CDI | | | 2019 | | | | 5,981,469 | |
| | | | | | | | | | | | |
| | Subtotal Brazilian reais | | | | | | | | Ps. | 20,935,142 | |
| | | | | | | | | | | | |
Other currencies | | | | | | | | | | | | |
Japanese yen | | | | | | | | | | | | |
| | Fixed-rate Senior notes (i) | | 2.950% | | | 2039 | | | Ps. | 2,282,608 | |
| | | | | | | | | | | | |
| | Subtotal Japanese yen | | | | | | | | Ps. | 2,282,608 | |
| | | | | | | | | | | | |
Chilean pesos | | | | | | | | | | | | |
| | Fixed-rate Senior notes (i) | | 3.961% | | | 2035 | | | Ps. | 4,312,424 | |
| | | | | | | | | | | | |
| | Subtotal Chilean pesos | | | | | | | | Ps. | 4,312,424 | |
| | | | | | | | | | | | |
| | Subtotal other currencies | | | | | | | | Ps. | 6,595,032 | |
| | | | | | | | | | | | |
Hybrid Notes | | | | | | | | | | | | |
Euros | | | | | | | | | | | | |
| | Euro NC5 Series A Capital Securities (iii) | | 5.125% | | | 2073 | | | Ps. | 21,378,540 | |
| | Euro NC10 Series B Capital Securities (iii) | | 6.375% | | | 2073 | | | | 13,064,663 | |
| | | | | | | | | | | | |
| | Subtotal Euros | | | | | | | | Ps. | 34,443,203 | |
| | | | | | | | | | | | |
Pounds sterling | | | | | | | | | | | | |
| | GBP NC7 Capital Securities (iii) | | 6.375% | | | 2073 | | | Ps. | 14,705,772 | |
| | | | | | | | | | | | |
| | Subtotal Pounds sterling | | | | | | | | Ps. | 14,705,772 | |
| | | | | | | | | | | | |
| | Subtotal Hybrid Notes | | | | | | | | Ps. | 49,148,975 | |
| | | | | | | | | | | | |
F-54
| | | | | | | | | | | | |
At December 31, 2017 | | | (Thousands of
Mexican pesos) | |
Currency | | Loan | | Interest rate | | Maturity | | | Total | |
Lines of Credit and others | | | | | | | | | | | | |
U.S. dollars | | | | | | | | | | | | |
| | Lines of credit (ii) | | L + 0.200% and 1.500% - 7.250% | | | 2018 - 2019 | | | Ps. | 14,474,350 | |
Mexican pesos | | | | | | | | | | | | |
| | Lines of credit (ii) | | TIIE + 0.040% - TIIE + 0.175% | | | 2018 - 2019 | | | Ps. | 12,500,000 | |
Brazilian reais | | | | | | | | | | | | |
| | Lines of credit (ii) | | 107% of CDI - TJLP + 3.500% & 3.000% - 9.500% | | | 2018 -2027 | | | Ps. | 4,389,260 | |
Chilean pesos | | | | | | | | | | | | |
| | Financial Leases | | 8.700% - 8.970% | | | 2018 - 2027 | | | Ps. | 99,446 | |
| | | | | | | | | | | | |
| | Subtotal Lines of Credit and others | | | | | | | | Ps. | 31,463,056 | |
| | | | | | | | | | | | |
| | Total debt | | | | | | | | Ps. | 697,884,899 | |
| | | | | | | | | | | | |
| | Less: Short-term debt and current portion of long-term debt | | | | | | | | Ps. | 51,745,841 | |
| | | | | | | | | | | | |
| | Long-term debt | | | | | | | | Ps. | 646,139,058 | |
| | | | | | | | | | | | |
| | | | | | | | | | | | |
At December 31, 2018 | | | (Thousands of
Mexican pesos) | |
Currency | | Loan | | Interest rate | | Maturity | | | Total | |
Senior Notes | | | | | | | | | | | | |
U.S. dollars | | | | | | | | | | | | |
| | Fixed-rate Senior notes (i) | | 5.000% | | | 2019 | | | Ps. | 14,762,175 | |
| | Fixed-rate Senior notes (i) | | 5.500% | | | 2019 | | | | 7,427,972 | |
| | Fixed-rate Senior notes (i) | | 5.000% | | | 2020 | | | | 41,822,521 | |
| | Fixed-rate Senior notes (i) | | 3.125% | | | 2022 | | | | 31,492,640 | |
| | Fixed-rate Senior notes (i) | | 6.375% | | | 2035 | | | | 19,315,420 | |
| | Fixed-rate Senior notes (i) | | 6.125% | | | 2037 | | | | 7,267,419 | |
| | Fixed-rate Senior notes (i) | | 6.125% | | | 2040 | | | | 39,365,800 | |
| | Fixed-rate Senior notes (i) | | 4.375% | | | 2042 | | | | 22,635,335 | |
| | | | | | | | | | | | |
| | Subtotal U.S. dollars | | | | | | | | Ps. | 184,089,282 | |
| | | | | | | | | | | | |
Mexican pesos | | | | | | | | | | | | |
| | Fixed-rate Senior notes (i) | | 6.000% | | | 2019 | | | Ps. | 10,000,000 | |
| | Domestic Senior notes (i) | | 8.600% | | | 2020 | | | | 7,000,000 | |
| | Fixed-rate Senior notes (i) | | 6.450% | | | 2022 | | | | 22,500,000 | |
| | Fixed-rate Senior notes (i) | | 7.125% | | | 2024 | | | | 11,000,000 | |
| | Domestic Senior notes (i) | | 0.000% | | | 2025 | | | | 4,629,425 | |
| | Fixed-rate Senior notes (i) | | 8.460% | | | 2036 | | | | 7,871,700 | |
| | Domestic Senior notes (i) | | 8.360% | | | 2037 | | | | 5,000,000 | |
| | | | | | | | | | | | |
| | Subtotal Mexican pesos | | | | | | | | Ps. | 68,001,125 | |
| | | | | | | | | | | | |
F-55
| | | | | | | | | | | | |
At December 31, 2018 | | | (Thousands of
Mexican pesos) | |
Currency | | Loan | | Interest rate | | Maturity | | | Total | |
Euros | | | | | | | | | | | | |
| | Fixed-rate Senior notes (i) | | 4.125% | | | 2019 | | | Ps. | 22,558,572 | |
| | Exchangeable Bonds (i) | | 0.000% | | | 2020 | | | | 64,107,851 | |
| | Fixed-rate Senior notes (i) | | 3.000% | | | 2021 | | | | 22,558,572 | |
| | Fixed-rate Senior notes (i) | | 3.125% | | | 2021 | | | | 17,568,739 | |
| | Fixed-rate Senior notes (i) | | 4.000% | | | 2022 | | | | 18,028,031 | |
| | Fixed-rate Senior notes (i) | | 4.750% | | | 2022 | | | | 16,918,929 | |
| | Fixed-rate Senior notes (i) | | 3.500% | | | 2023 | | | | 7,132,481 | |
| | Fixed-rate Senior notes (i) | | 3.259% | | | 2023 | | | | 16,918,929 | |
| | Fixed-rate Senior notes (i) | | 1.500% | | | 2024 | | | | 19,174,786 | |
| | Fixed-rate Senior notes (i) | | 1.500% | | | 2026 | | | | 16,918,929 | |
| | Fixed-rate Senior notes (i) | | 2.125% | | | 2028 | | | | 14,663,072 | |
| | | | | | | | | | | | |
| | Subtotal Euros | | | | | | | | Ps. | 236,548,891 | |
| | | | | | | | | | | | |
Pounds sterling | | | | | | | | | | | | |
| | Fixed-rate Senior notes (i) | | 5.000% | | | 2026 | | | Ps. | 12,550,801 | |
| | Fixed-rate Senior notes (i) | | 5.750% | | | 2030 | | | | 16,316,042 | |
| | Fixed-rate Senior notes (i) | | 4.948% | | | 2033 | | | | 7,530,481 | |
| | Fixed-rate Senior notes (i) | | 4.375% | | | 2041 | | | | 18,826,202 | |
| | | | | | | | | | | | |
| | Subtotal Pounds sterling | | | | | | | | Ps. | 55,223,526 | |
| | | | | | | | | | | | |
Brazilian reais | | | | | | | | | | | | |
| | Debenture (i) | | 103.900% of CDI | | | 2019 | | | Ps. | 5,079,720 | |
| | Promissory notes (i) | | 102.400% of CDI | | | 2019 | | | | 5,079,720 | |
| | Promissory notes (i) | | 103.205% of CDI | | | 2019 | | | | 1,828,699 | |
| | Debenture (i) | | 102.900% of CDI | | | 2020 | | | | 7,619,580 | |
| | Debenture (i) | | 104.000% of CDI | | | 2021 | | | | 5,587,692 | |
| | Debenture (i) | | 104.250% of CDI | | | 2021 | | | | 7,695,776 | |
| | | | | | | | | | | | |
| | Subtotal Brazilian reais | | | | | | | | Ps. | 32,891,187 | |
| | | | | | | | | | | | |
Other currencies | | | | | | | | | | | | |
Japanese yen | | | | | | | | | | | | |
| | Fixed-rate Senior notes (i) | | 2.950% | | | 2039 | | | Ps. | 2,334,864 | |
| | | | | | | | | | | | |
| | Subtotal Japanese yen | | | | | | | | Ps. | 2,334,864 | |
| | | | | | | | | | | | |
Chilean pesos | | | | | | | | | | | | |
| | Fixed-rate Senior notes (i) | | 3.961% | | | 2035 | | | Ps. | 3,904,707 | |
| | | | | | | | | | | | |
| | Subtotal Chilean pesos | | | | | | | | Ps. | 3,904,707 | |
| | | | | | | | | | | | |
| | Subtotal other currencies | | | | | | | | Ps. | 6,239,571 | |
| | | | | | | | | | | | |
Hybrid Notes | | | | | | | | | | | | |
Euros | | | | | | | | | | | | |
| | Euro NC10 Series B Capital Securities (iii) | | 6.375% | | | 2073 | | | Ps. | 12,407,214 | |
| | | | | | | | | | | | |
| | Subtotal Euros | | | | | | | | Ps. | 12,407,214 | |
| | | | | | | | | | | | |
Pounds sterling | | | | | | | | | | | | |
| | GBP NC7 Capital Securities (iii) | | 6.375% | | | 2073 | | | Ps. | 13,805,881 | |
| | | | | | | | | | | | |
| | Subtotal Pounds sterling | | | | | | | | Ps. | 13,805,881 | |
| | | | | | | | | | | | |
| | Subtotal Hybrid Notes | | | | | | | | | 26,213,095 | |
| | | | | | | | | | | | |
F-56
| | | | | | | | | | | | |
At December 31, 2018 | | | (Thousands of
Mexican pesos) | |
Currency | | Loan | | Interest rate | | Maturity | | | Total | |
Lines of Credit and others | | | | | | | | | | | | |
U.S. dollars | | | | | | | | | | | | |
| | Lines of credit (ii) | | L + 0.200% and 1.500% - 8.950% | | | 2019 - 2021 | | | Ps. | 11,698,885 | |
Mexican pesos | | | | | | | | | | | | |
| | Lines of credit (ii) | | TIIE + 0.175% | | | 2019 | | | Ps. | 4,500,000 | |
Euros | | | | | | | | | | | | |
| | Lines of credit (ii) | | -0.100% - 0.000% | | | 2019 | | | Ps. | 5,526,850 | |
Brazilian reais | | | | | | | | | | | | |
| | Lines of credit (ii) | | 5.000% - 6.000% | | | 2019 - 2027 | | | Ps. | 27,009 | |
Peruvian Soles | | | | | | | | | | | | |
| | Lines of credit (ii) | | 4.700% - 12.100% | | | 2019 | | | Ps. | 7,898,595 | |
Chilean pesos | | | | | | | | | | | | |
| | Financial Leases | | 8.700% - 8.970% | | | 2019 - 2027 | | | Ps. | 64,437 | |
| | | | | | | | | | | | |
| | Subtotal Lines of Credit and others | | | | | | | | Ps. | 29,715,776 | |
| | | | | | | | | | | | |
| | Total debt | | | | | | | | Ps. | 638,922,453 | |
| | | | | | | | | | | | |
| | Less: Short-term debt and current portion of long-term debt | | | | | | | | Ps. | 96,230,634 | |
| | | | | | | | | | | | |
| | Long-term debt | | | | | | | | Ps. | 542,691,819 | |
| | | | | | | | | | | | |
L = LIBOR (London Interbank Offer Rate)
TIIE = Mexican Interbank Rate
EURIBOR = Euro Interbank Offered Rate
CDI = Brazil Interbank Deposit Rate
TJLP = Brazil Long Term Interest Rate
Interest rates on the Company’s debt are subject to variances in international and local rates. The Company’s weighted average cost of borrowed funds at December 31, 2017, and December 31, 2018 was approximately 4.30% and 4.31%, respectively.
Such rates do not include commissions or the reimbursements for Mexican tax withholdings (typically a tax rate of 4.9%) that the Company must pay to international lenders.
An analysis of the Company’s short-term debt maturities as of December 31, 2017, and December 31, 2018, is as follows:
| | | | | | | | |
| | | 2017 | | | 2018 | |
Obligations and Senior Notes | | | Ps. 28,994,496 | | | | Ps. 67,365,810 | |
Lines of credit | | | 22,714,383 | | | | 28,852,364 | |
Financial Leases | | | 36,962 | | | | 12,460 | |
| | | | | | | | |
Total | | | Ps. 51,745,841 | | | | Ps. 96,230,634 | |
| | | | | | | | |
Weighted average interest rate | | | 4.0% | | | | 5.20% | |
| | | | | | | | |
F-57
The Company’s long-term debt maturities as of December 31, 2018 are as follows:
| | | | |
Years | | Amount | |
2020 | | Ps. | 121,184,630 | |
2021 | | | 54,189,122 | |
2022 | | | 88,027,828 | |
2023 and thereafter | | | 279,290,239 | |
| | | | |
Total | | Ps. | 542,691,819 | |
| | | | |
(i) Senior Notes
The outstanding Senior Notes at December 31, 2017, and December 31, 2018, are as follows:
| | | | | | | | |
Currency* | | 2017 | | | 2018 | |
U.S. dollars | | | Ps. 185,060,098 | | | | Ps. 184,089,282 | |
Mexican pesos | | | 70,691,683 | | | | 68,001,125 | |
Euros** | | | 263,998,076 | | | | 236,548,891 | |
Pounds sterling** | | | 58,823,089 | | | | 55,223,526 | |
Swiss francs | | | 11,169,748 | | | | — | |
Brazilian reais | | | 20,935,142 | | | | 32,891,187 | |
Japanese yens | | | 2,282,608 | | | | 2,334,864 | |
Chilean pesos | | | 4,312,424 | | | | 3,904,707 | |
| * | Thousands of Mexican pesos |
| ** | Includes secured and unsecured senior notes. |
(ii) Lines of credit
At December 31, 2017, and December 31, 2018, debt under lines of credit aggregated to Ps. $31,364 million and Ps. $29,651 million, respectively.
The Company has two revolving syndicated credit facilities, one for the Euro equivalent of U.S. $2,000 million and the other for U.S. $2,500 million maturing in 2021 and 2019, respectively. As long as the facilities are committed, a commitment fee is paid. As of December 31, 2018, these credit facilities were undrawn. Telekom Austria has also an undrawn revolving syndicated credit facility in Euros for €1,000 million that matures in 2019.
(iii) Hybrid Notes
On September 2013, the Company issued three series of Capital Securities (hybrid notes) maturing in 2073: two series denominated in Euros for €1,450 million with a coupon of 5.125% and 6.375% respectively, and one series denominated in pounds sterling in the amount of £550 million with a coupon of 6.375%. The Capital Securities are deeply subordinated, and when they were issued the principal rating agencies stated that they would treat only half of the principal amount as indebtedness for purposes of evaluating our leverage (an analysis referred to as 50.0% equity credit). The Capital Securities are subject to redemption at our option at varying dates beginning in 2018 and 2023, respectively, for the euro-denominated series and beginning in 2020 for the sterling-denominated series.
On September 2018, we exercised the option to call our hybrid bond with a maturity date in 2073 for a total amount of €900 million euros.
KPN
On September 2018, América Móvil delivered 224,695,844 KPN shares, equivalent to 5% of the total outstanding shares, after the maturity of a mandatory conversion bond with a nominal outstanding amount of €750 million Euros.
F-58
The transaction represented the sale of those shares at an effective price of €3.3374 euros per share.
Restrictions
A portion of the debt is subject to certain restrictions with respect to maintaining certain financial ratios, as well as restrictions on selling a significant portion of groups of assets, among others. At December 31, 2018, the Company was in compliance with all these requirements.
A portion of the debt is also subject to early maturity or repurchase at the option of the holders in the event of a change in control of the Company, as defined in each instrument. The definition of change in control varies from instrument to instrument; however, no change in control shall be considered to have occurred as long as its current shareholders continue to hold the majority of the Company’s voting shares.
“Covenants”
In conformity with the credit agreements, the Company is obliged to comply with certain financial and operating commitments. Such covenants limit in certain cases, the ability of the Company or the guarantor to: pledge assets, carry out certain types of mergers, sell all or substantially all of its assets, and sell control of Telcel.
Such covenants do not restrict the ability of AMX’s subsidiaries to pay dividends or other payment distributions to AMX. The more restrictive financial covenants require the Company to maintain a consolidated ratio of debt to EBITDA (defined as operating income plus depreciation and amortization) that does not exceed 4 to 1, and a consolidated ratio of EBITDA to interest paid that is not below 2.5 to 1 (in accordance with the clauses included in the credit agreements).
Several of the financing instruments of the Company may be accelerated, at the option of the debt holder in the case that a change in control occurs.
At December 31, 2018, the Company was in compliance with all the covenants.
15. Accounts payable, accrued liabilities and asset retirement obligations
a) The components of the caption accounts payable and accrued liabilities are as follows:
| | | | | | | | |
| | | At December 31, | |
| | | 2017 | | | 2018 | |
Suppliers | | | Ps. 106,483,848 | | | | Ps. 118,406,380 | |
Sundry creditors | | | 91,842,929 | | | | 91,087,197 | |
Interest payable | | | 8,930,561 | | | | 8,535,519 | |
Guarantee deposits from customers | | | 1,460,286 | | | | 1,421,336 | |
Dividends payable | | | 3,955,783 | | | | 2,506,835 | |
| | | | | | | | |
Total | | | Ps. 212,673,407 | | | | Ps. 221,957,267 | |
| | | | | | | | |
b) The balance of accrued liabilities at December 31, 2017 and 2018 are as follows:
| | | | | | | | |
| | | At December 31, | |
| | | 2017 | | | 2018 | |
Current liabilities | | | | | | | | |
Direct employee benefits payable | | | Ps. 16,673,627 | | | | Ps. 16,152,118 | |
Contingencies | | | 51,079,131 | | | | 40,281,573 | |
| | | | | | | | |
Total | | | Ps. 67,752,758 | | | | Ps. 56,433,691 | |
| | | | | | | | |
F-59
The movements in contingencies for the years ended December 31, 2017 and 2018 are as follows:
| | | | | | | | | | | | | | | | | | | | | | | | | | | | |
| | | Balance at
December 31,
2016 | | | Business
combination | | | Effect of
translation | | | Increase of
the year | | | Applications | | | Balance at
December 31,
2017 | |
| | | Payments | | | Reversals | |
Contingencies | | | Ps. 50,766,070 | | | | Ps. 115,971 | | | | Ps. (648,685) | | | | Ps. 10,510,473 | | | | Ps. (7,618,520) | | | | Ps. (2,046,178) | | | | Ps. 51,079,131 | |
| | | | | | | | | | | | | | | | | | | | | | | | | | | | |
| | | | | | | | | | | | | | | | | | | | | | | | | | | | |
| | | Balance at
December 31,
2017 | | | Business
combination | | | Effect of
translation | | | Increase of
the year | | | Applications | | | Balance at
December 31,
2018 | |
| | | Payments | | | Reversals | |
Contingencies | | | Ps. 51,079,131 | | | | Ps. 7,812 | | | | Ps. (5,729,826) | | | | Ps. 15,683,252 | | | | Ps. (6,203,329) | | | | Ps. (14,555,467) | | | | Ps. 40,281,573 | |
| | | | | | | | | | | | | | | | | | | | | | | | | | | | |
Contingencies include tax, labor, regulatory and other legal type contingencies. See Note 16 c) for detail of contingencies.
c) The movements in the asset retirement obligations for the years ended December 31, 2017 and 2018 are as follows:
| | | | | | | | | | | | | | | | | | | | | | | | |
| | | Balance at
December 31,
2016 | | | Effect of
translation | | | Increase of
the year | | | Applications | | | Balance at
December 31,
2017 | |
| | | Payments | | | Reversals | |
Asset retirement obligations | | | Ps. 16,288,631 | | | | Ps. (119,928) | | | | Ps. 3,160,320 | | | | Ps. (126,088) | | | | Ps. (957,806) | | | | Ps. 18,245,129 | |
| | | | | | | | | | | | | | | | | | | | | | | | |
| | | | | |
| | | Balance at
December 31,
2017 | | | Effect of
translation | | | Increase of
the year | | | Applications | | | Balance at
December 31,
2018 | |
| | | Payments | | | Reversals | |
Asset retirement obligations | | | Ps. 18,245,129 | | | | Ps. (2,020,853) | | | | Ps. 1,062,745 | | | | Ps. (151,364) | | | | Ps. (1,164,056) | | | | Ps. 15,971,601 | |
| | | | | | | | | | | | | | | | | | | | | | | | |
The discount rates used for the asset retirement obligation are based on market rates that are expected to be undertaken by the dismantling or restoration of cell sites, and may include labor costs.
16. Commitments and Contingencies
a) Leases
At December 31, 2017 and 2018, the Company has entered into several lease agreements with related parties and third parties for the buildings where its offices are located (as a lessee), as well as with the owners of towers and or premises where the Company has installed radio bases.
An analysis of the minimum rental payments for the next five years is shown below. In some cases, rental amounts are increased each year based on the National Consumer Price Index (INPC).
The Company has the followingnon-cancelable commitments under finance leases:
| | | | |
Year ended December 31, | | | |
2019 | | Ps. | 22,920 | |
2020 | | | 13,365 | |
2021 | | | 12,068 | |
2022 | | | 10,751 | |
2023 | | | 9,399 | |
2024 and thereafter | | | 34,011 | |
| | | | |
Total | | Ps. | 102,514 | |
Less: amounts representing finance charges | | | 23,837 | |
| | | | |
Present value of net minimum lease payments | | | 78,677 | |
Less current portion | | | 14,240 | |
| | | | |
Long-term obligations | | Ps. | 64,437 | |
| | | | |
F-60
An analysis ofnon-cancellable operating leases is as follows:
| | | | |
Year ended December 31, | | | |
2019 | | Ps. | 24,034,366 | |
2020 | | | 22,104,366 | |
2021 | | | 15,522,020 | |
2022 | | | 14,250,332 | |
2023 | | | 12,046,800 | |
2024 and thereafter | | | 49,991,937 | |
| | | | |
Total | | Ps. | 137,949,821 | |
| | | | |
Rent expense for the years ended December 31, 2016, 2017 and 2018 was Ps. 32,300,963, Ps. 35,571,283 and Ps. 34,421,817, respectively.
b) Commitments
The Company and its subsidiaries have commitments that mature on different dates, referring to CAPEX and cell phone purchases.
As of December 31, 2018, the total amounts equivalent to the contract period are detailed below:
| | | | |
Year ended December 31, | | | |
2019 | | Ps. | 88,233,626 | |
2020 | | | 68,170,083 | |
2021 | | | 55,358,156 | |
2022 | | | 13,322,961 | |
| | | | |
Total | | Ps. | 225,084,826 | |
| | | | |
c) Contingencies
I. MEXICO
Tax Assessment and Fine
In 2014, the Mexican Tax Administration Service (Servicio de Administración Tributaria or “SAT”) notified the Company of a Ps. 529,700 tax assessment related to the Company’s tax return for the fiscal year ended December 31, 2005, and reduced the Company’s consolidated tax loss for that year from Ps. 8,556,000 to zero. The Company has challenged this assessment before the Mexican courts and a final resolution is pending. The Company has not established a provision in the accompanying consolidated financial statements for a loss arising from this assessment, which it does not consider probable.
In 2012, the SAT notified the Company and its subsidiary Sercotel, S.A. de C.V. (“Sercotel”) of a fine of approximately Ps. 1,400,000 for alleged tax improprieties arising from the transfer of certain accounts receivable from one of the Company’s subsidiaries to Sercotel. In 2014, the Company challenged the fine and a final resolution is pending. The Company has not established a provision in the accompanying consolidated financial statements for a loss arising from this fine, which the Company does not consider probable.
Telcel Mobile Termination Rates
The mobile termination rates between Telcel and other network operators have been the subject of various legal proceedings. With respect to the interconnection fees for 2017, 2018 and 2019, Telcel has challenged the applicable resolutions and final resolutions are pending.
F-61
Given the fact that the “zero rate” that prevented Telcel from charging interconnection rates in its mobile network was held unconstitutional by the (Suprema Corte de Justicia de la Nación “SCJN”), the IFT has determined asymmetric interconnection rates for the termination of traffic in Telcel’s and other operators’ networks for 2018 and 2019. The resolutions setting such rates have been challenged by Telcel and final resolutions are pending.
The Company expects that mobile termination rates, as well as other rates applicable to mobile interconnection (such as transit), will continue to be the subject of litigation and administrative proceedings in Mexico. The Company cannot predict when or how these matters will be resolved or the financial effects of any such resolution.
Class Action Lawsuits
Telcel is subject to two class action lawsuits initiated by customers allegedly affected by Telcel’s quality of service and wireless and broadband rates. The Company cannot assess whether these class action lawsuits could have an adverse effect on the Company’s business and results of operations in the event that they are resolved against Telcel due to the lack of factual and legal claims underlying these proceedings. Consequently, the Company has not established a provision in the accompanying consolidated financial statements for a loss arising from these proceedings.
IFT Proceedings Against Telmex
In 2008, Telmex entered into certain commercial agreements with Dish México Holdings, S. de R.L. de C.V. and related companies (“Dish”), involving billing, collection services, distribution and equipment leasing. In addition, Telmex had an option to purchase shares representing 51% of the capital stock of Dish México, S. de R.L. de C.V. (“Dish México”). In 2014, Telmex waived its rights under the option.
In 2015, the IFT imposed a fine of Ps. 14,414 on Telmex on the grounds that the IFT was not notified of an alleged merger (concentración) between Telmex and Dish in 2008. Telmex filed an appeal for relief (amparo) and a final resolution is pending.
In 2015, in relation with some Dish operations, the IFT initiated several proceedings in order to determine potential violations of (i) Telmex’s concession, with respect to an alleged indirect exploitation of a public television services concession, which in 2019, the appeal for relief was granted by a competent court (Tribunal Colegiado); the Company cannot predict the outcome of such proceedings, and (ii) certain provisions of the Mexican Constitution (Constitución Política de los Estados Unidos Mexicanos) and the Federal Telecommunications and Broadcasting Law (Ley Federal de Telecomunicaciones y Radiodifusión) regarding the cost-free rule ofre-transmission of television broadcast signals (commonly known as “must offer”), through other operators. In 2018, the IFT absolved Telmex and Dish from any responsibility in connection with the sanction procedure initiated by the IFT for the alleged violation of item (ii) above.
In 2018, the IFT imposed a fine of Ps. 2,543,937 on Telmex relating to a sanction procedure triggered by the alleged breach in 2013 and 2014 of certain minimum quality goals for link services. Telmex challenged this fine and a final resolution is pending.
II. BRAZIL
a. Tax Matters
ICMS
As of December 31, 2018, the Company’s Brazilian subsidiaries Claro Brasil, Primesys Soluções Empresariais S.A. (“Primesys”), Telmex Do Brasil Ltda. (“TdB”), Americel S.A. (“Americel”), Brasil Telecomunicações S.A.
F-62
(“BrTel”) and TVSAT Telecomunicações S.A. (“TV SAT”), had aggregate tax contingencies related to value-added tax (“ICMS”) of approximately Ps. 55,455,306 (R$ 10,917,000). As of December 31, 2018, the Company has established a provision of Ps. 3,362,775 (R$ 662,000) in the accompanying consolidated financial statements for the losses arising from these contingencies which the Company considers probable. Such ICMS contingencies include the following tax assessments which the Company does not consider probable and therefore, has not established a provision in the accompanying consolidated financial statements:
| | • | | Tax assessments against Star One, S.A. (currently Claro Brasil as surviving entity of merger) in the amount of Ps. 21,167,194 (R$ 4,167,000) based on allegations that the provision of satellite capacity is subject to ICMS. The Company is contesting these tax assessments in separate proceedings at different litigation stages and has obtained favorable judicial decisions in two proceedings. |
| | • | | Tax assessments against Claro Brasil and Americel in the amount of Ps. 5,861,997 (R$ 1,154,000), due to a decision that held certain benefits granted by the Brazilian states unconstitutional. |
| | • | | Tax assessment against Primesys in the amount of Ps. 3,916,464 (R$ 771,000), related to ICMS over certain activities not deemed to be part of data communication services. |
CSLL/IRPJ
As of December 31, 2018 Claro Brasil, Americel, BrTel, and TV SAT had aggregate tax contingencies related to Social Contribution on Net income (“CSLL”) and Corporate Income Tax (“IRPJ”) in the amount of Ps. 17,779,021 (R$ 3,500,000). As of December 31, 2018, the Company has established a provision of Ps. 4,835,894 (R$ 952,000) in the accompanying consolidated financial statements for the losses arising from these contingencies, which the Company considers probable.
The aforementioned CSLL/IRPJ contingencies include a tax assessment against Claro Brasil in the amount of Ps. 10,906,159 (R$ 2,147,000) alleging the undue amortization of goodwill amounts between 2009 and 2012, and charging CSLL, IRPJ and penalties due to the late payment of taxes. Claro Brasil has challenged this assessment at the administrative level and a final resolution is pending. The Company has established a provision of Ps. 558,769 (R$ 110,000) in the accompanying consolidated financial statements for the losses arising from these contingencies, which the Company considers probable.
PIS/COFINS
As of December 31, 2018, Claro Brasil, Americel, TdB, Primesys and Brasil Center Comunicações Ltda. (“Brasil Center”) had aggregate tax assessments related to Social Integration Program (“PIS”) and Contribution for Social Security Financing (“COFINS”) in the amount of Ps. 16,488,772 (R$ 3,246,000). As of December 31, 2018, the Company has established a provision of Ps. 5,861,997 (R$ 1,154,000) in the accompanying consolidated financial statements for the losses arising from the PIS/COFINS assessments, which the Company considers probable. With respect to such PIS/COFINS assessments:
| | • | | Claro Brasil and Americel have commenced lawsuits against the Brazilian Federal Revenue Service seeking a ruling on constitutional grounds to exclude interconnection fees from the base used to calculate PIS and COFINS tax obligations. Pending a final resolution and pursuant to applicable Brazilian procedure, the companies have paid the tax based on their position in the lawsuits and have established a provision for the disputed amounts. As of December 31, 2018, the total amount in dispute was approximately Ps. 5,221,952 (R$ 1,028,000). |
| | • | | Tax assessments against Claro Brasil and Americel related to the offset of PIS and COFINS credits recorded in the noncumulative method in an amount of Ps. 8,183,429 (approximately R$ 1,611,000) as of December 31, 2018. The Company has not established a provision in the accompanying consolidated financial statements to cover the losses arising from this contingency, which the Company does not consider probable. |
F-63
As of September 30, 2018, based on a favorable decision from the Brazilian Supreme Court concerning the exclusion of ICMS from PIS and COFINS, the Company reverted the provision of Ps. 13,034,562 (R$2,566,000).
FUST/FUNTTEL
Anatel has initiated administrative proceedings against Claro Brasil, Americel, Primesys, TdB, BrTel and TVSAT in an aggregate amount of Ps. 14,223,217 (R$ 2,800,000) mainly based on an allegedly improper exclusion of interconnection revenues and costs from the basis used to calculate its Fund for Universal Telecommunication Services (“FUST”) obligations. The companies are contesting these assessments. As of December 31, 2018, the Company has established a provision of Ps. 1,706,786 (R$ 336,000) in the accompanying consolidated financial statements to cover the losses arising from these assessments, which the Company considers probable.
In addition, the Brazilian Ministry of Communications (Ministério das Comunicações) has initiated administrative proceedings against Claro Brasil, Americel, Primesys, TdB, BrTel and TVSAT totaling an amount of Ps. 5,115,278 (R$ 1,007,000) as of December 31, 2018, due to an alleged underpayment of their obligations to the telecommunications Technology Development Fund (“FUNTTEL”). The companies have challenged these assessments and a final resolution is pending. As of December 31, 2018, the Company has established a provision of Ps. 5,080 (R$ 1,000) in the accompanying consolidated financial statements to cover the losses arising from these assessments, which the Company considers probable.
ISS
The Municipal Revenue Services have issued tax assessments against Claro Brasil, Brasil Center and Primesys, totaling an aggregate amount of approximately Ps. 3,637,080 (R$ 716,000) due to the alleged nonpayment of Brazilian Services tax (“ISS”) over several telecommunication services, including Pay TV services, considered as taxable for ISS by these authorities. The companies have challenged the tax assessments on the grounds that the services cited are not subject to ISS tax and a final resolution is pending. As of December 31, 2018, the Company has established a provision of Ps. 25,399 (R$ 5,000) in the accompanying financial statements for the losses arising from these assessments, which the Company considers probable.
TFI
As of December 31, 2018, Anatel fined Claro Brasil and Americel a total of Ps. 13,207,273 (R$ 2,600,000), for an unpaid installation inspection fee (Taxa de Fiscalização de Instalação,or “TFI”) allegedly due for the renovation of radio base stations. Claro Brasil and Americel have challenged the fine, arguing that there was no new equipment installation that could lead to this charge, and a final resolution is pending. The Company has not established a provision in the accompanying consolidated financial statements to cover losses arising from these proceedings, which the Company does not consider probable.
Other Tax Contingencies
There are other several tax contingencies involving Claro Brasil, Americel, TdB and Primesys in an aggregate amount of Ps. 12,394,517 (R$ 2,440,000) related to a variety of taxes and government programs. As of December 31, 2018, the Company has established a provision of Ps. 1,117,538 (R$ 220,000) in the accompanying consolidated financial statements for the losses arising from these contingencies, which the Company considers probable.
F-64
b. Regulatory Matters
Inflation-Related Adjustments
Anatel has challenged the calculation of inflation-related adjustments due under the concession agreements with Tess S.A. (“Tess”), and Algar Telecom Leste S.A. (“ATL”), two of the Company’s subsidiaries that were previously merged into Claro Brasil. Anatel rejected Tess and ATL’s calculation of the inflation-related adjustments applicable to 60% of the concessions price (which was due in three equal annual installments, subject to inflation-related adjustments and interest), claiming that the companies’ calculation of the inflation-related adjustments resulted in a shortfall of the installment payments. The companies have filed declaratory and consignment actions seeking the resolution of the disputes and have obtained injunctions from a federal appeals court suspending payment until the pending appeals are resolved.
The amount of the alleged shortfall as well as the method used to calculate monetary corrections are in dispute. If other methods or assumptions are applied, the amount may increase. In 2018, Anatel calculated the monetary correction in a total amount of Ps. 19,302,937 (R$ 3,800,000). As of December 31, 2018, the Company has established a provision of Ps. 3,419,668 (R$ 673,200) in the accompanying consolidated financial statements for the losses arising from these contingencies, which the Company considers probable.
III. ECUADOR
In 2014, following a regulatory claim filed in 2012 by state-owned operatorCorporación Nacional de Telecomunicaciones(“CNT”), the Superintendency of Control of Market Power (Superintendencia de Control del Poder del Mercado,or ��SCPM”), imposed a fine of Ps.2,724,113 (US$138,400), on Conecel for alleged monopolistic practices. CNT alleged that Conecel had exclusive rights to deploy its network in five locations and thereby prevented CNT from deploying its own network in the same locations. Conecel challenged the fine before the Administrative Dispute Tribunal (Tribunal de lo Contencioso Administrativo), denying any wrongdoing and contends that CNT had other alternative sites in the same locations where it could have deployed its network.
In 2018, the Administrative Dispute Tribunal (Tribunal de lo ContenciosoAdministrativo), issued a ruling in favor of Conecel, declaring the fine null and void. The SCPM filed an appeal before the National Court of Justice and the appeal was declared inadmissible by such Court on March 14, 2019; nevertheless, this decision may not be final.
17. Employee Benefits
An analysis of the net liability and net period cost for employee benefits is as follows:
| | | | | | | | |
| | | At December 31, | |
| | | 2017 | | | 2018 | |
Liability: | | | | | | | | |
Mexico | | Ps. | 84,821,197 | | | Ps. | 85,517,190 | |
Puerto Rico | | | 13,962,128 | | | | 13,986,596 | |
Europe | | | 14,833,840 | | | | 12,705,926 | |
Brazil | | | 6,276,780 | | | | 5,666,694 | |
Ecuador | | | 403,194 | | | | 448,608 | |
| | | | | | | | |
Total | | | Ps. 120,297,139 | | | Ps. | 118,325,014 | |
| | | | | | | | |
F-65
| | | | | | | | | | | | |
| | | For the year ended December 31, | |
| | | 2016 | | | 2017 | | | 2018 | |
Net period cost (benefit) | | | | | | | | | | | | |
Mexico | | Ps. | 12,281,154 | | | Ps. | 11,586,065 | | | Ps. | 12,046,208 | |
Puerto Rico | | | 1,058,131 | | | | 776,238 | | | | 686,067 | |
Europe | | | 226,447 | | | | 385,689 | | | | 619,039 | |
Brazil | | | 633,159 | | | | 735,855 | | | | 579,432 | |
Ecuador | | | 41,380 | | | | 152,335 | | | | 58,354 | |
| | | | | | | | | | | | |
Total | | Ps. | 14,240,271 | | | Ps. | 13,636,182 | | | Ps. | 13,989,100 | |
| | | | | | | | | | | | |
a) Defined benefit plan
The defined benefit obligation (DBO) and plan assets for the pension and other benefit obligation plans, by country, are as follows:
| | | | | | | | | | | | | | | | | | | | | | | | | | | | | | | | |
| | | At December 31 | |
| | | 2017 | | | 2018 | |
| | | DBO | | | Plan Assets | | | Effect of asset
celling | | | Net employee
benefit liability | | | DBO | | | Plan Assets | | | Effect of asset
celling | | | Net employee
benefit liability | |
Mexico | | Ps. | 266,304,948 | | | Ps. | (182,539,376) | | | Ps. | — | | | Ps. | 83,765,572 | | | Ps. | 247,997,060 | | | Ps. | (163,404,418) | | | Ps. | — | | | Ps. | 84,592,642 | |
Puerto Rico | | | 38,711,695 | | | | ( 24,749,567) | | | | — | | | | 13,962,128 | | | | 35,220,889 | | | | ( 21,234,293) | | | | — | | | | 13,986,596 | |
Brazil | | | 19,369,664 | | | | ( 20,399,661) | | | | 6,519,560 | | | | 5,489,563 | | | | 18,795,315 | | | | ( 19,032,411) | | | | 5,087,543 | | | | 4,850,447 | |
Europe | | | 4,554,912 | | | | — | | | | — | | | | 4,554,912 | | | | 4,477,042 | | | | — | | | | — | | | | 4,477,042 | |
| | | | | | | | | | | | | | | | | | | | | | | | | | | | | | | | |
Total | | Ps. | 328,941,219 | | | Ps. | (227,688,604) | | | Ps. | 6,519,560 | | | Ps. | 107,772,175 | | | Ps. | 306,490,306 | | | Ps. | (203,671,122) | | | Ps. | 5,087,543 | | | Ps. | 107,906,727 | |
| | | | | | | | | | | | | | | | | | | | | | | | | | | | | | | | |
F-66
Below is a summary of the actuarial results generated for the pension and retirement plans as well as the medical services in Puerto Rico and Brazil; the pension plans and seniority premiums related to Telmex; the pension plan, the service awards plan and severance in Austria corresponding to the years ended December 31, 2016, 2017 and 2018:
| | | | | | | | | | | | | | | | |
| | | At December 31, 2016 | |
| | | DBO | | | Plan Assets | | | Effect of asset
celling | | | Net employee
benefit | |
Balance at the beginning of the year | | Ps. | 314,049,729 | | | Ps. | (212,234,440 | ) | | Ps. | 4,823,147 | | | Ps. | 106,638,436 | |
Current service cost | | | 4,606,856 | | | | | | | | | | | | 4,606,856 | |
Interest cost on projected benefit obligation | | | 27,275,363 | | | | | | | | | | | | 27,275,363 | |
Expected return on plan assets | | | | | | | (18,972,042 | ) | | | | | | | (18,972,042 | ) |
Changes in the asset ceiling during the period and others | | | | | | | | | | | 875,192 | | | | 875,192 | |
Past service costs and other | | | | | | | 165,851 | | | | | | | | 165,851 | |
Actuarial gain for changes in experience | | | (28,867 | ) | | | | | | | | | | | (28,867 | ) |
Actuarial loss from changes in financial assumptions | | | 7,784 | | | | | | | | | | | | 7,784 | |
| | | | | | | | | | | | | | | | |
Net period cost | | Ps. | 31,861,136 | | | Ps. | (18,806,191 | ) | | Ps. | 875,192 | | | Ps. | 13,930,137 | |
Actuarial gain for changes in experience | | | (20,976,837 | ) | | | | | | | | | | | (20,976,837 | ) |
Actuarial loss from changes in demographic assumptions | | | 397,985 | | | | | | | | | | | | 397,985 | |
Actuarial loss from changes in financial assumptions | | | 1,718,189 | | | | | | | | | | | | 1,718,189 | |
Changes in the asset ceiling during the period and others | | | | | | | | | | | (754,535 | ) | | | (754,535 | ) |
Return on plan assets greater than discount rate | | | | | | | (4,724,041 | ) | | | | | | | (4,724,041 | ) |
| | | | | | | | | | | | | | | | |
Recognized in other comprehensive income | | Ps. | (18,860,663 | ) | | Ps. | (4,724,041 | ) | | Ps. | (754,535 | ) | | Ps. | (24,339,239 | ) |
Contributions made by plan participants | | | 255,760 | | | | (255,760 | ) | | | | | | | — | |
Contributions to the pension plan made by the Company | | | | | | | (2,756,519 | ) | | | | | | | (2,756,519 | ) |
Benefits paid | | | (25,694,301 | ) | | | 25,517,599 | | | | | | | | (176,702 | ) |
Payments to employees | | | (525,612 | ) | | | | | | | | | | | (525,612 | ) |
Effect of translation | | | 12,196,546 | | | | (9,086,269 | ) | | | 2,139,414 | | | | 5,249,691 | |
| | | | | | | | | | | | | | | | |
Others | | Ps. | (13,767,607 | ) | | Ps. | 13,419,051 | | | Ps. | 2,139,414 | | | Ps. | 1,790,858 | |
Balance at the end of the year | | | 313,282,595 | | | | (222,345,621 | ) | | | 7,083,218 | | | | 98,020,192 | |
Less short-term portion | | | (152,448 | ) | | | | | | | | | | | (152,448 | ) |
| | | | | | | | | | | | | | | | |
Non-current obligation | | Ps. | 313,130,147 | | | Ps. | (222,345,621) | | | Ps. | 7,083,218 | | | Ps. | 97,867,744 | |
| | | | | | | | | | | | | | | | |
F-67
| | | | | | | | | | | | | | | | |
| | | At December 31, 2017 | |
| | | DBO | | | Plan Assets | | | Effect of asset
celling | | | Net employee
benefit liability | |
Balance at the beginning of the year | | Ps. | 313,282,595 | | | Ps. | (222,345,621 | ) | | Ps. | 7,083,218 | | | Ps. | 98,020,192 | |
Current service cost | | | 4,285,693 | | | | | | | | | | | | 4,285,693 | |
Interest cost on projected benefit obligation | | | 28,922,385 | | | | | | | | | | | | 28,922,385 | |
Expected return on plan assets | | | | | | | (20,916,104 | ) | | | | | | | (20,916,104 | ) |
Changes in the asset ceiling during the period and others | | | | | | | | | | | 716,330 | | | | 716,330 | |
Past service costs and other | | | | | | | 53,032 | | | | | | | | 53,032 | |
Actuarial gain for changes in experience | | | (35,145 | ) | | | | | | | | | | | (35,145 | ) |
Actuarial gain from changes in demographic assumptions | | | (85 | ) | | | | | | | | | | | (85 | ) |
Actuarial gain from changes in financial assumptions | | | (4,294 | ) | | | | | | | | | | | (4,294 | ) |
| | | | | | | | | | | | | | | | |
Net period cost | | Ps. | 33,168,554 | | | Ps. | (20,863,072 | ) | | Ps. | 716,330 | | | Ps. | 13,021,812 | |
Actuarial loss for changes in experience | | | 11,671,860 | | | | | | | | | | | | 11,671,860 | |
Actuarial gain from changes in demographic assumptions | | | (381,172 | ) | | | | | | | | | | | (381,172 | ) |
Actuarial loss from changes in financial assumptions | | | 2,438,078 | | | | | | | | | | | | 2,438,078 | |
Changes in the asset ceiling during the period and others | | | | | | | | | | | (856,188 | ) | | | (856,188 | ) |
Return on plan assets greater than discount rate | | | | | | | (2,483,430 | ) | | | | | | | (2,483,430 | ) |
| | | | | | | | | | | | | | | | |
Recognized in other comprehensive income | | Ps. | 13,728,766 | | | Ps. | (2,483,430 | ) | | Ps. | (856,188 | ) | | Ps. | 10,389,148 | |
Contributions made by plan participants | | | 198,713 | | | | (198,713 | ) | | | | | | | — | |
Contributions to the pension plan made by the Company | | | | | | | (2,697,621 | ) | | | | | | | (2,697,621 | ) |
Benefits paid | | | (18,841,754 | ) | | | 18,841,754 | | | | | | | | — | |
Payments to employees | | | (9,843,743 | ) | | | | | | | | | | | (9,843,743 | ) |
Effect of translation | | | (2,579,506 | ) | | | 2,058,099 | | | | (423,800 | ) | | | (945,207 | ) |
| | | | | | | | | | | | | | | | |
Others | | Ps. | (31,066,290 | ) | | Ps. | 18,003,519 | | | Ps. | (423,800 | ) | | Ps. | (13,486,571 | ) |
Balance at the end of the year | | | 329,113,625 | | | | (227,688,604 | ) | | | 6,519,560 | | | | 107,944,581 | |
Less short-term portion | | | (172,406 | ) | | | | | | | | | | | (172,406 | ) |
| | | | | | | | | | | | | | | | |
Non-current obligation | | Ps. | 328,941,219 | | | Ps. | (227,688,604) | | | Ps. | 6,519,560 | | | Ps. | 107,772,175 | |
| | | | | | | | | | | | | | | | |
F-68
| | | | | | | | | | | | | | | | |
| | | At December 31, 2018 | |
| | | DBO | | | Plan Assests | | | Effect of asset
celling | | | Net employee
benefit liability | |
Balance at the beginning of the year | | Ps. | 329,113,625 | | | Ps. | (227,688,604 | ) | | Ps. | 6,519,560 | | | Ps. | 107,944,581 | |
Current service cost | | | 3,322,813 | | | | | | | | | | | | 3,322,813 | |
Interest cost on projected benefit obligation | | | 30,185,257 | | | | | | | | | | | | 30,185,257 | |
Expected return on plan assets | | | | | | | (20,804,104 | ) | | | | | | | (20,804,104 | ) |
Changes in the asset ceiling during the period and others | | | | | | | | | | | 587,373 | | | | 587,373 | |
Past service costs and other | | | | | | | 157,765 | | | | | | | | 157,765 | |
Actuarial gain for changes in experience | | | (7,222 | ) | | | | | | | | | | | (7,222 | ) |
Actuarial loss from changes in demographic assumptions | | | 134,625 | | | | | | | | | | | | 134,625 | |
Actuarial gain from changes in financial assumptions | | | (24,890 | ) | | | | | | | | | | | (24,890 | ) |
| | | | | | | | | | | | | | | | |
Net period cost | | Ps. | 33,610,583 | | | Ps. | (20,646,339 | ) | | Ps. | 587,373 | | | Ps. | 13,551,617 | |
Actuarial gain for changes in experience | | | (21,283,470 | ) | | | | | | | | | | | (21,283,470 | ) |
Actuarial loss from changes in demographic assumptions | | | 68,482 | | | | | | | | | | | | 68,482 | |
Actuarial gain from changes in financial assumptions | | | (1,246,539 | ) | | | | | | | | | | | (1,246,539 | ) |
Changes in the asset ceiling during the period and others | | | | | | | | | | | (1,055,409 | ) | | | (1,055,409 | ) |
Return on plan assets greater than discount rate | | | | | | | 23,503,296 | | | | | | | | 23,503,296 | |
| | | | | | | | | | | | | | | | |
Recognized in other comprehensive income | | Ps. | (22,461,527 | ) | | Ps. | 23,503,296 | | | Ps. | (1,055,409 | ) | | Ps. | (13,640 | ) |
Contributions made by plan participants | | | 173,722 | | | | (173,722 | ) | | | | | | | — | |
Contributions to the pension plan made by the Company | | | | | | | (1,565,792 | ) | | | | | | | (1,565,792 | ) |
Benefits paid | | | (19,546,541 | ) | | | 19,546,541 | | | | | | | | — | |
Payments to employees | | | (10,651,938 | ) | | | | | | | | | | | (10,651,938 | ) |
Effect of translation | | | (3,535,477 | ) | | | 3,353,498 | | | | (963,981 | ) | | | (1,145,960 | ) |
| | | | | | | | | | | | | | | | |
Others | | Ps. | (33,560,234 | ) | | Ps. | 21,160,525 | | | Ps. | (963,981 | ) | | Ps. | (13,363,690 | ) |
Balance at the end of the year | | | 306,702,447 | | | | (203,671,122 | ) | | | 5,087,543 | | | | 108,118,868 | |
Less short-term portion | | | (212,141 | ) | | | | | | | | | | | (212,141 | ) |
| | | | | | | | | | | | | | | | |
Non-current obligation | | Ps. | 306,490,306 | | | Ps. | (203,671,122 | ) | | Ps. | 5,087,543 | | | Ps. | 107,906,727 | |
| | | | | | | | | | | | | | | | |
In the case of other subsidiaries in Mexico, the net period cost (income) of other employee benefits for the years ended December 31, 2016, 2017 and 2018 was Ps. 200,455, Ps. 165,884 and Ps. ( 16,347), respectively. The balance of employee benefits at December 31, 2017 and 2018 was Ps. 1,055,625 and Ps. 924,548, respectively.
In the case of other subsidiaries in Brazil, the net period cost of other employee benefits for the years ended December 31, 2016, 2017 and 2018 was Ps. 65,101, Ps.93,742 and Ps. 98,658, respectively. The balance of employee benefits at December 31, 2017 and 2018 was Ps. 650,815 and Ps. 724,009, respectively.
In the case of Ecuador, the net period cost of other employee benefits for the years ended December 31, 2016, 2017 and 2018 was Ps. 41,380, Ps.152,335 and Ps. 58,354, respectively. The balance of employee benefits at December 31, 2017 and 2018 was Ps. 403,194 and Ps. 448,608, respectively.
F-69
Plan assets are invested in:
| | | | | | | | | | | | | | | | | | | | | | | | |
| | | At December 31 | |
| | | 2017 | | | 2018 | |
| | | Puerto Rico | | | Brazil | | | Mexico | | | Puerto Rico | | | Brazil | | | Mexico | |
Equity instruments | | | 37% | | | | 6% | | | | 61% | | | | 37% | | | | — | | | | 39% | |
Debt instruments | | | 61% | | | | 88% | | | | 39% | | | | 60% | | | | 94% | | | | 61% | |
Others | | | 2% | | | | 6% | | | | — | | | | 3% | | | | 6% | | | | — | |
| | | | | | | | | | | | | | | | | | | | | | | | |
| | | 100% | | | | 100% | | | | 100% | | | | 100% | | | | 100% | | | | 100% | |
| | | | | | | | | | | | | | | | | | | | | | | | |
Included in the Telmex’s net pension plan liability are plan assets of Ps. 182,539,376 and Ps. 163,404,418 as of December 31, 2017 and 2018, respectively, of which 32.0% and 30.4% during 2017 and 2018, respectively, were invested in equity and debt instruments of both América Movil and also of related parties, primarily entities that are under common control of the Company’s principal shareholder. The Telmex pension plan recorded are-measurement of its defined pension plan of Ps. 12,394,617 and Ps. (1,141,142) during 2017 and 2018, respectively, attributable to a change in actuarial assumptions, and also a decline in the fair value of plan investments from December 31, 2017 to December 31, 2018. The decrease in fair value of the aforementioned related party pension plan investments approximated Ps. 437,663 and Ps. 21,279,760 during the year ended December 31, 2017 and 2018, respectively.
The assumptions used in determining the net period cost were as follows:
| | | | | | | | | | | | | | | | | | | | | | | | | | | | | | | | | | | | | | | | | | | | | | | | |
| | | 2016 | | | 2017 | | | 2018 | |
| | | Puerto
Rico | | | Brazil | | | Mexico | | | Europe | | | Puerto
Rico | | | Brazil | | | Mexico | | | Europe | | | Puerto
Rico | | | Brazil | | | Mexico | | | Europe | |
Discount rate and long- term rate return | | | 4.16 | % | | | 10.84 | % | | | 10.70 | % | |
| 1.0%, 1.5% &
1.75% |
| | | 3.61% | | | | 10.18 | % | | | 10.70% | | |
| 1.0%,
1.5% & 2.00% |
| | | 4.45% | | | | 9.10 | % | | | 11.81% | | |
| 1.25%,
1.75% & 2.00% |
|
Rate of future salary increases | | | 3.50 | % | | | 4.85 | % | | | 4.50 | % | |
| 3.0.%,
3.9% & 4.4% |
| | | 2.75% | | | | 4.50 | % | | | 4.50% | | |
| 3.0.%,
3.5% & 4.4% |
| | | 2.75% | | | | 4.00 | % | | | 3.55% | | |
| 3.0.%,
3.5% & 4.4% |
|
Percentage of increase in health care costs for the coming year | | | 4.20 | % | | | 11.35 | % | | | | | | | | | | | 3.57% | | | | 11.00 | % | | | | | | | | | | | 3.87% | | | | 10.50 | % | | | | | | | | |
Year to which this level will be maintained | | | N/A | | | | 2017 | | | | | | | | | | | | N/A | | | | 2028 | | | | | | | | | | | | N/A | | | | 2029 | | | | | | | | | |
Rate of increase of pensions | | | | | | | | | | | 3.83 | % | | | 1.60% | | | | | | | | | | | | 3.83% | | | | 1.60% | | | | | | | | | | | | 3.47% | | | | 1.60% | |
Employee turnover rate* | | | | | | | | | | | | | | | 0.0%-1.88% | | | | | | | | | | | | | | | | 0.0%-1.72% | | | | | | | | | | | | | | | | 0.0%-1.51% | |
| * | Depending on years of service |
Biometric
| | |
| Puerto Rico: | | |
| Mortality: | | RP 2014, MSS 2018 Tables. |
| Disability: | | 1985 Pension Disability Table |
| Brazil: | | |
| Mortality: | | 2000 Basic AT Table for gender |
| Disability for assets: | | UP 84 modified table for gender |
| Disability retirement: | | 80 CSO Code Table |
| Rotation: | | Probability of leaving the Company other than death, Disability and retirement is zero |
F-70
Europe
Life expectancy in Austria is base on “AVÖ2018-P – Rechnungsgrundlagen für die Pensionsversicherung – Pagler & Pagler” (2017: “AVÖ2008-P – Rechnungsgrundlagen für die Pensionsversicherung – Pagler & Pagler”).
| | |
| Telmex | | |
| Mortality: | | Mexican 2000 (CNSF) adjusted |
| Disability: | | Mexican Social Security adjusted by Telmex experience |
| Turnover: | | Telmex experience |
| Retirement: | | Telmex experience |
For the year ended December 31, 2018, the Company conducted a sensitivity analysis on the most significant variables that affect the DBO, simulating independently, reasonable changes to roughly 100 basis points in each of these variables. The increase (decrease) would have resulted in the DBO pension and other benefits at December 31, 2018 are as follows:
| | | | | | | | |
| | | -100 points | | | +100 points | |
Discount rate | | Ps. | 37,185,664 | | | Ps. | (38,604,684 | ) |
Health care cost trend rate | | Ps. | (651,697 | ) | | Ps. | 761,278 | |
Telmex Plans
Part of the Telmex´s employees are covered under defined benefit pension plans and seniority premiums. Pension benefits and seniority premiums are determined on the basis of compensation received by the employees in their final year of employment, their seniority, and their age at the time of retirement. Telmex has set up an irrevocable trust fund to finance these employee benefits and has adopted the policy of making contributions to such fund when it is considered necessary.
Defined benefits plan in Austria
Telekom Austria Group provides defined benefits for certain former employees in Austria. All such employees are retired and were employed prior to January 1, 1975. This unfunded plan provides benefits based on a percentage of salary and years employed, not exceeding 80% of the salary before retirement, and taking into consideration the pension provided by the social security system. Telekom Austria Group is exposed to the risk of development of life expectancy and inflation because the benefits from pension plans are lifetime benefits. Furthermore, approximately 7% of the pension benefit obligations at December 31, 2018 relate to the employees of the company Akenes in Lausanne, acquired in 2017.
Service awards in Austria
Civil servants and certain employees (together ‘employees’) are eligible to receive service awards. Under these plans, eligible employees receive a cash bonus of two months’ salary after 25 years of service and four months’ salary after 40 years of service. Employees with at least 35 years of service when retiring (at the age of 65) or who are retiring based on specific legal regulations are eligible to receive four monthly salaries. The compensation is accrued as earned over the period of service, taking into account the employee turnover rate. The risk Telekom Austria Group is exposed to is mainly the risk of development of salary increases and changes of interest rates.
Severance in Austria
Employees starting to work for Telekom Austria Group in Austria on or after 1 January 2003 are covered by a defined contribution plan. Telekom Austria Group paid Ps. 46,084 and Ps. 53,755 (1.53% of the salary) into this defined contribution plan (BAWAG Allianz Mitarbeitervorsorgekasse AG) in 2017 and 2018, respectively.
Severance benefit obligations for employees hired before 1 January 2003, excluding civil servants, are covered by defined benefit plans. Upon termination by Telekom Austria Group or retirement, eligible employees receive severance payments
F-71
equal to a multiple of their monthly compensation which comprises fixed compensation plus variable elements such as overtime or bonuses. Maximum severance is equal to a multiple of twelve times the eligible monthly compensation. In case of death, the heirs of eligible employees receive 50% of the severance benefits. Telekom Austria Group is exposed to the risk of development of salary increases and changes of interest rates.
b) The defined contribution plans (DCP)
Brazil
Claro makes contributions to the DCP through Embratel Social Security Fund—Telos. Contributions are computed based on the salaries of the employees, who decide on the percentage of their contributions to the plan (participants enrolled before October 31st, 2014 is from 3% to 8% and, for those subscribed after that date, the contribution is from 1% to 7% of their salaries). Claro contributes the same percentage as the employee, capped at 8% of the participant’s balance for the employees that are eligible to participate in this plan.
The unfunded liability represents Claro’s obligation for those participants that migrated from the DBP to the DCP. This liability is being paid over a term of 20 years as of January 1, 1999. Unpaid balances are adjusted monthly based on the yield of the asset portfolio at that date and is increased based on the General Price Index of Brazil plus 6 percentage points per year.
At December 31, 2017 and 2018, the balance of the DCP liability was Ps. 136,402 and Ps. 92,238, respectively.
For the years ended December 31, 2016, 2017 and 2018 the cost (income) of labor were Ps. (935), Ps. 374 and Ps. 2,377, respectively.
Europe
In Austria, pension benefits are generally provided by the social security system, for employees, and by the government, for civil servants. The contributions of 12.55% that A1 Telekom Austria Group made in 2017 and 2018 to the social security system and the government in Austria, amount to Ps. 1,309,157 and Ps.1,420,446, respectively. Contributions of the foreign subsidiaries into the respective systems range between 7% and 29% and amount to Ps. 453,641 and Ps. 518,607 in 2017 and 2018, respectively.
Additionally, Telekom Austria Group sponsors a defined contribution plan for employees of some of its Austrian subsidiaries. Telekom Austria Group’s contributions to this plan are based on a percentage of the compensation not exceeding 5%. The annual expenses for this plan amounted to Ps. 258,891, Ps. 256,507 and Ps. 272,453 in 2016, 2017 and 2018, respectively.
As of December 31, 2017 and 2018 the liability related to this defined contribution plan amounted to Ps. 120,892 and Ps. 116,244, respectively.
Other countries
For the rest of the countries where the Company operates and that do not have defined benefit plans or defined contribution plans, the Company makes contributions to the respective governmental social security agencies which are recognized in results of operations as they are incurred.
F-72
Long- term direct employee benefits
| | | | | | | | | | | | | | | | | | | | | | | | |
| | | Balance at
December 31,
2016 | | | | | | | | | Applications | | | Balance at
December 31,
2017 | |
| | | Effect of
translation | | | Increase of
the year | | | Payments | | | Reversals | |
Long-term direct employee benefits | | Ps. | 11,251,499 | | | Ps. | 795,581 | | | Ps. | 771,274 | | | Ps. | (2,077,632 | ) | | Ps. | (582,686 | ) | | Ps. | 10,158,036 | |
| | | | | | | | | | | | | | | | | | | | | | | | |
| | | | | |
| | | Balance at
December 31,
2017 | | | | | | | | | Applications | | | Balance at
December 31,
2018 | |
| | | Effect of
translation | | | Increase of
the year | | | Payments | | | Reversals | |
Long-term direct employee benefits | | Ps. | 10,158,036 | | | Ps. | (493,795 | ) | | Ps. | 1,750,831 | | | Ps. | (2,079,880 | ) | | Ps. | (1,223,414 | ) | | Ps. | 8,111,778 | |
| | | | | | | | | | | | | | | | | | | | | | | | |
In 2008, a comprehensive restructuring program was initiated in the segment Austria. The provision for restructuring includes future compensation of employees who will no longer provide services for Telekom Austria Group but who cannot be laid off due to their status as civil servants. These employment contracts are onerous contracts under IAS 37, as the unavoidable cost related to the contractual obligation exceeds the future economic benefit. The restructuring program also includes social plans for employees whose employments will be terminated in a socially responsible way. In 2009 and every year from 2011 to 2018, new social plans were initiated which provide for early retirement, special severance packages and golden handshake options. Due to their nature as termination benefits, these social plans are accounted for according to IAS 19.
18. Financial Assets and Liabilities
Set out below is the categorization of the financial instruments, excluding cash and cash equivalents, held by the Company as of December 31, 2017 and 2018:
| | | | | | | | | | | | |
| | | December 31, 2017 | |
| | | Loans and
Receivables | | | Fair value
through
profit or loss | | | Fair value
through OCI | |
Financial Assets: | | | | | | | | | | | | |
Equity investments at fair value through OCI and other short term investments | | Ps. | 12,438,019 | | | Ps. | — | | | Ps. | 46,682,657 | |
Accounts receivable from subscribers, distributors, contractual assets and other | | | 163,085,537 | | | | — | | | | — | |
Related parties | | | 868,230 | | | | — | | | | — | |
Derivative financial instruments | | | — | | | | 8,037,384 | | | | — | |
| | | | | | | | | | | | |
Total | | Ps. | 176,391,786 | | | Ps. | 8,037,384 | | | Ps. | 46,682,657 | |
| | | | | | | | | | | | |
Financial Liabilities: | | | | | | | | | | | | |
Debt | | Ps. | 697,884,899 | | | Ps. | — | | | Ps. | — | |
Accounts payable | | | 212,673,407 | | | | — | | | | — | |
Related parties | | | 2,540,412 | | | | — | | | | — | |
Derivative financial instruments | | | — | | | | 14,359,460 | | | | — | |
| | | | | | | | | | | | |
Total | | Ps. | 913,098,718 | | | Ps. | 14,359,460 | | | Ps. | — | |
| | | | | | | | | | | | |
F-73
| | | | | | | | | | | | |
| | | December 31, 2018 | |
| | | Loans and
Receivables | | | Fair value
through
profit or loss | | | Fair value
through OCI | |
Financial Assets: | | | | | | | | | | | | |
Equity investments at fair value through OCI and other short term investments | | Ps. | 9,987,851 | | | Ps. | — | | | Ps. | 39,028,083 | |
Accounts receivable from subscribers, distributors, contractual assets and other | | | 185,202,494 | | | | — | | | | — | |
Related parties | | | 1,263,605 | | | | — | | | | — | |
Derivative financial instruments | | | — | | | | 5,287,548 | | | | — | |
| | | | | | | | | | | | |
Total | | Ps. | 196,453,950 | | | Ps. | 5,287,548 | | | Ps. | 39,028,083 | |
| | | | | | | | | | | | |
Financial Liabilities: | | | | | | | | | | | | |
Debt | | Ps. | 638,922,453 | | | Ps. | — | | | Ps. | — | |
Accounts payable | | | 221,957,267 | | | | — | | | | — | |
Related parties | | | 2,974,213 | | | | — | | | | — | |
Derivative financial instruments | | | — | | | | 17,107,579 | | | | — | |
| | | | | | | | | | | | |
Total | | Ps. | 863,853,933 | | | Ps. | 17,107,579 | | | Ps. | — | |
| | | | | | | | | | | | |
Fair value hierarchy
The Company’s valuation techniques used to determine and disclose the fair value of its financial instruments are based on the following hierarchy:
Level 1: Quoted prices (unadjusted) in active markets for identical assets or liabilities;
Level 2: Variables other than quoted prices in Level 1 that are observable for the asset or liability, either directly (prices) or indirectly (derived from prices); and
Level 3: Variables used for the asset or liability that are not based on any observable market data(non-observable variables).
The fair value for the financial assets (excluding cash and cash equivalents) and financial liabilities shown in the consolidated statements of financial position at December 31, 2017 and 2018 is as follows:
| | | | | | | | | | | | | | | | |
| | | Measurement of fair value at December 31, 2017 | |
| | | Level 1 | | | Level 2 | | | Level 3 | | | Total | |
Assets: | | | | | | | | | | | | | | | | |
Equity investments at fair value through OCI and other short-term investments | | Ps. | 46,682,657 | | | Ps. | 12,438,019 | | | Ps. | — | | | Ps. | 59,120,676 | |
Derivative financial instruments | | | — | | | | 8,037,384 | | | | — | | | | 8,037,384 | |
Pension plan assets | | | 218,518,358 | | | | 9,039,270 | | | | 130,976 | | | | 227,688,604 | |
| | | | | | | | | | | | | | | | |
Total | | Ps. | 265,201,015 | | | Ps. | 29,514,673 | | | Ps. | 130,976 | | | Ps. | 294,846,664 | |
| | | | | | | | | | | | | | | | |
Liabilities: | | | | | | | | | | | | | | | | |
Debt | | Ps. | 691,769,785 | | | Ps. | 63,147,153 | | | Ps. | — | | | Ps. | 754,916,938 | |
Derivative financial instruments | | | — | | | | 14,359,460 | | | | — | | | | 14,359,460 | |
| | | | | | | | | | | | | | | | |
Total | | Ps. | 691,769,785 | | | Ps. | 77,506,613 | | | Ps. | — | | | Ps. | 769,276,398 | |
| | | | | | | | | | | | | | | | |
F-74
| | | | | | | | | | | | | | | | |
| | | Measurement of fair value at December 31, 2018 | |
| | | Level 1 | | | Level 2 | | | Level 3 | | | Total | |
Assets: | | | | | | | | | | | | | | | | |
Equity investments at fair value through OCI and other short-term investments | | Ps. | 39,028,083 | | | Ps. | 9,987,851 | | | Ps. | — | | | Ps. | 49,015,934 | |
Derivative financial instruments | | | — | | | | 5,287,548 | | | | — | | | | 5,287,548 | |
Pension plan assets | | | 186,557,731 | | | | 17,096,344 | | | | 17,047 | | | | 203,671,122 | |
| | | | | | | | | | | | | | | | |
Total | | Ps. | 225,585,814 | | | Ps. | 32,371,743 | | | Ps. | 17,047 | | | Ps. | 257,974,604 | |
| | | | | | | | | | | | | | | | |
Liabilities: | | | | | | | | | | | | | | | | |
Debt | | Ps. | 594,713,342 | | | Ps. | 99,723,251 | | | Ps. | — | | | Ps. | 694,436,593 | |
Derivative financial instruments | | | | | | | 17,107,579 | | | | — | | | | 17,107,579 | |
| | | | | | | | | | | | | | | | |
Total | | Ps. | 594,713,342 | | | Ps. | 116,830,830 | | | Ps. | — | | | Ps. | 711,544,172 | |
| | | | | | | | | | | | | | | | |
Fair value of derivative financial instruments is valued using valuation techniques with market observable inputs. To determine its Level 2 fair value, the Company applies different valuation techniques including forward pricing and swaps models, using present value calculations. The models incorporate various inputs including credit quality of counterparties, foreign exchange spot and forward rates and interest rate curves. Fair value of debt Level 2 has been determined using a model based on present value calculation incorporating credit quality of AMX. The Company’s investment in equity investments at fair value, specifically the investment in KPN, is valued using the quoted prices (unadjusted) in active markets for identical assets. The net realized gain related to derivative financial instruments for the years ended December 31, 2017 and 2018 was Ps. 1,515,668 and Ps. 5,286,290, respectively.
For the years ended December 31, 2016, 2017 and 2018, no transfers were made between Level 1 and Level 2 fair value measurement hierarchies.
Changes in liabilities arising from financing activities
| | | | | | | | | | | | | | | | |
| | | At January 1,
2017 | | | Cash flow | | | Foreign currency
exchange and
other | | | At December 31,
2017 | |
| | | | |
Total liabilities from financing activities | | Ps. | 707,801,403 | | | Ps. | (27,433,489 | ) | | Ps. | 17,516,985 | | | Ps. | 697,884,899 | |
| | | | | | | | | | | | | | | | |
| | | | |
| | | At January 1,
2018 | | | Cash flow | | | Foreign currency
exchange and
other | | | At December 31,
2018 | |
| | | | |
Total liabilities from financing activities | | Ps. | 697,884,899 | | | Ps. | (34,050,923 | ) | | Ps. | (24,911,523 | ) | | Ps. | 638,922,453 | |
| | | | | | | | | | | | | | | | |
19. Shareholders’ Equity
a) Pursuant to the Company’s bylaws, the capital stock of the Company consists of a minimum fixed portion of Ps. $270,049 (nominal amount), represented by a total of 71,063,212,170 shares (including treasury shares available for placement in accordance with the provisions of the Ley del Mercado de Valores), of which (i) 20,601,632,660 are “AA” shares (full voting rights); (ii) 558,677,704 are “A” shares (full voting rights); and (iii) 49,902,901,806 are “L” shares (limited voting rights).
b) As of December 31, 2018 and 2017, the Company’s capital structure was represented by 66,034,792,526 (20,601,632,660 “AA” shares, 546,112,938 “A” shares and 44,887,046,928 “L” shares), and 66,069,035,539 (20,601,632,660 “AA” shares, 566,661,526 “A” shares and 44,900,741,353 “L” shares), respectively, not including treasury shares.
F-75
c) As of December 31, 2018 and 2017, the Company’s treasury held for placement in accordance with the provisions of the Ley del Mercado de Valores and the Disposiciones de carácter general aplicables a las emisoras de valores y a otros participantes en el Mercado de valores issued by the Comisión Nacional Bancaria y de Valores, a total amount of 5,028,419,644 shares (5,028,399,396 “L” shares and 20,248 “A” shares); and 29,420,688,657 shares (29,419,120,359 “L” shares and 1,568,298 “A” shares), respectively, all acquired pursuant to the Company’s share repurchase program.
d) The holders of “AA” and “A” shares are entitled to full voting rights. The holders of “L” shares may only vote in limited circumstances, and they are only entitled to appoint two members of the Board of Directors and their respective alternates. The matters in which “L” shares holders are entitled to vote are the following: extension of the Company´s corporate life, dissolution of the Company, change of Company’s corporate purpose, change of nationality of the Company, transformation of the Company, a merger with another company, any transaction representing 20% or more of the Company’s consolidated assets, as well as the cancellation of the inscription of the shares issued by the Company at the Registro Nacional de Valores and any other foreign stock exchanges where they may be registered, except for quotation systems or other markets not organized as stock exchanges. Within their respective series, all shares confer the same rights to their holders.
The Company’s bylaws contain restrictions and limitations related to the subscription and acquisition of “AA” shares bynon-Mexican investors.
e) Pursuant to the Company’s bylaws, “AA” shares must at all times represent no less than 20% and no more than 51% of the Company’s capital stock, and they shall also represent at all times, no less than 51% of the common shares (entitled to full voting rights, represented by “AA” and “A” shares) representing said capital stock.
“A” shares, which may be freely subscribed, must not represent more than 19.6% of capital stock and must not exceed 49% of the common shares representing such capital. Common shares (entitled to full voting rights, represented by “AA” and “A” shares), must represent no more than 51% of the Company’s capital stock.
Lastly, “L” shares which have limited voting rights and may be freely subscribed may not exceed, along with “A” shares, 80% of the Company’s capital stock. For purposes of determining these restrictions, the percentages mentioned above refer only to the number of the Company’s shares outstanding.
Dividends
On April 16, 2018, the Company’s shareholders approved, among other resolutions, the payment of a dividend of Ps. $0.32(thirty-two peso cents) per share to each of the shares series of its capital stock “AA”, “A” and “L”. Such dividend was paid in two installments of Ps. $0.16 (sixteen peso cents) each, on July 16 and November 12, 2018 respectively.
On April 5, 2017, the Company’s shareholders approved, among other resolutions, the payment of a dividend of Ps. $0.30 (thirty peso cents) per share to each of the shares series of its capital stock “AA”, “A” and “L”, such dividend was payable, at each share holders’ election, in cash, “L” series shares or a combination thereof, in two installments of Ps. $0.15 (fifteen peso cents) each, on July 17 and November 13, 2017 respectively. As a result of the shareholders elections, on July 17, 2017 and November 13, 2017, AMX placed into circulation 325,264,125 and 16,905,414 series “L” shares, respectively.
Legal Reserve
According to the Ley General de Sociedades Mercantiles, companies must allocate from the net profit of each year, at least 5% to increase the legal reserve until it reaches 20% of its capital stock. This reserve may not be distributed to shareholders during the existence of the Company, except as a stock dividend. As of December 31, 2018 and 2017, the legal reserve amounted Ps. 358,440.
F-76
Restrictions on Certain Transactions
Pursuant to the Company’s bylaws any transfer of more than 10% of the full voting shares (“A” shares and “AA” shares), effected in one or more transactions by any person or group of persons acting in concert, requires prior approval by our Board of Directors. If the Board of Directors denies such approval, however, the Company bylaws require it to designate an alternate transferee, who must pay market price for the shares as quoted on the Bolsa Mexicana de Valores, S.A.B. de C.V.
Payment of Dividends
Dividends, either in cash or in kind, paid with respect to the “A” Shares, “L” Shares, “A” Share ADSs or “L” Share ADSs will generally be subject to a 10% Mexican withholding tax (provided that no Mexican withholding tax will apply to distributions of net taxable profits generated before 2015). Nonresident holders could be subject to a lower tax rate, to the extent that they are eligible for benefits under an income tax treaty to which Mexico is a party.
Earnings per Share
The following table shows the computation of the basic and diluted earnings per share:
| | | | | | | | | | | | |
| | | For the years ended December 31, | |
| | | 2016 | | | 2017 | | | 2018 | |
Net profit for the period attributable
to equity holders of the parent | | Ps. | 8,649,427 | | | Ps. | 29,325,921 | | | Ps. | 52,566,197 | |
Weighted average shares (in millions) | | | 65,693 | | | | 65,909 | | | | 66,055 | |
| | | | | | | | | | | | |
Earnings per share attributable to
equity holders of the parent | | | 0.13 | | | | 0.44 | | | | 0.79 | |
| | | | | | | | | | | | |
Subordinated Perpetual Fixed Rate Bond
On January 3, 2018, the Company decided to call and redeem the Telekom Austria subordinated perpetual Fixed Rate Bond (hybrid bond) amounting to 600 million of Euros, according to the terms and conditions of the bond, at its nominal value plus all interest on February 1, 2018, the first call date. The Company paid an amount of Ps 13,440,120.
20. Components of other comprehensive (loss) income
The movement on the components of the other comprehensive (loss) income for the years ended December 31, 2016, 2017 and 2018 is as follows:
| | | | | | | | | | | | |
| | | For the years ended December 31, | |
| | | 2016 | | | 2017 | | | 2018 | |
Controlling interest: | | | | | | | | | | | | |
Valuation of the derivative financial instruments, net of deferred taxes | | Ps. | 48,496 | | | Ps. | 12,292 | | | Ps. | — | |
Unrealized (loss) gain on equity investments at fair value, net of deferred taxes | | | (6,673,731 | ) | | | 622,424 | | | | (3,765,688 | ) |
Translation effect of foreign entities | | | 104,178,880 | | | | (21,683,333 | ) | | | (61,223,458 | ) |
Remeasurement of defined benefit plan, net of deferred taxes | | | 14,771,770 | | | | (7,075,606 | ) | | | 652,722 | |
Non-controlling interest of the items above | | | 3,322,090 | | | | 3,402,973 | | | | (2,986,018 | ) |
| | | | | | | | | | | | |
Other comprehensive (loss) income | | Ps. | 115,647,505 | | | Ps. | (24,721,250 | ) | | Ps. | (67,322,442 | ) |
| | | | | | | | | | | | |
F-77
21. Valuation of derivatives, interest cost from labor obligations and other financial items, net
For the years ended December 31, 2016, 2017 and 2018, valuation of derivatives and other financial items are as follows:
| | | | | | | | | | | | |
| | | For the years ended December 31, | |
| | | 2016 | | | 2017 | | | 2018 | |
Controlling interest: | | | | | | | | | | | | |
(Loss) gain in valuation of derivatives, net | | Ps. | (9,622,233 | ) | | Ps. | 8,192,567 | | | Ps. | (4,686,407 | ) |
Capitalized interest expense (Note 10 d) | | | 2,861,307 | | | | 2,875,034 | | | | 2,020,288 | |
Commissions | | | (2,034,972 | ) | | | (1,263,701 | ) | | | (1,901,473 | ) |
Interest cost of labor obligations (Note 17) | | | (9,178,513 | ) | | | (8,722,611 | ) | | | (9,968,526 | ) |
Interest expense on taxes | | | (245,922 | ) | | | (1,503,981 | ) | | | (555,921 | ) |
Dividend received (Note 4) | | | 5,740,092 | | | | 2,385,559 | | | | 2,605,333 | |
Gain on net monetary positions (Note 2i, c) | | | — | | | | — | | | | 4,429,145 | |
Other financial cost | | | (3,745,600 | ) | | | (3,906,627 | ) | | | (2,118,755 | ) |
| | | | | | | | | | | | |
Total | | Ps. | (16,225,841 | ) | | Ps. | (1,943,760 | ) | | Ps. | (10,176,316 | ) |
| | | | | | | | | | | | |
22. Segments
América Móvil operates in different countries. As mentioned in Note 1, the Company has operations in Mexico, Guatemala, Nicaragua, Ecuador, El Salvador, Costa Rica, Brazil, Argentina, Colombia, United States, Honduras, Chile, Peru, Paraguay, Uruguay, Dominican Republic, Puerto Rico, Panama, Austria, Croatia, Bulgaria, Belarus, Macedonian, Serbia and Slovenia. The accounting policies for the segments are the same as those described in Note 2.
The Chief Executive Officer, who is the Chief Operating Decision Maker (“CODM”), analyzes the financial and operating information by operating segment. All operating segments that (i) represent more than 10% of consolidated revenues, (ii) more than the absolute amount of its reported 10% of profits before income tax or (iii) more than 10% of consolidated assets, are presented separately.
The Company presents the following reportable segments for the purposes of its consolidated financial statements: Mexico (includes Telcel and Corporate operations and assets), Telmex (Mexico), Brazil, Southern Cone (includes Argentina, Chile, Paraguay and Uruguay), Central America (includes Guatemala, El Salvador, Honduras, Nicaragua, Costa Rica and Panama), U.S.A. (excludes Puerto Rico), Caribbean (includes Dominican Republic and Puerto Rico), and Europe (includes Austria, Bulgaria, Croatia, Belarus, Slovenia, Macedonia and Serbia).
The segment Southern Cone comprises mobile communication services in Argentina as well as Chile, Paraguay and Uruguay. In 2018, hyperinflation accounting in accordance with IAS 29 was initially applied to Argentina, which results in the restatement ofnon-monetary assets, liabilities and all items of the statements of comprehensive income for the change in a general price index and the translation of these items applying theyear-end exchange rate. In accordance with IFRS comparative amounts for 2016 and 2017 were not restated.
The Company considers that the quantitative and qualitative aspects of any aggregated operating segments (that is, Central America and Caribbean reportable segments) are similar in nature for all periods presented. In evaluating the appropriateness of aggregating operating segments, the key indicators considered included but were not limited to: (i) the similarity of key financial statements measures and trends, (ii) all entities provide telecommunications services, (iii) similarities of customer base and services, (iv) the methods to distribute services are the same, based on telephone plant in both cases, wireless and fixed lines, (v) similarities of governments and regulatory entities that oversee the activities and services of telecom companies, (vi) inflation trends, and (vii) currency trends.
F-78
| | | | | | | | | | | | | | | | | | | | | | | | | | | | | | | | | | | | | | | | | | | | | | | | |
| | | Mexico | | | Telmex | | | Brazil | | | Southern Cone | | | Colombia | | | Andean | | | Central
America | | | U.S.A. | | | Caribbean | | | Europe | | | Eliminations | | | Consolidated
total | |
At December 31 2016 (in Ps.): | | | | | | | | | | | | | | | | | | | | | | | | | | | | | | | | | | | | | | | | | | | | | | | | |
External revenues | | | 187,127,903 | | | | 93,343,612 | | | | 193,796,237 | | | | 71,553,356 | | | | 67,330,768 | | | | 55,825,972 | | | | 42,131,666 | | | | 140,856,365 | | | | 36,467,781 | | | | 86,978,828 | | | | — | | | | 975,412,488 | |
Intersegment revenues | | | 16,438,858 | | | | 8,872,248 | | | | 3,560,388 | | | | 776,719 | | | | 257,767 | | | | 304,834 | | | | 289,465 | | | | — | | | | 30,210 | | | | — | | | | (30,530,489 | ) | | | — | |
| | | | | | | | | | | | | | | | | | | | | | | | | | | | | | | | | | | | | | | | | | | | | | | | |
Total revenues | | | 203,566,761 | | | | 102,215,860 | | | | 197,356,625 | | | | 72,330,075 | | | | 67,588,535 | | | | 56,130,806 | | | | 42,421,131 | | | | 140,856,365 | | | | 36,497,991 | | | | 86,978,828 | | | | (30,530,489 | ) | | | 975,412,488 | |
Depreciation and amortization | | | 16,451,496 | | | | 17,150,013 | | | | 47,170,935 | | | | 9,739,634 | | | | 11,283,749 | | | | 7,764,474 | | | | 10,474,681 | | | | 1,073,623 | | | | 5,225,498 | | | | 22,525,050 | | | | (333,232 | ) | | | 148,525,921 | |
Operating income | | | 48,219,505 | | | | 12,275,892 | | | | 6,325,323 | | | | 8,317,053 | | | | 11,209,959 | | | | 6,086,638 | | | | 3,830,974 | | | | 1,220,601 | | | | 6,143,183 | | | | 5,388,595 | | | | 592,587 | | | | 109,610,310 | |
Interest income | | | 28,659,372 | | | | 303,915 | | | | 3,747,684 | | | | 2,649,539 | | | | 104,304 | | | | 944,945 | | | | 462,779 | | | | 239,797 | | | | 691,132 | | | | 286,784 | | | | (33,897,656 | ) | | | 4,192,595 | |
Interest expense | | | 32,004,944 | | | | 1,135,552 | | | | 22,970,335 | | | | 5,049,457 | | | | 1,079,989 | | | | 1,147,380 | | | | 411,597 | | | | — | | | | 143,322 | | | | 2,953,033 | | | | (33,033,597 | ) | | | 33,862,012 | |
Income tax | | | 2,502,242 | | | | 921,803 | | | | (4,294,040 | ) | | | 2,021,090 | | | | 4,456,750 | | | | 1,768,066 | | | | 3,291,776 | | | | 767,295 | | | | 2,542,080 | | | | (2,578,206 | ) | | | — | | | | 11,398,856 | |
Equity interest in net income
(loss) of associated companies | | | 67,472 | | | | 116,368 | | | | (270 | ) | | | (23,319 | ) | | | — | | | | — | | | | 171 | | | | — | | | | — | | | | 29,528 | | | | — | | | | 189,950 | |
Net profit (loss) attributable to equity holders of the parent | | | 378,150 | | | | 902,282 | | | | (10,357,493 | ) | | | 3,765,015 | | | | 4,022,633 | | | | 3,621,863 | | | | 538,890 | | | | 987,790 | | | | 3,318,960 | | | | 7,065,769 | | | | (5,594,432 | ) | | | 8,649,427 | |
Assets by segment | | | 1,070,598,204 | | | | 161,133,722 | | | | 461,831,754 | | | | 140,617,162 | | | | 103,361,235 | | | | 113,839,981 | | | | 80,832,029 | | | | 42,812,349 | | | | 93,941,695 | | | | 227,288,156 | | | | (981,214,013 | ) | | | 1,515,042,274 | |
Plant, property and equipment, net | | | 64,893,242 | | | | 112,220,236 | | | | 203,270,555 | | | | 67,023,143 | | | | 59,690,886 | | | | 37,716,772 | | | | 41,808,573 | | | | 1,949,166 | | | | 33,854,428 | | | | 78,763,065 | | | | — | | | | 701,190,066 | |
Goodwill | | | 27,186,328 | | | | 213,926 | | | | 26,106,622 | | | | 3,006,448 | | | | 14,659,891 | | | | 5,948,335 | | | | 5,652,268 | | | | 3,464,217 | | | | 14,186,723 | | | | 52,207,877 | | | | — | | | | 152,632,635 | |
Trademarks, net | | | 615,318 | | | | 307,881 | | | | 366,727 | | | | — | | | | 194 | | | | — | | | | — | | | | 788,228 | | | | 284,665 | | | | 10,203,880 | | | | — | | | | 12,566,893 | |
Licenses and rights, net | | | 5,887,092 | | | | 42,867 | | | | 41,496,209 | | | | 8,760,860 | | | | 4,603,793 | | | | 12,882,210 | | | | 3,993,120 | | | | — | | | | 7,694,798 | | | | 30,670,315 | | | | — | | | | 116,031,264 | |
Investment in associated companies | | | 7,605,220 | | | | 2,218,824 | | | | 699 | | | | 81,284 | | | | 470 | | | | — | | | | 17,390 | | | | — | | | | — | | | | 1,072,778 | | | | (7,393,181 | ) | | | 3,603,484 | |
Liabilities by segments | | | 798,044,609 | | | | 117,663,161 | | | | 349,915,118 | | | | 124,149,687 | | | | 40,811,337 | | | | 52,949,608 | | | | 38,095,161 | | | | 41,369,767 | | | | 44,790,656 | | | | 121,928,202 | | | | (485,698,799 | ) | | | 1,244,018,507 | |
At December 31, 2017 (in Ps.): | | | | | | | | | | | | | | | | | | | | | | | | | | | | | | | | | | | | | | | | | | | | | | | | |
External revenues | | | 190,022,612 | | | | 89,731,238 | | | | 210,536,673 | | | | 81,092,885 | | | | 72,435,460 | | | | 56,393,595 | | | | 44,094,835 | | | | 148,589,487 | | | | 35,092,578 | | | | 93,644,172 | | | | — | | | | 1,021,633,535 | |
Intersegment revenues | | | 16,748,428 | | | | 8,753,525 | | | | 4,785,601 | | | | 1,250,983 | | | | 304,555 | | | | 177,856 | | | | 187,086 | | | | 44 | | | | 122,656 | | | | — | | | | (32,330,734 | ) | | | — | |
| | | | | | | | | | | | | | | | | | | | | | | | | | | | | | | | | | | | | | | | | | | | | | | | |
Total revenues | | | 206,771,040 | | | | 98,484,763 | | | | 215,322,274 | | | | 82,343,868 | | | | 72,740,015 | | | | 56,571,451 | | | | 44,281,921 | | | | 148,589,531 | | | | 35,215,234 | | | | 93,644,172 | | | | (32,330,734 | ) | | | 1,021,633,535 | |
Depreciation and amortization | | | 17,030,251 | | | | 18,902,238 | | | | 51,486,652 | | | | 10,639,591 | | | | 12,373,790 | | | | 8,328,705 | | | | 9,668,439 | | | | 1,594,727 | | | | 5,349,757 | | | | 25,222,962 | | | | (422,170 | ) | | | 160,174,942 | |
Operating income (loss) | | | 50,666,028 | | | | 7,921,524 | | | | 11,601,369 | | | | 11,676,427 | | | | (4,704,165 | ) | | | 5,650,477 | | | | 5,252,401 | | | | 2,915,123 | | | | 4,752,168 | | | | 4,523,857 | | | | (111,906 | ) | | | 100,143,303 | |
Interest income | | | 30,083,437 | | | | 619,748 | | | | 3,792,242 | | | | 2,884,613 | | | | 211,521 | | | | 1,793,974 | | | | 1,064,992 | | | | 394,196 | | | | 1,111,980 | | | | 307,021 | | | | (39,338,076 | ) | | | 2,925,648 | |
Interest expense | | | 32,185,868 | | | | 1,028,593 | | | | 23,578,083 | | | | 4,637,989 | | | | 1,955,688 | | | | 1,573,929 | | | | 485,684 | | | | — | | | | 377,727 | | | | 2,035,716 | | | | (37,558,496 | ) | | | 30,300,781 | |
Income tax | | | 18,142,482 | | | | 387,145 | | | | (2,991,377 | ) | | | 3,535,302 | | | | (1,874,594 | ) | | | 1,806,085 | | | | 2,025,618 | | | | 1,803,555 | | | | 3,529,253 | | | | (1,417,358 | ) | | | (4,600 | ) | | | 24,941,511 | |
Equity interest in net income (loss) of associated companies | | | 99,044 | | | | 16,564 | | | | (232 | ) | | | (9,801 | ) | | | — | | | | — | | | | — | | | | — | | | | — | | | | (14,190 | ) | | | — | | | | 91,385 | |
Net profit (loss) attributable to equity holders of the parent | | | 26,321,442 | | | | 184,387 | | | | (6,617,381 | ) | | | 4,421,938 | | | | (6,209,530 | ) | | | 1,595,382 | | | | 3,713,301 | | | | 1,793,875 | | | | 1,262,073 | | | | 5,656,132 | | | | (2,795,698 | ) | | | 29,325,921 | |
Assets by segment | | | 1,033,036,406 | | | | 170,402,561 | | | | 428,281,963 | | | | 133,136,177 | | | | 108,362,023 | | | | 113,478,626 | | | | 81,529,691 | | | | 40,761,830 | | | | 88,672,466 | | | | 203,858,243 | | | | (915,308,134 | ) | | | 1,486,211,852 | |
Plant, property and equipment, net | | | 59,137,555 | | | | 109,713,770 | | | | 187,459,628 | | | | 69,006,093 | | | | 57,060,931 | | | | 35,930,966 | | | | 39,050,481 | | | | 1,693,642 | | | | 32,173,524 | | | | 85,116,608 | | | | — | | | | 676,343,198 | |
Goodwill | | | 27,102,384 | | | | 213,926 | | | | 24,708,739 | | | | 3,073,444 | | | | 13,981,033 | | | | 6,113,495 | | | | 5,597,990 | | | | 3,341,956 | | | | 14,186,723 | | | | 53,143,542 | | | | — | | | | 151,463,232 | |
Trademarks, net | | | 406,723 | | | | 274,786 | | | | 246,557 | | | | — | | | | — | | | | — | | | | — | | | | 631,024 | | | | 262,641 | | | | 8,116,076 | | | | — | | | | 9,937,807 | |
Licenses and rights, net | | | 11,457,720 | | | | 13,175 | | | | 35,662,305 | | | | 8,885,086 | | | | 4,197,498 | | | | 11,295,202 | | | | 3,376,106 | | | | — | | | | 7,276,039 | | | | 31,141,255 | | | | — | | | | 113,304,386 | |
Investment in associated companies | | | 469,662 | | | | 546,872 | | | | 640 | | | | 63,110 | | | | 451 | | | | — | | | | 16,999 | | | | — | | | | — | | | | 806,950 | | | | 1,830,488 | | | | 3,735,172 | |
Liabilities by segments | | | 794,598,013 | | | | 133,428,178 | | | | 322,620,030 | | | | 119,123,646 | | | | 54,756,152 | | | | 48,656,628 | | | | 35,501,900 | | | | 38,249,957 | | | | 43,978,410 | | | | 119,240,533 | | | | (484,575,112 | ) | | | 1,225,578,335 | |
F-79
| | | | | | | | | | | | | | | | | | | | | | | | | | | | | | | | | | | | | | | | | | | | | | | | |
At December 31, 2018 (in Ps.): | | | | | | | | | | | | | | | | | | | | | | | | | | | | | | | | | | | | | | | | | | | | | | | | |
External revenues | | | 207,610,244 | | | | 86,339,289 | | | | 188,712,666 | | | | 89,149,978 | | | | 75,460,428 | | | | 55,633,192 | | | | 44,883,585 | | | | 153,266,315 | | | | 36,435,541 | | | | 100,716,443 | | | | — | | | | 1,038,207,681 | |
Intersegment revenues | | | 16,946,543 | | | | 9,741,908 | | | | 4,593,760 | | | | 13,200,358 | | | | 344,517 | | | | 154,082 | | | | 149,445 | | | | — | | | | 204,294 | | | | — | | | | (45,334,907 | ) | | | — | |
| | | | | | | | | | | | | | | | | | | | | | | | | | | | | | | | | | | | | | | | | | | | | | | | |
Total revenues | | | 224,556,787 | | | | 96,081,197 | | | | 193,306,426 | | | | 102,350,336 | | | | 75,804,945 | | | | 55,787,274 | | | | 45,033,030 | | | | 153,266,315 | | | | 36,639,835 | | | | 100,716,443 | | | | (45,334,907 | ) | | | 1,038,207,681 | |
Depreciation and amortization | | | 17,619,342 | | | | 18,358,248 | | | | 42,857,751 | | | | 13,526,361 | | | | 13,464,867 | | | | 8,516,960 | | | | 8,940,655 | | | | 1,545,395 | | | | 5,036,831 | | | | 26,838,972 | | | | (992,802 | ) | | | 155,712,580 | |
Operating income (loss) | | | 57,450,599 | | | | 8,085,764 | | | | 23,494,903 | | | | 16,975,797 | | | | 14,388,552 | | | | 5,003,915 | | | | 4,867,763 | | | | 2,665,270 | | | | 5,811,846 | | | | 4,731,562 | | | | (3,918,800 | ) | | | 139,557,171 | |
Interest income | | | 26,578,280 | | | | 420,380 | | | | 11,303,888 | | | | 2,251,474 | | | | 1,013,839 | | | | 1,666,879 | | | | 1,566,086 | | | | 559,548 | | | | 1,458,874 | | | | 122,133 | | | | (36,295,212 | ) | | | 10,646,169 | |
Interest expense | | | 32,526,258 | | | | 1,153,913 | | | | 20,377,191 | | | | 4,338,941 | | | | 2,913,881 | | | | 1,719,663 | | | | 509,081 | | | | — | | | | 561,867 | | | | 1,973,431 | | | | (34,302,793 | ) | | | 31,771,433 | |
Income tax | | | 28,842,505 | | | | 643,377 | | | | 4,026,444 | | | | 1,390,039 | | | | 2,251,877 | | | | 2,498,666 | | | | 2,533,600 | | | | 810,898 | | | | 2,774,204 | | | | 707,093 | | | | (1,624 | ) | | | 46,477,079 | |
Equity interest in net income (loss) of associated companies | | | (5,962 | ) | | | 44,965 | | | | (152 | ) | | | (20,871 | ) | | | — | | | | — | | | | — | | | | — | | | | — | | | | (17,713 | ) | | | — | | | | 267 | |
Net profit (loss) attributable to equity holders of the parent | | | 23,185,029 | | | | (2,201,572 | ) | | | 3,530,653 | | | | 6,065,703 | | | | 9,165,801 | | | | 1,730,933 | | | | 2,821,733 | | | | 2,820,505 | | | | 3,644,697 | | | | 3,809,694 | | | | (2,006,979 | ) | | | 52,566,197 | |
Assets by segment | | | 970,564,314 | | | | 174,461,398 | | | | 390,791,480 | | | | 127,946,573 | | | | 111,975,598 | | | | 96,347,779 | | | | 81,640,157 | | | | 38,814,907 | | | | 102,531,547 | | | | 186,135,358 | | | | (851,985,719 | ) | | | 1,429,223,392 | |
Plant, property and equipment, net | | | 56,056,634 | | | | 103,737,293 | | | | 173,197,708 | | | | 62,988,635 | | | | 51,422,548 | | | | 35,800,477 | | | | 37,146,601 | | | | 1,356,237 | | | | 38,011,242 | | | | 80,421,642 | | | | (138,297 | ) | | | 640,000,720 | |
Goodwill | | | 27,104,632 | | | | 215,381 | | | | 21,388,124 | | | | 2,796,759 | | | | 12,770,380 | | | | 5,242,365 | | | | 5,466,871 | | | | 3,328,533 | | | | 14,186,723 | | | | 53,066,729 | | | | — | | | | 145,566,497 | |
Trademarks, net | | | 227,774 | | | | 243,556 | | | | 124,910 | | | | — | | | | — | | | | — | | | | — | | | | 507,033 | | | | 249,984 | | | | 3,313,948 | | | | — | | | | 4,667,205 | |
Licenses and rights, net | | | 10,573,147 | | | | — | | | | 25,873,910 | | | | 12,555,496 | | | | 3,400,235 | | | | 9,651,582 | | | | 3,605,416 | | | | — | | | | 10,294,336 | | | | 27,344,273 | | | | — | | | | 103,298,395 | |
Investment in associated companies | | | 5,621,661 | | | | 563,667 | | | | 543 | | | | 20,697 | | | | 412 | | | | — | | | | 24,262 | | | | — | | | | — | | | | 748,674 | | | | (3,847,209 | ) | | | 3,132,707 | |
Liabilities by segments | | | 748,965,728 | | | | 136,993,838 | | | | 298,308,084 | | | | 94,550,901 | | | | 56,211,438 | | | | 50,064,761 | | | | 28,592,953 | | | | 35,552,678 | | | | 58,716,154 | | | | 117,214,746 | | | | (441,820,311 | ) | | | 1,183,350,970 | |
F-80
23. Recently Issued Accounting Standards
New standards, amendments and interpretations not yet effective
The estimated impact and evaluation of the recently issued accounting standards not yet in effect as of December 31, 2018 are as follow:
IFRS 16, Leases
In January 2016, the IASB issued the new accounting standard, IFRS 16 Leases. The fundamental changes in this new standard affect the lessees’ recognition of leases in the financial statements. Generally, all leases have to be recognized based on the “right of use approach”.
IFRS 16 replaces IAS 17 Leases, IFRIC 4 Determining whether an Arrangement contains a Lease,SIC-15 Operating Leases- Incentives andSIC-27 Evaluating the Substance of Transactions Involving the Legal Form of a Lease. IFRS 16 sets out the principles for the recognition, measurement, presentation and disclosure of leases and requires lessees to account for all leases under a singleon-balance sheet model similar to the accounting for finance leases under IAS 17. The standard includes two recognition exemptions for lessees – leases of’low-value’ assets (e.g., personal computers) and short-term leases (i.e., leases with a lease term of 12 months or less). At the commencement date of a lease, a lessee will recognize a liability to make lease payments (i.e., the lease liability) and an asset representing the right to use the underlying asset during the lease term (i.e., theright-of-use asset). Lessees will be required to separately recognize the interest expense on the lease liability and the depreciation expense on theright-of-use asset.
Lessees will be also required to remeasure the lease liability upon the occurrence of certain events (e.g., a change in the lease term, a change in future lease payments resulting from a change in an index or rate used to determine those payments). The lessee will generally recognize the amount of the remeasurement of the lease liability as an adjustment to theright-of-use asset.
Lessor accounting under IFRS 16 is substantially unchanged from today’s accounting under IAS 17. Lessors will continue to classify all leases using the same classification principle as in IAS 17 and distinguish between two types of leases: operating and finance leases.
IFRS 16, which is effective for annual periods beginning on January 1, 2019, requires lessees and lessors to make more extensive disclosures than under IAS 17.
Transition to IFRS 16
The Company will adopt the IFRS 16 using the modified retrospectively method with the date of initial applications on January 1, 2019. Moreover, the Company will apply the new requirements regarding IFRS 16 to all contracts identified as leases under the current accounting standard and reassessed all services, in order to identify lease components or an implicit accounting lease within these contracts.
The Company will elect to use the exemptions applicable to the standard on lease contracts for which the lease terms ends within 12 months as of the date of initial application, and lease contracts for which the underlying asset is of low value. The Company has leases of certain office equipment (i.e., personal computers, printing and photocopying machines, mainly) that are considered low value assets.
The Company identified a significant number of lease assets such as towers, physical facilities (office buildings, stores and sites, mainly), circuits, among others. The implementation of IFRS 16 required a significant effort due to the fact of the need to make certain estimates, such as the leases term, based on thenon-cancelable period and the periods covered by options to extend the lease. AMX extended the lease terms beyond thenon-cancelable period only when it was reasonably certain to extend it. The reasonability of the extension is affected on several factors, such as regulation, business model, and geographical business strategies.
F-81
AMX expects that the changes in the implementation of IFRS 16 will have a significant impact on its financial statements from the date of adoption. The Company expects that the opening balances at the date of initial application will increase in right of use assets and lease liabilities between Ps.113,000,000 and Ps.132,000,000 without a material impact in equity.
Estimated initial impact are based on the assessment conducted to date and could have a difference because of the lease borrowing rate and the volume of contracts considered in the implementation process. The new accounting policies will not be final until the Company presents its first financial statements subsequent to the effective date of IFRS 16.
IFRS 17 Insurance Contracts
In May 2017, the IASB issued IFRS 17Insurance Contracts (IFRS 17), a comprehensive new accounting standard for insurance contracts covering recognition and measurement, presentation and disclosure. Once effective, IFRS 17 will replace IFRS 4Insurance Contracts (IFRS 4) that was issued in 2005. IFRS 17 applies to all types of insurance contracts (i.e., life,non-life, direct insurance andre-insurance), regardless of the type of entities that issue them, as well as to certain guarantees and financial instruments with discretionary participation features. A few scope exceptions will apply. The overall objective of IFRS 17 is to provide an accounting model for insurance contracts that is more useful and consistent for insurers. In contrast to the requirements in IFRS 4, which are largely based on grandfathering previous local accounting policies, IFRS 17 provides a comprehensive model for insurance contracts, covering all relevant accounting aspects. The core of IFRS 17 is the general model, supplemented by:
| | • | | A specific adaptation for contracts with direct participation features (the variable fee approach) |
| | • | | A simplified approach (the premium allocation approach) mainly for short-duration contracts |
IFRS 17 is effective for reporting periods beginning on or after 1 January 2021, with comparative figures required.
Early application is permitted, provided the entity also applies IFRS 9 and IFRS 15 on or before the date it first applies IFRS 17.
The company is evaluating the effects, however, it does not expect the adoption of this standard to have a significant impact.
IFRIC Interpretation 23 Uncertainty over Income Tax Treatment
The Interpretation addresses the accounting for income taxes when tax treatments involve uncertainty that affects the application of IAS 12 and does not apply to taxes or levies outside the scope of IAS 12, nor does it specifically include requirements relating to interest and penalties associated with uncertain tax treatments.
The Interpretation specifically addresses the following:
| | • | | Whether an entity considers uncertain tax treatments separately |
| | • | | The assumptions an entity makes about the examination of tax treatments by taxation authorities |
| | • | | How an entity determines taxable profit (tax loss), tax bases, unused tax losses, unused tax credits and tax rates |
| | • | | How an entity considers changes in facts and circumstances |
An entity has to determine whether to consider each uncertain tax treatment separately or together with one or more other uncertain tax treatments. The approach that better predicts the resolution of the uncertainty should be
F-82
followed. The interpretation is effective for annual reporting periods beginning on or after 1 January 2019, but certain transition reliefs are available. The Company will apply the interpretation from its effective date. The Company will establish the processes and procedures to obtain the necessary information to apply the Interpretation in a timely manner.
The company estimates that the adoption of this standard will not have a significant impact on its consolidated financial statements.
Amendments to IFRS 9: Prepayment Features with Negative Compensation
Under IFRS 9, a debt instrument can be measured at amortized cost or at fair value through other comprehensive income, provided that the contractual cash flows are ‘solely payments of principal and interest on the principal amount outstanding’ (the SPPI criterion) and the instrument is held within the appropriate business model for that classification. The amendments to IFRS 9 clarify that a financial asset passes the SPPI criterion regardless of the event or circumstance that causes the early termination of the contract and irrespective of which party pays or receives reasonable compensation for the early termination of the contract.
The amendments should be applied retrospectively and are effective from 1 January 2019, with earlier application permitted. These amendments have no impact on the consolidated financial statements of the Company.
Amendments to IFRS 10 and IAS 28: Sale or Contribution of Assets between an Investor and its Associate or Joint Venture
The amendments address the conflict between IFRS 10 and IAS 28 in dealing with the loss of control of a subsidiary that is sold or contributed to an associate or joint venture. The amendments clarify that the gain or loss resulting from the sale or contribution of assets that constitute a business, as defined in IFRS 3, between an investor and its associate or joint venture, is recognized in full. Any gain or loss resulting from the sale or contribution of assets that do not constitute a business, however, is recognized only to the extent of unrelated investors’ interests in the associate or joint venture. The IASB has deferred the effective date of these amendments indefinitely, but an entity that early adopts the amendments must apply them prospectively. The Company will apply these amendments when they become effective.
Amendments to IAS 19: Plan Amendment, Curtailment or Settlement
The amendments to IAS 19 address the accounting when a plan amendment, curtailment or settlement occurs during a reporting period. The amendments specify that when a plan amendment, curtailment or settlement occurs during the annual reporting period, an entity is required to:
| | • | | Determine current service cost for the remainder of the period after the plan amendment, curtailment or settlement, using the actuarial assumptions used to remeasure the net defined benefit liability (asset) reflecting the benefits offered under the plan and the plan assets after that event. |
| | • | | Determine net interest for the remainder of the period after the plan amendment, curtailment or settlement using: the net defined benefit liability (asset) reflecting the benefits offered under the plan and the plan assets after that event; and the discount rate used to remeasure that net defined benefit liability (asset). |
The amendments also clarify that an entity first determines any past service cost, or a gain or loss on settlement, without considering the effect of the asset ceiling. This amount is recognized in profit or loss.
An entity then determines the effect of the asset ceiling after the plan amendment, curtailment or settlement. Any change in that effect, excluding amounts included in the net interest, is recognized in other comprehensive income.
F-83
The amendments apply to plan amendments, curtailments, or settlements occurring on or after the beginning of the first annual reporting period that begins on or after 1 January 2019, with early application permitted. These amendments will apply only to any future plan amendments, curtailments, or settlements of the Company.
Amendments to IAS 28: Long-term interests in associates and joint ventures
The amendments clarify that an entity applies IFRS 9 to long-term interests in an associate or joint venture to which the equity method is not applied but that, in substance, form part of the net investment in the associate or joint venture (long-term interests). This clarification is relevant because it implies that the expected credit loss model in IFRS 9 applies to such long-term interests.
The amendments also clarified that, in applying IFRS 9, an entity does not take account of any losses of the associate or joint venture, or any impairment losses on the net investment, recognized as adjustments to the net investment in the associate or joint venture that arise from applying IAS 28 Investments in Associates and Joint Ventures.
The amendments should be applied retrospectively and are effective from 1 January 2019, with early application permitted. Since the Company does not have such long-term interests in its associate and joint venture, the amendments will not have an impact on its consolidated financial statements.
Annual Improvements 2015-2017 Cycle (issued in December 2017)
These improvements include:
• IFRS 3 Business Combinations
The amendments clarify that, when an entity obtains control of a business that is a joint operation, it applies the requirements for a business combination achieved in stages, including remeasuring previously held interests in the assets and liabilities of the joint operation at fair value. In doing so, the acquirer remeasures its entire previously held interest in the joint operation.
An entity applies those amendments to business combinations for which the acquisition date is on or after the beginning of the first annual reporting period beginning on or after 1 January 2019, with early application permitted.
These amendments will apply on future business combinations of the Company.
• IFRS 11 Joint Arrangements
A party that participates in, but does not have joint control of, a joint operation might obtain joint control of the joint operation in which the activity of the joint operation constitutes a business as defined in IFRS 3. The amendments clarify that the previously held interests in that joint operation are not remeasured.
An entity applies those amendments to transactions in which it obtains joint control on or after the beginning of the first annual reporting period beginning on or after 1 January 2019, with early application permitted. These amendments are currently not applicable to the Company but may apply to future transactions.
• IAS 12 Income Taxes
The amendments clarify that the income tax consequences of dividends are linked more directly to past transactions or events that generated distributable profits than to distributions to owners. Therefore, an entity recognizes the income tax consequences of dividends in profit or loss, other comprehensive income or equity according to where the entity originally recognized those past transactions or events.
F-84
An entity applies those amendments for annual reporting periods beginning on or after 1 January 2019, with early application is permitted. When an entity first applies those amendments, it applies them to the income tax consequences of dividends recognized on or after the beginning of the earliest comparative period. Since the Company´s current practice is in line with these amendments, the Company does not expect any effect on its consolidated financial statements.
• IAS 23 Borrowing Costs
The amendments clarify that an entity treats as part of general borrowings any borrowing originally made to develop a qualifying asset when substantially all of the activities necessary to prepare that asset for its intended use or sale are complete.
An entity applies those amendments to borrowing costs incurred on or after the beginning of the annual reporting period in which the entity first applies those amendments. An entity applies those amendments for annual reporting periods beginning on or after 1 January 2019, with early application permitted. Since the Company´s current practice is in line with these amendments, the Company does not expect any effect on its consolidated financial statements.
24. Subsequent Events
(a) On January 24, 2019, the Company acquired from Telefónica S.A. and certain of its affiliates (“Telefónica”), 100% of Telefónica Móviles Guatemala, S.A. (“Telefónica Guatemala”), and has entered into an agreement to acquire 99.3% of Telefónica Móviles El Salvador, S.A. de C.V. (“Telefónica El Salvador”). The Telefónica Guatemala acquisition has been completed on this date. The completion of the acquisition of Telefónica El Salvador is subject to certain customary closing conditions, including regulatory approval. The purchase price paid for Telefónica Guatemala was Ps. 6,326,068 (US$333,000 ). The agreed upon purchase price for Telefónica El Salvador is Ps. 5,984,118 (US$315,000). The acquired companies provide mobile and fixed telecommunications services, including voice, data and Pay TV in El Salvador and Guatemala.
(b) On March 18, 2019, the Company announced that it has entered into an agreement to acquire from NII Holdings, Inc. and certain of its affiliates (“NII”) and AI Brazil Holdings B.V. 100% of Nextel Telecomunicações Ltda. (“Nextel Brazil”).
The completion of the acquisition is subject to certain customary closing conditions, including regulatory approval from Agência Nacional de Telecomunicações — Anatel and Conselho Administrativo de Defesa Econômica — CADE. The transaction is also subject to the approval at a stockholders meeting of NII shareholders holding a majority of the outstanding shares of NII. The agreed purchase price for Nextel Brazil is Ps. 17,487,578 (US$905,000) on a cash free / debt free basis.
Nextel Brazil provides nationwide mobile telecommunications services.
25. Supplemental Guarantor Information
Condensed Consolidating Financial Information
The following consolidating information presents condensed consolidating statements of financial position as of December 31, 2017 and 2018 and condensed consolidating statements of comprehensive income and cash flows for each of the three years in the period ended December 31, 2018 of the Company and Telcel (the “wholly-owned Guarantor Subsidiary”). The unconsolidated financial statements of América Móvil and Telcel reflect their investments in subsidiaries on the basis of the equity method. These unconsolidated entities are the Guarantors of most of América Móvil’s consolidated obligations. The guarantees of the Guarantor are full and unconditional.
F-85
The Company’s consolidating condensed financial information for the (i) Company; (ii) its wholly-owned guarantor subsidiary Telcel (on standalone basis), which is a wholly and unconditional guarantor under the Senior Notes; (iii) the combinednon-guarantor subsidiaries; iv) eliminations and v) the Company’s consolidated financial statements are as follows:
Condensed consolidating statements of financial position
| | | | | | | | | | | | | | | | | | | | |
| | | As of December 31, 2017 | |
| | | Parent | | | Wholly-owned
Guarantor
Subsidiary | | | Combined
non-guarantor
Subsidiaries | | | Eliminations | | | Consolidated
Total | |
Assets: | |
Cash and cash equivalents | | Ps. | 7,018,559 | | | Ps. | 3,553,352 | | | Ps. | 13,698,562 | | | Ps. | — | | | Ps. | 24,270,473 | |
Equity investments at fair value through OCI and other short-term investments | | | 10,303,535 | | | | — | | | | 48,817,141 | | | | — | | | | 59,120,676 | |
Accounts receivable and derivative financial instruments | | | 9,874,652 | | | | 24,064,936 | | | | 167,873,940 | | | | — | | | | 201,813,528 | |
Related parties | | | 208,240,067 | | | | 957,704 | | | | 503,895,549 | | | | (712,225,090 | ) | | | 868,230 | |
Inventories, net | | | 264,649 | | | | 16,700,837 | | | | 21,844,079 | | | | — | | | | 38,809,565 | |
Other current assets | | | 17,805,747 | | | | 922,245 | | | | (1,375,246 | ) | | | — | | | | 17,352,746 | |
Property, plant and equipment, Net | | | 1,996,721 | | | | 24,287,904 | | | | 650,058,573 | | | | — | | | | 676,343,198 | |
Investments in associated companies | | | 747,771,790 | | | | 35,569,788 | | | | 3,457,152 | | | | (783,063,558 | ) | | | 3,735,172 | |
Intangible assets and other non- current assets, net | | | 4,104,268 | | | | 73,557,904 | | | | 386,236,092 | | | | — | | | | 463,898,264 | |
| | | | | | | | | | | | | | | | | | | | |
Total assets | | Ps. | 1,007,379,988 | | | Ps. | 179,614,670 | | | Ps. | 1,794,505,842 | | | Ps. | (1,495,288,648 | ) | | Ps. | 1,486,211,852 | |
| | | | | | | | | | | | | | | | | | | | |
Liabilities: | |
Short-term debt and current portion of long-term debt | | Ps. | 34,345,398 | | | Ps. | — | | | Ps. | 17,400,443 | | | Ps. | — | | | Ps. | 51,745,841 | |
Current liabilities | | | 161,940,198 | | | | 41,304,845 | | | | 797,880,314 | | | | (639,534,701 | ) | | | 361,590,656 | |
Long-term debt | | | 547,728,176 | | | | — | | | | 98,410,882 | | | | — | | | | 646,139,058 | |
Othernon-current liabilities | | | 69,201,904 | | | | 132,728,838 | | | | 40,909,234 | | | | (76,737,196 | ) | | | 166,102,780 | |
| | | | | | | | | | | | | | | | | | | | |
Total liabilities | | Ps. | 813,215,676 | | | Ps. | 174,033,683 | | | Ps. | 954,600,873 | | | Ps. | (716,271,897 | ) | | Ps. | 1,225,578,335 | |
| | | | | | | | | | | | | | | | | | | | |
Equity attributable to equity holders of the parent | | | 194,164,312 | | | | 5,580,987 | | | | 741,988,231 | | | | (747,569,218 | ) | | | 194,164,312 | |
Non-controlling interests | | | — | | | | — | | | | 97,916,738 | | | | (31,447,533 | ) | | | 66,469,205 | |
Total equity | | | 194,164,312 | | | | 5,580,987 | | | | 839,904,969 | | | | (779,016,751 | ) | | | 260,633,517 | |
| | | | | | | | | | | | | | | | | | | | |
Total liabilities and equity | | Ps. | 1,007,379,988 | | | Ps. | 179,614,670 | | | Ps. | 1,794,505,842 | | | Ps. | (1,495,288,648 | ) | | Ps. | 1,486,211,852 | |
| | | | | | | | | | | | | | | | | | | | |
F-86
Condensed consolidating statements of financial position
| | | | | | | | | | | | | | | | | | | | |
| |
| | | As of December 31, 2018 | |
| | | Parent | | | Wholly-owned
Guarantor
Subsidiary | | | Combined
non-guarantor
Subsidiaries | | | Eliminations | | | Consolidated
Total | |
Assets: | | | | | | | | | | | | | | | | | | | | |
Cash and cash equivalents | | Ps. | 8,335,101 | | | Ps. | 1,745,895 | | | Ps. | 11,578,966 | | | Ps. | — | | | Ps. | 21,659,962 | |
Equity investments at fair value through OCI and other short-term investments | | | 9,511,368 | | | | — | | | | 39,504,566 | | | | — | | | | 49,015,934 | |
Accounts receivable and derivative financial instruments | | | 31,462,176 | | | | 35,671,582 | | | | 154,380,710 | | | | — | | | | 221,514,468 | |
Related parties | | | 199,566,671 | | | | 1,144,534 | | | | 560,142,367 | | | | (759,589,967 | ) | | | 1,263,605 | |
Inventories, net | | | 215,055 | | | | 18,495,502 | | | | 21,594,805 | | | | — | | | | 40,305,362 | |
Other current assets | | | — | | | | 1,218,764 | | | | 14,077,429 | | | | — | | | | 15,296,193 | |
Property, plant and equipment, Net | | | 1,340,358 | | | | 23,192,546 | | | | 615,467,816 | | | | — | | | | 640,000,720 | |
Investments in associated companies | | | 734,944,344 | | | | 88,070,845 | | | | 16,926,615 | | | | (836,809,097 | ) | | | 3,132,707 | |
Intangible assets and other non- current assets, net | | | 4,113,902 | | | | 26,176,381 | | | | 406,744,158 | | | | — | | | | 437,034,441 | |
| | | | | | | | | | | | | | | | | | | | |
Total assets | | Ps. | 989,488,975 | | | Ps. | 195,716,049 | | | Ps. | 1,840,417,432 | | | Ps. | (1,596,399,064 | ) | | Ps. | 1,429,223,392 | |
| | | | | | | | | | | | | | | | | | | | |
Liabilities: | | | | | | | | | | | | | | | | | | | | |
Short-term debt and current portion of long-term debt | | Ps. | 52,827,411 | | | Ps. | — | | | Ps. | 43,403,223 | | | Ps. | — | | | Ps. | 96,230,634 | |
Current liabilities | | | 153,489,868 | | | | 72,282,238 | | | | 597,174,025 | | | | (452,085,876 | ) | | | 370,860,255 | |
Long-term debt | | | 456,918,590 | | | | — | | | | 85,773,229 | | | | — | | | | 542,691,819 | |
Othernon-current liabilities | | | 130,257,461 | | | | 109,368,210 | | | | 242,232,897 | | | | (308,290,306 | ) | | | 173,568,262 | |
| | | | | | | | | | | | | | | | | | | | |
Total liabilities | | Ps. | 793,493,330 | | | Ps. | 181,650,448 | | | Ps. | 968,583,374 | | | Ps. | (760,376,182 | ) | | Ps. | 1,183,350,970 | |
| | | | | | | | | | | | | | | | | | | | |
Equity attributable to equity holders of the parent | | | 195,995,645 | | | | 14,065,601 | | | | 760,485,332 | | | | (774,550,933 | ) | | | 195,995,645 | |
Non-controlling interests | | | — | | | | — | | | | 111,348,726 | | | | (61,471,949 | ) | | | 49,876,777 | |
Total equity | | | 195,995,645 | | | | 14,065,601 | | | | 871,834,058 | | | | (836,022,882 | ) | | | 245,872,422 | |
| | | | | | | | | | | | | | | | | | | | |
Total liabilities and equity | | Ps. | 989,488,975 | | | Ps. | 195,716,049 | | | Ps. | 1,840,417,432 | | | Ps. | (1,596,399,064 | ) | | Ps. | 1,429,223,392 | |
| | | | | | | | | | | | | | | | | | | | |
F-87
Condensed consolidating statements of comprehensive income
For the year ended December 31, 2016
| | | | | | | | | | | | | | | | | | | | |
| | | Parent | | | Wholly-owned
Guarantor
Subsidiary | | | Combined
non-guarantor
Subsidiaries | | | Eliminations | | | Consolidated
Total | |
Total revenues | | Ps. | 137,236,301 | | | Ps. | 173,714,225 | | | Ps. | 857,137,822 | | | Ps. | (192,675,860 | ) | | Ps. | 975,412,488 | |
Total cost and operating expenses | | | 117,835,634 | | | | 160,949,691 | | | | 778,483,079 | | | | (191,466,226 | ) | | | 865,802,178 | |
| | | | | | | | | | | | | | | | | | | | |
Operating income | | | 19,400,667 | | | | 12,764,534 | | | | 78,654,743 | | | | (1,209,634 | ) | | | 109,610,310 | |
Interest (expense) income, net | | | (12,331,095 | ) | | | 97,314 | | | | (17,207,855 | ) | | | (227,781 | ) | | | (29,669,417 | ) |
Foreign currency exchange (loss) gain, net | | | (46,625,392 | ) | | | (5,853,669 | ) | | | 12,051,654 | | | | — | | | | (40,427,407 | ) |
Other financing cost, net | | | (10,475,673 | ) | | | (11,203,533 | ) | | | 5,453,365 | | | | — | | | | (16,225,841 | ) |
Income tax | | | (7,712,179 | ) | | | 1,139,631 | | | | 17,971,404 | | | | — | | | | 11,398,856 | |
Equity interest in net income of associated companies | | | 50,968,741 | | | | (1,342,073 | ) | | | (6,677,059 | ) | | | (42,759,659 | ) | | | 189,950 | |
| | | | | | | | | | | | | | | | | | | | |
Net profit (loss) for year | | Ps. | 8,649,427 | | | Ps. | (6,677,058 | ) | | Ps. | 54,303,444 | | | Ps. | (44,197,074 | ) | | Ps. | 12,078,739 | |
| | | | | | | | | | | | | | | | | | | | |
Distribution of the net profit (loss) to: | | | | | | | | | | | | | | | | | | | | |
Equity owners of holding company | | | 8,649,427 | | | | (6,677,058 | ) | | | 50,049,280 | | | | (43,372,222 | ) | | | 8,649,427 | |
Non-controlling interest | | | — | | | | — | | | | 4,254,164 | | | | (824,852 | ) | | | 3,429,312 | |
| | | | | | | | | | | | | | | | | | | | |
Net profit (loss) | | Ps. | 8,649,427 | | | Ps. | (6,677,058 | ) | | Ps. | 54,303,444 | | | Ps. | (44,197,074 | ) | | Ps. | 12,078,739 | |
| | | | | | | | | | | | | | | | | | | | |
Other comprehensive income items: | | | | | | | | | | | | | | | | | | | | |
Net other comprehensive income (loss) to be reclassified to profit or loss in subsequent years: | | | | | | | | | | | | | | | | | | | | |
Effect of translation of foreign entities | | | 104,178,880 | | | | 755,978 | | | | 108,291,984 | | | | (105,728,134 | ) | | | 107,498,708 | |
Effect of fair value of derivatives, net of deferred taxes | | | 48,496 | | | | — | | | | 30,206 | | | | (29,573 | ) | | | 49,129 | |
Items not to be reclassified to profit or loss in subsequent years: | | | | | | | | | | | | | | | | | | | | |
Remeasurement of defined benefit plan, net of income tax effect | | | 14,771,770 | | | | (12,300 | ) | | | 7,477,926 | | | | (7,463,997 | ) | | | 14,773,399 | |
Equity investments at fair value | | | (6,673,731 | ) | | | — | | | | (6,673,731 | ) | | | 6,673,731 | | | | (6,673,731 | ) |
| | | | | | | | | | | | | | | | | | | | |
Total other comprehensive income items for the period | | Ps. | 112,325,415 | | | Ps. | 743,678 | | | Ps. | 109,126,385 | | | Ps. | (106,547,973 | ) | | Ps. | 115,647,505 | |
| | | | | | | | | | | | | | | | | | | | |
Total comprehensive income for the period | | Ps. | 120,974,842 | | | Ps. | (5,933,380 | ) | | Ps. | 163,429,829 | | | Ps. | (150,745,047 | ) | | Ps. | 127,726,244 | |
| | | | | | | | | | | | | | | | | | | | |
Comprehensive income for the period attributable to: | | | | | | | | | | | | | | | | | | | | |
Equity holders of the parent | | Ps. | 120,974,842 | | | Ps. | (5,933,380 | ) | | Ps. | 150,900,984 | | | Ps. | (144,967,604 | ) | | Ps. | 120,974,842 | |
Non-controlling interests | | | — | | | | — | | | | 12,528,845 | | | | (5,777,443 | ) | | | 6,751,402 | |
| | | | | | | | | | | | | | | | | | | | |
| | Ps. | 120,974,842 | | | Ps. | (5,933,380 | ) | | Ps. | 163,429,829 | | | Ps. | (150,745,047 | ) | | Ps. | 127,726,244 | |
| | | | | | | | | | | | | | | | | | | | |
F-88
Condensed consolidating statements of comprehensive income
For the year ended December 31, 2017
| | | | | | | | | | | | | | | | | | | | |
| | | Parent | | | Wholly-owned
Guarantor
Subsidiary | | | Combined
non-guarantor
Subsidiaries | | | Eliminations | | | Consolidated
Total | |
Total revenues | | Ps. | 160,057,511 | | | Ps. | 170,991,493 | | | Ps. | 887,951,615 | | | Ps. | (197,367,084 | ) | | Ps. | 1,021,633,535 | |
Total cost and operating expenses | | | 123,548,341 | | | | 163,152,868 | | | | 832,429,198 | | | | (197,640,175 | ) | | | 921,490,232 | |
| | | | | | | | | | | | | | | | | | | | |
Operating income | | | 36,509,170 | | | | 7,838,625 | | | | 55,522,417 | | | | 273,091 | | | | 100,143,303 | |
Interest (expense) income, net | | | (16,779,235 | ) | | | (12,365,116 | ) | | | 1,810,523 | | | | (41,305 | ) | | | (27,375,133 | ) |
Foreign currency exchange (loss) gain, net | | | (15,223,111 | ) | | | 1,320,667 | | | | 83,493 | | | | — | | | | (13,818,951 | ) |
Other financing cost, net | | | 6,775,455 | | | | — | | | | (8,719,215 | ) | | | — | | | | (1,943,760 | ) |
Income tax | | | 14,201,399 | | | | 1,386,519 | | | | 9,353,593 | | | | — | | | | 24,941,511 | |
Equity interest in net income of associated companies | | | 32,245,041 | | | | (8,977,146 | ) | | | (13,466,845 | ) | | | (9,709,665 | ) | | | 91,385 | |
| | | | | | | | | | | | | | | | | | | | |
Net profit (loss) for year | | Ps. | 29,325,921 | | | Ps. | (13,569,489 | ) | | Ps. | 25,876,780 | | | Ps. | (9,477,879 | ) | | Ps. | 32,155,333 | |
| | | | | | | | | | | | | | | | | | | | |
Distribution of the net profit (loss) to: | | | | | | | | | | | | | | | | | | | | |
Equity owners of holding company | | | 29,325,921 | | | | (13,569,489 | ) | | | 21,417,549 | | | | (7,848,060 | ) | | | 29,325,921 | |
Non-controlling interest | | | — | | | | — | | | | 4,459,231 | | | | (1,629,819 | ) | | | 2,829,412 | |
| | | | | | | | | | | | | | | | | | | | |
Net profit (loss) | | Ps. | 29,325,921 | | | Ps. | (13,569,489 | ) | | Ps. | 25,876,780 | | | Ps. | (9,477,879 | ) | | Ps. | 32,155,333 | |
| | | | | | | | | | | | | | | | | | | | |
Other comprehensive income items: | | | | | | | | | | | | | | | | | | | | |
Net other comprehensive income (loss) to be reclassified to profit or loss in subsequent years: | | | | | | | | | | | | | | | | | | | | |
Effect of translation of foreign entities | | | (21,683,333 | ) | | | (1,897,936 | ) | | | (18,309,877 | ) | | | 23,581,269 | | | | (18,309,877 | ) |
Effect of fair value of derivatives, net of deferred taxes | | | 12,292 | | | | — | | | | 12,292 | | | | (12,292 | ) | | | 12,292 | |
Items not to be reclassified to profit or loss in subsequent years: | | | | | | | | | | | | | | | | | | | | |
Remeasurement of defined benefit plan, net of income tax effect | | | (7,075,606 | ) | | | (8,439 | ) | | | (7,046,089 | ) | | | 7,084,045 | | | | (7,046,089 | ) |
Equity investments at fair value | | | 622,424 | | | | — | | | | 622,424 | | | | (622,424 | ) | | | 622,424 | |
| | | | | | | | | | | | | | | | | | | | |
Total other comprehensive income items for the period | | Ps. | (28,124,223 | ) | | Ps. | (1,906,375 | ) | | Ps. | (24,721,250 | ) | | Ps. | 30,030,598 | | | Ps. | (24,721,250 | ) |
| | | | | | | | | | | | | | | | | | | | |
Total comprehensive income for the period | | Ps. | 1,201,698 | | | Ps. | (15,475,864 | ) | | Ps. | 1,155,530 | | | Ps. | 20,552,719 | | | Ps. | 7,434,083 | |
| | | | | | | | | | | | | | | | | | | | |
Comprehensive income for the period attributable to: | | | | | | | | | | | | | | | | | | | | |
Equity holders of the parent | | Ps. | 1,201,698 | | | Ps. | (15,475,864 | ) | | Ps. | (5,076,855 | ) | | Ps. | 20,552,719 | | | Ps. | 1,201,698 | |
Non-controlling interests | | | — | | | | — | | | | 6,232,385 | | | | — | | | | 6,232,385 | |
| | | | | | | | | | | | | | | | | | | | |
| | Ps. | 1,201,698 | | | Ps. | (15,475,864 | ) | | Ps. | 1,155,530 | | | Ps. | 20,552,719 | | | Ps. | 7,434,083 | |
| | | | | | | | | | | | | | | | | | | | |
F-89
Condensed consolidating statements of comprehensive income
For the year ended December 31, 2018
| | | | | | | | | | | | | | | | | | | | |
| | | Parent | | | Wholly-owned
Guarantor
Subsidiary | | | Combined
non-guarantor
Subsidiaries | | | Eliminations | | | Consolidated
Total | |
Total revenues | | Ps. | 170,887,145 | | | Ps. | 190,924,413 | | | Ps. | 890,427,121 | | | Ps. | (214,030,998 | ) | | Ps. | 1,038,207,681 | |
Total cost and operating expenses | | | 129,039,749 | | | | 183,542,058 | | | | 799,085,884 | | | | (213,017,181 | ) | | | 898,650,510 | |
| | | | | | | | | | | | | | | | | | | | |
Operating income | | | 41,847,396 | | | | 7,382,355 | | | | 91,341,237 | | | | (1,013,817 | ) | | | 139,557,171 | |
Interest (expense) income, net | | | (24,831,538 | ) | | | (11,033,069 | ) | | | 14,757,906 | | | | (18,563 | ) | | | (21,125,264 | ) |
Foreign currency exchange (loss) gain, net | | | 11,805,283 | | | | 626,304 | | | | (19,693,543 | ) | | | — | | | | (7,261,956 | ) |
Other financing cost, net | | | (4,443,892 | ) | | | — | | | | (5,732,424 | ) | | | — | | | | (10,176,316 | ) |
Income tax | | | 17,754,010 | | | | 798,639 | | | | 27,924,430 | | | | — | | | | 46,477,079 | |
Equity interest in net income of associated companies | | | 46,101,188 | | | | 1,325,723 | | | | (2,497,059 | ) | | | (44,929,585 | ) | | | 267 | |
| | | | | | | | | | | | | | | | | | | | |
Net profit (loss) for year | | Ps. | 52,724,427 | | | Ps. | (2,497,326 | ) | | Ps. | 50,251,687 | | | Ps. | (45,961,965 | ) | | Ps. | 54,516,823 | |
| | | | | | | | | | | | | | | | | | | | |
Distribution of the net profit (loss) to: | | | | | | | | | | | | | | | | | | | | |
Equity owners of holding company | | | 52,724,427 | | | | (2,497,326 | ) | | | 46,641,696 | | | | (44,302,600 | ) | | | 52,566,197 | |
Non-controlling interest | | | — | | | | — | | | | 3,609,991 | | | | (1,659,365 | ) | | | 1,950,626 | |
| | | | | | | | | | | | | | | | | | | | |
Net profit (loss) | | Ps. | 52,724,427 | | | Ps. | (2,497,326 | ) | | Ps. | 50,251,687 | | | Ps. | (45,961,965 | ) | | Ps. | 54,516,823 | |
| | | | | | | | | | | | | | | | | | | | |
Other comprehensive income items: | | | | | | | | | | | | | | | | | | | | |
Net other comprehensive income (loss) to be reclassified to profit or loss in subsequent years: | | | | | | | | | | | | | | | | | | | | |
Effect of translation of foreign entities | | | (61,223,458 | ) | | | (724,521 | ) | | | (64,314,032 | ) | | | 61,947,979 | | | | (64,314,032 | ) |
Items not to be reclassified to profit or loss in subsequent years: | | | | | | | | | | | | | | | | | | | | |
Remeasurement of defined benefit plan, net of income tax effect | | | 652,722 | | | | (1,603,145 | ) | | | 757,278 | | | | 950,423 | | | | 757,278 | |
Equity investments at fair value | | | (3,765,688 | ) | | | — | | | | (3,765,688 | ) | | | 3,765,688 | | | | (3,765,688 | ) |
| | | | | | | | | | | | | | | | | | | | |
Total other comprehensive income items for the period | | Ps. | (64,336,424 | ) | | Ps. | (2,327,666 | ) | | Ps. | (67,322,442 | ) | | Ps. | 66,664,090 | | | Ps. | (67,322,442 | ) |
| | | | | | | | | | | | | | | | | | | | |
Total comprehensive income for the period | | Ps. | (11,611,997 | ) | | Ps. | (4,824,992 | ) | | Ps. | (17,070,755 | ) | | Ps. | 20,702,125 | | | Ps. | (12,805,619 | ) |
| | | | | | | | | | | | | | | | | | | | |
Comprehensive income for the period attributable to: | | | | | | | | | | | | | | | | | | | | |
Equity holders of the parent | | Ps. | (11,611,997 | ) | | Ps. | (4,824,992 | ) | | Ps. | (16,035,363 | ) | | Ps. | 20,702,125 | | | Ps. | (11,770,227 | ) |
Non-controlling interests | | | — | | | | — | | | | (1,035,392 | ) | | | — | | | | (1,035,392 | ) |
| | | | | | | | | | | | | | | | | | | | |
| | Ps. | (11,611,997 | ) | | Ps. | (4,824,992 | ) | | Ps. | (17,070,755 | ) | | Ps. | 20,702,125 | | | Ps. | (12,805,619 | ) |
| | | | | | | | | | | | | | | | | | | | |
F-90
Condensed consolidating statements of cash flows
For the year ended December 31, 2016
| | | | | | | | | | | | | | | | | | | | |
| | | Parent | | | Wholly-owned
Guarantor
Subsidiary | | | Combined
non-guarantor
Subsidiaries | | | Eliminations | | | Consolidated
Total | |
Operating activities: | | | | | | | | | | | | | | | | | | | | |
Profit before taxes | | Ps. | 937,247 | | | Ps. | (5,537,427 | ) | | Ps. | 28,077,775 | | | Ps. | — | | | Ps. | 23,477,595 | |
Non-cash items | | | (997,587 | ) | | | 19,800,396 | | | | 209,821,118 | | | | — | | | | 228,623,927 | |
Changes in working capital: | | | 74,520,320 | | | | 9,130,768 | | | | (93,359,195 | ) | | | (6,595,361 | ) | | | (16,303,468 | ) |
| | | | | | | | | | | | | | | | | | | | |
Net cash flows provided by operating activities | | Ps. | 74,459,980 | | | Ps. | 23,393,737 | | | Ps. | 144,539,698 | | | Ps. | (6,595,361 | ) | | Ps. | 235,798,054 | |
| | | | | | | | | | | | | | | | | | | | |
Investing activities: | | | | | | | | | | | | | | | | | | | | |
Purchase of property, plant and equipment | | | — | | | | (7,860,232 | ) | | | (130,846,925 | ) | | | — | | | | (138,707,157 | ) |
Acquisition of intangibles | | | — | | | | (4,947,506 | ) | | | (11,369,232 | ) | | | — | | | | (16,316,738 | ) |
Dividends received from associates | | | 21,950 | | | | — | | | | 5,988,938 | | | | (270,796 | ) | | | 5,740,092 | |
Proceeds from sale of plant, property and equipment | | | 20,078 | | | | — | | | | 95,522 | | | | — | | | | 115,600 | |
Acquisition of business, net of cash acquired | | | — | | | | (2,796,254 | ) | | | (1,823,813 | ) | | | 2,796,254 | | | | (1,823,813 | ) |
Partial sale of shares of associate company | | | 756,444 | | | | — | | | | 2,796,254 | | | | (3,552,698 | ) | | | — | |
Investment in associates companies | | | — | | | | 663,203 | | | | (666,690 | ) | | | — | | | | (3,487 | ) |
| | | | | | | | | | | | | | | | | | | | |
Net cash flows provided by (used in) investing activities | | Ps. | 798,472 | | | Ps. | (14,940,789 | ) | | Ps. | (135,825,946 | ) | | Ps. | (1,027,240 | ) | | Ps. | (150,995,503 | ) |
| | | | | | | | | | | | | | | | | | | | |
Financing activities: | | | | | | | | | | | | | | | | | | | | |
Bank loans, net | | | (39,598,698 | ) | | | — | | | | (21,792,115 | ) | | | — | | | | (61,390,813 | ) |
Acquisition of no controlling interest | | | — | | | | — | | | | (2,280,278 | ) | | | — | | | | (2,280,278 | ) |
Interest paid | | | (24,826,139 | ) | | | (7,972,827 | ) | | | (5,922,267 | ) | | | 6,595,361 | | | | (32,125,872 | ) |
Paid-In capital | | | — | | | | — | | | | (756,444 | ) | | | 756,444 | | | | — | |
Sale of shares of subsidiaries | | | — | | | | — | | | | 6,323,336 | | | | — | | | | 6,323,336 | |
Repurchase of shares and others | | | (7,092,385 | ) | | | — | | | | 71,138 | | | | — | | | | (7,021,247 | ) |
Payment of dividends | | | (13,437,168 | ) | | | — | | | | (643,585 | ) | | | 270,796 | | | | (13,809,957 | ) |
Derivative financial instruments | | | — | | | | — | | | | (351,213 | ) | | | — | | | | (351,213 | ) |
| | | | | | | | | | | | | | | | | | | | |
Net cash flows (used in) financing activities | | Ps. | (84,954,390 | ) | | Ps. | (7,972,827 | ) | | Ps. | (25,351,428 | ) | | Ps. | 7,622,601 | | | Ps. | (110,656,044 | ) |
| | | | | | | | | | | | | | | | | | | | |
Net (decrease) increase in cash and cash equivalents | | | (9,695,938 | ) | | | 480,121 | | | | (16,637,676 | ) | | | — | | | | (25,853,493 | ) |
Adjustment to cash flow for exchange rate differences | | | — | | | | — | | | | 3,911,844 | | | | — | | | | 3,911,844 | |
Cash and cash equivalents at beginning of the period | | | 13,803,584 | | | | 1,468,036 | | | | 29,888,412 | | | | — | | | | 45,160,032 | |
| | | | | | | | | | | | | | | | | | | | |
Cash and cash equivalents at end of the period | | Ps. | 4,107,645 | | | Ps. | 1,948,159 | | | Ps. | 17,162,579 | | | Ps. | — | | | Ps. | 23,218,383 | |
| | | | | | | | | | | | | | | | | | | | |
F-91
Condensed consolidating statements of cash flows
For the year ended December 31, 2017
| | | | | | | | | | | | | | | | | | | | |
| | | Parent | | | Wholly-owned
Guarantor
Subsidiary | | | Combined
non-guarantor
Subsidiaries | | | Eliminations | | | Consolidated
Total | |
Operating activities: | | | | | | | | | | | | | | | | | | | | |
Profit before taxes | | Ps. | 43,527,320 | | | Ps. | (12,182,970 | ) | | Ps. | 35,230,373 | | | Ps. | (9,477,879 | ) | | Ps. | 57,096,844 | |
Non-cash items | | | (17,017,287 | ) | | | 30,000,109 | | | | 171,062,158 | | | | 11,635,563 | | | | 195,680,543 | |
Changes in working capital: | | | (18,973,478 | ) | | | (9,486 | ) | | | (66,062,629 | ) | | | 50,040,581 | | | | (35,005,012 | ) |
| | | | | | | | | | | | | | | | | | | | |
Net cash flows provided by operating activities | | Ps. | 7,536,555 | | | Ps. | 17,807,653 | | | Ps. | 140,229,902 | | | Ps. | 52,198,265 | | | Ps. | 217,772,375 | |
| | | | | | | | | | | | | | | | | | | | |
Investing activities: | | | | | | | | | | | | | | | | | | | | |
Purchase of property, plant and equipment | | | 16,526 | | | | (5,571,410 | ) | | | (113,630,253 | ) | | | — | | | | (119,185,137 | ) |
Acquisition of intangibles | | | — | | | | (3,053,345 | ) | | | (14,485,196 | ) | | | — | | | | (17,538,541 | ) |
Dividends received from associates | | | 21,465,687 | | | | 970,000 | | | | 2,385,559 | | | | (22,435,687 | ) | | | 2,385,559 | |
Proceeds from sale of plant, property and equipment | | | — | | | | — | | | | 133,349 | | | | — | | | | 133,349 | |
Acquisition of business, net of cash acquired | | | — | | | | (3,381,505 | ) | | | (3,497,288 | ) | | | — | | | | (6,878,793 | ) |
Investment in associates companies | | | — | | | | 1,925,898 | | | | — | | | | (1,925,898 | ) | | | — | |
Sale of associated company | | | — | | | | — | | | | 340,040 | | | | — | | | | 340,040 | |
| | | | | | | | | | | | | | | | | | | | |
Net cash flows provided by (used in) investing activities | | Ps. | 21,482,213 | | | Ps. | (9,110,362 | ) | | Ps. | (128,753,789 | ) | | Ps. | (24,361,585 | ) | | Ps. | (140,743,523 | ) |
| | | | | | | | | | | | | | | | | | | | |
Financing activities: | | | | | | | | | | | | | | | | | | | | |
Bank loans, net | | | 13,548,138 | | | | — | | | | 16,382,838 | | | | (57,364,465 | ) | | | (27,433,489 | ) |
Acquisition of no controlling interest | | | — | | | | — | | | | (11,930 | ) | | | — | | | | (11,930 | ) |
Interest paid | | | (24,009,216 | ) | | | (7,092,098 | ) | | | (7,187,225 | ) | | | 7,092,098 | | | | (31,196,441 | ) |
Repurchase of shares and others | | | (1,240,028 | ) | | | — | | | | 6,657 | | | | — | | | | (1,233,371 | ) |
Payment of dividends | | | (14,406,748 | ) | | | — | | | | (24,120,329 | ) | | | 22,435,687 | | | | (16,091,390 | ) |
Derivative financial instruments | | | — | | | | — | | | | (71,474 | ) | | | — | | | | (71,474 | ) |
| | | | | | | | | | | | | | | | | | | | |
Net cash flows used in financing activities | | Ps. | (26,107,854 | ) | | Ps. | (7,092,098 | ) | | Ps. | (15,001,463 | ) | | Ps. | (27,836,680 | ) | | Ps. | (76,038,095 | ) |
| | | | | | | | | | | | | | | | | | | | |
Net (decrease) increase in cash and cash equivalents | | | 2,910,914 | | | | 1,605,193 | | | | (3,525,350 | ) | | | — | | | | 990,757 | |
Adjustment to cash flow for exchange rate differences | | | — | | | | — | | | | 61,333 | | | | — | | | | 61,333 | |
Cash and cash equivalents at beginning of the period | | | 4,107,645 | | | | 1,948,159 | | | | 17,162,579 | | | | — | | | | 23,218,383 | |
| | | | | | | | | | | | | | | | | | | | |
Cash and cash equivalents at end of the period | | Ps. | 7,018,559 | | | Ps. | 3,553,352 | | | Ps. | 13,698,562 | | | Ps. | — | | | Ps. | 24,270,473 | |
| | | | | | | | | | | | | | | | | | | | |
F-92
Condensed consolidating statements of cash flows
For the year ended December 31, 2018
| | | | | | | | | | | | | | | | | | | | |
| | | Parent | | | Wholly-owned
Guarantor
Subsidiary | | | Combined
non-guarantor
Subsidiaries | | | Eliminations | | | Consolidated
Total | |
Operating activities: | | | | | | | | | | | | | | | | | | | | |
Profit before taxes | | Ps. | 70,478,437 | | | Ps. | (1,698,687 | ) | | Ps. | 78,176,117 | | | Ps. | (45,961,965 | ) | | Ps. | 100,993,902 | |
Non-cash items | | | (23,099,316 | ) | | | 20,952,414 | | | | 149,503,016 | | | | 39,836,704 | | | | 187,192,818 | |
Changes in working capital: | | | (49,040,542 | ) | | | (35,329,228 | ) | | | (61,332,380 | ) | | | 105,845,958 | | | | (39,856,192 | ) |
| | | | | | | | | | | | | | | | | | | | |
Net cash flows provided by operating activities | | Ps. | (1,661,421 | ) | | Ps. | (16,075,501 | ) | | Ps. | 166,346,753 | | | Ps. | 99,720,697 | | | Ps. | 248,330,528 | |
| | | | | | | | | | | | | | | | | | | | |
Investing activities: | | | | | | | | | | | | | | | | | | | | |
Purchase of property, plant and equipment | | | (17,709 | ) | | | (4,031,228 | ) | | | (139,839,096 | ) | | | — | | | | (143,888,033 | ) |
Acquisition of intangibles | | | — | | | | (2,993,373 | ) | | | (4,940,274 | ) | | | — | | | | (7,933,647 | ) |
Dividends received from associates | | | 24,314,803 | | | | — | | | | 2,622,237 | | | | (24,314,803 | ) | | | 2,622,237 | |
Proceeds from sale of plant, property and equipment | | | — | | | | — | | | | 178,532 | | | | — | | | | 178,532 | |
Acquisition of business, net of cash acquired | | | — | | | | — | | | | (310,604 | ) | | | — | | | | (310,604 | ) |
Investment in associates companies | | | — | | | | (5,092,881 | ) | | | — | | | | 5,092,881 | | | | — | |
Sale of associated company | | | — | | | | — | | | | 548,484 | | | | — | | | | 548,484 | |
| | | | | | | | | | | | | | | | | | | | |
Net cash flows provided by (used in) investing activities | | Ps. | 24,297,094 | | | Ps. | (12,117,482 | ) | | Ps. | (141,740,721 | ) | | Ps. | (19,221,922 | ) | | Ps. | (148,783,031 | ) |
| | | | | | | | | | | | | | | | | | | | |
Financing activities: | | | | | | | | | | | | | | | | | | | | |
Bank loans, net | | | 24,784,341 | | | | — | | | | 19,592,788 | | | | (78,428,052 | ) | | | (34,050,923 | ) |
Acquisition of no controlling interest | | | — | | | | — | | | | (115,821 | ) | | | — | | | | (115,821 | ) |
Interest paid | | | (24,802,363 | ) | | | 26,385,526 | | | | (6,066,654 | ) | | | (26,385,526 | ) | | | (30,869,017 | ) |
Repurchase of shares and others | | | (514,007 | ) | | | — | | | | 2,586 | | | | — | | | | (511,421 | ) |
Payment of dividends | | | (20,787,102 | ) | | | — | | | | (25,897,494 | ) | | | 24,314,803 | | | | (22,369,793 | ) |
Redemption of hybrid bond | | | — | | | | — | | | | (13,440,120 | ) | | | — | | | | (13,440,120 | ) |
| | | | | | | | | | | | | | | | | | | | |
Net cash flows used in financing activities | | Ps. | (21,319,131 | ) | | Ps. | 26,385,526 | | | Ps. | (25,924,715 | ) | | Ps. | (80,498,775 | ) | | Ps. | (101,357,095 | ) |
| | | | | | | | | | | | | | | | | | | | |
Net (decrease) increase in cash and cash equivalents | | | 1,316,542 | | | | (1,807,457 | ) | | | (1,318,683 | ) | | | — | | | | (1,809,598 | ) |
Adjustment to cash flow for exchange rate differences | | | — | | | | — | | | | (800,913 | ) | | | — | | | | (800,913 | ) |
Cash and cash equivalents at beginning of the period | | | 7,018,559 | | | | 3,553,352 | | | | 13,698,562 | | | | — | | | | 24,270,473 | |
| | | | | | | | | | | | | | | | | | | | |
Cash and cash equivalents at end of the period | | Ps. | 8,335,101 | | | Ps. | 1,745,895 | | | Ps. | 11,578,966 | | | Ps. | — | | | Ps. | 21,659,962 | |
| | | | | | | | | | | | | | | | | | | | |
F-93