Financial Community Presentation New York, NY March 3-4, 2014
2 Management Representatives Carl Chapman – Chairman, President and CEO Robert Goocher – Treasurer and VP - Investor Relations Aaron Musgrave – Director, Investor Relations

3 Forward-Looking Statements All statements other than statements of historical fact are forward-looking statements made in good faith by the company and are intended to qualify for the safe harbor from liability established by the Private Securities Litigation Reform Act of 1995. Such statements are based on management’s beliefs, as well as assumptions made by and information currently available to management and include such words as “believe”, “anticipate”, ”endeavor”, “estimate”, “expect”, “objective”, “projection”, “forecast”, “goal”, “likely”, and similar expressions intended to identify forward-looking statements. Vectren cautions readers that the assumptions forming the basis for forward-looking statements include many factors that are beyond Vectren’s ability to control or estimate precisely and actual results could differ materially from those contained in this document. Forward-looking statements speak only as of the date on which our statement is made, and we assume no duty to update them. More detailed information about these factors is set forth in Vectren’s filings with the Securities and Exchange Commission, including Vectren’s 2013 annual report on Form 10-K filed on February 20, 2014. Robert L. Goocher, Treasurer and VP – Investor Relations rgoocher@vectren.com 812-491-4080
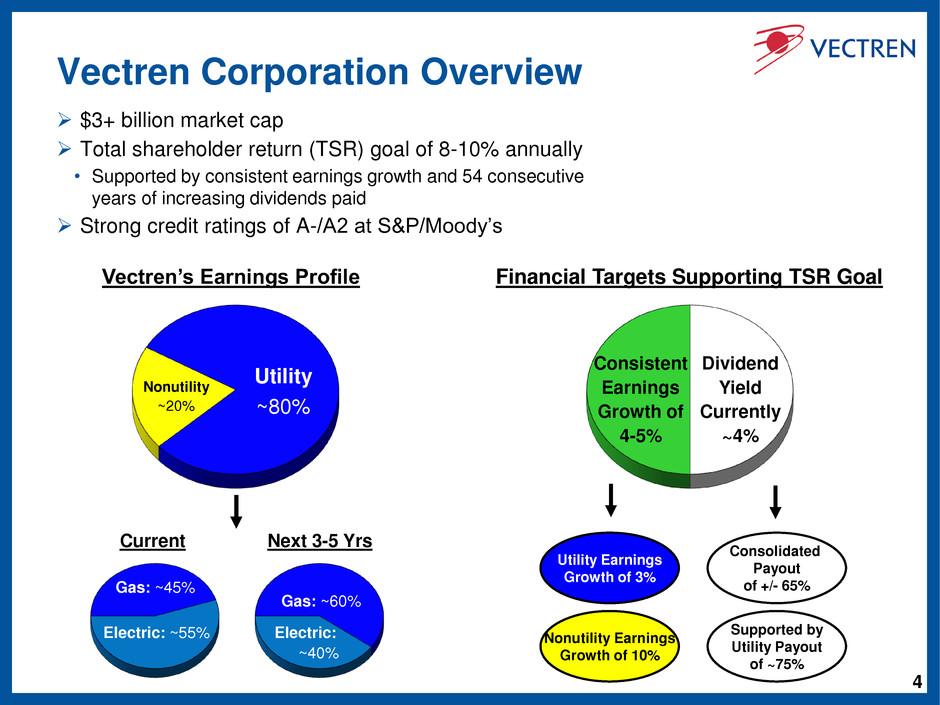
4 Vectren Corporation Overview $3+ billion market cap Total shareholder return (TSR) goal of 8-10% annually • Supported by consistent earnings growth and 54 consecutive years of increasing dividends paid Strong credit ratings of A-/A2 at S&P/Moody’s Vectren’s Earnings Profile Utility ~80% Nonutility ~20% Electric: ~55% Gas: ~45% Electric: ~40% Gas: ~60% Current Next 3-5 Yrs Financial Targets Supporting TSR Goal Consistent Earnings Growth of 4-5% Utility Earnings Growth of 3% Nonutility Earnings Growth of 10% Dividend Yield Currently ~4% Supported by Utility Payout of ~75% Consolidated Payout of +/- 65%
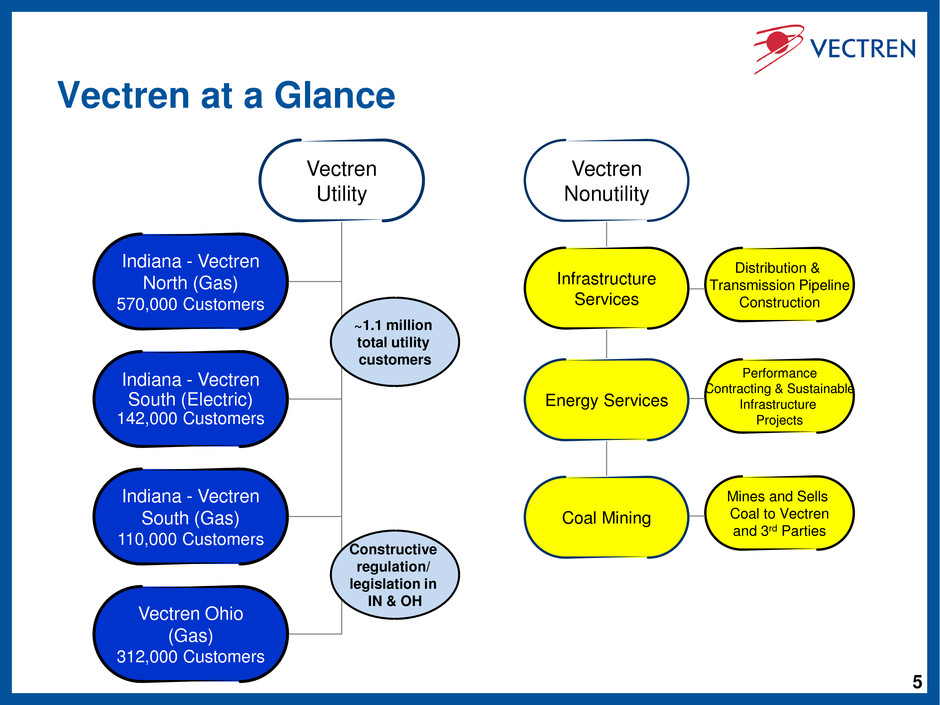
5 Vectren Nonutility Infrastructure Services Energy Services Coal Mining Distribution & Transmission Pipeline Construction Performance Contracting & Sustainable Infrastructure Projects Mines and Sells Coal to Vectren and 3rd Parties Vectren Utility Indiana - Vectren North (Gas) 570,000 Customers Indiana - Vectren South (Electric) 142,000 Customers Indiana - Vectren South (Gas) 110,000 Customers Vectren Ohio (Gas) 312,000 Customers Vectren at a Glance ~1.1 million total utility customers Constructive regulation/ legislation in IN & OH
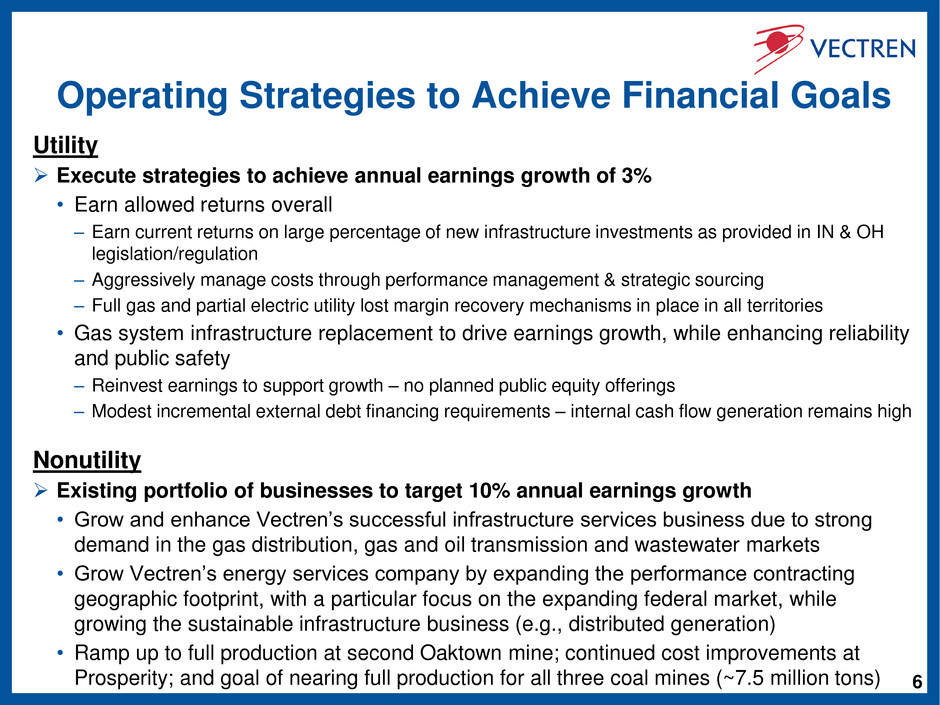
6 Operating Strategies to Achieve Financial Goals Utility Execute strategies to achieve annual earnings growth of 3% • Earn allowed returns overall – Earn current returns on large percentage of new infrastructure investments as provided in IN & OH legislation/regulation – Aggressively manage costs through performance management & strategic sourcing – Full gas and partial electric utility lost margin recovery mechanisms in place in all territories • Gas system infrastructure replacement to drive earnings growth, while enhancing reliability and public safety – Reinvest earnings to support growth – no planned public equity offerings – Modest incremental external debt financing requirements – internal cash flow generation remains high Nonutility Existing portfolio of businesses to target 10% annual earnings growth • Grow and enhance Vectren’s successful infrastructure services business due to strong demand in the gas distribution, gas and oil transmission and wastewater markets • Grow Vectren’s energy services company by expanding the performance contracting geographic footprint, with a particular focus on the expanding federal market, while growing the sustainable infrastructure business (e.g., distributed generation) • Ramp up to full production at second Oaktown mine; continued cost improvements at Prosperity; and goal of nearing full production for all three coal mines (~7.5 million tons)
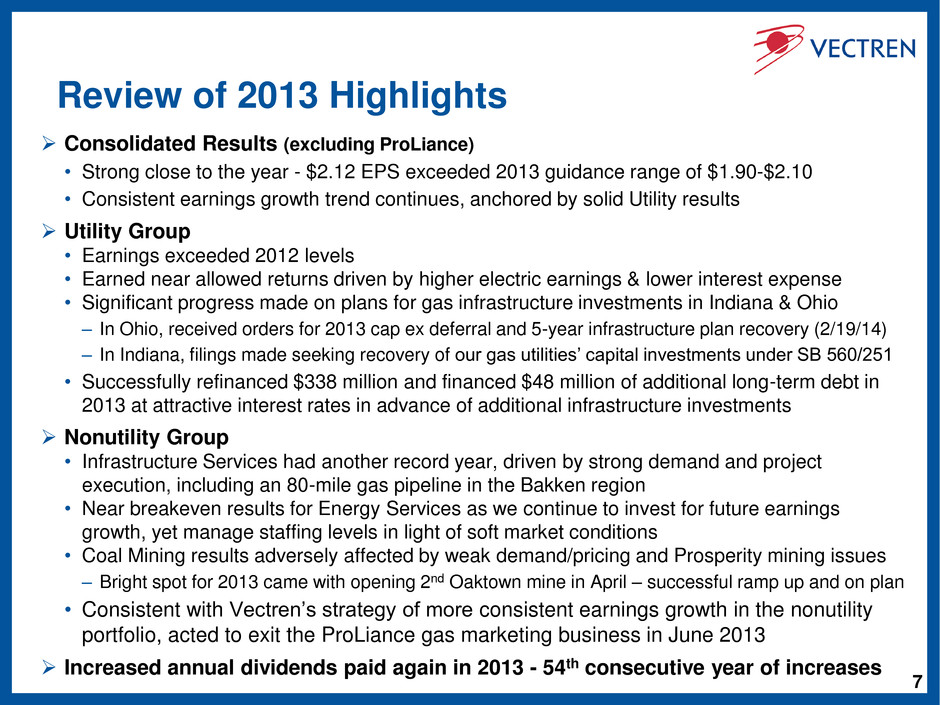
7 Review of 2013 Highlights Consolidated Results (excluding ProLiance) • Strong close to the year - $2.12 EPS exceeded 2013 guidance range of $1.90-$2.10 • Consistent earnings growth trend continues, anchored by solid Utility results Utility Group • Earnings exceeded 2012 levels • Earned near allowed returns driven by higher electric earnings & lower interest expense • Significant progress made on plans for gas infrastructure investments in Indiana & Ohio – In Ohio, received orders for 2013 cap ex deferral and 5-year infrastructure plan recovery (2/19/14) – In Indiana, filings made seeking recovery of our gas utilities’ capital investments under SB 560/251 • Successfully refinanced $338 million and financed $48 million of additional long-term debt in 2013 at attractive interest rates in advance of additional infrastructure investments Nonutility Group • Infrastructure Services had another record year, driven by strong demand and project execution, including an 80-mile gas pipeline in the Bakken region • Near breakeven results for Energy Services as we continue to invest for future earnings growth, yet manage staffing levels in light of soft market conditions • Coal Mining results adversely affected by weak demand/pricing and Prosperity mining issues – Bright spot for 2013 came with opening 2nd Oaktown mine in April – successful ramp up and on plan • Consistent with Vectren’s strategy of more consistent earnings growth in the nonutility portfolio, acted to exit the ProLiance gas marketing business in June 2013 Increased annual dividends paid again in 2013 - 54th consecutive year of increases
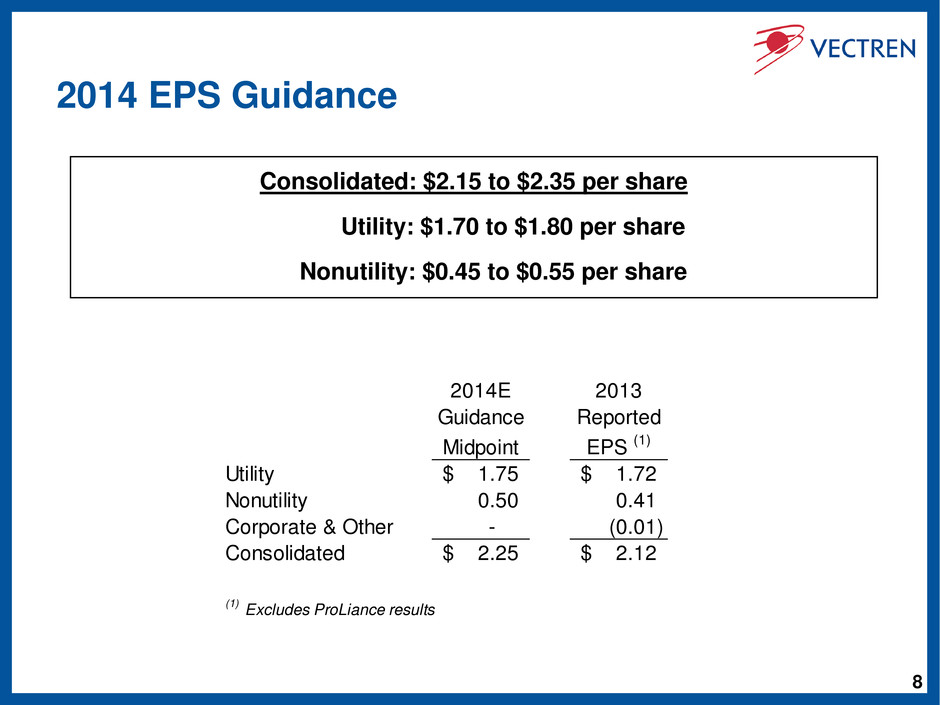
8 2014 EPS Guidance Consolidated: $2.15 to $2.35 per share Utility: $1.70 to $1.80 per share Nonutility: $0.45 to $0.55 per share 2014E 2013 Guidance Reported Midpoint EPS (1) Utility 1.75$ 1.72$ Nonutility 0.50 0.41 Corporate & Other - (0.01) Consolidated 2.25$ 2.12$ (1) Excludes ProLiance results
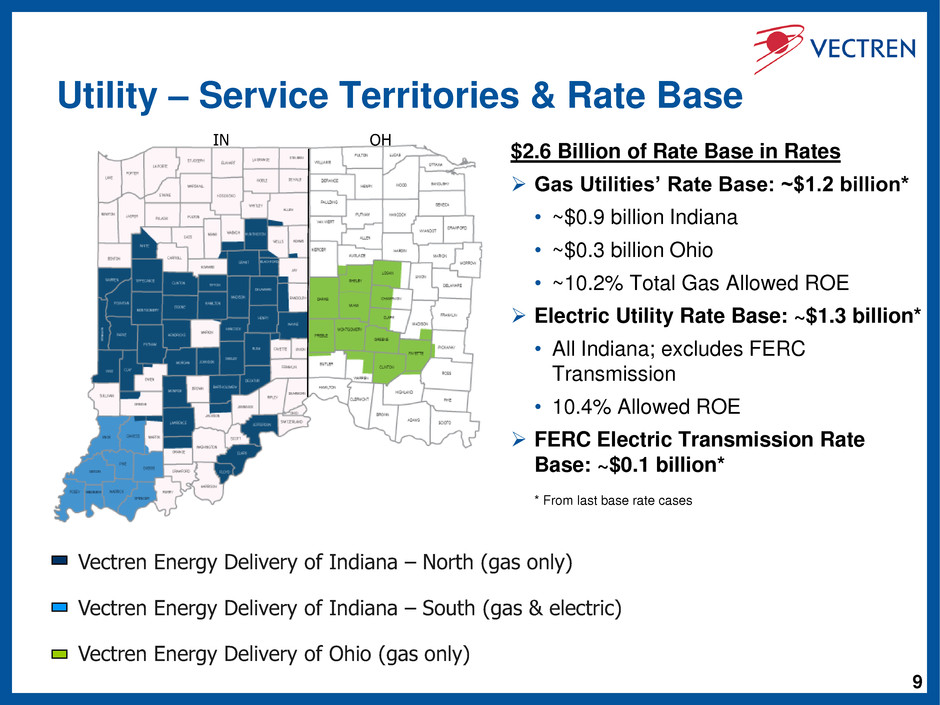
9 Vectren Energy Delivery of Indiana – North (gas only) Vectren Energy Delivery of Indiana – South (gas & electric) Vectren Energy Delivery of Ohio (gas only) Utility – Service Territories & Rate Base $2.6 Billion of Rate Base in Rates Gas Utilities’ Rate Base: ~$1.2 billion* • ~$0.9 billion Indiana • ~$0.3 billion Ohio • ~10.2% Total Gas Allowed ROE Electric Utility Rate Base: ~$1.3 billion* • All Indiana; excludes FERC Transmission • 10.4% Allowed ROE FERC Electric Transmission Rate Base: ~$0.1 billion* * From last base rate cases OH IN
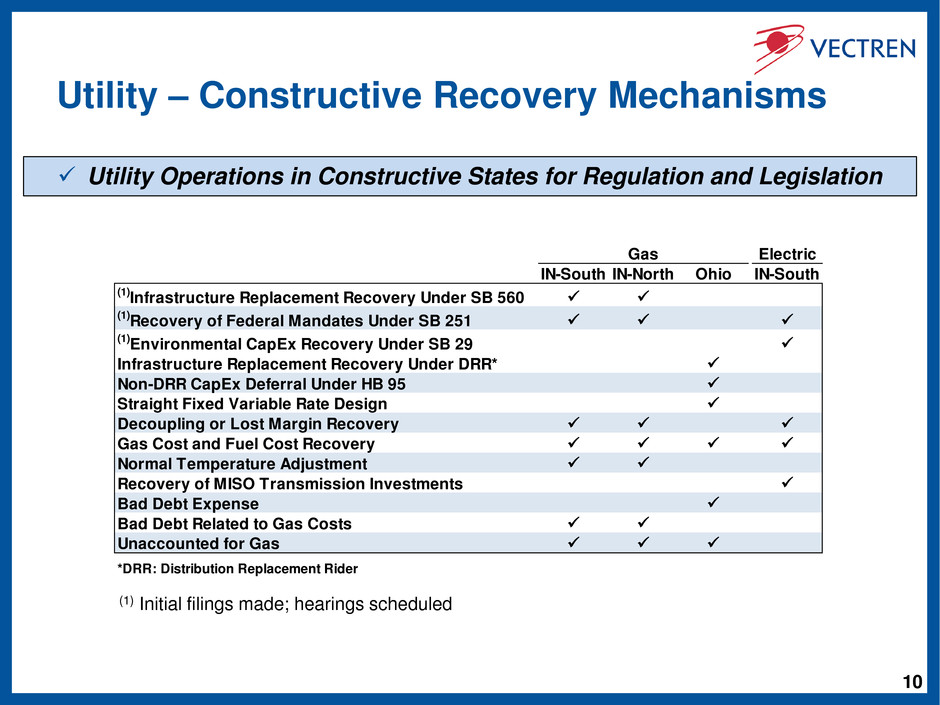
10 Utility – Constructive Recovery Mechanisms Electric IN-South IN-North Ohio IN-South (1)Infrastructure Replacement Recovery Under SB 560 (1)Recovery of Federal Mandates Under SB 251 (1)Environmental CapEx Recovery Under SB 29 Infrastructure Replacement Recovery Under DRR* Non-DRR CapEx Deferral Under HB 95 Straight Fixed Variable Rate Design Decoupling or Lost Margin Recovery Gas Cost and Fuel Cost Recovery Normal Temperature Adjustment Recovery of MISO Transmission Investments Bad Debt Expense Bad Debt Related to Gas Costs Unaccounted for Gas *DRR: Distribution Replacement Rider Gas Utility Operations in Constructive States for Regulation and Legislation (1) Initial filings made; hearings scheduled
11 Utility – Recent Gas Infrastructure Filings - Indiana In Indiana, filed in November 2013 to seek recovery of capital investments for our gas utilities under Senate Bills 560 & 251; now subject to review & approval by the Indiana Commission (hearing scheduled; order expected latter half of 2014) ▪ Filing under Senate Bill 560 included the required 7-year infrastructure plan • These filings reflect estimated construction costs of $865 million over 7-year period 2014-2020 • Seeking to recover federally-mandated compliance O&M costs in the filing as well (under SB251) • Senate Bills 560 & 251 allow for timely cash recovery of 80% of depreciation, operating costs and full return, and 20% deferral treatment of such costs until the next base rate case – Expect 100% income statement recognition (earnings) to begin in late 2014
12 Utility – Recent Gas Infrastructure Filings - Ohio In Ohio, filed in August 2013 for a 5-year extension to recover costs for acceleration of bare steel/cast iron replacement program, additional gas infrastructure improvements • Filing detailed a 5-yr plan (2013-2017) for these infrastructure investments totaling $187 million – Commission approved plan on Feb. 19, 2014 and is effective immediately – Current cash recovery of investments, including a full return, under this extension of existing distribution replacement rider mechanism ▪ 100% income statement recognition (earnings) • Commission approved recovery of remaining 2013 cap ex of ~$27 million under HB95 – Cash recovery of depreciation, property taxes and debt-related post in service carrying costs deferred until next base rate case ▪ Income statement will reflect recognition of post in service carrying costs and deferral of other costs starting in 2014, continuing until next base rate case – Expect to file annually for similar cap ex recovery under HB95
13 Utility – Recent Electric Infrastructure Filing Filed with the Indiana Commission in January 2014 seeking approval for upgrades of existing emissions control equipment on electric generation units under SB251 and clean coal statute (SB 29) • Expect to spend $70-90 million related to EPA mandates, including the mercury and air toxins standards (MATS) that will take effect in 2016 • Requesting authority to postpone cash recovery, which will mitigate near-term customer bill impacts. This proposal is a deferral approach even though Indiana legislation provides for immediate cost recovery. – Targeting cash recovery starting in 2020 due to unrelated existing deferrals that will be fully recovered by the end of 2019 – Case-in-chief to be filed March 14, 2014; Hearings are scheduled to begin July 9, 2014 – Expect order in late 2014 and income statement recognition (earnings) to begin upon receipt of order by deferral of costs, including depreciation, and recording of a return on investment • Vectren’s strategy for electric investments and recovery over the next several years is focused on mitigating the impact to electric customer bills while continuing to invest in order to maintain our safe, reliable, and compliant system of electric infrastructure – Based upon the current cap ex forecast, expect electric rate base to be approximately flat to current level over next several years
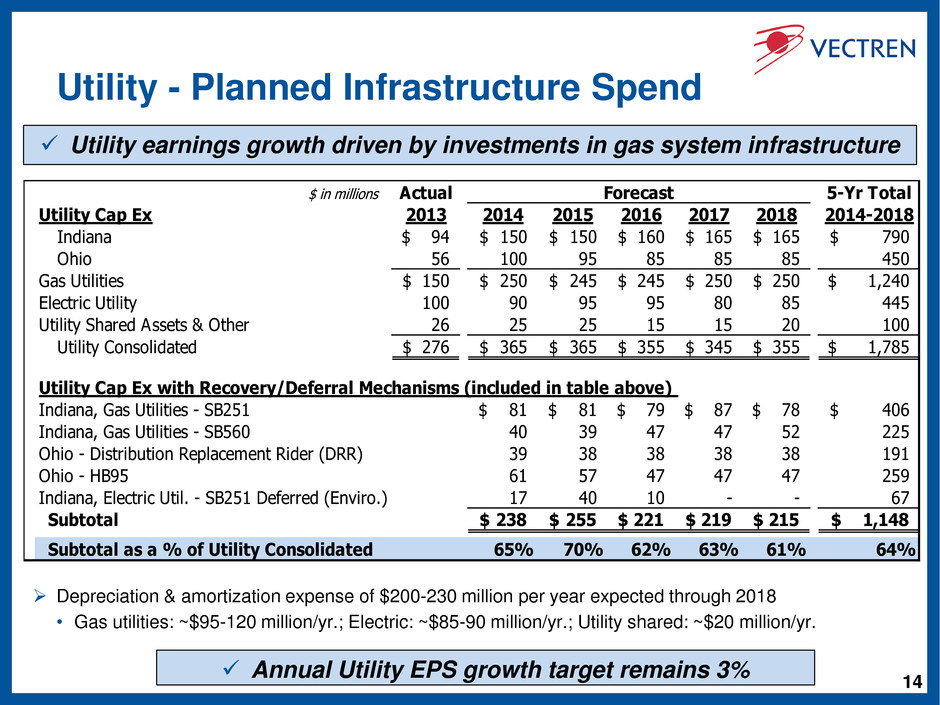
14 Utility - Planned Infrastructure Spend Depreciation & amortization expense of $200-230 million per year expected through 2018 • Gas utilities: ~$95-120 million/yr.; Electric: ~$85-90 million/yr.; Utility shared: ~$20 million/yr. Utility earnings growth driven by investments in gas system infrastructure $ in millions Actual 5-Yr Total Utility Cap Ex 2013 2014 2015 2016 2017 2018 2014-2018 Indiana 94$ 150$ 150$ 160$ 165$ 165$ 790$ Ohio 56 100 95 85 85 85 450 Gas Utilities 150$ 250$ 245$ 245$ 250$ 250$ 1,240$ Electric Utility 100 90 95 95 80 85 445 Utility Shared Assets & Other 26 25 25 15 15 20 100 Utility Consolidated 276$ 365$ 365$ 355$ 345$ 355$ 1,785$ Utility Cap Ex with Recovery/Deferral Mechanisms (included in table above) Indiana, Gas Utilities - SB251 81$ 81$ 79$ 87$ 78$ 406$ Indiana, Gas Utilities - SB560 40 39 47 47 52 225 Ohio - Distribution Replacement Rider (DRR) 39 38 38 38 38 191 Ohio - HB95 61 57 47 47 47 259 Indiana, Electric Util. - SB251 Deferred (Enviro.) 17 40 10 - - 67 Subtotal 238$ 255$ 221$ 219$ 215$ 1,148$ Subtotal as a % of Utility Consolidated 65% 70% 62% 63% 61% 64% Forecast Annual Utility EPS growth target remains 3%
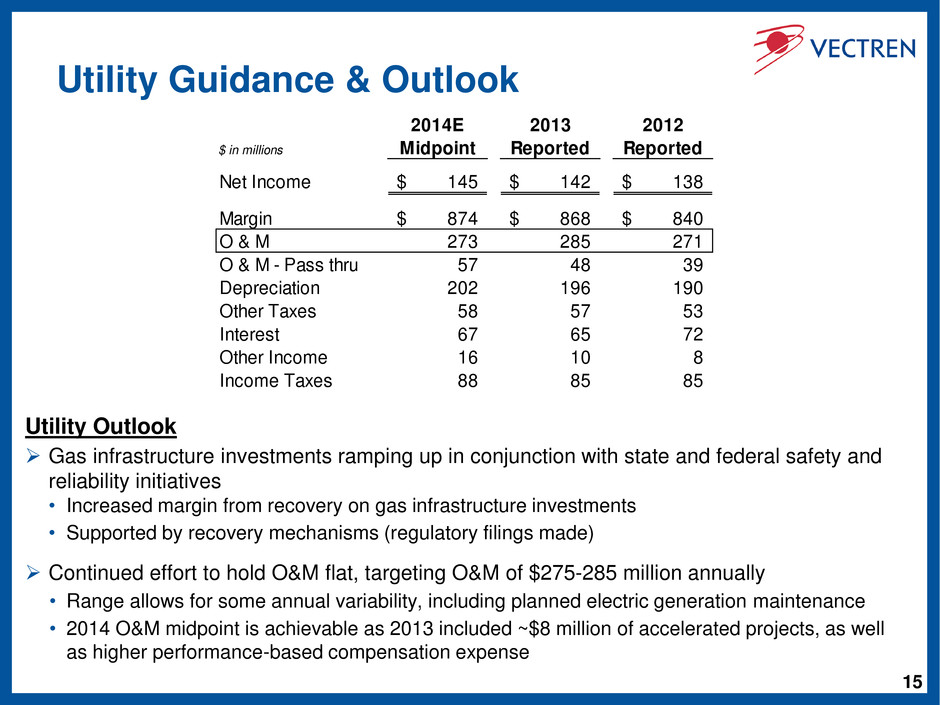
15 Utility Guidance & Outlook Utility Outlook Gas infrastructure investments ramping up in conjunction with state and federal safety and reliability initiatives • Increased margin from recovery on gas infrastructure investments • Supported by recovery mechanisms (regulatory filings made) Continued effort to hold O&M flat, targeting O&M of $275-285 million annually • Range allows for some annual variability, including planned electric generation maintenance • 2014 O&M midpoint is achievable as 2013 included ~$8 million of accelerated projects, as well as higher performance-based compensation expense 2014E 2013 2012 $ in millions Midpoint Reported Reported Net Income 145$ 142$ 138$ Margin 874$ 868$ 840$ O & M 273 285 271 O & M - Pass thru 57 48 39 Depreciation 202 196 190 Other Taxes 58 57 53 Interest 67 65 72 Other Income 16 10 8 Income Taxes 88 85 85
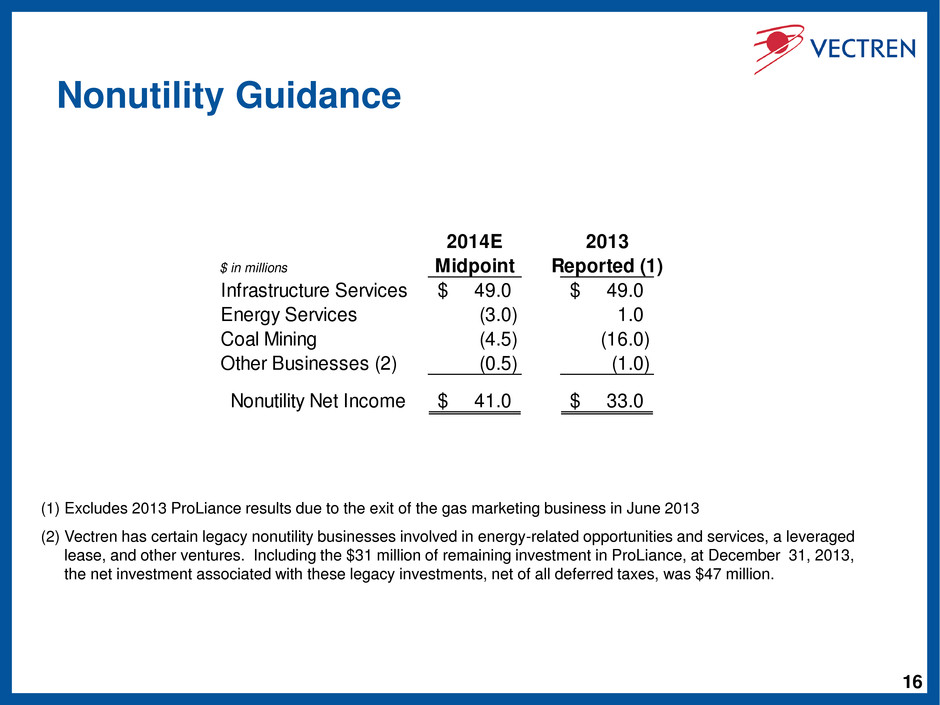
16 Nonutility Guidance 2014E 2013 $ in millions Midpoint Reported (1) Infrastructure Services 49.0$ 49.0$ En rgy Services (3.0) 1.0 Coal Mining (4.5) (16.0) Other Businesses (2) (0.5) (1.0) Nonutility Net Income 41.0$ 33.0$ (1) Excludes 2013 ProLiance results due to the exit of the gas marketing business in June 2013 (2) Vectren has certain legacy nonutility businesses involved in energy-related opportunities and services, a leveraged lease, and other ventures. Including the $31 million of remaining investment in ProLiance, at December 31, 2013, the net investment associated with these legacy investments, net of all deferred taxes, was $47 million.
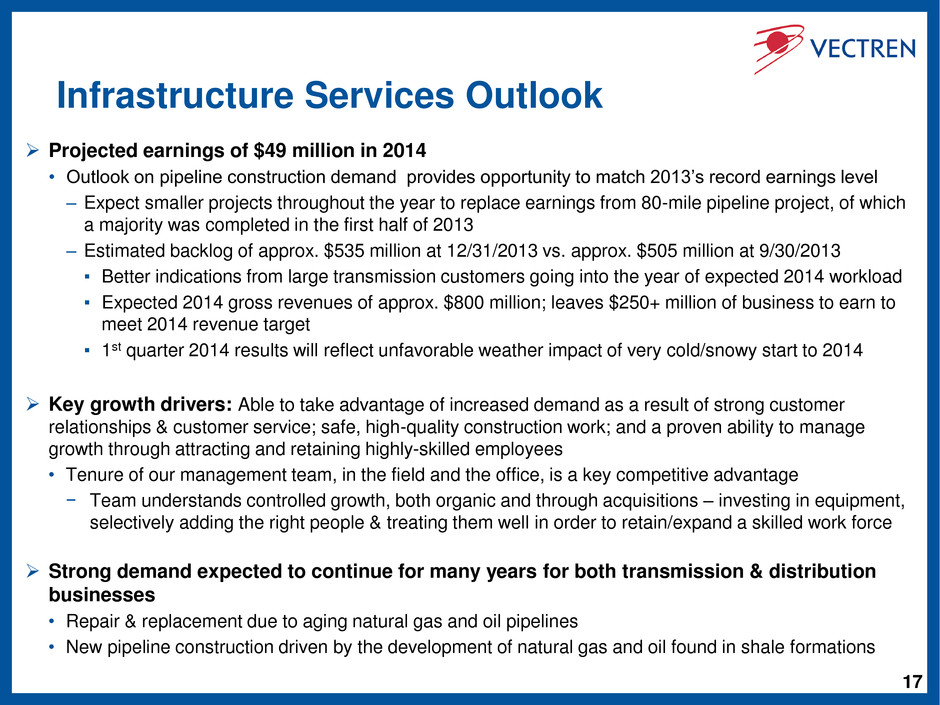
17 Infrastructure Services Outlook Projected earnings of $49 million in 2014 • Outlook on pipeline construction demand provides opportunity to match 2013’s record earnings level – Expect smaller projects throughout the year to replace earnings from 80-mile pipeline project, of which a majority was completed in the first half of 2013 – Estimated backlog of approx. $535 million at 12/31/2013 vs. approx. $505 million at 9/30/2013 ▪ Better indications from large transmission customers going into the year of expected 2014 workload ▪ Expected 2014 gross revenues of approx. $800 million; leaves $250+ million of business to earn to meet 2014 revenue target ▪ 1st quarter 2014 results will reflect unfavorable weather impact of very cold/snowy start to 2014 Key growth drivers: Able to take advantage of increased demand as a result of strong customer relationships & customer service; safe, high-quality construction work; and a proven ability to manage growth through attracting and retaining highly-skilled employees • Tenure of our management team, in the field and the office, is a key competitive advantage − Team understands controlled growth, both organic and through acquisitions – investing in equipment, selectively adding the right people & treating them well in order to retain/expand a skilled work force Strong demand expected to continue for many years for both transmission & distribution businesses • Repair & replacement due to aging natural gas and oil pipelines • New pipeline construction driven by the development of natural gas and oil found in shale formations
18 Energy Services Outlook Projected loss of ($3) million in 2014 as 179D tax credits expire; earnings from operations projected to increase by nearly $8 million in 2014 • Expect 2014 to be a transition year without availability of 179D tax credits, customer demand expected to improve, and cost structure stabilizes – No benefit from 179D tax credits assumed in 2014 projected results vs. ~$7 million net income impact in 2013 – Expansion of sales force was completed in 2013; coupled with some organizational realignments in light of soft market conditions, provides an improved and stable cost structure for the business going forward – Expecting higher level of new contracts in coming years, including 2014 ▪ “MUSH” market is still in a recovery stage, though uptick in new contracts in Q4 vs. Q3 2013 – Expecting to achieve strong, yet lower, gross margins in 2014 & beyond of roughly 20% on average ▪ Margin % expected to decrease due to some larger, sustainable infrastructure projects Still committed to growing the business – including the federal and sustainable infrastructure markets • Energy Systems Group is one of the few energy services companies with experience developing, designing, constructing and operating large, sustainable infrastructure projects (e.g., distributed gen.) • In addition to core “MUSH” market, federal government expected to rely on firms such as ESG to meet energy efficiency & renewable energy standards in its facilities – Diminished governmental funds to complete capital projects that would achieve such standards will drive utilization of firms like ESG since the company has expertise in securing project financing • Customers’ HVAC, lighting, etc., replacement needs increase with passage of time • Projected increases in power prices expected to drive many energy efficiency projects Earnings for Energy Services expected to rebound starting in 2015 as new sales professionals deliver bottom line impact (projects in construction) as 18-24 month lead time passes
19 Coal Mining Results and Outlook Loss of ($16.0) million in 2013, including 4th quarter loss of ($4.0) million • Overall, Coal Mining performance was much improved in the 2nd half of 2013 – Substantial progress was made in the execution of a revised mining plan at Prosperity mine, resulting in lower production costs in the second half of the year – However, during October, an increase in the number of elevated MSHA citations at Prosperity mine negatively impacted production levels and related costs – Also, in December, approx. 0.3 million tons could not be delivered due to rail/weather issues Projected loss of ($4.5) million in 2014 • Expecting production of 7.3 million tons, and sales of 7.6 million tons at ~$44.00 per ton – 6.8 million tons (~90% of expected sales) already sold for 2014 at price of $44.50/ton ▪ Includes 0.3 million tons that could not be delivered at end of 2013 ▪ Includes expected sales to Vectren’s electric utility of ~2.1 million tons • Expecting cost/ton of ~$43.50 compared to $46.12 in 2013 – Increasing percentage of sales from the two Oaktown mines should further improve average cost/ton – Productivity is improving at Oaktown 2 as production ramp-up continues (e.g., deep cuts approved) – Productivity improvement measures continue to be implemented at Prosperity and are working – No recurrence to date of increased elevated citations at Prosperity as experienced in Oct. ’13 ▪ If in the future, Prosperity mine were to be placed on Pattern of Violation (POV) status, citations written would result in more frequent downtime of portions or all of the mine, resulting in higher costs of production 5.5 million tons sold (over 70% of max production of 7.5M) for 2015 at price of ~$45.50/ton

20 Coal Mining – Outlook for Illinois Basin (IB) Coal in 2014 and Beyond Drivers of Expected Improvements • Scrubbers are being installed in larger, more efficient plants, increasing demand for IB coal compared to other coal basins and helping it compete against low natural gas prices. • Natural gas prices forecasted to remain above $3 level reducing likelihood of coal to gas switching in Midwest • Prices expected to firm up and increase as supply and demand become more balanced • Vectren’s Coal Mining group is acting on changing market dynamics - IB coal is displacing coal from other regions, particularly Central Appalachia Midwest 93% Northeast 1% Export 6% 2010 Vectren Coal Sales by Region [% of Volume] Midwest 62% Southeast 29% Northeast 9% 2013 Vectren Coal Sales by Region [% of Volume]

21 Vectren Well Positioned for Premium Valuation Consideration Total shareholder return target of 8-10% • Consolidated earnings growth rate target of 4-5% • 54-year history of attractive and growing dividend Demonstrated ability to consistently achieve earnings growth Premier Utility franchise • Operations in Indiana (gas/electric) and Ohio (gas) – constructive states for utility legislation/regulation • Earnings growth to be driven by timely recovered significant gas infrastructure investments Demonstrated ability to consistently achieve earnings growth and earn allowed returns Nonutility investments focused on Infrastructure and Energy Services for future earnings growth, thus reducing volatility • Infrastructure Services continues to deliver great results Demonstrated action on strategy of reducing reliance on commodity-sensitive businesses Strong credit ratings of A- / A2 at S&P / Moody’s Vectren’s Core Earnings Utility ~80% Nonutility ~20% Electric: ~55% Gas: ~45% 1.1 million Utility customers, Indiana and Ohio Electric: ~40% Gas: ~60% Current Next 3-5 Yrs
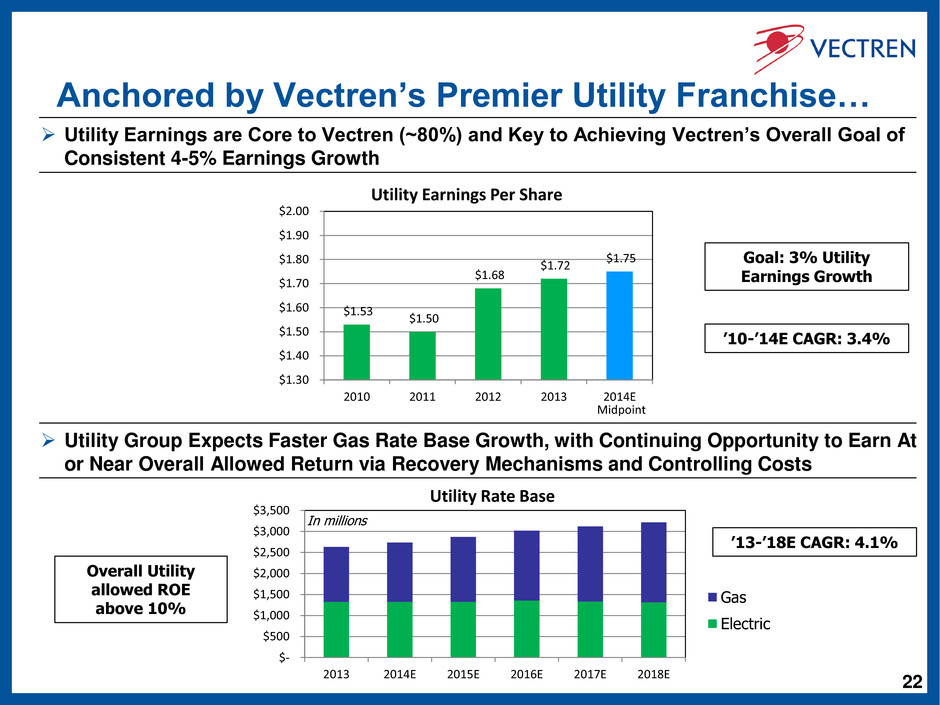
22 Anchored by Vectren’s Premier Utility Franchise… Utility Earnings are Core to Vectren (~80%) and Key to Achieving Vectren’s Overall Goal of Consistent 4-5% Earnings Growth Utility Group Expects Faster Gas Rate Base Growth, with Continuing Opportunity to Earn At or Near Overall Allowed Return via Recovery Mechanisms and Controlling Costs Overall Utility allowed ROE above 10% Goal: 3% Utility Earnings Growth $1.53 $1.50 $1.68 $1.72 $1.75 $1.30 $1.40 $1.50 $1.60 $1.70 $1.80 $1.90 $2.00 2010 2011 2012 2013 2014E Utility Earnings Per Share Midpoint $- $500 $1,000 $1,500 $2,000 $2,500 $3,000 $3,500 2013 2014E 2015E 2016E 2017E 2018E Utility Rate Base Gas Electric ’13-’18E CAGR: 4.1% In millions ’10-’14E CAGR: 3.4%
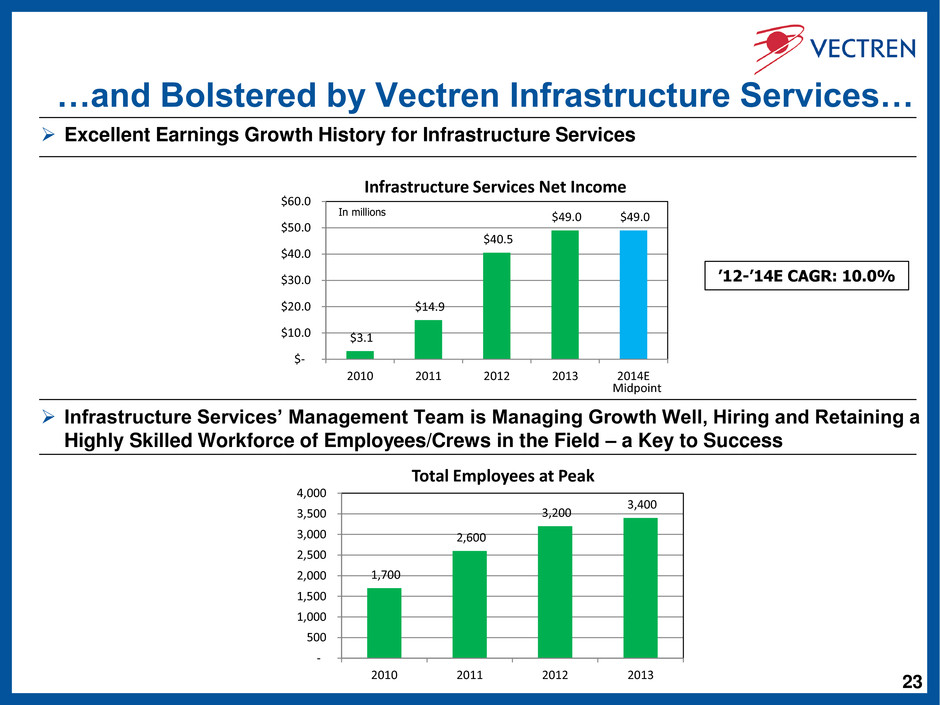
23 …and Bolstered by Vectren Infrastructure Services… Excellent Earnings Growth History for Infrastructure Services Infrastructure Services’ Management Team is Managing Growth Well, Hiring and Retaining a Highly Skilled Workforce of Employees/Crews in the Field – a Key to Success $3.1 $14.9 $40.5 $49.0 $49.0 $- $10.0 $20.0 $30.0 $40.0 $50.0 $60.0 2010 2011 2012 2013 2014E Infrastructure Services Net Income Midpoint In millions 1,700 2,600 3,200 3,400 - 500 1,000 1,500 2,000 2,500 3,000 3,500 4,000 2010 2011 2012 2013 Total Employees at Peak ’12-’14E CAGR: 10.0%
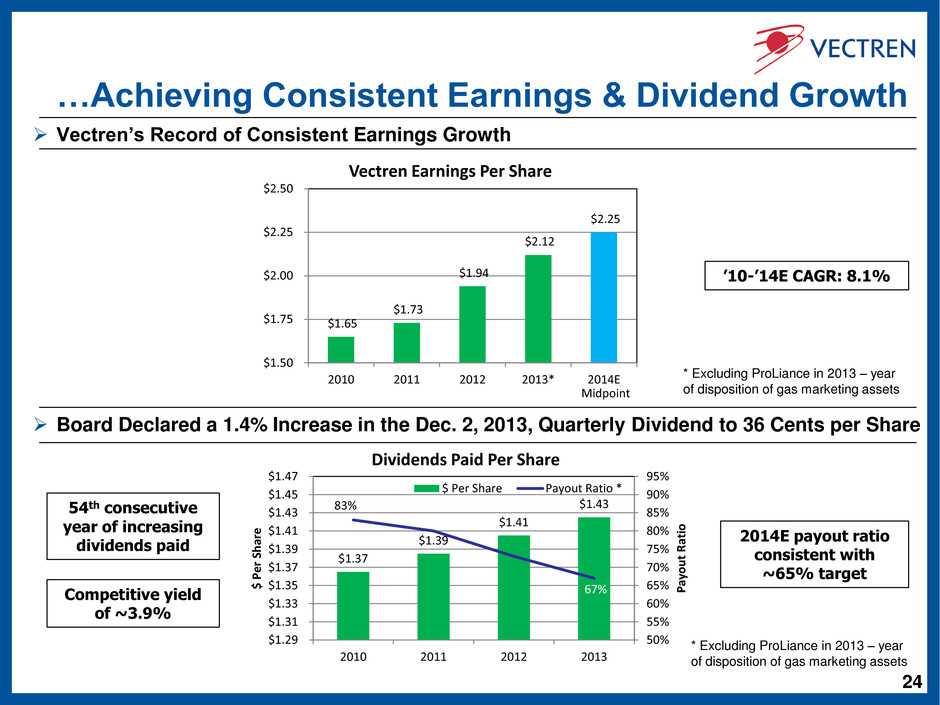
24 …Achieving Consistent Earnings & Dividend Growth 54th consecutive year of increasing dividends paid Competitive yield of ~3.9% Board Declared a 1.4% Increase in the Dec. 2, 2013, Quarterly Dividend to 36 Cents per Share 2014E payout ratio consistent with ~65% target $1.37 $1.39 $1.41 $1.43 83% 67% 50% 55% 60% 65% 70% 75% 80% 85% 90% 95% $1.29 $1.31 $1.33 $1.35 $1.37 $1.39 $1.41 $1.43 $1.45 $1.47 2010 2011 2012 2013 Pa yo u t R ati o $ P e r S h ar e Dividends Paid Per Share $ Per Share Payout Ratio * $1.65 $1.73 $1.94 $2.12 $2.25 $1.50 $1.75 $2.00 $2.25 $2.50 2010 2011 2012 2013* 2014E Vectren Earnings Per Share Midpoint Vectren’s Record of Consistent Earnings Growth * Excluding ProLiance in 2013 – year of disposition of gas marketing assets ’10-’14E CAGR: 8.1% * Excluding ProLiance in 2013 – year of disposition of gas marketing assets
Appendix
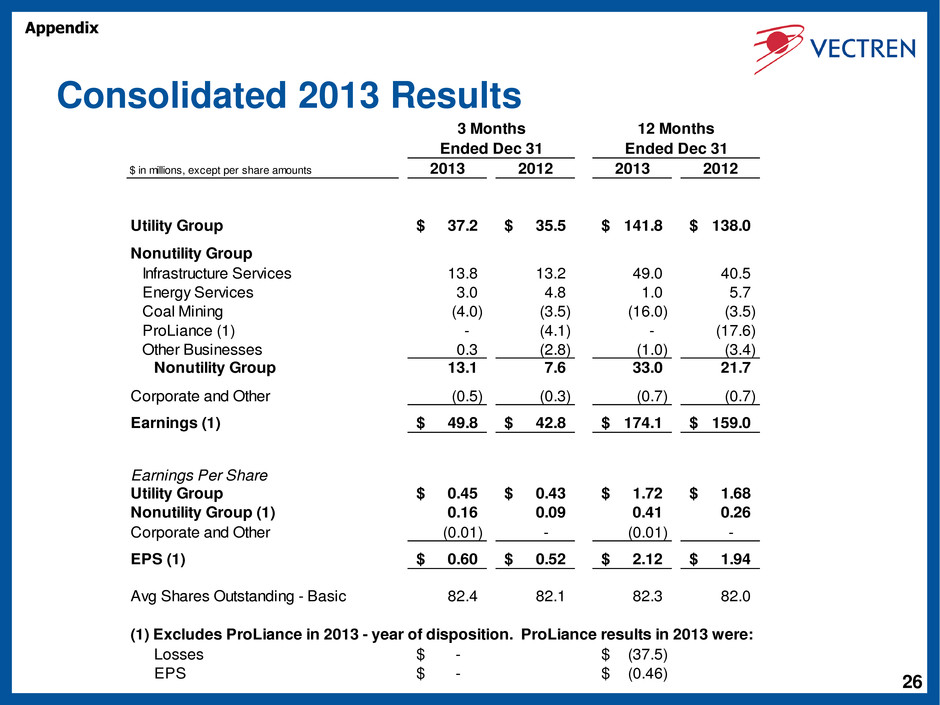
26 Consolidated 2013 Results $ in millions, except per share amounts 2013 2012 2013 2012 Utility Group 37.2$ 35.5$ 141.8$ 138.0$ Nonutility Group Infrastructure Services 13.8 13.2 49.0 40.5 Energy Services 3.0 4.8 1.0 5.7 Coal Mining (4.0) (3.5) (16.0) (3.5) ProLiance (1) - (4.1) - (17.6) Other Businesses 0.3 (2.8) (1.0) (3.4) Nonutility Group 13.1 7.6 33.0 21.7 Corporate and Other (0.5) (0.3) (0.7) (0.7) Earnings (1) 49.8$ 42.8$ 174.1$ 159.0$ Earnings Per Share Utility Group 0.45$ 0.43$ 1.72$ 1.68$ Nonutility Group (1) 0.16 0.09 0.41 0.26 Corporate and Other (0.01) - (0.01) - EPS (1) 0.60$ 0.52$ 2.12$ 1.94$ Avg Shares Outstanding - Basic 82.4 82.1 82.3 82.0 (1) Excludes ProLiance in 2013 - year of disposition. ProLiance results in 2013 were: Losses -$ (37.5)$ EPS -$ (0.46)$ Ended Dec 31 Ended Dec 31 3 Months 12 Months Appendix
27 Utility – Background on Planned Infrastructure Investments Background • The Pipeline Safety Acts (PSA) of 2002 and 2006 established Transmission Integrity Management Program (TIMP) requirements and Distribution Integrity Management Program (DIMP) requirements – Includes assessment of transmission lines within high consequence areas, for example • Vectren’s current gas infrastructure investment plans are designed to address requirements specified under the PSA’s of 2002 and 2006, which will also allow us to meet the anticipated requirements for these assets under the most recent PSA of 2011 Vectren’s Gas Infrastructure Replacement Plans • Transmission Pipeline Infrastructure Replacement - investments to include hydrostatic testing, in-line inspection modifications (‘smart pigging’), installation of remotely-controlled valves, etc. • Distribution Pipeline Infrastructure Replacement - projects include inside meter move outs, obsolete equipment replacements, vintage and odd pipe replacements, etc. Vectren’s Bare Steel/Cast Iron Acceleration Plans • Currently replacing ~85 miles annually; filings reflect acceleration to ~135 miles annually Future • PHMSA has not yet finalized additional requirements specified in the PSA of 2011; Vectren’s infrastructure investment plans will be updated once those requirements are known Appendix
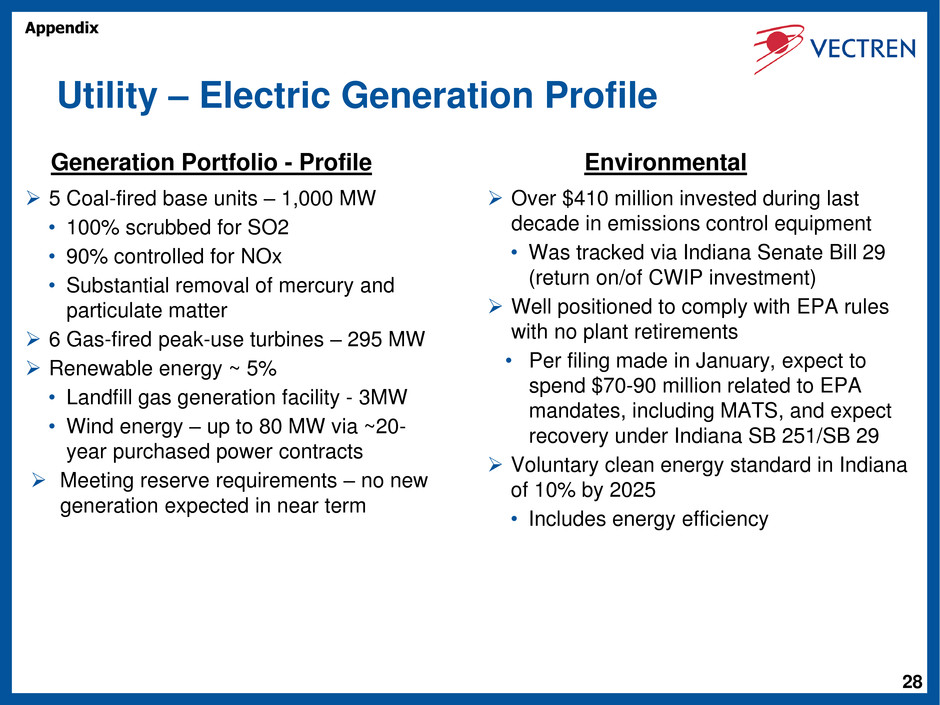
28 Environmental Generation Portfolio - Profile Utility – Electric Generation Profile Over $410 million invested during last decade in emissions control equipment • Was tracked via Indiana Senate Bill 29 (return on/of CWIP investment) Well positioned to comply with EPA rules with no plant retirements • Per filing made in January, expect to spend $70-90 million related to EPA mandates, including MATS, and expect recovery under Indiana SB 251/SB 29 Voluntary clean energy standard in Indiana of 10% by 2025 • Includes energy efficiency 5 Coal-fired base units – 1,000 MW • 100% scrubbed for SO2 • 90% controlled for NOx • Substantial removal of mercury and particulate matter 6 Gas-fired peak-use turbines – 295 MW Renewable energy ~ 5% • Landfill gas generation facility - 3MW • Wind energy – up to 80 MW via ~20- year purchased power contracts Meeting reserve requirements – no new generation expected in near term Appendix
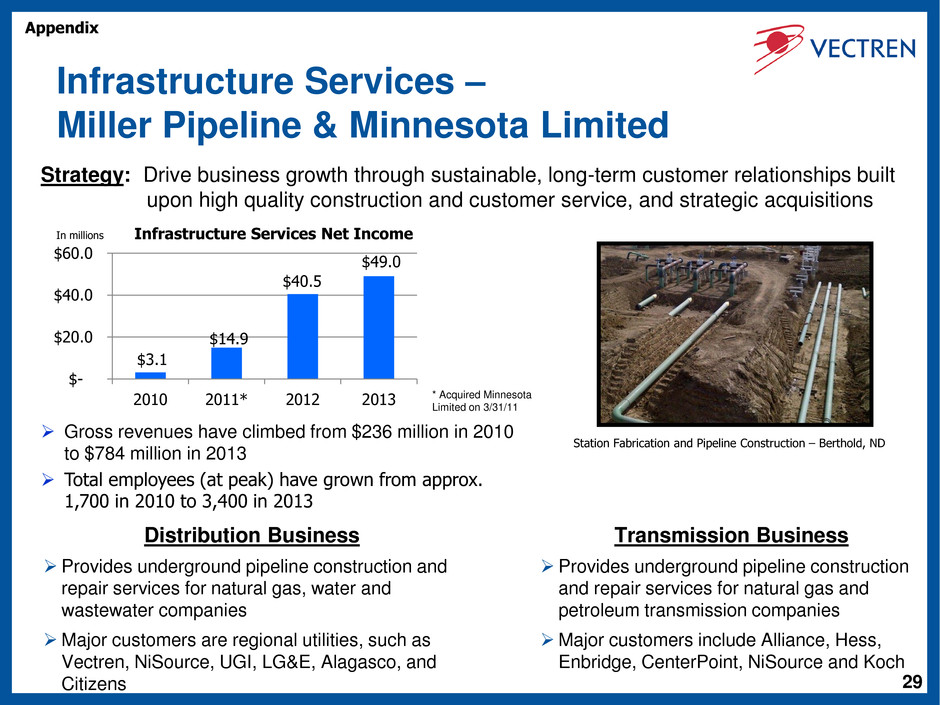
29 Infrastructure Services – Miller Pipeline & Minnesota Limited Distribution Business Provides underground pipeline construction and repair services for natural gas, water and wastewater companies Major customers are regional utilities, such as Vectren, NiSource, UGI, LG&E, Alagasco, and Citizens Transmission Business Provides underground pipeline construction and repair services for natural gas and petroleum transmission companies Major customers include Alliance, Hess, Enbridge, CenterPoint, NiSource and Koch Strategy: Drive business growth through sustainable, long-term customer relationships built upon high quality construction and customer service, and strategic acquisitions Station Fabrication and Pipeline Construction – Berthold, ND * Acquired Minnesota Limited on 3/31/11 $3.1 $14.9 $40.5 $49.0 $- $20.0 $40.0 $60.0 2010 2011* 2012 2013 Infrastructure Services Net Income In millions Gross revenues have climbed from $236 million in 2010 to $784 million in 2013 Total employees (at peak) have grown from approx. 1,700 in 2010 to 3,400 in 2013 Appendix
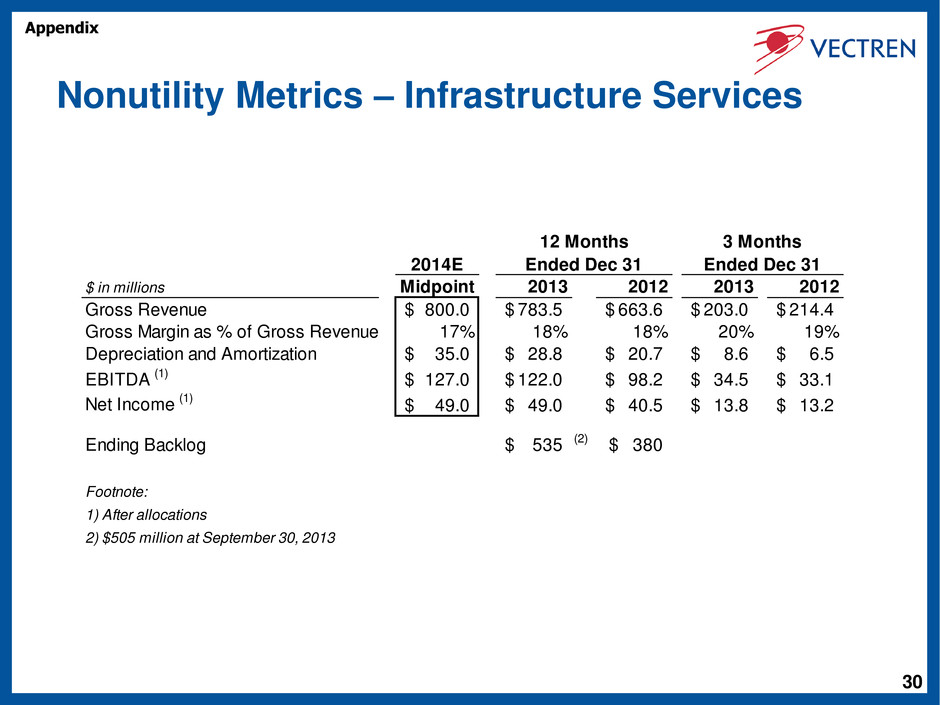
30 Nonutility Metrics – Infrastructure Services 2014E $ in millions Midpoint 2013 2012 2013 2012 Gross Revenue 800.0$ 783.5$ 663.6$ 203.0$ 214.4$ Gross Margin as % of Gross Revenue 17% 18% 18% 20% 19% Depreciation and Amortization 35.0$ 28.8$ 20.7$ 8.6$ 6.5$ EBITDA (1) 127.0$ 122.0$ 98.2$ 34.5$ 33.1$ Net Income (1) 49.0$ 49.0$ 40.5$ 13.8$ 13.2$ Ending Backlog 535$ (2) 380$ Footnote: 1) After allocations 2) $505 million at September 30, 2013 3 Months Ended Dec 31 12 Months Ended Dec 31 Appendix
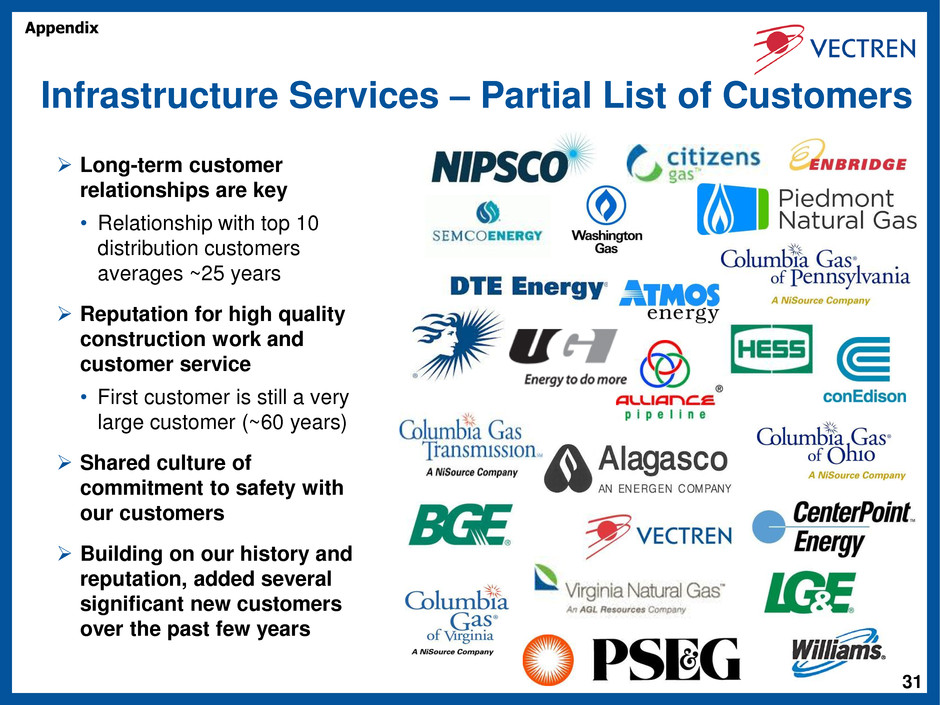
31 Infrastructure Services – Partial List of Customers Long-term customer relationships are key • Relationship with top 10 distribution customers averages ~25 years Reputation for high quality construction work and customer service • First customer is still a very large customer (~60 years) Shared culture of commitment to safety with our customers Building on our history and reputation, added several significant new customers over the past few years Appendix
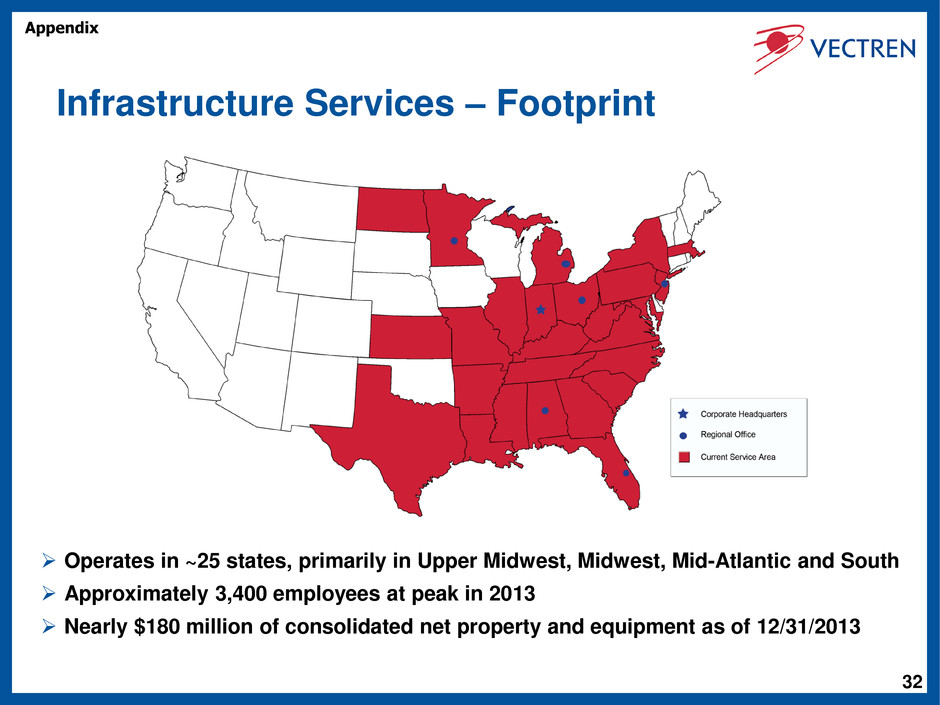
32 Infrastructure Services – Footprint Operates in ~25 states, primarily in Upper Midwest, Midwest, Mid-Atlantic and South Approximately 3,400 employees at peak in 2013 Nearly $180 million of consolidated net property and equipment as of 12/31/2013 Appendix
33 Infrastructure Services – Estimated Backlog General Description of Types of Customer Contracts for Infrastructure Services • Infrastructure Services operates primarily under two types of contracts – blanket contracts and fixed price contracts. Blanket contracts are ones which a customer is not contractually committed to specific volumes of services, but where we have been chosen to perform work needed by a customer in a given time frame (typically awarded on a yearly basis). Fixed price contracts are ones which a customer has contractually committed to a specific service to be performed for a specific price, whether in total for a project or on a per unit basis (e.g., per dig or per foot). General Description of Backlog for Infrastructure Services • Backlog represents an estimate of the amount of gross revenue that we expect to realize from work to be performed in the next 12 months on existing contracts or contracts we reasonably expect to be renewed or awarded based upon recent history or discussions with customers. While there is a reasonable basis to estimate backlog, there can be no assurance as to our customers’ eventual demand for our services each year or, therefore, the accuracy of our estimate of backlog. Backlog for Infrastructure Services estimated as follows: • For blanket contracts, estimated backlog as of 12/31/2013 is $460 million. This estimate is based upon 80% of a rolling 12-month calculation of gross revenues. An 80% multiplier was used to factor in such unknowns as weather and potential budgetary restrictions of customers. • For fixed price contracts, estimated backlog as of 12/31/2013 is $75 million. This represents the value remaining on contracts awarded, but not yet completed as of 12/31/2013. • Total estimated backlog as of 12/31/2013: $535 million, compared to $505 million at 9/30/2013 Appendix

34 This page intentionally left blank Appendix
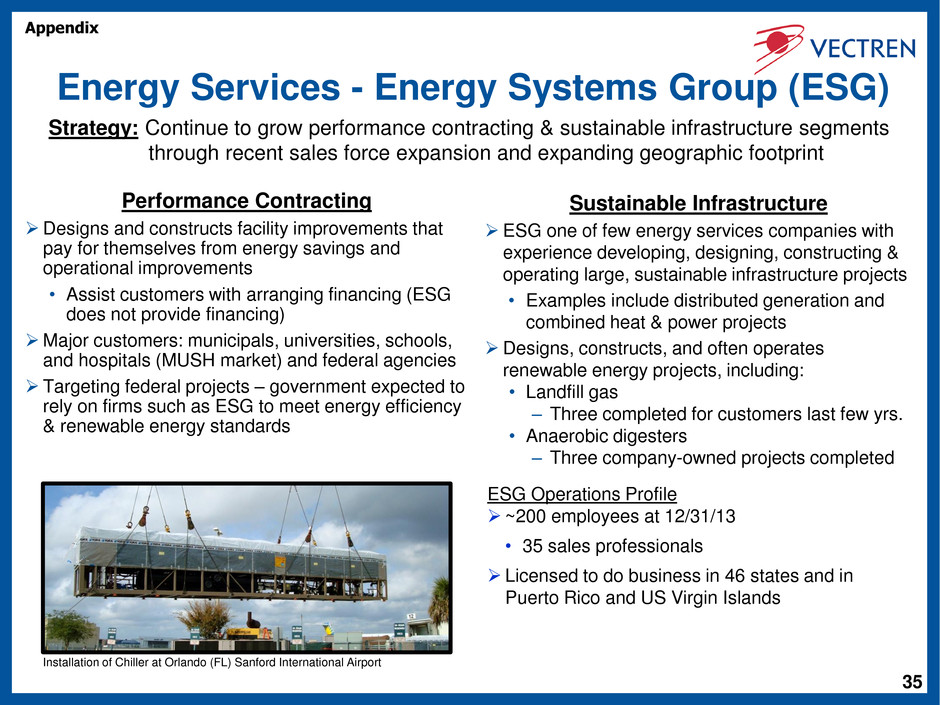
35 Energy Services - Energy Systems Group (ESG) Performance Contracting Designs and constructs facility improvements that pay for themselves from energy savings and operational improvements • Assist customers with arranging financing (ESG does not provide financing) Major customers: municipals, universities, schools, and hospitals (MUSH market) and federal agencies Targeting federal projects – government expected to rely on firms such as ESG to meet energy efficiency & renewable energy standards Sustainable Infrastructure ESG one of few energy services companies with experience developing, designing, constructing & operating large, sustainable infrastructure projects • Examples include distributed generation and combined heat & power projects Designs, constructs, and often operates renewable energy projects, including: • Landfill gas – Three completed for customers last few yrs. • Anaerobic digesters – Three company-owned projects completed ESG Operations Profile ~200 employees at 12/31/13 • 35 sales professionals Licensed to do business in 46 states and in Puerto Rico and US Virgin Islands Strategy: Continue to grow performance contracting & sustainable infrastructure segments through recent sales force expansion and expanding geographic footprint Installation of Chiller at Orlando (FL) Sanford International Airport Appendix
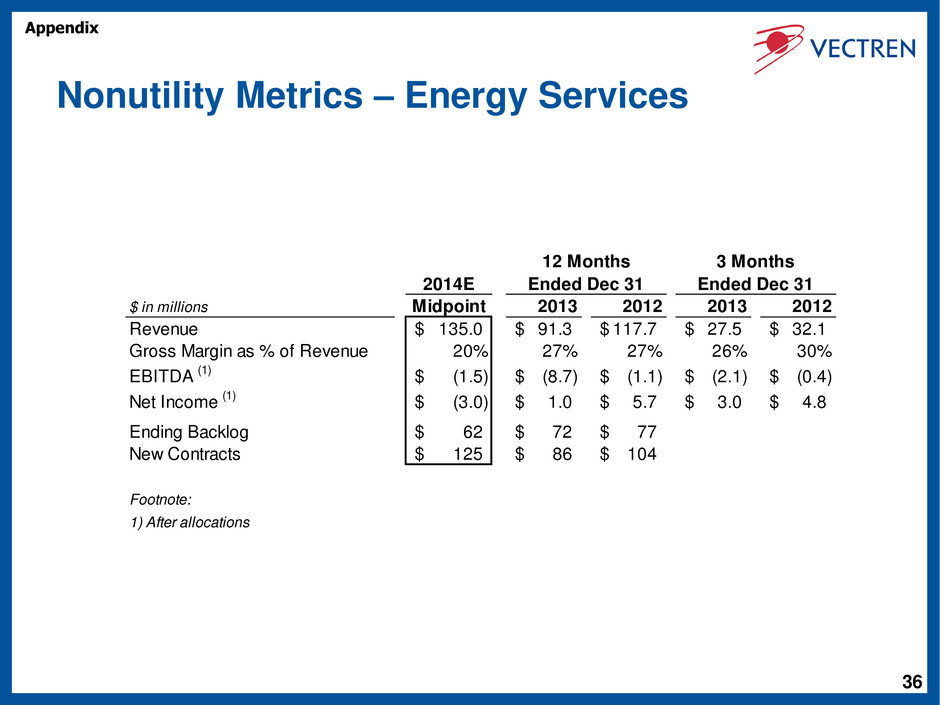
36 Nonutility Metrics – Energy Services 2014E $ in millions Midpoint 2013 2012 2013 2012 Revenue 135.0$ 91.3$ 117.7$ 27.5$ 32.1$ Gross Margin as % of Revenue 20% 27% 27% 26% 30% EBITDA (1) (1.5)$ (8.7)$ (1.1)$ (2.1)$ (0.4)$ Net I come (1) (3.0)$ 1.0$ 5.7$ 3.0$ 4.8$ Ending Backlog 62$ 72$ 77$ New Contracts 125$ 86$ 104$ Footnote: 1) After allocations Ended Dec 31 3 Months12 Months Ended Dec 31 Appendix
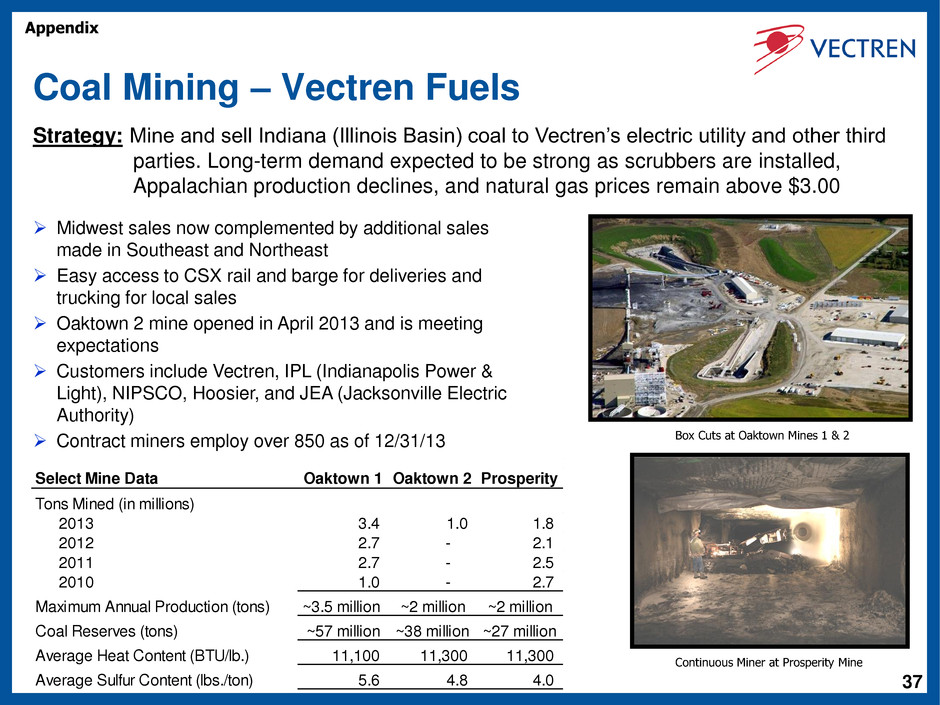
37 Coal Mining – Vectren Fuels Midwest sales now complemented by additional sales made in Southeast and Northeast Easy access to CSX rail and barge for deliveries and trucking for local sales Oaktown 2 mine opened in April 2013 and is meeting expectations Customers include Vectren, IPL (Indianapolis Power & Light), NIPSCO, Hoosier, and JEA (Jacksonville Electric Authority) Contract miners employ over 850 as of 12/31/13 Strategy: Mine and sell Indiana (Illinois Basin) coal to Vectren’s electric utility and other third parties. Long-term demand expected to be strong as scrubbers are installed, Appalachian production declines, and natural gas prices remain above $3.00 Select Mine Data Oaktown 1 Oaktown 2 Prosperity Tons Mined (in millions) 2013 3.4 1.0 1.8 2012 2.7 - 2.1 2011 2.7 - 2.5 2010 1.0 - 2.7 Maximum Annual Production (tons) ~3.5 million ~2 million ~2 million Coal Reserves (tons) ~57 million ~38 million ~27 million Average Heat Content (BTU/lb.) 11,100 11,300 11,300 Average Sulfur Content (lbs./ton) 5.6 4.8 4.0 Box Cuts at Oaktown Mines 1 & 2 Continuous Miner at Prosperity Mine Appendix
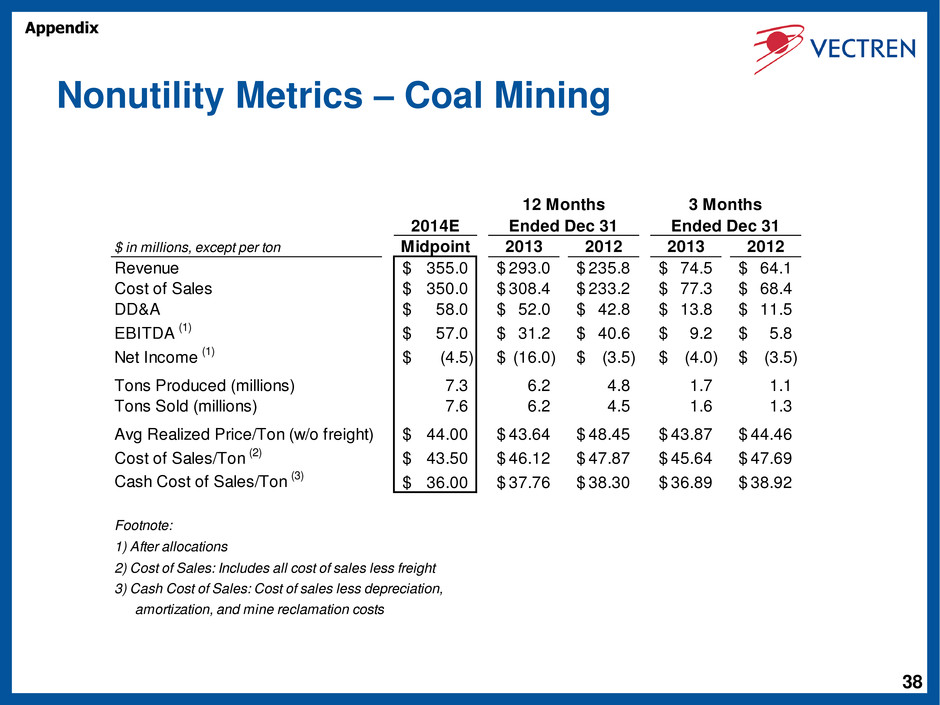
38 Nonutility Metrics – Coal Mining 2014E $ in millions, except per ton Midpoint 2013 2012 2013 2012 Revenue 355.0$ 293.0$ 235.8$ 74.5$ 64.1$ Cost of Sales 350.0$ 308.4$ 233.2$ 77.3$ 68.4$ DD&A 58.0$ 52.0$ 42.8$ 13.8$ 11.5$ EBITDA (1) 57.0$ 31.2$ 40.6$ 9.2$ 5.8$ Net Income (1) (4.5)$ (16.0)$ (3.5)$ (4.0)$ (3.5)$ Tons Produced (millions) 7.3 6.2 4.8 1.7 1.1 Tons Sold (millions) 7.6 6.2 4.5 1.6 1.3 Avg Realized Price/Ton (w/o freight) 44.00$ 43.64$ 48.45$ 43.87$ 44.46$ Cost of Sales/Ton (2) 43.50$ 46.12$ 47.87$ 45.64$ 47.69$ Cash Cost of Sales/Ton (3) 36.00$ 37.76$ 38.30$ 36.89$ 38.92$ Footnote: 1) After allocations 2) Cost of Sales: Includes all cost of sales less freight 3) Cash Cost of Sales: Cost of sales less depreciation, amortization, and mine reclamation costs Ended Dec 31 3 Months12 Months Ended Dec 31 Appendix
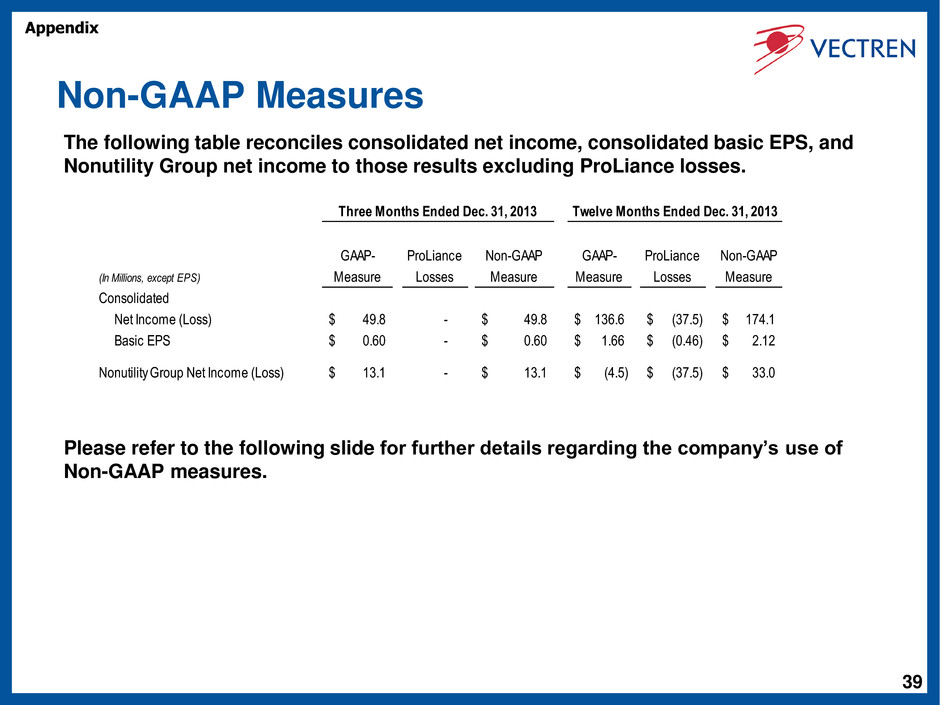
39 Non-GAAP Measures The following table reconciles consolidated net income, consolidated basic EPS, and Nonutility Group net income to those results excluding ProLiance losses. Please refer to the following slide for further details regarding the company’s use of Non-GAAP measures. Three Months Ended Dec. 31, 2013 Twelve Months Ended Dec. 31, 2013 GAAP- Measure ProLiance Losses Non-GAAP Measure GAAP- Measure ProLiance Losses Non-GAAP Measure Consolidated N t In m (Loss) 49.8$ - 49.8$ 136.6$ (37.5)$ 174.1$ Basic EPS 0.60$ - 0.60$ 1.66$ (0.46)$ 2.12$ Nonutility Group Net Income (Loss) 13.1$ - 13.1$ (4.5)$ (37.5)$ 33.0$ (In Millions, except EPS) Appendix
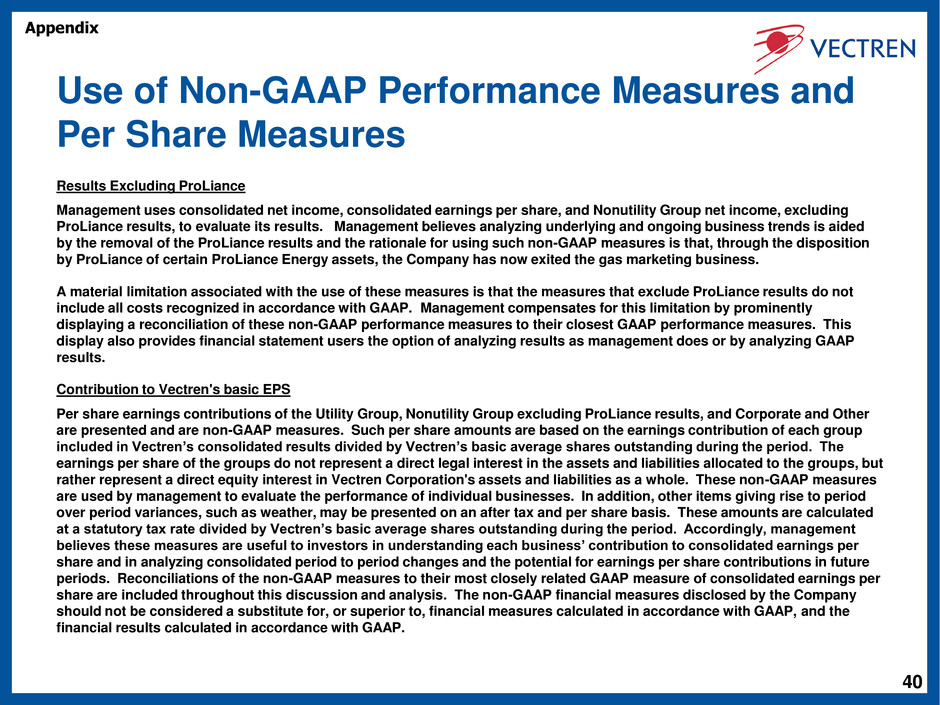
40 Use of Non-GAAP Performance Measures and Per Share Measures Results Excluding ProLiance Management uses consolidated net income, consolidated earnings per share, and Nonutility Group net income, excluding ProLiance results, to evaluate its results. Management believes analyzing underlying and ongoing business trends is aided by the removal of the ProLiance results and the rationale for using such non-GAAP measures is that, through the disposition by ProLiance of certain ProLiance Energy assets, the Company has now exited the gas marketing business. A material limitation associated with the use of these measures is that the measures that exclude ProLiance results do not include all costs recognized in accordance with GAAP. Management compensates for this limitation by prominently displaying a reconciliation of these non-GAAP performance measures to their closest GAAP performance measures. This display also provides financial statement users the option of analyzing results as management does or by analyzing GAAP results. Contribution to Vectren's basic EPS Per share earnings contributions of the Utility Group, Nonutility Group excluding ProLiance results, and Corporate and Other are presented and are non-GAAP measures. Such per share amounts are based on the earnings contribution of each group included in Vectren’s consolidated results divided by Vectren’s basic average shares outstanding during the period. The earnings per share of the groups do not represent a direct legal interest in the assets and liabilities allocated to the groups, but rather represent a direct equity interest in Vectren Corporation's assets and liabilities as a whole. These non-GAAP measures are used by management to evaluate the performance of individual businesses. In addition, other items giving rise to period over period variances, such as weather, may be presented on an after tax and per share basis. These amounts are calculated at a statutory tax rate divided by Vectren’s basic average shares outstanding during the period. Accordingly, management believes these measures are useful to investors in understanding each business’ contribution to consolidated earnings per share and in analyzing consolidated period to period changes and the potential for earnings per share contributions in future periods. Reconciliations of the non-GAAP measures to their most closely related GAAP measure of consolidated earnings per share are included throughout this discussion and analysis. The non-GAAP financial measures disclosed by the Company should not be considered a substitute for, or superior to, financial measures calculated in accordance with GAAP, and the financial results calculated in accordance with GAAP. Appendix


