Mission Statement "To Serve All People During the End of Life's Journey" |
Forward-Looking Statement Certain statements contained in this presentation are forward-looking statements within the meaning of the federal securities laws. Such forward-looking statements are based on management's current expectations and are subject to known and unknown risks, uncertainties and assumptions which may cause the forward- looking events and circumstances discussed in this presentation to differ materially from those anticipated or implied by the forward-looking statements. Such risks, uncertainties and assumptions include, but are not limited to, general market conditions; adverse changes in reimbursement levels under Medicare and Medicaid programs; increases in inflation including inflationary increases in patient care costs; adverse changes in the Medicare payment cap limits and increases in the Company's Medicare cap contractual adjustment; decline in patient census growth; challenges inherent in and potential changes in the Company's growth and expansion strategy; our ability to effectively implement the Company's 2006 operations initiatives; the ability to attract and retain healthcare professionals; the company's dependence on patient referral sources and potential adverse changes in patient referral practices of those referral sources; our ability to implement a new integrated billing and clinical management and electronic medical records system; changes in state or federal income, franchise or similar tax laws and regulations; adverse changes in the state and federal licensure and certification laws and regulations; adverse results of regulatory surveys; delays in licensure and/or certification; government and private party, legal proceedings and investigations; adverse changes in the competitive environment in which the Company operates; adverse impact of natural disasters; changes in our estimate of additional compensation costs under FASB Statement No. 123(R); and the disclosures contained under the headings "Government Regulation and Payment Structure" in "Item 1. Business" and "Item 1A. Risk Factors" of Odyssey's Annual Report on Form 10-K filed with the Securities and Exchange Commission on March 10, 2006, and in its other filings with the Securities and Exchange Commission. Many of these factors are beyond the ability of the Company to control or predict. Given these uncertainties, readers are cautioned not to place undue reliance on such forward-looking statements, which reflect management's views only as of the date hereof. The Company undertakes no obligation to revise or update any of the forward-looking statements or publicly announce any updates or revisions to any of the forward- looking statements contained herein to reflect any change in the Company's expectations with regard thereto or any change in events, conditions, circumstances or assumptions underlying such statements. |
Largest geographic footprint of any hospice provider 82 Medicare certified programs in 30 states Second largest in terms of patients treated 33,024 admissions in 2005 Demonstrated track record of growth CAGR revenue = 30.5% Implementing new state of the art IT system Strong cash flow / balance sheet provides flexibility Odyssey... A Leader in Hospice Care |
Investment Highlights Strong balance sheet $69.0 million in cash and short term investments Good cash flow $29.7 million from operations YTD 2006 (exclusive of $13 million DOJ payment) Implementing growth initiatives for differentiation National scale provides benefits Proven track record in geographic expansion through start-ups and acquisitions Excellent growth opportunity with aging population, underserved market |
Odyssey Locations 82 Medicare Certified |
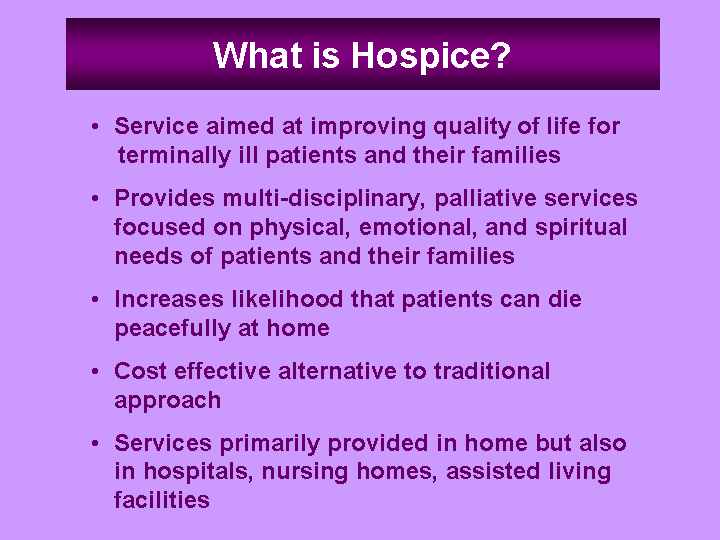
What is Hospice? Service aimed at improving quality of life for terminally ill patients and their families Provides multi-disciplinary, palliative services focused on physical, emotional, and spiritual needs of patients and their families Increases likelihood that patients can die peacefully at home Cost effective alternative to traditional approach Services primarily provided in home but also in hospitals, nursing homes, assisted living facilities |
Four Levels of Care Routine $129 per diem * At patient's residence, including nursing home Approximately 90% of the market Continuous $802 per diem * (hourly billing) At patient's residence Examples: crisis, manage acute pain; 24/7 care Inpatient $615 per diem * At hospital, dedicated Odyssey facility, certain nursing homes Examples: crisis, manage pain that can't be managed elsewhere Respite $134 per diem * At hospital, dedicated Odyssey facility or nursing home Seldom used benefit * Per diem rates vary by geographic location |
Hospice Market 56% Non-Profit 36% For Profit 7% Government 1% Other Approximately 2,700 hospice programs Major players will have consolidation opportunities |
Market Opportunity 2.5 Million Deaths Annually in U.S. 17% Est. Sudden Death/Other 42% Est. Under- Served Market 41% Est. Hospice Patients Served Entire industry capturing only 50% of patients that may qualify for hospice Odyssey undergoing strategic evaluation of programs in each market to better capture under-served market |
Patients by Diagnosis in the Industry Cancer 49% Other 19.2% Heart Disease 11% Dementia 9.6% Lung Disease 6.8% Kidney Disease 2.8% Liver Disease 1.6% |
Covered by Medicare Benefit enacted in 1983 Six months life expectancy Largest payer at > 90% is Medicare Paid on a per diem basis with an aggregate per beneficiary cap ($20,585 for 2006 Medicare Cap year) Service promoted by CMS |
Hospice Market Growth factors Aging population Additional diagnoses utilizing hospice Increased penetration - greater understanding and acceptance Increased length of stay |
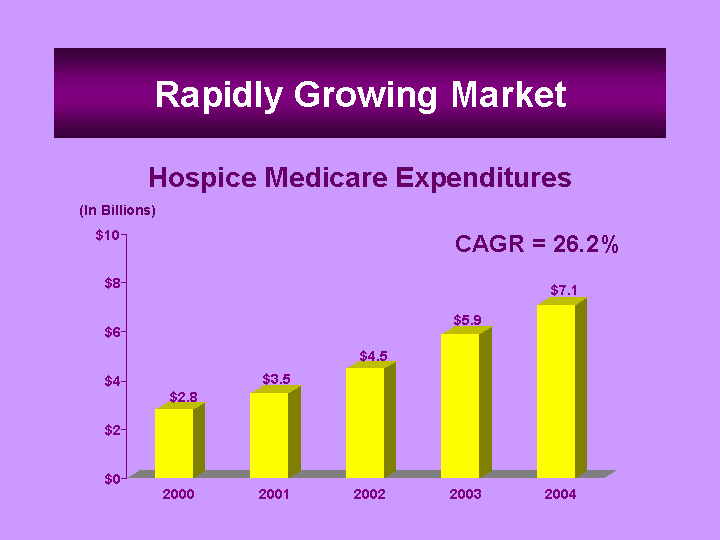
Rapidly Growing Market Hospice Medicare Expenditures (In Billions) CAGR = 26.2% $2.8 $3.5 $4.5 $5.9 $7.1 $0 $2 $4 $6 $8 $10 2000 2001 2002 2003 2004 |
Strategy Service excellence Refine growth strategies More comprehensive and sophisticated approach to Medicare cap Continue development of new inpatient units Balance top line growth with a more disciplined approach to infrastructure and costs Continue the implementation of our new state of the art IT system Round out management team |
Growth Strategy Same store growth Start-up programs Acquisitions Focused and disciplined approach to growth through: |
Same Store Growth Program maturation Referral sources become more familiar with our programs and level of service Continue to refine basic sales strategy Marketing teams working to understand specific needs of each market and each referral source Expanding continuum of care to increase market share by treating broader range of patients Increase penetration into continuous care Expand inpatient unit development Leverage footprint by expanding geographic reach of existing programs by opening alternate delivery sites (ADS) |
Expanding continuum of care - Continuous Care Same Store Growth (continued) Higher level of care to patients and families Increases our ability to accept more acute patients and admit patients earlier Major competitive advantage Improves admissions as a provider of choice Dilutive effect on margin % |
Expanding the continuum of care - Dedicated Inpatient Unit Development Same Store Growth (continued) Higher quality of inpatient care Further enhances ability to accept more acute patient Competitive advantage Provider of choice to referral sources Currently have 7 projects in various stages of development Dilutive effect on margin % |
Alternate delivery sites Same Store Growth (continued) New geographic site associated with an existing provider Expands geographic reach and leverages management overhead Leverages existing relationships Opened 10 ADS sites thus far in 2006 |
Distribution by Program Size Medicare Certified Programs Only 0 - 50 Patients 51 - 100 Patients 101 - 200 Patients 201+ Patients # of Programs 19 23 34 5 Avg. Size Q3 30 ADC 72 ADC 145 ADC 246 ADC Avg. Revenue Q3 $375,918 $844,854 $1,788,294 $3,102,923 Avg. Net Margin Q3 .8% 10.8% 20.9% 30.6% Q3 2006 Scale brings significant economic benefits |
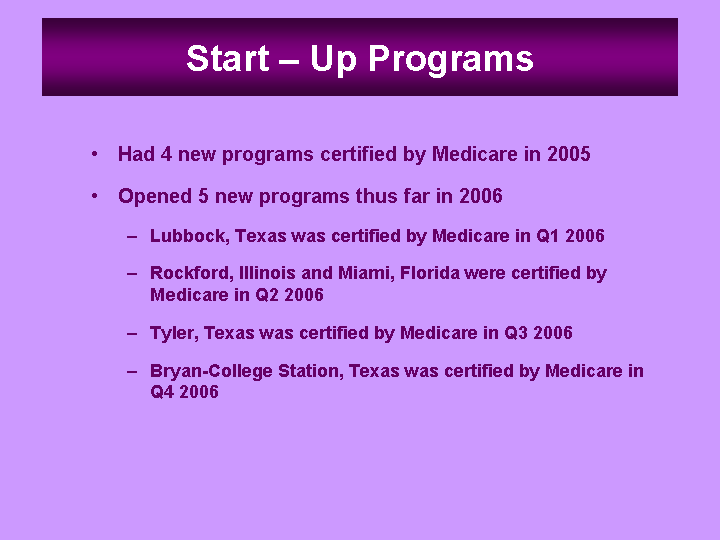
Start - Up Programs Had 4 new programs certified by Medicare in 2005 Opened 5 new programs thus far in 2006 Lubbock, Texas was certified by Medicare in Q1 2006 Rockford, Illinois and Miami, Florida were certified by Medicare in Q2 2006 Tyler, Texas was certified by Medicare in Q3 2006 Bryan-College Station, Texas was certified by Medicare in Q4 2006 |
Acquisitions Renewed focus on acquisitions Hired new Senior Vice President of Strategy and Development Strong cash position and balance sheet |
26 36 49 65 73 78 (Cumulative Providers) Growth in Number of Programs 79 81 81 8 18 10 26 13 36 22 43 29 44 32 46 33 46 35 46 35 46 0 10 20 30 40 50 60 70 80 90 2000 2001 2002 2003 2004 2005 Q1 2006 Q2 2006 Q3 2006 Start-ups Acquisitions |
Admissions 15,969 22,062 26,488 30,618 33,024 Admissions doubled since 2001 due to same store growth, acquisitions, new programs 25,750 (9 months) 0 2,000 4,000 6,000 8,000 10,000 12,000 14,000 16,000 18,000 20,000 22,000 24,000 26,000 28,000 30,000 32,000 34,000 2001 2002 2003 2004 2005 YTD 2006 |
(Days) Average Length of Stay (9 months) 74 79 82 85 68 70 72 74 76 78 80 82 84 86 2003 2004 2005 YTD 2006 |
Average Daily Census a Function of Admissions and Length of Stay 3,044 4,407 5,936 7,383 Average Daily Census 7,907 8,329 (9 months) 0 500 1,000 1,500 2,000 2,500 3,000 3,500 4,000 4,500 5,000 5,500 6,000 6,500 7,000 7,500 8,000 8,500 2001 2002 2003 2004 2005 YTD 2006 |
Net Revenue Growth Revenue Growth Fuelled by Internal Growth and Acquisitions (In Millions) CAGR 30.5% (9 months) $130.2 $194.5 $270.2 $340.2 $378.1 $310.3 $0 $50 $100 $150 $200 $250 $300 $350 $400 2001 2002 2003 2004 2005 YTD 2006 |
Medicare "Cap" Sets a limit on the maximum reimbursement per provider number Determined on an aggregate basis on an annual basis at each individual program $20,585 X number of admissions = limit Gross Revenue per admission > $20,585 2006 Cap number |
Medicare "Cap" Can be volatile in the short term due to nature of calculation Changes in number of admissions causes this volatility Can be effectively managed over the long term |
Medicare "Cap" Clarifications A program that exceeds cap may be performing better than a program that is below the cap Looking at cap amount alone is not an indicator of profitability |
Medicare "Cap" - An Example Program 1 Program 2 LOS 100 175 Gross Rev PPD 125 125 Ex PPD 75 75 Admissions 500 500 ADC (a result of LOS) 137 240 Cap limit 10,185,000 10,185,000 Gross Revenue 6,250,000 10,937,500 "Cap accrual" 0 752,500 Net Revenue 6,250,000 10,185,000 Expense 3,750,000 6,562,500 Profit 2,500,000 3,622,500 LOS X RevPPD 12,500 21,875 |
Medicare "Cap" Profitability is enhanced when a program operates near the cap, not significantly over or UNDER Profitability Analysis |
Medicare "Cap" Performance Level - % of Peak % of Cap Limit Gross Revenue per Admission 80 - 100% 80 - 105% $16,468 - 21,614 50 - 80 % 50 - 80% 105 - 115% $10,292 - 16,468 $21,614 - 23,672 < 50 % < 50% > 115% < $10,292 > $23,672 |
Medicare "Cap" Performance Level - % of Peak % of Cap Limit Percentage of Programs - 80 - 100% 80 - 105% 23% 50 - 80 % 50 - 80% 105 - 115% 45% 5% < 50 % < 50% > 115% 19% 8% |
Medicare "Cap" - Strategy Balanced Mix of Patients By diagnosis By place of referral Inpatient development |
Inpatient Unit Development Two strategies Medicare cap - acute, short stay patients Grow market share - create differentiation 7 new projects before 12/31/07 Opening losses Pre-opening loss - $400,000 Additional loss before breakeven - $300,000 FY 2007 loss due to new inpatient units = $3,600,000 |
Financial Summary |
Q3 2006 over Q3 2005 admission decline of (1.0%) Net patient service revenue growth for Q3 of 5.09% Net income from continuing operations for Q3 of $5.7 million or $.17 per diluted share Odyssey Q3 2006 Results |
Revenue by Level of Care Gross Revenue by Level of Care 2Q2005 3Q2005 4Q2005 1Q2006 2Q2006 3Q2006 Routine 89.9% 89.3% 88.1% 87.2% 87.8% 89.2% Inpatient 7.4% 6.8% 6.8% 7.1% 6.9% 6.4% Continuous Care 1.9% 3.0% 4.3% 4.9% 4.4% 3.6% Respite/ Other 0.8% 0.9% 0.8% 0.8% 0.9% 0.8% |
Admissions and Average Daily Census by Quarter 8,405 8,213 8,247 8,228 8,162 8,413 8,221 7,745 9,071 8,238 8,517 8,334 Q2 2005 Q3 2005 Q4 2005 Q1 2006 Q2 2006 Q32006 Admissions Av. Daily Census |
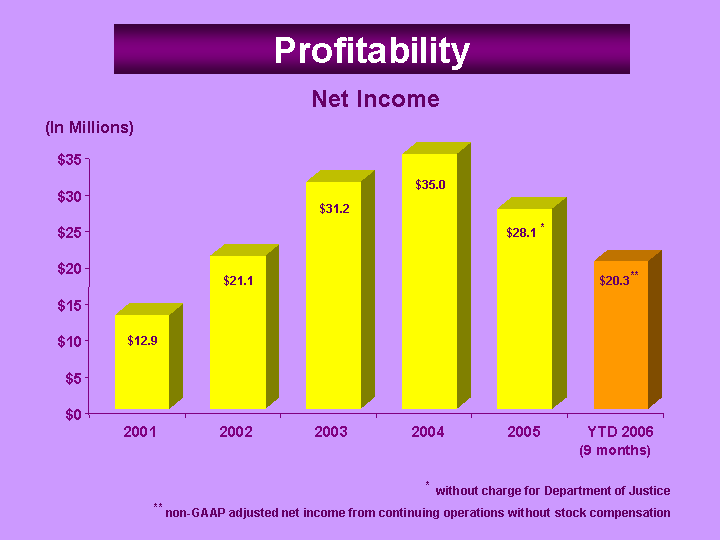
Profitability (In Millions) Net Income $28.1 * $35.0 $31.2 $21.1 $12.9 * without charge for Department of Justice ** non-GAAP adjusted net income from continuing operations without stock compensation $20.3** (9 months) $0 $5 $10 $15 $20 $25 $30 $35 2001 2002 2003 2004 2005 YTD 2006 |
(In Millions) Net Cash from Operations and Discontinuing Operations (9 months) * exclusive of $13 million DOJ payment $27.6 $47.2 $58.7 $29.7 * $0 $10 $20 $30 $40 $50 $60 2003 2004 2005 YTD 2006 |
Days Sales Outstanding Days (9 months) 59 51 46 45 0 10 20 30 40 50 60 2003 2004 2005 YTD 2006 |
Balance Sheet Dec. 31, 2005 Sept. 30, 2006 (in thousands) (in thousands) (in thousands) ASSETS Cash, cash equivalents, $ 63,469 $ 68,507 short-term investments Accounts receivable $ 59,911 $ 62,191 Total Assets $ 244,967 $ 261,249 LIABILITIES Total current liabilities $ 68,721 $ 64,108 Long-term debt $ 4 $ 2 |
Routine Care 97.2% Inpatient 1.5% Continuous 1.1% Respite 0.2% 774,019 Days of Care Provided in Q3 2006 |
Medicare 92.6% Medicaid 4.4% Other 0.1% Commercial 2.9% Q3 2006 Revenue By Financial Class |
Largest geographic footprint of any hospice provider Second largest in terms of patients treated National scale provides economic benefits Implementing growth initiatives Proven track record of growth Strong cash flow / balance sheet provides flexibility Excellent growth opportunities in market Odyssey... A Leader in Hospice Care |