Exhibit 99.1
1 “To Serve All People During the End of Life’s Journey”
2 FORWARD-LOOKING STATEMENTS Certain statements contained in this presentation are forward-looking statements within the meaning of the federal securities laws. Such forward-looking statements are based on management’s current expectations and are subject to known and unknown risks, uncertainties and assumptions which may cause the forward-looking events and circumstances discussed in this presentation to differ materially from those anticipated or implied by the forwardlooking statements. Additional risks, uncertainties and assumptions include, but are not limited to, general market conditions; adverse changes in reimbursement levels under Medicare and Medicaid programs; our ability to successfully integrate the acquisition of VistaCare, Inc.; adverse changes in the Medicare payment cap limits and increases in the Company’s estimated Medicare cap contractual adjustment; decline in patient census growth; increases in inflation including inflationary increases in patient care costs; challenges inherent in and potential changes in the Company’s growth and development strategy; our ability to effectively implement the Company’s 2008 operations and development initiatives; the Company’s dependence on patient referral sources and potential adverse changes in patient referral practices of those referral sources; the ability to attract and retain healthcare professionals; increases in the Company’s bad debt expense due to various factors including an increase in the volume of prepayment reviews by the Company’s Medicare fiscal intermediaries; adverse changes in the state and federal licensure and certification laws and regulations; adverse results of regulatory surveys; delays in licensure and/or certification; government and private party, legal proceedings and investigations; cost of complying with the terms and conditions of our corporate integrity agreement; adverse changes in the competitive environment in which the Company operates; changes in state or federal income, franchise or similar tax laws and regulations; adverse impact of natural disasters; changes in our estimate of additional compensation costs under FASB Statement No. 123(R); and the disclosures contained under the headings “Government Regulation and Payment Structure” in “Item 1. Business” and “Item 1A. Risk Factors” of Odyssey’s Annual Report on Form 10-K filed with the Securities and Exchange Commission on March 14, 2008, and its most recent report on Form 10-Q and in its other filings with the Securities and Exchange Commission. Many of these factors are beyond the ability of the Company to control or predict. Given these uncertainties, readers are cautioned not to place undue reliance on such forward-looking statements, which reflect management’s views only as of the date hereof. The Company undertakes no obligation to revise or update any of the forward-looking statements or publicly announce any updates or revisions to any of the forward-looking statements contained herein to reflect any change in the Company’s expectations with regard thereto or any change in events, conditions, circumstances or assumptions underlying such statements.

3 ODYSSEY… A LEADER IN HOSPICE CARE 100 Medicare Certified Programs in 29 states 32,294 admissions in 2007 CAGR revenue = 12.3%
4 Growing recognition of end of life services Aging population assures increased demand VistaCare acquisition adds scale and expands leadership position Strong balance sheet Compelling operating/growth strategy Experienced management team with strong integration and operating background VALUE PROPOSITION
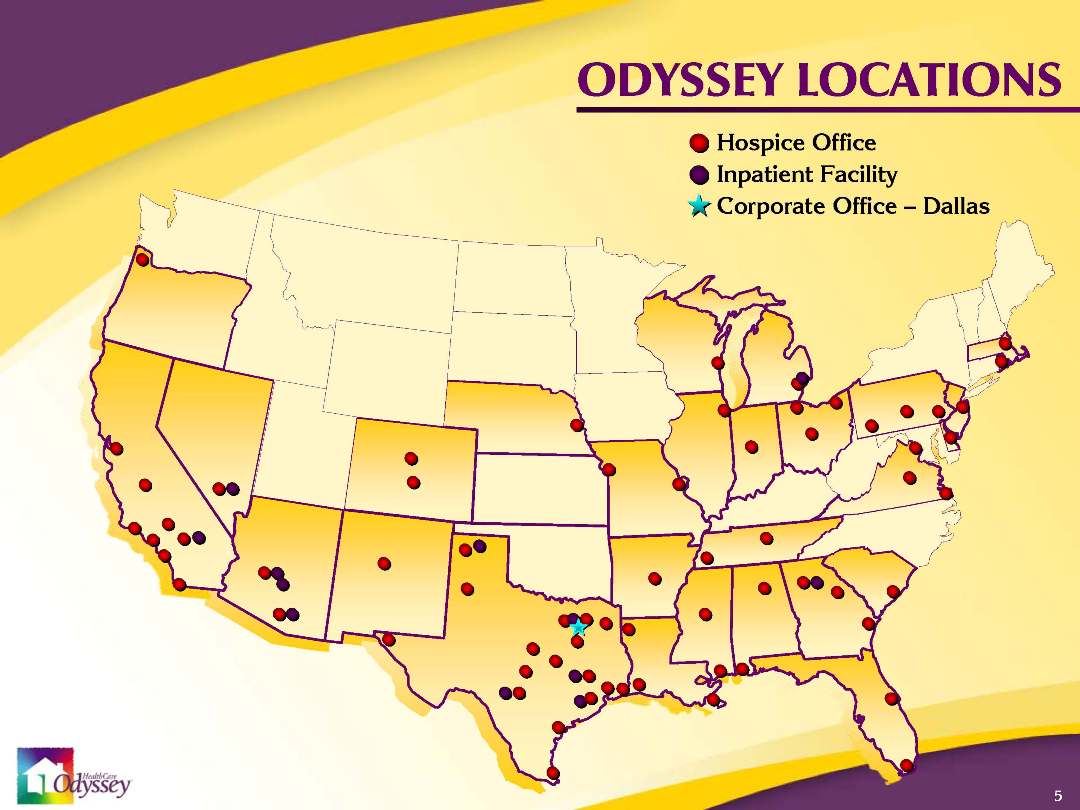
5 ODYSSEY LOCATIONS Hospice Office Inpatient Facility Corporate Office – Dallas
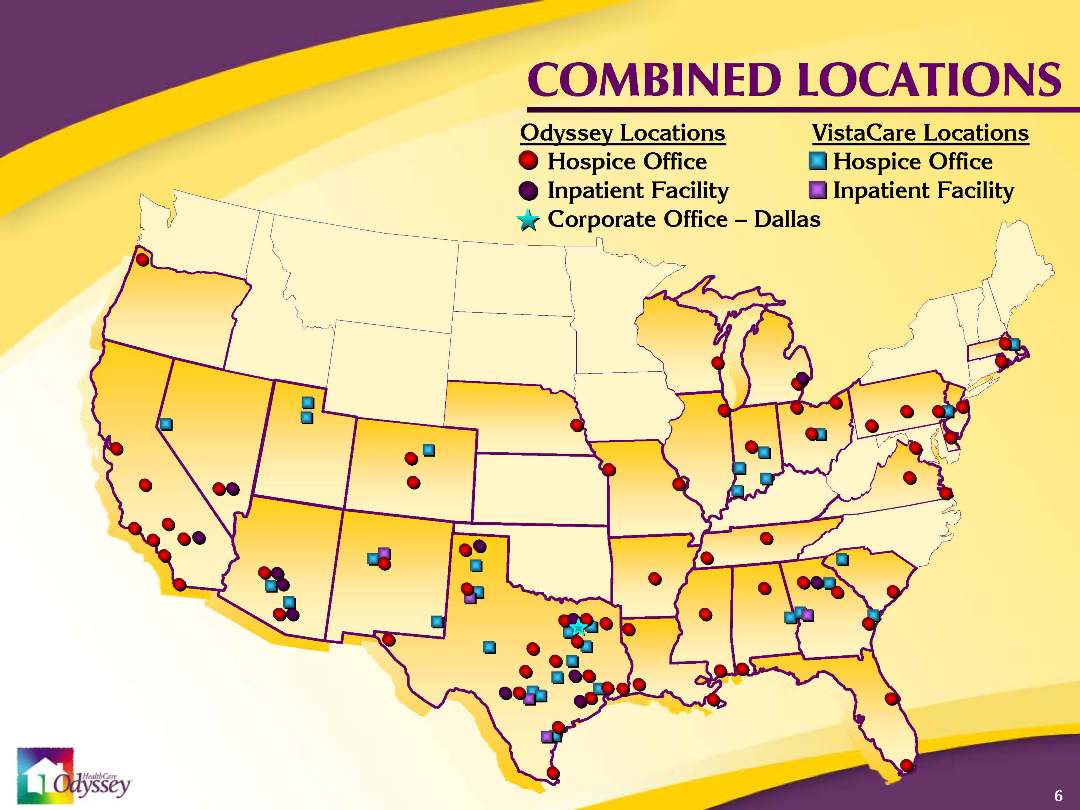
6 COMBINED LOCATIONS Odyssey Locations Hospice Office Inpatient Facility Corporate Office – Dallas VistaCare Locations Hospice Office Inpatient Facility
7 WHAT IS HOSPICE? More cost effective Services provided primarily in home Provides quality of life for terminal patients and families Focus on physical, emotional and spiritual
8 IMPROVES QUALITY OF LIFE Prior studies have found that hospice improves quality of care Mor and Kidder 1985 National Hospice Organization 1995 Miller et al. 2002, 2004 Wu et al. 2003
9 COST EFFECTIVE 25% of total US Medicare budget spent on last year of life Mean expenditure in last year of life $24,600 vs $9,400 for same beneficiaries in next to last year of life Duke University study (2007) Hospice use reduced Medicare costs by an average of $2,309 in last year of life For 7 in 10 users, costs would be reduced if hospice had been used longer
10 COVERED BY MEDICARE Benefit enacted in 1983 Aggregate per beneficiary cap of $22,386 Largest payer at > 90% is Medicare Six months life expectancy Paid on per diem basis based on level of care
11 PATIENTS BY DIAGNOSIS IN THE INDUSTRY Heart Disease 12.2% 20% 8.9% 46% 8.2% Other Dementia Cancer Lung Disease Kidney Disease 3.1% Liver Disease 1.6%
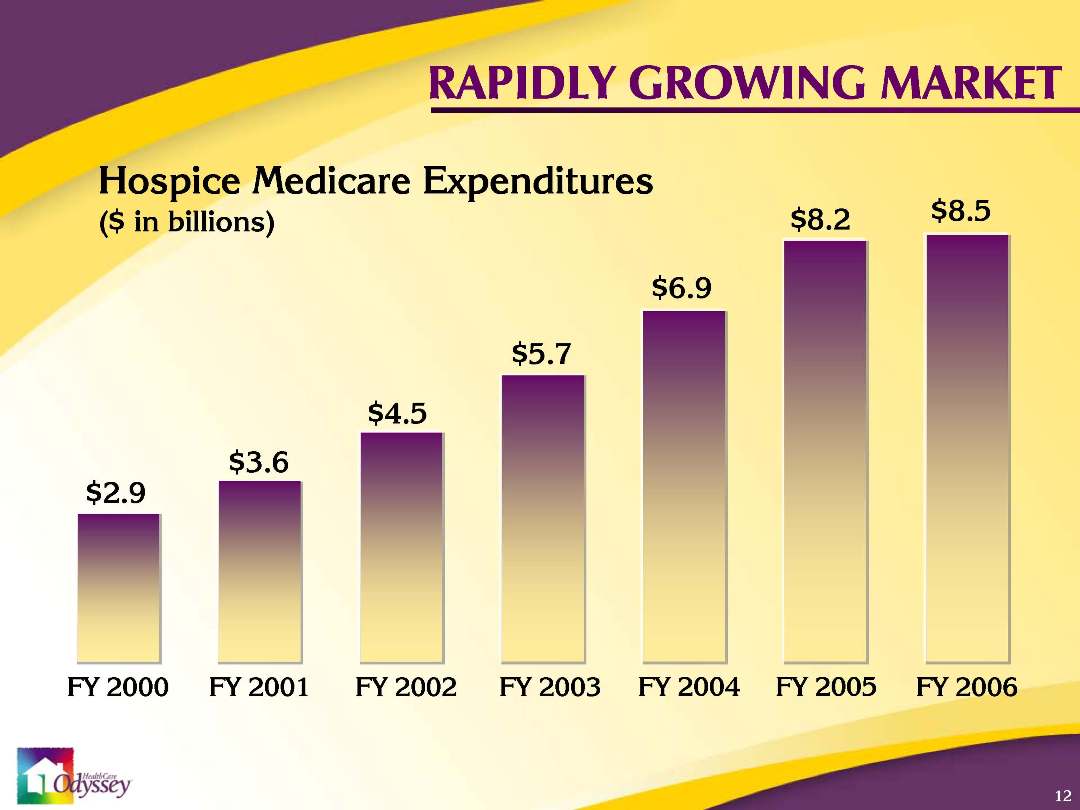
12 RAPIDLY GROWING MARKET Hospice Medicare Expenditures ($ in billions) $2.9 $3.6 $4.5 $5.7 $8.5 FY 2000 FY 2001 FY 2002 FY 2003 FY 2006 $6.9 FY 2004 $8.2 FY 2005
13 MARKET OPPORTUNITY Sudden Death/ Other Hospice Patients Served 41% 2.5 million deaths annually in U.S. 42% Estimated Under-Served Market 17%
14 PROGRAMS EXCEEDING CAP 2002 2005 2003 Number of hospices Percent of hospices 220 2004 150 60 98 2.6% 4.1% 5.8% 7.8%
15 MEDICARE CAP LIABILITY 2002 2005 2003 ($ in millions) $166 2004 $112 $28 $65
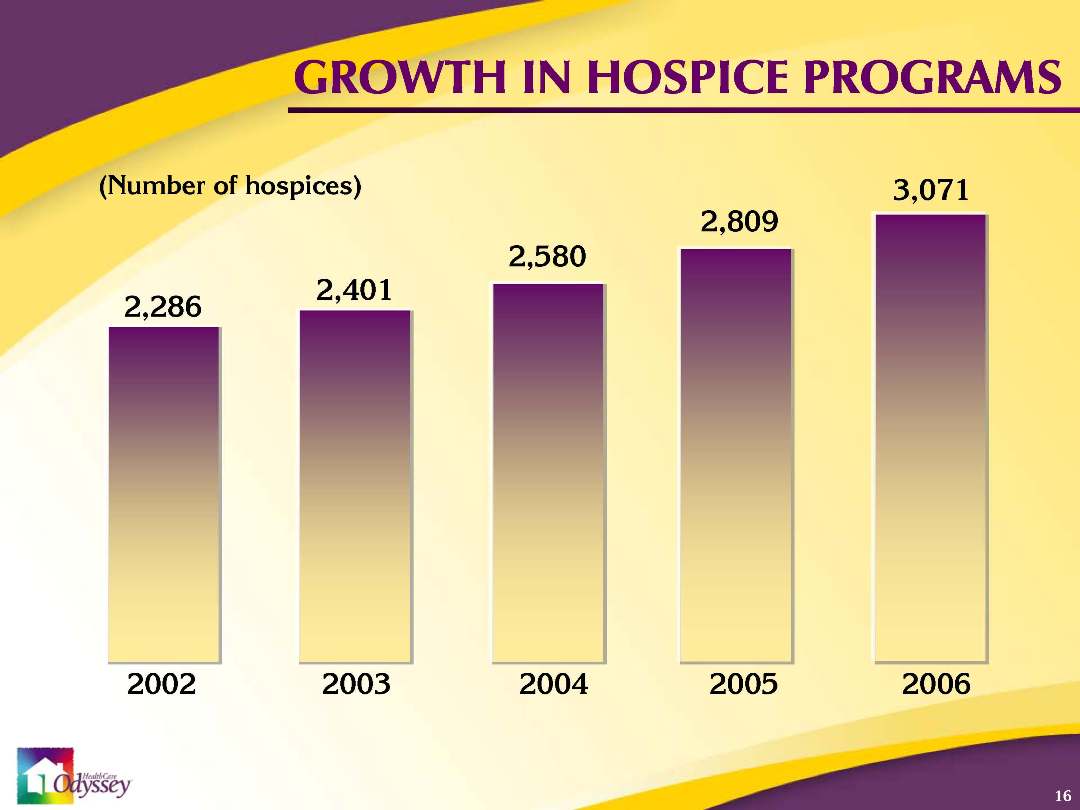
16 GROWTH IN HOSPICE PROGRAMS (Number of hospices) 2005 2,809 2004 2,580 2002 2,286 2003 2,401 2006 3,071
17 NUMBER OF NEW MEDICARE-PARTICIPATING HOSPICES EXCEEDS VOLUNTARY CLOSURES 2000 300 250 200 150 100 50 0 New entrants Voluntary closures 2001 2002 2003 2004 2005 2006
18 Management of Medicare cap STRATEGIC FOCUS
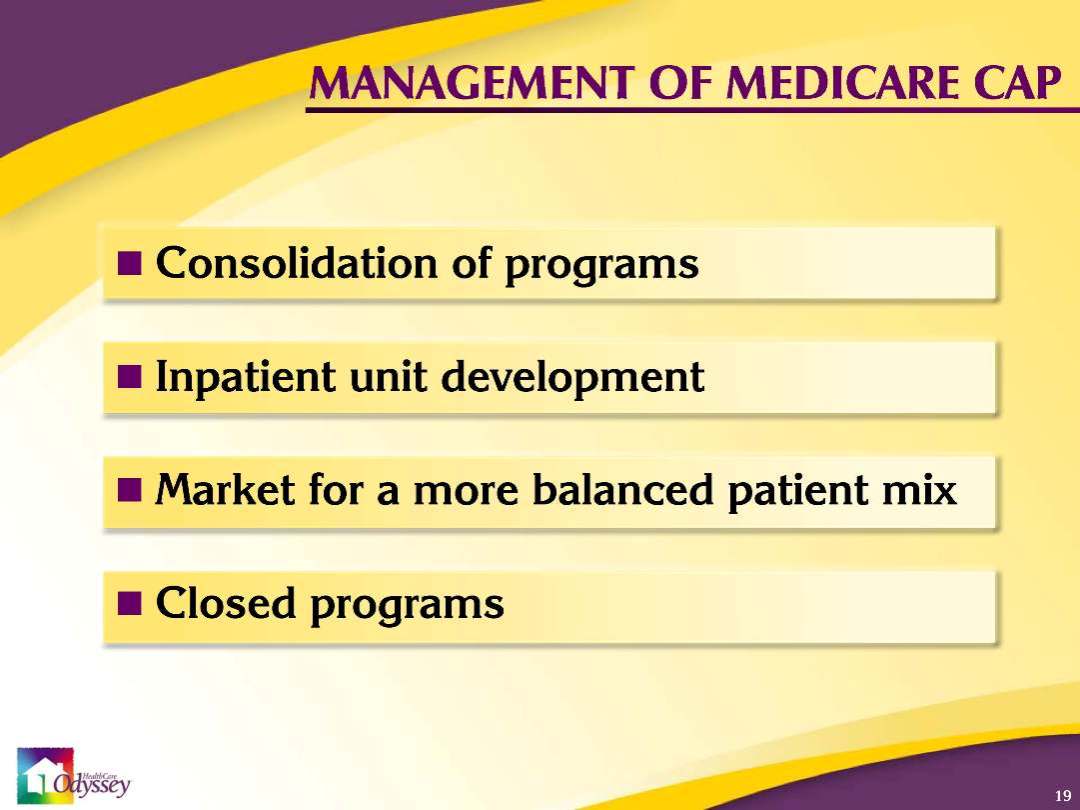
19 MANAGEMENT OF MEDICARE CAP Consolidation of programs Inpatient unit development Market for a more balanced patient mix Closed programs
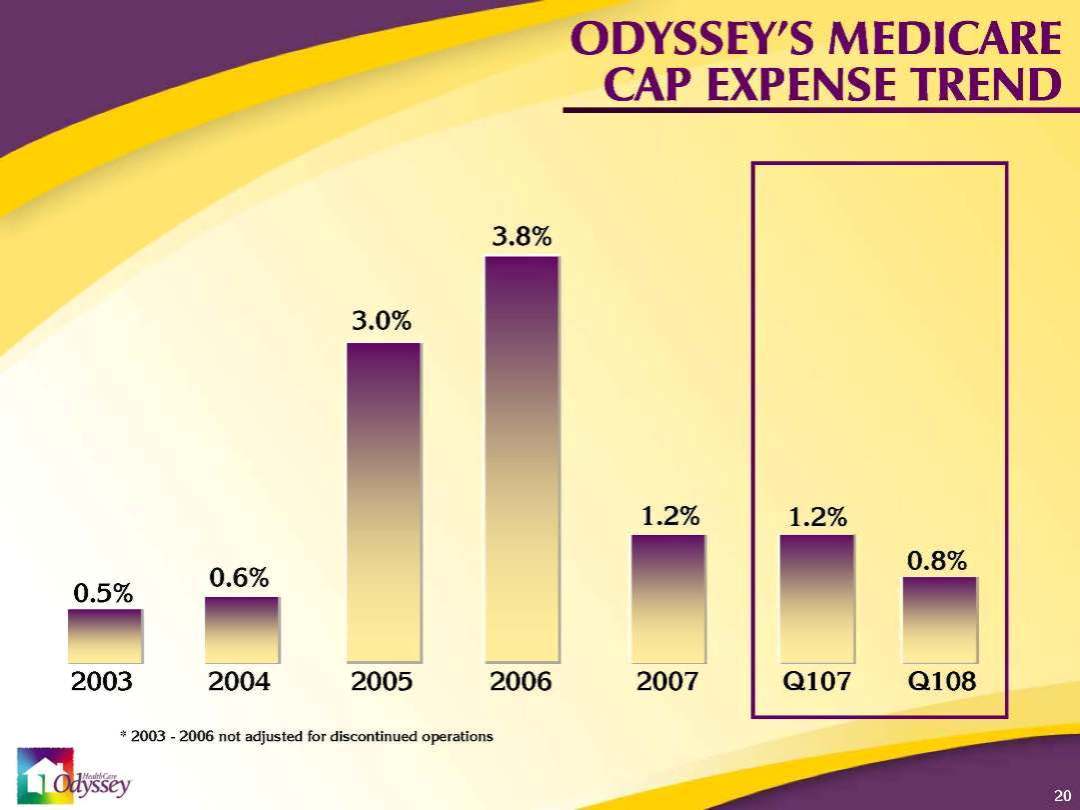
20 ODYSSEY’S MEDICARE CAP EXPENSE TREND * 2003 - 2006 not adjusted for discontinued operations Q108 Q107 2003 0.5% 2004 0.6% 2005 3.0% 2006 3.8% 2007 1.2% 0.8% 1.2%
21 Management of Medicare cap Strengthen senior management team STRATEGIC FOCUS
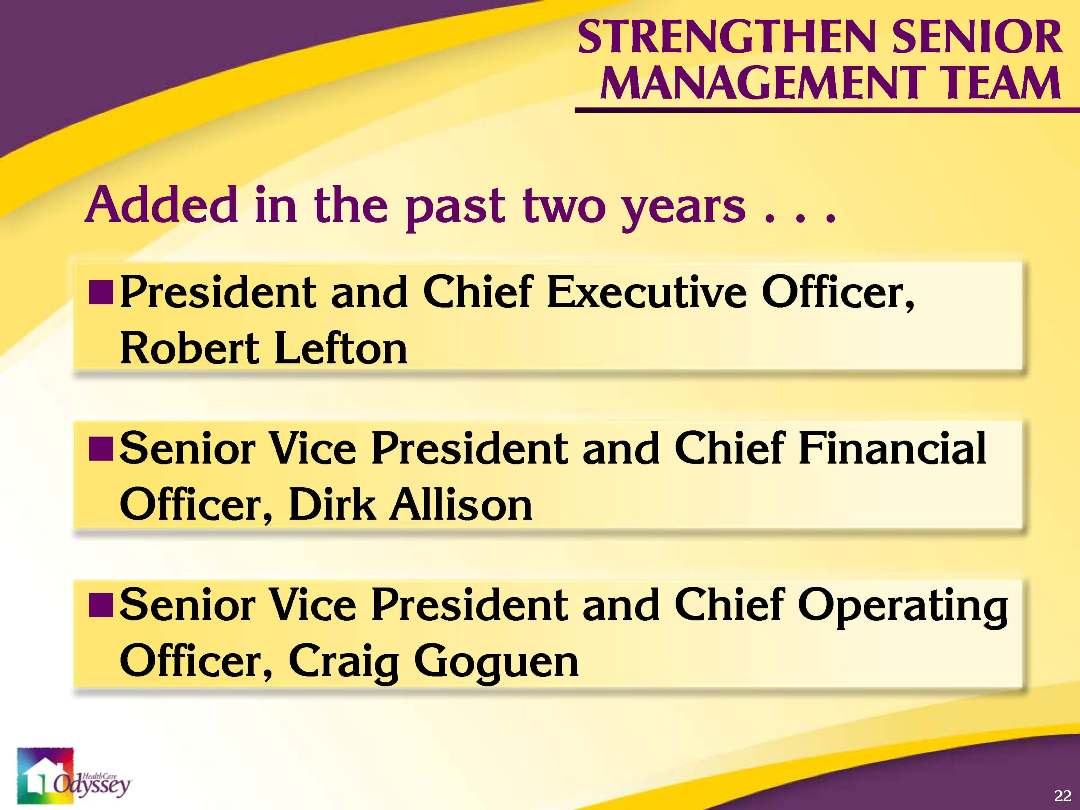
22 Added in the past two years . . . President and Chief Executive Officer, Robert Lefton Senior Vice President and Chief Financial Officer, Dirk Allison Senior Vice President and Chief Operating Officer, Craig Goguen STRENGTHEN SENIOR MANAGEMENT TEAM
23 Management of Medicare cap Strengthen senior management team Focus on existing footprint STRATEGIC FOCUS
24 GROWTH STRATEGY Growth Growth Same store growth De Novos Acquisitions
25 Management of Medicare cap Strengthen senior management team Focus on existing footprint Rationalize existing portfolio STRATEGIC FOCUS
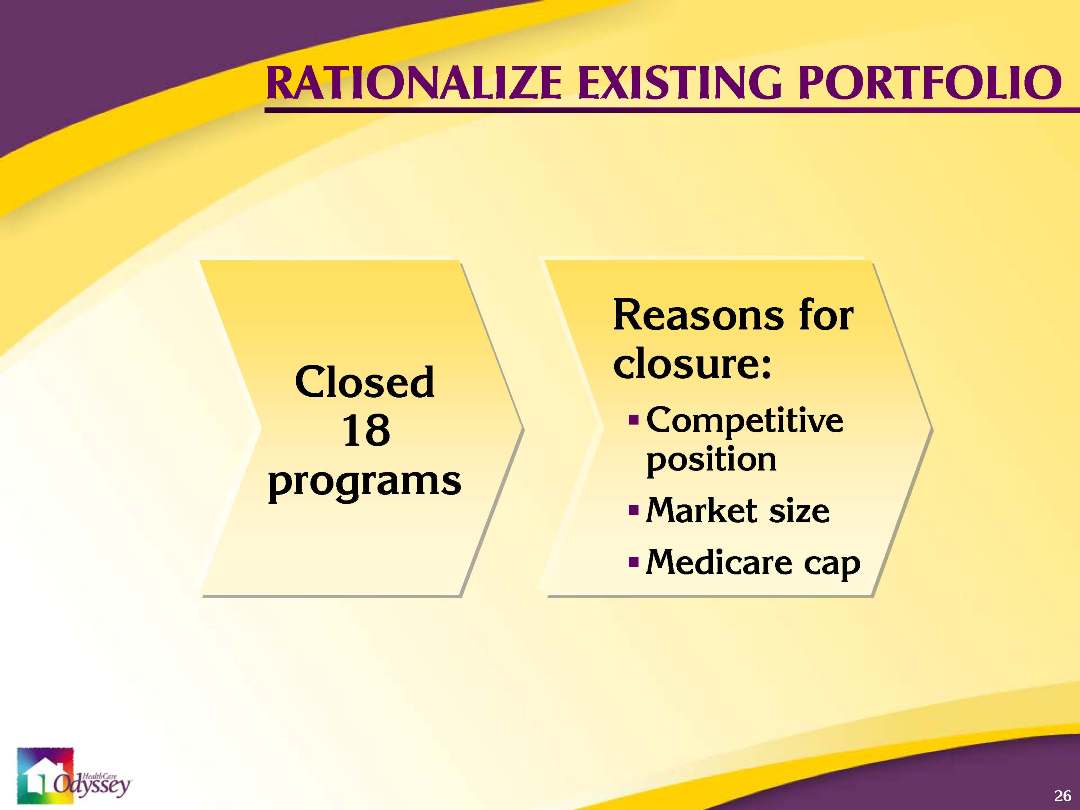
26 RATIONALIZE EXISTING PORTFOLIO Closed 18 programs Reasons for closure: Competitive position Market size Medicare cap
27 Management of Medicare cap Strengthen senior management team Focus on existing footprint Rationalize existing portfolio Implement more sophisticated sales and marketing strategy STRATEGIC FOCUS
28 IMPLEMENT MORE SOPHISTICATED SALES AND MARKETING STRATEGY Hired Regional Sales Manager Revamped CER bonus plan Developed detailed marketing plan for major markets
29 Management of Medicare cap Strengthen senior management team Focus on existing footprint Rationalize existing portfolio Implement more sophisticated sales and marketing strategy Inpatient program development STRATEGIC FOCUS
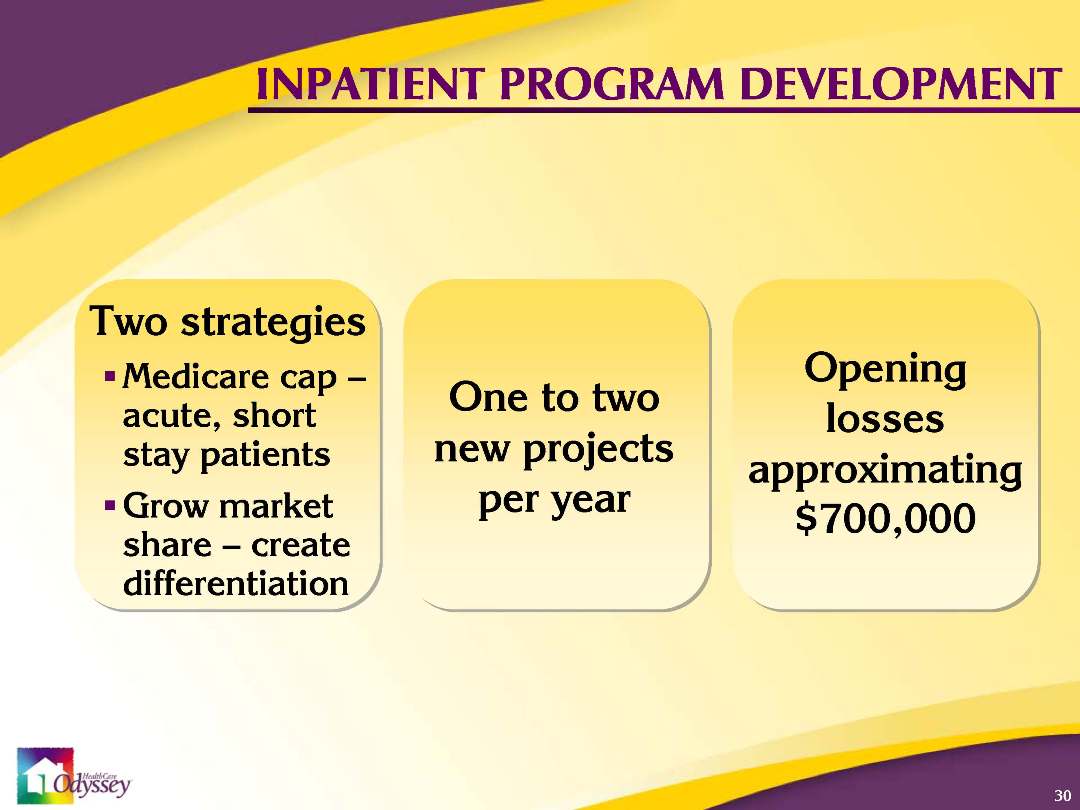
30 INPATIENT PROGRAM DEVELOPMENT Two strategies Medicare cap – acute, short stay patients Grow market share – create differentiation One to two new projects per year Opening losses approximating $700,000
31 STRATEGIC FOCUS Management of Medicare cap Strengthen senior management team Focus on existing footprint Rationalize existing portfolio Implement more sophisticated sales and marketing strategy Inpatient program development Investment in information systems
32 INVESTMENT IN INFORMATION SYSTEMS Implemented new billing system In process of implementing new sales and marketing system
33 VISTACARE TRANSACTION Expands leadership position Compatible organizations Strengthens existing markets Management experience with acquisitions and integration Reducing corporate overhead and closing corporate offices drives profitability Operational and Medicare cap improvements not required for success Neutral in 2008/accretive in 2009 Closed March 6, 2008
34 COMBINED COMPANY $650 million in revenues 100 locations ADC of more than 12,000 29 states
35 FINANCIAL SUMMARY
36 Q108 Q107 NET REVENUE GROWTH FROM CONTINUING OPERATIONS CAGR = 12.3% 2003 $251.3 2004 $312.9 2005 $348.6 2006 $379.3 2007 $398.9 $123.3 $96.6 ($ in millions)
37 ADMISSIONS FROM CONTINUING OPERATIONS Q108 Q107 2003 24,900 2004 28,620 2005 30,972 2006 32,001 2007 32,294 10,810 8,489
 38 AVERAGE LENGTH OF STAY FROM CONTINUING OPERATIONS (Days) Q108 Q107 2003 72 2004 77 2005 80 2006 83 2007 85 82 82
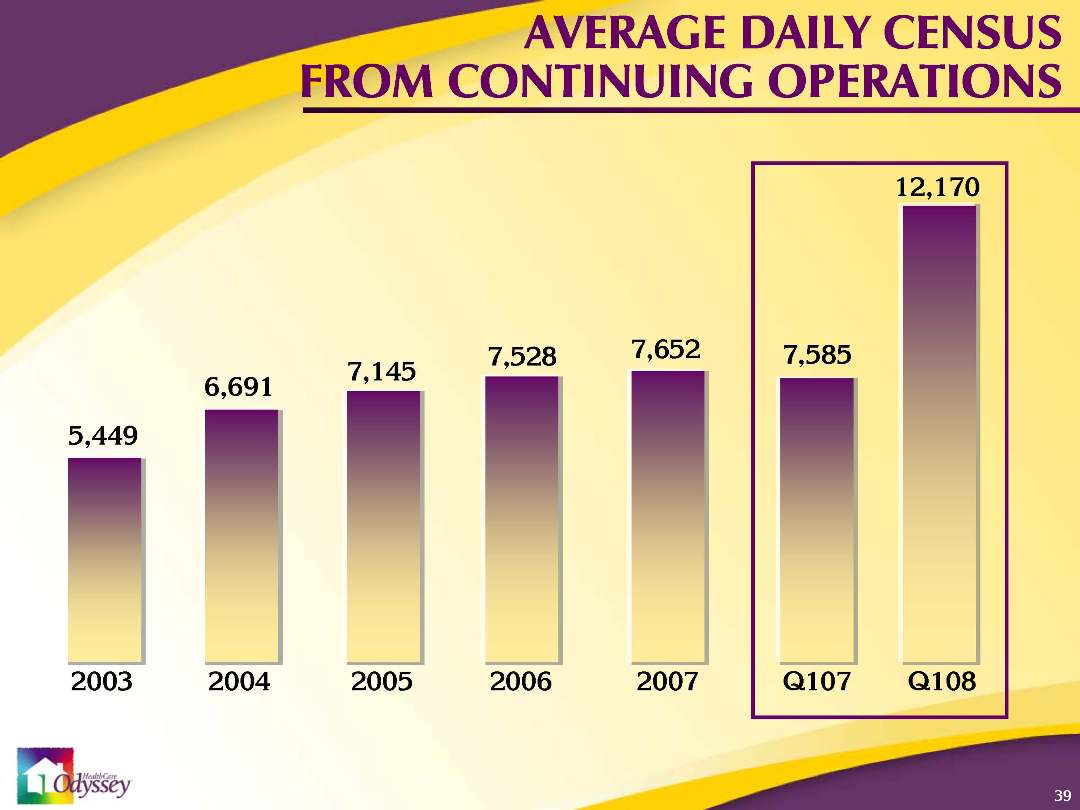
39 AVERAGE DAILY CENSUS FROM CONTINUING OPERATIONS Q108 Q107 2003 5,449 2004 6,691 2005 7,145 2006 7,528 2007 7,652 12,170 7,585
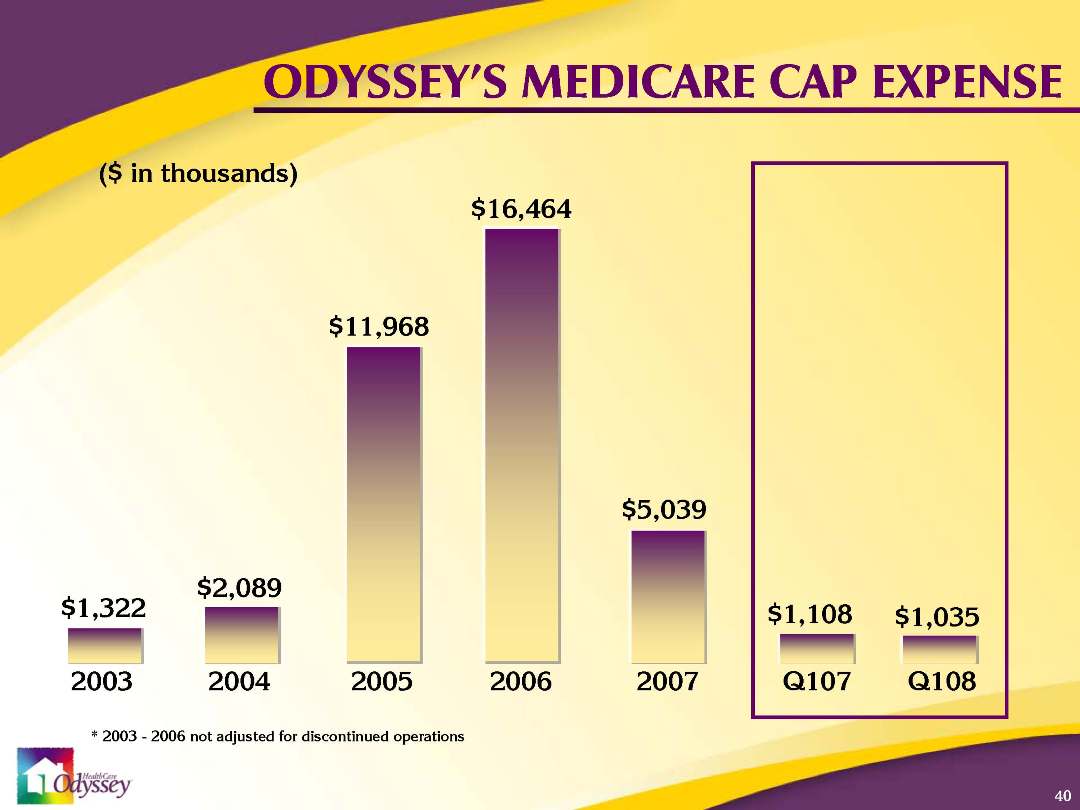
40 ODYSSEY’S MEDICARE CAP EXPENSE ($ in thousands) Q108 Q107 2003 $1,322 2004 $2,089 2005 $11,968 2006 $16,464 2007 $5,039 $1,035 $1,108 * 2003 - 2006 not adjusted for discontinued operations
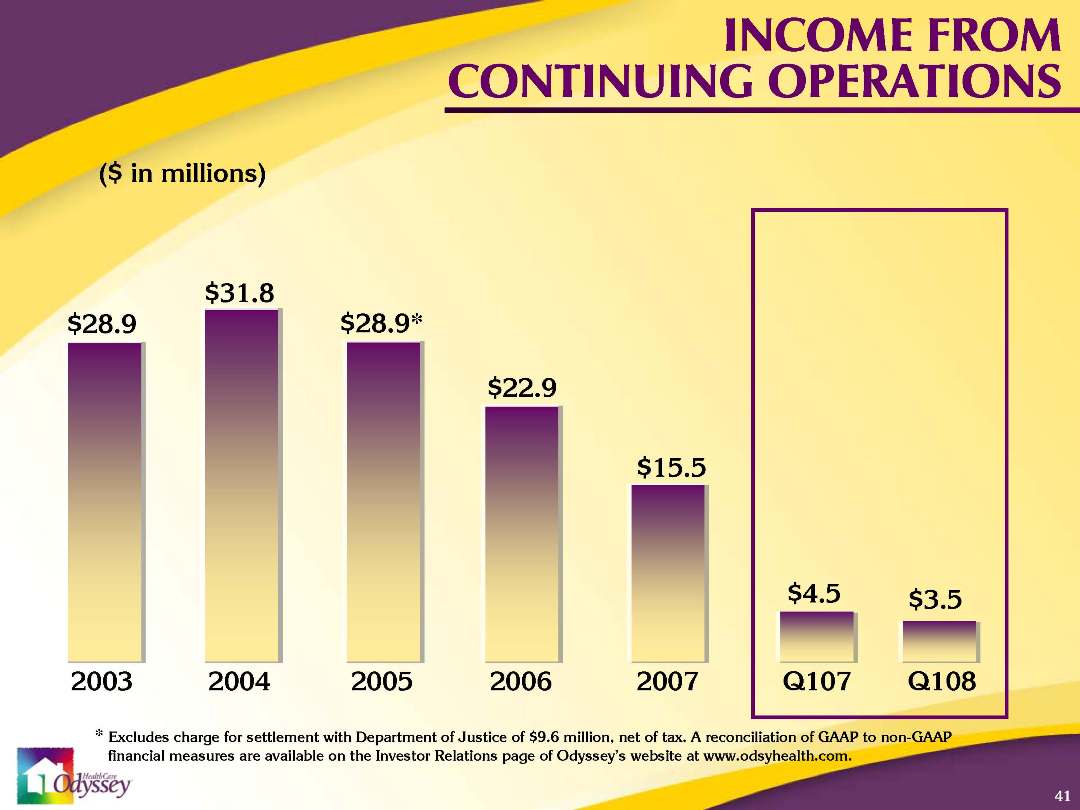
41 INCOME FROM CONTINUING OPERATIONS * Excludes charge for settlement with Department of Justice of $9.6 million, net of tax. A reconciliation of GAAP to non-GAAP financial measures are available on the Investor Relations page of Odyssey’s website at www.odsyhealth.com. ($ in millions) Q108 Q107 2003 $28.9 2004 $31.8 2005 $28.9* 2006 $22.9 2007 $15.5 $3.5 $4.5
42 NET CASH FROM CONTINUING OPERATIONS * Exclusive of $13 million for Department of Justice payment ($ in millions) Q108 Q107 2003 $27.6 2004 $47.1 2005 $45.2* 2006 $47.7* 2007 $16.9 $10.4 $1.5
43 Growing recognition of end of life services Aging population assures increased demand VistaCare acquisition adds scale and expands leadership position Strong balance sheet Compelling operating/growth strategy Experienced management team with strong integration and operating background VALUE PROPOSITION
44 “To Serve All People During the End of Life’s Journey”