UNITED STATES
SECURITIES AND EXCHANGE COMMISSION
Washington, D.C. 20549
SCHEDULE 14A
PROXY STATEMENT PURSUANT TO SECTION 14(a) OF
THE SECURITIES EXCHANGE ACT OF 1934
Filed by the Registrantx
Filed by a Party other than the Registrant¨
Check the appropriate box:
| ¨ | Preliminary Proxy Statement |
| ¨ | Confidential, for Use of the Commission Only (as permitted by Rule 14a-6(e)(2)) |
| ¨ | Definitive Proxy Statement |
| x | Definitive Additional Materials |
| ¨ | Soliciting Material Pursuant to §240.14a-12 |
THE PHOENIX COMPANIES, INC.
(Name of Registrant as Specified In Its Charter)
(Name of Person(s) Filing Proxy Statement, if other than the Registrant)
Payment of Filing Fee (Check the appropriate box):
| x | No fee required. |
| ¨ | Fee computed on table below per Exchange Act Rules 14a-6(i)(1) and 0-11. |
| (1) | Title of each class of securities to which the transaction applies: |
| (2) | Aggregate number of securities to which the transaction applies: |
| (3) | Per unit price or other underlying value of the transaction computed pursuant to Exchange Act Rule 0-11 (set forth the amount on which the filing fee is calculated and state how it was determined): |
| (4) | Proposed maximum aggregate value of the transaction: |
| (5) | Total fee paid: |
| ¨ | Fee paid previously with preliminary materials. |
| ¨ | Check box if any part of the fee is offset as provided by Exchange Act Rule 0-11(a)(2) and identify the filing for which the offsetting fee was paid previously. Identify the previous filing by registration statement number, or the Form or Schedule and the date of its filing. |
| (1) | Amount Previously Paid: |
| (2) | Form, Schedule or Registration Statement No.: |
| (3) | Filing Party: |
| (4) | Date Filed: |
Commencing on March 26, 2008, certain directors and members of senior management of The Phoenix Companies, Inc. will use the slide deck set forth below in meetings with shareholders:
 Investor Briefing March 2008 |
 1 Important Disclosures This presentation may contain forward-looking statements within the meaning of the Private Securities Litigation Reform Act of 1995 which, by their nature, are subject to risks and uncertainties. We intend for these forward-looking statements to be covered by the safe harbor provisions of the federal securities laws relating to forward-looking statements. These include statements relating to trends in, or representing management’s beliefs about our future transactions, strategies, operations and financial results, as well as other statements including, but not limited to, words such as “anticipate,” “believe,” “plan,” “estimate,” “expect,” “intend,” “may,” “should” and other similar expressions. Forward-looking statements are made based upon our current expectations and beliefs concerning trends and future developments and their potential effects on us. They are not guarantees of future performance. Actual results may differ materially from those suggested by forward-looking statements as a result of risks and uncertainties which include, among others: (i) changes in general market and business conditions, interest rates and the debt and equity markets; (ii) the possibility that mortality rates, persistency rates or funding levels may differ significantly from our pricing expectations; (iii) the availability, pricing and terms of reinsurance coverage generally and the inability or unwillingness of our reinsurers to meet their obligations to us specifically; (iv) our dependence on non-affiliated distributors for our product sales, (v) downgrades in our debt or financial strength ratings; (vi) our dependence on third parties to maintain critical business and administrative functions; (vii) the ability of independent trustees of our mutual funds and closed-end funds, intermediary program sponsors, managed account clients and institutional asset management clients to terminate their relationships with us; (viii) our ability to attract and retain key personnel in a competitive environment; (ix) the poor relative investment performance of some of our asset management strategies and the resulting outflows in our assets under management; (x) the possibility that the goodwill or intangible assets associated with our asset management business could become impaired, requiring a charge t o earnings; (xi) the strong competition we face in our business from mutual fund companies, banks, asset management firms and other insurance companies; (xii) our reliance, as a holding company, on dividends and other payments from our subsidiaries to meet our financial obligations and pay future dividends, particularly since our insurance subsidiaries’ ability to pay dividen ds is subject to regulatory restrictions; (xiii) the potential need to fund deficiencies in our Closed Block; (xiv) tax developments that may affect us directly, or indirectly through the cost of, the demand for or profitability of our products or services; (xv) other legislative or regulatory developments; (xvi) legal or regulatory actions; (xvii) changes in accounting standards; (xviii) the potential effects of the spin-off of our asset management subsidiary on our expense levels, liquidity and third-party relationships; and (xix) other risks and uncertainties described herein or in any of our filings with the SEC. We undertake no obligation to update or revise publicly any forward-looking statement, whether as a result of new information, future events or otherwise. In managing our business, we analyze our performance on the basis of “operating income” which does not equate to net income as determined in accordance with GAAP. Rather, it is the measure of profit or loss used by our management to evaluate performance, allocate resources and manage our operations. We believe that operating income, and measures that are derived from or incorporate operating income, are appropriate measures that are useful to investors as well, because they identify the earnings of, and underlying profitability factors affecting, the ongoing operations of our business. Operating income is calculated by excluding realized investment gains (losses) and certain other items because we do not consider them to be related to our operating performance. The size and timing of realized investment gains (losses) are often subject to our discretion. Certain other items are also excluded from operating income if, in our opinion, they are not indicative of overall operating trends. The criteria used to identify an item that will be excluded from operating income include: whether the item is infrequent and is material to our income; or whether it results from a change in regulatory requirements, or relates to other unusual circumstances. Items excluded from operating income may vary from period to period. Because these items are excluded based on our discretion, inconsistencies in the application of our selection criteria may exist. Some of these items may be significant components of net income in accordance with GAAP. Accordingly, operating income, and other measures that are derived from or incorporate operating income, are not substitutes for net income, or measures that are derived from or incorporate net income, determined in accordance with GAAP and may be different from similarly titled measures of other companies. Within our Asset Management segment, we also consider earnings before interest, taxes, depreciation and amortization (“EBITDA”). Our management believes EBITDA provides additional perspective on the operating efficiency and profitability of the Asset Management segment. EBITDA represents pre-tax operating income before depreciation and amortization of goodwill and intangibles. Total operating return on equity (“ROE”) is an internal performance measure used in the management of our operations, including our compensation plans and planning processes. Our management believes that this measure provides investorswith a useful metric to assess our performance and the effectiveness of our use of historic capital. ROE is calculated by dividing (i) total operating income, by (ii) average equity, excluding accumulated OCI, FIN 46-R and discontinued operations. Total operating return on tangible equity ("return on tangible equity") is also an internal performance measure used in the evaluation of our operations. Our management believes that this measure provides investors with a useful metric to assess our performance and the effectiveness of our use of current capital. Return on tangible equity is calculated by dividing (i) total operating income, by (ii) average equity, excluding accumulated OCI, FIN 46-R, discontinued operations and the carrying value of goodwill and intangible assets. More detailed financial information, including reconciling information regarding our non-GAAP financial measures, can be found in the Appendix hereto, and in our financial supplement for the fourth quarter of 2007, which is available on our web site, www.phoenixwm.com in the Investor Relations section. In connection with our 2008 Annual Meeting, we have filed a definitive proxy statement, BLUE proxy card and other materials with the U.S. Securities and Exchange Commission. The Phoenix Companies, Inc. and its directors and executive officers are deemed to be participants in the solicitation of proxies from its shareholders in connection with our upcoming annual meeting and the notice we received from one of our shareholders. Information regarding the special interests of the directors and executive officers in the proposals that are the subject of the meeting is include d in the proxy statement that we have filed. Our shareholders are strongly advised to read the proxy statement filed in connection with the annual meeting carefully before making any voting or investment decision, as it contains important information. Shareholders are able to obtain this proxy statement, any amendments or supplements to the proxy statement, along with the annual, quarterly and special reports we file, for free at theweb site maintained by the Securities and Exchange Commission at www.sec.gov or at our web site at www.phoenixwm.com, in the Investor Relations section. In addition, copies of the proxy materials may be requested by contacting our proxy solicitor, Morrow & Co., LLC, toll-free at (800) 414-4313. Banks and Brokers may call collect at (203) 658-9400. |
2 Agenda • Profile and History of Phoenix • Value Creation Through Business Momentum • Oliver Press Campaign: Nothing New • Strong Governance Profile |
3 Phoenix history and profile Profile • Life, Annuity & Asset Management business focus • $1.3 billion market capitalization History • PNX demutualization and IPO in June 2001 at share price of $17.50 • Difficult economic environment after September 11, 2001, compounded by concentrated equity market exposures drove significant financial losses in 2001 and 2002; three-notch downgrade by Moody’s on November 25, 2002 • New CEO on January 1, 2003; share price $7.60 • Board, CEO and strengthened management team have acted decisively in past five years to position company for growth; 17% 1 operating EPS CAGR Objective • Seek to maintain this momentum by asking shareholders to keep existing board intact and reject Oliver Press slate 1. 2003-2007 Operating EPS; 2002 Operating EPS $(0.61); after fully dilutive effect of equity units, which converted to shares in 2006; no share repurchases for PNX since 2002. |
 4 Growing business with great potential Actions taken to strengthen Phoenix Rebuilt balance sheet Recreated effective infrastructure for company - Established risk management framework - Rebuilt talent pool - Improved expense profile Reinvigorated growth engines of Life and Annuity business through strengthened and expanded core distribution and products Repaired investment and financial performance, organizational structure and net flows of Asset Management business Next steps to drive growth • Realize value through executing planned asset management spin-off • Enhance shareholder value through expected redeployment of closed block capital: structures in place – continuous review of redeployment opportunities that meet return hurdles, provide strategic fit and support strong ratings • Use Operational Excellence to drive growth • Launch new business initiatives (Life Solutions and Alternative Financial Solutions) to enhance growth in Life & Annuity |
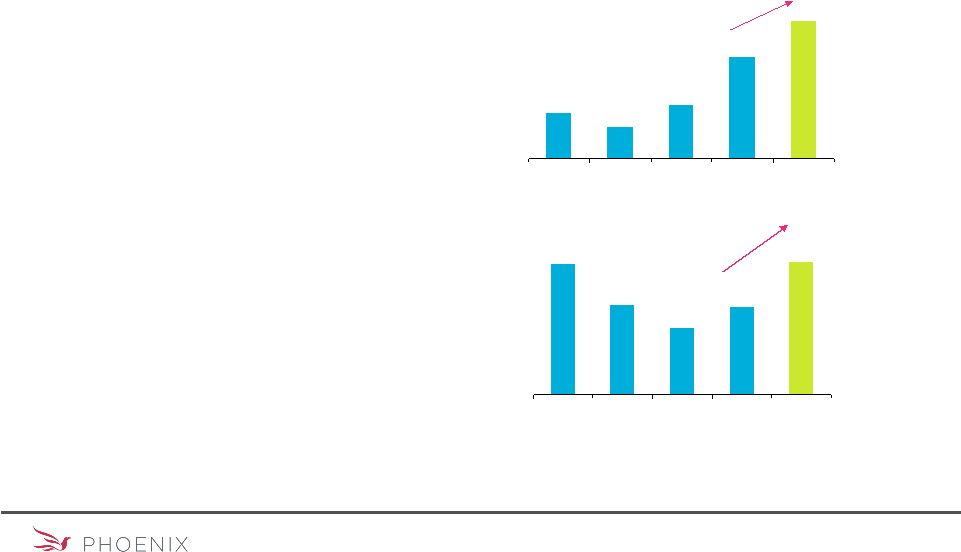
 5 Rebuilt life company balance sheet • Increased statutory surplus while: - Supporting strong sales growth - Nearly $1 billion in cumulative annualized life premium - $2.4 billion in cumulative annuity deposits - Making $80.5 million in pension plan contributions - Paying $284.5 million in dividends to holding company • Increased RBC at even greater pace - Disposed of almost $1 billion in high-risk, non-strategic assets - Discontinued sale of low-profit, capital- intensive products $1,040.7 $961.5 2003 2007 2003 2007 310% 419% PLIC Risk-Based Capital Ratio PLIC Statutory Surplus + AVR $ in millions |
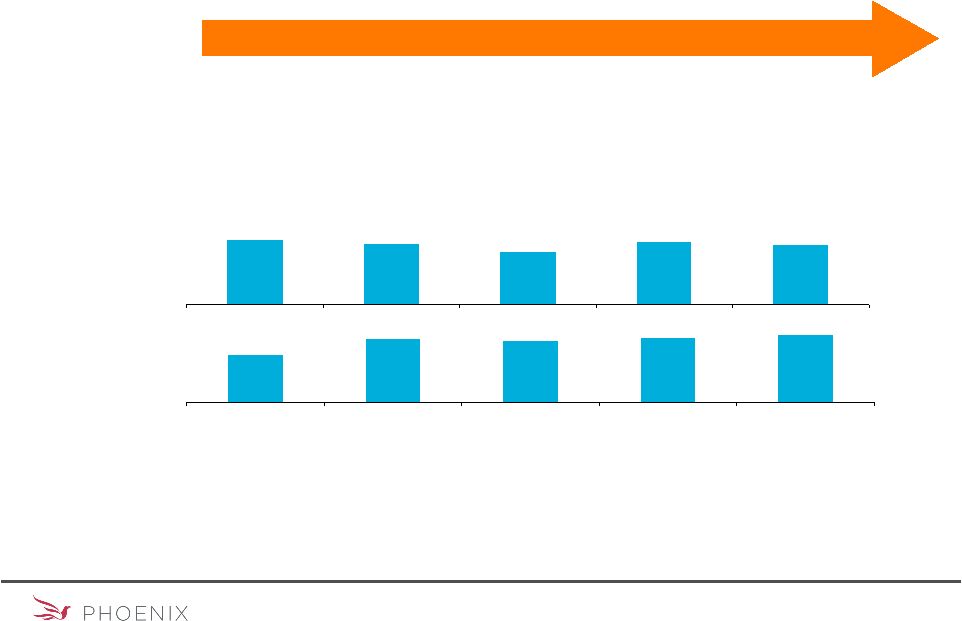
 6 Life & Annuity business vibrant and growing • Successfully established partnerships with key insurance/annuity distributors - State Farm - National Life Group - Jefferson National - Brokerage General Agent channel • Improved service and operations to meet distribution partner needs • Improved open block operating earnings almost eight-fold between 2003 and 2007 ($19.3 million to $148.7 million pre-tax) • Continued consistent growth at State Farm - 10,600 agents enrolled to sell Phoenix products; penetration has grown to approximately 50% with significant upside remaining - Life sales: $51 million; up 15% from 2006 and targeting $100 million by 2010 - Annuity deposits: $391 million, up 43% from 2006 - Cumulative sales of $290 million in life premium and $1.2 billion in annuity deposits - Shareholder since IPO, with approximate 5.1% ownership, publicly stated support for existing Board and management $352 $259 $137 $117 $81 2003 2004 2005 2006 2007 $627 $620 $423 $313 $415 2003 2004 2005 2006 2007 36% 51% 1. Life and annuity sales exclude private placements. 2. Annuity deposits exclude discontinued products. Life Sales Annualized Premium¹ Annuity Deposits 1, 2 $ in millions |
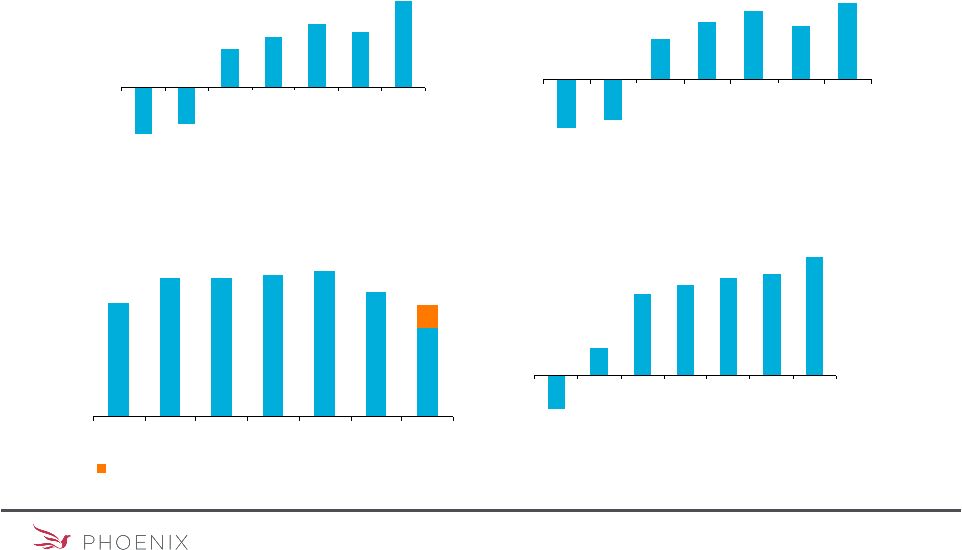 7 Earnings and credit profile materially stronger Return on Equity 2001 2002 2003 2004 2005 2006 2007 2001 2002 2003 2004 2005 2006 2007 Operating Income $59.8 $78.9 $100.6 $135.3 3.0% 4.2% 5.0% 5.6% 2001 2002 2003 2004 2005 2006 2007 Interest Coverage 4.8x 5.7x 3.9x 4.3x 4.6x $ in millions 3.9% $87.1 22.5% 20.2% 26.2% 25.5% 24.9% 25.0% 20.5% 2001 2002 2003 2004 2005 2006 2007 6.675% senior notes matured 02/08 Debt / Capital 16.0% Net Income $(215.2) $(272.3) $(6.2) $86.4 $108.4 $99.9 $123.9 $(59.4) $(74.6) (3.5)% (2.9)% (1.6)x 1.3x |
 8 Significant accomplishments in 2007 • Extended State Farm contract to 2016, five additional years • Entered BGA distribution channel with strong results • Agreed with National Life Group to promote Phoenix variable annuities and add their Sentinel Funds • Agreed with Jefferson National to develop a low-cost, no-load variable annuity aimed at the fee- based advisor market • Formed two new businesses: Life Solutions and Alternative Financial Solutions • Record operating income of $135.3 million; 22% CAGR since 2003 • Record Life & Annuity pre-tax operating earnings of $215.7 million • Record life sales of $425 million • Record mutual fund sales of $3.6 billion • 51% year-over-year growth in annuity deposits to $627 million • 5.6% ROE; 7.9% return on tangible equity Business Highlights Results |
 9 Asset management stabilized and rebuilt A.U.M. ($bn) EBITDA ($mm) Significant restructuring efforts undertaken in PXP 2003 2004 2005 2006 2007 • Purchased Capital West minority interest • Purchased Walnut minority interest • SASCO adoption • Purchased KAR minority interest • Purchased Seneca minority interest • Vontobel adoptions • Sub-advisory strategy • Harris Insight funds adoption • 7 fund mergers • 6 fund liquidations • 7 fund mergers • 3 fund liquidations Performance 1 1-Yr 32% 36% 43% 68% 57% 3-Yr 45% 39% 39% 66% 61% 5-Yr 63% 63% 60% 68% 60% 1. Percentage of funds exceeding their benchmarks for each time period. $27.2 $36.1 $35.0 $36.9 $38.9 $46.3 $42.9 $37.4 $45.0 $42.5 Net Income ($mm) $(9.7) $(1.6) $(14.4) $(25.8) $3.6 Net Flows ($bn) $(1.2) $(6.6) $(5.6) $(4.0) $(0.5) |
 10 The right time to spin off PXP • PXP strategically well-positioned Multi-boutique asset manager; flexible with diverse investment and distribution capabilities Retail fund platform has broad, balanced product offerings, including high-quality sub-advisory relationships Strong investment performance across a variety of products Broad and powerful distribution access to all major wirehouses and platforms Innovative product development capabilities and management team (e.g., “Diversifier”) Continuing growth in revenue and scale benefits would support margin upside Alignment of ownership and incentives of managers and shareholders through planned spin-off • Benefits of planned spin-off - Can be catalyzing event for Asset Management - Both businesses can focus exclusively on their own strategies - Positive ROE impact for the new Phoenix - Marketplace can value each business independently; clarifies obscured value of asset management business - Expense structure of each company can be appropriately sized, eliminating excess overhead |
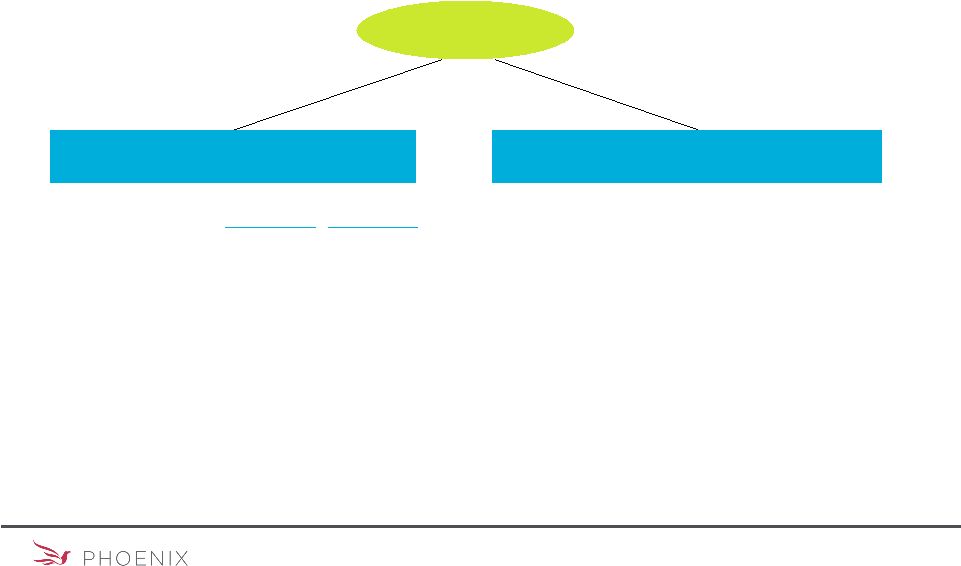 11 Illustrative impact of planned spin-off Shareholders Asset Management SpinCo The Phoenix Companies, Inc. Book Value $1,693 $14.82 Operating Income 2 $134 $1.16 Return on Equity 7.5% Aggregate Per Share 1 AUM $40.4 bn Revenues $203.2 EBITDA 3 $37 - $42 $ in millions, except per share 1. Book value per basic shares outstanding (114.3 million); operating earnings per average diluted shares outstanding (116.0 million). 2. Phoenix 2007 operating earnings less SpinCo operating earnings. 3. Excludes Goodwin’s 2007 EBITDA of approximately $5 million, and is adjusted to reflect a new expense structure for the independent company. Note: Numbers are for purposes of illustration and are not a guarantee of actual results. Phoenix figures reflect expected illustrative impact of planned PXP spin-off at December 31, 2007, including adjustment to stockholders’ equity and reduction in operating earnings. We intend to eliminate remaining allocated corporate expenses in the next 18 to 24 months while the figures above assume that remaining allocated corporate expenses are eliminated immediately. |
 12 Closed block: a significant opportunity for enhancing shareholder value • Created at time of demutualization to segregate assets and liabilities of participating policyholders • Significantly larger structural constraint than other demutualizations: largest closed block as a percentage of general account assets • Currently represents 32% of GAAP equity with very stable mid-single-digit returns • Significant opportunity to enhance returns through effectively executed capital redeployment 22% 17% 27% 29% 52% Phoenix Metlife John Hancock Prudential AmerUs Closed Block Assets as a % of General Account Assets at IPO |
13 Closed block: a valuable asset to be deployed strategically • Have continuously and actively assessed monetization opportunities since 2002 - Rating agency views on leverage treatment have evolved - Market developments have positioned us to monetize using several different techniques - Strengthened balance sheet and core earnings growth create basis for transformational action • Focus on potential uses of proceeds that: - Meet return hurdles - Maintain soundness of the block and support core business - Meet rating agency requirements • Unwilling to settle for sub-optimal use of proceeds - Rating agencies hesitant to endorse share repurchases - Need to remain disciplined with respect to acquisitions Moody’s, May 2003 Phoenix recently announced that it will not implement a securitization of Phoenix Life’s closed block related assets at this time. While such a transaction might have improved the company’s overall liquidity position, Moody’s would have treated the proceeds of such a transaction as an increase in PNX’s overall financial leverage. Standard & Poor’s, April 2007 …the potential monetization of its closed block provides for significant financial flexibility. Redeployment of proceeds would be expected to go to the life and annuity lines of business and not to a share repurchase program. Moody’s, March 2006 Phoenix has publicly stated that a key 2006 corporate objective is to consider monetizing the closed block in an effort to improve the company's overall ROE. Such an effort, if successful, could considerably raise the overall ROE of the life and annuity segment since the closed block requires almost half of the segment's total capital allocation. At this time, Moody's is unable to evaluate the potential credit effects of such a possibility since no specific transaction has yet been proposed. The use of the proceeds from the closed block's monetization would be an important consideration in Moody's evaluation of such a transaction. |
14 Opportunities to drive growth in earnings Operational Excellence • Combines Lean and strict expense discipline to meet goal of providing high-quality products and services to customers and distribution partners, delivered cost effectively and with speed • 2008 Goal: $15-$20 million increase in pre-tax earnings related to operating efficiencies New Businesses in Life and Annuity • Alternative Financial Solutions - Extends features of life and annuity products to other financial products • Guaranteed Retirement Income Solution: provides annual stream of income for life • Longevity Product: provides protection against outliving one’s assets • Life Solutions - Initially will participate in originations of life settlements as well as in the institutional arena |
 15 Key initiatives and goals • Increase pre-tax operating earnings $15-$20 million through Operational Excellence - Building on operating expense reductions of $108 million from 2004-2006 • Continue to invest in Life & Annuity growth through: - New and expanded distribution initiatives - New businesses: Life Solutions & Alternative Financial Solutions • Complete planned spin-off • Implement expense rationalization resulting from planned spin-off • Continue to seek appropriate uses of proceeds for a closed block monetization • Double-digit ROE: 10% by 2010 • Double-digit CAGR in operating EPS, 2008-10 • Top 10 life insurance company in sales • Top 20 seller of variable annuities 2010 2008 |
16 Executive compensation Compensation aligns with shareholder interests • In 2003, the Board established pay-for-performance policy with overhaul of long-term and short-term plans - Heavily weighted total comp to variable pay - ROE improvement key metric - LTI plan paid in performance RSUs - Aggressive targets: LTI paid in 2 of last 5 years, Annual plan paid in 3 of last 5 years • Executive compensation targets market levels - Compensation targeted at levels based on 12 smaller life insurance companies in Diversified Insurance Study of Executive Compensation (“DIS”) • Between 2002 and 2007, reduced number of change in control agreements by 75% - Terms are aligned to current and emerging market practice CEO Compensation • 80% of targeted compensation through performance-based incentives • Actual compensation below target for 2 out of last 5 years • 2007 compensation of $4.9 million reported in proxy reflects accruals of time-vested and performance-contingent awards, change in pension value and non-qualified deferred compensation earnings, and includes the following: Salary $950,000 2007 Annual incentive $1,923,000 Long-term incentive $0 Other compensation $144,143 |
 17 The Oliver Press campaign: no new ideas “Deal with Cost Structure” Monetize Closed Block Undertake Strategic Review The Facts Oliver Press Criticisms • Company should undertake a “complete strategic review” focused on capital deployment • PNX Board has reviewed, and continues to actively and thoroughly review, strategic and financial options, with input from advisors • Reviews resulted in critical strategic initiatives, including, most recently, planned spin-off of PXP • ”We believe there are several possible transactions that would serve the dual purpose of raising the claims-paying (“financial strength”) rating for these policies and produce higher returns for stockholders.” • PNX has already been actively exploring closed block alternatives with advisors • PNX has put structures in place and will execute the optimal alternative deliberately and expeditiously • Oliver Press acknowledges they have no new ideas for a closed block transaction • Rating agencies have affirmed that use of proceeds will determine rating impact • Company should take “aggressive steps” to “deal with” operating expenses • Various aggressive expense reduction initiatives implemented since 2002 resulting in 30% head count reduction, including sale of career agency force, outsourcing IT infrastructure while building for long-term value • Operating expenses reduced by $108 million 2004- 2006; additional expense reductions to be implemented in 2008 as part of Operational Excellence Oliver Press “proposals” lag PNX Board’s actions to enhance shareholder value |
 18 Oliver Press criticisms mischaracterize facts Executive Compensation Operating Expenses • Phoenix cost structure is “out of step” with comparable companies • We believe that the $90 million in expense reductions Oliver Press has spoken about are unrealistic • Comparisons with companies with different products, distribution and customers are not meaningful • PNX recently engaged Deloitte to conduct an expense review that suggested an approximately $30 million annual reduction would bring the corporate expense structure to a “bare bones” level • Compensation not aligned with performance • PNX compensation plan rigorously tied to ROE benchmarks (0.1% miss in long-term targets in ’02-’04 resulted in no payout). • Misleading characterization: $22 million relates to 27 years of prior service ($13 million pension benefit; $9 million to deferred compensation, savings plans, and RSUs) • Standard supplemental pension plan is broad-based, covering almost 400 participants; 27 SVPs or above • Phoenix believes transparent disclosure in compliance with SEC requirements is in the interest of all shareholders • $49 million combined compensation change-in- control package for CEO • $141 million “special pension account” • 43 pages of disclosure on executive compensation The Facts Oliver Press Criticisms |
 19 Oliver Press criticisms mischaracterize facts Stock Price Ratings • “Since 2001 company has had no fewer than 5 downgrades” • Significant challenges in first 18 months as public company – ended 2002 at $7.60 • Appreciated 109% 2003-2006 to $15.89 • Despite record earnings, 2007 a challenging year for PNX shares • Remains up substantially in current CEO tenure (up 60% through 3/25/08) • Outperformed S&P Life Index since planned spin-off announced The Facts Oliver Press Criticisms • Mostly old news; only S&P has acted since April 2005 • Maintained A rating with AM Best since 1993 • Positive momentum with agencies including recent outlook change to positive at AM Best • Agencies acknowledge Phoenix’s improvement through: - Continued strong balance sheet - Continued earnings expansion - Elimination of ratings negatives - Use of closed block proceeds • “The company’s stock is trading approximately 38% lower today than its public offering price nearly seven years ago” |
 20 Adding risk to Phoenix’s business Disruptive of Spin-off and Strategic Review Process Questions Regarding Long- Term Focus Relationships with Key Constituencies • State Farm - In 2007, 14% of PNX life sales and 62% of annuity deposits - 5.1% owner of PNX stock, with long-term perspective - Publicly expressed concerns regarding Oliver Press’s disruption of Phoenix’s business and strategy • “Aggressive” cost reduction approach suggested by Oliver Press could - Negatively impact company - Raise concerns with distribution partners and policyholders - Undermine growth initiatives • Oliver Press has failed to provide specifics on closed block alternatives • Phoenix currently executing the planned PXP spin-off and determining the best alternative for closed block monetization • Oliver Press is running a distracting proxy fight in an attempt to oust qualified and experienced directors • There is a risk of significant slow-down or disruption of critical strategic initiatives • Oliver Press rhetoric provides ammunition for competitors, potentially resulting in lost sales and higher surrenders Oliver Press “proposals” seem to add risk to our business |
 21 Phoenix commitment to strong governance Actively Engaged Highly Rated Fresh Perspectives Independent Oversight • 12 out of 13 directors are independent • Lead independent director chairs Executive Committee, conducts all meetings of independent directors, can call a meeting of the Board • Independent directors meet without CEO • Five directors added since IPO while shrinking board from 17 to 13, including the removal of three inside directors • Three directors, or ~25% of board, added in past three years • ISS CGQ scores: - 99% v. Russell 3000 - 95% v. Insurance Peers • All committees except Executive Committee comprised solely of independent directors • Executive Committee chaired by lead independent director with CEO serving as member • Five regularly scheduled board meetings per year through 2007; six per year starting in 2008 • Committee meetings: 22 in person; 23 telephonic in 2007 • Frequent informal dialogue among directors |
 22 Phoenix directors: the right choice • PNX directors have proactively undertaken initiatives to resolve performance and structural issues, the same initiatives Oliver Press is calling for Key Initiatives • PNX directors have the support of major shareholders, including State Farm, our largest shareholder and an important business partner Support of Key Constituents • PNX directors initiated a meeting with Oliver Press after Oliver Press disclosed its concerns following its several meetings with management. Directors have remained open to a constructive dialogue with them • Governance Committee considered and evaluated Oliver Press’s nominees consistent with past practices Responsive to Shareholders Phoenix’s directors are actively involved in driving the business, have the support of major shareholders and are responsive to shareholder concerns |
 23 Phoenix directors: deep experience, independence & continuity Alfiero Haire Johnson • Shares: 208,667 • Director since 1988 • Previous lead director • Financial/audit experience • Director HSBC • Shares: 45,114 • Director since 1999 • Extensive media/ internet expertise • Former publisher of TIME • Shares: 61,312 • Director since 2000 • Former Chairman/ CEO Greenpoint • Financial/audit experience • Director Freddie Mac Oliver Clinton Santillo • Indirect beneficial ownership of shares through Oliver Press: 5,688,206 • No prior financial services company experience • Hedge fund principal • Shares: 10,000 (1/23/08) • No public company board experience • P&C insurance company experience; no life insurance experience • Shares: 10,000 (1/24/08) • No public company board experience • Former insurance executive • Not actively employed Oliver Press Nominees Phoenix Directors Note: Phoenix director holdings include restricted stock units. |
24 Summary: “New blood” – Can it hurt? • Phoenix’s core life business is sensitive to the stability and strength of the company – real and perceived. Distribution partners, independent agents and current and prospective policyholders are primarily concerned with the long-term ability of the company to meet its promises to policyholders and stability of company • The current board has effectively steered the turnaround of the company through external and internal challenges, driving significant financial improvement and business growth that positions the company for enhanced shareholder returns • Phoenix is not a large company, but its structural and legacy challenges are complex beyond its size; thoughtfulness, a longer-term perspective and experience are key for realizing the potential for increased shareholder value • The current board has taken significant transformational actions when they were supported by sound strategic reasons: a prime example is the sale of the company’s career life insurance agency force • Governance at Phoenix is working: governance scores are excellent, director independence unassailable. There have been regular additions of new board members. Compensation practices have been continually enhanced and recalibrated to the market – they are performance-based, grounded in competitive analysis and aligned with shareholders |
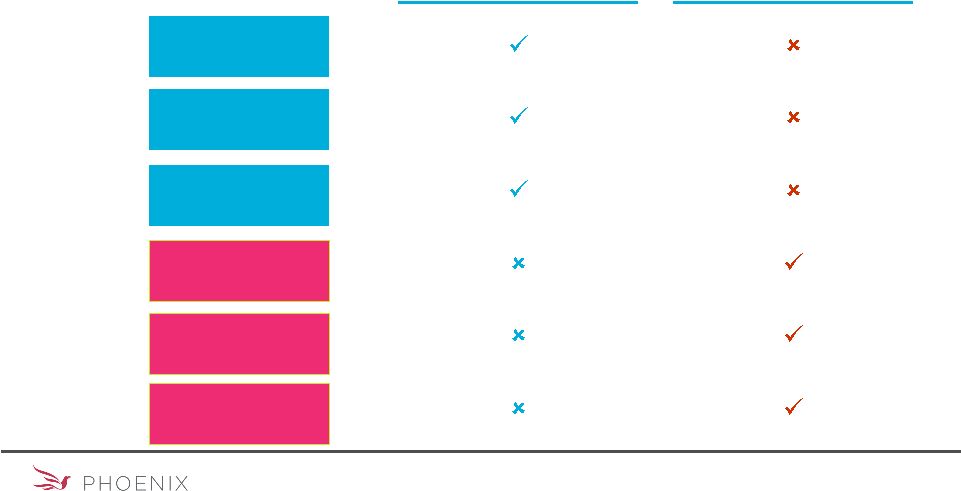 25 Vote Your Blue Proxy Card Experience Phoenix Directors Constructive Strategic Plan Building Long- Term Value Disruption & Cost Increased Risk Extracting Short- Term Value Oliver Press Nominees |
 Appendix |
 27 Reconciliation of Income Measures $ in millions December 31, 2001 2002 2003 2004 2005 2006 2007 Total Operating Income (74.6) (59.4) 59.8 78.9 100.6 87.1 135.3 Net Realized Investment Gains (43.0) (39.3) 3.2 11.8 25.5 21.8 (8.9) Realized Gains (Losses) - Investments Pledged as Collateral Consolidated Under FIN 46-R (12.5) (26.3) (2.4) (12.9) 1.3 (1.0) 1.0 Realized and Unrealized Gains (Losses) on Equity Investment in Aberdeen - - (55.0) 55.9 (7.0) Share of Aberdeen's Extraordinary Charge for FSA Settlement - - - (14.7) Surplus Notes Tender Costs - - - (6.4) Management Restructuring and Early Retirement Costs (15.5) (28.5) (8.4) (21.9) (12.5) (9.1) Other, Demutualization Related Items (55.7) 13.8 Other income 5.3 - 1.3 Income (Loss) from Continuing Operations (196.0) (139.7) (1.5) 90.7 107.9 98.8 127.4 Income (Loss) from Discontinued Operations (2.6) (2.3) (4.7) (4.3) 0.5 1.1 (3.5) Income (Loss) before Cumulative Effect of Accounting changes (198.6) (142.0) (6.2) 86.4 108.4 99.9 123.9 Cumulative Effect of Accounting changes (16.6) (130.3) - - - - - Net Income (Loss) (215.2) $ (272.3) $ (6.2) $ 86.4 $ 108.4 $ 99.9 $ 123.9 $ |
 28 Reconciliation of Operating Income to EBITDA $ in millions December 31, 2003 2004 2005 2006 2007 Asset Management Pre-tax Operating Income (Loss) (8.7) $ 0.1 $ (10.5) $ (28.6) $ 7.4 $ Adjustments for: Intangible asset amortization and impairments 33.2 33.8 43.8 64.5 30.4 Depreciation 2.7 2.2 1.7 1.0 1.1 EBITDA 27.2 $ 36.1 $ 35.0 $ 36.9 $ 38.9 $ |
 |
IMPORTANT INFORMATION REGARDING THE SOLICITATION AND
PARTICIPANTS THEREIN
In connection with its 2008 Annual Meeting, The Phoenix Companies, Inc. has filed a definitive proxy statement, BLUE proxy card and other materials with the U.S. Securities and Exchange Commission. The Phoenix Companies, Inc. and its directors and executive officers may be deemed to be participants in the solicitation of proxies from its shareholders in connection with our upcoming annual meeting and the notice we received from one of our shareholders. Information regarding the special interests of the directors and executive officers in the proposals that are the subject of the meeting is included in the proxy statement that we have filed. The Phoenix Companies, Inc.’s shareholders are strongly advised to read the proxy statement filed in connection with the annual meeting carefully before making any voting or investment decision, as it contains important information. Shareholders are able to obtain this proxy statement, any amendments or supplements to the proxy statement, along with the annual, quarterly and special reports we file, for free at the web site maintained by the Securities and Exchange Commission atwww.sec.gov or at our web site atwww.phoenixwm.com, in the Investor Relations section. In addition, copies of the proxy materials may be requested by contacting our proxy solicitor, Morrow & Co., LLC, toll-free at (800) 414-4313. Banks and Brokers may call collect at (203) 658-9400.
FORWARD-LOOKING STATEMENTS
The discussion herein may contain forward-looking statements within the meaning of the Private Securities Litigation Reform Act of 1995. We intend for these forward-looking statements to be covered by the safe harbor provisions of the federal securities laws relating to forward-looking statements. These include statements relating to trends in, or representing management’s beliefs about our future strategies, operations and financial results, as well as other statements including, but not limited to, words such as “anticipate,” “believe,” “plan,” “estimate,” “expect,” “intend,” “may,” “should” and other similar expressions. Forward-looking statements are made based upon management’s current expectations and beliefs concerning trends and future developments and their potential effects on us. They are not guarantees of future performance. Actual results may differ materially from those suggested by forward-looking statements as a result of risks and uncertainties which include, among others: (i) changes in general market and business conditions, interest rates and the debt and equity markets; (ii) the possibility that mortality rates, persistency rates or funding levels may differ significantly from our pricing expectations; (iii) the availability, pricing and terms of reinsurance coverage generally and the inability or unwillingness of our reinsurers to meet their obligations to us specifically; (iv) our dependence on non-affiliated distributors for our product sales, (v) downgrades in our debt or financial strength ratings; (vi) our dependence on third parties to maintain critical business and administrative functions; (vii) the ability of independent trustees of our mutual funds and closed-end funds, intermediary program sponsors, managed account clients and institutional asset management clients to terminate their relationships with us; (viii) our ability to attract and retain key personnel in a competitive environment; (ix) the poor relative investment performance of some of our asset management
strategies and the resulting outflows in our assets under management; (x) the possibility that the goodwill or intangible assets associated with our asset management business could become impaired, requiring a charge to earnings; (xi) the strong competition we face in our business from mutual fund companies, banks, asset management firms and other insurance companies; (xii) our reliance, as a holding company, on dividends and other payments from our subsidiaries to meet our financial obligations and pay future dividends, particularly since our insurance subsidiaries’ ability to pay dividends is subject to regulatory restrictions; (xiii) the potential need to fund deficiencies in our Closed Block; (xiv) tax developments that may affect us directly, or indirectly through the cost of, the demand for or profitability of our products or services; (xv) other legislative or regulatory developments; (xvi) legal or regulatory actions; (xvii) changes in accounting standards; (xviii) the potential effects of the spin-off of our asset management subsidiary on our expense levels, liquidity and third-party relationships; and (xix) other risks and uncertainties described herein or in any of our filings with the SEC. We undertake no obligation to update or revise publicly any forward-looking statement, whether as a result of new information, future events or otherwise.